Embed Size (px)
Citation preview

2008/ED/EFA/MRT/PI/42 Original: Spanish
Background paper prepared for the
Education for All Global Monitoring Report 2008
Education for All by 2015: will we make it?
Urban and rural disparities in Latin America: their implications for education access
Nestor Lopez
IIEP Buenos Aires 2007
This paper was commissioned by the Education for All Global Monitoring Report as background information to assist in drafting the 2008 report. It has not been edited by the team. The views and opinions expressed in this paper are those of the author(s) and should not be attributed to the EFA Global Monitoring Report or to UNESCO. The papers can be cited with the following reference: “Paper commissioned for the EFA Global Monitoring Report 2008, Education for All by 2015: will we make it? For further information, please contact [email protected]

Presentation
This paper was commissioned from the Buenos Aires Regional Office of the International Institute for Educational Planning (IIEP) by the working group responsible for drafting the Education for All (EFA) Global Monitoring Report, published annually by UNESCO.
The working group requested a text including a range of social and educational indicators enabling the levels of access to primary and secondary education in various Latin American countries to be monitored. Working together, the Office and the working group agreed on the most suitable indicators for attaining the aims of the EFA Global Monitoring Report, the levels of disaggregation for the data, and the countries and the years for which the indicators would be produced.
They agreed to focus on producing four educational indicators:
• Net primary education enrolment ratios;
• Percentage of primary school-age children who have never attended an educational establishment;
• Net secondary education enrolment ratios;
• Age-specific enrolment ratios for secondary school-age adolescents.
A concern present from the outset was producing data sufficiently disaggregated to be able to demonstrate the variations in each country. In principle, that would stress the disparities between urban and rural areas, but in order to go beyond simply analysing variations, it was decided to disaggregate the data by the various regions of each country. This enabled the differences in the various national, urban and rural situations in each country to be recorded.
Lastly, a series of indicators was produced showing the social situation and employment conditions of families in each of the regions, aiming to provide a context making it easier to propose theories about the processes discernible from a preliminary reading of the trends in enrolment ratios.
Household surveys undertaken by the national statistics institutes of the countries considered1 for the pre- and post-Dakar periods were used as a source of information. This information had already been standardized and made compatible under the Information System on Educational Trends in Latin America (SITEAL) project, a joint initiative of the IIEP Buenos Aires and the Organization of Ibero-American States for Education, Science and Culture (OEI). Although this work sought to produce standardized, comparable information about the educational situation of 11 countries, it also offered preliminary data analysis, which served as a springboard to undertaking a more detailed appraisal. The first part of the paper describes the most pertinent findings set out in the form of a basically descriptive plan. Subsequently, in the form of conclusions to this analysis, theories and considered views are presented, proposing interpretations of possible challenges that could be identified in terms of educational policies. Following this, the information produced is included in an annex and lastly, a further annex contains a brief report making clear the methodological decisions taken throughout the project.
1 The countries considered were: Bolivia (2002), Brazil (1992-2002), Chile (1996-2003), Costa Rica (1995-2005),
El Salvador (1997-2003), Guatemala (2001), Honduras (1990-2001), Mexico (2000-2004), Nicaragua (1998-2001), Paraguay (1995-2000) and Peru (1997-2000).

– 2 –
Principal trends in access to education in Latin America: preliminary data analysis
1 - The current situation
Beginning with the 1990 Jomtien Conference, various conferences,2 forums3 and documents4 have made Education for All their objective. In principle, in Latin America this objective was reflected in goals expressed by full access to primary education, but this expectation gradually expanded to the point that today, most explicitly propose to ensure that all children and adolescents complete secondary education.
How distant is this goal? In principle, and quite logically, primary enrolment rates are higher than secondary enrolment rates in all countries. Access to primary education is more widespread and in addition there are fewer variations between countries at this level. Moreover, in those cases in which there are greater problems with secondary enrolment, a larger proportion of adolescents remain in primary education despite being of secondary school-age. By analysing the net enrolment ratios and the age-specific enrolment ratios,5 we are able to distinguish three different situations in the countries under consideration at the start of this millennium:
• Chile, Mexico and Brazil have the highest primary and secondary enrolment ratios.
• Costa Rica, El Salvador, Bolivia and Peru are in an intermediate position.
• Guatemala, Honduras, Nicaragua and Paraguay are the most disadvantaged.
Paraguay and Guatemala stand out among the latter, as only a quarter of their secondary school-age population receives any schooling at this level and they have a significant proportion of adolescents in primary education.
Table 1. Net enrolment ratios by level and age-specific secondary enrolment ratio, primary/secondary gap and percentage difference in secondary enrolment. Post-Dakar period.
Country total.
Net Enrolment Ratio (NER)
6 Country Year
Primary Secondary
Secondary Age-
specific Enrolment Ratio
(ASER) 7
Primary/second
ary gap
Secondary enrolment difference*
Lag**
Bolivia 2002 87.1 62.2 85.0 1.4 22.8 0 Brazil 2002 90.0 72.1 73.7 1.2 1.6 0 Chile 2003 91.9 80.9 89.6 1.1 8.7 0 Costa Rica 2005 86.4 63.3 75.3 1.4 12 0 El Salvador 2003 88.5 51.5 62.4 1.7 11 0 Guatemala 2001 77.6 25.5 47.4 3.0 21.9 0
2 The Ibero-American Conferences of Ministers of Education, inter alia. 3 Dakar World Education Forum. 4 One of the pioneers in the region may well have been “Education and Knowledge: Basic Pillars of Changing
Production Patterns with Social Equity”, United Nations Economic Commission for Latin America and the Caribbean, ECLAC-UNESCO Regional Bureau for Education in Latin America and the Caribbean. 1991.
5 See methodological annex. 6 NER refers to net enrolment ratio. 7 ASER refers to age-specific enrolment ratio.

– 3 –
Honduras 2001 85.8 34.1 52.2 2.5 18.1 0 Mexico 2004 95.4 66.7 73.3 1.4 6.6 0 Nicaragua 2001 83.0 42.9 56.3 1.9 13.4 0 Paraguay 2000 91.4 28.0 67.5 3.3 39.6 1 Peru 2000 92.2 61.0 82.5 1.5 21.6 0
* Ratio of secondary school-age pupils in primary education to the total secondary school-age population. ** A ‘1’ indicates those countries where the number of secondary school-age pupils at the primary level is greater than
the number at the secondary level.
Urban areas are analysed first, followed by rural areas in order to demonstrate the internal logic of each.
Urban areas
Primary enrolment is widespread in urban areas. Ratios exceed 90% in most countries, with a minimum level of 83%. While variations between countries are not large at this level, they become more apparent at the secondary level. There are countries where variations in attendance between these two levels are highly significant, which points to major difficulties in retaining pupils when changing from one level to another. Noteworthy in this regard is a group of countries (Guatemala, Honduras and Paraguay), where primary enrolment is almost double the figure for secondary enrolment, or even exceeds this. In these countries, less than half of secondary school-age adolescents are in school. In Nicaragua, the gap between primary and secondary enrolment is the smallest of the above-mentioned countries, a result of a lower primary enrolment and a higher secondary enrolment. Lastly, in the case of Paraguay, the proportion of secondary school-age adolescents who remain at the primary level is higher. It is therefore possible to delineate three groups of countries, by their enrolment profile in urban areas:
• countries where both primary and secondary enrolment is high (Brazil and Chile);
• countries in an intermediate position, with high primary enrolment and average secondary enrolment (Bolivia, Costa Rica, El Salvador, Mexico and Peru); and
• countries with low enrolment and – generally – substantial differences between indicators at both educational levels (Guatemala, Honduras, Nicaragua and Paraguay).
Table 2. Net enrolment ratios by level and age-specific secondary enrolment ratio, primary/secondary gap and percentage difference in secondary enrolment. Post-Dakar period.
Urban areas.
NER
Country
Primary
Secondary
Secondary ASER
Primary/Secondary
gap
Secondary enrolment difference*
Lag**
Bolivia 88.8 74.2 91.5 1.2 17.3 0 Brazil 90.4 76.3 90.2 1.2 14 0 Chile 92.0 82.0 94.9 1.1 12.9 0 Costa Rica 86.5 71.3 91.6 1.2 20.3 0 El Salvador 90.5 63.9 74.8 1.4 10.9 0 Guatemala 83.2 47.2 64.9 1.8 17.7 0 Honduras 88.9 49.8 71.3 1.8 21.5 0 Mexico 95.2 69.3 77.4 1.4 8.1 0

– 4 –
Nicaragua 86.4 57.9 74.5 1.5 16.5 0 Paraguay 93.6 37.7 85.0 2.5 47.3 1 Peru 92.7 73.1 91.7 1.3 18.6 0
* Ratio of secondary school-age pupils in primary education to the total secondary school-age population. ** A ‘1’ indicates those countries where the number of secondary school-age pupils at the primary level is greater than
the number at the secondary level.
Rural areas
In rural areas, primary education covers most of the primary school-age population, although there is less coverage than in urban areas. In some countries, the primary net enrolment ratios are greater than 90% (Chile, Mexico and Peru) and the rest include, as a minimum, three quarters of the official school-age8 population in all countries. Nicaragua and Guatemala lag furthest behind in this regard.
Secondary enrolment is much further from attaining the goal of universalization and at the same time, reflecting the general trend, it is where the greatest diversity among Latin American countries appears. In some countries, secondary enrolment levels are particularly low and this appears in conjunction with a significant proportion of secondary school-age adolescents remaining in primary education.
From a comprehensive analysis of the indicators, three types of countries emerge:
• Countries with high primary and secondary enrolment. These show widespread primary enrolment and although secondary enrolment is less, the situation is the best in the region. The majority of secondary school-age pupils are in secondary education (Chile and Mexico).
• Countries with high, but not widespread primary enrolment (at 85%) and average secondary enrolment for the region. Nevertheless, in these countries, at least one third of the secondary school-age population who actually attend school are at the primary level. The dual existence of high net primary enrolment ratios and a significant proportion of secondary school-age adolescents in primary education raises the possibility of universalization at this level, with significant lag indexes (Peru, Brazil, Costa Rica, El Salvador and Bolivia).
• Countries with the lowest primary enrolment ratios in the region and a very low secondary enrolment ratio (net ratios between 10 and 20% approximately). These countries are noteworthy in having a majority of secondary school-age pupils in primary school (Guatemala, Honduras, Nicaragua and Paraguay).
8 This refers to the ages at which it is expected children will attend primary school in accordance with each
country’s educational requirements.

– 5 –
Table 3. Net enrolment ratios by level and age-specific secondary enrolment ratio, primary/secondary gap and percentage difference in secondary enrolment. Post-Dakar period.
Rural areas.
NER Country Primary
Secondary
Secondary ASER
Primary/ Secondary
relative divide
Difference secondary enrolment*
Lag**
Chile 91.3 74.1 89.8 1.2 15.7 0
México 95.9 59.9 71.3 1.6 11.4 0
Peru 91.5 43.4 79.3 2.1 36 0
Brazil 87.9 53.4 84.7 1.6 31.2 0
Costa Rica 86.3 53.0 79.2 1.6 26.2 0
El Salvador 86.3 36.8 55.7 2.3 18.9 0
Bolivia 84.6 43.2 74.7 2.0 31.5 0
Guatemala 74.7 12.7 37.1 5.9 24.4 1
Honduras 83.6 21.9 49.7 3.8 27.8 1
Nicaragua 78.9 22.4 50.8 3.5 28.4 1
Paraguay 89.5 17.9 65.6 5.0 47.8 1
* Ratio of secondary school-age pupils in primary education to the total secondary school-age population. ** A ‘1’ indicates the countries where the number of secondary school-age pupils at the primary level is greater than
the number at the secondary level.
2 – Recent changes in primary and secondary enrolment levels
A general analysis of the data demonstrates that in the region’s countries enrolment ratios are rising. This is greater in areas that initially had the lowest ratios, in turn leading to a reduction in the urban-rural divide and interregional variations. The rate of growth in primary enrolment is, in general terms, lower than that of secondary enrolment.
Table 4. Net primary and secondary enrolment ratios and average annual growth rate by country. Pre- and post-Dakar periods.
Country total.
Initial situation Annual growth rate Country NPER Total
NSER Total
NPER-NSER Percentage difference
Total NPER9 GR10
Total NSER11 GR
NPER-NSER Percentage difference
Brazil 77.96 46.22 -31.74 1.44 4.55 3.11 Chile 89.39 73.90 -15.49 0.40 1.30 0.91 Costa Rica 68.70 31.10 -37.60 2.32 7.37 5.05 El Salvador 83.37 45.37 -38.00 1.00 2.13 1.13 Honduras 75.10 18.65 -56.45 1.22 5.65 4.43 Mexico 90.96 63.70 -27.26 1.19 1.16 -0.03 Nicaragua 79.64 36.56 -43.08 1.37 5.49 4.11 Paraguay 78.65 24.61 -54.04 3.06 2.58 -0.48 Peru 68.32 56.10 -12.22 10.52 2.83 -7.69
9 NPER refers to net primary enrolment ratio. 10 GR refers to growth rate. 11 NSER refers to net secondary enrolment ratio.

– 6 –
For both primary and secondary enrolment, average growth is greater in rural areas than in urban areas. This means that the rural-urban divide has become less pronounced in all countries.12 In some countries with high growth in rural enrolment, the divide has remained the same as they are also experiencing significant growth in urban enrolment (Costa Rica).
Table 5. Net primary urban and rural enrolment ratios, annual growth in urban and rural primary enrolment and average annual rate of growth in the rural/urban divide by country. Pre- and post-Dakar periods.
Initial situation Annual growth rate Country Urban NPER
Rural NPER
Rural-urban Percentage difference
Urban NPER GR
Rural NPER GR
Rural-urban Percentage difference
NPER divide GR
Brazil 82.90 62.19 -20.71 0.87 3.53 2.65 -2.54 Chile 89.67 88.01 -1.65 0.37 0.52 0.15 -0.14 Costa Rica 70.60 67.40 -3.20 2.05 2.50 0.45 -0.51 El Salvador 87.30 79.86 -7.45 0.59 1.31 0.71 -0.71 Honduras 82.26 70.71 -11.55 0.70 1.53 0.83 -0.81 Mexico 92.18 88.34 -3.85 0.80 2.06 1.26 -1.26 Nicaragua 84.10 74.78 -9.32 0.90 1.81 0.90 -0.74 Paraguay 79.51 77.93 -1.59 3.32 2.81 -0.51 0.41 Peru 72.89 62.59 -10.30 8.35 13.51 5.16 -4.58
Table 6. Net secondary urban and rural enrolment ratios, annual growth in urban and rural secondary enrolment and average annual rate of growth in the rural/urban divide by country. Pre- and post-Dakar periods.
Initial situation Annual growth rate Urban NSER
Rural NSER
Rural-urban difference
Urban NSER GR
Rural NSER GR
Rural-urban difference
GR NSER divide
Brazil 54.40 18.95 -35.45 3.44 10.92 7.48 -6.70 Chile 76.91 59.23 -17.69 0.92 3.26 2.34 -2.20 Costa Rica 41.50 23.30 -18.20 5.56 8.57 3.00 -2.75 El Salvador 63.88 26.56 -37.32 0.00 5.59 5.58 -5.24 Honduras 36.54 6.85 -29.69 2.85 11.16 8.31 -7.35 Mexico 71.22 46.04 -25.18 -0.69 6.80 7.49 -6.76 Nicaragua 52.91 17.04 -35.88 3.07 9.62 6.55 -6.38 Paraguay 36.86 13.19 -23.67 0.46 6.27 5.80 -5.19 Peru 69.20 37.02 -32.18 1.84 5.41 3.57 -3.51
Lastly, interregional variations measured using the variation coefficients have also decreased.
12 With the sole exception of Paraguay.

– 7 –
Table 7. Net primary and secondary urban and rural enrolment ratios. Average annual rate of growth in differences between regions by country.
Country Urban NPER CVGR13
Rural NPER CVGR
Urban NSER CVGR
Rural NSER CVGR
Brazil -11.94 -15.71 -4.51 -8.12 Chile 0.74 -3.24 -4.85 -4.33 Costa Rica -2.07 -2.93 -6.91 -4.36 El Salvador -7.42 5.13 -19.06 -7.21 Honduras -13.31 -4.54 -4.31 -3.65 Mexico -15.91 -24.46 -3.67 -12.27 Nicaragua 0.00 -16.12 -9.33 -5.67 Paraguay -26.77 -8.15 -8.73 -17.26 Peru -23.69 -32.93 2.04 -0.24
Although a general upward trend in terms of enrolment and a reduction in interregional differences can be seen, the forms of growth in the region are distinct.
The aim of this section is to assess how the countries have arrived at their current situation by identifying various recent trend configurations.
Urban areas
Focusing on particular cases, it is possible to identify various ways in which enrolment processes in the region have grown. Brazil and Chile attained significant primary and secondary enrolment, but by different routes: Chile, beginning at a high level, had slow growth, whereas Brazil had higher annual increases.
Costa Rica and Brazil stand out from the group owing to their significant increase in secondary enrolment. Nevertheless, this was achieved in different ways. While in Costa Rica most adolescents who enter school or remain enrolled have an impact almost exclusively on the secondary involvement ratio, in Brazil, enrolment of this group also involves greater growth at the primary level.
Honduras and Nicaragua also stand out because of their significant annual growth in secondary enrolment, but unlike Brazil and Costa Rica, they remain among the countries with the lowest enrolment ratios.
Peru and Paraguay have witnessed major growth in primary enrolment but not in secondary. In Paraguay, more pupils continue to enter primary school, including those of secondary school-age.
13 CVGR refers to coefficients of variation annual growth rate.

– 8 –
Table 8. Net enrolment ratio by level and age-specific secondary enrolment ratios. Pre- and post-Dakar periods. Grouping of countries by final results.
Urban areas.
Year 0
Year 1
Final results Country
Initial NPER
Final NPER
Initial NSER
Final NSER
Initial ASER
Final ASER
1992 2002 Brazil 82.9 90.4 54.4 76.3 78.9 90.2
1996 2003 High ratios
Chile 89.7 92.0 76.9 82.0 91.7 94.9
1995 2005 Costa Rica 70.6 86.5 41.5 71.3 86.4 91.6
1997 2003 El Salvador 87.3 90.5 63.9 63.9 76.0 74.8
2000 2004 Mexico 92.2 95.2 71.2 69.3 78.1 77.4
1997 2000
Intermediate ratios
Peru 72.9 92.7 69.2 73.1 88.0 91.7
1990 2001 Honduras 82.3 88.9 36.5 49.8 68.8 71.3
1998 2001 Nicaragua 84.1 86.4 52.9 57.9 70.2 74.5
1995 2000
Low ratios
Paraguay 79.5 93.6 36.9 37.7 77.4 85.0
Table 9. Average annual rate of growth in net enrolment ratios by level and in age-specific secondary enrolment ratios. Pre- and post-Dakar periods. Grouping of countries by final results.
Urban areas.
Final results
Country
Annual NPER GR
Annual NSER GR
Annual ASER GR
Brazil 0.9 3.4 1.4 High ratios Chile 0.4 0.9 0.5 Costa Rica 2.1 5.6 0.6 El Salvador 0.6 0.0 -0.3 Mexico 0.8 -0.7 -0.2
Intermediate ratios
Peru 8.4 1.8 1.4 Honduras 0.7 2.9 0.3 Nicaragua 0.9 3.1 2.0 Low ratios
Paraguay 3.3 0.5 1.9
Analysis of this data demonstrates that the way in which adolescent enrolment rises is significant. It shows that a rise in secondary school-age adolescent enrolment ratios can occur in two different ways: (a) by adolescents entering at the primary level, with an age lag; and (b) by adolescents entering at the secondary level. These differences demonstrate the relationship between the net and age-specific secondary enrolment ratios.
Different predictions can be made with regard to the countries’ future enrolment ratios depending on the impact of these two processes. To do so, we can examine enrolment trends. By calculating the gaps between age-specific and net secondary enrolment ratios at the beginning and the end of the period under study, it is possible to determine whether the trends have changed in the countries concerned. A smaller gap would mean that more adolescents are entering school at the official age (as is happening in Costa Rica) whereas a gap that remains unchanged would point to a slowdown in the growth of secondary enrolment (as is the case in Paraguay). Although most countries have lesser gaps than Paraguay, they maintain them over time. This means that in most countries, there is

– 9 –
still a sizable group of adolescents who have dropped out before completing primary school. In this context, enrolling adolescents in the school system does not only mean expanding secondary education, but is a necessary condition for achieving universal primary education.
Table 10. Secondary enrolment gap in the pre- and post-Dakar periods by country.
Urban areas.
Country
Secondary enrolment gap* initial situation
Secondary enrolment gap final situation
Brazil 1.5 1.2 Chile 1.2 1.2 Costa Rica 2.1 1.3 El Salvador 1.2 1.2 Mexico 1.1 1.1 Peru 1.3 1.3 Honduras 1.9 1.4 Nicaragua 1.3 1.3 Paraguay 2.1 2.3
* Relationship between the age-specific secondary enrolment ratio and the net secondary enrolment ratio.
Rural areas
Turning now to developments between the two periods in rural areas of Brazil, Costa Rica and Peru, as well as Honduras, Nicaragua and Paraguay, there was initially a greater number of secondary-school age adolescents enrolled in primary school than at the level corresponding to their age.
The first three countries managed to reverse this situation over the 10-year period by greater enrolment of children and adolescents at the levels corresponding to their age in both primary and secondary school. This is indicated by the high annual primary enrolment ratios on the one hand, and the fact that the net annual secondary growth ratio was greater than that of age-specific secondary growth, on the other.
Honduras and Paraguay could well be following the same course as Brazil, Costa Rica and Peru, since their rate of growth in secondary enrolment is highest among the official secondary school-age population, meaning that a significant proportion are entering school at the correct level. This may be the result of policies to promote the opening of schools in these areas.
The situation of Nicaragua is unique, since according to its growth rate it is enrolling pupils of a more advanced age in primary and secondary education in similar proportions. There are more adolescents enrolled in primary school than in secondary school.

– 10 –
Table 11. Net enrolment ratios by level and age-specific secondary enrolment ratios. Pre- and post-Dakar periods. Grouping of countries by final results.
Rural areas.
Year 0 Year 1 Country Initial NPER
Final NPER
Initial NSER
Final NSER
Initial ASER
Final ASER
1992 2002 Brazil 62.2 87.9 18.9 53.4 56.6 84.7
1996 2003 Chile 88.0 91.3 59.2 74.1 79.6 89.8
1995 2005 Costa Rica 67.4 86.3 23.3 53.0 67.0 79.2
1997 2003 El Salvador 79.9 86.3 26.6 36.8 48.6 55.7
1990 2001 Honduras 70.7 83.6 6.8 21.9 41.2 49.7
2000 2004 Mexico 88.3 95.9 46.0 59.9 62.0 71.3
1998 2001 Nicaragua 74.8 78.9 17.0 22.4 39.7 50.8
1995 2000 Paraguay 77.9 89.5 13.2 17.9 58.4 65.6
1997 2000 Peru 62.6 91.5 37.0 43.4 74.7 79.3 Table 12. Average annual rate of growth in net enrolment ratios by level and in age-specific
secondary enrolment ratios. Pre- and post-Dakar periods. Grouping of countries by final results.
Rural areas. Final results
Country
NPER annual growth rate
NSER annual growth rate
ASER annual growth rate
Chile 0.5 3.3 1.7 High ratios Mexico 2.1 6.8 3.5
Brazil 3.5 10.9 4.1 Costa Rica 2.5 8.6 1.7 El Salvador 1.3 5.6 2.3
Intermediate ratios
Peru 13.5 5.4 2.0 Honduras 1.5 11.2 1.7 Nicaragua 1.8 9.6 8.6 Low ratios
Paraguay 2.8 6.3 2.4
Table 13. Secondary enrolment gaps in pre- and post-Dakar periods by country.
Rural areas.
Country
Secondary enrolment gap* Initial situation
Secondary enrolment gap Final situation
Brazil 3.0 1.6 Chile 1.3 1.2 Costa Rica 2.9 1.5 El Salvador 1.8 1.5 Mexico 6.1 2.3 Peru 1.3 1.2 Honduras 2.3 2.3 Nicaragua 4.4 3.7 Paraguay 2.0 1.8
* Relationship between the age-specific secondary enrolment ratio and the net secondary enrolment ratio.

– 11 –
3 – Absence of enrolment in primary school
We have seen that primary enrolment in the various countries appears widespread, although there are sometimes significant lag indexes. Nevertheless, in some countries of the region, a significant proportion of primary school-age children have never attended school.14 The overarching question of this chapter is – are there high percentages of children not receiving any schooling or is it actually a case of late entry into the education system?
In order to assess whether children are entering primary school later than expected, we have compared the attendance rates for various age groups. Comparing the attendance rates for first grade-age children with those of children two years older, we find significant variations between countries. This is an initial indicator of late entry into the education system. In most countries, attendance ultimately exceeds 95%. Taking into account that dropouts may affect the latter indicator, the percentage of children who have never attended school appears to be decreasing.
The case of rural Chile is a good example of this phenomenon. Here, only 86% of children who should enter the primary level are actually attending school. Nevertheless, almost 100% of children two years older are in school. Although there is a lag, everyone eventually receives an education. This is a clear example of late entry.
Table 14. Percentage of children who have never attended primary school and attendance rates by age, broken down by country. Pre- and post-Dakar periods.
Urban areas.
Country
Percentage (%) who never attended at primary level
Attendance rate for official
starting age15
Attendance rate for children two years older than official starting
age16
Percentage difference
Peru 0.30 97.40 98.40 1.00 Chile 0.50 98.10 99.60 1.50 Costa Rica 0.50 98.60 100.00 1.40 Mexico 1.40 97.50 99.10 1.60 Brazil 1.80 96.30 98.50 2.20 Paraguay 2.50 94.50 99.00 4.50 Bolivia 3.20 91.10 96.60 5.50 El Salvador 3.30 91.80 95.30 3.50 Honduras 4.50 83.70 97.30 13.60 Nicaragua 5.30 90.90 95.60 4.70 Guatemala 9.20 82.70 92.80 10.10
14 In urban areas, the percentage of children who have never attended primary school is less than 4% in most
countries. In rural areas, this figure is higher. 15 The age corresponding to the official age for starting primary school. 16 This refers to children who are two years older than the official age for starting primary school.

– 12 –
Table 15. Percentage of children who have never attended primary school and attendance rates by age, broken down by country. Pre- and post-Dakar periods.
Rural areas.
Country
Percentage (%) who never attended at primary level
Attendance rate for official
starting age
Attendance rate for children two years older than official starting
age
Percentage difference
Mexico 1.20 97.50 99.30 1.80 Costa Rica 1.70 91.80 99.50 7.70 Peru 2.10 88.70 95.00 6.30 Chile 2.40 86.50 99.70 13.20 Brazil 3.30 92.80 97.40 4.60 Bolivia 7.80 72.50 95.30 22.80 Paraguay 8.00 75.30 97.00 21.70 El Salvador 8.40 80.00 91.50 11.50 Honduras 9.00 74.70 92.30 17.60 Nicaragua 15.70 75.20 87.70 12.50 Guatemala 18.20 65.60 82.60 17.00
There is also a group of countries where – particularly in rural areas – late entry occurs, and at the same time, the attendance rate for older children does not exceed 92% (sometimes dropping to 83%). This is the case of El Salvador, Honduras, Nicaragua and Guatemala. Does late entry coexist here with a population that has never attended school?
Assuming that those who fail to enter school two years late are unlikely to attend school in the future, it is possible to clearly define the phenomenon of school non-attenders. Looking at this group of countries, the percentage of children who never attended primary school was calculated for the various age groups.17 Noteworthy in this regard are Nicaragua and Guatemala where more than 10% of children aged nine living in rural areas have never attended school. In these countries, the two trends that we are endeavouring to identify appear to coexist.
Moreover, in all these countries, the percentage of children enrolled later than at the official age exceeds 50%.
Table 16. Percentage of children who never attended primary school in total and by age, broken down by rural and urban areas. Pre- and post-Dakar periods. Countries with the highest non-attendance levels.
Area
Country
Percentage (%) who
never attended at primary level
Percentage (%) who fail to enter at the official
starting age
Percentage (%) who fail to enter at one year after the official
starting age
Percentage (%) who fail to enter at two years after the official
starting age
Age gap*
Urban Guatemala 9.18 15.90 11.66 7.02 55.86 El Salvador 8.42 19.61 9.31 6.82 65.21 Honduras 9.02 24.86 12.44 6.51 73.83 Nicaragua 15.67 24.80 16.50 10.38 58.16
Rural
Guatemala 18.16 34.16 19.72 15.97 53.24
* Indicates the percentage of children who enrolled later than the official age.
17 This disaggregation was not possible for the other countries owing to the small number of cases.

– 13 –
Lastly, in answer to the initial question, it can be said that (a) in all the countries where a significant percentage of primary school-age children have never attended school, there is also significant late entry into education; and (b) while this characteristic is shared, variations are found between countries where attendance exceeds 95% in older children, and countries where attendance continues to be lower, even among older children. In these cases, non-attendance seems to coexist with late entry.
4 – Decreasing growth in educational expansion processes
As already mentioned, there is an upward trend in enrolment ratios, particularly in the most disadvantaged areas. Nevertheless, within this general trend, there are various forms of growth in the different countries. This section will endeavour to propose an explanation for these trends. In order to examine the regional and urban variations in more depth, data disaggregated by region for each country will be used.
Enrolment is generally on the rise, but this is largely happening in the most disadvantaged areas, leading to the conclusion that the increase in enrolment is not linear and that it could even see a decline. This situation is illustrated by the graphs below, in which the growth in enrolment ratios is linked to the initial values of these ratios. In both cases, it can be seen – as would be expected – that the lowest starting points correspond to a higher growth ratio. Nevertheless, it can also be seen that when enrolment becomes widespread, growth tends to flatten out.
To illustrate this process, the graphs present two contrasting situations. Graph 1 shows widespread and homogeneous primary enrolment in urban areas, while graph 2 shows heterogeneous and limited net secondary enrolment in rural areas. This demonstrates how enrolment growth flattens out when it becomes widespread. In graph 1, enrolment growth begins to plateau at 80%. In graph 2, where enrolment does not reach 80% in any case, no plateau is seen.
Graph 1. Urban NPER growth rate Graph 2. Rural NSER growth rate
TNEP inicial Ur
10090
8070
6050
4030
2010
0
Tasa
cre
cim
ient
o N
EP
Ur
20
15
10
5
0
-5
PAÍS
Paraguay
Nicaragua
México
Honduras
El Salvador
Costa Rica
Chile
Brasil
TNES inicial Ru
10090
8070
6050
4030
2010
0
Tasa
cre
cim
ient
o N
ES
Ru
20
15
10
5
0
-5
PAÍS
Paraguay
Nicaragua
México
Honduras
El Salvador
Costa Rica
Chile
Brasil
5 – Relationship between enrolment growth and other social indicators
It is logical to assume that a country’s rate of growth is associated with its socioeconomic characteristics, such as the degree of poverty. Initially, there appears to be an association between extreme poverty (measured by the percentage of critically overcrowded households) and very low school enrolment, meaning that a fixed minimum threshold is necessary to ensure that children and adolescents attend school. This is particularly true in countries where adolescent enrolment is low, even when adolescents going to primary school are counted. Guatemala, Honduras and Nicaragua
– 14 –
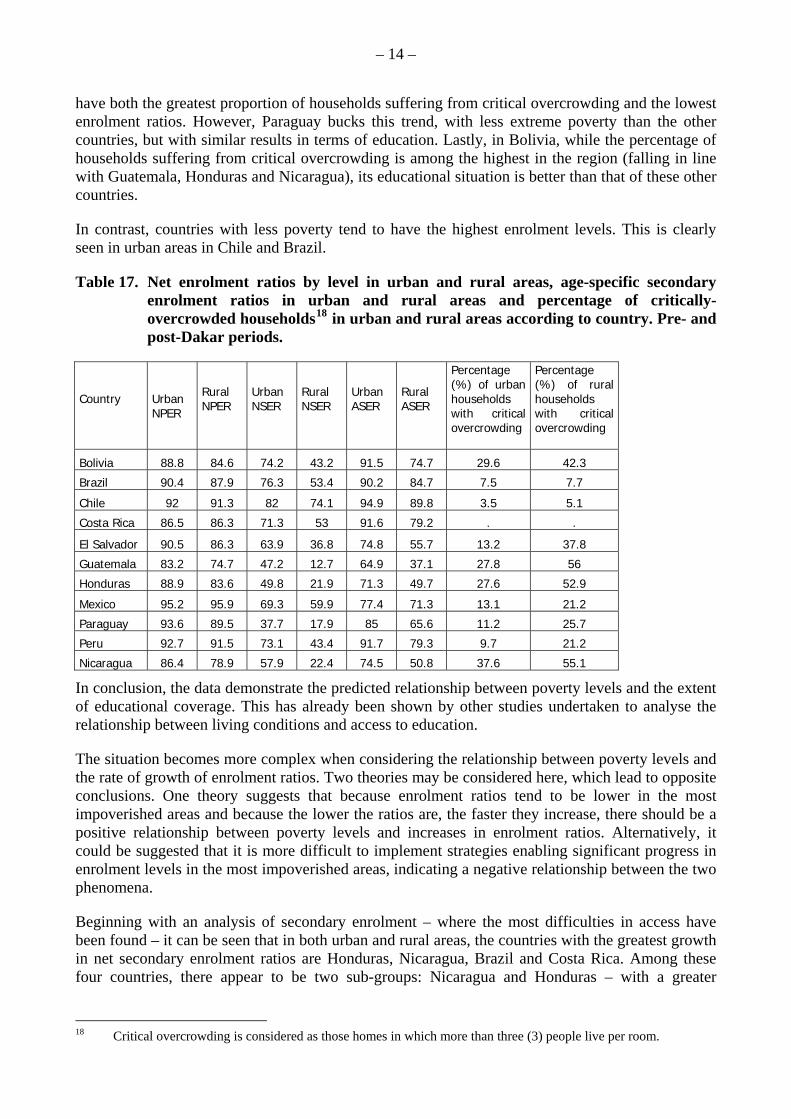
have both the greatest proportion of households suffering from critical overcrowding and the lowest enrolment ratios. However, Paraguay bucks this trend, with less extreme poverty than the other countries, but with similar results in terms of education. Lastly, in Bolivia, while the percentage of households suffering from critical overcrowding is among the highest in the region (falling in line with Guatemala, Honduras and Nicaragua), its educational situation is better than that of these other countries.
In contrast, countries with less poverty tend to have the highest enrolment levels. This is clearly seen in urban areas in Chile and Brazil.
Table 17. Net enrolment ratios by level in urban and rural areas, age-specific secondary enrolment ratios in urban and rural areas and percentage of critically-overcrowded households18 in urban and rural areas according to country. Pre- and post-Dakar periods.
Country
Urban NPER
Rural NPER
Urban NSER
Rural NSER
Urban ASER
Rural ASER
Percentage (%) of urban households with critical overcrowding
Percentage (%) of rural households with critical overcrowding
Bolivia 88.8 84.6 74.2 43.2 91.5 74.7 29.6 42.3
Brazil 90.4 87.9 76.3 53.4 90.2 84.7 7.5 7.7
Chile 92 91.3 82 74.1 94.9 89.8 3.5 5.1
Costa Rica 86.5 86.3 71.3 53 91.6 79.2 . .
El Salvador 90.5 86.3 63.9 36.8 74.8 55.7 13.2 37.8
Guatemala 83.2 74.7 47.2 12.7 64.9 37.1 27.8 56
Honduras 88.9 83.6 49.8 21.9 71.3 49.7 27.6 52.9
Mexico 95.2 95.9 69.3 59.9 77.4 71.3 13.1 21.2
Paraguay 93.6 89.5 37.7 17.9 85 65.6 11.2 25.7
Peru 92.7 91.5 73.1 43.4 91.7 79.3 9.7 21.2
Nicaragua 86.4 78.9 57.9 22.4 74.5 50.8 37.6 55.1
In conclusion, the data demonstrate the predicted relationship between poverty levels and the extent of educational coverage. This has already been shown by other studies undertaken to analyse the relationship between living conditions and access to education.
The situation becomes more complex when considering the relationship between poverty levels and the rate of growth of enrolment ratios. Two theories may be considered here, which lead to opposite conclusions. One theory suggests that because enrolment ratios tend to be lower in the most impoverished areas and because the lower the ratios are, the faster they increase, there should be a positive relationship between poverty levels and increases in enrolment ratios. Alternatively, it could be suggested that it is more difficult to implement strategies enabling significant progress in enrolment levels in the most impoverished areas, indicating a negative relationship between the two phenomena.
Beginning with an analysis of secondary enrolment – where the most difficulties in access have been found – it can be seen that in both urban and rural areas, the countries with the greatest growth in net secondary enrolment ratios are Honduras, Nicaragua, Brazil and Costa Rica. Among these four countries, there appear to be two sub-groups: Nicaragua and Honduras – with a greater
18 Critical overcrowding is considered as those homes in which more than three (3) people live per room.

– 15 –
percentage of critically overcrowded households and of children aged under six – and Brazil and Costa Rica with lower poverty levels.
This initial analysis fails to find a clear relationship between increases in educational indicators and socio-economic factors.
Table 18. Annual growth rate in net secondary enrolment in the pre- and post-Dakar period, percentage of children aged under six and percentage of critically overcrowded households in the post-Dakar period, by country.
Urban areas.
Country
NSER GR
Percentage (%) of children aged
under six
Percentage (%) of critical
overcrowding Mexico -0.7 11.5 15.2 El Salvador 0.0 12.0 18.0 Paraguay 0.5 13.9 14.0 Chile 0.9 9.2 6.9 Peru 1.8 11.8 13.1
Honduras 2.9 14.2 41.9
Nicaragua 3.1 13.1 44.0
Brazil 3.4 10.3 10.1
Costa Rica 5.6 10.3 .
Table 19. Annual growth rate in net secondary enrolment in the pre- and post-Dakar period, percentage of children aged under six and percentage of critically overcrowded households in the post-Dakar period, by country.
Rural areas.
Country
NSER GR
Percentage (%) of children aged
under six
Percentage (%) of critical overcrowding
Chile 3.3 8.8 10.7 Peru 5.4 13.9 29.8 El Salvador 5.6 15.0 47.9 Paraguay 6.3 17.2 29.1 Mexico 6.8 13.5 32.9
Costa Rica 8.6 12.5 .
Nicaragua 9.6 16.8 59.1
Brazil 10.9 12.1 11.5
Honduras 11.2 17.7 69.8
Nevertheless, by ranking the countries by their net secondary enrolment ratios in the pre- and post-Dakar periods, we observe that the countries with higher levels of enrolment and lower levels of poverty were able to improve their situation relative to the rest. This does not happen in countries where the deficits are greater. The urban areas of Brazil and Costa Rica thus improved their situation relative to the other countries (moving from fifth and eighth place to first and fourth place respectively), while the situation of Honduras and Guatemala remained unchanged or worsened.

– 16 –
Table 20. Relative position of the countries19 according to their net secondary enrolment ratios in pre- and post-Dakar periods, by country.
Urban areas.
Country
NSER ranking initial situation
NSER ranking final situation
Brazil 5 1
Chile 1 2
Costa Rica 8 4
El Salvador 4 7
Honduras 7 8
Mexico 2 5
Nicaragua 6 6
Paraguay 9 9
Peru 3 3
Something similar occurs in rural areas, although since there is much greater variation between countries, their relative positions remain somewhat more stable. It would seem that in rural areas where the situations of the countries are more heterogeneous, changing their relative positions takes more time.
Table 21. Relative position of the countries according to their net secondary enrolment ratios in pre- and post-Dakar periods, by country.
Rural areas.
Country
NSER ranking initial situation
NSER ranking final situation
Brazil 6 5
Chile 1 1
Costa Rica 5 4
El Salvador 4 6
Honduras 9 9
Mexico 2 2
Nicaragua 7 7
Paraguay 8 8
Peru 3 3
Reference has been made throughout this paper to a group of countries in which the proportion of adolescents enrolled in primary school is greater than those in secondary school. While decreasing over time in all the countries, these differences are more or less significant depending on the level of poverty. Brazil and Costa Rica have thus had a greater decrease in the percentage of adolescents in primary education than Honduras and Nicaragua, in both urban and rural areas.
19 In order to rank the countries according to their relative position, the net enrolment ratios for 1995 (initial
situation) and 2005 (final situation) were used.

– 17 –
Table 22. Growth rate in the pre- and post-Dakar periods of the proportion of adolescents enrolled at primary level, by country.
Urban areas.
Country
Growth rate of the proportion of adolescents enrolled at primary level
Brazil -6.8
Chile -2.4
Costa Rica -8.2
El Salvador -1.5
Honduras -3.9
México 4.3
Nicaragua -3.3
Paraguay 1.2
Peru -1.7
Table 23. Growth rate in the pre- and post-Dakar periods of the proportion of adolescents enrolled at primary level, by country.
Rural areas.
Country
Growth rate of the proportion of adolescents enrolled at primary level
Brazil -5.7
Chile -5.3
Costa Rica -6.6
El Salvador -4.7
Honduras -3.6
Mexico -11.3
Nicaragua -0.7
Paraguay -1.2
Peru -3.6
Lastly, the late entry of children into primary school has been noted. In cases such as that of Chile, the non-enrolment of children can be explained entirely by late entry. In other countries, late entry coexists with a portion of the population that never attends school (Nicaragua and Guatemala). In this regard also, the differences are based on socio-economic factors. It is in countries with the greatest percentage of critically overcrowded households that these two phenomena coexist.
Lastly, it can be said that, despite upward trends and improvements in various educational indicators, this growth does not help the extremely poor countries to improve their relative position in the region.
Conclusions
Understanding the logic of the region’s educational processes is a complex task, especially against the background of the major economic, social and cultural changes now sweeping through Latin America. An analysis that can not only describe the recent trends in the enrolment of children and adolescents, but also determine which factors favour progress and which are obstacles to universal

– 18 –
education must rely on multiple information sources and increasingly complex methodological strategies.
The data presented in this document are undoubtedly not sufficient to provide a thorough understanding of the issues. The data make it possible to identify and measure specific phenomena, but they are not adequate to the task of formulating explanations that go beyond pure description.
Still, it is possible to offer some theories and ideas that may stimulate new analyses of the data and, at the same time, suggest some connections between the descriptive processes and social and education policies. The last section presents observations along those lines, which emerge from the principal findings that have been made.
(1) Greater access to education and less inequality
At least three findings that emerge from the data are worthy of being considered in parallel:
• There has been a general rise in the region’s enrolment rates;
• This rise is the result of increasing numbers of adolescents in the schools;
• Increases in enrolment levels were highest in what were initially the most disadvantaged areas, such as rural communities or the poorest regions, resulting in a reduction in the educational gaps between each country’s various regions.
These facts point to a period of significant expansion in education in the region, in which nearly all children are entering school, and increasing numbers are remaining there. The trend towards universal access, the fact that more adolescents are staying in school and the narrowing of the educational divide support a positive assessment of recent trends in Latin America.
This should not be surprising. In principle, this is because Latin American education systems have shown, from their beginnings at the turn of the twentieth century, almost constant growth and expansion within the various social sectors. Decade after decade, increases in access to education and in enrolment levels have been noted.
Moreover, many efforts have been made since the beginning of the 1990s to consolidate progress towards education for all. This is in response to education’s central place in the public policy agenda issuing from the development model that has been consolidated since that time. Nearly all the region’s countries have made sweeping educational reforms, designed to reach the goal of universal secondary education and increase the length of compulsory education.
In addition to these reforms, various compensatory policies seeking to extend access to education to poor and rural communities in the region have become widespread. These policies provided for additional transfers of funds to support schools serving the most disadvantaged social sectors and the families themselves, through scholarships.
At the same time, the issue of indigenous education became a much more powerful challenge than in previous decades, giving rise to the development of many intercultural education programmes seeking to boost enrolment among the region’s indigenous communities.
These specific policy measures implemented by the region’s States coincided with a broad debate that confirmed education as an inalienable right and bound States to guarantee it. This growing debate on the role of education in the region’s new development policy and the strengthening of
– 19 –
education from a rights perspective has given rise to another phenomenon already noted in the region – society’s growing demand for education.
Various qualitative studies conducted in Latin America have in fact shown an increasing tension between the greater expectations put on education by families from the most disadvantaged sectors, as well as a decline in the social conditions necessary for these expectations to become reality.20
(2) A remaining challenge in terms of access: secondary education
Two points have emerged from the data which will inevitably leave their mark on the educational agenda for the coming years. On the one hand, in terms of access to and remaining in school, it can be said that the region is close to achieving universal primary education. On the other hand, while significant gains have been made in adolescent enrolment, much undoubtedly remains to be done to ensure that all children complete primary and secondary school.
An indication that primary education is widespread is the coexistence of high net enrolment ratios at this level with a significant gap between net secondary enrolment ratios and age-specific enrolment ratios for adolescents. This gap demonstrates clearly that a significant number of adolescents remain at the primary level. Furthermore, the number of primary school-age children in the region who do not attend school is low. In those countries where this indicator is significant, most of the cases are among the youngest children, meaning that it is more a problem of late entry than of access. While nearly all children living in urban areas eventually enter the education system, the problem of lack of access to primary education is much greater for those living in the more impoverished rural areas.
At the secondary level, the perspective shifts. While many adolescents have entered the education system, the data indicate that in many cases, and particularly in rural areas, this influx of pupils was into primary schools. In these cases, the net secondary enrolment ratios remain very low.
(3) Boosting educational goals: lack of enrolment when education is available
From the data it emerges that the highest growth in enrolment ratios is registered by the most disadvantaged social sectors or groups. While various factors underlie this trend, one of the most important is the rate of growth of the offer.
Most of the region’s countries provide universal coverage for the middle and upper classes – essentially urban – in the age groups corresponding to primary and secondary education. Current educational goals involve incorporating historically neglected social sectors and increasing the range of ages to be enrolled. This has led to a significant effort to provide education where none has been offered in the past, or to expand the existing offer. This expansion of the offer explains the high rate of enrolment, especially in the lowest income sectors and in rural areas.
In any event, it is important to remember that in the process of moving towards fixed social goals, the rhythm decreases as the indexes get closer to their final value. In the context of low enrolment, for example, education forms part of what is known as “soft areas” of social policy, i.e. those offering the least resistance to change. As offer begins to meet demand, society as a whole must make greater efforts and invest more resources to achieve full enrolment. This is how education is gradually moving into what are known as “hard areas” of social policy. Once education becomes a hard area, the goal of attracting and retaining great numbers of children and adolescents in order to
20 Some of the research conducted by the UNESCO International Institute for Educational Planning (IIEP) in
Buenos Aires pertains to this phenomenon. See “Educación, reformas y equidad en los países de los Andes y el Cono Sur” (Education, reform and equity in the Andean and Southern Cone countries).

– 20 –
provide them with quality education will require greater efforts, capable of removing any structural obstacle. From an operational perspective, policy tools that were highly effective when the coverage expansion processes began, or those that brought the education system to its current level of attainment, are not necessarily the ones needed to attain the goal of quality education for all.
A turning point, which many countries in the region are reaching, is when the educational offer begins to equal or exceed the demand from families and the community. As long as demand exceeds supply, the rate of enrolment growth is determined almost exclusively by the capacity of each State to increase the offer.
However, the greatest difficulty is in situations in which, although education is available, children and adolescents do not take advantage of it. While this is particularly obvious in secondary education, where the factors determining whether an adolescent remains in school are particularly complex, the phenomenon does affect all levels. In such cases, actions necessary to ensure full enrolment go beyond the possibilities of the education system and involve cultural, employment and family issues and so forth.
As already noted, the region’s education systems have demonstrated significant capacity for expansion decade after decade, since they were first established. Nevertheless, there are indications that the current decade may be a turning point for countries that have made the greatest progress in enrolling their children and adolescents. In societies in which the 90% enrolment threshold has been crossed, the rate of growth tends to be almost zero, and there are even serious threats of a slight decrease.21
(4) The relationship between educational expansion and poverty
The last significant finding concerns the relationship between the increase in enrolment ratios and structural poverty levels, measured using indicators such as critical overcrowding and the relative presence of children aged under six in the demographic structure. The rate of expansion of education coverage, at both primary and secondary levels, was higher where initial coverage was lower. Beyond this general trend, the data show that countries with the greatest structural poverty have not managed to reach coverage indexes that would bring them nearer to the intermediate positions of the Latin American region and that this expansion brought with it problems linked to late entry and age lag. Therefore, even with high growth rates, the regions of Latin America with the highest structural poverty indexes continue to be in the worst position in terms of net secondary enrolment ratios. These same regions also have the greatest number of secondary school-age children in primary school.
Poverty accounts for a good many but not all of the multiple factors impeding access to education. For example, there is a set of factors linked to the geographical distribution of families and schools. In countries with larger rural populations and more difficult terrain, obstacles to expansion are linked to problems of physical inaccessibility and isolation that are not necessarily associated with poverty.
However, the greatest difficulties can be seen in secondary education, where the reasons why adolescents do not remain in school are truly diverse. Although the need to move into the labour market is usually one of the reasons invoked most often in that regard – associated with low income – the cultural dimension is also a significant challenge at this level, affecting even the urban middle class. 21 This same trend was already identified and analysed in “Equidad educativa y desigualdad social. Desafíos de la
educación en el nuevo escenario latinoamericano” (Equitable education and social inequality. Educational challenges in the new Latin American context) IIEP-UNESCO, Buenos Aires, López, 2005.

– 21 –
Indeed, secondary education today has to meet the challenge of producing an offer that is attractive to young people, who form an entirely heterogeneous universe. The growth of what are known as the new urban youth cultures has given rise to various scenarios on which adolescents’ socialization and identity-building processes are based. In many cases, they represent a major obstacle for educational institutions.
The difficulties in attaining full enrolment for adolescents and ensuring the goal of universal secondary education far outweigh those issues linked to the problem of poverty. The imbalance between the institutional proposals that define this level of education and the subjectivities of the new youth cultures is perhaps one of the principal obstacles still to be removed and which is found throughout the Latin American social spectrum.


![Heritage Homeowner's Preservation Manuals for ... - …unesdoc.unesco.org/images/0015/001520/152020m.pdf · Heritage Homeowner’s Preservation Manual;Dkbf 33/wgLsf] ;;+/If0f DDofg'on;Dkbf](https://img.pdfslide.us/doc/110x75/5b81004e7f8b9aad638b61bd/heritage-homeowners-preservation-manuals-for-heritage-homeowners-preservation.jpg)