Embed Size (px)
Citation preview
Council for Agricultural Science and TechnologyPrinted in the United States of America
Cover design by Lynn Ekblad, Different Angles, Ames, IowaGraphics by Richard Beachler, Instructional Technology Center,
Iowa State University, Ames
ISBN 1-887383-20-4ISSN 0194-408805 04 03 02 4 3 2 1
Library of Congress Cataloging-in-Publication Data
Urban and Agricultural Communities: Opportunities for Common Groundp. cm.Includes bibliographical references (p. ).ISBN 1-887383-20-4 (alk. paper)1. Urban agriculture. 2. Land use, Urban. 3. Agriculture--Economic aspects.I. Council for Agricultural Science and Technology.
S494.5.U72 U74 2002630'.91732-dc21 2002005851
CIP
Urban and Agricultural Communities:Opportunities for Common Ground
Council for Agricultural Science and TechnologyAmes, Iowa
Task Force Report No. 138 May 2002
Lorna Michael Butler (Cochair and Lead Coauthor), College of Agriculture, Departments of Sociology andAnthropology, Iowa State University, Ames
Dale M. Maronek (Cochair and Lead Coauthor), Department of Horticulture and Landscape Architecture,Oklahoma State University, Stillwater
Task Force Members
ii
Reviewers
Mark B. Lapping, Edmund S. Muskie School of Public Service, University of Southern Maine, Portland
Douglas J. Lawrence, U.S. Department of Agriculture, Natural Resources Conservation Service, Washing-ton, D.C.
John J. Sloan, Texas Agricultural Experiment Station, Texas A&M University–Dallas, Dallas
Nelson Bills, Department of Applied Economics and Management, Cornell University, Ithaca, New York
Tim D. Davis, Texas A&M University Research and Extension Center, Dallas
Julia Freedgood, American Farmland Trust, Northampton, Massachusetts
Frank M. Howell, Department of Sociology, Anthropology, and Social Work, Mississippi State University,Mississippi State
John Kelly, Public Service and Agriculture, Clemson University, Clemson, South Carolina
Lawrence W. Libby, Department of Agricultural, Environmental, and Development Economics, The Ohio StateUniversity, Columbus
Kameshwari Pothukuchi, Department of Geography and Urban Planning, Wayne State University, Detroit,Michigan
Diane Relf, Department of Horticulture, Virginia Polytechnic Institute and State University, Blacksburg
John K. Thomas, Department of Rural Sociology, Texas A&M University and the Texas Agricultural Experi-ment Stations, College Station
Paul B. Thompson, Department of Philosophy, Purdue University, West Lafayette, Indiana
Contributing Authors
Contents
Interpretive Summary . . . . . . . . . . . . . . . . . . . . . . . . . . . . . . . . . . . . . . . . . . . . . . . . . . . . . . . . . . . . . . . . . . . . . . 1Agriculture's Contributions to Urbanization, 1Policy and Institutional Dimensions, 1New Visions for Urban Agriculture, 2Conclusions, 3
Executive Summary . . . . . . . . . . . . . . . . . . . . . . . . . . . . . . . . . . . . . . . . . . . . . . . . . . . . . . . . . . . . . . . . . . . . . . . 4Introduction, 4Agriculture's Service Role, 8Agriculture's Benefits to the Urbanizing Society, 8Recreation and Leisure, 8Policy and Institutional Dimensions of Urban Agriculture, 9New Visions for Urban Agriculture, 10Conclusions, 11
1 Introduction . . . . . . . . . . . . . . . . . . . . . . . . . . . . . . . . . . . . . . . . . . . . . . . . . . . . . . . . . . . . . . . . . . . . . . . . . . 12The Rural-Urban Agroecosystem, 13Urban Agriculture Defined, 14Objectives, 14Historical Context of Agriculture, 15Agriculture Represents an Opportunity, 17Background and Situation, 18Recent U.S. Demographic Changes, 22Today's Rural-Urban Agriculture, 23Myths, Stereotypes, and Realities, 24The Scope of Urban Agriculture, 25
2 Agriculture's Service Role in the Urbanizing Society. . . . . . . . . . . . . . . . . . . . . . . . . . . . . . . . . . . . . . . . . 27Introduction, 27Agroecosystem Services for Restoration and Remediation, 27 Storm Water Management, 27 Water Remediation and Wastewater Reclamation, 28 Waste Recycling, 30 Carbon Sequestration, 31 Remediation of Brownfields, 31
3 Agriculture's Service Role in Planning and Revitalization . . . . . . . . . . . . . . . . . . . . . . . . . . . . . . . . . . . . 33Introduction, 33Managing Growth, 34Landscape and Energy Modifications, 35 Indoor-Outdoor Air Quality, 36Insect, Disease, and Wildlife Management, 36Conserving and Revitalizing Land Areas, 38Merging the Interests of Stakeholders in the Planning Process, 40
4 Agriculture's Busines Contribution to the Urbanizing Society . . . . . . . . . . . . . . . . . . . . . . . . . . . . . . . . . 41Introduction, 41Environmental Horticulture and the Green Industry, 41 Nursery and Greenhouse Crop Production, 42
iii
Retail Garden Centers and Nurseries, 43 Landscape Design, Installation, and Maintenance, 43 Turfgrass Production and Management, 44 Foliage Plants and Interiorscapes, 44 Cut Flowers, 45Companion Animal Industry, 46Equine Industry, 46Aquaculture, 47
5 Agriculture's Contributions to Community Health and Well-Being . . . . . . . . . . . . . . . . . . . . . . . . . . . . . 48Introduction, 48Individual Health and Well-Being, 48Community Quality of Life, 51Community Food Systems, 53 Community Supported Agriculture, 54 Entrepreneurial Food Gardens and Farms, 55 Farmers' Markets, 58 Farm-to-Table Programs, 60
6 Recreation and Leisure . . . . . . . . . . . . . . . . . . . . . . . . . . . . . . . . . . . . . . . . . . . . . . . . . . . . . . . . . . . . . . . . . 62Introduction, 62On-Farm Recreation and Entertainment Farming, 62Consumer Horticulture, 63Horticultural Tourism, 64 Touring Green Industry Businesses, 64 Public Gardens and Zoos, 65Golf and Other Sports, 66
7 Policy and Institutional Dimensions of Urban Agriculture . . . . . . . . . . . . . . . . . . . . . . . . . . . . . . . . . . . . 68Introduction, 68Setting Policy, 69Land Protection Initiatives, 70The Farmland Protection Toolbox, 71 Regulatory Programs, 71 Incentive Programs, 72
8 New Visions for Urban Agriculture. . . . . . . . . . . . . . . . . . . . . . . . . . . . . . . . . . . . . . . . . . . . . . . . . . . . . . . . 78Introduction, 78Comprehensive Planning, 80Public Policy, 81 Land Use, 81 Food Systems, 82 Human Capital Development, 83Higher Education, 83Research, 85Partnerships and Collaboration, 89Conclusions, 93
Appendix A: Tables . . . . . . . . . . . . . . . . . . . . . . . . . . . . . . . . . . . . . . . . . . . . . . . . . . . . . . . . . . . . . . . . . . . . . . 95
Appendix B: Abbreviations, Acronyms, and Symbols . . . . . . . . . . . . . . . . . . . . . . . . . . . . . . . . . . . . . . . . . 108
Appendix C: Glossary . . . . . . . . . . . . . . . . . . . . . . . . . . . . . . . . . . . . . . . . . . . . . . . . . . . . . . . . . . . . . . . . . . . 109
Literature Cited . . . . . . . . . . . . . . . . . . . . . . . . . . . . . . . . . . . . . . . . . . . . . . . . . . . . . . . . . . . . . . . . . . . . . . . . . 111
Index . . . . . . . . . . . . . . . . . . . . . . . . . . . . . . . . . . . . . . . . . . . . . . . . . . . . . . . . . . . . . . . . . . . . . . . . . . . . . . . . . . 118
iv Contents
Figures
S.1 Rural and urban areas of Richmond, Virginia, 4
S.2 Corn production in Colorado, 6
S.3 Neighborhood residents in Chicago, Illinois, work in the community vegetable garden, 6
S.4 Researchers in Arizona spray a mix of common liquid dishwashing detergent and cooking oil that killssweet potato whiteflies, as well as several common home garden pests, 8
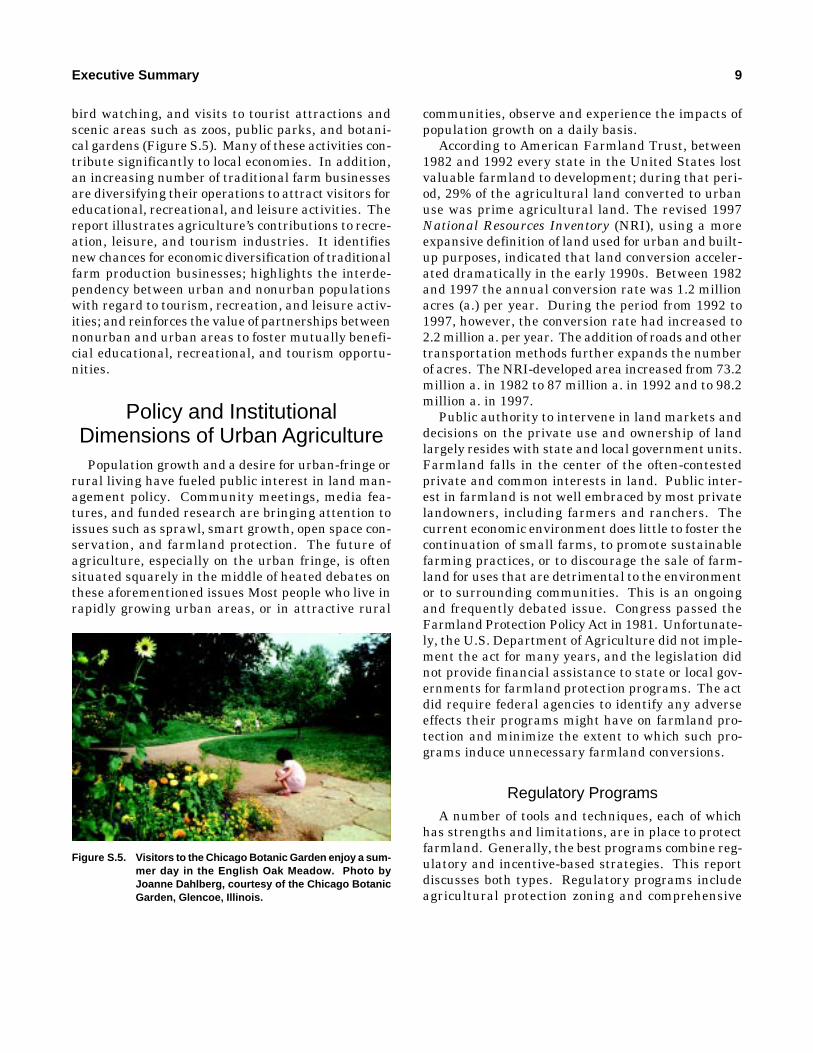
S.5 Visitors to the Chicago Botanic Garden enjoy a summer day in the English Oak Meadow, 9
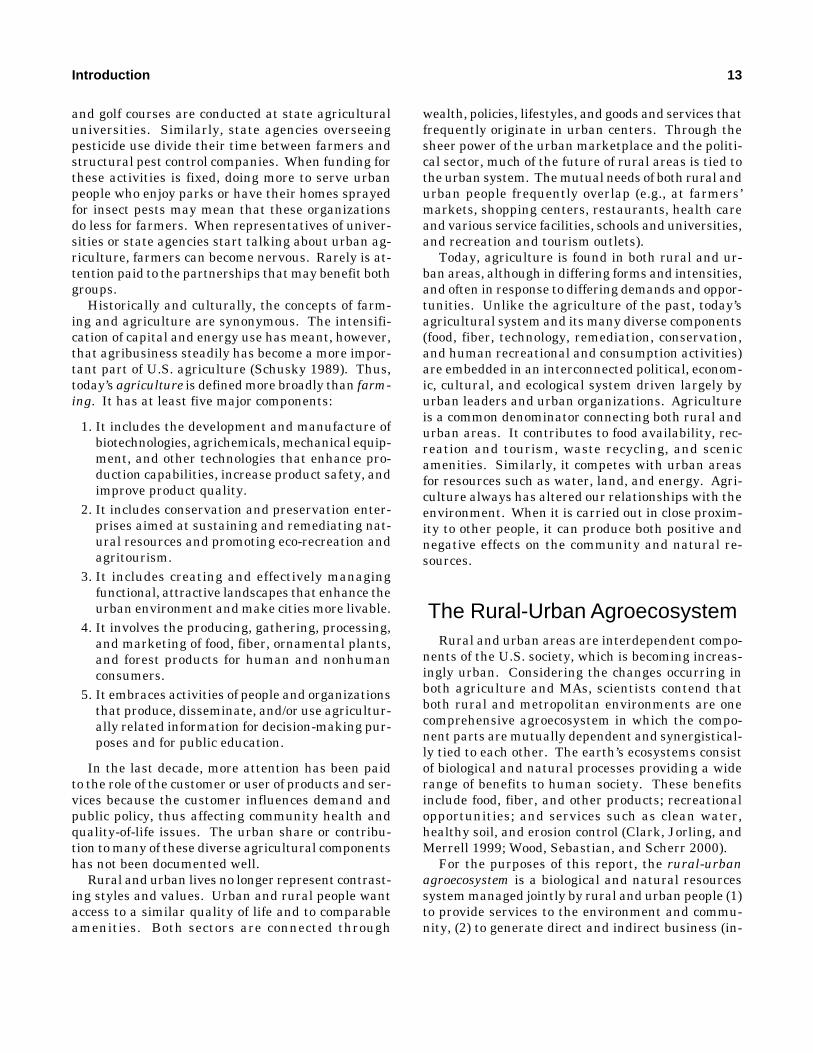
1.1 Understanding the functionality of the rural-urban agroecosystem within an urbanizing society can behelpful in establishing how parts interact with each other and areas of common ground to ensure thehealth of the whole society, including the total agricultural system, 14
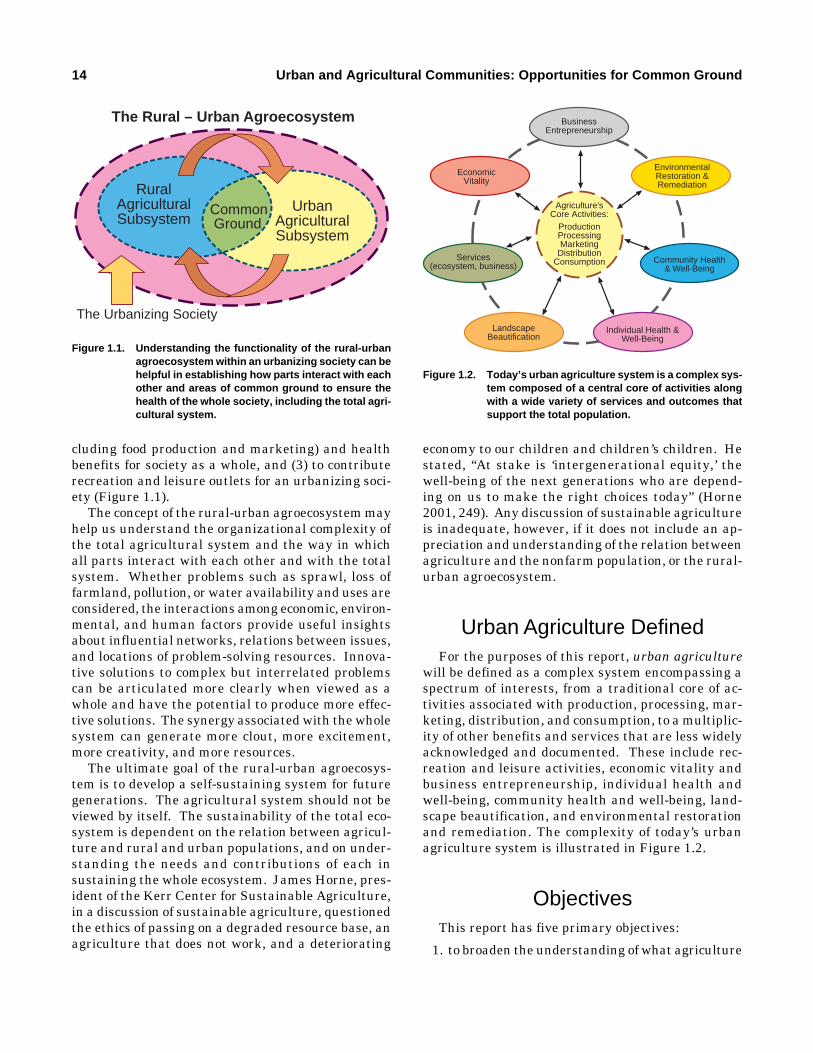
1.2 Today's urban agriculture system is a complex system composed of a central core of activities along witha wide variety of services and outcomes that support the total population, 14
1.3 The rural-urban agroecosystem encompasses a series of shared problems, goods and services, and bene-fits. Although the problems are not always common to all urban and rural agricultural communities, theexamples show ways that goods and services can be mutually beneficial, 18
2.1 Wetland and streamside vegetation serves as a buffer to filter excess nutrients from water running offagricultural land, 28
2.2 A view into the South Burlington Living Machine Wastewater Treatment System in Vermont. Manyeconomically viable plants can be produced in these systems including cut flowers, landscape plants, andeven food for humans and animals, 30
2.3 A Suwanee County, Florida, poultry farmer adds water to compost to keep the bacteria working thatultimately turn chicken waste into usable topsoil, 30
3.1 Mahantango Creek watershed near Klingerstown, Pennsylvania. The combination of land use, soil prop-erties, and hydrogeology largely determines vulnerability to surface and groundwater contamination byagricultural activities, 33
3.2 In a wind tunnel, a technician prepares to measure how live plants and straw residue slow windblownsoil erosion, 35
3.3 Technicians at the base of a 3-story rainfall simulator study rainfall interception by foliage, 36
3.4 A local resident works in a community garden in Chicago, Illinois, 39
4.1 A homeowner and his daughter weed a flower garden in front of their home in Placerville, California, 41
4.2 Poinsettia is the number-one flowering potted plant in the United States, even though its traditionalsales period is just six weeks, 42
4.3 Greenhouse production of bedding plants, 43
4.4 Lawn and garden retail sales and store numbers for various types of retail outlets represented in the top100 U.S. retailers, 43
v
vi
4.5 Street vendor selling cut flowers, 45
4.6 Horses graze next to housing in Montgomery County, Maryland, 46
4.7 Workers harvest catfish from the Delta Pride Catfish farm in Mississippi, 47
5.1 Raised-bed gardens make gardening accessible to all ages and ability levels, 49
5.2 Gardening can be enjoyed by persons of all ages, 50
5.3 Residents enjoy their community garden at the Northpoint Apartments in Mt. Olive, North Carolina, 51
5.4 Assisted by staff from the Chicago Botanic Garden, Chicago public school students work in a teachinggarden, 52
5.5 An abundance of fresh vegetables is offered for sale at a weekly farmers' market, 54
5.6 The Crescent City Farmers' Market meets in New Orleans, Louisiana, every Saturday morning, 58
5.7 A soil conservationist and a graduate student at Fresno State University check on the growth of Asianvegetables that will be sold at local farmers' markets, 59
6.1 Visitors to the Chicago Botanic Garden enjoy a stroll through Sansho-En, the Japanese Garden, 62
6.2 Visitors can tour the grounds at Calloway's Stonegate Nursery, a retail garden center in Fort Worth,Texas, 65
6.3 The Flower Fields in Carlsbad, California, 65
6.4 A Chicago Botanic Garden staff member joins students at the Von Schiller School to plant a new commu-nity garden, 66
8.1 Common problems and potential impacts within the rural-urban agroecosystem, 79
8.2 A faculty member points out qualities of a pond-raised hybrid striped bass for a student studying fisher-ies science at Delaware State University, 84
8.3 A plant pathologist examines cultures of different root pathogens that can reduce yields of strawberriesgrown in poorly or nonfumigated soil, 86
figures
Tables
1.1 Metropolitan status of U.S. counties, 1970 to 1990, by size of population, 20
1.2 Rural-Urban Continuum Codes, 1993, 21
1.3 Components of county population change, 1980 to 1998, by metropolitan proximity in 1993, 22
4.1 Nursery and greenhouse crop production data for the top five states in terms of total sales for theyear 1997. Data from 1992 also included for comparative purposes, 42
4.2 Production area and wholesale sales data for major components of the U.S. nursery and greenhousecrop production in 1997, 42
4.3 Top ten states in terms of lawn and garden retail sales in 1997, 43
A.1 Historical patterns of size of farm population and percentage of U.S. population, 95
A.2 Historical patterns of number of farms, acres in farms, percentage of land in farms, and average sizeof farms, 1850 to 1997, 96
A.3 Population by ethnicity, 1980 to 1999, and county metropolitan proximity in 1993, 97
A.4 County population change, 1980 to 1999, by ethnicity and metropolitan proximity in 1993, 98
A.5 Employment in the agricultural, forestry, and fisheries industry, 1980 to 1997, by county metropoli-tan proximity in 1993, 99
A.6 Employment in agricultural (farming, forestry, and fishing) occupations, 1980 to 1997, by countymetropolitan proximity in 1993, 100
A.7 Total number of farms, 1978 to 1997, by metropolitan proximity in 1993, 101
A.8 Percentage of county acres in farmland, 1978 to 1997, by metropolitan proximity in 1993, 102
A.9 Average farm size in acres, 1978 to 1997, by metropolitan proximity in 1993, 103
A.10 Total gross sales ($000s) for farms, 1978 to 1997, by metropolitan proximity in 1993, 104
A.11 Value of crop sales ($000s) for farms, 1978 to 1997, by metropolitan proximity in 1993, 105
A.12 Value of livestock and poultry sales ($000s) for farms, 1978 to 1997, by metropolitan proximity in1993, 106
A.13 Locations and total production areas of the top five floricultural producers in the United States, 107
A.14 Top ten U.S. lawn and garden retail businesses in 1999, 107
7.1 Primary public farmland protection tools: Benefits and drawbacks, 73
vii
Textbox
Foreword
Following a recommendation by the CAST NationalConcerns Committee, the CAST Board of Directorsauthorized preparation of a report on urban agricul-ture.
Dr. Lorna Michael Butler, Henry A. Wallace En-dowed Chair for Sustainable Agriculture, Iowa StateUniversity, and Dr. Dale M. Maronek, Head of theDepartment of Horticulture and Landscape Architec-ture, Oklahoma State University, served as cochairsand lead authors for the report. A highly qualifiedgroup of scientists served as task force members andreviewers. The group included individuals with ex-pertise in agricultural anthropology; rural sociology;horticulture; landscape architecture; agricultural, re-source, and managerial economics; agricultural exten-sion; geography and urban planning; public policy;and philosophy.
The task force prepared an initial draft of the re-port, which was reviewed by the credited reviewers.The task force revised all subsequent drafts and thetask force and credited reviewers reviewed the proofs.The CAST Executive Committee and Editorial andPublications Committee reviewed the final draft. TheCAST staff provided editorial and structural sugges-tions and published the report. The authors are re-sponsible for the report's scientific content.
On behalf of CAST, we thank the cochairs, authors,and reviewers who gave of their time and expertiseto prepare this report as a contribution by the scien-tific community to public understanding of the issue.
We also thank the employers of the scientists, whomade the time of these individuals available at no costto CAST. CAST thanks all members who made addi-tional contributions to assist in the preparation of thisdocument. The members of CAST deserve specialrecognition because the unrestricted contributionsthey have made in support of CAST also have financedthe preparation and publication of this report.
This report is being distributed widely; recipientsinclude Members of Congress, the White House, theU.S. Department of Agriculture, the CongressionalResearch Service, the Food and Drug Administration,the Environmental Protection Agency, and the Agen-cy for International Development. Additional recipi-ents include media personnel and institutional mem-bers of CAST. Individual members of CAST mayreceive a complimentary copy upon request for a $3.00postage and handling fee. The report may be repro-duced in its entirety without permission. If copied inany manner, credit to the authors and to CAST wouldbe appreciated.
Brad L. InmanPresident
Teresa A. GruberExecutive Vice President
Linda M. ChimentiManaging Scientific Editor
viii
1
Interpretive Summary
Agriculture is an integral part of urban growth andpopulation change. This fact is frequently unrecog-nized by the general public, mainstream agricultur-al interests, and political leaders. In many people’sminds, there is the perception of a rural-urban splitthat results in competition for resources, separatepolicies, and inaccurate stereotypes. A critical needexists to gain a better understanding of our currentagricultural situation and to coalesce the interestsand goals of rural and urban areas. Agriculture is oneway to meet this need.
This report focuses on the role that agriculture canplay in serving as a common denominator betweenrural and urban sectors. The intent is two-fold: tomove our thinking beyond agriculture’s traditionalproduction and rural roots focus, and to identify com-ponents of contemporary agriculture that can be aresource for civic leaders and planners who are chal-lenged by issues of sprawl, vacant city lots, publicdesire for safe local food, and community livability.
The objectives of this report are to
• broaden understanding of agriculture in an urban-izing society;
• identify opportunities for urban and agriculturalconstituencies to work cooperatively toward com-mon goals;
• document agriculture’s contributions and/or ser-vices to both rural and urban sectors;
• stimulate broad debate and discussion about pro-gram and policy directions and priorities pertain-ing to agriculture in an urbanizing society; and
• propose ways in which contemporary agriculture,with other partners, can help meet the challeng-es associated with urbanization.
Agriculture’s Contributions toUrbanization
This report presents an extensive discussion of theways in which agriculture contributes to urban com-munities. The following topics are considered.
• Restoration and Remediation: storm watermanagement, water remediation and waste waterreclamation, waste recycling, carbon sequestra-tion, and remediation of brownfields
• Planning and Revitalization: growth manage-ment, landscape and energy modification, indoor-outdoor air quality, insect and wildlife manage-ment, and revitalization of land areas
• Business and Economic Benefits: environmen-tal horticulture and the green industry; nurseryand greenhouse production; retail garden centers;landscape and interiorscape design, installation,and maintenance; turfgrass production and man-agement; companion animal industry; aquacul-ture; and the equine industry
• Individual Health and Well-Being: human/an-imal relationships, plants and planted landscapes
• Community Health and Well-Being: commu-nity food systems such as entrepreneurial gardensand farms, farmers’ markets, community support-ed agriculture, and farm-to-table programs
• Recreation and Leisure: gardening, golf, hik-ing, equestrian activities, wildlife and bird watch-ing, public parks, arboreta, botanical gardens, andentertainment farms
Policy and InstitutionalDimensions
Population growth and a desire for country livinghave fueled public interest in land management is-sues. According to the USDA National Resources In-ventory, between 1982 and 1992, 29% of U. S. agri-cultural land converted to urban use was primeagricultural land. During 1992 to 1997, the rate ofland conversion reached 2.2 million acres annually,not counting land used for transportation routes. Thiswas 1.2 times the conversion that occurred in the pre-vious decade.
A number of tools are in place to protect farmland.The best programs combine regulatory and incentive-
based strategies, such as the following.
• Regulatory Programs: agricultural protectionzoning and comprehensive planning• Incentive Programs: agriculture tax programs,right-to-farm laws, agricultural districts, purchase ofdevelopment rights, transfer of development rights (orpurchase of agricultural conservation easement pro-grams), and private land trusts
New Visions for Urban Agriculture
This report proposes initiatives that the agricultur-al system, higher education, and governments mustundertake jointly to remain relevant to society. Eachof the initiatives has research, extension, and educa-tional opportunities that are addressed in the report.
1. Comprehensive Planning Initiatives
• Build public understanding of the rural-urbanagroecosystem
• Integrate agriculture into long-term, rural-urbancomprehensive planning
• Promote knowledge of community food systems toachieve desired local/regional goals
• Use urban agriculture as a tool for improving pub-lic education and community livability
• Identify financial incentives and revenue sourc-es for entrepreneurial urban agricultural activities
• Draw on existing resources for science-based in-formation
2. Public Policy Initiatives
• Study agricultural land use; analyze alternativepolicy instruments; document land conversionand decision-making behavior; implement spatialmodels of land use for policy design; and identifyroles for levels of government in policy and devel-opment
• Strengthen understanding of local/regional foodsystems; encourage policies that improve food ac-cess; promote food system sustainability; estab-lish food policy councils; establish local mecha-nisms for food production, distribution, and use;and monitor consumption patterns of disadvan-taged populations
• Develop policies to ensure a new generation offarmers who can interact successfully with the ur-banizing society
3. Higher Education Initiatives
• Establish curricula in urban agriculture and the
rural-urban agroecosystem• Form rural-urban outreach and extension teams
that include urban leaders and planners• Monitor and analyze community food systems; ed-
ucate about nutrition and diet, community gar-dens, food-related employment, farmer-consum-er linkages, sustainable production andmanagement systems, and food security strate-gies
• Facilitate public understanding of changes in thestatus of agriculture land, natural resources, andopen space; provide outreach education on farm-land protection tools and policies while maintain-ing neutrality and promoting diverse stakehold-er participation; document successful farmeradaptations
• Identify common ground and promote bridge-building activities and policies between urbanand rural constituents
• Encourage professional development on urban ag-riculture issues and the rural-urban agroecosystem
• Foster internal planning to share resources, iden-tify funding sources, and build new partnerships
4. Research Initiatives
• Pursue research on urban agricultural topics inplant adaptability and production systems, urbansoils, water management, and pest management
• Encourage research on entrepreneurial products,farmland preservation, and social and economicdimensions of the rural-urban agroecosystem
5. Partnerships and Collaboration Initiatives
• Broaden the mix of partners (higher education,government agencies, nonprofit organizations,private sector)
• Foster partnerships between farmers or rural peo-ple and urban planners and urban-oriented inter-est groups on community food systems, commu-nity greening, sustaining and remediating naturalresources, wildlife and recreation issues, and wa-tershed protection
• Encourage higher education faculty collaborationwith urban agriculture partners to address urbanagriculture problems and issues
• Expand cooperative extension’s role in urban ag-riculture issues, using a team approach to addressrural-urban agroecosystem issues, coalition build-ing, land protection tools, and policies; offer urbanagriculture professional development
• Initiate urban agriculture experiential learning toengage K–12 educators, undergraduates, and
2 Urban and Agricultural Communities: Opportunities for Common Ground
Executive Summary 3
graduate students in public and private collegesand universities
• Develop creative funding strategies to support anexpanded rural-urban agriculture agenda; coop-erate with state and federal agencies to stimulatedialogue and planning on the rural-urban agroec-osystem; engage legislators, planners, businessand industry leaders, and nonprofit organizationsin joint proposals; create profit-sharing entrepre-neurial models
ConclusionsAgriculture must be redefined in the context of
urbanization. The wealth of knowledge associatedwith the agricultural sciences can be put to valuableuse in helping to meet the challenges of urbanization.Together, rural and urban communities have the po-tential to create a situation beneficial to both, basedon their unique resources and experiences. This sit-uation will come about only with proactive leadership,shared resources, creative policy options, and a will-ingness to work together. Land grant universities,industry, traditional agricultural interest groups, andurban partners—such as metropolitan educational in-stitutions, city leaders, and urban planners—willneed to work together to embrace change and promotea new and exciting future for everyone.
Interpretive Summary
Executive Summary
4
IntroductionAgriculture is an integral part of urban growth and
population change. This fact is frequently unrecog-nized by the general public, mainstream agricultur-al interests, and political leaders. In many people’sminds, there is the perception of a rural-urban splitthat results in competition for resources, separatepolicies, and unfortunate stereotypes. A critical needexists to gain a better understanding of our currentagricultural situation and to coalesce the interestsand goals of rural and urban areas. Agriculture is oneway to meet this need.
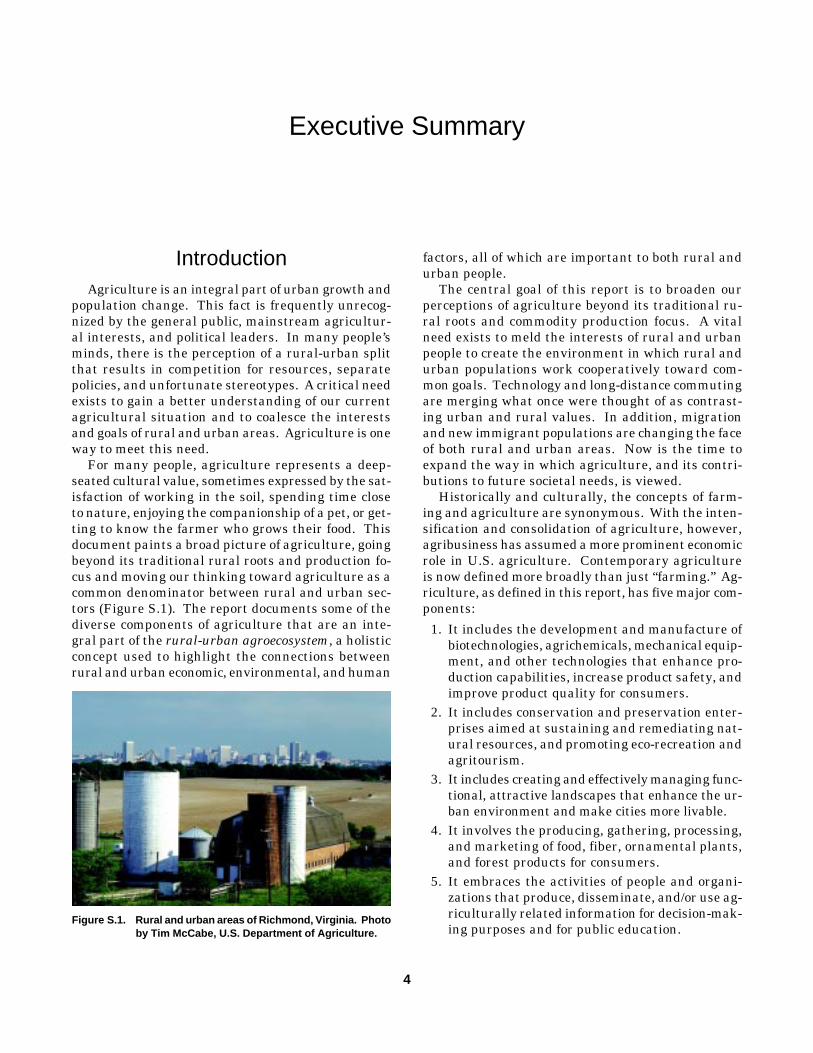
For many people, agriculture represents a deep-seated cultural value, sometimes expressed by the sat-isfaction of working in the soil, spending time closeto nature, enjoying the companionship of a pet, or get-ting to know the farmer who grows their food. Thisdocument paints a broad picture of agriculture, goingbeyond its traditional rural roots and production fo-cus and moving our thinking toward agriculture as acommon denominator between rural and urban sec-tors (Figure S.1). The report documents some of thediverse components of agriculture that are an inte-gral part of the rural-urban agroecosystem, a holisticconcept used to highlight the connections betweenrural and urban economic, environmental, and human
Figure S.1. Rural and urban areas of Richmond, Virginia. Photoby Tim McCabe, U.S. Department of Agriculture.
factors, all of which are important to both rural andurban people.
The central goal of this report is to broaden ourperceptions of agriculture beyond its traditional ru-ral roots and commodity production focus. A vitalneed exists to meld the interests of rural and urbanpeople to create the environment in which rural andurban populations work cooperatively toward com-mon goals. Technology and long-distance commutingare merging what once were thought of as contrast-ing urban and rural values. In addition, migrationand new immigrant populations are changing the faceof both rural and urban areas. Now is the time toexpand the way in which agriculture, and its contri-butions to future societal needs, is viewed.
Historically and culturally, the concepts of farm-ing and agriculture are synonymous. With the inten-sification and consolidation of agriculture, however,agribusiness has assumed a more prominent economicrole in U.S. agriculture. Contemporary agricultureis now defined more broadly than just “farming.” Ag-riculture, as defined in this report, has five major com-ponents:
1. It includes the development and manufacture ofbiotechnologies, agrichemicals, mechanical equip-ment, and other technologies that enhance pro-duction capabilities, increase product safety, andimprove product quality for consumers.
2. It includes conservation and preservation enter-prises aimed at sustaining and remediating nat-ural resources, and promoting eco-recreation andagritourism.
3. It includes creating and effectively managing func-tional, attractive landscapes that enhance the ur-ban environment and make cities more livable.
4. It involves the producing, gathering, processing,and marketing of food, fiber, ornamental plants,and forest products for consumers.
5. It embraces the activities of people and organi-zations that produce, disseminate, and/or use ag-riculturally related information for decision-mak-ing purposes and for public education.
Executive Summary 5
In the last decade, more attention has been paidto the role of the consumer because of the growingawareness of the impacts that consumers have on de-mand and public policies affecting community healthand quality-of-life issues. The urban and suburbancontribution to many of these diverse agriculturalcomponents is neither well documented nor well un-derstood.
Rural and urban lives no longer represent contrast-ing styles and values. Urban and rural people wantaccess to a similar quality of life. Both populationsare intimately connected through wealth, policies, lif-estyles, and goods and services that frequently origi-nate in urban centers. Through the sheer power ofthe urban market place and the political sector, muchof the future of rural areas is tied to that of the urbansystem. Today, agriculture is found in both rural andurban locations, but in differing forms and intensitiesand often in response to differing demands and oppor-tunities. Today’s agricultural system and its manydiverse components (food, fiber, technology, remedi-ation, conservation, landscape and environmentalenhancement, and human recreational and consump-tion activities) are embedded into an interconnectedpolitical, economic, cultural, and ecological systemthat is driven largely by urban leaders and urban or-ganizations.
Nevertheless, agriculture is a common denomina-tor that connects both rural and urban areas. It con-tributes to food availability, recreation and tourism,land restoration, waste recycling, community entre-preneurship, and scenic amenities. Similarly, it com-petes with urban areas for the same resources, suchas water, land, and energy. Agriculture has alwaysinvolved relationships between people and their en-vironment. When agriculture is carried out in closeproximity to community residents, it can produce bothpositive and negative impacts on the neighborhood,the economy, natural areas, and wildlife.
The Rural-Urban AgroecosystemRural and urban areas are interdependent ele-
ments of U.S. society, which is becoming increasing-ly urban. This fact suggests that both rural and met-ropolitan environments can best be viewed as onecomprehensive agroecosystem in which the compo-nent parts are mutually dependent and synergistical-ly tied to one another. For the purposes of this report,the rural-urban agroecosystem is defined as a biolog-ical and natural resources system that is managedjointly by rural and urban people to
• provide services to the environment and commu-nity,
• generate direct and indirect business (includingfood production, food technology, and marketing)as well as health benefits to the total society, and
• contribute recreational and leisure outlets for anurbanizing society.
The concept of a rural-urban agroecosystem moreaccurately describes the total agricultural systembecause all parts of the system interact with each oth-er and with the total system. Whether the problemsconsidered are those such as urban sprawl, loss offarmland, pollution, water availability, or waste dis-posal, the connections between the economic, environ-mental, biological, and social factors are clear. Thisapproach provides useful insights about who is im-pacted by decisions, where to go for resources to fixproblems, and who to involve in identifying solutions.The synergy associated with the whole system, and abroader group of players, can generate more politicalclout, more problem-solving creativity, and more fund-ing to address solutions.
Urban Agriculture DefinedUrban agriculture is a phrase that seems contrived,
almost an oxymoron. Views of agriculture are not thesame for everyone. Agriculture is a word often asso-ciated with the production of food and fiber commod-ities such as corn, cotton, wheat, soybeans, beef, dairy,poultry, pork, and eggs. Such production takes placemostly in the countryside, outside urban areas (Fig-ure S.2). Yet if one considers activities that are con-ducted and regulated by federal and state depart-ments of agriculture, or research and educationalactivities in agricultural colleges and research insti-tutes, agriculture can be defined in a much broaderway. This broader definition includes grasses, flow-ers, and all types of small-scale greenhouse produc-tion; horses; aquaculture; pest control measures, in-cluding those for rodents and insects; forestry andwildlife management; the food that we eat such asfruits and vegetables; human relationships builtaround farmers’ markets and community gardens;and the quality of life in our communities. All of thesecomponents can be important to both rural and ur-ban populations. In addition, many city dwellers haveundertaken food production and community beauti-fication programs of their own, or in groups (FigureS.3). Even traditional rural commodity productionhas found a place in urban and suburban areas well
6 Urban and Agricultural Communities: Opportunities for Common Ground
beyond people’s dependency on it for food and fiber.And even this description of the activities associatedwith agriculture neglects the many roles that agricul-ture plays in people’s personal and civic lives: for ex-ample, home gardening, therapeutic riding, compan-ion animal rearing, horticultural therapy, and thelocally grown food that is becoming increasingly pop-ular in restaurants.
Today’s contemporary urban agriculture is a com-plex system encompassing a full spectrum of inter-ests—from a core of traditional production, process-ing, marketing, distribution, and consumptionactivities to more extensive system components in-cluding recreation and leisure, business entrepre-neurship, neighborhood beautification, environmen-tal restoration and remediation, individual andcommunity health and well-being, agroecosystem ser-vices, and economic vitality.
Report Objectives
The objectives of this report are to
• broaden understanding of agriculture in an ur-banizing society;
• identify opportunities for urban and agricultur-al constituencies to work cooperatively towardcommon goals;
• document the contributions and/or services thatagriculture provides to both rural and urban sec-tors;
• stimulate broad debate and discussion about pro-gram and policy directions and priorities pertain-ing to agriculture in an urbanizing society; and
• propose ways in which contemporary agriculture,with other partners, can help society meet thechallenges associated with urbanization.
This report is intended for policymakers and plan-ners, administrators and faculty of colleges and uni-versities, and members of diverse agricultural inter-est groups found in urban and urban-edgecommunities, cities, and rural areas. Although thecontents are applicable to the interests of traditionalagricultural clientele, such as agriculture commodi-ty groups, this report also has direct relevance to theneeds of local government decision makers and plan-ners, as well as to urban-oriented organizations con-cerned with growth and development. In addition, thecontents will be informative for individuals andgroups involved in consumer advocacy and local foodsystems work, food security and food safety, womenin agriculture, environmental and farmland protec-tion, and sustainable agriculture.
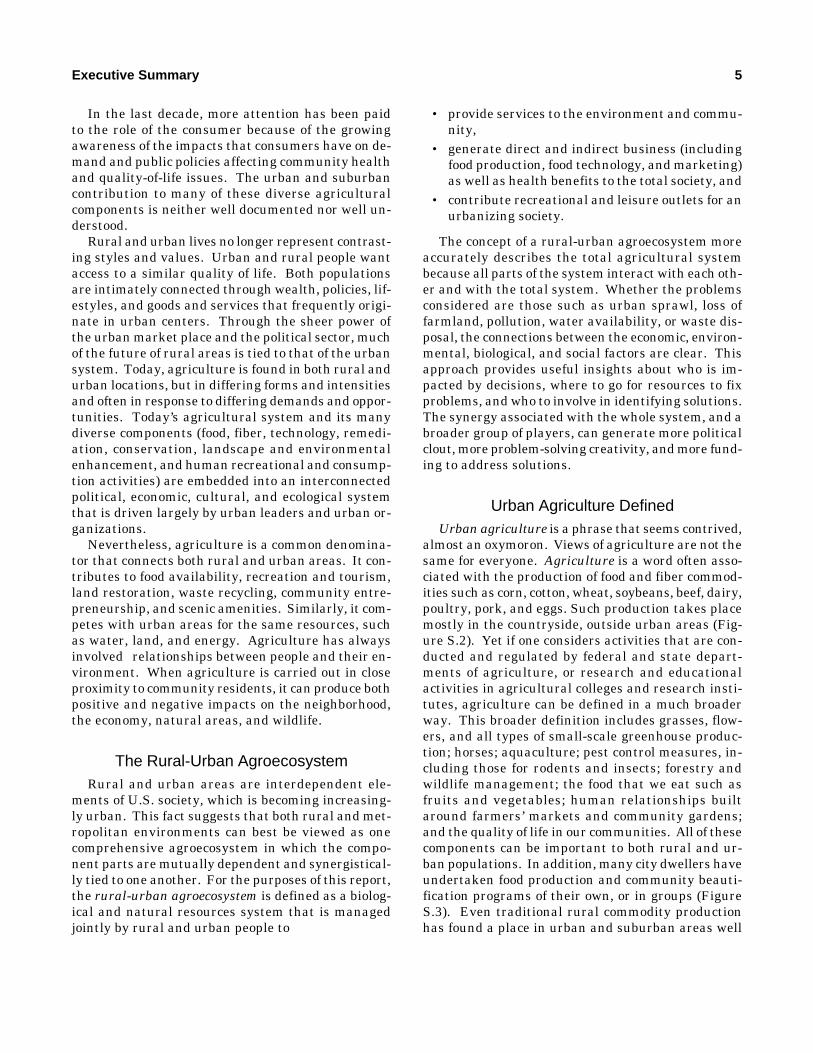
Figure S.2. Corn production in Colorado. Photo by Scott Bauer,Agricultural Research Service, U.S. Department ofAgriculture, Beltsville, Maryland.
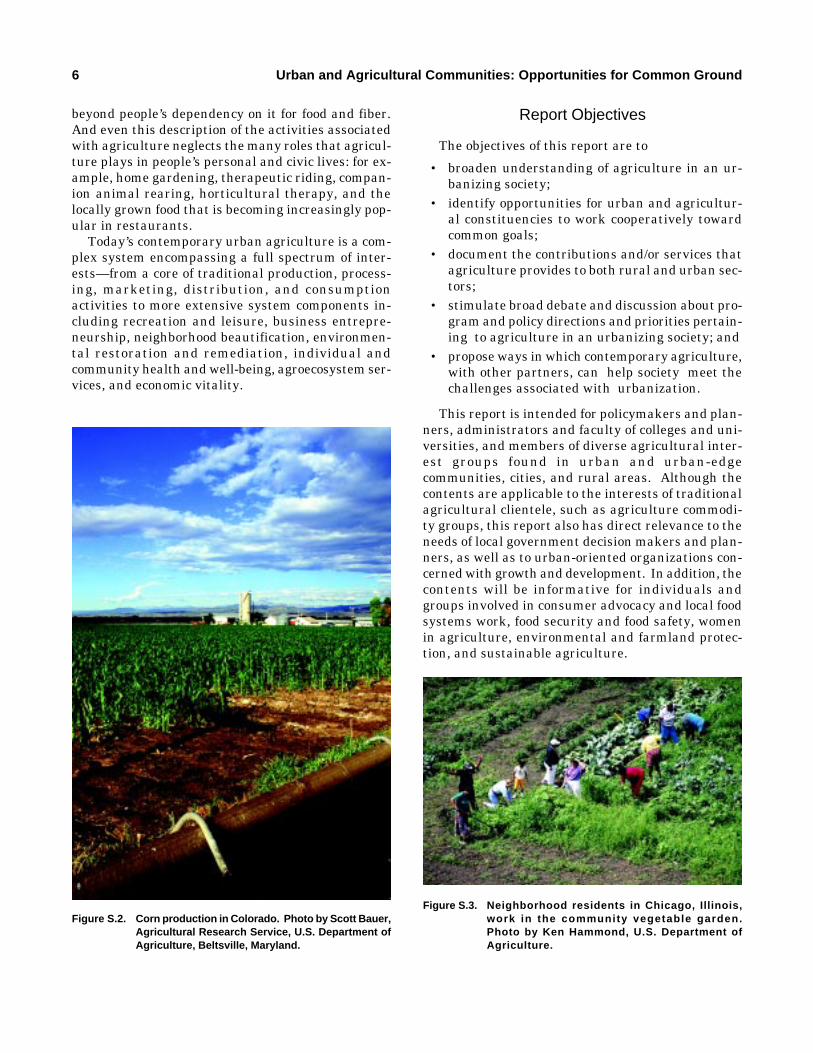
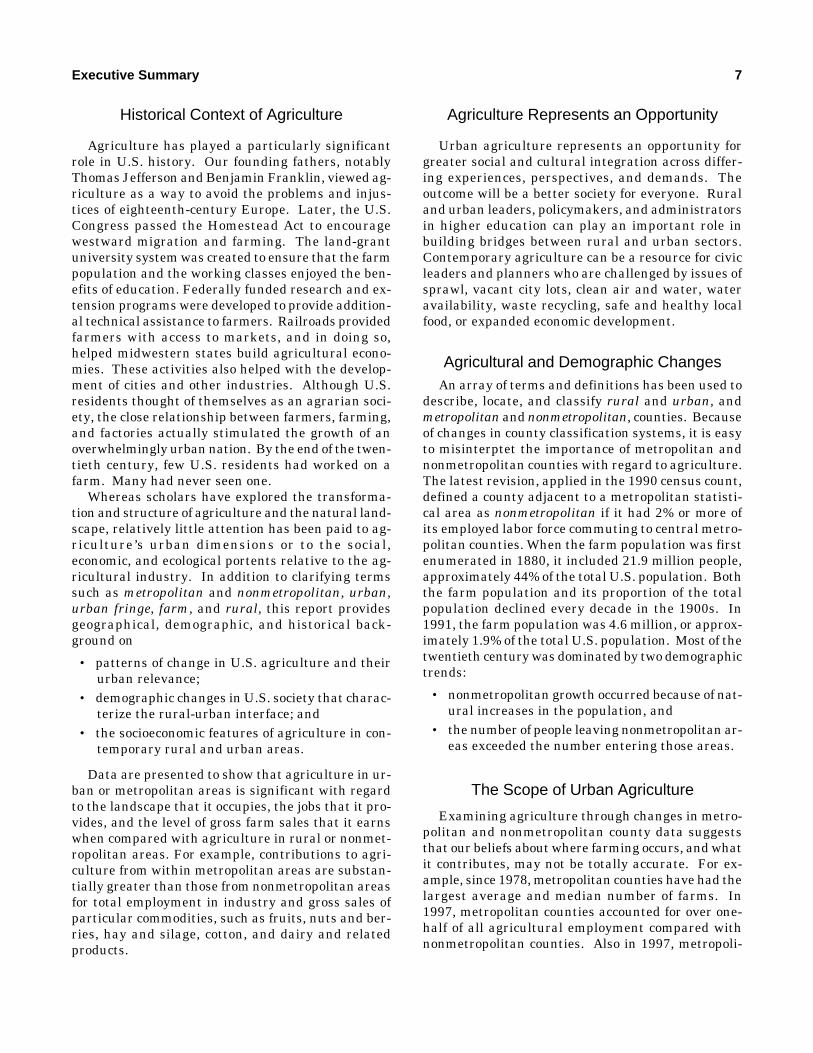
Figure S.3. Neighborhood residents in Chicago, Illinois,work in the community vegetable garden.Photo by Ken Hammond, U.S. Department ofAgriculture.
Executive Summary 7
Historical Context of Agriculture
Agriculture has played a particularly significantrole in U.S. history. Our founding fathers, notablyThomas Jefferson and Benjamin Franklin, viewed ag-riculture as a way to avoid the problems and injus-tices of eighteenth-century Europe. Later, the U.S.Congress passed the Homestead Act to encouragewestward migration and farming. The land-grantuniversity system was created to ensure that the farmpopulation and the working classes enjoyed the ben-efits of education. Federally funded research and ex-tension programs were developed to provide addition-al technical assistance to farmers. Railroads providedfarmers with access to markets, and in doing so,helped midwestern states build agricultural econo-mies. These activities also helped with the develop-ment of cities and other industries. Although U.S.residents thought of themselves as an agrarian soci-ety, the close relationship between farmers, farming,and factories actually stimulated the growth of anoverwhelmingly urban nation. By the end of the twen-tieth century, few U.S. residents had worked on afarm. Many had never seen one.
Whereas scholars have explored the transforma-tion and structure of agriculture and the natural land-scape, relatively little attention has been paid to ag-riculture’s urban dimensions or to the social,economic, and ecological portents relative to the ag-ricultural industry. In addition to clarifying termssuch as metropolitan and nonmetropolitan, urban,urban fringe, farm, and rural, this report providesgeographical, demographic, and historical back-ground on
• patterns of change in U.S. agriculture and theirurban relevance;
• demographic changes in U.S. society that charac-terize the rural-urban interface; and
• the socioeconomic features of agriculture in con-temporary rural and urban areas.
Data are presented to show that agriculture in ur-ban or metropolitan areas is significant with regardto the landscape that it occupies, the jobs that it pro-vides, and the level of gross farm sales that it earnswhen compared with agriculture in rural or nonmet-ropolitan areas. For example, contributions to agri-culture from within metropolitan areas are substan-tially greater than those from nonmetropolitan areasfor total employment in industry and gross sales ofparticular commodities, such as fruits, nuts and ber-ries, hay and silage, cotton, and dairy and relatedproducts.
Agriculture Represents an Opportunity
Urban agriculture represents an opportunity forgreater social and cultural integration across differ-ing experiences, perspectives, and demands. Theoutcome will be a better society for everyone. Ruraland urban leaders, policymakers, and administratorsin higher education can play an important role inbuilding bridges between rural and urban sectors.Contemporary agriculture can be a resource for civicleaders and planners who are challenged by issues ofsprawl, vacant city lots, clean air and water, wateravailability, waste recycling, safe and healthy localfood, or expanded economic development.
Agricultural and Demographic ChangesAn array of terms and definitions has been used to
describe, locate, and classify rural and urban, andmetropolitan and nonmetropolitan, counties. Becauseof changes in county classification systems, it is easyto misinterptet the importance of metropolitan andnonmetropolitan counties with regard to agriculture.The latest revision, applied in the 1990 census count,defined a county adjacent to a metropolitan statisti-cal area as nonmetropolitan if it had 2% or more ofits employed labor force commuting to central metro-politan counties. When the farm population was firstenumerated in 1880, it included 21.9 million people,approximately 44% of the total U.S. population. Boththe farm population and its proportion of the totalpopulation declined every decade in the 1900s. In1991, the farm population was 4.6 million, or approx-imately 1.9% of the total U.S. population. Most of thetwentieth century was dominated by two demographictrends:
• nonmetropolitan growth occurred because of nat-ural increases in the population, and
• the number of people leaving nonmetropolitan ar-eas exceeded the number entering those areas.
The Scope of Urban Agriculture
Examining agriculture through changes in metro-politan and nonmetropolitan county data suggeststhat our beliefs about where farming occurs, and whatit contributes, may not be totally accurate. For ex-ample, since 1978, metropolitan counties have had thelargest average and median number of farms. In1997, metropolitan counties accounted for over one-half of all agricultural employment compared withnonmetropolitan counties. Also in 1997, metropoli-
8 Urban and Agricultural Communities: Opportunities for Common Ground
tan and nonadjacent, nonmetropolitan counties aver-aged $108 million and $112 million in gross farmsales, respectively, compared with $89 million by ad-jacent, nonmetropolitan counties.
Except in the central Great Plains, much of U.S.agriculture occurs in counties defined as “urban in-fluenced” (within statistical metropolitan counties oradjacent counties). These areas contain much of thenation’s most productive agriculture and grow mostof the food: 79% of U.S. fruit, 68% of vegetables, and52% of dairy products are produced in urban-influ-enced counties. Between 1978 and 1997, metropoli-tan counties’ share of the total value of crop sales rosefrom 38.9% to 42.2%. This gain in metropolitan cropsales is attributed partially to assigning metropolitanstatus in 1993 to counties that may not have beenmetropolitan in 1978 or in the years that followed.Nevertheless, metropolitan counties led other coun-ties in total crop sales for fruits/nuts/berries, nursery/greenhouse, and vegetables/sweet corn/melons in eachof the past five censuses. The metropolitan countiesled in sales for hay/silage/field seeds in all censusyears except 1978 and for cotton/cottonseed in all cen-sus years except 1997.
Agriculture’s Service RoleUnderstanding agroecosystem functions and main-
taining biodiversity within the system are importantfor getting the most benefit from the system. Manyagricultural activities can alter a highly interdepen-dent agroecosystem. Consequently, agriculture canhelp to replenish and sustain agroecosystems and thesubsequent agroecosystem services that benefit urbanpopulations. When well planned and properly inte-grated into the urban environment, open space ornatural areas (as opposed to built-up areas) providevaluable agroecosystem services to the community.
Selected examples of agroecosystem services forwhich agricultural sciences can contribute knowledgeand expertise include storm water management,wastewater remediation, waste recycling, phytoreme-diation, carbon sequestration, soil retention and fer-tility, appropriate pesticide and fertilizer use (FigureS.4), and remediation of brownfields. These servicesare a valuable part of the rural-urban agriculturalsystem. Some of these services require further re-search to perfect their application to issues of urban-ization.
Agriculture’s Benefits to theUrbanizing Society
Agriculture makes major economic and social con-tributions to both urban and rural areas. Some con-tributions are direct, as in the case of production andmarketing of products and services. Other contribu-tions, such as farmers’ markets, community support-ed agriculture, landscape design, construction, andnursery services are indirect, and therefore more dif-ficult to document. Less tangible benefits come fromimproved individual mental and physical health andcommunity vitality. Landscape design and subse-quent plant installations are both a service and a ben-efit. Community food systems and community gar-dens benefit the local economy as well as individualand community health. This report highlights urbanagriculture’s business and economic contributions andits benefits to individual and community health andwell-being.
Recreation and LeisureLarge segments of the recreation and leisure indus-
try are related directly to products and services of tra-ditional and urban agriculture activities. Agriculturalservices today support a variety of educational, rec-reational, and leisure pursuits including gardening,golfing, hiking, equestrian activities, wildlife viewing,
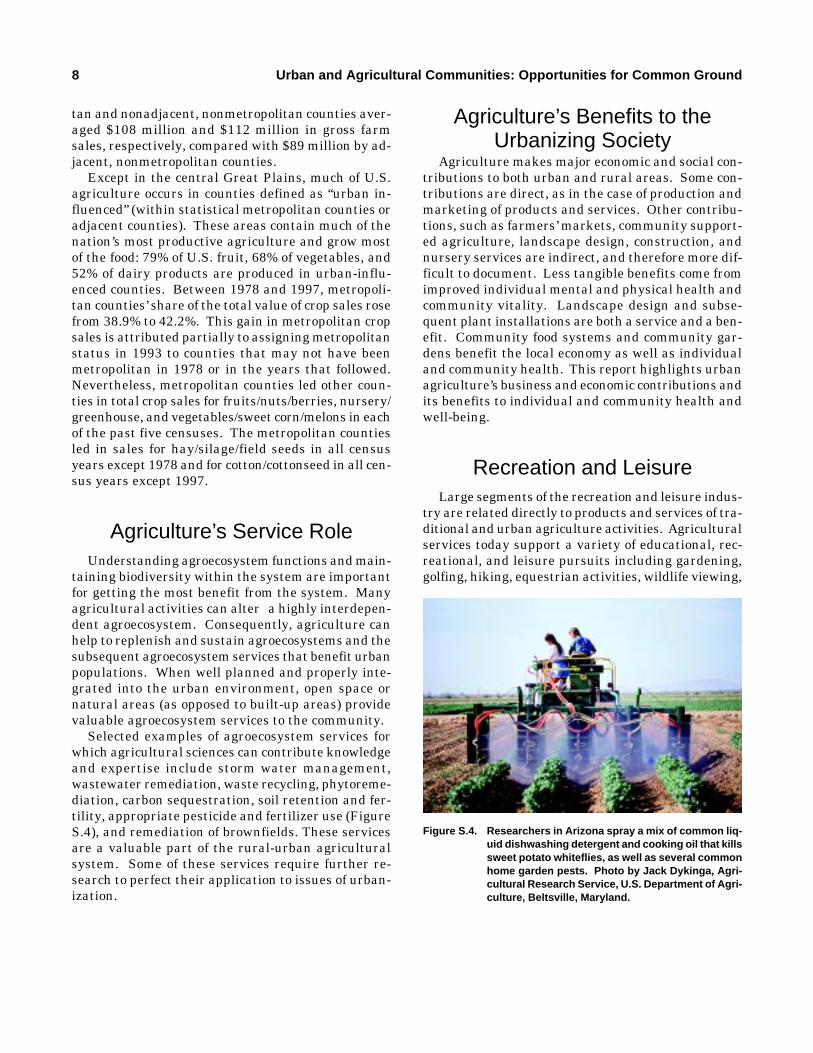
Figure S.4. Researchers in Arizona spray a mix of common liq-uid dishwashing detergent and cooking oil that killssweet potato whiteflies, as well as several commonhome garden pests. Photo by Jack Dykinga, Agri-cultural Research Service, U.S. Department of Agri-culture, Beltsville, Maryland.
Executive Summary 9
bird watching, and visits to tourist attractions andscenic areas such as zoos, public parks, and botani-cal gardens (Figure S.5). Many of these activities con-tribute significantly to local economies. In addition,an increasing number of traditional farm businessesare diversifying their operations to attract visitors foreducational, recreational, and leisure activities. Thereport illustrates agriculture’s contributions to recre-ation, leisure, and tourism industries. It identifiesnew chances for economic diversification of traditionalfarm production businesses; highlights the interde-pendency between urban and nonurban populationswith regard to tourism, recreation, and leisure activ-ities; and reinforces the value of partnerships betweennonurban and urban areas to foster mutually benefi-cial educational, recreational, and tourism opportu-nities.
Policy and InstitutionalDimensions of Urban Agriculture
Population growth and a desire for urban-fringe orrural living have fueled public interest in land man-agement policy. Community meetings, media fea-tures, and funded research are bringing attention toissues such as sprawl, smart growth, open space con-servation, and farmland protection. The future ofagriculture, especially on the urban fringe, is oftensituated squarely in the middle of heated debates onthese aforementioned issues Most people who live inrapidly growing urban areas, or in attractive rural
communities, observe and experience the impacts ofpopulation growth on a daily basis.
According to American Farmland Trust, between1982 and 1992 every state in the United States lostvaluable farmland to development; during that peri-od, 29% of the agricultural land converted to urbanuse was prime agricultural land. The revised 1997National Resources Inventory (NRI), using a moreexpansive definition of land used for urban and built-up purposes, indicated that land conversion acceler-ated dramatically in the early 1990s. Between 1982and 1997 the annual conversion rate was 1.2 millionacres (a.) per year. During the period from 1992 to1997, however, the conversion rate had increased to2.2 million a. per year. The addition of roads and othertransportation methods further expands the numberof acres. The NRI-developed area increased from 73.2million a. in 1982 to 87 million a. in 1992 and to 98.2million a. in 1997.
Public authority to intervene in land markets anddecisions on the private use and ownership of landlargely resides with state and local government units.Farmland falls in the center of the often-contestedprivate and common interests in land. Public inter-est in farmland is not well embraced by most privatelandowners, including farmers and ranchers. Thecurrent economic environment does little to foster thecontinuation of small farms, to promote sustainablefarming practices, or to discourage the sale of farm-land for uses that are detrimental to the environmentor to surrounding communities. This is an ongoingand frequently debated issue. Congress passed theFarmland Protection Policy Act in 1981. Unfortunate-ly, the U.S. Department of Agriculture did not imple-ment the act for many years, and the legislation didnot provide financial assistance to state or local gov-ernments for farmland protection programs. The actdid require federal agencies to identify any adverseeffects their programs might have on farmland pro-tection and minimize the extent to which such pro-grams induce unnecessary farmland conversions.
Regulatory ProgramsA number of tools and techniques, each of which
has strengths and limitations, are in place to protectfarmland. Generally, the best programs combine reg-ulatory and incentive-based strategies. This reportdiscusses both types. Regulatory programs includeagricultural protection zoning and comprehensive
Figure S.5. Visitors to the Chicago Botanic Garden enjoy a sum-mer day in the English Oak Meadow. Photo byJoanne Dahlberg, courtesy of the Chicago BotanicGarden, Glencoe, Illinois.
10 Urban and Agricultural Communities: Opportunities for Common Ground
planning. Incentive programs include agriculture taxprograms, right-to-farm laws, agricultural districts,purchase of development rights, transfer of develop-ment rights (sometimes referred to as purchase ofagricultural conservation easement programs), andprivate land trusts.
A number of political realities confront U.S. publicpolicy for agricultural land protection. Using onlypolice power (zoning) has had limited success in pro-tecting and regulating farmland use. Agriculturallandowners, particularly active farmers, typicallyvoice support for farmland protection; however, theymost often endorse programs that are voluntary andthat provide financial incentives for owners whochoose to participate. Consequently, most state andlocal farmland protection programs have stressedvoluntary and incentive-based programs in their de-sign. This report suggests a number of initiativesconcerning agricultural and land-use policy to accom-modate more sustainable urban growth patterns;needed areas of farmland protection research; and theroles of various levels of government, higher educa-tion, and stakeholders in agricultural land protection.
New Visions for Urban Agriculture
This report by the Council for Agricultural Scienceand Technology (CAST) presents agriculture in a newlight. It identifies agriculture’s current role in anurbanizing society, frames agriculture’s contributionsto the needs of a growing urban population, and pro-vides insights as to how agricultural thinking mustadapt to meet future societal needs. Opportunitiesare identified for urban leaders and decision makerswho can benefit by partnering with those from non-urban areas to resolve complex environmental,health, safety, nutritional, social, and economic prob-lems. Recommendations are offered concerning need-ed changes in the agriculture system, higher educa-tion and research, and various levels of government.
The extensive documentation of today’s urban ag-riculture presented in this report suggests five impor-tant initiatives within which agriculture can play asignificant role: comprehensive planning, public pol-icy, higher education, research, and partnerships andcollaboration.
1. Comprehensive Planning Initiatives. Thereis need for greater public support and under-standing of the rural-urban agroecosystem; for in-tegration of agriculture into long-term, compre-hensive rural and urban planning; for expanded
knowledge of community food systems and com-munities’ cooperation in goal setting; for usingurban agriculture as a tool to improve publicknowledge of the issues and to make communi-ties more livable; for financial incentives and rev-enue-generating opportunities in rural and urbanentrepreneurial agriculture; and for awarenessand use of existing research resources.
2. Public Policy Initiatives. Relatively little U.S.policy addresses agricultural relationships inboth metropolitan and rural areas. Importantpolicy-related issues fall into the categories ofland use, food systems, and development of hu-man capital. Land use includes analysis of alter-native policy instruments, documentation of de-cision-making behavior, spatial land-use modelsfor policy design, and role clarification for levelsof government. Food systems policies need to ad-dress food access, public education, and research;establishment of food policy councils; food systemsustainability; diversified systems of production,distribution, and use of links between customers(eaters) and farmers (producers); and improvedmonitoring of consumption patterns of disadvan-taged populations. Human capital developmentneeds policies to ensure a new generation of ag-riculturists who can interact successfully with theurbanizing society and to assist young agricultur-ists with access to capital.
3. Higher Education Initiatives. Higher educa-tion has a timely opportunity to respond to urbanagriculture in several ways: through the devel-opment of curricula in urban agriculture and therural-urban agroecosystem; establishment of ru-ral-urban outreach and extension teams; andmonitoring, analyzing, and supporting communi-ty food systems. More emphasis probably shouldbe directed to protection of farmland and openspace, and in doing so, maintaining stakeholderneutrality and balance. Bridge building betweenurban and rural constituents should be a highpriority; this will require professional develop-ment for faculty and staff on urban agricultureissues and the rural-urban agroecosystem. Workin this complex area will necessitate careful plan-ning to share resources, identify funding, andbuild new partnerships
4. Research Initiatives. More science-based in-formation is needed to assist with the design andmanagement of contemporary urban agriculture.Some topics of importance include plant adapt-ability and production systems, urban soils, wa-
Executive Summary 11
ter management, and pest management. Re-search is needed on entrepreneurial products, farm-land preservation, and the social and economic di-mensions of the rural-urban agroecosystem.
5. Partnerships and Collaboration Initiatives.If agriculture is to survive in an urbanizing soci-ety, albeit in a different form, partnerships be-tween traditional agricultural groups and urbaninterest groups will be imperative. Partnershipsand coalitions can play a crucial role in solvingproblems and creating new opportunities, espe-cially given the complexity and multidimension-al issues of urban agriculture. Two of the great-est needs are to broaden the mix of partners andto bring rural people and urban-oriented groupstogether around issues such as community foodsystems, community greening, wildlife habitat,and watershed protection. Universities will beimportant participants in these collaborationsand should encourage active involvement of fac-ulty in urban agriculture. Cooperative extensionpersonnel need to address urban agriculture is-sues in partnership with urban leaders and plan-ners, to facilitate linkages between rural and ur-ban interests, and to build coalitions. Highereducation and government will need to developcreative funding strategies to support the newurban agriculture agenda. This development willopen new possibilities to cooperate with industry,state and federal agencies, legislators, businessleaders, and nonprofit organizations to stimulateentrepreneurial profit-sharing models as well asto test new models for distance learning and pro-fessional development.
ConclusionsFive domains for collaborative urban-rural problem
solving with a broadened perspective and apprecia-
tion of the contribution of agriculture are identifiedin this report: (1) comprehensive planning, (2) publicpolicy, (3) higher education, (4) research, and (5) part-nerships and collaboration. For each category, thereport suggests actions that could enhance problem-solving and planning activities.
Comprehensive planning for sustainability of ru-ral-urban agroecosystems should include both eco-nomic and resource (human and natural) availabili-ty and replenishment. Without integrating theoften-competitive needs of both urban and rural ar-eas, however, outcomes frequently lack the elementsthat may contribute to regional competitive advan-tage and problem-solving capacity.
Only in cooperation with other partners can agri-culture help to resolve the challenges facing a rapid-ly urbanizing society. Although their sources maydiffer, many of the problems facing rural and urbansubsectors of our society have similar impacts. Suc-cessful response and cost-effective use of resourceswill require joint planning, problem solving, and costsharing. It is incumbent on all partners to recognizethat each partner brings valuable contributions and,simultaneously, derives mutual benefits.
Agriculture must be redefined in the context ofurbanization. The wealth of knowledge associatedwith the agricultural sciences can be put to valuableuse in helping to meet the challenges of urbanization.Together, rural and urban communities have the po-tential to create a situation beneficial to both, basedon their unique resources and experiences. This sit-uation will come about only with proactive leadership,shared resources, creative policy options, and a will-ingness to work together. Land-grant universities,industry, traditional agricultural interest groups, andurban partners—such as metropolitan educational in-stitutions, city leaders, and urban planners—willneed to work together to embrace change and providea new and exciting future for everyone.
12 Urban and Agricultural Communities: Opportunities for Common Ground
This report is designed to provide guidance to pol-icymakers, planners, educational leaders, and diverseagricultural interest groups as they seek to addressthe needs and interests of rural and urban communi-ties. It proposes ways in which agriculture can makesignificant contributions to tough issues such as ur-ban growth, environmental protection, and humanand community health. It offers suggestions on howto build positive interfaces between rural and urbanpeople to create a better society for everyone.
The central goal of this report is to broaden the per-ception of agriculture beyond its traditional ruralroots and commodity production focus. Enormouschanges are occurring in and around metropolitanareas (MAs), smaller cities, and in rural communities.A crucial need exists to meld the interests of rural andurban people to create a situation in which rural andurban areas work cooperatively towards common in-terests and goals. Technology and long-distance com-muting are merging what once were thought of ascontrasting urban and rural values. In addition, mi-gration and new immigrant populations are chang-ing the face of both rural and urban areas. This is anappropriate time to expand the ways in which agri-culture and its contributions to future societal needsare viewed.
Urban agriculture is a phrase that seems contrived,almost an oxymoron. Views of agriculture are not thesame for everyone. Agriculture is a word often asso-ciated with the production of food and fiber commod-ities such as corn, cotton, wheat, soybeans, beef, dairy,poultry, pork, and eggs. Such production takes placemostly in the countryside, outside urban areas. Yetif one considers activities that are conducted and reg-ulated by federal and state departments of agricul-ture, or research and educational activities in agri-cultural colleges and research institutes, agriculturecan be defined in a much broader way. This broaderdefinition includes grasses, flowers, and all types ofsmall-scale greenhouse production; horses; aquacul-ture; pest control measures, including those for ro-dents and insects; forestry and wildlife management;the food that we eat such as fruits, vegetables, and
1 Introduction
12
fish; and the communities in which we live. All ofthese components can be important to both rural andurban areas. In addition, many city dwellers haveundertaken food production and community beauti-fication programs of their own, or in groups. Eventraditional rural commodity production has found aplace in urban and suburban areas. And even thisdescription of the activities associated with agricul-ture neglects the many roles that agriculture playsin people’s personal and civic lives: for example, com-munity gardening, therapeutic riding, companionanimal rearing, horticultural therapy, and the cultureof farmers’ markets.
Any attempt to expand the concept of agriculturewill be somewhat controversial; it is, therefore, impor-tant to explore the possible sources of disagreementand misunderstanding. In part, this is a symbolicissue. The sharp distinction between urban and ru-ral areas is a recurring theme throughout U.S. histo-ry. Town and country are often thought to representcontrasting values and lifestyles. In part, it is a mat-ter of the way that definitions of rural, urban, andagriculture are woven into legal and governancestructures. Power and money are at stake. Power isat stake because farmers, farm groups, and politiciansrepresenting agricultural districts and special inter-ests have established relationships with legislativeagricultural committees, state and federal depart-ments of agriculture, and state and federal agenciesregulating farm production. Urban constituents havedone the same. Money is at stake because these termsare written into laws and court decisions that haveconsequences for property rights, entitlements, andregulations. For example, agricultural land receivestax abatements in all states. The redefinition of anykey terms could destabilize power relationships orfinancial preferences. People who think that theymight lose or gain from such changes are very atten-tive to the definitions of farm and nonfarm.
There are other money matters that may not be asevident to casual observers. In most states, for ex-ample, research and teaching about basic food com-modity production and turf management for parks
Introduction 13
and golf courses are conducted at state agriculturaluniversities. Similarly, state agencies overseeingpesticide use divide their time between farmers andstructural pest control companies. When funding forthese activities is fixed, doing more to serve urbanpeople who enjoy parks or have their homes sprayedfor insect pests may mean that these organizationsdo less for farmers. When representatives of univer-sities or state agencies start talking about urban ag-riculture, farmers can become nervous. Rarely is at-tention paid to the partnerships that may benefit bothgroups.
Historically and culturally, the concepts of farm-ing and agriculture are synonymous. The intensifi-cation of capital and energy use has meant, however,that agribusiness steadily has become a more impor-tant part of U.S. agriculture (Schusky 1989). Thus,today’s agriculture is defined more broadly than farm-ing. It has at least five major components:
1. It includes the development and manufacture ofbiotechnologies, agrichemicals, mechanical equip-ment, and other technologies that enhance pro-duction capabilities, increase product safety, andimprove product quality.
2. It includes conservation and preservation enter-prises aimed at sustaining and remediating nat-ural resources and promoting eco-recreation andagritourism.
3. It includes creating and effectively managingfunctional, attractive landscapes that enhance theurban environment and make cities more livable.
4. It involves the producing, gathering, processing,and marketing of food, fiber, ornamental plants,and forest products for human and nonhumanconsumers.
5. It embraces activities of people and organizationsthat produce, disseminate, and/or use agricultur-ally related information for decision-making pur-poses and for public education.
In the last decade, more attention has been paidto the role of the customer or user of products and ser-vices because the customer influences demand andpublic policy, thus affecting community health andquality-of-life issues. The urban share or contribu-tion to many of these diverse agricultural componentshas not been documented well.
Rural and urban lives no longer represent contrast-ing styles and values. Urban and rural people wantaccess to a similar quality of life and to comparableamenities. Both sectors are connected through
wealth, policies, lifestyles, and goods and services thatfrequently originate in urban centers. Through thesheer power of the urban marketplace and the politi-cal sector, much of the future of rural areas is tied tothe urban system. The mutual needs of both rural andurban people frequently overlap (e.g., at farmers’markets, shopping centers, restaurants, health careand various service facilities, schools and universities,and recreation and tourism outlets).
Today, agriculture is found in both rural and ur-ban areas, although in differing forms and intensities,and often in response to differing demands and oppor-tunities. Unlike the agriculture of the past, today’sagricultural system and its many diverse components(food, fiber, technology, remediation, conservation,and human recreational and consumption activities)are embedded in an interconnected political, econom-ic, cultural, and ecological system driven largely byurban leaders and urban organizations. Agricultureis a common denominator connecting both rural andurban areas. It contributes to food availability, rec-reation and tourism, waste recycling, and scenicamenities. Similarly, it competes with urban areasfor resources such as water, land, and energy. Agri-culture always has altered our relationships with theenvironment. When it is carried out in close proxim-ity to other people, it can produce both positive andnegative effects on the community and natural re-sources.
The Rural-Urban AgroecosystemRural and urban areas are interdependent compo-
nents of the U.S. society, which is becoming increas-ingly urban. Considering the changes occurring inboth agriculture and MAs, scientists contend thatboth rural and metropolitan environments are onecomprehensive agroecosystem in which the compo-nent parts are mutually dependent and synergistical-ly tied to each other. The earth’s ecosystems consistof biological and natural processes providing a widerange of benefits to human society. These benefitsinclude food, fiber, and other products; recreationalopportunities; and services such as clean water,healthy soil, and erosion control (Clark, Jorling, andMerrell 1999; Wood, Sebastian, and Scherr 2000).
For the purposes of this report, the rural-urbanagroecosystem is a biological and natural resourcessystem managed jointly by rural and urban people (1)to provide services to the environment and commu-nity, (2) to generate direct and indirect business (in-
14 Urban and Agricultural Communities: Opportunities for Common Ground
cluding food production and marketing) and healthbenefits for society as a whole, and (3) to contributerecreation and leisure outlets for an urbanizing soci-ety (Figure 1.1).
The concept of the rural-urban agroecosystem mayhelp us understand the organizational complexity ofthe total agricultural system and the way in whichall parts interact with each other and with the totalsystem. Whether problems such as sprawl, loss offarmland, pollution, or water availability and uses areconsidered, the interactions among economic, environ-mental, and human factors provide useful insightsabout influential networks, relations between issues,and locations of problem-solving resources. Innova-tive solutions to complex but interrelated problemscan be articulated more clearly when viewed as awhole and have the potential to produce more effec-tive solutions. The synergy associated with the wholesystem can generate more clout, more excitement,more creativity, and more resources.
The ultimate goal of the rural-urban agroecosys-tem is to develop a self-sustaining system for futuregenerations. The agricultural system should not beviewed by itself. The sustainability of the total eco-system is dependent on the relation between agricul-ture and rural and urban populations, and on under-standing the needs and contributions of each insustaining the whole ecosystem. James Horne, pres-ident of the Kerr Center for Sustainable Agriculture,in a discussion of sustainable agriculture, questionedthe ethics of passing on a degraded resource base, anagriculture that does not work, and a deteriorating
economy to our children and children’s children. Hestated, “At stake is ‘intergenerational equity,’ thewell-being of the next generations who are depend-ing on us to make the right choices today” (Horne2001, 249). Any discussion of sustainable agricultureis inadequate, however, if it does not include an ap-preciation and understanding of the relation betweenagriculture and the nonfarm population, or the rural-urban agroecosystem.
Urban Agriculture DefinedFor the purposes of this report, urban agriculture
will be defined as a complex system encompassing aspectrum of interests, from a traditional core of ac-tivities associated with production, processing, mar-keting, distribution, and consumption, to a multiplic-ity of other benefits and services that are less widelyacknowledged and documented. These include rec-reation and leisure activities, economic vitality andbusiness entrepreneurship, individual health andwell-being, community health and well-being, land-scape beautification, and environmental restorationand remediation. The complexity of today’s urbanagriculture system is illustrated in Figure 1.2.
ObjectivesThis report has five primary objectives:
1. to broaden the understanding of what agriculture
Figure 1.1. Understanding the functionality of the rural-urbanagroecosystem within an urbanizing society can behelpful in establishing how parts interact with eachother and areas of common ground to ensure thehealth of the whole society, including the total agri-cultural system.
UrbanAgriculturalSubsystem
RuralAgriculturalSubsystem
Common Ground
The Rural – Urban Agroecosystem
The Urbanizing Society
Figure 1.2. Today’s urban agriculture system is a complex sys-tem composed of a central core of activities alongwith a wide variety of services and outcomes thatsupport the total population.
EnvironmentalRestoration &Remediation
Community Health& Well-Being
Agriculture’sCore Activities:
ProductionProcessingMarketing
DistributionConsumption
Individual Health &Well-Being
LandscapeBeautification
Services(ecosystem, business)
EconomicVitality
BusinessEntrepreneurship
Introduction 15
is in an urbanizing society;2. to identify opportunities for urban and agricultur-
al constituencies to work cooperatively towardcommon goals;
3. to document the contributions and/or servicesthat agriculture provides to both rural and urbansectors;
4. to stimulate broad debate and discussion aboutprogram and policy directions and priorities per-taining to agriculture in an urbanizing society;and
5. to propose ways in which contemporary agricul-ture, with other partners, can help society meetthe challenges associated with urbanization.
Historical Context of Agriculture
Agriculture traditionally has been thought of as ru-ral in place and occupation. This is so partly becauseearly societies were preoccupied with subsistence foodproduction. To understand the bases for conflictingopinions about the possible meanings and interpre-tations of the phrase urban agriculture, it will be use-ful to examine the history of attitudes about farms andcities, how the social context of agriculture changedthroughout the twentieth century, and what the re-alities are today.
City and country have represented contrasting val-ues and lifestyles in many human societies, and es-pecially in the European tradition. For much of Eu-ropean history, country life has meant isolation. Newscame slowly, if at all, and the circle of associates forcountry people was somewhat narrow. In contrast,city life presented more opportunity for commerce andinteraction with a wider circle of people. City peoplewere thought to be more sophisticated, better educat-ed, and wiser to the ways of the world. Cities werecrowded, however; sanitation often was poor; andcrime could be pervasive. Country life was healthi-er, especially for the poor, and country folk werethought to be more virtuous. These realities of thedistant past became the basis for stereotypes thatcontinue to influence ideas of city and country today.
Agriculture has played an especially significantrole in U.S. history. Founding fathers such as Tho-mas Jefferson and Benjamin Franklin thought thatthe new nation, by emphasizing agriculture, wouldavoid the horrors, pitfalls, and injustices they saw ineighteenth-century Europe. Throughout the nine-teenth century, the U.S. Congress undertook a num-ber of initiatives to extend the original vision of Jef-
ferson and Franklin. It passed the Homestead Act,encouraging westward migration for people whowould domesticate the wilderness by farming. It cre-ated the land grant university (LGU) system as a wayto ensure that the farm population and the workingclasses enjoyed the benefits of education. It lateradded federally funded programs of research and out-reach to provide technical assistance to farmers.Railroads were encouraged to provide farmers withaccess to markets, and many midwestern states builttheir economies on meat, milk, and grain.
Of course, these activities also allowed the UnitedStates to develop great cities and industries. Build-ing the railroads may have been understood as help-ing the farmers, but doing so required a steel indus-try and a huge commitment of labor to the task ofclearing grade and laying track. Once built, the rail-roads meant that food could be delivered cheaply toworkers in the manufacturing centers growing on theEast Coast. Furthermore, the food system itself cameto be much more than farming. To move commodi-ties, a transportation industry was required, and thuslarge companies to ship and to store grain were de-veloped, as well as those to build and to service thenecessary infrastructure. Of course, food had to bedelivered to consumers by grocers and later by res-taurateurs. Farming itself came to depend on equip-ment manufacturers and seed and chemical compa-nies. Although U.S. residents thought of theirs as anagrarian society, all these activities to help the farm-er, farm, and factory actually constituted a symbioticrelation leading to the growth of an overwhelminglyurban nation. By the end of the twentieth century,few U.S. residents had worked on a farm. Some hadnever seen one.
Urban agriculture is an underrecognized but sig-nificant component of agriculture that is multidimen-sional in its functions and contributions. One aspectof urban agriculture includes the producing, process-ing, marketing, and consuming or using of food, fiber,ornamental plants, and services. Many of these ac-tivities occur within urban and urban-fringe areas.Urban agriculture also includes a myriad of social andeconomic services and activities associated with rec-reation, leisure, tourism, health care, and mainte-nance. Agribusinesses and the conservation and pres-ervation sectors are composed of such things as toolsand equipment sales and services, irrigation designand installation, input supply, retail sales, product de-velopment, remediation, education, and information.They are major players in the total urban agricultur-al system. Similarly, the equine and aquaculture in-dustries, which are both recreational and major agri-
16 Urban and Agricultural Communities: Opportunities for Common Ground
businesses, often are overlooked as contributors to theagricultural sector. This report addresses the socialand demographic factors contributing to urban agri-culture, its geographic patterns across the UnitedStates, and its structural characteristics in urbanareas.
In his powerful book Nature’s Metropolis, WilliamCronon (1991) wrote of the complex and intricate link-ages growing between city and country during thesecond half of the 1800s. Although his focus was onChicago and the Great West, his account of the struc-ture of agriculture and urban expansion containedimportant vignettes of social and economic changeapplicable to the entire U.S. landscape. He spoke ofhow technology changed agricultural production, aswell as the transporting, processing, and marketingof food and fiber in regional urban centers. He point-ed to the eventual transformation of a once predomi-nantly agrarian society to a more urban one with con-sumer demands for greater and more specializedgoods and services.
Cronon (1991) made several key distinctions in Na-ture’s Metropolis. One distinction was between farm-ing and agribusiness: farming was at one time almostsynonymous with agriculture, but over time agricul-ture became more complex, differentiated, and spe-cialized. Farming per se became only one componentof an agricultural industry in which the productionand processing of food and fiber became economical-ly and geographically separated in the United States.Farm produce increasingly was graded for quality anddifferentiated as commodities for demanding consum-er and investment markets. Although commoditiesare grown on farms, they generally are graded at ur-ban centers. As noted elsewhere in this report, a sec-ond distinction for Cronon was simply between ruraland urban life. The process of rural people’s sendinggrain, lumber, and livestock to urban centers in re-turn for exotic materials and a variety of merchan-dise exemplified the linkage and mutual dependencybetween these two sectors. Finally, Cronon distin-guished an ecological and spatial hierarchy between“cores” and “peripheries.” The growth of urban cen-ters was but one of many expressions of the new mar-ket system, which involved geographical flows of re-sources, capital, and credit between large urbanmetroplexes and small rural communities. Reflect-ing on the ecological hierarchy, Cronin noted the fol-lowing:
Beyond the central city lay the zone of intensive ag-riculture, filled with orchards, market gardens,dairy farms, and feedlots; beyond it the zone of ex-
tensive agriculture, with its farms raising mainlywheat and corn; beyond it the zone of livestock andlumber production; and beyond it the zone of hunt-ers, where fast disappearing game species wereopening new niches for cattle, to say nothing offarmers, miners, lumbermen. Each element of thisnew market geography had its roots in the origi-nal ecosystems that had assigned pine trees to thenorth woods and bison to the Great Plains. Buteach was no less affected by its distance from thecity and its ability to pay the transport costs of get-ting there (Cronon 1991, 266).
Over the years, much scholarly interest has exist-ed in exploring the transformation and the structureof agriculture and the natural landscape (Hallberg,Spitze, and Ray 1994). This process, however, haslargely ignored the social, economic, and ecologicalportents of the urban dimension relative to those ofthe agricultural industry. Cronon’s insights raisethree questions: What is the historical pattern ofchange in U.S. agriculture, and its urban relevance?What recent demographic changes in U.S. societyhave occurred that characterize the rural-urban in-terface? What are the socioeconomic features of ag-riculture in contemporary rural and urban areas inthe United States?
Answers to all three questions require that partic-ular concepts be defined to provide a clear basis fordiscussion and assimilation of ideas. A specific timeperiod must be established to frame the evolution ofchange. Thus, the use of a standard geographical unitof study and the assumption that a heterogeneousdistribution of urban agriculture characteristics ex-ists in a community are required.
The United States has a history of geographical,demographic, and economic expansion. Agricultureplayed an important part in sustaining that expan-sion. Farming and farms defined rural life and ruralcommunities for decades. Indeed, as the U.S. popu-lation shifted from residing and working in rural ar-eas to urban areas, the public romanticized rural ar-eas and farming by associating them with images ofindividual autonomy, nurturing family life, and com-munity spirit. In short, it created the “rural myth”(Goldman and Dickens 1983) that agriculture is sim-ply farming and that farming is a rural phenomenon,a myth in which many continue to believe. Althoughagriculture continues to contribute to U.S. economicprominence in the world, agriculture is not simplyfarming. The available statistics document primari-ly gross sales of agricultural commodities. This prac-tice clearly overlooks the many other economic and
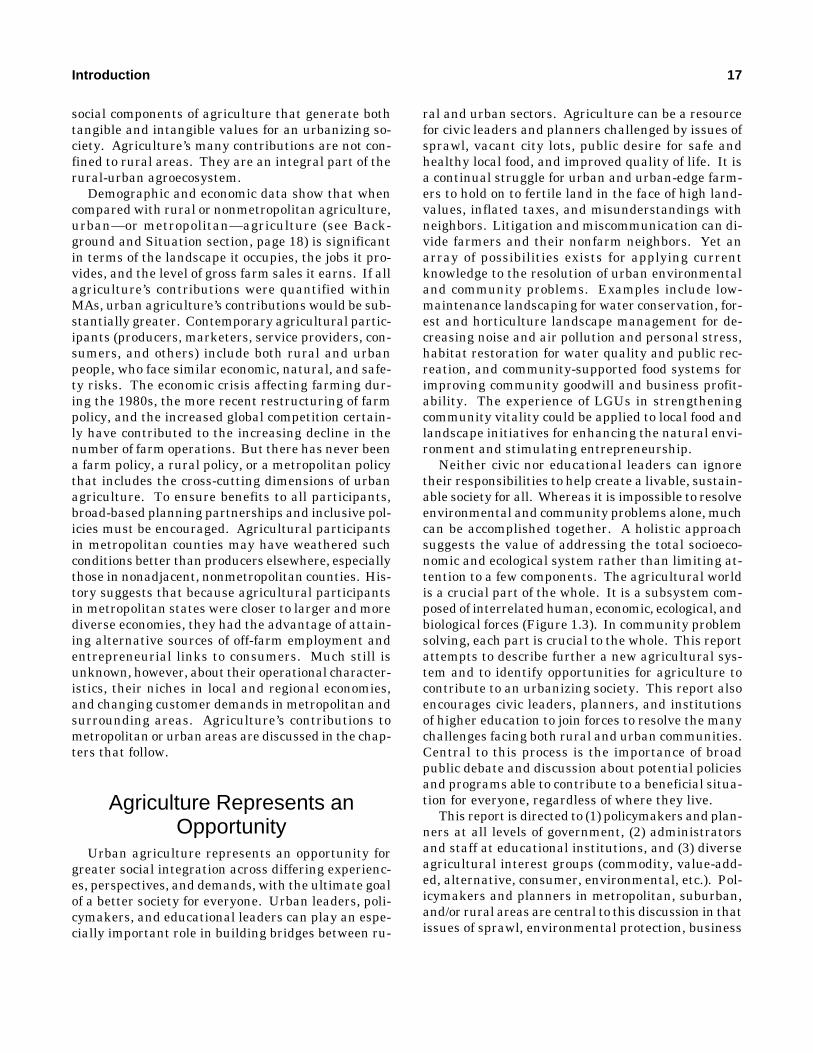
Introduction 17
social components of agriculture that generate bothtangible and intangible values for an urbanizing so-ciety. Agriculture’s many contributions are not con-fined to rural areas. They are an integral part of therural-urban agroecosystem.
Demographic and economic data show that whencompared with rural or nonmetropolitan agriculture,urban—or metropolitan—agriculture (see Back-ground and Situation section, page 18) is significantin terms of the landscape it occupies, the jobs it pro-vides, and the level of gross farm sales it earns. If allagriculture’s contributions were quantified withinMAs, urban agriculture’s contributions would be sub-stantially greater. Contemporary agricultural partic-ipants (producers, marketers, service providers, con-sumers, and others) include both rural and urbanpeople, who face similar economic, natural, and safe-ty risks. The economic crisis affecting farming dur-ing the 1980s, the more recent restructuring of farmpolicy, and the increased global competition certain-ly have contributed to the increasing decline in thenumber of farm operations. But there has never beena farm policy, a rural policy, or a metropolitan policythat includes the cross-cutting dimensions of urbanagriculture. To ensure benefits to all participants,broad-based planning partnerships and inclusive pol-icies must be encouraged. Agricultural participantsin metropolitan counties may have weathered suchconditions better than producers elsewhere, especiallythose in nonadjacent, nonmetropolitan counties. His-tory suggests that because agricultural participantsin metropolitan states were closer to larger and morediverse economies, they had the advantage of attain-ing alternative sources of off-farm employment andentrepreneurial links to consumers. Much still isunknown, however, about their operational character-istics, their niches in local and regional economies,and changing customer demands in metropolitan andsurrounding areas. Agriculture’s contributions tometropolitan or urban areas are discussed in the chap-ters that follow.
Agriculture Represents anOpportunity
Urban agriculture represents an opportunity forgreater social integration across differing experienc-es, perspectives, and demands, with the ultimate goalof a better society for everyone. Urban leaders, poli-cymakers, and educational leaders can play an espe-cially important role in building bridges between ru-
ral and urban sectors. Agriculture can be a resourcefor civic leaders and planners challenged by issues ofsprawl, vacant city lots, public desire for safe andhealthy local food, and improved quality of life. It isa continual struggle for urban and urban-edge farm-ers to hold on to fertile land in the face of high land-values, inflated taxes, and misunderstandings withneighbors. Litigation and miscommunication can di-vide farmers and their nonfarm neighbors. Yet anarray of possibilities exists for applying currentknowledge to the resolution of urban environmentaland community problems. Examples include low-maintenance landscaping for water conservation, for-est and horticulture landscape management for de-creasing noise and air pollution and personal stress,habitat restoration for water quality and public rec-reation, and community-supported food systems forimproving community goodwill and business profit-ability. The experience of LGUs in strengtheningcommunity vitality could be applied to local food andlandscape initiatives for enhancing the natural envi-ronment and stimulating entrepreneurship.
Neither civic nor educational leaders can ignoretheir responsibilities to help create a livable, sustain-able society for all. Whereas it is impossible to resolveenvironmental and community problems alone, muchcan be accomplished together. A holistic approachsuggests the value of addressing the total socioeco-nomic and ecological system rather than limiting at-tention to a few components. The agricultural worldis a crucial part of the whole. It is a subsystem com-posed of interrelated human, economic, ecological, andbiological forces (Figure 1.3). In community problemsolving, each part is crucial to the whole. This reportattempts to describe further a new agricultural sys-tem and to identify opportunities for agriculture tocontribute to an urbanizing society. This report alsoencourages civic leaders, planners, and institutionsof higher education to join forces to resolve the manychallenges facing both rural and urban communities.Central to this process is the importance of broadpublic debate and discussion about potential policiesand programs able to contribute to a beneficial situa-tion for everyone, regardless of where they live.
This report is directed to (1) policymakers and plan-ners at all levels of government, (2) administratorsand staff at educational institutions, and (3) diverseagricultural interest groups (commodity, value-add-ed, alternative, consumer, environmental, etc.). Pol-icymakers and planners in metropolitan, suburban,and/or rural areas are central to this discussion in thatissues of sprawl, environmental protection, business
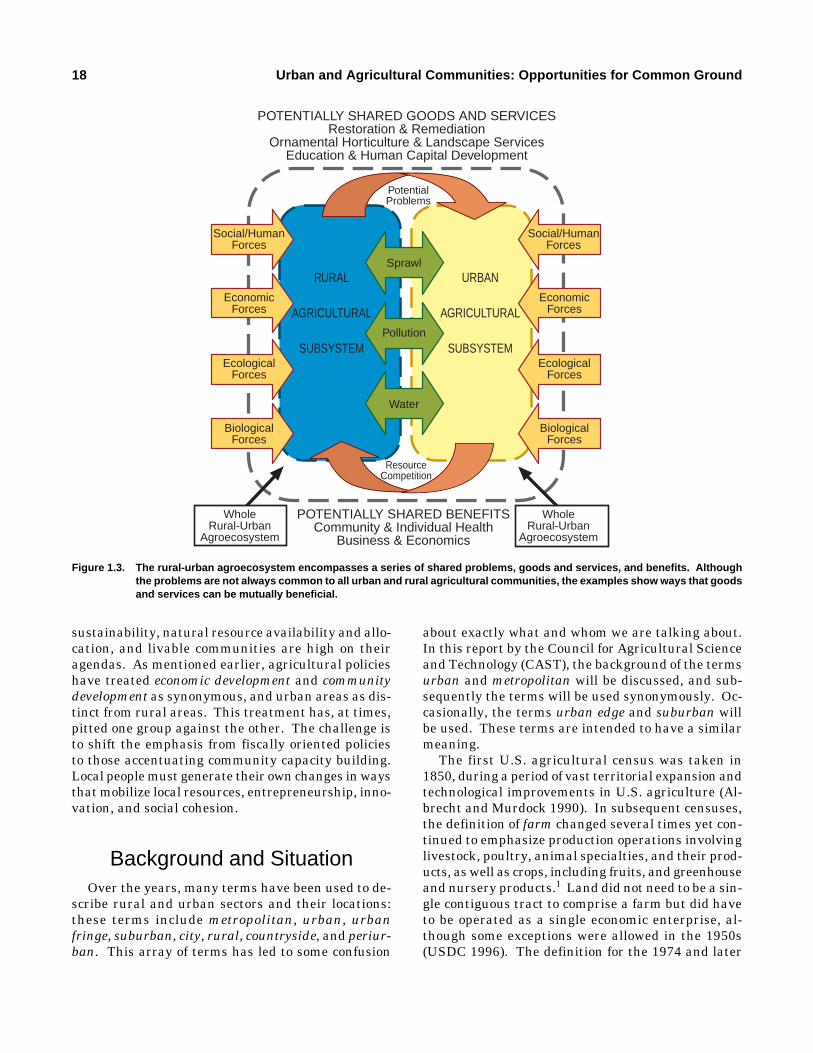
18 Urban and Agricultural Communities: Opportunities for Common Ground
sustainability, natural resource availability and allo-cation, and livable communities are high on theiragendas. As mentioned earlier, agricultural policieshave treated economic development and communitydevelopment as synonymous, and urban areas as dis-tinct from rural areas. This treatment has, at times,pitted one group against the other. The challenge isto shift the emphasis from fiscally oriented policiesto those accentuating community capacity building.Local people must generate their own changes in waysthat mobilize local resources, entrepreneurship, inno-vation, and social cohesion.
Background and SituationOver the years, many terms have been used to de-
scribe rural and urban sectors and their locations:these terms include metropolitan, urban, urbanfringe, suburban, city, rural, countryside, and periur-ban. This array of terms has led to some confusion
about exactly what and whom we are talking about.In this report by the Council for Agricultural Scienceand Technology (CAST), the background of the termsurban and metropolitan will be discussed, and sub-sequently the terms will be used synonymously. Oc-casionally, the terms urban edge and suburban willbe used. These terms are intended to have a similarmeaning.
The first U.S. agricultural census was taken in1850, during a period of vast territorial expansion andtechnological improvements in U.S. agriculture (Al-brecht and Murdock 1990). In subsequent censuses,the definition of farm changed several times yet con-tinued to emphasize production operations involvinglivestock, poultry, animal specialties, and their prod-ucts, as well as crops, including fruits, and greenhouseand nursery products.1 Land did not need to be a sin-gle contiguous tract to comprise a farm but did haveto be operated as a single economic enterprise, al-though some exceptions were allowed in the 1950s(USDC 1996). The definition for the 1974 and later
POTENTIALLY SHARED GOODS AND SERVICESRestoration & Remediation
Ornamental Horticulture & Landscape ServicesEducation & Human Capital Development
POTENTIALLY SHARED BENEFITSCommunity & Individual Health
Business & Economics
RURAL
AGRICULTURAL
SUBSYSTEM
URBAN
AGRICULTURAL
SUBSYSTEM
ResourceCompetition
PotentialProblems
WholeRural-Urban
Agroecosystem
EconomicForces
WholeRural-Urban
Agroecosystem
Social/HumanForces
Social/HumanForces
EcologicalForces
BiologicalForces
EconomicForces
EcologicalForces
BiologicalForces
Sprawl
Water
Pollution
Figure 1.3. The rural-urban agroecosystem encompasses a series of shared problems, goods and services, and benefits. Althoughthe problems are not always common to all urban and rural agricultural communities, the examples show ways that goodsand services can be mutually beneficial.
Introduction 19
censuses of agriculture referred to a farm as any placefrom which $1,000 or more of agricultural productswere sold, or normally would have been sold, duringthe census year. This more recent definition stan-dardizes the use of the term and provides a rationalefor limiting a discussion of agriculture and demographicchanges to the last quarter of the twentieth century.
Thus far, the liberal use of the term urban misrep-resents the conceptual and analytical variation thatexists with its application. Social scientists have longdebated the distinction between rural and urban andits relevance for community life (Goodall, Kafadar,and Tukey 1998; Wilkinson 1991). This distinction
has competed often, however, with that between met-ropolitan area and nonmetropolitan area, terms de-veloped by the Office of Management and Budget(OMB) in 1949.2 The difficulty with using these con-cepts is that the empirical measure of urban-ruralareas cuts across metropolitan and nonmetropolitanareas, and the data for these areas generally do notcorrespond, as other government data do, to countylines (Ricketts, Johnson-Webb, and Taylor 1998).3
Moreover, social scientists have made refinementsand provided special definitions such as rural fron-tiers to accommodate specific governmental policy andprogram objectives (Zelarney and Ciarlo 1999).4
1The definition of a farm has included several criteria since the1850 census. From 1785 to 1860, no acreage requirement existed,but a minimum of $100 in sales of agricultural products was re-quired. From 1870 to 1890, the definition included any place ofthree or more acres involved in agricultural production. Places withfewer than three acres were considered farms if they had a mini-mum annual value of $500 in agricultural sales. In 1900, therewere no acreage or minimum sales criteria. Cranberry marshes,greenhouses, and city dairies were included for the first time in thedefinition if they required the full-time services of at least one per-son. The definition from 1910 to 1920 became a minimum of threeacres, with $250 or more in total value of sales, unless the individ-ual operation required the full-time services of at least one person.The definition was unchanged, except for the deletion of the require-ment of a full-time person, from 1925 to 1945. In 1950 and 1954, afarm included any place of fewer than three acres if it had, or nor-mally would have had, sales of $150 or more in agricultural prod-ucts during the census year. Places that began operating as farmsfor the first time in 1954 also were included. Parcels operated bysharecroppers and tenant farms counted as separate farms eventhough the landlord managed the whole holding as a single unit.Moreover, land retained and operated by the landlord was count-ed as a separate farm unit. In censuses conducted from 1959 to1969, the farm definition raised the acreage requirement to 10 acresor more, with at least $50 or more in agricultural sales. A place offewer than 10 acres qualified as a farm if it had sales of $250 ormore during the census year (USDC 1996). The current farm def-inition for the 50 states differs in areal and sales criteria used incensuses conducted in U.S. protectorates. Also, the United Nation’sFood and Agricultural Organization, which collects farm produc-tion data internationally, cautions that its indices may differ fromthose produced by the countries themselves because of differencesin definitions of production, coverage, weights, and in concepts oftime reference of data and methods of calculation (FAO 1999b).Such differences constrain comparisons of domestic and foreignfarm production and other economic indicators.
2The U.S. Census Bureau defines urban as comprising all ter-ritory, population, and housing units in urbanized areas and in (1)places of 2,500 or more persons incorporated as cities, villages,boroughs, and towns (with exclusions in some states); (2) CensusDesignated Places of 2,500 or more people; and (3) other incorpo-rated or unincorporated territory in urbanized areas. An urban-ized area has one or more central places and an adjacent denselysettled surrounding territory, or urban fringe, that contains a min-imum of 50,000 people (USDC 1991). The urban fringe consists
generally of territory contiguous to a central place and of at least1,000 people/mile. Territory, population, and housing units notclassified as urban are deemed rural, being places of fewer than2,500 inhabitants. A metropolitan area (MA) is a large-populationnucleus of 50,000 or more people in addition to adjacent communi-ties with a high degree of economic and social integration with thatnucleus. An MA also can be an urbanized area with a total popu-lation of at least 100,000 (75,000 in New England). Residual ter-ritories, populations, and housing units located outside an MA arereferred to as nonmetropolitan. The Census and Office of Manage-ment and Budget (OMB) distinguish other, larger units (e.g., con-solidated and primary metropolitan statistical areas [MSAs]) basedon populations of one million or more.
3The World Resources Institute (WRI) stated in a 1996 reportthat around the world the term urban area is synonymous with cityalthough the two terms are not the same. Urban is a statisticalconcept that differs in meaning from one country to the next, ac-cording to a combination of criteria such as population density,political function, or predominant activity of the region. All citiesare urban areas, but the converse is not always true. A city is acomplex political, economic, and social center symbolizing, in somesense, its nation’s identity. The WRI advises that comparisons ofurban and city data can be misleading and that the available databe treated as best estimates.
4The Economic Research Service (ERS) produced three otherclassification schemes. Similar to the Rural-Urban ContinuumCodes, the Urban Influence Codes classify a county by size of thecities within it and its proximity to larger metropolitan economiesand urban populations (Ghelfi and Parker 1995). This index hastwo metropolitan and seven nonmetropolitan subclassifications.The ERS also produced a rural county typology in 1979 (with arevision in 1994) that identifies groups of nonmetropolitan coun-ties having similar economical and policy characteristics. Six over-lapping classifications are farming-dependent, mining-dependent,manufacturing-dependent, government-dependent, services-depen-dent, and nonspecialized. Its five overlapping policy types are re-tirement-destination, federal lands, commuting, persistent poverty,and transfer-dependent (Bender et al. 1985; Cook and Mizer 1994).Finally, the Goldsmith Rural Modification scheme improves thedefinition of rural areas in metropolitan counties. It identifies ar-eas in large MAs that are small town or open-country with no easyaccess to central areas (Goldsmith, Puskin, and Stiles 1993). Farm-er (1997) summarizes some of the literature behind alternativemeasures of rural and rurality.
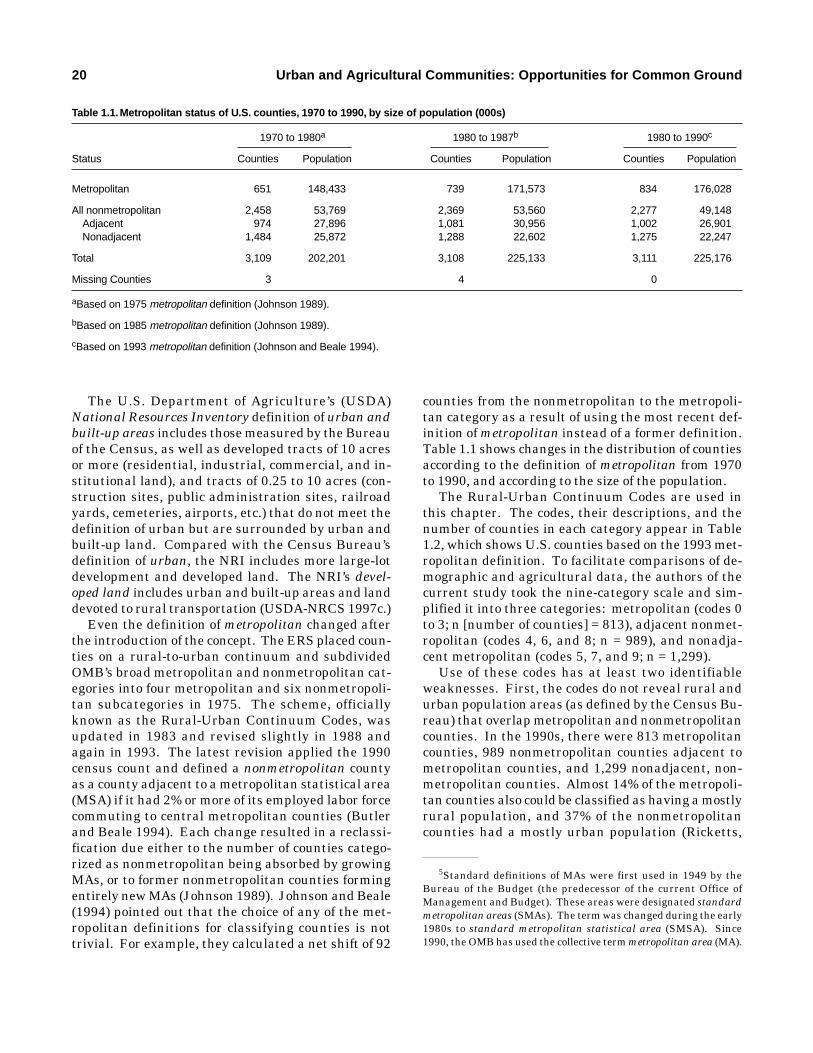
20 Urban and Agricultural Communities: Opportunities for Common Ground
The U.S. Department of Agriculture’s (USDA)National Resources Inventory definition of urban andbuilt-up areas includes those measured by the Bureauof the Census, as well as developed tracts of 10 acresor more (residential, industrial, commercial, and in-stitutional land), and tracts of 0.25 to 10 acres (con-struction sites, public administration sites, railroadyards, cemeteries, airports, etc.) that do not meet thedefinition of urban but are surrounded by urban andbuilt-up land. Compared with the Census Bureau’sdefinition of urban, the NRI includes more large-lotdevelopment and developed land. The NRI’s devel-oped land includes urban and built-up areas and landdevoted to rural transportation (USDA-NRCS 1997c.)
Even the definition of metropolitan changed afterthe introduction of the concept. The ERS placed coun-ties on a rural-to-urban continuum and subdividedOMB’s broad metropolitan and nonmetropolitan cat-egories into four metropolitan and six nonmetropoli-tan subcategories in 1975. The scheme, officiallyknown as the Rural-Urban Continuum Codes, wasupdated in 1983 and revised slightly in 1988 andagain in 1993. The latest revision applied the 1990census count and defined a nonmetropolitan countyas a county adjacent to a metropolitan statistical area(MSA) if it had 2% or more of its employed labor forcecommuting to central metropolitan counties (Butlerand Beale 1994). Each change resulted in a reclassi-fication due either to the number of counties catego-rized as nonmetropolitan being absorbed by growingMAs, or to former nonmetropolitan counties formingentirely new MAs (Johnson 1989). Johnson and Beale(1994) pointed out that the choice of any of the met-ropolitan definitions for classifying counties is nottrivial. For example, they calculated a net shift of 92
counties from the nonmetropolitan to the metropoli-tan category as a result of using the most recent def-inition of metropolitan instead of a former definition.Table 1.1 shows changes in the distribution of countiesaccording to the definition of metropolitan from 1970to 1990, and according to the size of the population.
The Rural-Urban Continuum Codes are used inthis chapter. The codes, their descriptions, and thenumber of counties in each category appear in Table1.2, which shows U.S. counties based on the 1993 met-ropolitan definition. To facilitate comparisons of de-mographic and agricultural data, the authors of thecurrent study took the nine-category scale and sim-plified it into three categories: metropolitan (codes 0to 3; n [number of counties] = 813), adjacent nonmet-ropolitan (codes 4, 6, and 8; n = 989), and nonadja-cent metropolitan (codes 5, 7, and 9; n = 1,299).
Use of these codes has at least two identifiableweaknesses. First, the codes do not reveal rural andurban population areas (as defined by the Census Bu-reau) that overlap metropolitan and nonmetropolitancounties. In the 1990s, there were 813 metropolitancounties, 989 nonmetropolitan counties adjacent tometropolitan counties, and 1,299 nonadjacent, non-metropolitan counties. Almost 14% of the metropoli-tan counties also could be classified as having a mostlyrural population, and 37% of the nonmetropolitancounties had a mostly urban population (Ricketts,
Table 1.1.Metropolitan status of U.S. counties, 1970 to 1990, by size of population (000s)
1970 to 1980a 1980 to 1987b 1980 to 1990c
Status Counties Population Counties Population Counties Population
Metropolitan 651 148,433 739 171,573 834 176,028
All nonmetropolitan 2,458 53,769 2,369 53,560 2,277 49,148Adjacent 974 27,896 1,081 30,956 1,002 26,901Nonadjacent 1,484 25,872 1,288 22,602 1,275 22,247
Total 3,109 202,201 3,108 225,133 3,111 225,176
Missing Counties 3 4 0
aBased on 1975 metropolitan definition (Johnson 1989).
bBased on 1985 metropolitan definition (Johnson 1989).
cBased on 1993 metropolitan definition (Johnson and Beale 1994).
5Standard definitions of MAs were first used in 1949 by theBureau of the Budget (the predecessor of the current Office ofManagement and Budget). These areas were designated standardmetropolitan areas (SMAs). The term was changed during the early1980s to standard metropolitan statistical area (SMSA). Since1990, the OMB has used the collective term metropolitan area (MA).
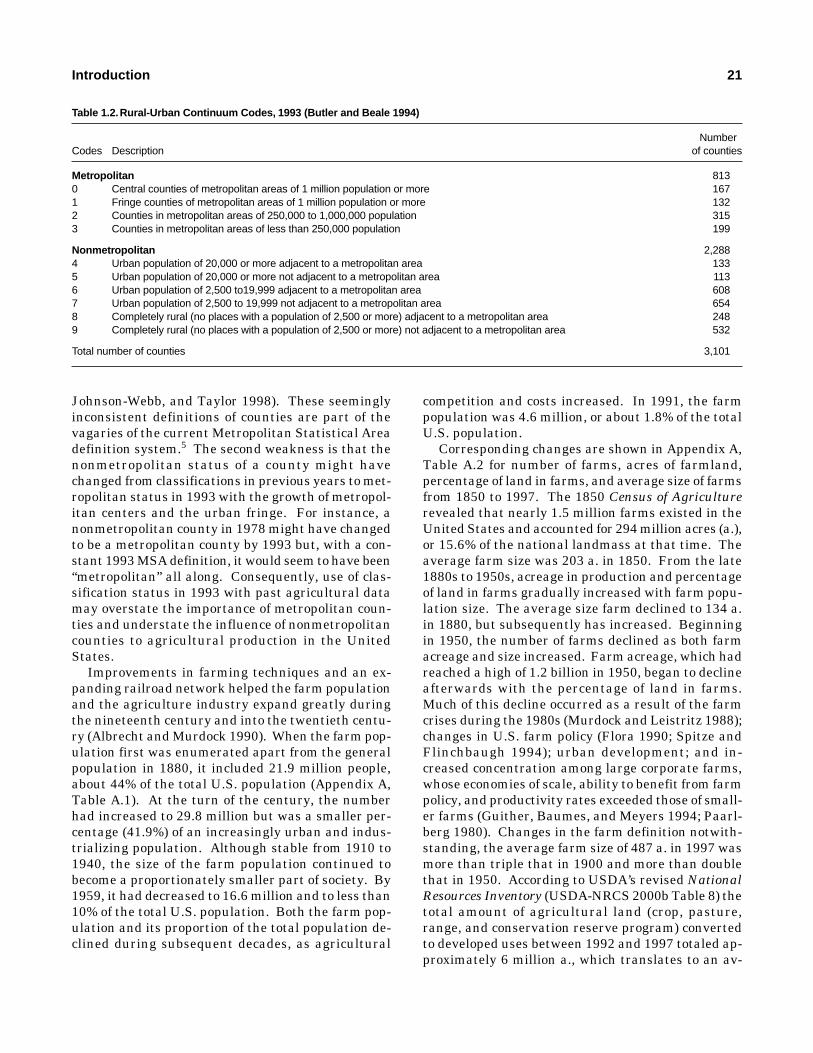
Introduction 21
Johnson-Webb, and Taylor 1998). These seeminglyinconsistent definitions of counties are part of thevagaries of the current Metropolitan Statistical Areadefinition system.5 The second weakness is that thenonmetropolitan status of a county might havechanged from classifications in previous years to met-ropolitan status in 1993 with the growth of metropol-itan centers and the urban fringe. For instance, anonmetropolitan county in 1978 might have changedto be a metropolitan county by 1993 but, with a con-stant 1993 MSA definition, it would seem to have been“metropolitan” all along. Consequently, use of clas-sification status in 1993 with past agricultural datamay overstate the importance of metropolitan coun-ties and understate the influence of nonmetropolitancounties to agricultural production in the UnitedStates.
Improvements in farming techniques and an ex-panding railroad network helped the farm populationand the agriculture industry expand greatly duringthe nineteenth century and into the twentieth centu-ry (Albrecht and Murdock 1990). When the farm pop-ulation first was enumerated apart from the generalpopulation in 1880, it included 21.9 million people,about 44% of the total U.S. population (Appendix A,Table A.1). At the turn of the century, the numberhad increased to 29.8 million but was a smaller per-centage (41.9%) of an increasingly urban and indus-trializing population. Although stable from 1910 to1940, the size of the farm population continued tobecome a proportionately smaller part of society. By1959, it had decreased to 16.6 million and to less than10% of the total U.S. population. Both the farm pop-ulation and its proportion of the total population de-clined during subsequent decades, as agricultural
competition and costs increased. In 1991, the farmpopulation was 4.6 million, or about 1.8% of the totalU.S. population.
Corresponding changes are shown in Appendix A,Table A.2 for number of farms, acres of farmland,percentage of land in farms, and average size of farmsfrom 1850 to 1997. The 1850 Census of Agriculturerevealed that nearly 1.5 million farms existed in theUnited States and accounted for 294 million acres (a.),or 15.6% of the national landmass at that time. Theaverage farm size was 203 a. in 1850. From the late1880s to 1950s, acreage in production and percentageof land in farms gradually increased with farm popu-lation size. The average size farm declined to 134 a.in 1880, but subsequently has increased. Beginningin 1950, the number of farms declined as both farmacreage and size increased. Farm acreage, which hadreached a high of 1.2 billion in 1950, began to declineafterwards with the percentage of land in farms.Much of this decline occurred as a result of the farmcrises during the 1980s (Murdock and Leistritz 1988);changes in U.S. farm policy (Flora 1990; Spitze andFlinchbaugh 1994); urban development; and in-creased concentration among large corporate farms,whose economies of scale, ability to benefit from farmpolicy, and productivity rates exceeded those of small-er farms (Guither, Baumes, and Meyers 1994; Paarl-berg 1980). Changes in the farm definition notwith-standing, the average farm size of 487 a. in 1997 wasmore than triple that in 1900 and more than doublethat in 1950. According to USDA’s revised NationalResources Inventory (USDA-NRCS 2000b Table 8) thetotal amount of agricultural land (crop, pasture,range, and conservation reserve program) convertedto developed uses between 1992 and 1997 totaled ap-proximately 6 million a., which translates to an av-
Table 1.2.Rural-Urban Continuum Codes, 1993 (Butler and Beale 1994)
NumberCodes Description of counties
Metropolitan 8130 Central counties of metropolitan areas of 1 million population or more 1671 Fringe counties of metropolitan areas of 1 million population or more 1322 Counties in metropolitan areas of 250,000 to 1,000,000 population 3153 Counties in metropolitan areas of less than 250,000 population 199
Nonmetropolitan 2,2884 Urban population of 20,000 or more adjacent to a metropolitan area 1335 Urban population of 20,000 or more not adjacent to a metropolitan area 1136 Urban population of 2,500 to19,999 adjacent to a metropolitan area 6087 Urban population of 2,500 to 19,999 not adjacent to a metropolitan area 6548 Completely rural (no places with a population of 2,500 or more) adjacent to a metropolitan area 2489 Completely rural (no places with a population of 2,500 or more) not adjacent to a metropolitan area 532
Total number of counties 3,101
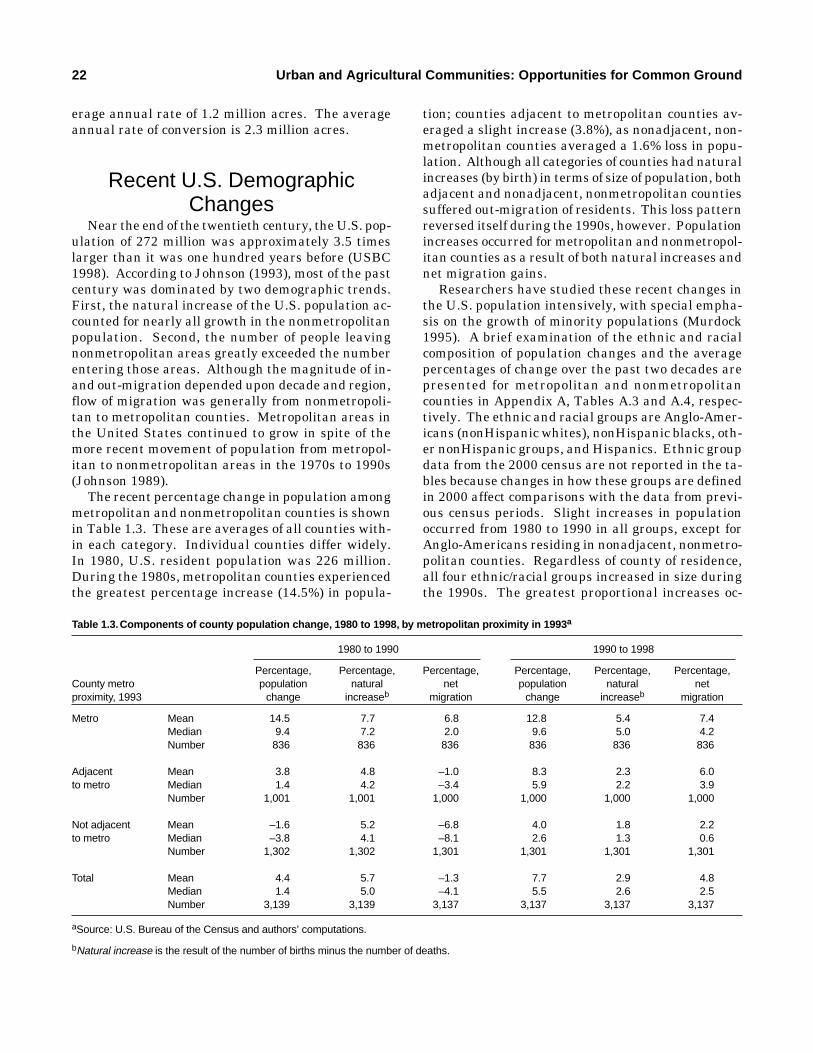
22 Urban and Agricultural Communities: Opportunities for Common Ground
erage annual rate of 1.2 million acres. The averageannual rate of conversion is 2.3 million acres.
Recent U.S. DemographicChanges
Near the end of the twentieth century, the U.S. pop-ulation of 272 million was approximately 3.5 timeslarger than it was one hundred years before (USBC1998). According to Johnson (1993), most of the pastcentury was dominated by two demographic trends.First, the natural increase of the U.S. population ac-counted for nearly all growth in the nonmetropolitanpopulation. Second, the number of people leavingnonmetropolitan areas greatly exceeded the numberentering those areas. Although the magnitude of in-and out-migration depended upon decade and region,flow of migration was generally from nonmetropoli-tan to metropolitan counties. Metropolitan areas inthe United States continued to grow in spite of themore recent movement of population from metropol-itan to nonmetropolitan areas in the 1970s to 1990s(Johnson 1989).
The recent percentage change in population amongmetropolitan and nonmetropolitan counties is shownin Table 1.3. These are averages of all counties with-in each category. Individual counties differ widely.In 1980, U.S. resident population was 226 million.During the 1980s, metropolitan counties experiencedthe greatest percentage increase (14.5%) in popula-
tion; counties adjacent to metropolitan counties av-eraged a slight increase (3.8%), as nonadjacent, non-metropolitan counties averaged a 1.6% loss in popu-lation. Although all categories of counties had naturalincreases (by birth) in terms of size of population, bothadjacent and nonadjacent, nonmetropolitan countiessuffered out-migration of residents. This loss patternreversed itself during the 1990s, however. Populationincreases occurred for metropolitan and nonmetropol-itan counties as a result of both natural increases andnet migration gains.
Researchers have studied these recent changes inthe U.S. population intensively, with special empha-sis on the growth of minority populations (Murdock1995). A brief examination of the ethnic and racialcomposition of population changes and the averagepercentages of change over the past two decades arepresented for metropolitan and nonmetropolitancounties in Appendix A, Tables A.3 and A.4, respec-tively. The ethnic and racial groups are Anglo-Amer-icans (nonHispanic whites), nonHispanic blacks, oth-er nonHispanic groups, and Hispanics. Ethnic groupdata from the 2000 census are not reported in the ta-bles because changes in how these groups are definedin 2000 affect comparisons with the data from previ-ous census periods. Slight increases in populationoccurred from 1980 to 1990 in all groups, except forAnglo-Americans residing in nonadjacent, nonmetro-politan counties. Regardless of county of residence,all four ethnic/racial groups increased in size duringthe 1990s. The greatest proportional increases oc-
Table 1.3.Components of county population change, 1980 to 1998, by metropolitan proximity in 1993a
1980 to 1990 1990 to 1998
Percentage, Percentage, Percentage, Percentage, Percentage, Percentage,County metro population natural net population natural netproximity, 1993 change increaseb migration change increaseb migration
Metro Mean 14.5 7.7 6.8 12.8 5.4 7.4Median 9.4 7.2 2.0 9.6 5.0 4.2Number 836 836 836 836 836 836
Adjacent Mean 3.8 4.8 –1.0 8.3 2.3 6.0to metro Median 1.4 4.2 –3.4 5.9 2.2 3.9
Number 1,001 1,001 1,000 1,000 1,000 1,000
Not adjacent Mean –1.6 5.2 –6.8 4.0 1.8 2.2to metro Median –3.8 4.1 –8.1 2.6 1.3 0.6
Number 1,302 1,302 1,301 1,301 1,301 1,301
Total Mean 4.4 5.7 –1.3 7.7 2.9 4.8Median 1.4 5.0 –4.1 5.5 2.6 2.5Number 3,139 3,139 3,137 3,137 3,137 3,137
aSource: U.S. Bureau of the Census and authors’ computations.
bNatural increase is the result of the number of births minus the number of deaths.
Introduction 23
curred among Hispanics, nonHispanic blacks, andother ethnic and racial groups. Hispanics nearly tri-pled their sizes of population in metropolitan coun-ties from 1980 to 1999 and evidenced the greatestpercentage change during the 1980s and 1990s (Ap-pendix A, Table A.3). Although the largest segmentof the U.S. population, Anglo-Americans evidenced byfar the smallest percentage of change in each decade.
Today’s Rural-Urban AgricultureAs has been mentioned, the general public per-
ceives agriculture as a rural enterprise in which work,residence, and family life are intertwined and under-pinned by traditional agrarian beliefs (Molnar and Wu1989). Looking at agriculture through metropolitanand nonmetropolitan county lenses indicates that thepublic belief about where farming occurs may be amisconception. Employment in the broader agricul-ture, forestry, horticulture, and fisheries industry(called the agriculture industry hereafter) is report-ed by county category in Appendix A, Table A.5 forthe period 1980 to 1997. In 1980, 3.9 million peoplewere working in the agricultural industry. Metropol-itan counties accounted for 47% of the agricultureindustry’s total employment, compared with 25 and28% by adjacent and nonadjacent, nonmetropolitancounties, respectively. The agricultural industry’sproportion of employed persons to total industrialemployment in metropolitan counties was 2.4% and1.9% for the United States in 1980. By comparison,the agriculture industry’s proportion of employedpersons to total employment in adjacent and nonad-jacent, nonmetropolitan counties was 9.2 and 12.8%,respectively. Nationally, the industry was responsi-ble for 1.0 and 1.1% of all U.S. industrial employmentin adjacent and nonadjacent, nonmetropolitan coun-ties, respectively. By 1997, metropolitan countiesaccounted for more than half (54%) of all agricultur-al employment relative to nonmetropolitan counties.
In 1980, approximately 2.8 million people were em-ployed in agricultural occupations (Appendix A, Ta-ble A.6). This number was estimated to have in-creased to about 3 million by 1997. Metropolitancounties provided the largest proportion of agricultur-al jobs, accounting for 46% in 1980, 53% in 1990, and54% in 1997. The number of people employed in ag-ricultural occupations declined slightly since 1980 innonmetropolitan counties and was divided almostevenly between counties adjacent and those nonad-jacent to metropolitan counties.
Examination of several selected economic charac-
teristics indicates the spatial arrangement of U.S.farming (Heaton 1980). Mean and median numbersof farms appear in Appendix A, Table A.7. Metropol-itan counties have had the greatest average and me-dian numbers of farms since 1978. Nonadjacent, non-metropolitan counties have had the fewest number offarms over the 20-year (yr) period. Metropolitan coun-ties averaged 889 farms in 1978; adjacent and non-adjacent counties averaged 787 and 608 farms, respec-tively. By the end of the 1990s, the average numberof farms had declined to 772 in metropolitan counties,650 farms in adjacent counties, and 507 in nonadja-cent counties.
The proportion of acres in farmland compared withthe total county land area (Appendix A, Table A.8) andaverage farm size (Appendix A, Table A.9) indicate thedegree to which farming dominates county landscapes(USBC, various years 1978-1992; USDA-NASS1997a). Two patterns exist. The average share offarmland compared with the total land area has de-clined, and nonmetropolitan counties consistentlyhave had the largest proportions of their acreage infarms. Metropolitan counties have averaged nearly4 of every 10 a. in farmland during the 1980s and1990s.
The mean farm size increased slightly from 449 to487 a. nationally (Appendix A, Table A.9). Nonadja-cent, nonmetropolitan counties had the largest farmson average, and metropolitan counties had the small-est farms. Changes in average farm size parallel thepattern of overall increase in farm acreage. Medianacreage for average farm size/county increased from266 a. in 1978 to 285 a. in 1997. These increases oc-curred in nonmetropolitan counties, especially in non-adjacent counties.
Economic production similarities and differencesin the spatial location of farms are indicated by com-parisons of gross farm sales (Appendix A, Tables A.10to A.12). Average gross farm sales/county increasedoverall from $47 million in 1978 to $103 million in1997, and the change in median value of average grosssales/county doubled from $36 million to $72 million.Metropolitan and nonadjacent,6 nonmetropolitancounties averaged the most gross farm sales for each
6For Appendix A, Tables A.11 and A.12, county-level data wereused. These data have suppressed values for some counties (andtwo states). In sums across counties within each proximity group(i.e., metropolitan, adjoining nonmetropolitan, and nonadjoiningnonmetropolitan), these suppressed values were not included. Inthe national aggregated gross sales data reported by commoditythese values are included by the U.S. Census and/or the USDAstatistics, thus producing larger gross sales figures than the CASTtask force authors obtained.
24 Urban and Agricultural Communities: Opportunities for Common Ground
agricultural census period when compared with ad-jacent, nonmetropolitan counties. In 1997, metropol-itan and nonadjacent, nonmetropolitan counties av-eraged $108 million and $112 million in gross farmsales, respectively, compared with $89 million by ad-jacent, nonmetropolitan counties (Appendix A, TableA.10).
Total crop sales (unadjusted dollars) between 1978and 1997 more than doubled from $47.3 billion in 1978to $96 billion. Grain sales increased from $26.7 bil-lion (1978) to $46.5 billion (1997), followed by gainsfor fruits/nuts/berries (from $4.5 billion to $12.5 bil-lion), nursery/greenhouse products (from $2.5 billionto $10.1 billion), and vegetables/sweet corn/melons(from $3.2 billion to $8.2 billion). Increases also oc-curred for cotton/cotton seed (from $3.1 billion to $5.9billion), other crops (from $2.9 billion to $5.5 billion),hay/silage/field seeds (from $2.2 billion to $4.4 billion),and tobacco (from $2.3 billion to $2.9 billion) (Appen-dix A, Table A.11).
In 1978, metropolitan counties accounted for 38.9%of the total value of crop sales while adjacent andnonadjacent, nonmetropolitan counties accounted for28.7 and 24.1%, respectively. By 1997, the share ofmetropolitan counties had increased to 42.2% of to-tal crop sales compared with the 26.6% share of adja-cent, nonmetropolitan counties and the 31.2% shareof nonadjacent, nonmetropolitan counties. This gainin metropolitan crop sales could be attributed to as-signing 1993 metropolitan status to include countiesthat may not have been metropolitan in 1978 or in thefollowing year. Nevertheless, metropolitan countiesled other counties in total crop sales for fruits/nuts/berries, nursery/greenhouse, and vegetables/sweetcorn/melons in the past five censuses. They led insales for hay/silage/field seeds in all census years ex-cept 1978, and for cotton/cottonseed in all census yearsexcept 1997. Adjacent nonmetropolitan counties ledin tobacco sales, and nonadjacent counties consistent-ly led in grain and other crop sales and in cotton/cot-tonseed sales in 1997.
Between 1978 and 1997, total livestock/poultrysales (unadjusted dollars) increased from $57.2 billionto $94.4 billion (Appendix A, Table A.12).7 Sales oflivestock/poultry were greater than gross crop salesin every census year, except in 1997. Cattle/calf salesincreased from $29.4 billion to $40 billion. Poultryproduct sales increased the most, 155% (from $7.9 to$20.3 billion). They were followed by sales growth indairy products (from $10.9 billion to $18.6 billion),
hogs/pigs (from $7.6 billion to $12.9 billion), and oth-er livestock products (from $0.7 billion to $2 billion).Gross sales of sheep/lambs/wool were well under abillion dollars during the same period.
Metropolitan counties accounted for 28.7% of thetotal value of livestock and poultry sales in 1978, whileadjacent and nonadjacent, nonmetropolitan countiesaccounted for 31.3 and 40%, respectively. By 1997,metropolitan counties’ share had declined slightly to26% of total livestock and poultry sales, comparedwith slight increases to 32.2% by adjacent, nonmet-ropolitan counties and 41.8% by nonadjacent, nonmet-ropolitan counties. Metropolitan counties led othercounties in total sales for dairy products and otherlivestock in the past five censuses. They also led inpoultry product sales from 1987 to 1997 whereas ad-jacent, nonmetropolitan counties led in these salesprior to 1987. Nonadjacent counties led in the grosssales of cattle/calves, hogs/pigs, and sheep/lambs/woolfrom 1978 to 1997.
Myths, Stereotypes, and RealitiesRural and urban cultures tend to be separate in the
minds of U.S. residents. Treatment of the needs ofcities and of farming communities must be reassessed.Myths and stereotypes hinder the envisioning of fu-ture possibilities for agriculture’s role in addressingthe needs of rural and urban areas.
The belief that city life, centered on manufactur-ing and commerce, and rural life, centered on farm-ing, produce radically different kinds of life experience(and corresponding moral character) is ingraineddeeply in U.S. political culture. The belief dates backto Jefferson, who wrote, “Those who labour in theearth are the chosen people of God, if ever he had achosen people, in whose breasts he has made his pe-culiar deposit for substantial and genuine virtue”(1984, 290). Such praise of farming often is repeatedin U.S. politics. According to Lincoln, “No other hu-man occupation opens so wide a field for the profit-able and agreeable combination of labor with thought,as agriculture” (Ayres 1992, 4). More than a centuryafter Jefferson, Theodore Roosevelt wrote that “thepermanent greatness of any State must ultimatelydepend more upon the character of its country popu-lation than anything else” (McGovern 1967, 28). Inthe 1950s, Ezra Taft Benson, an official of the Eisen-hower administration, repeated the theme: “Ruralpeople are a bulwark against all that is aimed atweakening and destroying our American way of life”(McGovern 1967, 428).
7For Appendix A, Tables A.11 and A.12, county-level data wereused. See comments in previous footnote.
Introduction 25
Perhaps some of these quotes praising the moralcharacter of rural U.S. citizens reflect the cynicism ofpoliticians pandering for votes; nonetheless, conceptsare rooted in a political reality that framed key polit-ical decisions for several hundred years. Jefferson’spraise of farming reflected a key difference betweenhim and his main political rival, Alexander Hamilton.Hamilton represented advocates of the urban way oflife. He advocated a federal program to promote de-velopment of a manufacturing center that would be-come the central engine of economic growth for thenew republic. Jefferson advocated policies such as theLouisiana Purchase and the Lewis and Clark Expe-dition, which would open new lands for farming andorient the economic development of the young nationtowards agriculture.
Hamilton and Jefferson also espoused contrastingphilosophies of government that coincided with theirvisions of economic growth. Both feared the influenceof the urban working class, which they believed lackedthe discipline and the loyalty necessary to undertakethe sacrifices needed for long-term economic growthand development of stable political institutions.Hamilton thought that the power of the federal gov-ernment should be limited sharply and controllednarrowly by elite families, including industrialists.Jefferson believed the owners of industrial capitalwere as likely to abandon the new republic as weretheir workers. He believed that power could be sharedbroadly in an agricultural nation because farmerswere dependent on responsible and stable govern-ments to protect their primary asset, that is, land.Unlike laborers and manufacturers, farmers’ long-term economic interests coincided with the develop-ment of stable democratic institutions of governance(Thompson 2000).
Contemporary reality is far more complex thanmyths and stereotypes associating either urban orrural environments and people with certain lifestyles,values, and moral characteristics. It is difficult todocument the accuracy or origins of myths handeddown from generation to generation and to identifytheir usefulness today. Positive stereotypes, on theone hand, may be empowering, although not always;negative stereotypes can be quite the opposite, ofcourse. The demarcation between urban and ruralagriculture now may exist more profoundly in themind than on the land. In many parts of the UnitedStates, urban centers blend into suburbs, which inturn blend seamlessly into a countryside where farmsand bedroom communities exist side by side. Thesequasisuburban, quasifarming neighborhoods contrib-ute greatly to urban quality of life. Even within ur-
ban centers, various parks, gardens, and recreation-al areas such as golf courses have brought a bit of thecountryside into the urban core. As agriculture be-comes more industrialized, demand for manufacturedinputs, which are produced primarily in urban areas,increases. Scientific and governmental services sup-porting farming now are needed to support the ruralenclave within the urban landscape. These changesencourage urban and rural cooperation.
The Scope of Urban AgricultureExcept in the central Great Plains, a great deal of
U.S. agriculture occurs in counties defined as urbaninfluenced (within statistical metropolitan counties oradjacent counties). These areas contain much of thenation’s most productive agriculture and grow mostof the food eaten. In fact, 79% of U.S. fruit, 68% ofvegetables, and 52% of dairy products are producedin urban-influenced counties (Sorenson, Greene, andRuss 1997). The public perception of agriculture iscrucial because it drives the policies crafted aroundurbanism and the role that food and agriculture playin urban settings. If much of U.S. agriculture is, infact, occurring in urban and suburban areas, then itis imperative to foster a relationship between urbanand rural policymakers. Yet many people living inrural and urban areas do not recognize the value ofagriculture to their daily lives.
Beyond food production, well-managed agricultureprovides a host of nonmarket benefits such as attrac-tive landscapes, scenic views, and cultural continu-ity, as well as ecological services such as composting,carbon sequestration, remediation, wildlife habitat,and clean water. These benefits lead to recreationalopportunities that help sustain a rural way of life evenin an urban context.
All people benefit from agriculture, which is in thefabric of the urban community. Although it is not theonly component, agriculture can be a valuable contrib-utor to the solution of current and future problems oc-curring in urbanizing communities. Some applica-tions of agriculture are more direct, such asimprovement of water and soil quality, production andmarketing of food, and control of undesirable insects.Likewise, applications exist whereby agriculture’sbenefits are more indirect, such as the conservationand management of open space, which, if done sus-tainably, affords the population the opportunity toenjoy recreational pursuits, biodiverse plant life, andother quality-of-life amenities. Agriculture is a toolwith many valuable parts that can be harnessed or
26 Urban and Agricultural Communities: Opportunities for Common Ground
combined with other human or scientific resources,to serve societal needs. These direct and indirect con-tributions have unique applications in urban settings,where population and land use is more concentratedand public debate over how to resolve urban problemsis more heated.
Urban agriculture means different things to differ-ent people. In the broadest sense, it covers a sphereof social, ecological, and economic influences through-out a total metropolitan population and land area, in-cluding surrounding communities closely connectedto the system. Depending on the location, it can in-clude horticulture, aquaculture, forestry, animals
such as livestock and exotic species, insect rearing(e.g., beneficial insects) and management, tradition-al food production, and food and plant gathering.Other components include processing, landscape andother services, agribusiness and value-added activi-ties, recreation and leisure, conservation and revital-ization of natural resources, and community health.Urban agriculture is intertwined with the larger ag-ricultural system, much of which is found in nonmet-ropolitan areas. These connections are fostered byinfrastructure such as transportation systems (high-ways, airlines), computer technology, social networks,and currency exchange and investments.
Agriculture's Service Role in the Urbanizing Society 27
2 Agriculture's Service Role in the Urbanizing Society
27
IntroductionUnderstanding the agroecosystem functions and
maintaining biodiversity within the system are essen-tial to maximizing system benefits. Many agriculturalactivities (e.g., animal and plant production and pres-ervation, creation of urban planted landscapes, refor-estation of open spaces) can affect a highly interde-pendent agroecosystem. Consequently, agriculturalactivities can help to replenish and to sustain agro-ecosystems and, in turn, subsequent agroecosystemservices benefiting urban populations.
When well planned and properly integrated intothe urban environment, open space or natural areas(as opposed to built-up areas) provide valuable agro-ecosystem services to the surrounding community.Critical agroecosystem processes emanating fromnature are fundamental to the life support system onearth. Open spaces afford alternatives for water man-agement by serving as receptacles for storm water, re-charge areas for aquifers, filtration systems for sur-face waters, and storage sites for irrigation water.Water reuse (reclamation, or “gray water”) from wastetreatment facilities is used to sustain recreationalareas and to irrigate nonfood crops. Composting ac-tivities result in decreasing solid wastes from popu-lated areas and are a source of nutrients and organicmatter for urban landscapes and for rehabilitation ofdisturbed lands (e.g., mine sites, highway right-of-ways, vacant lots). Properly managed, urban greenareas can serve as wildlife habitats. Appropriate landmanagement and design practices rooted in the agri-cultural sciences are essential in applications of land-use planning, pollution abatement, site remediation,and carbon sequestration processes. When exploitedproperly through careful planning, ecosystem servic-es have measurable economic value (Costanza et al.1997); their positive effects on quality of life are diffi-cult to quantify, however.
Selected examples of agroecosystem services forwhich the agricultural sciences can contribute knowl-edge and expertise include storm water management,waste-water remediation, waste recycling (e.g., com-posting), phytoremediation, carbon sequestration, soil
retention and fertility, proper pesticide and fertilizeruse, and remediation of brownfields. While recogniz-ing that some services require further research if theirapplicability to urbanization is to be perfected, theauthors of this CAST report contend that such servic-es are a valuable part of the rural-urban agriculturalsystem.
A host of agricultural services, including water con-servation, pollution control, and environmental riskmitigation, are funded wholly or in part through fed-eral agency budgets and supported by research andeducational programs at agricultural and other uni-versities. Although these services may not be per-ceived as a form of urban agriculture, each representsa benefit provided to urban and rural residents un-der an organizational and budgetary rubric of agri-culture. Neglect of agriculture could mean, therefore,neglect of the infrastructure supporting these vitalagroecosystem services. Both rural and urban resi-dents and their legislative representatives will bene-fit from becoming better informed about how they candraw on agriculture to ensure the availability of suchvital services and functions. The increased need foragricultural services in MAs, coupled with the con-tinuing demands from traditional agricultural constit-uents, taxes current institutional systems. Thismakes it even more important for urban leaders tointeract with agricultural leaders and scientists toshare knowledge, resources, and innovative ideas foraddressing crucial urban insect and wildlife issues.
Agroecosystem Services forRestoration and Remediation
Storm Water Management
Agricultural engineering and land managementpractices offer scientifically proven methods by whichto prevent the destruction of environmentally sensi-tive areas as a result of storm water runoff. Removalof vegetation and placement of impervious surfacesand structures often change surface and subsurfacewater flow and groundwater recharge. Accelerated
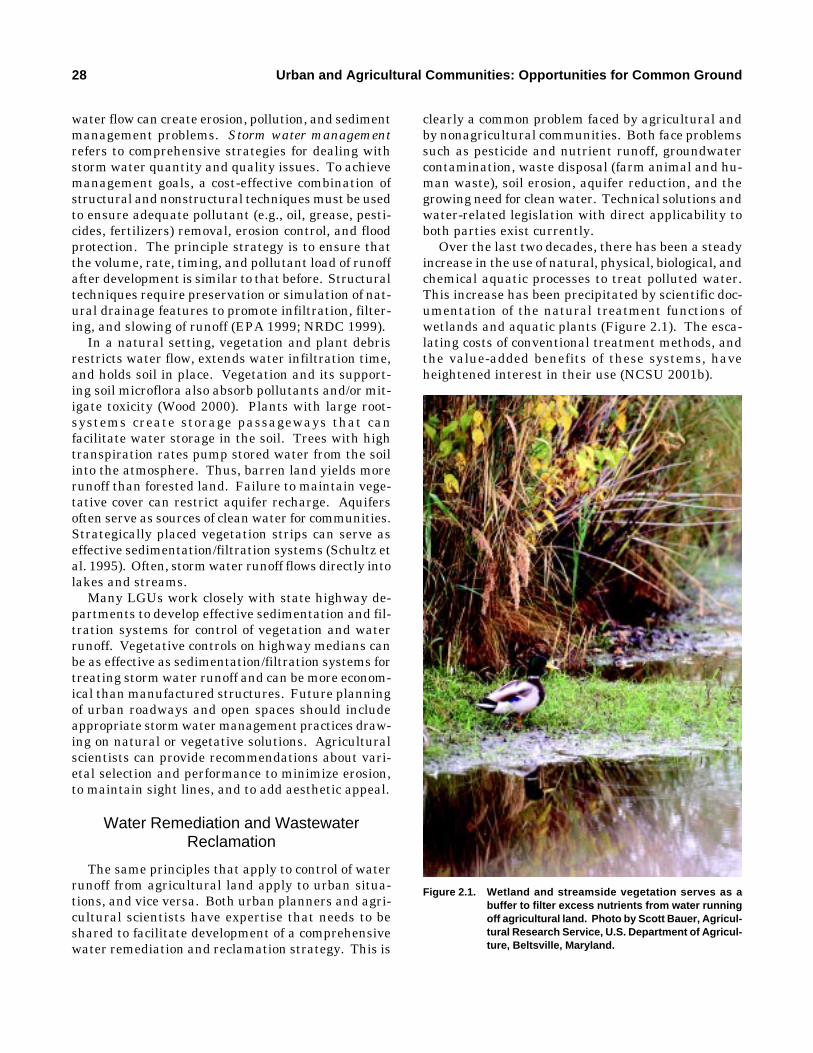
28 Urban and Agricultural Communities: Opportunities for Common Ground
water flow can create erosion, pollution, and sedimentmanagement problems. Storm water managementrefers to comprehensive strategies for dealing withstorm water quantity and quality issues. To achievemanagement goals, a cost-effective combination ofstructural and nonstructural techniques must be usedto ensure adequate pollutant (e.g., oil, grease, pesti-cides, fertilizers) removal, erosion control, and floodprotection. The principle strategy is to ensure thatthe volume, rate, timing, and pollutant load of runoffafter development is similar to that before. Structuraltechniques require preservation or simulation of nat-ural drainage features to promote infiltration, filter-ing, and slowing of runoff (EPA 1999; NRDC 1999).
In a natural setting, vegetation and plant debrisrestricts water flow, extends water infiltration time,and holds soil in place. Vegetation and its support-ing soil microflora also absorb pollutants and/or mit-igate toxicity (Wood 2000). Plants with large root-systems create storage passageways that canfacilitate water storage in the soil. Trees with hightranspiration rates pump stored water from the soilinto the atmosphere. Thus, barren land yields morerunoff than forested land. Failure to maintain vege-tative cover can restrict aquifer recharge. Aquifersoften serve as sources of clean water for communities.Strategically placed vegetation strips can serve aseffective sedimentation/filtration systems (Schultz etal. 1995). Often, storm water runoff flows directly intolakes and streams.
Many LGUs work closely with state highway de-partments to develop effective sedimentation and fil-tration systems for control of vegetation and waterrunoff. Vegetative controls on highway medians canbe as effective as sedimentation/filtration systems fortreating storm water runoff and can be more econom-ical than manufactured structures. Future planningof urban roadways and open spaces should includeappropriate storm water management practices draw-ing on natural or vegetative solutions. Agriculturalscientists can provide recommendations about vari-etal selection and performance to minimize erosion,to maintain sight lines, and to add aesthetic appeal.
Water Remediation and WastewaterReclamation
The same principles that apply to control of waterrunoff from agricultural land apply to urban situa-tions, and vice versa. Both urban planners and agri-cultural scientists have expertise that needs to beshared to facilitate development of a comprehensivewater remediation and reclamation strategy. This is
clearly a common problem faced by agricultural andby nonagricultural communities. Both face problemssuch as pesticide and nutrient runoff, groundwatercontamination, waste disposal (farm animal and hu-man waste), soil erosion, aquifer reduction, and thegrowing need for clean water. Technical solutions andwater-related legislation with direct applicability toboth parties exist currently.
Over the last two decades, there has been a steadyincrease in the use of natural, physical, biological, andchemical aquatic processes to treat polluted water.This increase has been precipitated by scientific doc-umentation of the natural treatment functions ofwetlands and aquatic plants (Figure 2.1). The esca-lating costs of conventional treatment methods, andthe value-added benefits of these systems, haveheightened interest in their use (NCSU 2001b).
Figure 2.1. Wetland and streamside vegetation serves as abuffer to filter excess nutrients from water runningoff agricultural land. Photo by Scott Bauer, Agricul-tural Research Service, U.S. Department of Agricul-ture, Beltsville, Maryland.
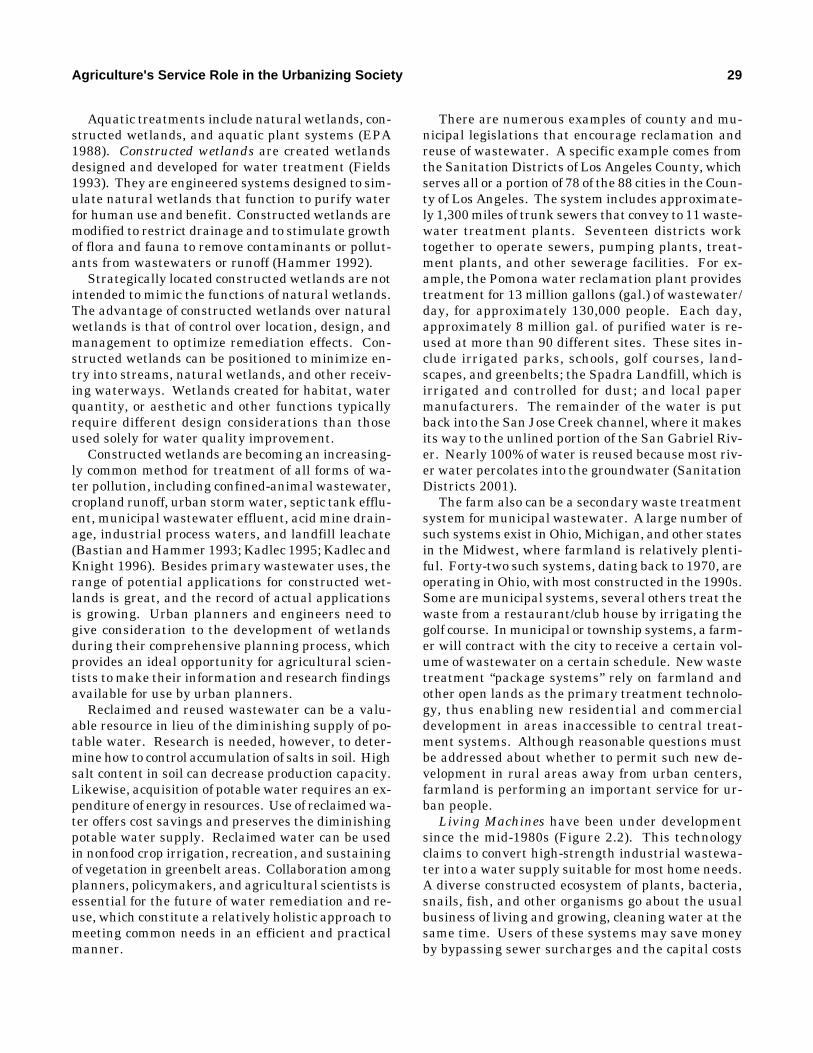
Agriculture's Service Role in the Urbanizing Society 29
Aquatic treatments include natural wetlands, con-structed wetlands, and aquatic plant systems (EPA1988). Constructed wetlands are created wetlandsdesigned and developed for water treatment (Fields1993). They are engineered systems designed to sim-ulate natural wetlands that function to purify waterfor human use and benefit. Constructed wetlands aremodified to restrict drainage and to stimulate growthof flora and fauna to remove contaminants or pollut-ants from wastewaters or runoff (Hammer 1992).
Strategically located constructed wetlands are notintended to mimic the functions of natural wetlands.The advantage of constructed wetlands over naturalwetlands is that of control over location, design, andmanagement to optimize remediation effects. Con-structed wetlands can be positioned to minimize en-try into streams, natural wetlands, and other receiv-ing waterways. Wetlands created for habitat, waterquantity, or aesthetic and other functions typicallyrequire different design considerations than thoseused solely for water quality improvement.
Constructed wetlands are becoming an increasing-ly common method for treatment of all forms of wa-ter pollution, including confined-animal wastewater,cropland runoff, urban storm water, septic tank efflu-ent, municipal wastewater effluent, acid mine drain-age, industrial process waters, and landfill leachate(Bastian and Hammer 1993; Kadlec 1995; Kadlec andKnight 1996). Besides primary wastewater uses, therange of potential applications for constructed wet-lands is great, and the record of actual applicationsis growing. Urban planners and engineers need togive consideration to the development of wetlandsduring their comprehensive planning process, whichprovides an ideal opportunity for agricultural scien-tists to make their information and research findingsavailable for use by urban planners.
Reclaimed and reused wastewater can be a valu-able resource in lieu of the diminishing supply of po-table water. Research is needed, however, to deter-mine how to control accumulation of salts in soil. Highsalt content in soil can decrease production capacity.Likewise, acquisition of potable water requires an ex-penditure of energy in resources. Use of reclaimed wa-ter offers cost savings and preserves the diminishingpotable water supply. Reclaimed water can be usedin nonfood crop irrigation, recreation, and sustainingof vegetation in greenbelt areas. Collaboration amongplanners, policymakers, and agricultural scientists isessential for the future of water remediation and re-use, which constitute a relatively holistic approach tomeeting common needs in an efficient and practicalmanner.
There are numerous examples of county and mu-nicipal legislations that encourage reclamation andreuse of wastewater. A specific example comes fromthe Sanitation Districts of Los Angeles County, whichserves all or a portion of 78 of the 88 cities in the Coun-ty of Los Angeles. The system includes approximate-ly 1,300 miles of trunk sewers that convey to 11 waste-water treatment plants. Seventeen districts worktogether to operate sewers, pumping plants, treat-ment plants, and other sewerage facilities. For ex-ample, the Pomona water reclamation plant providestreatment for 13 million gallons (gal.) of wastewater/day, for approximately 130,000 people. Each day,approximately 8 million gal. of purified water is re-used at more than 90 different sites. These sites in-clude irrigated parks, schools, golf courses, land-scapes, and greenbelts; the Spadra Landfill, which isirrigated and controlled for dust; and local papermanufacturers. The remainder of the water is putback into the San Jose Creek channel, where it makesits way to the unlined portion of the San Gabriel Riv-er. Nearly 100% of water is reused because most riv-er water percolates into the groundwater (SanitationDistricts 2001).
The farm also can be a secondary waste treatmentsystem for municipal wastewater. A large number ofsuch systems exist in Ohio, Michigan, and other statesin the Midwest, where farmland is relatively plenti-ful. Forty-two such systems, dating back to 1970, areoperating in Ohio, with most constructed in the 1990s.Some are municipal systems, several others treat thewaste from a restaurant/club house by irrigating thegolf course. In municipal or township systems, a farm-er will contract with the city to receive a certain vol-ume of wastewater on a certain schedule. New wastetreatment “package systems” rely on farmland andother open lands as the primary treatment technolo-gy, thus enabling new residential and commercialdevelopment in areas inaccessible to central treat-ment systems. Although reasonable questions mustbe addressed about whether to permit such new de-velopment in rural areas away from urban centers,farmland is performing an important service for ur-ban people.
Living Machines have been under developmentsince the mid-1980s (Figure 2.2). This technologyclaims to convert high-strength industrial wastewa-ter into a water supply suitable for most home needs.A diverse constructed ecosystem of plants, bacteria,snails, fish, and other organisms go about the usualbusiness of living and growing, cleaning water at thesame time. Users of these systems may save moneyby bypassing sewer surcharges and the capital costs
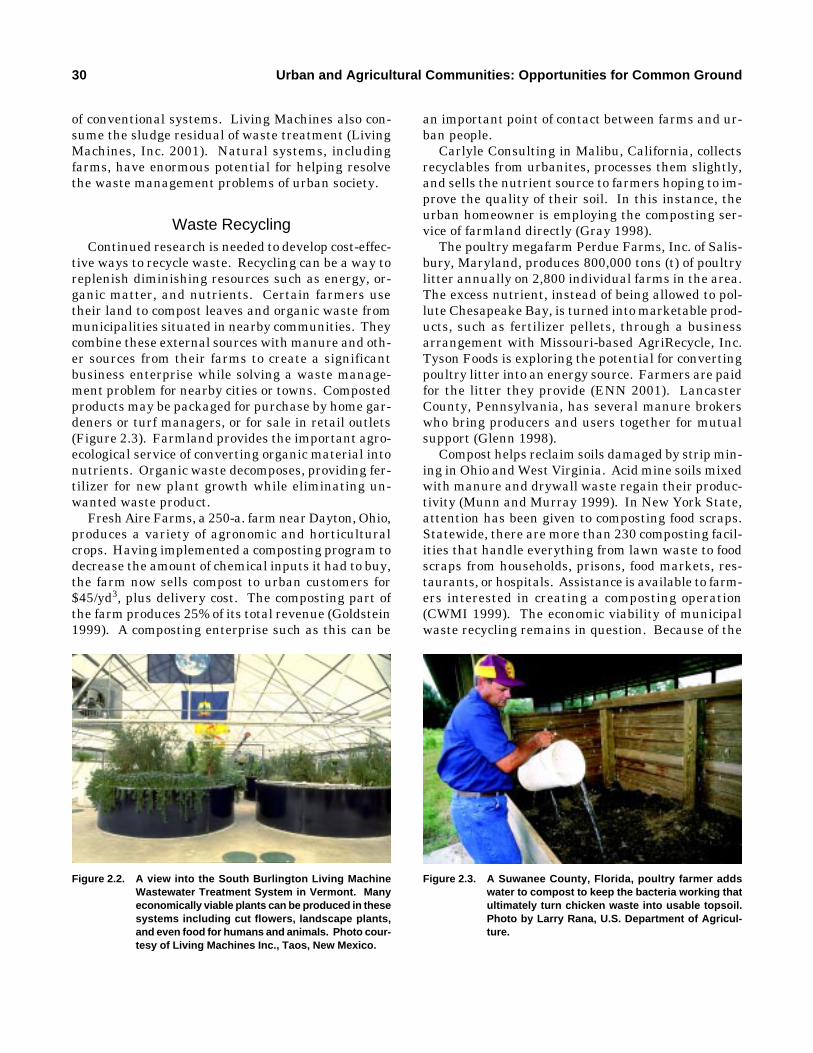
30 Urban and Agricultural Communities: Opportunities for Common Ground
of conventional systems. Living Machines also con-sume the sludge residual of waste treatment (LivingMachines, Inc. 2001). Natural systems, includingfarms, have enormous potential for helping resolvethe waste management problems of urban society.
Waste RecyclingContinued research is needed to develop cost-effec-
tive ways to recycle waste. Recycling can be a way toreplenish diminishing resources such as energy, or-ganic matter, and nutrients. Certain farmers usetheir land to compost leaves and organic waste frommunicipalities situated in nearby communities. Theycombine these external sources with manure and oth-er sources from their farms to create a significantbusiness enterprise while solving a waste manage-ment problem for nearby cities or towns. Compostedproducts may be packaged for purchase by home gar-deners or turf managers, or for sale in retail outlets(Figure 2.3). Farmland provides the important agro-ecological service of converting organic material intonutrients. Organic waste decomposes, providing fer-tilizer for new plant growth while eliminating un-wanted waste product.
Fresh Aire Farms, a 250-a. farm near Dayton, Ohio,produces a variety of agronomic and horticulturalcrops. Having implemented a composting program todecrease the amount of chemical inputs it had to buy,the farm now sells compost to urban customers for$45/yd3, plus delivery cost. The composting part ofthe farm produces 25% of its total revenue (Goldstein1999). A composting enterprise such as this can be
an important point of contact between farms and ur-ban people.
Carlyle Consulting in Malibu, California, collectsrecyclables from urbanites, processes them slightly,and sells the nutrient source to farmers hoping to im-prove the quality of their soil. In this instance, theurban homeowner is employing the composting ser-vice of farmland directly (Gray 1998).
The poultry megafarm Perdue Farms, Inc. of Salis-bury, Maryland, produces 800,000 tons (t) of poultrylitter annually on 2,800 individual farms in the area.The excess nutrient, instead of being allowed to pol-lute Chesapeake Bay, is turned into marketable prod-ucts, such as fertilizer pellets, through a businessarrangement with Missouri-based AgriRecycle, Inc.Tyson Foods is exploring the potential for convertingpoultry litter into an energy source. Farmers are paidfor the litter they provide (ENN 2001). LancasterCounty, Pennsylvania, has several manure brokerswho bring producers and users together for mutualsupport (Glenn 1998).
Compost helps reclaim soils damaged by strip min-ing in Ohio and West Virginia. Acid mine soils mixedwith manure and drywall waste regain their produc-tivity (Munn and Murray 1999). In New York State,attention has been given to composting food scraps.Statewide, there are more than 230 composting facil-ities that handle everything from lawn waste to foodscraps from households, prisons, food markets, res-taurants, or hospitals. Assistance is available to farm-ers interested in creating a composting operation(CWMI 1999). The economic viability of municipalwaste recycling remains in question. Because of the
Figure 2.3. A Suwanee County, Florida, poultry farmer addswater to compost to keep the bacteria working thatultimately turn chicken waste into usable topsoil.Photo by Larry Rana, U.S. Department of Agricul-ture.
Figure 2.2. A view into the South Burlington Living MachineWastewater Treatment System in Vermont. Manyeconomically viable plants can be produced in thesesystems including cut flowers, landscape plants,and even food for humans and animals. Photo cour-tesy of Living Machines Inc., Taos, New Mexico.
Agriculture's Service Role in the Urbanizing Society 31
cost of separate collection services and the difficultyof establishing reliable market outlets, many munic-ipalities must struggle to make composting programsviable.
Carbon SequestrationA new entrepreneurial opportunity exists for agri-
culture to work with industries and communities thatgenerate significant carbon dioxide (CO2) emissions.Sequestering carbon can be a beneficial strategy foragriculture, MAs, and the environment. Municipali-ties generate significant CO2 emissions through en-ergy generation and burning of fossil fuels. Carbonfarming offers an opportunity for farmers to workclosely with municipalities to help mitigate CO2 at-mospheric concentrations through planned carbonsequestration practices. Estimates indicate that thepotential for a carbon market for U.S. agriculturecould reach $5 billion/yr for the next 30 to 40 yr (Con-sortium 2001).
The carbon cycle, one of the central processes in theecosystem, transfers carbon between organisms, soils,and the atmosphere. Most living matter is water;what remains is composed mainly of carbon-basedmolecules, especially compounds used in energytransfer and storage. Stored energy is released whencarbon compounds are oxidized to CO2 by means ofmetabolic reactions. Carbon dioxide from the atmo-sphere is recycled into more complex carbon com-pounds by plants and other autotrophic (self-feeding)life forms. Some carbon is recycled immediately; someis stored in ocean sediments, soils, and plant biom-ass. Plants, for example, store significant amountsof carbon. Subsequently, planting a range of crops(e.g., forest, horticulture, agronomic) absorbs andstores atmospheric carbon.
As a result of population growth and associated hu-man activities, atmospheric CO2 has increased great-ly, from 260 parts per million (ppm) to > 370 ppm sincethe 1800s (Lal, Kimble, and Follett 1997). As a re-sult of power generation and fossil fuel emissions,nearly six billion t/yr of carbon is released into theworld’s atmosphere. Approximately 100 billion t/yris released naturally (FAO 2001). Continued disrup-tion of natural carbon sinks (e.g., forests and othervegetated areas) will decrease the ability of CO2 to berecycled and fixed as biomass (sequestered) from theatmosphere. Atmospheric carbon dioxide is a green-house gas crucial to maintaining a heat balance onearth. As concentrations increase, planet tempera-tures can increase. Carbon sequestration (removal of
CO2) mitigates global temperature change and im-proves soil quality. Conservation and vegetationmanagement practices that preserve rural and urbanforests and green spaces not only aid in the seques-tration process but also enhance water quality bydecreasing water runoff and nonpoint source pollutionand providing wildlife habitat.
Measuring carbon storage is difficult. Research isneeded to clarify the working of the carbon cycle andto determine how soil and plants contribute to it. Forexample, how much biomass is needed to sustain aCO2 balance? What cropping systems and plant va-rieties offer the greatest potential to fix carbon? Whatrole do soils play in the carbon cycling process (e.g.,what are the roles of soil respiration and structure,contributions from roots and microorganisms, and therates of carbon transfer between active and resistantfractions of stored carbon [Lal, Kimble, and Follett1997])? Although debate continues as to whetherurban environments can affect global carbon recy-cling, research has yet to demonstrate whether thereis a potential for this if a collective carbon recyclingprocess was adopted by many urban centers. Farm-ers can benefit by selling crops that sequester carbonor other crop byproducts (e.g., ethanol, methane) toutility companies as a source of fuel. Through appro-priate agricultural research, an opportunity exists toachieve a more harmonious balance between use ofand sequestration of carbon.
Remediation of BrownfieldsAgriculture is well positioned to provide assistance
in remediation of brownfields. Brownfields are aban-doned, idled, or under-used industrial or commercialsites in which real or perceived environmental con-tamination occurs. The EPA (2000) estimated thatthere are as many as 500,000 brownfield sites acrossthe country.
Current or former industrial sites, or brownfields,can be polluted with a range of environmentally harm-ful substances, including heavy metals. A great needfor inexpensive and efficient cleanup (remediation)technologies exists to restore these sites for produc-tive use. There are two main biological methods ofremediation: (1) bioremediation, which uses microbesto break down or immobilize toxic compounds, and (2)phytoremediation, which uses plants to accumulatecontaminates and/or to break down waste into lessharmful products (Irvine 1999). Although remedia-tion technologies still are in their infancy, they offermuch promise in dealing with environmentally toxic
32 Urban and Agricultural Communities: Opportunities for Common Ground
situations. In addition to this obvious advantage,increasing vegetation in urban environments contrib-utes positively to air quality and to open space avail-ability.
Further research is needed to determine bioreme-diation efficiency and its effect on the food chain, airquality, and economic feasibility. The phytoremedi-ation market in the United States was expected toexpand from $16.5 million to $29.5 million in 1998 andfrom $55 million to $103 million in 2000, and is ex-pected to expand from $214 million to $370 million
by 2005 (Black 1999).Remediation of brownfields and subsequent reuse
can provide economic and environmental benefits tocommunities. Reusing brownfields discourages urbansprawl while retaining or creating new jobs for com-munities. Redeveloped properties serve as a tax-gen-erating revenue, but the need of municipalities togenerate short-term revenue has discouraged adop-tion of remediation processes. Research is needed todevelop ways in which to accelerate the remediationprocess to ensure enhanced cost-effectiveness.
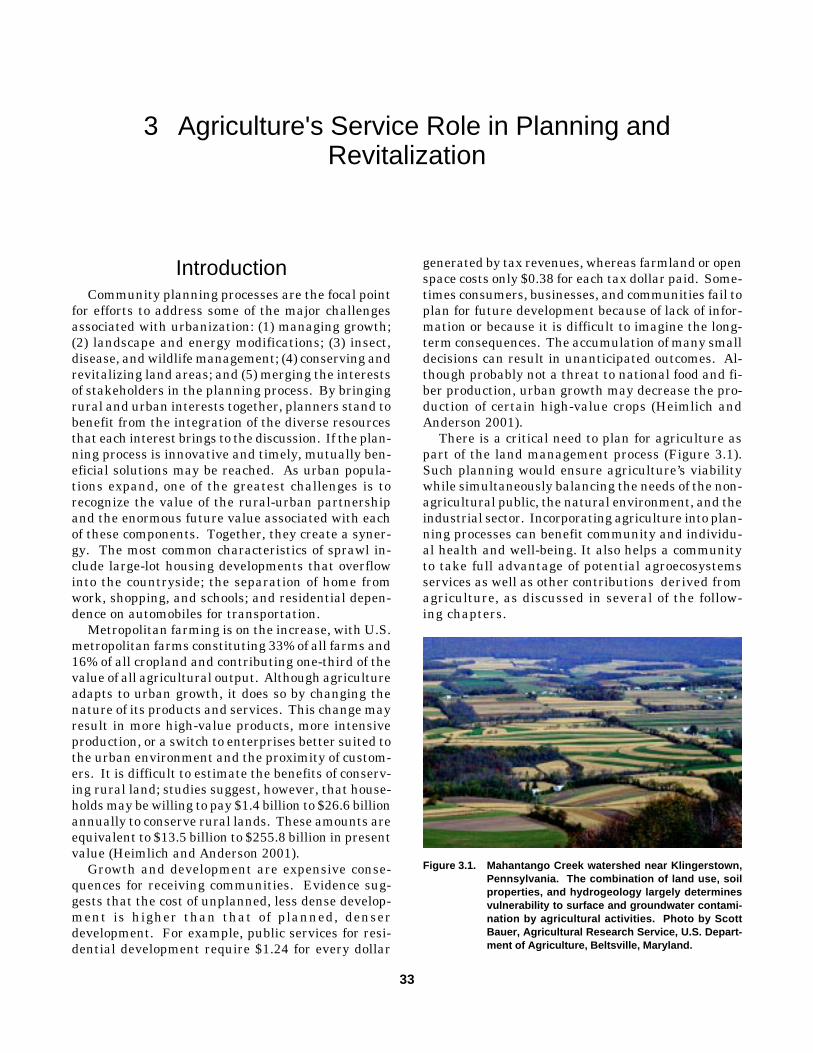
Agriculture's Service Role in Planning and Revitalization 33
3 Agriculture's Service Role in Planning andRevitalization
33
IntroductionCommunity planning processes are the focal point
for efforts to address some of the major challengesassociated with urbanization: (1) managing growth;(2) landscape and energy modifications; (3) insect,disease, and wildlife management; (4) conserving andrevitalizing land areas; and (5) merging the interestsof stakeholders in the planning process. By bringingrural and urban interests together, planners stand tobenefit from the integration of the diverse resourcesthat each interest brings to the discussion. If the plan-ning process is innovative and timely, mutually ben-eficial solutions may be reached. As urban popula-tions expand, one of the greatest challenges is torecognize the value of the rural-urban partnershipand the enormous future value associated with eachof these components. Together, they create a syner-gy. The most common characteristics of sprawl in-clude large-lot housing developments that overflowinto the countryside; the separation of home fromwork, shopping, and schools; and residential depen-dence on automobiles for transportation.
Metropolitan farming is on the increase, with U.S.metropolitan farms constituting 33% of all farms and16% of all cropland and contributing one-third of thevalue of all agricultural output. Although agricultureadapts to urban growth, it does so by changing thenature of its products and services. This change mayresult in more high-value products, more intensiveproduction, or a switch to enterprises better suited tothe urban environment and the proximity of custom-ers. It is difficult to estimate the benefits of conserv-ing rural land; studies suggest, however, that house-holds may be willing to pay $1.4 billion to $26.6 billionannually to conserve rural lands. These amounts areequivalent to $13.5 billion to $255.8 billion in presentvalue (Heimlich and Anderson 2001).
Growth and development are expensive conse-quences for receiving communities. Evidence sug-gests that the cost of unplanned, less dense develop-ment is higher than that of planned, denserdevelopment. For example, public services for resi-dential development require $1.24 for every dollar
generated by tax revenues, whereas farmland or openspace costs only $0.38 for each tax dollar paid. Some-times consumers, businesses, and communities fail toplan for future development because of lack of infor-mation or because it is difficult to imagine the long-term consequences. The accumulation of many smalldecisions can result in unanticipated outcomes. Al-though probably not a threat to national food and fi-ber production, urban growth may decrease the pro-duction of certain high-value crops (Heimlich andAnderson 2001).
There is a critical need to plan for agriculture aspart of the land management process (Figure 3.1).Such planning would ensure agriculture’s viabilitywhile simultaneously balancing the needs of the non-agricultural public, the natural environment, and theindustrial sector. Incorporating agriculture into plan-ning processes can benefit community and individu-al health and well-being. It also helps a communityto take full advantage of potential agroecosystemsservices as well as other contributions derived fromagriculture, as discussed in several of the follow-ing chapters.
Figure 3.1. Mahantango Creek watershed near Klingerstown,Pennsylvania. The combination of land use, soilproperties, and hydrogeology largely determinesvulnerability to surface and groundwater contami-nation by agricultural activities. Photo by ScottBauer, Agricultural Research Service, U.S. Depart-ment of Agriculture, Beltsville, Maryland.
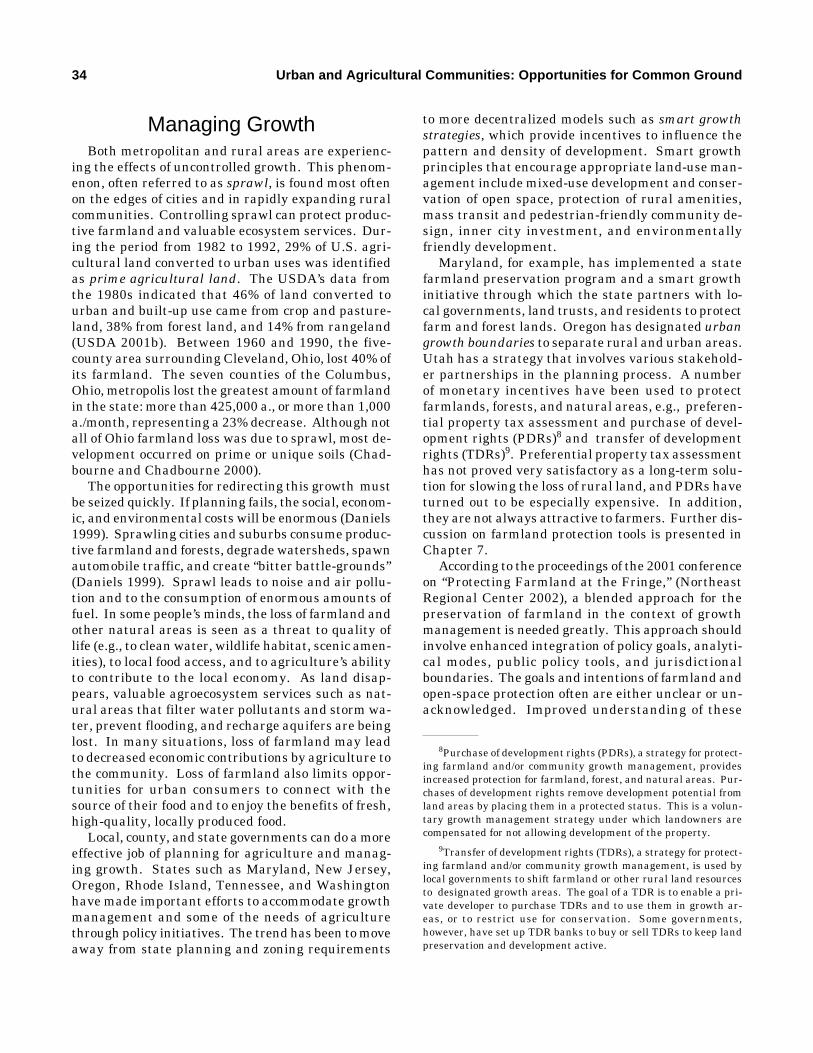
34 Urban and Agricultural Communities: Opportunities for Common Ground
Managing GrowthBoth metropolitan and rural areas are experienc-
ing the effects of uncontrolled growth. This phenom-enon, often referred to as sprawl, is found most oftenon the edges of cities and in rapidly expanding ruralcommunities. Controlling sprawl can protect produc-tive farmland and valuable ecosystem services. Dur-ing the period from 1982 to 1992, 29% of U.S. agri-cultural land converted to urban uses was identifiedas prime agricultural land. The USDA’s data fromthe 1980s indicated that 46% of land converted tourban and built-up use came from crop and pasture-land, 38% from forest land, and 14% from rangeland(USDA 2001b). Between 1960 and 1990, the five-county area surrounding Cleveland, Ohio, lost 40% ofits farmland. The seven counties of the Columbus,Ohio, metropolis lost the greatest amount of farmlandin the state: more than 425,000 a., or more than 1,000a./month, representing a 23% decrease. Although notall of Ohio farmland loss was due to sprawl, most de-velopment occurred on prime or unique soils (Chad-bourne and Chadbourne 2000).
The opportunities for redirecting this growth mustbe seized quickly. If planning fails, the social, econom-ic, and environmental costs will be enormous (Daniels1999). Sprawling cities and suburbs consume produc-tive farmland and forests, degrade watersheds, spawnautomobile traffic, and create “bitter battle-grounds”(Daniels 1999). Sprawl leads to noise and air pollu-tion and to the consumption of enormous amounts offuel. In some people’s minds, the loss of farmland andother natural areas is seen as a threat to quality oflife (e.g., to clean water, wildlife habitat, scenic amen-ities), to local food access, and to agriculture’s abilityto contribute to the local economy. As land disap-pears, valuable agroecosystem services such as nat-ural areas that filter water pollutants and storm wa-ter, prevent flooding, and recharge aquifers are beinglost. In many situations, loss of farmland may leadto decreased economic contributions by agriculture tothe community. Loss of farmland also limits oppor-tunities for urban consumers to connect with thesource of their food and to enjoy the benefits of fresh,high-quality, locally produced food.
Local, county, and state governments can do a moreeffective job of planning for agriculture and manag-ing growth. States such as Maryland, New Jersey,Oregon, Rhode Island, Tennessee, and Washingtonhave made important efforts to accommodate growthmanagement and some of the needs of agriculturethrough policy initiatives. The trend has been to moveaway from state planning and zoning requirements
to more decentralized models such as smart growthstrategies, which provide incentives to influence thepattern and density of development. Smart growthprinciples that encourage appropriate land-use man-agement include mixed-use development and conser-vation of open space, protection of rural amenities,mass transit and pedestrian-friendly community de-sign, inner city investment, and environmentallyfriendly development.
Maryland, for example, has implemented a statefarmland preservation program and a smart growthinitiative through which the state partners with lo-cal governments, land trusts, and residents to protectfarm and forest lands. Oregon has designated urbangrowth boundaries to separate rural and urban areas.Utah has a strategy that involves various stakehold-er partnerships in the planning process. A numberof monetary incentives have been used to protectfarmlands, forests, and natural areas, e.g., preferen-tial property tax assessment and purchase of devel-opment rights (PDRs)8 and transfer of developmentrights (TDRs)9. Preferential property tax assessmenthas not proved very satisfactory as a long-term solu-tion for slowing the loss of rural land, and PDRs haveturned out to be especially expensive. In addition,they are not always attractive to farmers. Further dis-cussion on farmland protection tools is presented inChapter 7.
According to the proceedings of the 2001 conferenceon “Protecting Farmland at the Fringe,” (NortheastRegional Center 2002), a blended approach for thepreservation of farmland in the context of growthmanagement is needed greatly. This approach shouldinvolve enhanced integration of policy goals, analyti-cal modes, public policy tools, and jurisdictionalboundaries. The goals and intentions of farmland andopen-space protection often are either unclear or un-acknowledged. Improved understanding of these
8Purchase of development rights (PDRs), a strategy for protect-ing farmland and/or community growth management, providesincreased protection for farmland, forest, and natural areas. Pur-chases of development rights remove development potential fromland areas by placing them in a protected status. This is a volun-tary growth management strategy under which landowners arecompensated for not allowing development of the property.
9Transfer of development rights (TDRs), a strategy for protect-ing farmland and/or community growth management, is used bylocal governments to shift farmland or other rural land resourcesto designated growth areas. The goal of a TDR is to enable a pri-vate developer to purchase TDRs and to use them in growth ar-eas, or to restrict use for conservation. Some governments,however, have set up TDR banks to buy or sell TDRs to keep landpreservation and development active.
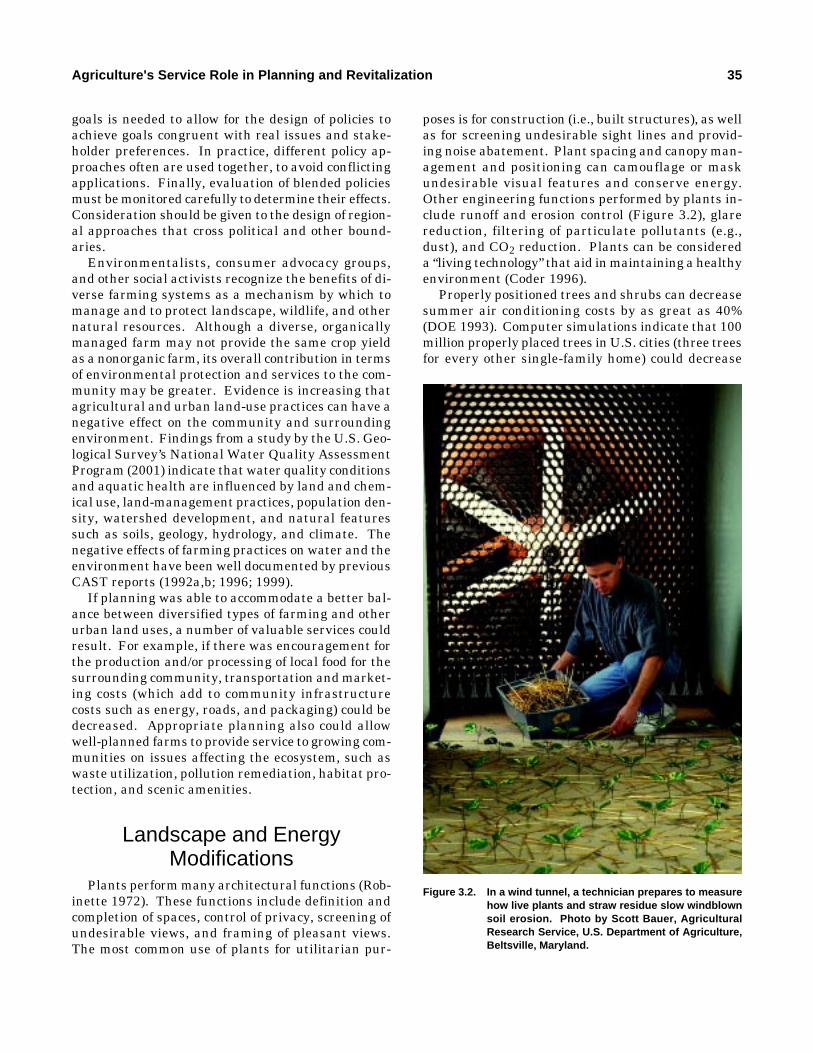
Agriculture's Service Role in Planning and Revitalization 35
goals is needed to allow for the design of policies toachieve goals congruent with real issues and stake-holder preferences. In practice, different policy ap-proaches often are used together, to avoid conflictingapplications. Finally, evaluation of blended policiesmust be monitored carefully to determine their effects.Consideration should be given to the design of region-al approaches that cross political and other bound-aries.
Environmentalists, consumer advocacy groups,and other social activists recognize the benefits of di-verse farming systems as a mechanism by which tomanage and to protect landscape, wildlife, and othernatural resources. Although a diverse, organicallymanaged farm may not provide the same crop yieldas a nonorganic farm, its overall contribution in termsof environmental protection and services to the com-munity may be greater. Evidence is increasing thatagricultural and urban land-use practices can have anegative effect on the community and surroundingenvironment. Findings from a study by the U.S. Geo-logical Survey’s National Water Quality AssessmentProgram (2001) indicate that water quality conditionsand aquatic health are influenced by land and chem-ical use, land-management practices, population den-sity, watershed development, and natural featuressuch as soils, geology, hydrology, and climate. Thenegative effects of farming practices on water and theenvironment have been well documented by previousCAST reports (1992a,b; 1996; 1999).
If planning was able to accommodate a better bal-ance between diversified types of farming and otherurban land uses, a number of valuable services couldresult. For example, if there was encouragement forthe production and/or processing of local food for thesurrounding community, transportation and market-ing costs (which add to community infrastructurecosts such as energy, roads, and packaging) could bedecreased. Appropriate planning also could allowwell-planned farms to provide service to growing com-munities on issues affecting the ecosystem, such aswaste utilization, pollution remediation, habitat pro-tection, and scenic amenities.
Landscape and EnergyModifications
Plants perform many architectural functions (Rob-inette 1972). These functions include definition andcompletion of spaces, control of privacy, screening ofundesirable views, and framing of pleasant views.The most common use of plants for utilitarian pur-
poses is for construction (i.e., built structures), as wellas for screening undesirable sight lines and provid-ing noise abatement. Plant spacing and canopy man-agement and positioning can camouflage or maskundesirable visual features and conserve energy.Other engineering functions performed by plants in-clude runoff and erosion control (Figure 3.2), glarereduction, filtering of particulate pollutants (e.g.,dust), and CO2 reduction. Plants can be considereda “living technology” that aid in maintaining a healthyenvironment (Coder 1996).
Properly positioned trees and shrubs can decreasesummer air conditioning costs by as great as 40%(DOE 1993). Computer simulations indicate that 100million properly placed trees in U.S. cities (three treesfor every other single-family home) could decrease
Figure 3.2. In a wind tunnel, a technician prepares to measurehow live plants and straw residue slow windblownsoil erosion. Photo by Scott Bauer, AgriculturalResearch Service, U.S. Department of Agriculture,Beltsville, Maryland.
36 Urban and Agricultural Communities: Opportunities for Common Ground
annual energy use by 30 billion kilowatt hours (kWh),leading to savings of approximately $2 million in en-ergy costs (Huang et al. 1987). Further, simulationsby McPherson and Rowntree (1993) indicate that asingle properly placed 25-ft tall tree can decreaseannual heating and cooling costs of a typical residenceby 8 to 12%. Extrapolating nationwide, this practicewould result in savings of approximately $1 billion.In addition to influencing energy use by shading,plantings also can affect heating and cooling by alter-ing air movement around buildings. Furthermore,plants can contribute multiple benefits such as de-creasing glare and influencing temperature by tran-spirational cooling (evaporation of moisture at the leafsurface). For example, a green bermudagrass turfcanopy decreases glare and can have a maximumdaily temperature that is 39˚C cooler than a syntheticsurface (Beard and Green 1994). Computer simula-tions for cities across the United States indicate thattranspirational cooling decreases annual cooling en-ergy demand by 2 to 8% (McPherson and Simpson1995). The most significant savings are in the west-ern United States, where low relative humidity im-proves transpirational cooling. For example, in Sac-ramento County, California, the urban forest isresponsible for an annual air conditioning savings ofapproximately $18.5 million (Simpson 1998).
Indoor-Outdoor Air QualityFiltering capacity of plants can improve both indoor
and outdoor air quality; for example, a tree canopy canameliorate parking lot temperatures. The canopydensity has been included in models to predict motorvehicle emissions (Scott, Simpson, and McPherson1999).
Studies on indoor air quality show that plants maycontribute to reduction in “sick building” syndrome.The National Aeronautics and Space Administrationfunded early studies on the use of plants to clean theair in space stations. Common interior plants werehighly effective in removing formaldehyde from sealedchambers (Wolverton, McDonald, and Watkins 1984).Further work documented similar effects with addi-tional pollutants, including carbon monoxide (Wolver-ton, McDonald, and Mesick 1985), and began to doc-ument the mechanisms involved (Wolverton, Johnson,and Bounds 1989). One researcher looked at the abil-ity of interior plants to affect indoor relative humidi-ty (Figure 3.3) (Lohr 1992a,b). Plants in these stud-ies did not contribute excessive humidity to interiors,which might damage building materials, but did raiserelative humidity to levels within the range recom-
mended for human health. Lohr and Pearson-Mims(1996) studied the influence of interior plants on dust,showing that adding plants to the periphery of a roomdecreased particulate matter deposition by as muchas 20%. Other contributions include cleansing of airby slowing particulate materials (e.g., pollens, pollut-ants), absorption of carbon monoxide, and generationof oxygen. In one urban park (524 a.), tree cover wasfound to remove 48 pounds (lb) of particulates, 9 lbnitrogen dioxide, 6 lb sulphur dioxide, and 1 lb car-bon monoxide daily (Coder 1996).
Insect, Disease, and WildlifeManagement
Humans have altered environments through phys-ical disruption or importation of new insect and ani-
Figure 3.3. Technicians at the base of a 3-story rainfall simula-tor study rainfall interception by foliage. Photo byScott Bauer, Agricultural Research Service, U.S.Department of Agriculture, Beltsville, Maryland.
Agriculture's Service Role in Planning and Revitalization 37
mal species. Thus the ecological balance has beendisrupted, sometimes leading to the creation of habi-tats that either establish new insect or wildlife popu-lations or stimulate existing population growth ordecline. These alterations can have direct or indirectsocial and economic consequences. Maintaining hu-man health and safety and protection of the landscapenecessitates broad knowledge of the entire agroeco-logical system.
Urban entomology, plant pathology, and wildlifemanagement—three of the agricultural sciences—involve the management of insects, spiders, diseas-es, and animal populations (domestic and natural) liv-ing in association with humans and domesticatedpets. Knowledge from this field becomes more impor-tant as the population shifts to urban centers. Insects,diseases, and animals associated with structures andwith domestic and landscape environments can havea direct effect on the quality and safety of life. Thereare both tangible and intangible benefits, as well asreal costs, associated with creating a balanced wild-life, disease, and insect management strategy, wheth-er in an urban or rural situation.
The quantified economic benefits of wildlife in theurban environment are not readily available. In theircontinued pursuit of food, however, wild animals actas scavengers by cleaning up animal road kills andby eating copious amounts of insects. For example,although bats are among the most feared and leastregarded mammals, they are one of the major preda-tors of night-flying insects such as mosquitoes, gypsymoths, and Japanese beetles (BCI 2001). One bat caneat 600 to 1,000 mosquito-sized insects in one hour(hr). Besides eating insects, bats pollinate plants suchas the saguaro cactus. Without bats to pollinate it,the desert ecosystem can be at risk (NCSU 2001a).One bat can easily eat 20 female corn earworm mothsin a night, and each moth can lay as many as 500 eggs,potentially producing 10,000 crop-damaging caterpil-lars. As few as 8 caterpillars/100 plants can force afarmer to apply pesticides.
A cooperative effort between the U.S. Golf Associ-ation and Audubon International promotes ecological-ly sound land management, as well as the conserva-tion of natural resources. The positive effect of thiseffort extends beyond the boundaries of the golf courseand benefits the surrounding community. AudubonInternational (2001) provides each golf course withone-on-one assistance for development of an environ-mental plan. Golf courses must fulfill the followingrequirements: (1) a written environmental plan; (2)a wildlife and habitat management plan to providehabitat for wildlife; (3) public involvement to create
awareness through education; (4) integrated pestmanagement; (5) water conservation directed towardirrigation, recapture, reuse, variety selection, andmaintenance; and (6) water quality managementstrategies.
The economic effects of urban wildlife and insectsare explored most frequently in terms of the damagecosts incurred by their presence. For example, accord-ing to a report by Curtis (2001), deer in suburbanlandscapes cause significant economic losses to resi-dential landowners, present safety hazards, and areagents for transmission of Lyme disease. Curtis(2001) estimates that deer numbers in local parks andsuburban landscapes may continue to double everytwo to three years, as long as forage is available, un-less some form of control is implemented. If peoplechoose not to take action, much greater expense willbe incurred later. Based on homeowner surveys, wild-life damage has been estimated at $3.8 billion annu-ally, with 4% of respondents reporting problems withdeer (2.4 million households). These data indicatethat deer damage alone may cost homeowners approx-imately $251 million/yr. A conservative estimate ofthe total number of deer-related vehicle accidentsnationwide is 1.5 million annually, with vehicle repair(in 1993 dollars) averaging $1,577. The 726,000 ac-cidents actually reported represent approximately$1.1 billion annually, less than half the estimatedcost. The Centers for Disease Control and Preventionindicated that between 12,000 and 14,000 cases ofLyme disease have been reported annually in theUnited States since 1994 (Curtis 2001).
The creation of new environments changes the na-ture and existence of pests over time. For example,more diverse landscape plantings provide a greaterdiversity of pests. Urban gardening creates food forrabbits and insects and habitat for other pests. De-velopment of recreational areas encourages new or dif-ferent insects and other urban wildlife. Increasednumbers of food-related establishments (e.g., ware-houses, vendors, containers, processing plants, gro-ceries, restaurants, cafeterias) in urban areas expandpest habitat. Building heating and cooling systemsallows tropical and semitropical pests to flourish atnorthern and southern extreme latitudes (Keith1997).
Waste and water management and artificial im-poundment for water runoff create habitat for aquat-ic insects such as midges and mosquitoes. Problemswith waste disposal include inadequate sewers, gar-bage facilities, and landfills, leading to selectivity ofgarbage collection. Lawn clippings no longer accept-ed by many cities can produce stable-fly problems
38 Urban and Agricultural Communities: Opportunities for Common Ground
caused by improper composting. Examples of insectsand animals creating health and economic problemsin urban areas include houseflies, stable flies, hornflies, ants, mosquitoes, moths, fleas, ticks, cockroach-es, termites, turf and ornamental pests, opossums,rats, mice, rabbits, deer, and raccoons. Also, wildlifefeces can cause bacterial water pollution, especiallywhen it rains.
Agricultural science is positioned to address theaforementioned issues. Areas of entomology, horti-culture, plant pathology, veterinary medicine, animaland range sciences, and rural sociology can assist inthe mitigation and management of undesirable in-sects, diseases, and wildlife that affect the health andwell-being of natural habitats, humans, and domes-ticated animals. For example, agricultural scientistsare developing vaccines for Lyme disease. Addition-al agricultural research is needed to address the grow-ing insect, disease, and wildlife problems in urbanareas. Research topics could include the following:
• isolation and identification of natural products(e.g., plant extracts, animal derivatives, andwaste products) for pest control;
• chemical and behavioral ecology of insect, disease,and animal pests and their parasites for biologi-cal control programs;
• computer-aided decision making and problemsolving in urban pest management;
• integrated pest management (IPM) programs forstructural, ornamental, and nuisance pests;
• forecasting and management schemes for mosqui-to and other insect, disease, and animal popula-tions;
• insect and animal growth and reproductive reg-ulators and other reproductive control technolo-gies;
• health and environmental impact analyses of pes-ticide application; and
• social, cultural, and economic impact analyses ofpests that adversely affect animal and humanpopulations.
Conserving and Revitalizing LandAreas
In the last twenty to thirty years there has beenincreasing public interest in the conservation of ru-ral areas. Sometimes this interest has meant conser-vation of farmland for the production of food. In oth-er instances, farmland has been seen as an amenity
with scenic or recreational value, or has been viewedas having high economic development potential. Thebenefits of conserving rural land are often difficult toestimate because they differ depending upon the cir-cumstances. Land conservation also has become apotentially divisive issue because of differing stake-holder values.
Disagreement over land and natural resource pro-tection has made it especially important to createopportunities for broad stakeholder participation inplanning processes. American Farmland Trust rec-ommends a strategic approach that analyzes the landcharacteristics and the desired objectives and purpos-es. Some of the questions to be asked include: Whatare the ideal qualities of the farmland that is to beprotected? How much of the land needs to be protect-ed? What public interests will be served? Farmlandprotection is an expensive goal and one that few statesand localities will be able to manage on their own; itis an endeavor in which other levels of governmentpartnership are important (Thompson 1996).
Agricultural knowledge and practices can aid inland remediation and revitalization. As mentionedin the discussion of remediation, management of soils,soil microflora, and planting of specific types of plantscan restore land to a more desirable state.
Vacant lands, neglected sites, and toxic dumps arecrucial problems facing urban communities. If anarea is dilapidated or vandalized, contains trash-filledvacant lots, or consists mainly of sterile steel and con-crete, the message is sent that those in charge (thecity government, the owner, or the employers) placelittle value on the area or the people living there.Under these circumstances it would seem that peo-ple have no intrinsic worth and no control over theirenvironment, that this is not an appropriate place inwhich to reside or to invest. A study in Atlanta (Bro-gan and Douglas 1980) examined the associationamong psychosocial health of the community, physi-cal environment (e.g., landscaping and nearby landuse, and sociocultural environment (e.g., populationdensity and income). Data indicated that both phys-ical and sociocultural environments were equallyimportant in explaining variations in the psychoso-cial health of the community.
In Baltimore, Maryland, a Community GreeningGrants Revitalization Program provides small grantsto create community-managed open space. Baltimorehas an estimated 40,000 vacant lots covering 11% ofthe city’s land area. About 12,000 lots owned by thecity represent a burden to the city, in that they areno one’s responsibility. As a result, they have becomea social blight on the neighborhood instead of a bene-
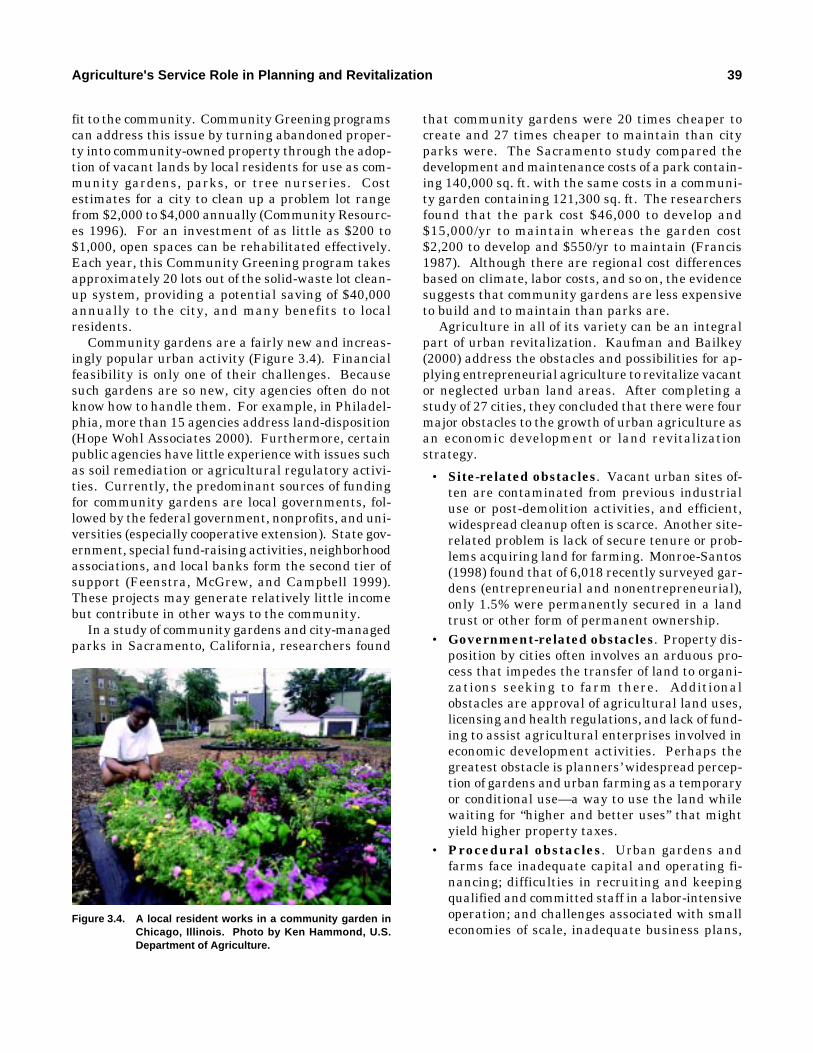
Agriculture's Service Role in Planning and Revitalization 39
fit to the community. Community Greening programscan address this issue by turning abandoned proper-ty into community-owned property through the adop-tion of vacant lands by local residents for use as com-munity gardens, parks, or tree nurseries. Costestimates for a city to clean up a problem lot rangefrom $2,000 to $4,000 annually (Community Resourc-es 1996). For an investment of as little as $200 to$1,000, open spaces can be rehabilitated effectively.Each year, this Community Greening program takesapproximately 20 lots out of the solid-waste lot clean-up system, providing a potential saving of $40,000annually to the city, and many benefits to localresidents.
Community gardens are a fairly new and increas-ingly popular urban activity (Figure 3.4). Financialfeasibility is only one of their challenges. Becausesuch gardens are so new, city agencies often do notknow how to handle them. For example, in Philadel-phia, more than 15 agencies address land-disposition(Hope Wohl Associates 2000). Furthermore, certainpublic agencies have little experience with issues suchas soil remediation or agricultural regulatory activi-ties. Currently, the predominant sources of fundingfor community gardens are local governments, fol-lowed by the federal government, nonprofits, and uni-versities (especially cooperative extension). State gov-ernment, special fund-raising activities, neighborhoodassociations, and local banks form the second tier ofsupport (Feenstra, McGrew, and Campbell 1999).These projects may generate relatively little incomebut contribute in other ways to the community.
In a study of community gardens and city-managedparks in Sacramento, California, researchers found
that community gardens were 20 times cheaper tocreate and 27 times cheaper to maintain than cityparks were. The Sacramento study compared thedevelopment and maintenance costs of a park contain-ing 140,000 sq. ft. with the same costs in a communi-ty garden containing 121,300 sq. ft. The researchersfound that the park cost $46,000 to develop and$15,000/yr to maintain whereas the garden cost$2,200 to develop and $550/yr to maintain (Francis1987). Although there are regional cost differencesbased on climate, labor costs, and so on, the evidencesuggests that community gardens are less expensiveto build and to maintain than parks are.
Agriculture in all of its variety can be an integralpart of urban revitalization. Kaufman and Bailkey(2000) address the obstacles and possibilities for ap-plying entrepreneurial agriculture to revitalize vacantor neglected urban land areas. After completing astudy of 27 cities, they concluded that there were fourmajor obstacles to the growth of urban agriculture asan economic development or land revitalizationstrategy.
• Site-related obstacles. Vacant urban sites of-ten are contaminated from previous industrialuse or post-demolition activities, and efficient,widespread cleanup often is scarce. Another site-related problem is lack of secure tenure or prob-lems acquiring land for farming. Monroe-Santos(1998) found that of 6,018 recently surveyed gar-dens (entrepreneurial and nonentrepreneurial),only 1.5% were permanently secured in a landtrust or other form of permanent ownership.
• Government-related obstacles. Property dis-position by cities often involves an arduous pro-cess that impedes the transfer of land to organi-zations seeking to farm there. Additionalobstacles are approval of agricultural land uses,licensing and health regulations, and lack of fund-ing to assist agricultural enterprises involved ineconomic development activities. Perhaps thegreatest obstacle is planners’ widespread percep-tion of gardens and urban farming as a temporaryor conditional use—a way to use the land whilewaiting for “higher and better uses” that mightyield higher property taxes.
• Procedural obstacles. Urban gardens andfarms face inadequate capital and operating fi-nancing; difficulties in recruiting and keepingqualified and committed staff in a labor-intensiveoperation; and challenges associated with smalleconomies of scale, inadequate business plans,
Figure 3.4. A local resident works in a community garden inChicago, Illinois. Photo by Ken Hammond, U.S.Department of Agriculture.
40 Urban and Agricultural Communities: Opportunities for Common Ground
and ineffective public relations.• Perception-related obstacles. Urban activi-
ties in food production are most challenged by per-ceptions among policymakers, urban opinion-shapers, and the general public that farming is arural, not an urban, pursuit; that farming is notthe best use of urban land; and that farming isan ineffective economic development strategywhen compared with, for instance, a strategy thatattracts large industry. These perceptions arecoming under attack from a number of directions.Communities slowly are recognizing the potentialof urban agriculture for comprehensive commu-nity betterment, and not only from an economicdevelopment or a land-use strategy standpoint(Kaufman and Bailkey 2000).
Agroecosystem services can assist planners withissues associated with growth. Because agriculturehas not been viewed typically as a service to the en-vironment (farms have been viewed as producers offood), many of today’s farms would find this role achallenging opportunity. Designing farms to fulfillecological service needs would require agencies, pub-lic decision makers, and farmers to rethink farmingsystems and incentives for change. This may be anopportunity for institutions of higher education andthe media to educate the public about expanding ag-riculture’s service roles. Such a change in thinkingwould require additional research, as noted previous-ly, and close working relationships among agricultur-al resource people (farmer/ranchers, scientists, andextension personnel) and urban leaders, planners,and citizens’ groups.
Merging the Interests ofStakeholders in the Planning
ProcessStauber (2001, 11) claimed that one’s relationship
to nature is a key determinant of what is rural, and
that “rural requires a symbiotic relationship withplace.” There is every indication, however, that ur-ban people also crave a relationship with nature andall those elements that are associated with what mayhave once been an agriculture heritage—animals,green spaces or parks, forests or wilderness areas,fresh locally produced food, relationships with localfarmers, and so on.
Comprehensive planning processes can documenteconomic and other benefits of local agriculture andidentify important support activities, e.g., products formarketing, housing for farm workers, waste dispos-al, and roads. Local and regional planning, coordi-nation, and negotiation of commonly valued resourc-es across regions and levels of government are equallyimportant. As noted by Pezzini and Wojan (2001),there is a need for shared commitment and dialogueregarding the preservation and use of appreciatedresources. This suggests it is important to developzoning ordinances and other incentive programs toprotect rural, urban, and urban-edge agriculture andnatural areas from development that could otherwisedestroy them.
Sokolow (2000) outlines a number of policy strat-egies, many of which are implicit in smart growthtrends, which communities can use to divert growthaway from productive farmland and fertile agricultur-al soils. The challenges, however, are to minimizepotentially negative interactions between state- andlocal-level administrators and to create conditions fora long-term and mutually beneficial coexistence be-tween farmers and nonfarmers. If agricultural inter-ests are included in this planning process, they canplay a useful role in these and other rural-urban plan-ning activities. Communities that are experiencing aninflux of new residents must balance the demands ofagricultural interests with the often-different inter-ests of nonfarming residents. The leaders of theseurbanizing communities must facilitate meaningfuldialogues and participatory planning processes thatinvolve both newcomers and oldtimers.
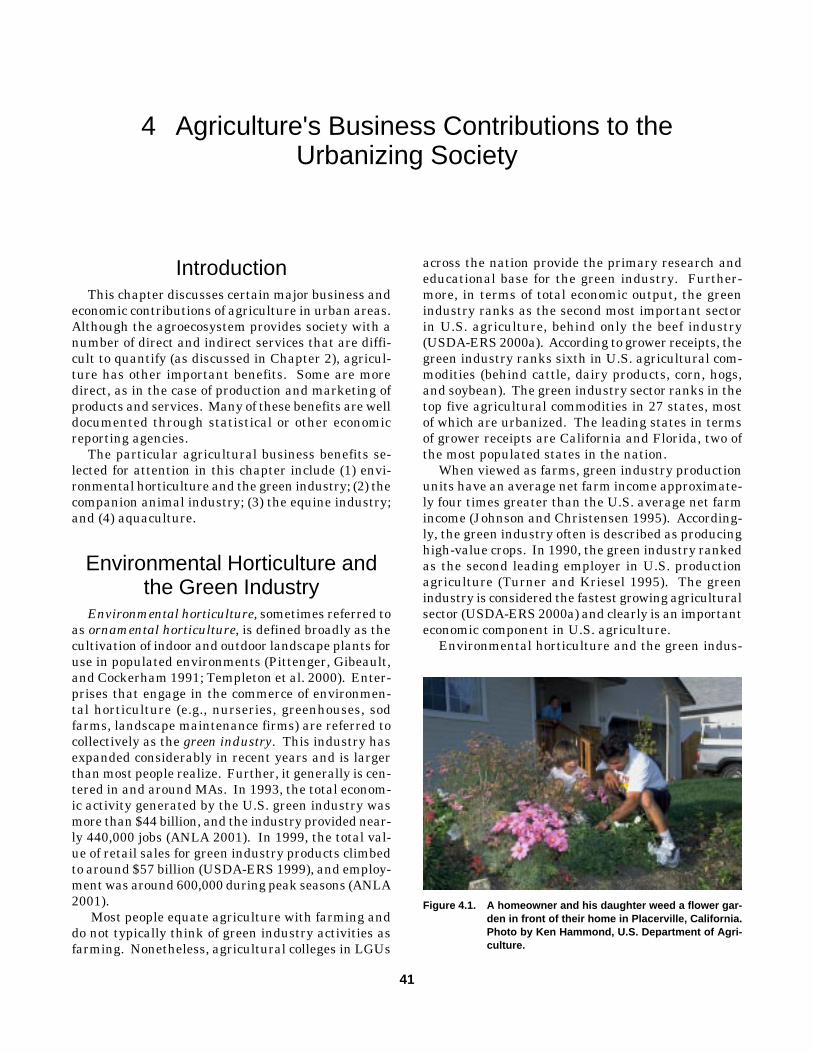
Agriculture's Business Contributions to the Urbanizing Society 41
4 Agriculture's Business Contributions to theUrbanizing Society
41
IntroductionThis chapter discusses certain major business and
economic contributions of agriculture in urban areas.Although the agroecosystem provides society with anumber of direct and indirect services that are diffi-cult to quantify (as discussed in Chapter 2), agricul-ture has other important benefits. Some are moredirect, as in the case of production and marketing ofproducts and services. Many of these benefits are welldocumented through statistical or other economicreporting agencies.
The particular agricultural business benefits se-lected for attention in this chapter include (1) envi-ronmental horticulture and the green industry; (2) thecompanion animal industry; (3) the equine industry;and (4) aquaculture.
Environmental Horticulture andthe Green Industry
Environmental horticulture, sometimes referred toas ornamental horticulture, is defined broadly as thecultivation of indoor and outdoor landscape plants foruse in populated environments (Pittenger, Gibeault,and Cockerham 1991; Templeton et al. 2000). Enter-prises that engage in the commerce of environmen-tal horticulture (e.g., nurseries, greenhouses, sodfarms, landscape maintenance firms) are referred tocollectively as the green industry. This industry hasexpanded considerably in recent years and is largerthan most people realize. Further, it generally is cen-tered in and around MAs. In 1993, the total econom-ic activity generated by the U.S. green industry wasmore than $44 billion, and the industry provided near-ly 440,000 jobs (ANLA 2001). In 1999, the total val-ue of retail sales for green industry products climbedto around $57 billion (USDA-ERS 1999), and employ-ment was around 600,000 during peak seasons (ANLA2001).
Most people equate agriculture with farming anddo not typically think of green industry activities asfarming. Nonetheless, agricultural colleges in LGUs
across the nation provide the primary research andeducational base for the green industry. Further-more, in terms of total economic output, the greenindustry ranks as the second most important sectorin U.S. agriculture, behind only the beef industry(USDA-ERS 2000a). According to grower receipts, thegreen industry ranks sixth in U.S. agricultural com-modities (behind cattle, dairy products, corn, hogs,and soybean). The green industry sector ranks in thetop five agricultural commodities in 27 states, mostof which are urbanized. The leading states in termsof grower receipts are California and Florida, two ofthe most populated states in the nation.
When viewed as farms, green industry productionunits have an average net farm income approximate-ly four times greater than the U.S. average net farmincome (Johnson and Christensen 1995). According-ly, the green industry often is described as producinghigh-value crops. In 1990, the green industry rankedas the second leading employer in U.S. productionagriculture (Turner and Kriesel 1995). The greenindustry is considered the fastest growing agriculturalsector (USDA-ERS 2000a) and clearly is an importanteconomic component in U.S. agriculture.
Environmental horticulture and the green indus-
Figure 4.1. A homeowner and his daughter weed a flower gar-den in front of their home in Placerville, California.Photo by Ken Hammond, U.S. Department of Agri-culture.
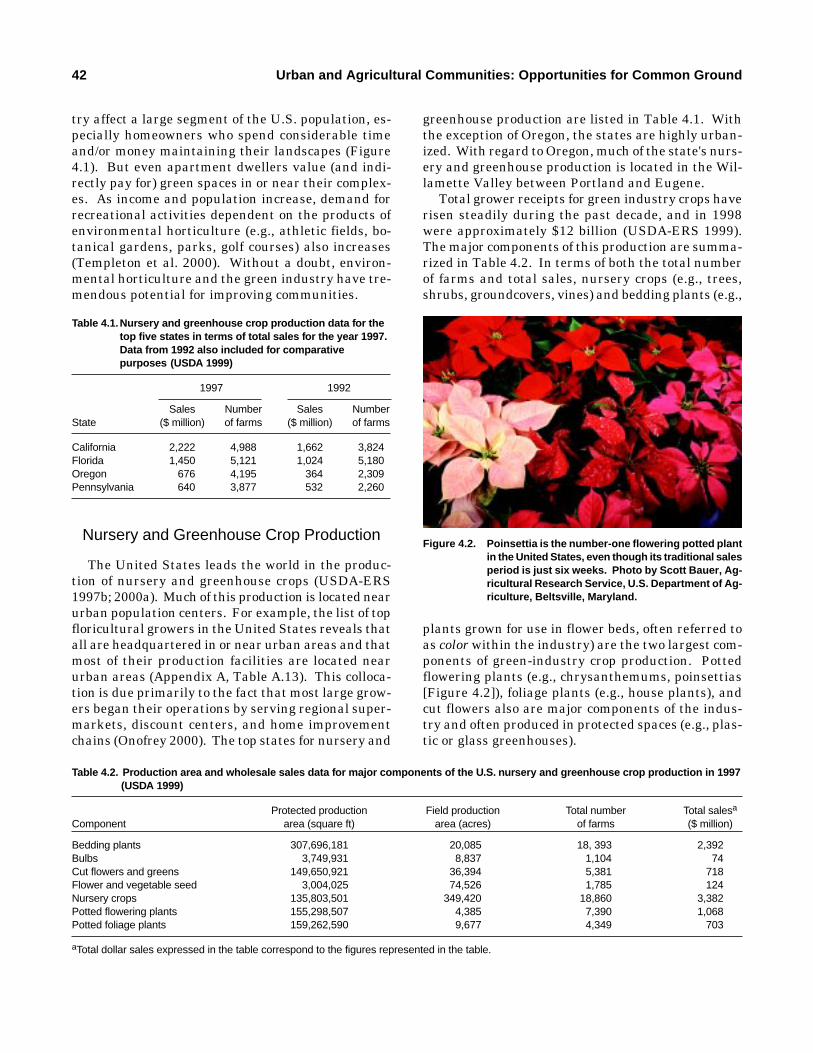
42 Urban and Agricultural Communities: Opportunities for Common Ground
try affect a large segment of the U.S. population, es-pecially homeowners who spend considerable timeand/or money maintaining their landscapes (Figure4.1). But even apartment dwellers value (and indi-rectly pay for) green spaces in or near their complex-es. As income and population increase, demand forrecreational activities dependent on the products ofenvironmental horticulture (e.g., athletic fields, bo-tanical gardens, parks, golf courses) also increases(Templeton et al. 2000). Without a doubt, environ-mental horticulture and the green industry have tre-mendous potential for improving communities.
greenhouse production are listed in Table 4.1. Withthe exception of Oregon, the states are highly urban-ized. With regard to Oregon, much of the state's nurs-ery and greenhouse production is located in the Wil-lamette Valley between Portland and Eugene.
Total grower receipts for green industry crops haverisen steadily during the past decade, and in 1998were approximately $12 billion (USDA-ERS 1999).The major components of this production are summa-rized in Table 4.2. In terms of both the total numberof farms and total sales, nursery crops (e.g., trees,shrubs, groundcovers, vines) and bedding plants (e.g.,
Table 4.1.Nursery and greenhouse crop production data for thetop five states in terms of total sales for the year 1997.Data from 1992 also included for comparativepurposes (USDA 1999)
1997 1992
Sales Number Sales NumberState ($ million) of farms ($ million) of farms
California 2,222 4,988 1,662 3,824Florida 1,450 5,121 1,024 5,180Oregon 676 4,195 364 2,309Pennsylvania 640 3,877 532 2,260
Nursery and Greenhouse Crop Production
The United States leads the world in the produc-tion of nursery and greenhouse crops (USDA-ERS1997b; 2000a). Much of this production is located nearurban population centers. For example, the list of topfloricultural growers in the United States reveals thatall are headquartered in or near urban areas and thatmost of their production facilities are located nearurban areas (Appendix A, Table A.13). This colloca-tion is due primarily to the fact that most large grow-ers began their operations by serving regional super-markets, discount centers, and home improvementchains (Onofrey 2000). The top states for nursery and
Table 4.2. Production area and wholesale sales data for major components of the U.S. nursery and greenhouse crop production in 1997(USDA 1999)
Protected production Field production Total number Total salesa
Component area (square ft) area (acres) of farms ($ million)
Bedding plants 307,696,181 20,085 18, 393 2,392Bulbs 3,749,931 8,837 1,104 74Cut flowers and greens 149,650,921 36,394 5,381 718Flower and vegetable seed 3,004,025 74,526 1,785 124Nursery crops 135,803,501 349,420 18,860 3,382Potted flowering plants 155,298,507 4,385 7,390 1,068Potted foliage plants 159,262,590 9,677 4,349 703
aTotal dollar sales expressed in the table correspond to the figures represented in the table.
Figure 4.2. Poinsettia is the number-one flowering potted plantin the United States, even though its traditional salesperiod is just six weeks. Photo by Scott Bauer, Ag-ricultural Research Service, U.S. Department of Ag-riculture, Beltsville, Maryland.
plants grown for use in flower beds, often referred toas color within the industry) are the two largest com-ponents of green-industry crop production. Pottedflowering plants (e.g., chrysanthemums, poinsettias[Figure 4.2]), foliage plants (e.g., house plants), andcut flowers also are major components of the indus-try and often produced in protected spaces (e.g., plas-tic or glass greenhouses).
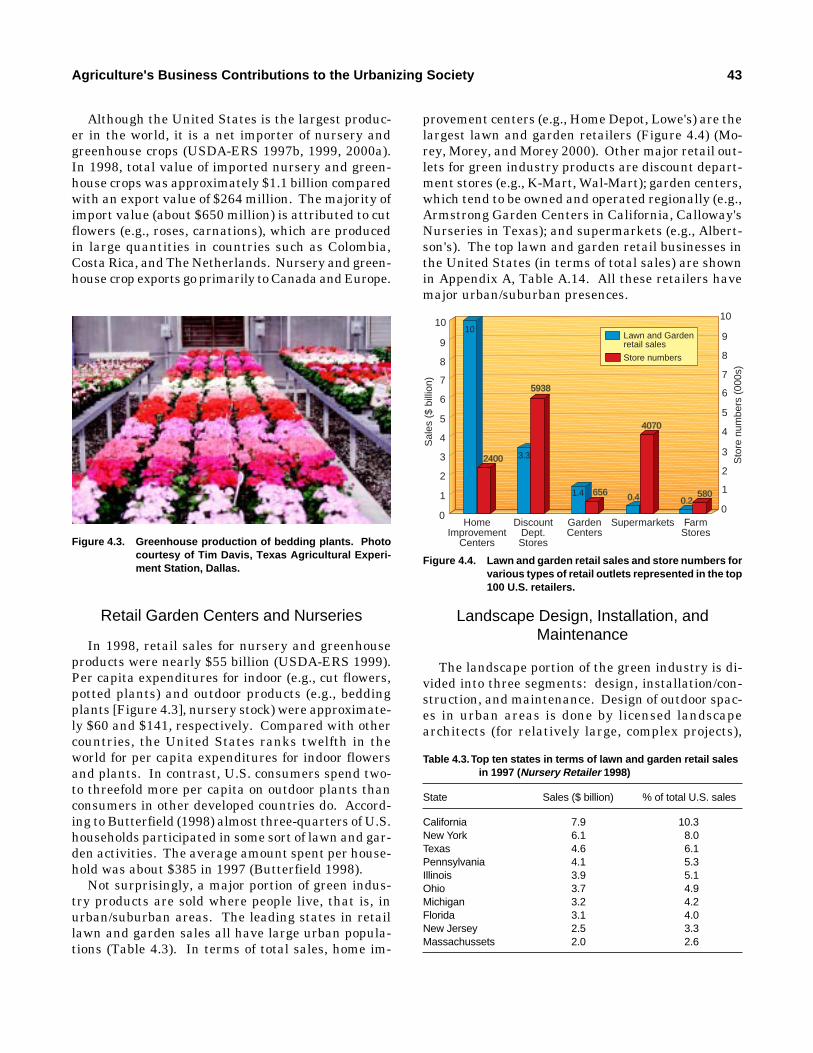
Agriculture's Business Contributions to the Urbanizing Society 43
Although the United States is the largest produc-er in the world, it is a net importer of nursery andgreenhouse crops (USDA-ERS 1997b, 1999, 2000a).In 1998, total value of imported nursery and green-house crops was approximately $1.1 billion comparedwith an export value of $264 million. The majority ofimport value (about $650 million) is attributed to cutflowers (e.g., roses, carnations), which are producedin large quantities in countries such as Colombia,Costa Rica, and The Netherlands. Nursery and green-house crop exports go primarily to Canada and Europe.
provement centers (e.g., Home Depot, Lowe's) are thelargest lawn and garden retailers (Figure 4.4) (Mo-rey, Morey, and Morey 2000). Other major retail out-lets for green industry products are discount depart-ment stores (e.g., K-Mart, Wal-Mart); garden centers,which tend to be owned and operated regionally (e.g.,Armstrong Garden Centers in California, Calloway'sNurseries in Texas); and supermarkets (e.g., Albert-son's). The top lawn and garden retail businesses inthe United States (in terms of total sales) are shownin Appendix A, Table A.14. All these retailers havemajor urban/suburban presences.
Table 4.3.Top ten states in terms of lawn and garden retail salesin 1997 (Nursery Retailer 1998)
State Sales ($ billion) % of total U.S. sales
California 7.9 10.3New York 6.1 8.0Texas 4.6 6.1Pennsylvania 4.1 5.3Illinois 3.9 5.1Ohio 3.7 4.9Michigan 3.2 4.2Florida 3.1 4.0New Jersey 2.5 3.3Massachussets 2.0 2.6
3
2
1
0
Sal
es (
$ bi
llion
)
10
7
HomeImprovement
Centers
FarmStores
9
8
5
4
DiscountDept.Stores
Supermarkets
Sto
re n
umbe
rs (
000s
)
Store numbers
Lawn and Gardenretail sales
6
3
2
1
0
10
7
9
8
5
4
6
GardenCenters
10
3.3
1.4 0.40.40.4 0.20.20.2
593859385938
240024002400
656656656 580580580
407040704070
Figure 4.3. Greenhouse production of bedding plants. Photocourtesy of Tim Davis, Texas Agricultural Experi-ment Station, Dallas.
Retail Garden Centers and Nurseries
In 1998, retail sales for nursery and greenhouseproducts were nearly $55 billion (USDA-ERS 1999).Per capita expenditures for indoor (e.g., cut flowers,potted plants) and outdoor products (e.g., beddingplants [Figure 4.3], nursery stock) were approximate-ly $60 and $141, respectively. Compared with othercountries, the United States ranks twelfth in theworld for per capita expenditures for indoor flowersand plants. In contrast, U.S. consumers spend two-to threefold more per capita on outdoor plants thanconsumers in other developed countries do. Accord-ing to Butterfield (1998) almost three-quarters of U.S.households participated in some sort of lawn and gar-den activities. The average amount spent per house-hold was about $385 in 1997 (Butterfield 1998).
Not surprisingly, a major portion of green indus-try products are sold where people live, that is, inurban/suburban areas. The leading states in retaillawn and garden sales all have large urban popula-tions (Table 4.3). In terms of total sales, home im-
Figure 4.4. Lawn and garden retail sales and store numbers forvarious types of retail outlets represented in the top100 U.S. retailers.
Landscape Design, Installation, andMaintenance
The landscape portion of the green industry is di-vided into three segments: design, installation/con-struction, and maintenance. Design of outdoor spac-es in urban areas is done by licensed landscapearchitects (for relatively large, complex projects),
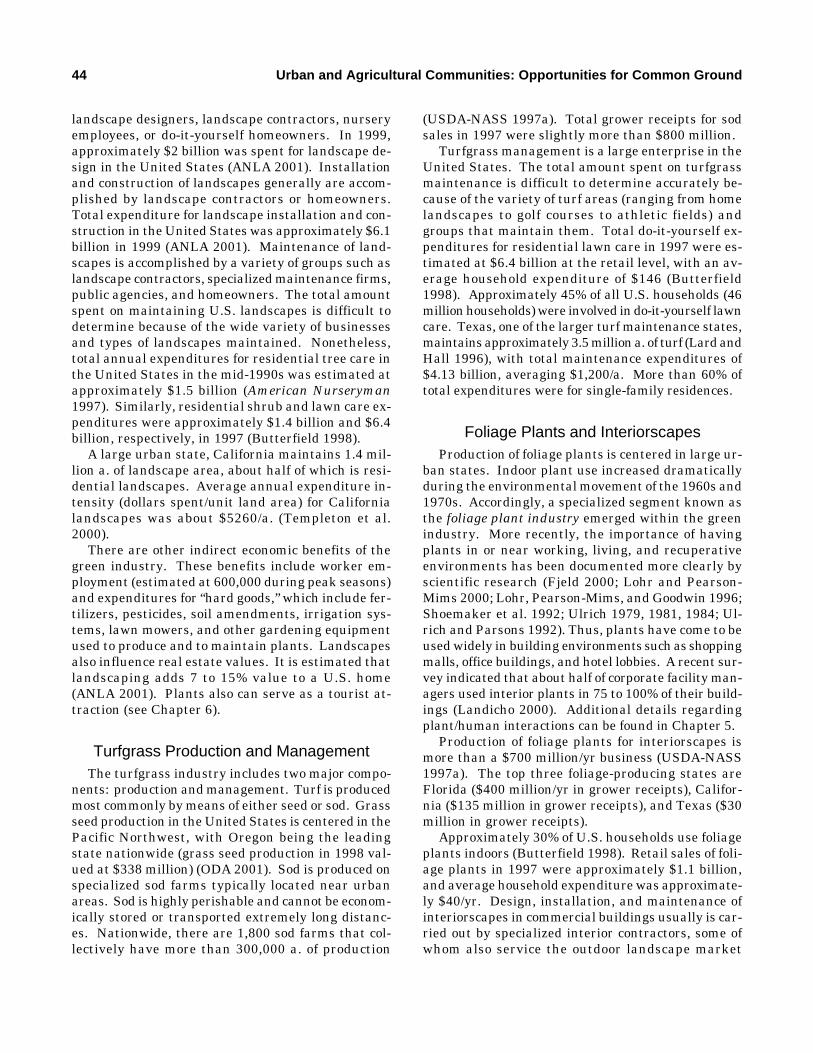
44 Urban and Agricultural Communities: Opportunities for Common Ground
landscape designers, landscape contractors, nurseryemployees, or do-it-yourself homeowners. In 1999,approximately $2 billion was spent for landscape de-sign in the United States (ANLA 2001). Installationand construction of landscapes generally are accom-plished by landscape contractors or homeowners.Total expenditure for landscape installation and con-struction in the United States was approximately $6.1billion in 1999 (ANLA 2001). Maintenance of land-scapes is accomplished by a variety of groups such aslandscape contractors, specialized maintenance firms,public agencies, and homeowners. The total amountspent on maintaining U.S. landscapes is difficult todetermine because of the wide variety of businessesand types of landscapes maintained. Nonetheless,total annual expenditures for residential tree care inthe United States in the mid-1990s was estimated atapproximately $1.5 billion (American Nurseryman1997). Similarly, residential shrub and lawn care ex-penditures were approximately $1.4 billion and $6.4billion, respectively, in 1997 (Butterfield 1998).
A large urban state, California maintains 1.4 mil-lion a. of landscape area, about half of which is resi-dential landscapes. Average annual expenditure in-tensity (dollars spent/unit land area) for Californialandscapes was about $5260/a. (Templeton et al.2000).
There are other indirect economic benefits of thegreen industry. These benefits include worker em-ployment (estimated at 600,000 during peak seasons)and expenditures for “hard goods,” which include fer-tilizers, pesticides, soil amendments, irrigation sys-tems, lawn mowers, and other gardening equipmentused to produce and to maintain plants. Landscapesalso influence real estate values. It is estimated thatlandscaping adds 7 to 15% value to a U.S. home(ANLA 2001). Plants also can serve as a tourist at-traction (see Chapter 6).
Turfgrass Production and ManagementThe turfgrass industry includes two major compo-
nents: production and management. Turf is producedmost commonly by means of either seed or sod. Grassseed production in the United States is centered in thePacific Northwest, with Oregon being the leadingstate nationwide (grass seed production in 1998 val-ued at $338 million) (ODA 2001). Sod is produced onspecialized sod farms typically located near urbanareas. Sod is highly perishable and cannot be econom-ically stored or transported extremely long distanc-es. Nationwide, there are 1,800 sod farms that col-lectively have more than 300,000 a. of production
(USDA-NASS 1997a). Total grower receipts for sodsales in 1997 were slightly more than $800 million.
Turfgrass management is a large enterprise in theUnited States. The total amount spent on turfgrassmaintenance is difficult to determine accurately be-cause of the variety of turf areas (ranging from homelandscapes to golf courses to athletic fields) andgroups that maintain them. Total do-it-yourself ex-penditures for residential lawn care in 1997 were es-timated at $6.4 billion at the retail level, with an av-erage household expenditure of $146 (Butterfield1998). Approximately 45% of all U.S. households (46million households) were involved in do-it-yourself lawncare. Texas, one of the larger turf maintenance states,maintains approximately 3.5 million a. of turf (Lard andHall 1996), with total maintenance expenditures of$4.13 billion, averaging $1,200/a. More than 60% oftotal expenditures were for single-family residences.
Foliage Plants and InteriorscapesProduction of foliage plants is centered in large ur-
ban states. Indoor plant use increased dramaticallyduring the environmental movement of the 1960s and1970s. Accordingly, a specialized segment known asthe foliage plant industry emerged within the greenindustry. More recently, the importance of havingplants in or near working, living, and recuperativeenvironments has been documented more clearly byscientific research (Fjeld 2000; Lohr and Pearson-Mims 2000; Lohr, Pearson-Mims, and Goodwin 1996;Shoemaker et al. 1992; Ulrich 1979, 1981, 1984; Ul-rich and Parsons 1992). Thus, plants have come to beused widely in building environments such as shoppingmalls, office buildings, and hotel lobbies. A recent sur-vey indicated that about half of corporate facility man-agers used interior plants in 75 to 100% of their build-ings (Landicho 2000). Additional details regardingplant/human interactions can be found in Chapter 5.
Production of foliage plants for interiorscapes ismore than a $700 million/yr business (USDA-NASS1997a). The top three foliage-producing states areFlorida ($400 million/yr in grower receipts), Califor-nia ($135 million in grower receipts), and Texas ($30million in grower receipts).
Approximately 30% of U.S. households use foliageplants indoors (Butterfield 1998). Retail sales of foli-age plants in 1997 were approximately $1.1 billion,and average household expenditure was approximate-ly $40/yr. Design, installation, and maintenance ofinteriorscapes in commercial buildings usually is car-ried out by specialized interior contractors, some ofwhom also service the outdoor landscape market
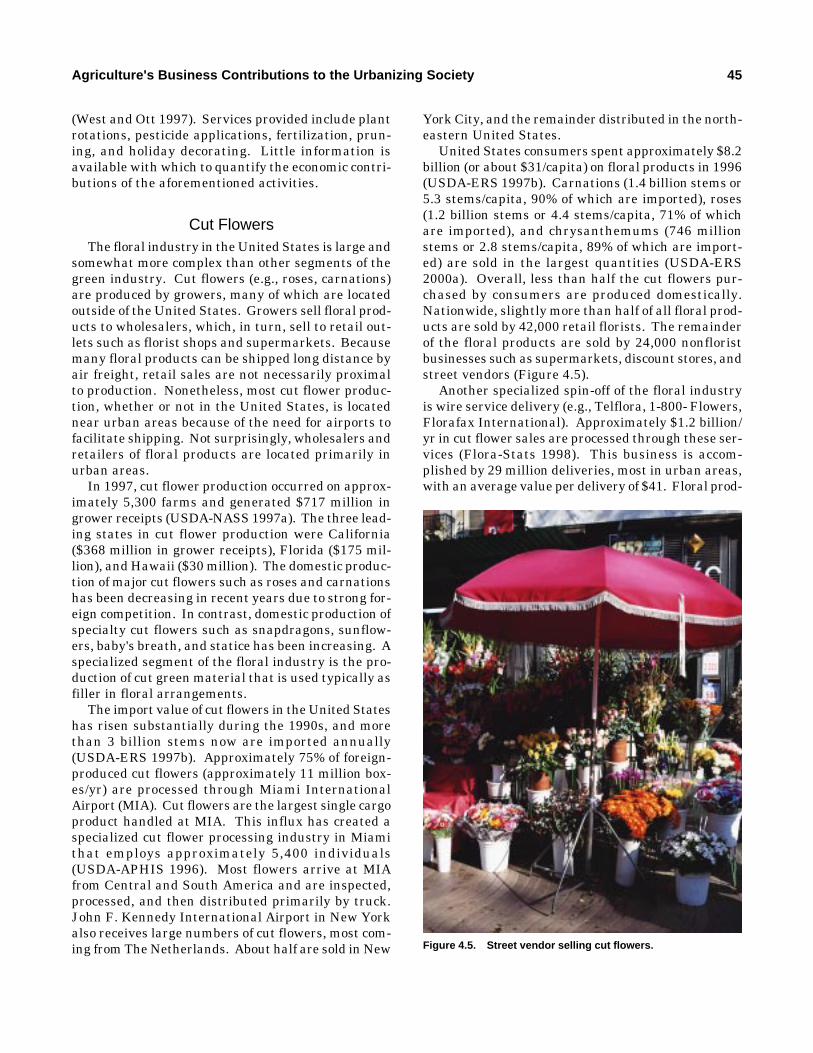
Agriculture's Business Contributions to the Urbanizing Society 45
(West and Ott 1997). Services provided include plantrotations, pesticide applications, fertilization, prun-ing, and holiday decorating. Little information isavailable with which to quantify the economic contri-butions of the aforementioned activities.
Cut FlowersThe floral industry in the United States is large and
somewhat more complex than other segments of thegreen industry. Cut flowers (e.g., roses, carnations)are produced by growers, many of which are locatedoutside of the United States. Growers sell floral prod-ucts to wholesalers, which, in turn, sell to retail out-lets such as florist shops and supermarkets. Becausemany floral products can be shipped long distance byair freight, retail sales are not necessarily proximalto production. Nonetheless, most cut flower produc-tion, whether or not in the United States, is locatednear urban areas because of the need for airports tofacilitate shipping. Not surprisingly, wholesalers andretailers of floral products are located primarily inurban areas.
In 1997, cut flower production occurred on approx-imately 5,300 farms and generated $717 million ingrower receipts (USDA-NASS 1997a). The three lead-ing states in cut flower production were California($368 million in grower receipts), Florida ($175 mil-lion), and Hawaii ($30 million). The domestic produc-tion of major cut flowers such as roses and carnationshas been decreasing in recent years due to strong for-eign competition. In contrast, domestic production ofspecialty cut flowers such as snapdragons, sunflow-ers, baby's breath, and statice has been increasing. Aspecialized segment of the floral industry is the pro-duction of cut green material that is used typically asfiller in floral arrangements.
The import value of cut flowers in the United Stateshas risen substantially during the 1990s, and morethan 3 billion stems now are imported annually(USDA-ERS 1997b). Approximately 75% of foreign-produced cut flowers (approximately 11 million box-es/yr) are processed through Miami InternationalAirport (MIA). Cut flowers are the largest single cargoproduct handled at MIA. This influx has created aspecialized cut flower processing industry in Miamithat employs approximately 5,400 individuals(USDA-APHIS 1996). Most flowers arrive at MIAfrom Central and South America and are inspected,processed, and then distributed primarily by truck.John F. Kennedy International Airport in New Yorkalso receives large numbers of cut flowers, most com-ing from The Netherlands. About half are sold in New
York City, and the remainder distributed in the north-eastern United States.
United States consumers spent approximately $8.2billion (or about $31/capita) on floral products in 1996(USDA-ERS 1997b). Carnations (1.4 billion stems or5.3 stems/capita, 90% of which are imported), roses(1.2 billion stems or 4.4 stems/capita, 71% of whichare imported), and chrysanthemums (746 millionstems or 2.8 stems/capita, 89% of which are import-ed) are sold in the largest quantities (USDA-ERS2000a). Overall, less than half the cut flowers pur-chased by consumers are produced domestically.Nationwide, slightly more than half of all floral prod-ucts are sold by 42,000 retail florists. The remainderof the floral products are sold by 24,000 nonfloristbusinesses such as supermarkets, discount stores, andstreet vendors (Figure 4.5).
Another specialized spin-off of the floral industryis wire service delivery (e.g., Telflora, 1-800- Flowers,Florafax International). Approximately $1.2 billion/yr in cut flower sales are processed through these ser-vices (Flora-Stats 1998). This business is accom-plished by 29 million deliveries, most in urban areas,with an average value per delivery of $41. Floral prod-
Figure 4.5. Street vendor selling cut flowers.
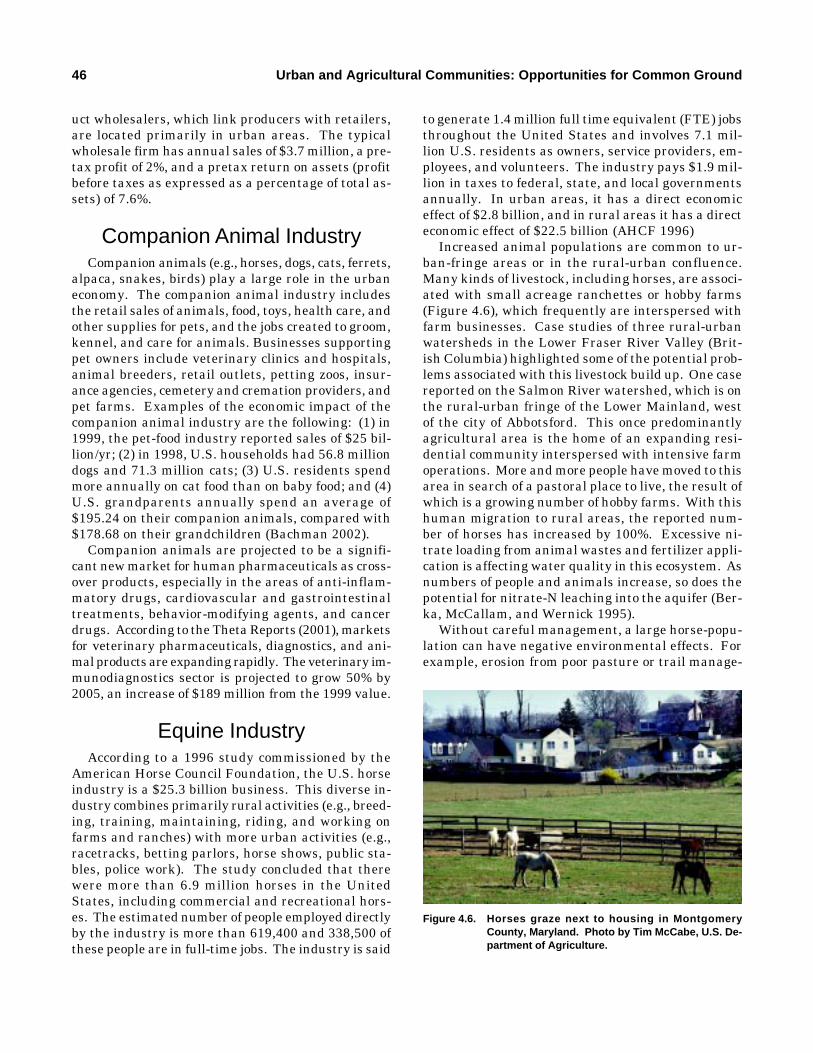
46 Urban and Agricultural Communities: Opportunities for Common Ground
uct wholesalers, which link producers with retailers,are located primarily in urban areas. The typicalwholesale firm has annual sales of $3.7 million, a pre-tax profit of 2%, and a pretax return on assets (profitbefore taxes as expressed as a percentage of total as-sets) of 7.6%.
Companion Animal IndustryCompanion animals (e.g., horses, dogs, cats, ferrets,
alpaca, snakes, birds) play a large role in the urbaneconomy. The companion animal industry includesthe retail sales of animals, food, toys, health care, andother supplies for pets, and the jobs created to groom,kennel, and care for animals. Businesses supportingpet owners include veterinary clinics and hospitals,animal breeders, retail outlets, petting zoos, insur-ance agencies, cemetery and cremation providers, andpet farms. Examples of the economic impact of thecompanion animal industry are the following: (1) in1999, the pet-food industry reported sales of $25 bil-lion/yr; (2) in 1998, U.S. households had 56.8 milliondogs and 71.3 million cats; (3) U.S. residents spendmore annually on cat food than on baby food; and (4)U.S. grandparents annually spend an average of$195.24 on their companion animals, compared with$178.68 on their grandchildren (Bachman 2002).
Companion animals are projected to be a signifi-cant new market for human pharmaceuticals as cross-over products, especially in the areas of anti-inflam-matory drugs, cardiovascular and gastrointestinaltreatments, behavior-modifying agents, and cancerdrugs. According to the Theta Reports (2001), marketsfor veterinary pharmaceuticals, diagnostics, and ani-mal products are expanding rapidly. The veterinary im-munodiagnostics sector is projected to grow 50% by2005, an increase of $189 million from the 1999 value.
Equine IndustryAccording to a 1996 study commissioned by the
American Horse Council Foundation, the U.S. horseindustry is a $25.3 billion business. This diverse in-dustry combines primarily rural activities (e.g., breed-ing, training, maintaining, riding, and working onfarms and ranches) with more urban activities (e.g.,racetracks, betting parlors, horse shows, public sta-bles, police work). The study concluded that therewere more than 6.9 million horses in the UnitedStates, including commercial and recreational hors-es. The estimated number of people employed directlyby the industry is more than 619,400 and 338,500 ofthese people are in full-time jobs. The industry is said
to generate 1.4 million full time equivalent (FTE) jobsthroughout the United States and involves 7.1 mil-lion U.S. residents as owners, service providers, em-ployees, and volunteers. The industry pays $1.9 mil-lion in taxes to federal, state, and local governmentsannually. In urban areas, it has a direct economiceffect of $2.8 billion, and in rural areas it has a directeconomic effect of $22.5 billion (AHCF 1996)
Increased animal populations are common to ur-ban-fringe areas or in the rural-urban confluence.Many kinds of livestock, including horses, are associ-ated with small acreage ranchettes or hobby farms(Figure 4.6), which frequently are interspersed withfarm businesses. Case studies of three rural-urbanwatersheds in the Lower Fraser River Valley (Brit-ish Columbia) highlighted some of the potential prob-lems associated with this livestock build up. One casereported on the Salmon River watershed, which is onthe rural-urban fringe of the Lower Mainland, westof the city of Abbotsford. This once predominantlyagricultural area is the home of an expanding resi-dential community interspersed with intensive farmoperations. More and more people have moved to thisarea in search of a pastoral place to live, the result ofwhich is a growing number of hobby farms. With thishuman migration to rural areas, the reported num-ber of horses has increased by 100%. Excessive ni-trate loading from animal wastes and fertilizer appli-cation is affecting water quality in this ecosystem. Asnumbers of people and animals increase, so does thepotential for nitrate-N leaching into the aquifer (Ber-ka, McCallam, and Wernick 1995).
Without careful management, a large horse-popu-lation can have negative environmental effects. Forexample, erosion from poor pasture or trail manage-
Figure 4.6. Horses graze next to housing in MontgomeryCounty, Maryland. Photo by Tim McCabe, U.S. De-partment of Agriculture.
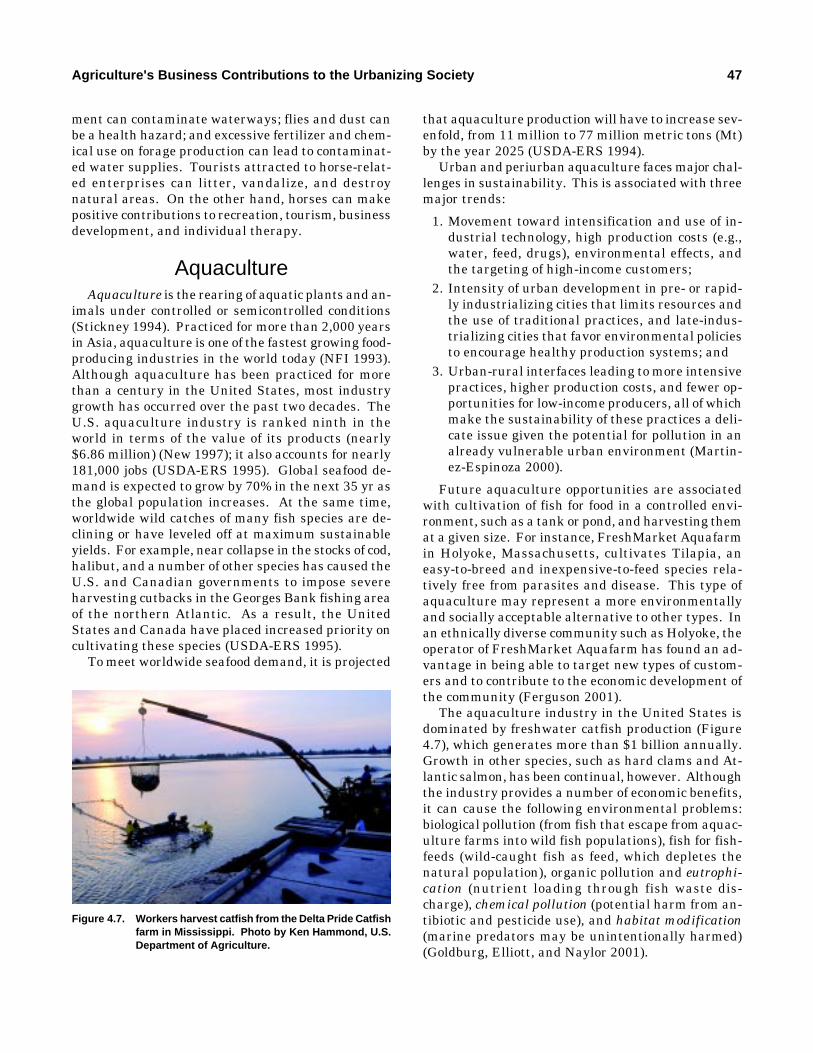
Agriculture's Business Contributions to the Urbanizing Society 47
ment can contaminate waterways; flies and dust canbe a health hazard; and excessive fertilizer and chem-ical use on forage production can lead to contaminat-ed water supplies. Tourists attracted to horse-relat-ed enterprises can litter, vandalize, and destroynatural areas. On the other hand, horses can makepositive contributions to recreation, tourism, businessdevelopment, and individual therapy.
AquacultureAquaculture is the rearing of aquatic plants and an-
imals under controlled or semicontrolled conditions(Stickney 1994). Practiced for more than 2,000 yearsin Asia, aquaculture is one of the fastest growing food-producing industries in the world today (NFI 1993).Although aquaculture has been practiced for morethan a century in the United States, most industrygrowth has occurred over the past two decades. TheU.S. aquaculture industry is ranked ninth in theworld in terms of the value of its products (nearly$6.86 million) (New 1997); it also accounts for nearly181,000 jobs (USDA-ERS 1995). Global seafood de-mand is expected to grow by 70% in the next 35 yr asthe global population increases. At the same time,worldwide wild catches of many fish species are de-clining or have leveled off at maximum sustainableyields. For example, near collapse in the stocks of cod,halibut, and a number of other species has caused theU.S. and Canadian governments to impose severeharvesting cutbacks in the Georges Bank fishing areaof the northern Atlantic. As a result, the UnitedStates and Canada have placed increased priority oncultivating these species (USDA-ERS 1995).
To meet worldwide seafood demand, it is projected
that aquaculture production will have to increase sev-enfold, from 11 million to 77 million metric tons (Mt)by the year 2025 (USDA-ERS 1994).
Urban and periurban aquaculture faces major chal-lenges in sustainability. This is associated with threemajor trends:
1. Movement toward intensification and use of in-dustrial technology, high production costs (e.g.,water, feed, drugs), environmental effects, andthe targeting of high-income customers;
2. Intensity of urban development in pre- or rapid-ly industrializing cities that limits resources andthe use of traditional practices, and late-indus-trializing cities that favor environmental policiesto encourage healthy production systems; and
3. Urban-rural interfaces leading to more intensivepractices, higher production costs, and fewer op-portunities for low-income producers, all of whichmake the sustainability of these practices a deli-cate issue given the potential for pollution in analready vulnerable urban environment (Martin-ez-Espinoza 2000).
Future aquaculture opportunities are associatedwith cultivation of fish for food in a controlled envi-ronment, such as a tank or pond, and harvesting themat a given size. For instance, FreshMarket Aquafarmin Holyoke, Massachusetts, cultivates Tilapia, aneasy-to-breed and inexpensive-to-feed species rela-tively free from parasites and disease. This type ofaquaculture may represent a more environmentallyand socially acceptable alternative to other types. Inan ethnically diverse community such as Holyoke, theoperator of FreshMarket Aquafarm has found an ad-vantage in being able to target new types of custom-ers and to contribute to the economic development ofthe community (Ferguson 2001).
The aquaculture industry in the United States isdominated by freshwater catfish production (Figure4.7), which generates more than $1 billion annually.Growth in other species, such as hard clams and At-lantic salmon, has been continual, however. Althoughthe industry provides a number of economic benefits,it can cause the following environmental problems:biological pollution (from fish that escape from aquac-ulture farms into wild fish populations), fish for fish-feeds (wild-caught fish as feed, which depletes thenatural population), organic pollution and eutrophi-cation (nutrient loading through fish waste dis-charge), chemical pollution (potential harm from an-tibiotic and pesticide use), and habitat modification(marine predators may be unintentionally harmed)(Goldburg, Elliott, and Naylor 2001).
Figure 4.7. Workers harvest catfish from the Delta Pride Catfishfarm in Mississippi. Photo by Ken Hammond, U.S.Department of Agriculture.
48 Urban and Agricultural Communities: Opportunities for Common Ground
5 Agriculture's Contributions to CommunityHealth and Well-Being
48
IntroductionResidents of the United States are increasingly
adopting a fast-paced life style. More amounts of per-sonal time are being devoted to commuting and busi-ness activities, and less time to personal life. Dailyexposure to a harsh and often unnatural environmentheightens awareness of the need for aestheticallypleasing indoor and outdoor environments. Dailycontacts with nature that take place within land-scapes around homes, on the way to work, and in theworkplace, make important contributions to a healthypersonal, family, and work environment. Althoughan arbitrary choice has been made about whether toaddress these issues as “individual” or “community”health contributors, in several instances the issuescould easily be handled in either category, such as thebenefits that landscapes and natural settings providefor daily freeway commuters.
For the purposes of this report, community healthrefers to the social and economic capacity of a com-munity to create an environment that sustains thevisions, goals, and needs of the residents. This isachieved primarily through residents’ interactionswith each other, with people and organizations out-side the community, and with the physical surround-ings. Both rural and urban communities consist ofhuman, natural, and built environments. The healthof this rural-urban agroecosystem is dependent on thequality of plant, animal, and built community rela-tionships.
The purpose of this chapter is to draw attention tothe role that plants and animals play in everydayhuman and community health. The following topicsare discussed: (1) individual health and well-being; (2)community quality of life; and (3) community foodsystems.
Individual Health and Well-BeingAgricultural activities in such endeavors as forest-
ry, horticulture, veterinary medicine, animal science,agroecology, sociology, and community developmentare positioned to contribute to the development and
the maintenance of more user-friendly urban environ-ments. Such environments are conducive to relax-ation, productivity, learning, and psychologicalhealth. Human–animal relationships are anotherpart of the personal health equation. Careful atten-tion should be paid to the role and the effects of ani-mals in the urban setting, both as companions and aspart of the natural landscape. Companion animalstraditionally have not been viewed as an agricultur-al component; for centuries, however, humans andlivestock have been closely connected. Horses are aprimary example, as are other forms of livestock (cat-tle, sheep, pigs, and goats) that have been includedin 4-H and state fair programs, all of which are wellaccepted in the agricultural community. The authorscontend that the science of human–companion animalrelationships will increase in importance as societybecomes more urbanized. Although human and ani-mal relationships have been shown to decrease stressand to serve as therapeutic mechanisms for improvedpersonal health, there also are undesirable health(personal, social) and environmentally related effectsthat accompany their presence in areas of high popu-lation density.
Companion animals offer therapeutic and healthbenefits for people of all ages. For example, pet own-ers have been found to have lower blood pressure andlower triglyceride and cholesterol levels (Anderson,Reid, and Jennings 1992). Pet owners have fewerminor health problems and better psychological well-being and physical health (Serpel 1990). They alsohave a higher survival rate after experiencing coro-nary heart disease (Friedmann and Thomas 1995).Dogs are preventive and therapeutic measuresagainst everyday stress (Allen et al. 1991; Baun, Oet-ting, and Bergstrom 1991; Nagengast et al. 1997;Raina et al. 1999). Pets positively affect autistic be-havior in children (Redefer and Goodman 1989). Theelderly who own dogs go to the doctor less frequentlythan those who do not own dogs. Siegel (1990) foundthat Medicare patients who own pets had 21% fewerphysician contacts than nonpet owners did.
Although it is difficult to carry out scientific stud-ies about the effects of pets, animals, and plants on
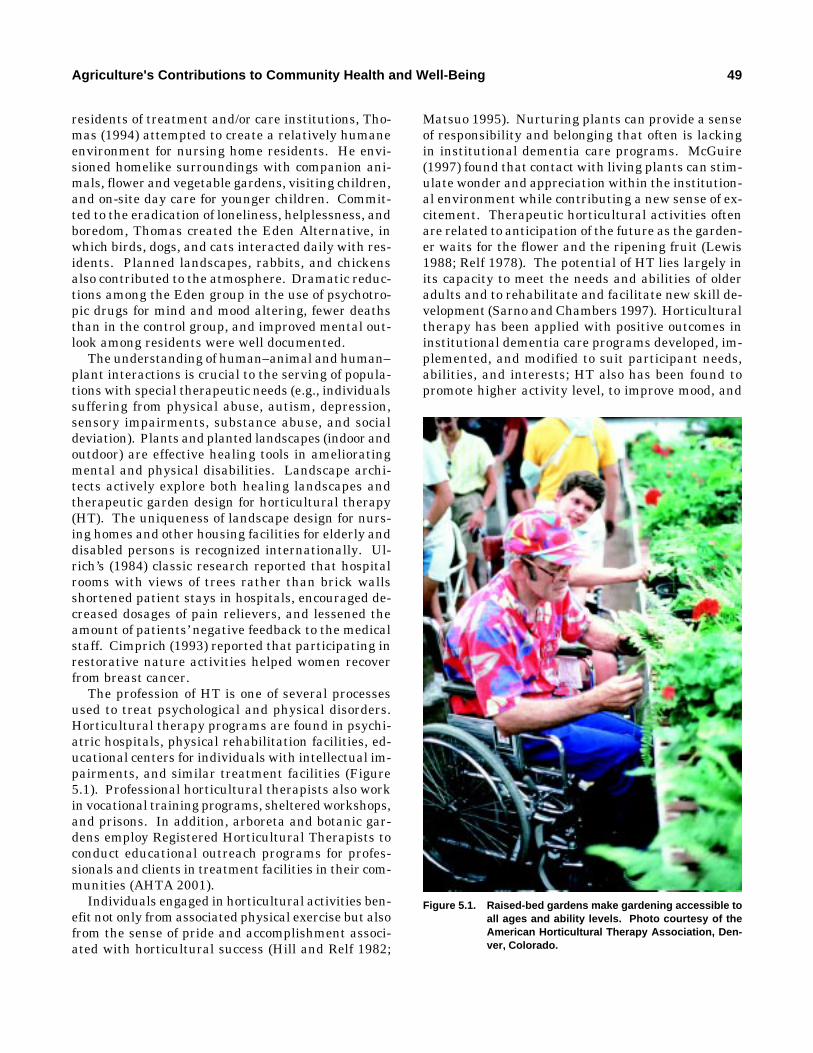
Agriculture's Contributions to Community Health and Well-Being 49
residents of treatment and/or care institutions, Tho-mas (1994) attempted to create a relatively humaneenvironment for nursing home residents. He envi-sioned homelike surroundings with companion ani-mals, flower and vegetable gardens, visiting children,and on-site day care for younger children. Commit-ted to the eradication of loneliness, helplessness, andboredom, Thomas created the Eden Alternative, inwhich birds, dogs, and cats interacted daily with res-idents. Planned landscapes, rabbits, and chickensalso contributed to the atmosphere. Dramatic reduc-tions among the Eden group in the use of psychotro-pic drugs for mind and mood altering, fewer deathsthan in the control group, and improved mental out-look among residents were well documented.
The understanding of human–animal and human–plant interactions is crucial to the serving of popula-tions with special therapeutic needs (e.g., individualssuffering from physical abuse, autism, depression,sensory impairments, substance abuse, and socialdeviation). Plants and planted landscapes (indoor andoutdoor) are effective healing tools in amelioratingmental and physical disabilities. Landscape archi-tects actively explore both healing landscapes andtherapeutic garden design for horticultural therapy(HT). The uniqueness of landscape design for nurs-ing homes and other housing facilities for elderly anddisabled persons is recognized internationally. Ul-rich’s (1984) classic research reported that hospitalrooms with views of trees rather than brick wallsshortened patient stays in hospitals, encouraged de-creased dosages of pain relievers, and lessened theamount of patients’ negative feedback to the medicalstaff. Cimprich (1993) reported that participating inrestorative nature activities helped women recoverfrom breast cancer.
The profession of HT is one of several processesused to treat psychological and physical disorders.Horticultural therapy programs are found in psychi-atric hospitals, physical rehabilitation facilities, ed-ucational centers for individuals with intellectual im-pairments, and similar treatment facilities (Figure5.1). Professional horticultural therapists also workin vocational training programs, sheltered workshops,and prisons. In addition, arboreta and botanic gar-dens employ Registered Horticultural Therapists toconduct educational outreach programs for profes-sionals and clients in treatment facilities in their com-munities (AHTA 2001).
Individuals engaged in horticultural activities ben-efit not only from associated physical exercise but alsofrom the sense of pride and accomplishment associ-ated with horticultural success (Hill and Relf 1982;
Matsuo 1995). Nurturing plants can provide a senseof responsibility and belonging that often is lackingin institutional dementia care programs. McGuire(1997) found that contact with living plants can stim-ulate wonder and appreciation within the institution-al environment while contributing a new sense of ex-citement. Therapeutic horticultural activities oftenare related to anticipation of the future as the garden-er waits for the flower and the ripening fruit (Lewis1988; Relf 1978). The potential of HT lies largely inits capacity to meet the needs and abilities of olderadults and to rehabilitate and facilitate new skill de-velopment (Sarno and Chambers 1997). Horticulturaltherapy has been applied with positive outcomes ininstitutional dementia care programs developed, im-plemented, and modified to suit participant needs,abilities, and interests; HT also has been found topromote higher activity level, to improve mood, and
Figure 5.1. Raised-bed gardens make gardening accessible toall ages and ability levels. Photo courtesy of theAmerican Horticultural Therapy Association, Den-ver, Colorado.
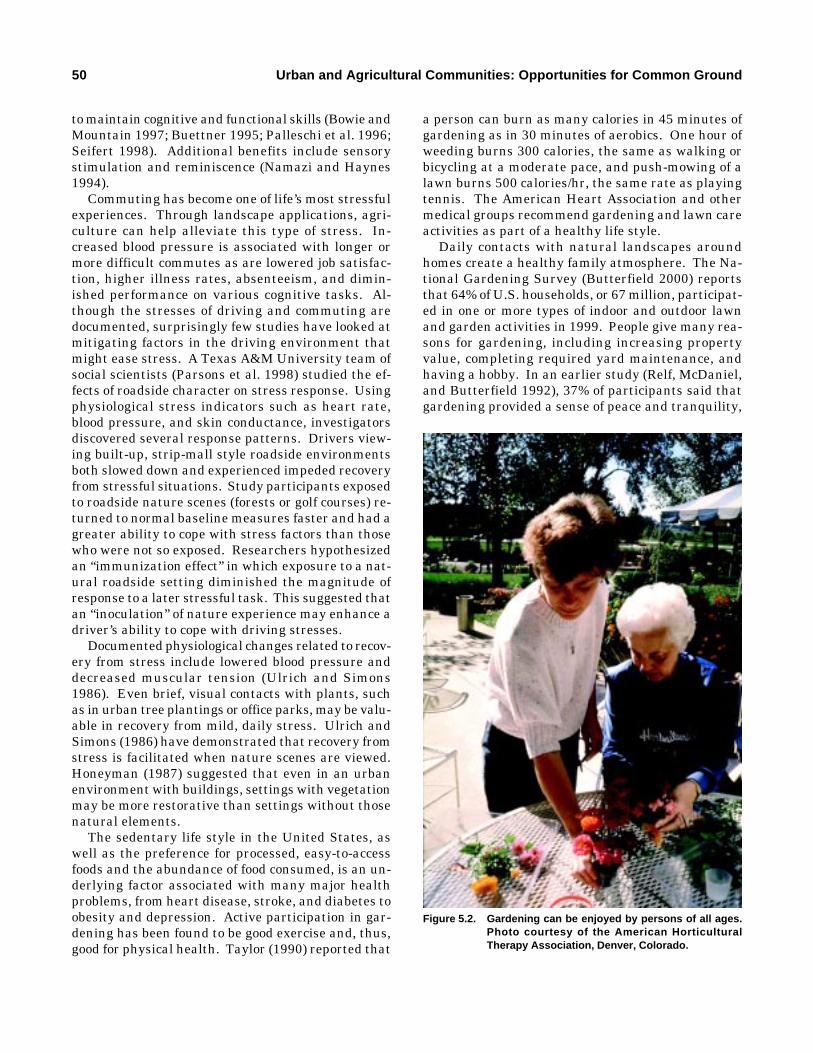
50 Urban and Agricultural Communities: Opportunities for Common Ground
to maintain cognitive and functional skills (Bowie andMountain 1997; Buettner 1995; Palleschi et al. 1996;Seifert 1998). Additional benefits include sensorystimulation and reminiscence (Namazi and Haynes1994).
Commuting has become one of life’s most stressfulexperiences. Through landscape applications, agri-culture can help alleviate this type of stress. In-creased blood pressure is associated with longer ormore difficult commutes as are lowered job satisfac-tion, higher illness rates, absenteeism, and dimin-ished performance on various cognitive tasks. Al-though the stresses of driving and commuting aredocumented, surprisingly few studies have looked atmitigating factors in the driving environment thatmight ease stress. A Texas A&M University team ofsocial scientists (Parsons et al. 1998) studied the ef-fects of roadside character on stress response. Usingphysiological stress indicators such as heart rate,blood pressure, and skin conductance, investigatorsdiscovered several response patterns. Drivers view-ing built-up, strip-mall style roadside environmentsboth slowed down and experienced impeded recoveryfrom stressful situations. Study participants exposedto roadside nature scenes (forests or golf courses) re-turned to normal baseline measures faster and had agreater ability to cope with stress factors than thosewho were not so exposed. Researchers hypothesizedan “immunization effect” in which exposure to a nat-ural roadside setting diminished the magnitude ofresponse to a later stressful task. This suggested thatan “inoculation” of nature experience may enhance adriver’s ability to cope with driving stresses.
Documented physiological changes related to recov-ery from stress include lowered blood pressure anddecreased muscular tension (Ulrich and Simons1986). Even brief, visual contacts with plants, suchas in urban tree plantings or office parks, may be valu-able in recovery from mild, daily stress. Ulrich andSimons (1986) have demonstrated that recovery fromstress is facilitated when nature scenes are viewed.Honeyman (1987) suggested that even in an urbanenvironment with buildings, settings with vegetationmay be more restorative than settings without thosenatural elements.
The sedentary life style in the United States, aswell as the preference for processed, easy-to-accessfoods and the abundance of food consumed, is an un-derlying factor associated with many major healthproblems, from heart disease, stroke, and diabetes toobesity and depression. Active participation in gar-dening has been found to be good exercise and, thus,good for physical health. Taylor (1990) reported that
a person can burn as many calories in 45 minutes ofgardening as in 30 minutes of aerobics. One hour ofweeding burns 300 calories, the same as walking orbicycling at a moderate pace, and push-mowing of alawn burns 500 calories/hr, the same rate as playingtennis. The American Heart Association and othermedical groups recommend gardening and lawn careactivities as part of a healthy life style.
Daily contacts with natural landscapes aroundhomes create a healthy family atmosphere. The Na-tional Gardening Survey (Butterfield 2000) reportsthat 64% of U.S. households, or 67 million, participat-ed in one or more types of indoor and outdoor lawnand garden activities in 1999. People give many rea-sons for gardening, including increasing propertyvalue, completing required yard maintenance, andhaving a hobby. In an earlier study (Relf, McDaniel,and Butterfield 1992), 37% of participants said thatgardening provided a sense of peace and tranquility,
Figure 5.2. Gardening can be enjoyed by persons of all ages.Photo courtesy of the American HorticulturalTherapy Association, Denver, Colorado.
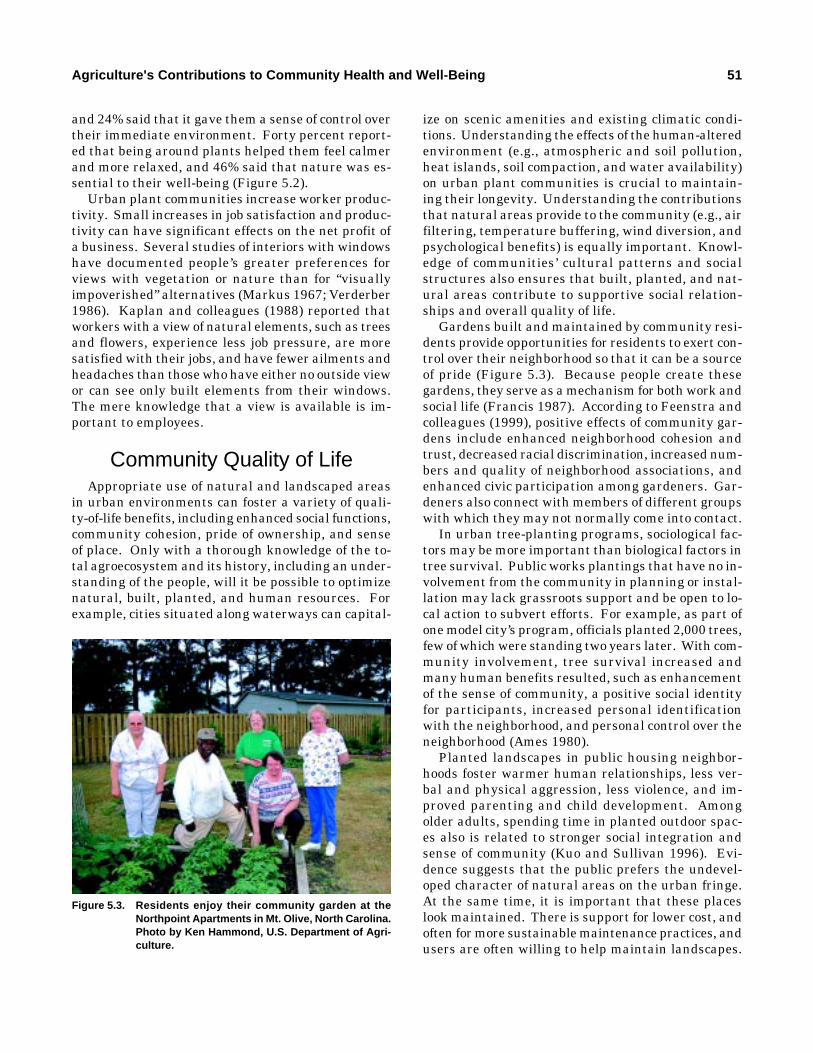
Agriculture's Contributions to Community Health and Well-Being 51
and 24% said that it gave them a sense of control overtheir immediate environment. Forty percent report-ed that being around plants helped them feel calmerand more relaxed, and 46% said that nature was es-sential to their well-being (Figure 5.2).
Urban plant communities increase worker produc-tivity. Small increases in job satisfaction and produc-tivity can have significant effects on the net profit ofa business. Several studies of interiors with windowshave documented people’s greater preferences forviews with vegetation or nature than for “visuallyimpoverished” alternatives (Markus 1967; Verderber1986). Kaplan and colleagues (1988) reported thatworkers with a view of natural elements, such as treesand flowers, experience less job pressure, are moresatisfied with their jobs, and have fewer ailments andheadaches than those who have either no outside viewor can see only built elements from their windows.The mere knowledge that a view is available is im-portant to employees.
Community Quality of LifeAppropriate use of natural and landscaped areas
in urban environments can foster a variety of quali-ty-of-life benefits, including enhanced social functions,community cohesion, pride of ownership, and senseof place. Only with a thorough knowledge of the to-tal agroecosystem and its history, including an under-standing of the people, will it be possible to optimizenatural, built, planted, and human resources. Forexample, cities situated along waterways can capital-
ize on scenic amenities and existing climatic condi-tions. Understanding the effects of the human-alteredenvironment (e.g., atmospheric and soil pollution,heat islands, soil compaction, and water availability)on urban plant communities is crucial to maintain-ing their longevity. Understanding the contributionsthat natural areas provide to the community (e.g., airfiltering, temperature buffering, wind diversion, andpsychological benefits) is equally important. Knowl-edge of communities’ cultural patterns and socialstructures also ensures that built, planted, and nat-ural areas contribute to supportive social relation-ships and overall quality of life.
Gardens built and maintained by community resi-dents provide opportunities for residents to exert con-trol over their neighborhood so that it can be a sourceof pride (Figure 5.3). Because people create thesegardens, they serve as a mechanism for both work andsocial life (Francis 1987). According to Feenstra andcolleagues (1999), positive effects of community gar-dens include enhanced neighborhood cohesion andtrust, decreased racial discrimination, increased num-bers and quality of neighborhood associations, andenhanced civic participation among gardeners. Gar-deners also connect with members of different groupswith which they may not normally come into contact.
In urban tree-planting programs, sociological fac-tors may be more important than biological factors intree survival. Public works plantings that have no in-volvement from the community in planning or instal-lation may lack grassroots support and be open to lo-cal action to subvert efforts. For example, as part ofone model city’s program, officials planted 2,000 trees,few of which were standing two years later. With com-munity involvement, tree survival increased andmany human benefits resulted, such as enhancementof the sense of community, a positive social identityfor participants, increased personal identificationwith the neighborhood, and personal control over theneighborhood (Ames 1980).
Planted landscapes in public housing neighbor-hoods foster warmer human relationships, less ver-bal and physical aggression, less violence, and im-proved parenting and child development. Amongolder adults, spending time in planted outdoor spac-es also is related to stronger social integration andsense of community (Kuo and Sullivan 1996). Evi-dence suggests that the public prefers the undevel-oped character of natural areas on the urban fringe.At the same time, it is important that these placeslook maintained. There is support for lower cost, andoften for more sustainable maintenance practices, andusers are often willing to help maintain landscapes.
Figure 5.3. Residents enjoy their community garden at theNorthpoint Apartments in Mt. Olive, North Carolina.Photo by Ken Hammond, U.S. Department of Agri-culture.
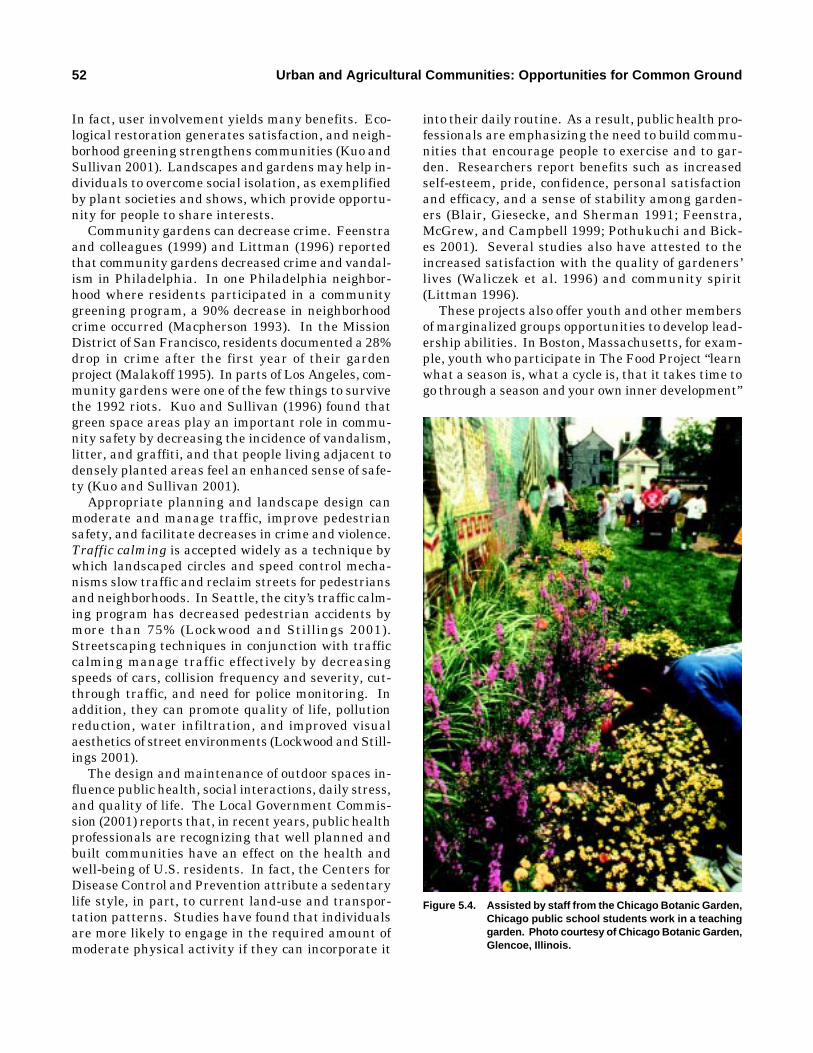
52 Urban and Agricultural Communities: Opportunities for Common Ground
In fact, user involvement yields many benefits. Eco-logical restoration generates satisfaction, and neigh-borhood greening strengthens communities (Kuo andSullivan 2001). Landscapes and gardens may help in-dividuals to overcome social isolation, as exemplifiedby plant societies and shows, which provide opportu-nity for people to share interests.
Community gardens can decrease crime. Feenstraand colleagues (1999) and Littman (1996) reportedthat community gardens decreased crime and vandal-ism in Philadelphia. In one Philadelphia neighbor-hood where residents participated in a communitygreening program, a 90% decrease in neighborhoodcrime occurred (Macpherson 1993). In the MissionDistrict of San Francisco, residents documented a 28%drop in crime after the first year of their gardenproject (Malakoff 1995). In parts of Los Angeles, com-munity gardens were one of the few things to survivethe 1992 riots. Kuo and Sullivan (1996) found thatgreen space areas play an important role in commu-nity safety by decreasing the incidence of vandalism,litter, and graffiti, and that people living adjacent todensely planted areas feel an enhanced sense of safe-ty (Kuo and Sullivan 2001).
Appropriate planning and landscape design canmoderate and manage traffic, improve pedestriansafety, and facilitate decreases in crime and violence.Traffic calming is accepted widely as a technique bywhich landscaped circles and speed control mecha-nisms slow traffic and reclaim streets for pedestriansand neighborhoods. In Seattle, the city’s traffic calm-ing program has decreased pedestrian accidents bymore than 75% (Lockwood and Stillings 2001).Streetscaping techniques in conjunction with trafficcalming manage traffic effectively by decreasingspeeds of cars, collision frequency and severity, cut-through traffic, and need for police monitoring. Inaddition, they can promote quality of life, pollutionreduction, water infiltration, and improved visualaesthetics of street environments (Lockwood and Still-ings 2001).
The design and maintenance of outdoor spaces in-fluence public health, social interactions, daily stress,and quality of life. The Local Government Commis-sion (2001) reports that, in recent years, public healthprofessionals are recognizing that well planned andbuilt communities have an effect on the health andwell-being of U.S. residents. In fact, the Centers forDisease Control and Prevention attribute a sedentarylife style, in part, to current land-use and transpor-tation patterns. Studies have found that individualsare more likely to engage in the required amount ofmoderate physical activity if they can incorporate it
into their daily routine. As a result, public health pro-fessionals are emphasizing the need to build commu-nities that encourage people to exercise and to gar-den. Researchers report benefits such as increasedself-esteem, pride, confidence, personal satisfactionand efficacy, and a sense of stability among garden-ers (Blair, Giesecke, and Sherman 1991; Feenstra,McGrew, and Campbell 1999; Pothukuchi and Bick-es 2001). Several studies also have attested to theincreased satisfaction with the quality of gardeners’lives (Waliczek et al. 1996) and community spirit(Littman 1996).
These projects also offer youth and other membersof marginalized groups opportunities to develop lead-ership abilities. In Boston, Massachusetts, for exam-ple, youth who participate in The Food Project “learnwhat a season is, what a cycle is, that it takes time togo through a season and your own inner development”
Figure 5.4. Assisted by staff from the Chicago Botanic Garden,Chicago public school students work in a teachinggarden. Photo courtesy of Chicago Botanic Garden,Glencoe, Illinois.
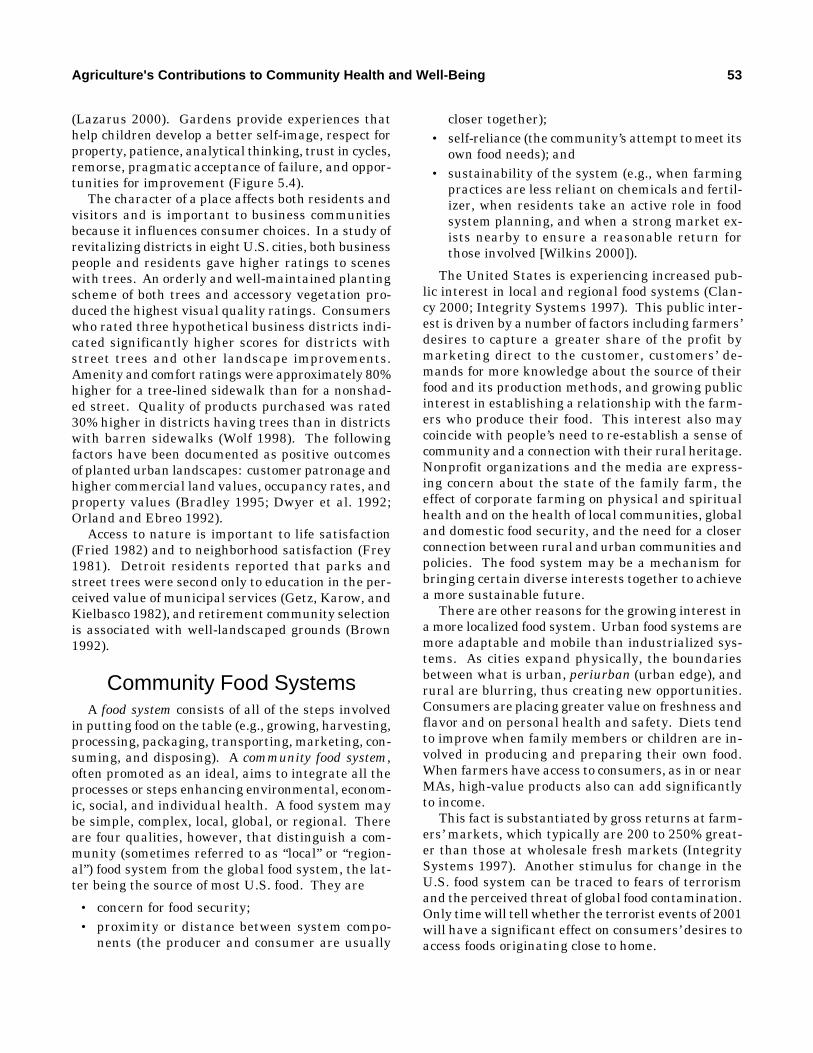
Agriculture's Contributions to Community Health and Well-Being 53
(Lazarus 2000). Gardens provide experiences thathelp children develop a better self-image, respect forproperty, patience, analytical thinking, trust in cycles,remorse, pragmatic acceptance of failure, and oppor-tunities for improvement (Figure 5.4).
The character of a place affects both residents andvisitors and is important to business communitiesbecause it influences consumer choices. In a study ofrevitalizing districts in eight U.S. cities, both businesspeople and residents gave higher ratings to sceneswith trees. An orderly and well-maintained plantingscheme of both trees and accessory vegetation pro-duced the highest visual quality ratings. Consumerswho rated three hypothetical business districts indi-cated significantly higher scores for districts withstreet trees and other landscape improvements.Amenity and comfort ratings were approximately 80%higher for a tree-lined sidewalk than for a nonshad-ed street. Quality of products purchased was rated30% higher in districts having trees than in districtswith barren sidewalks (Wolf 1998). The followingfactors have been documented as positive outcomesof planted urban landscapes: customer patronage andhigher commercial land values, occupancy rates, andproperty values (Bradley 1995; Dwyer et al. 1992;Orland and Ebreo 1992).
Access to nature is important to life satisfaction(Fried 1982) and to neighborhood satisfaction (Frey1981). Detroit residents reported that parks andstreet trees were second only to education in the per-ceived value of municipal services (Getz, Karow, andKielbasco 1982), and retirement community selectionis associated with well-landscaped grounds (Brown1992).
Community Food SystemsA food system consists of all of the steps involved
in putting food on the table (e.g., growing, harvesting,processing, packaging, transporting, marketing, con-suming, and disposing). A community food system,often promoted as an ideal, aims to integrate all theprocesses or steps enhancing environmental, econom-ic, social, and individual health. A food system maybe simple, complex, local, global, or regional. Thereare four qualities, however, that distinguish a com-munity (sometimes referred to as “local” or “region-al”) food system from the global food system, the lat-ter being the source of most U.S. food. They are
• concern for food security;• proximity or distance between system compo-
nents (the producer and consumer are usually
closer together);• self-reliance (the community’s attempt to meet its
own food needs); and• sustainability of the system (e.g., when farming
practices are less reliant on chemicals and fertil-izer, when residents take an active role in foodsystem planning, and when a strong market ex-ists nearby to ensure a reasonable return forthose involved [Wilkins 2000]).
The United States is experiencing increased pub-lic interest in local and regional food systems (Clan-cy 2000; Integrity Systems 1997). This public inter-est is driven by a number of factors including farmers’desires to capture a greater share of the profit bymarketing direct to the customer, customers’ de-mands for more knowledge about the source of theirfood and its production methods, and growing publicinterest in establishing a relationship with the farm-ers who produce their food. This interest also maycoincide with people’s need to re-establish a sense ofcommunity and a connection with their rural heritage.Nonprofit organizations and the media are express-ing concern about the state of the family farm, theeffect of corporate farming on physical and spiritualhealth and on the health of local communities, globaland domestic food security, and the need for a closerconnection between rural and urban communities andpolicies. The food system may be a mechanism forbringing certain diverse interests together to achievea more sustainable future.
There are other reasons for the growing interest ina more localized food system. Urban food systems aremore adaptable and mobile than industrialized sys-tems. As cities expand physically, the boundariesbetween what is urban, periurban (urban edge), andrural are blurring, thus creating new opportunities.Consumers are placing greater value on freshness andflavor and on personal health and safety. Diets tendto improve when family members or children are in-volved in producing and preparing their own food.When farmers have access to consumers, as in or nearMAs, high-value products also can add significantlyto income.
This fact is substantiated by gross returns at farm-ers’ markets, which typically are 200 to 250% great-er than those at wholesale fresh markets (IntegritySystems 1997). Another stimulus for change in theU.S. food system can be traced to fears of terrorismand the perceived threat of global food contamination.Only time will tell whether the terrorist events of 2001will have a significant effect on consumers’ desires toaccess foods originating close to home.
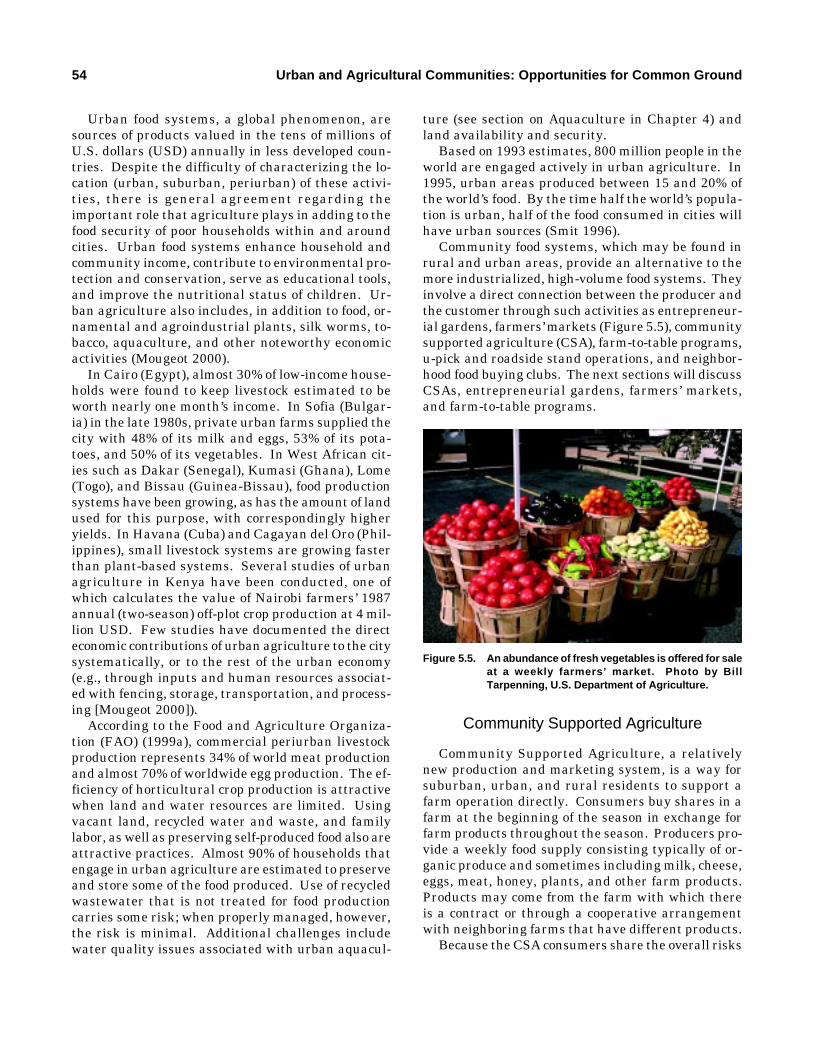
54 Urban and Agricultural Communities: Opportunities for Common Ground
Urban food systems, a global phenomenon, aresources of products valued in the tens of millions ofU.S. dollars (USD) annually in less developed coun-tries. Despite the difficulty of characterizing the lo-cation (urban, suburban, periurban) of these activi-ties, there is general agreement regarding theimportant role that agriculture plays in adding to thefood security of poor households within and aroundcities. Urban food systems enhance household andcommunity income, contribute to environmental pro-tection and conservation, serve as educational tools,and improve the nutritional status of children. Ur-ban agriculture also includes, in addition to food, or-namental and agroindustrial plants, silk worms, to-bacco, aquaculture, and other noteworthy economicactivities (Mougeot 2000).
In Cairo (Egypt), almost 30% of low-income house-holds were found to keep livestock estimated to beworth nearly one month’s income. In Sofia (Bulgar-ia) in the late 1980s, private urban farms supplied thecity with 48% of its milk and eggs, 53% of its pota-toes, and 50% of its vegetables. In West African cit-ies such as Dakar (Senegal), Kumasi (Ghana), Lome(Togo), and Bissau (Guinea-Bissau), food productionsystems have been growing, as has the amount of landused for this purpose, with correspondingly higheryields. In Havana (Cuba) and Cagayan del Oro (Phil-ippines), small livestock systems are growing fasterthan plant-based systems. Several studies of urbanagriculture in Kenya have been conducted, one ofwhich calculates the value of Nairobi farmers’ 1987annual (two-season) off-plot crop production at 4 mil-lion USD. Few studies have documented the directeconomic contributions of urban agriculture to the citysystematically, or to the rest of the urban economy(e.g., through inputs and human resources associat-ed with fencing, storage, transportation, and process-ing [Mougeot 2000]).
According to the Food and Agriculture Organiza-tion (FAO) (1999a), commercial periurban livestockproduction represents 34% of world meat productionand almost 70% of worldwide egg production. The ef-ficiency of horticultural crop production is attractivewhen land and water resources are limited. Usingvacant land, recycled water and waste, and familylabor, as well as preserving self-produced food also areattractive practices. Almost 90% of households thatengage in urban agriculture are estimated to preserveand store some of the food produced. Use of recycledwastewater that is not treated for food productioncarries some risk; when properly managed, however,the risk is minimal. Additional challenges includewater quality issues associated with urban aquacul-
ture (see section on Aquaculture in Chapter 4) andland availability and security.
Based on 1993 estimates, 800 million people in theworld are engaged actively in urban agriculture. In1995, urban areas produced between 15 and 20% ofthe world’s food. By the time half the world’s popula-tion is urban, half of the food consumed in cities willhave urban sources (Smit 1996).
Community food systems, which may be found inrural and urban areas, provide an alternative to themore industrialized, high-volume food systems. Theyinvolve a direct connection between the producer andthe customer through such activities as entrepreneur-ial gardens, farmers’ markets (Figure 5.5), communitysupported agriculture (CSA), farm-to-table programs,u-pick and roadside stand operations, and neighbor-hood food buying clubs. The next sections will discussCSAs, entrepreneurial gardens, farmers’ markets,and farm-to-table programs.
Community Supported Agriculture
Community Supported Agriculture, a relativelynew production and marketing system, is a way forsuburban, urban, and rural residents to support afarm operation directly. Consumers buy shares in afarm at the beginning of the season in exchange forfarm products throughout the season. Producers pro-vide a weekly food supply consisting typically of or-ganic produce and sometimes including milk, cheese,eggs, meat, honey, plants, and other farm products.Products may come from the farm with which thereis a contract or through a cooperative arrangementwith neighboring farms that have different products.
Because the CSA consumers share the overall risks
Figure 5.5. An abundance of fresh vegetables is offered for saleat a weekly farmers’ market. Photo by BillTarpenning, U.S. Department of Agriculture.
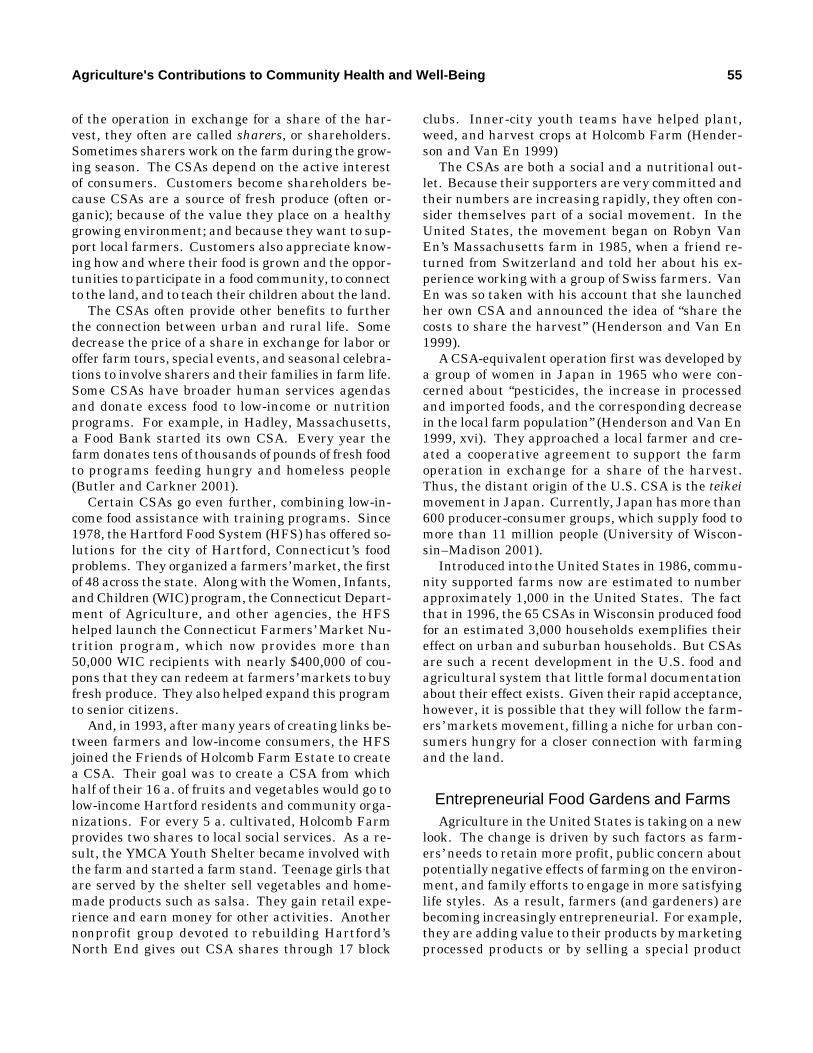
Agriculture's Contributions to Community Health and Well-Being 55
of the operation in exchange for a share of the har-vest, they often are called sharers, or shareholders.Sometimes sharers work on the farm during the grow-ing season. The CSAs depend on the active interestof consumers. Customers become shareholders be-cause CSAs are a source of fresh produce (often or-ganic); because of the value they place on a healthygrowing environment; and because they want to sup-port local farmers. Customers also appreciate know-ing how and where their food is grown and the oppor-tunities to participate in a food community, to connectto the land, and to teach their children about the land.
The CSAs often provide other benefits to furtherthe connection between urban and rural life. Somedecrease the price of a share in exchange for labor oroffer farm tours, special events, and seasonal celebra-tions to involve sharers and their families in farm life.Some CSAs have broader human services agendasand donate excess food to low-income or nutritionprograms. For example, in Hadley, Massachusetts,a Food Bank started its own CSA. Every year thefarm donates tens of thousands of pounds of fresh foodto programs feeding hungry and homeless people(Butler and Carkner 2001).
Certain CSAs go even further, combining low-in-come food assistance with training programs. Since1978, the Hartford Food System (HFS) has offered so-lutions for the city of Hartford, Connecticut’s foodproblems. They organized a farmers’ market, the firstof 48 across the state. Along with the Women, Infants,and Children (WIC) program, the Connecticut Depart-ment of Agriculture, and other agencies, the HFShelped launch the Connecticut Farmers’ Market Nu-trition program, which now provides more than50,000 WIC recipients with nearly $400,000 of cou-pons that they can redeem at farmers’ markets to buyfresh produce. They also helped expand this programto senior citizens.
And, in 1993, after many years of creating links be-tween farmers and low-income consumers, the HFSjoined the Friends of Holcomb Farm Estate to createa CSA. Their goal was to create a CSA from whichhalf of their 16 a. of fruits and vegetables would go tolow-income Hartford residents and community orga-nizations. For every 5 a. cultivated, Holcomb Farmprovides two shares to local social services. As a re-sult, the YMCA Youth Shelter became involved withthe farm and started a farm stand. Teenage girls thatare served by the shelter sell vegetables and home-made products such as salsa. They gain retail expe-rience and earn money for other activities. Anothernonprofit group devoted to rebuilding Hartford’sNorth End gives out CSA shares through 17 block
clubs. Inner-city youth teams have helped plant,weed, and harvest crops at Holcomb Farm (Hender-son and Van En 1999)
The CSAs are both a social and a nutritional out-let. Because their supporters are very committed andtheir numbers are increasing rapidly, they often con-sider themselves part of a social movement. In theUnited States, the movement began on Robyn VanEn’s Massachusetts farm in 1985, when a friend re-turned from Switzerland and told her about his ex-perience working with a group of Swiss farmers. VanEn was so taken with his account that she launchedher own CSA and announced the idea of “share thecosts to share the harvest” (Henderson and Van En1999).
A CSA-equivalent operation first was developed bya group of women in Japan in 1965 who were con-cerned about “pesticides, the increase in processedand imported foods, and the corresponding decreasein the local farm population” (Henderson and Van En1999, xvi). They approached a local farmer and cre-ated a cooperative agreement to support the farmoperation in exchange for a share of the harvest.Thus, the distant origin of the U.S. CSA is the teikeimovement in Japan. Currently, Japan has more than600 producer-consumer groups, which supply food tomore than 11 million people (University of Wiscon-sin–Madison 2001).
Introduced into the United States in 1986, commu-nity supported farms now are estimated to numberapproximately 1,000 in the United States. The factthat in 1996, the 65 CSAs in Wisconsin produced foodfor an estimated 3,000 households exemplifies theireffect on urban and suburban households. But CSAsare such a recent development in the U.S. food andagricultural system that little formal documentationabout their effect exists. Given their rapid acceptance,however, it is possible that they will follow the farm-ers’ markets movement, filling a niche for urban con-sumers hungry for a closer connection with farmingand the land.
Entrepreneurial Food Gardens and FarmsAgriculture in the United States is taking on a new
look. The change is driven by such factors as farm-ers’ needs to retain more profit, public concern aboutpotentially negative effects of farming on the environ-ment, and family efforts to engage in more satisfyinglife styles. As a result, farmers (and gardeners) arebecoming increasingly entrepreneurial. For example,they are adding value to their products by marketingprocessed products or by selling a special product
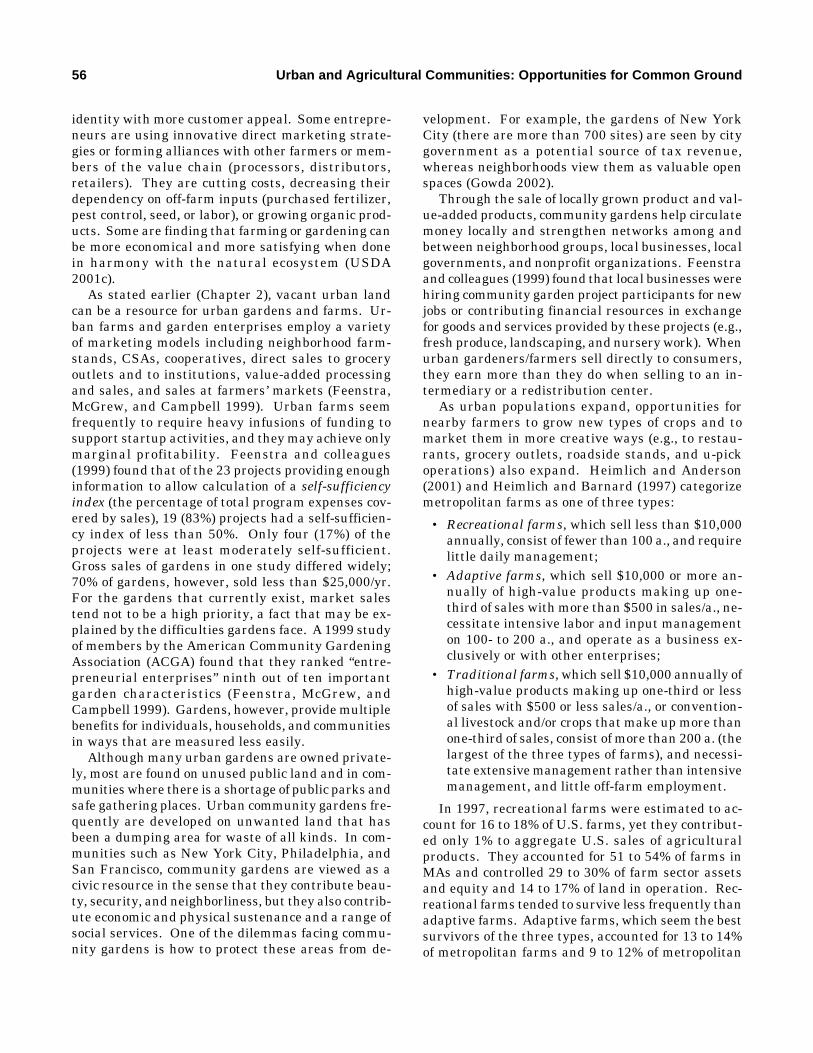
56 Urban and Agricultural Communities: Opportunities for Common Ground
identity with more customer appeal. Some entrepre-neurs are using innovative direct marketing strate-gies or forming alliances with other farmers or mem-bers of the value chain (processors, distributors,retailers). They are cutting costs, decreasing theirdependency on off-farm inputs (purchased fertilizer,pest control, seed, or labor), or growing organic prod-ucts. Some are finding that farming or gardening canbe more economical and more satisfying when donein harmony with the natural ecosystem (USDA2001c).
As stated earlier (Chapter 2), vacant urban landcan be a resource for urban gardens and farms. Ur-ban farms and garden enterprises employ a varietyof marketing models including neighborhood farm-stands, CSAs, cooperatives, direct sales to groceryoutlets and to institutions, value-added processingand sales, and sales at farmers’ markets (Feenstra,McGrew, and Campbell 1999). Urban farms seemfrequently to require heavy infusions of funding tosupport startup activities, and they may achieve onlymarginal profitability. Feenstra and colleagues(1999) found that of the 23 projects providing enoughinformation to allow calculation of a self-sufficiencyindex (the percentage of total program expenses cov-ered by sales), 19 (83%) projects had a self-sufficien-cy index of less than 50%. Only four (17%) of theprojects were at least moderately self-sufficient.Gross sales of gardens in one study differed widely;70% of gardens, however, sold less than $25,000/yr.For the gardens that currently exist, market salestend not to be a high priority, a fact that may be ex-plained by the difficulties gardens face. A 1999 studyof members by the American Community GardeningAssociation (ACGA) found that they ranked “entre-preneurial enterprises” ninth out of ten importantgarden characteristics (Feenstra, McGrew, andCampbell 1999). Gardens, however, provide multiplebenefits for individuals, households, and communitiesin ways that are measured less easily.
Although many urban gardens are owned private-ly, most are found on unused public land and in com-munities where there is a shortage of public parks andsafe gathering places. Urban community gardens fre-quently are developed on unwanted land that hasbeen a dumping area for waste of all kinds. In com-munities such as New York City, Philadelphia, andSan Francisco, community gardens are viewed as acivic resource in the sense that they contribute beau-ty, security, and neighborliness, but they also contrib-ute economic and physical sustenance and a range ofsocial services. One of the dilemmas facing commu-nity gardens is how to protect these areas from de-
velopment. For example, the gardens of New YorkCity (there are more than 700 sites) are seen by citygovernment as a potential source of tax revenue,whereas neighborhoods view them as valuable openspaces (Gowda 2002).
Through the sale of locally grown product and val-ue-added products, community gardens help circulatemoney locally and strengthen networks among andbetween neighborhood groups, local businesses, localgovernments, and nonprofit organizations. Feenstraand colleagues (1999) found that local businesses werehiring community garden project participants for newjobs or contributing financial resources in exchangefor goods and services provided by these projects (e.g.,fresh produce, landscaping, and nursery work). Whenurban gardeners/farmers sell directly to consumers,they earn more than they do when selling to an in-termediary or a redistribution center.
As urban populations expand, opportunities fornearby farmers to grow new types of crops and tomarket them in more creative ways (e.g., to restau-rants, grocery outlets, roadside stands, and u-pickoperations) also expand. Heimlich and Anderson(2001) and Heimlich and Barnard (1997) categorizemetropolitan farms as one of three types:
• Recreational farms, which sell less than $10,000annually, consist of fewer than 100 a., and requirelittle daily management;
• Adaptive farms, which sell $10,000 or more an-nually of high-value products making up one-third of sales with more than $500 in sales/a., ne-cessitate intensive labor and input managementon 100- to 200 a., and operate as a business ex-clusively or with other enterprises;
• Traditional farms, which sell $10,000 annually ofhigh-value products making up one-third or lessof sales with $500 or less sales/a., or convention-al livestock and/or crops that make up more thanone-third of sales, consist of more than 200 a. (thelargest of the three types of farms), and necessi-tate extensive management rather than intensivemanagement, and little off-farm employment.
In 1997, recreational farms were estimated to ac-count for 16 to 18% of U.S. farms, yet they contribut-ed only 1% to aggregate U.S. sales of agriculturalproducts. They accounted for 51 to 54% of farms inMAs and controlled 29 to 30% of farm sector assetsand equity and 14 to 17% of land in operation. Rec-reational farms tended to survive less frequently thanadaptive farms. Adaptive farms, which seem the bestsurvivors of the three types, accounted for 13 to 14%of metropolitan farms and 9 to 12% of metropolitan
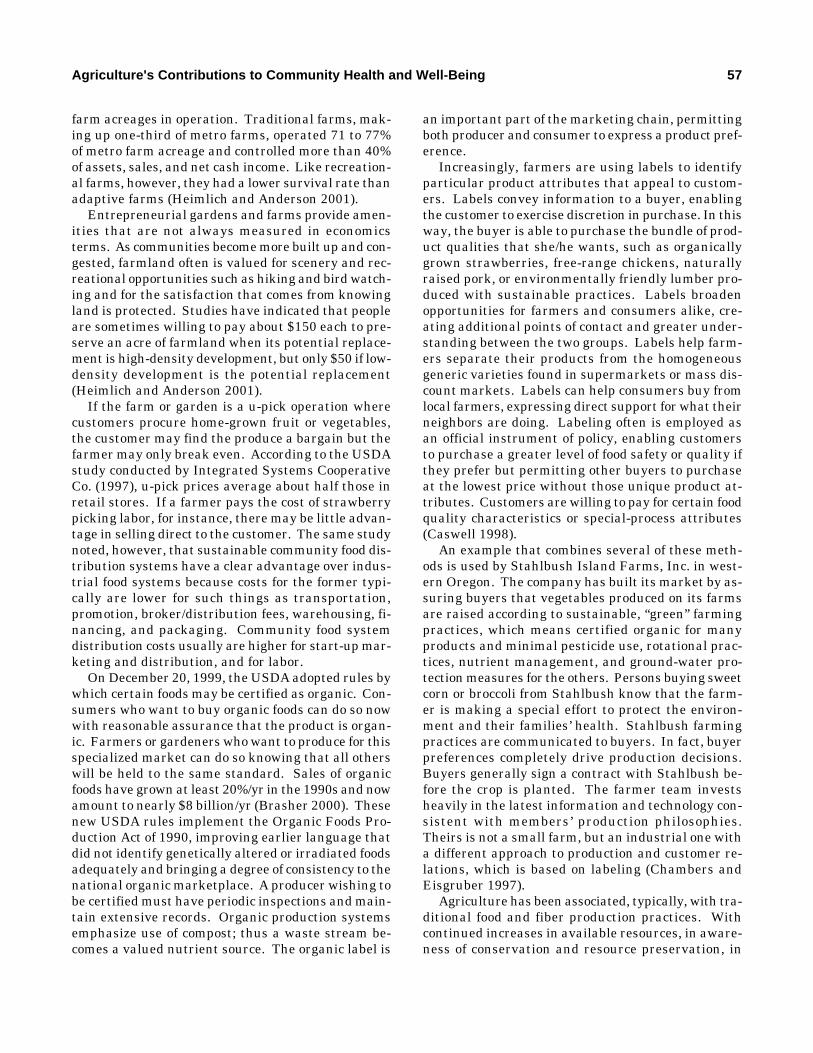
Agriculture's Contributions to Community Health and Well-Being 57
farm acreages in operation. Traditional farms, mak-ing up one-third of metro farms, operated 71 to 77%of metro farm acreage and controlled more than 40%of assets, sales, and net cash income. Like recreation-al farms, however, they had a lower survival rate thanadaptive farms (Heimlich and Anderson 2001).
Entrepreneurial gardens and farms provide amen-ities that are not always measured in economicsterms. As communities become more built up and con-gested, farmland often is valued for scenery and rec-reational opportunities such as hiking and bird watch-ing and for the satisfaction that comes from knowingland is protected. Studies have indicated that peopleare sometimes willing to pay about $150 each to pre-serve an acre of farmland when its potential replace-ment is high-density development, but only $50 if low-density development is the potential replacement(Heimlich and Anderson 2001).
If the farm or garden is a u-pick operation wherecustomers procure home-grown fruit or vegetables,the customer may find the produce a bargain but thefarmer may only break even. According to the USDAstudy conducted by Integrated Systems CooperativeCo. (1997), u-pick prices average about half those inretail stores. If a farmer pays the cost of strawberrypicking labor, for instance, there may be little advan-tage in selling direct to the customer. The same studynoted, however, that sustainable community food dis-tribution systems have a clear advantage over indus-trial food systems because costs for the former typi-cally are lower for such things as transportation,promotion, broker/distribution fees, warehousing, fi-nancing, and packaging. Community food systemdistribution costs usually are higher for start-up mar-keting and distribution, and for labor.
On December 20, 1999, the USDA adopted rules bywhich certain foods may be certified as organic. Con-sumers who want to buy organic foods can do so nowwith reasonable assurance that the product is organ-ic. Farmers or gardeners who want to produce for thisspecialized market can do so knowing that all otherswill be held to the same standard. Sales of organicfoods have grown at least 20%/yr in the 1990s and nowamount to nearly $8 billion/yr (Brasher 2000). Thesenew USDA rules implement the Organic Foods Pro-duction Act of 1990, improving earlier language thatdid not identify genetically altered or irradiated foodsadequately and bringing a degree of consistency to thenational organic marketplace. A producer wishing tobe certified must have periodic inspections and main-tain extensive records. Organic production systemsemphasize use of compost; thus a waste stream be-comes a valued nutrient source. The organic label is
an important part of the marketing chain, permittingboth producer and consumer to express a product pref-erence.
Increasingly, farmers are using labels to identifyparticular product attributes that appeal to custom-ers. Labels convey information to a buyer, enablingthe customer to exercise discretion in purchase. In thisway, the buyer is able to purchase the bundle of prod-uct qualities that she/he wants, such as organicallygrown strawberries, free-range chickens, naturallyraised pork, or environmentally friendly lumber pro-duced with sustainable practices. Labels broadenopportunities for farmers and consumers alike, cre-ating additional points of contact and greater under-standing between the two groups. Labels help farm-ers separate their products from the homogeneousgeneric varieties found in supermarkets or mass dis-count markets. Labels can help consumers buy fromlocal farmers, expressing direct support for what theirneighbors are doing. Labeling often is employed asan official instrument of policy, enabling customersto purchase a greater level of food safety or quality ifthey prefer but permitting other buyers to purchaseat the lowest price without those unique product at-tributes. Customers are willing to pay for certain foodquality characteristics or special-process attributes(Caswell 1998).
An example that combines several of these meth-ods is used by Stahlbush Island Farms, Inc. in west-ern Oregon. The company has built its market by as-suring buyers that vegetables produced on its farmsare raised according to sustainable, “green” farmingpractices, which means certified organic for manyproducts and minimal pesticide use, rotational prac-tices, nutrient management, and ground-water pro-tection measures for the others. Persons buying sweetcorn or broccoli from Stahlbush know that the farm-er is making a special effort to protect the environ-ment and their families’ health. Stahlbush farmingpractices are communicated to buyers. In fact, buyerpreferences completely drive production decisions.Buyers generally sign a contract with Stahlbush be-fore the crop is planted. The farmer team investsheavily in the latest information and technology con-sistent with members’ production philosophies.Theirs is not a small farm, but an industrial one witha different approach to production and customer re-lations, which is based on labeling (Chambers andEisgruber 1997).
Agriculture has been associated, typically, with tra-ditional food and fiber production practices. Withcontinued increases in available resources, in aware-ness of conservation and resource preservation, in
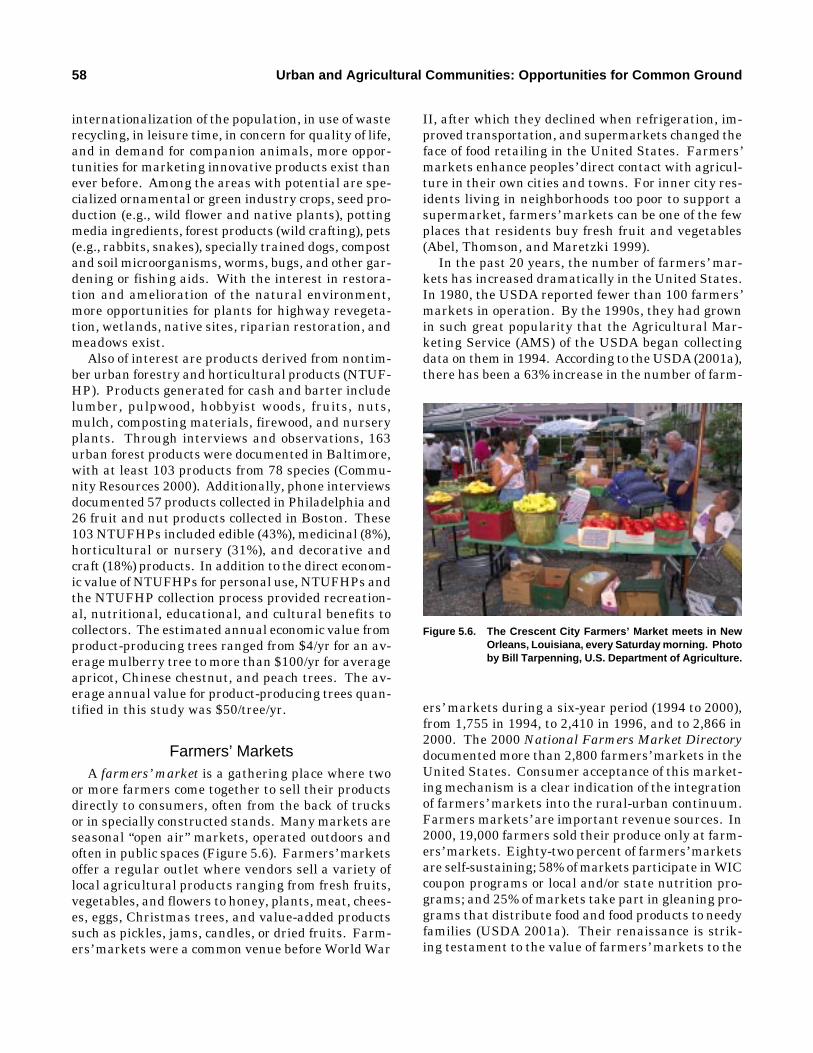
58 Urban and Agricultural Communities: Opportunities for Common Ground
internationalization of the population, in use of wasterecycling, in leisure time, in concern for quality of life,and in demand for companion animals, more oppor-tunities for marketing innovative products exist thanever before. Among the areas with potential are spe-cialized ornamental or green industry crops, seed pro-duction (e.g., wild flower and native plants), pottingmedia ingredients, forest products (wild crafting), pets(e.g., rabbits, snakes), specially trained dogs, compostand soil microorganisms, worms, bugs, and other gar-dening or fishing aids. With the interest in restora-tion and amelioration of the natural environment,more opportunities for plants for highway revegeta-tion, wetlands, native sites, riparian restoration, andmeadows exist.
Also of interest are products derived from nontim-ber urban forestry and horticultural products (NTUF-HP). Products generated for cash and barter includelumber, pulpwood, hobbyist woods, fruits, nuts,mulch, composting materials, firewood, and nurseryplants. Through interviews and observations, 163urban forest products were documented in Baltimore,with at least 103 products from 78 species (Commu-nity Resources 2000). Additionally, phone interviewsdocumented 57 products collected in Philadelphia and26 fruit and nut products collected in Boston. These103 NTUFHPs included edible (43%), medicinal (8%),horticultural or nursery (31%), and decorative andcraft (18%) products. In addition to the direct econom-ic value of NTUFHPs for personal use, NTUFHPs andthe NTUFHP collection process provided recreation-al, nutritional, educational, and cultural benefits tocollectors. The estimated annual economic value fromproduct-producing trees ranged from $4/yr for an av-erage mulberry tree to more than $100/yr for averageapricot, Chinese chestnut, and peach trees. The av-erage annual value for product-producing trees quan-tified in this study was $50/tree/yr.
Farmers’ MarketsA farmers’ market is a gathering place where two
or more farmers come together to sell their productsdirectly to consumers, often from the back of trucksor in specially constructed stands. Many markets areseasonal “open air” markets, operated outdoors andoften in public spaces (Figure 5.6). Farmers’ marketsoffer a regular outlet where vendors sell a variety oflocal agricultural products ranging from fresh fruits,vegetables, and flowers to honey, plants, meat, chees-es, eggs, Christmas trees, and value-added productssuch as pickles, jams, candles, or dried fruits. Farm-ers’ markets were a common venue before World War
II, after which they declined when refrigeration, im-proved transportation, and supermarkets changed theface of food retailing in the United States. Farmers’markets enhance peoples’ direct contact with agricul-ture in their own cities and towns. For inner city res-idents living in neighborhoods too poor to support asupermarket, farmers’ markets can be one of the fewplaces that residents buy fresh fruit and vegetables(Abel, Thomson, and Maretzki 1999).
In the past 20 years, the number of farmers’ mar-kets has increased dramatically in the United States.In 1980, the USDA reported fewer than 100 farmers’markets in operation. By the 1990s, they had grownin such great popularity that the Agricultural Mar-keting Service (AMS) of the USDA began collectingdata on them in 1994. According to the USDA (2001a),there has been a 63% increase in the number of farm-
Figure 5.6. The Crescent City Farmers’ Market meets in NewOrleans, Louisiana, every Saturday morning. Photoby Bill Tarpenning, U.S. Department of Agriculture.
ers’ markets during a six-year period (1994 to 2000),from 1,755 in 1994, to 2,410 in 1996, and to 2,866 in2000. The 2000 National Farmers Market Directorydocumented more than 2,800 farmers’ markets in theUnited States. Consumer acceptance of this market-ing mechanism is a clear indication of the integrationof farmers’ markets into the rural-urban continuum.Farmers markets’ are important revenue sources. In2000, 19,000 farmers sold their produce only at farm-ers’ markets. Eighty-two percent of farmers’ marketsare self-sustaining; 58% of markets participate in WICcoupon programs or local and/or state nutrition pro-grams; and 25% of markets take part in gleaning pro-grams that distribute food and food products to needyfamilies (USDA 2001a). Their renaissance is strik-ing testament to the value of farmers’ markets to the
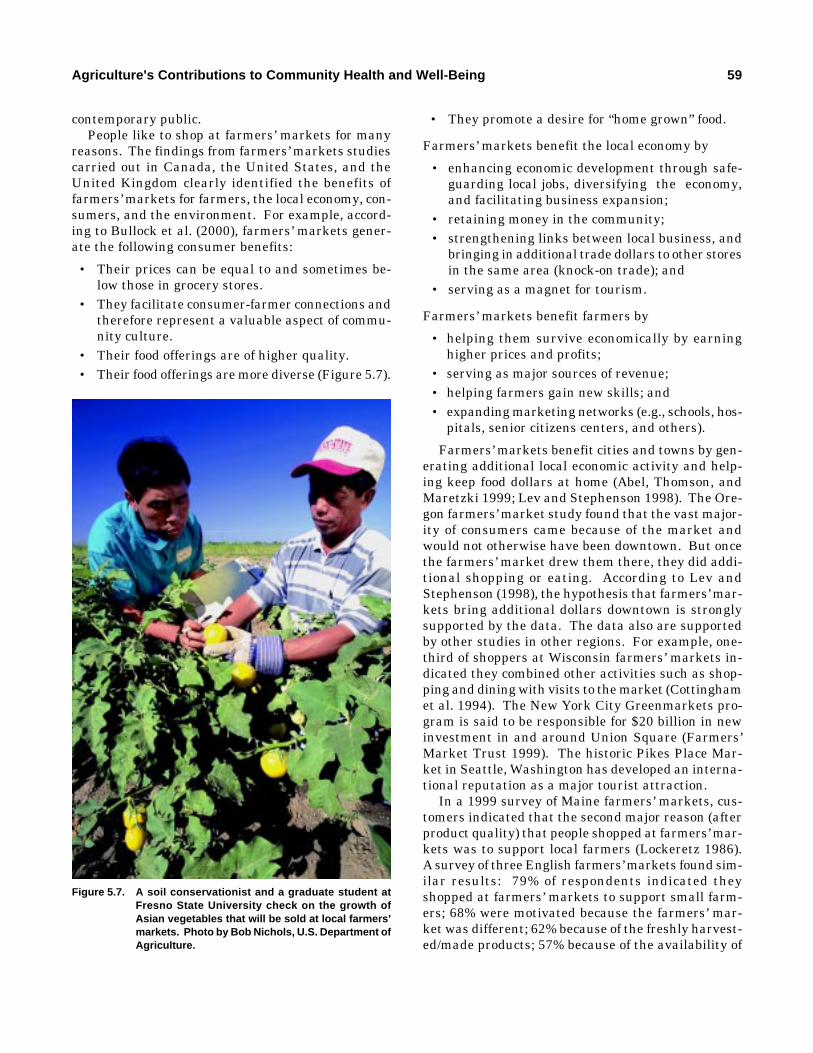
Agriculture's Contributions to Community Health and Well-Being 59
contemporary public.People like to shop at farmers’ markets for many
reasons. The findings from farmers’ markets studiescarried out in Canada, the United States, and theUnited Kingdom clearly identified the benefits offarmers’ markets for farmers, the local economy, con-sumers, and the environment. For example, accord-ing to Bullock et al. (2000), farmers’ markets gener-ate the following consumer benefits:
• Their prices can be equal to and sometimes be-low those in grocery stores.
• They facilitate consumer-farmer connections andtherefore represent a valuable aspect of commu-nity culture.
• Their food offerings are of higher quality.• Their food offerings are more diverse (Figure 5.7).
• They promote a desire for “home grown” food.
Farmers’ markets benefit the local economy by
• enhancing economic development through safe-guarding local jobs, diversifying the economy,and facilitating business expansion;
• retaining money in the community;• strengthening links between local business, and
bringing in additional trade dollars to other storesin the same area (knock-on trade); and
• serving as a magnet for tourism.
Farmers’ markets benefit farmers by
• helping them survive economically by earninghigher prices and profits;
• serving as major sources of revenue;• helping farmers gain new skills; and• expanding marketing networks (e.g., schools, hos-
pitals, senior citizens centers, and others).
Farmers’ markets benefit cities and towns by gen-erating additional local economic activity and help-ing keep food dollars at home (Abel, Thomson, andMaretzki 1999; Lev and Stephenson 1998). The Ore-gon farmers’ market study found that the vast major-ity of consumers came because of the market andwould not otherwise have been downtown. But oncethe farmers’ market drew them there, they did addi-tional shopping or eating. According to Lev andStephenson (1998), the hypothesis that farmers’ mar-kets bring additional dollars downtown is stronglysupported by the data. The data also are supportedby other studies in other regions. For example, one-third of shoppers at Wisconsin farmers’ markets in-dicated they combined other activities such as shop-ping and dining with visits to the market (Cottinghamet al. 1994). The New York City Greenmarkets pro-gram is said to be responsible for $20 billion in newinvestment in and around Union Square (Farmers’Market Trust 1999). The historic Pikes Place Mar-ket in Seattle, Washington has developed an interna-tional reputation as a major tourist attraction.
In a 1999 survey of Maine farmers’ markets, cus-tomers indicated that the second major reason (afterproduct quality) that people shopped at farmers’ mar-kets was to support local farmers (Lockeretz 1986).A survey of three English farmers’ markets found sim-ilar results: 79% of respondents indicated theyshopped at farmers’ markets to support small farm-ers; 68% were motivated because the farmers’ mar-ket was different; 62% because of the freshly harvest-ed/made products; 57% because of the availability of
Figure 5.7. A soil conservationist and a graduate student atFresno State University check on the growth ofAsian vegetables that will be sold at local farmers’markets. Photo by Bob Nichols, U.S. Department ofAgriculture.
60 Urban and Agricultural Communities: Opportunities for Common Ground
organic produce; and 45% because of the good quali-ty of the products (Wilson, J., reported in Bullock etal. 2000). Farmers’ market customers also cite thefarmers’ market atmosphere as a primary attraction.Customers appreciate the opportunity to get ac-quainted with the person who produces their food,to learn about new foods and food preparation, andto become involved in the entire farmers’ market ex-perience (Abel, Thomson, and Maretzki 1999; Lev andStephenson 1998; Lockeretz 1986).
The Ithaca, New York, farmers’ market is a goodexample of this type of business. The market openedfirst for business in 1973 as a venue in which localgrowers and craftspeople could sell their goods. Itexpanded rapidly and moved five times before mar-ket volunteers transformed a site of former debris intoa thriving community-gathering place called Steam-boat Landing. Now the farmers’ market is locatedpermanently on the waterfront where steamboatsfrom Cayuga Lake used to dock. Visitors shop forfresh, local produce and handcrafted gifts. Custom-ers sit at tables along the waterfront listening tomusic while savoring a wide variety of internationalfoods. Recently a dock was built to accommodate lo-cal fishermen, people arriving by boat, and thosewanting to picnic in a picturesque spot. In the sum-mer, 125 vendors sell at the Ithaca farmers’ marketon one or all of three market days. The market oftendraws more than 5,000 people a day and sales in 1999neared $4 million. What originally was an innova-tive way to sell local produce, crafts, and baked goodsnow is an Ithaca tradition.
Health conscious consumers have spurred the re-vival of farmers’ markets, demonstrating a desire topurchase the freshest produce. The tremendousgrowth in farmers’ market attendance may be partlydue to consumers who have become increasingly in-terested in nutrition, food and environmental safety,and the use of agricultural practices that contributeto improved public health.
In numerous surveys, shoppers ranked freshnessas their main selection factor when buying produceand their primary reason for choosing farmers’ mar-kets (Abel, Thomson, and Maretzke 1999; Lockeretz1986). An Ohio study found that consumers wantfreshness, quality, convenience, selection, and valuewhen selecting fresh produce, and roadside stands orfarmers’ markets are perceived as the best source ofproduce with these features (Rhodus, Schwartz, andHoskins 1994). In taste test studies, beyond fresh-ness, the appearance, nutritional value, and the factthe products were locally produced were listed as rea-sons people shopped at farmers’ markets (Abel,
Thomson, and Maretzki 1999).Consumers were willing to pay more for local prod-
ucts than for similar products at a supermarket. Ina 1998 Oregon study, approximately half the respon-dents to a mail survey said they were willing to paysome premium for a locally produced product, where-as 80% of consumers shopping at farmers’ marketsindicated they would pay a premium over similarproducts at a supermarket. In the same study, 30%of customers indicated that they buy local productsbecause of “the enjoyment of the buying experience,”and 44% rated “supporting the local economy” and“keeping farmers in the local area” as highly as “lo-cal products are better” (Lev and Stephenson 1998).
Farmers’ markets give people, through direct con-nections to farms, a contact with rural life and withtheir food system. These markets foster relationshipsbetween consumers and the people who grow theirfood and promote understanding about food produc-tion.
In an effort to make locally grown food in Massa-chusetts farmers’ markets more available and afford-able to low-income consumers and to increase the con-sumption of fruits and vegetables by nutritionallyat-risk women and children, the Massachusetts De-partment of Food and Agriculture initiated a programwith the Federation of Massachusetts Farmers’ Mar-kets in 1986. It quickly gained in popularity, and in1992 the USDA established the WIC Farmers’ Mar-ket Nutrition Program to provide fresh, nutritious,unprepared foods from farmers’ markets to WIC par-ticipants and to expand the awareness and use offarmers’ markets by consumers. Federal funding in2000 doubled to $12 million.
Seventy-five to one-hundred million dollars in foodstamps are estimated to be spent at farmers’ marketsannually; farmers’ markets also support gleaningprograms, donations to food banks and shelters, andsales to school meal programs.
Farm-to-Table ProgramsFarm-to-table programs connect farms directly
with restaurants, schools, or other institutions thatfeed large numbers of individuals. These programs,often initiated through a small grant, have evolvedin an effort to return a greater share of the food dol-lar to the producer. For example, the Practical Farm-ers of Iowa collaborate with several local organiza-tions through the Community Food Systems Project,through which they broker purchases of local andsustainably produced foods for hotel and restaurantcustomers, conference caterers, and institutional
Agriculture's Contributions to Community Health and Well-Being 61
markets. The program, which initiated an IowaChoice menu, offers its services to university confer-ences and catered meals. The major challenges asso-ciated with this type of program are keeping retailprices sufficiently low to encourage continuing cus-tomer demand, and ensuring continued patronagefrom institutional buyers who are asked to pay a feefor “brokering” services offered by nonprofit organi-zations. One of the future challenges for farm-to-ta-ble programs is to find ways to encourage state, lo-cal, and federal institutions (e.g., prisons, agencies,hospitals, and schools) to purchase directly from farm-ers, thereby supporting their own state, local, andregional farming systems.
Farm-to-school programs link schools’ food pur-chasing and planning in a “healthy farm, healthykids” approach. Young people benefit through being
offered additional choices in healthy foods and im-proved nutrition, and the program decreases the com-mercial influence on school food choices. Additional-ly, this mechanism offers new markets and betterprices for local farmers (Azuma and Fisher 2001). Allstudents, especially those relying on free or low-pricedmeals, can benefit from improved nutritional qualityas well as from educational programs on local agri-culture, nutrition, and food systems. A seven-casestudy by Azuma and Fisher (2001) found there weresubstantial barriers associated with farm-to-schoolprograms (e.g., additional costs for labor and food, andadministrative and logistical challenges). Federal,state, and local policies need to be designed to sup-port local food purchases by schools and otherinstitutions.
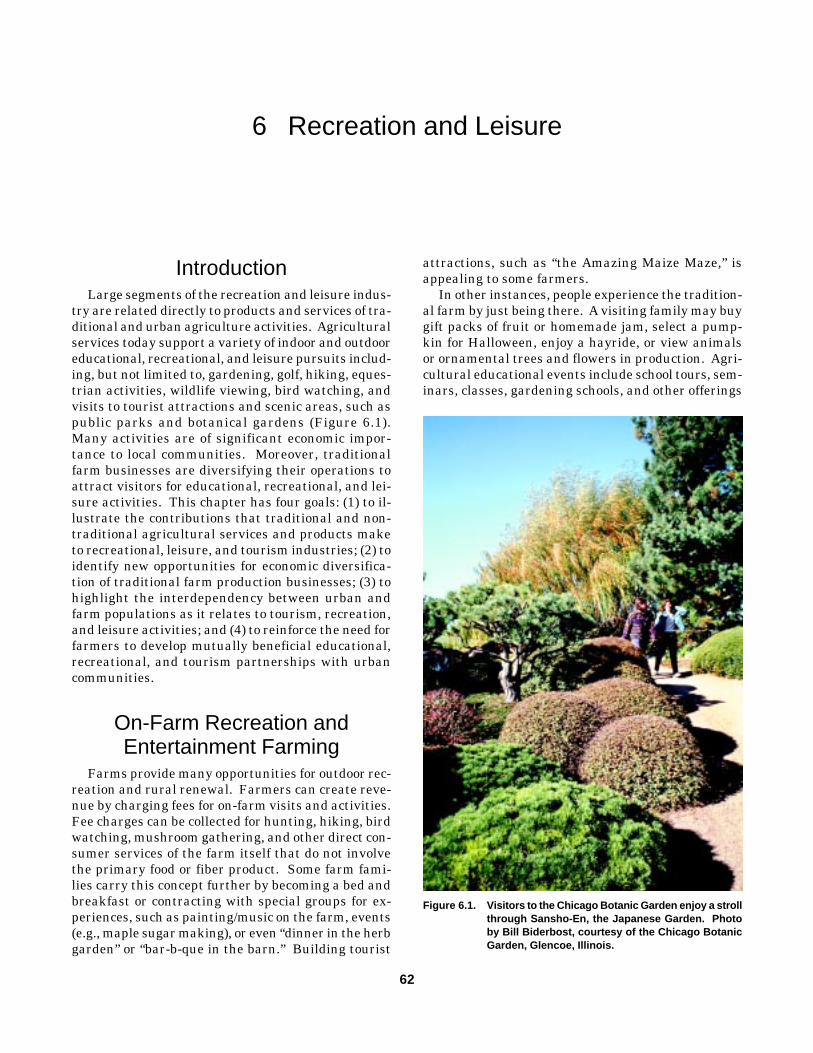
62 Urban and Agricultural Communities: Opportunities for Common Ground
6 Recreation and Leisure
62
IntroductionLarge segments of the recreation and leisure indus-
try are related directly to products and services of tra-ditional and urban agriculture activities. Agriculturalservices today support a variety of indoor and outdooreducational, recreational, and leisure pursuits includ-ing, but not limited to, gardening, golf, hiking, eques-trian activities, wildlife viewing, bird watching, andvisits to tourist attractions and scenic areas, such aspublic parks and botanical gardens (Figure 6.1).Many activities are of significant economic impor-tance to local communities. Moreover, traditionalfarm businesses are diversifying their operations toattract visitors for educational, recreational, and lei-sure activities. This chapter has four goals: (1) to il-lustrate the contributions that traditional and non-traditional agricultural services and products maketo recreational, leisure, and tourism industries; (2) toidentify new opportunities for economic diversifica-tion of traditional farm production businesses; (3) tohighlight the interdependency between urban andfarm populations as it relates to tourism, recreation,and leisure activities; and (4) to reinforce the need forfarmers to develop mutually beneficial educational,recreational, and tourism partnerships with urbancommunities.
On-Farm Recreation andEntertainment Farming
Farms provide many opportunities for outdoor rec-reation and rural renewal. Farmers can create reve-nue by charging fees for on-farm visits and activities.Fee charges can be collected for hunting, hiking, birdwatching, mushroom gathering, and other direct con-sumer services of the farm itself that do not involvethe primary food or fiber product. Some farm fami-lies carry this concept further by becoming a bed andbreakfast or contracting with special groups for ex-periences, such as painting/music on the farm, events(e.g., maple sugar making), or even “dinner in the herbgarden” or “bar-b-que in the barn.” Building tourist
attractions, such as “the Amazing Maize Maze,” isappealing to some farmers.
In other instances, people experience the tradition-al farm by just being there. A visiting family may buygift packs of fruit or homemade jam, select a pump-kin for Halloween, enjoy a hayride, or view animalsor ornamental trees and flowers in production. Agri-cultural educational events include school tours, sem-inars, classes, gardening schools, and other offerings
Figure 6.1. Visitors to the Chicago Botanic Garden enjoy a strollthrough Sansho-En, the Japanese Garden. Photoby Bill Biderbost, courtesy of the Chicago BotanicGarden, Glencoe, Illinois.
Recreation and Leisure 63
through which the group is expected to take away newknowledge and skills regarding agriculture. All thesefarm experiences or services can compete with otherforms of recreation and bring urban people closer tofarms and to farmers.
There are economic benefits of wildlife habitat onthe farm. The Conservation Fund cites significantfindings regarding the economic value of several out-door activities that could be well managed on farms(Conservation Fund 2002). The fund reports that U.S.residents spend $18 billion/yr to watch wildlife, tri-ple what they spend on movies or sporting events.Birdwatchers spend $5.2 billion/yr according to stud-ies by the U.S. Fish and Wildlife Service. A study ofthe Santa Ana National Wildlife Refuge in HildagoCounty, Texas, found that birdwatchers visiting therefuge added $14.4 million to the local economy. Asimilar study found that birders spent $9.7 million ontheir hobby while visiting Virginia’s ChincoteagueNational Wildlife Refuge. According to a 1994 RoperSurvey on Outdoor Recreation, fishing is the favoriterecreational activity among men (19%). In 1991, an-glers spent $24 billion, or an average of $674 each ontheir hobby. In 1986, 30 million U.S. anglers spent$301 million on licenses; U.S. hunters spent $322million, and according to the California Office of Eco-nomic Research, campers spent more than $2 billionin California in 1990. This spending especially bene-fits rural areas.
M and M Hunting Lodge on the eastern shore ofDelaware provides goose, dove, and duck hunting onwhat used to be a dairy farm. The owners eventuallyrented additional farmland for the hunting and de-veloped a conference center on site for get-away work-shops. They provide a guide service and other amen-ities to make an outdoor weekend more comfortable.Fee hunting and overnight accommodations have re-placed milk as the primary income source on thesefarms.
The rough uplands of Illinois farms near the Mis-sissippi River provide cover for deer and game birdsvalued highly by nearby urbanites. The same man-agement and marketing skills necessary for growingand selling grain can be applied to the deer and oth-er wildlife on the farm (Miller 1999). Hunters will payas much as $600/acre for access to prime deer territo-ry during hunting season. Leased hunting rights arean alternative, and even hunter outfitters who pro-vide all the necessary equipment can find lucrativeopportunities on Illinois farms. Estimates are that432,000 hunters spend 15 days each in Illinois, a to-tal of 6.4 million hunting days a year providing greateconomic potential.
Back Roads Adventures attracts urban touristsfrom Pittsburgh, Cleveland, Philadelphia, Washing-ton, D.C., and other cities to the quiet of Preston Coun-ty, West Virginia. The company arranges tours forfamilies or individuals through the small towns andfarms of the region. It is essentially a tour company,a specialized travel agent for those wishing to expe-rience country landscapes, farm crops, animals, andactivities, as well as the crafts, folklore, foods, andinns of backcountry West Virginia. Tour packagesrange from day to multiple-day trips and are pricedaccordingly.
The Wal-Mech Farm Bed and Breakfast in Thorn-ville, Ohio, is a working grain and hay farm that hasguest rooms for visitors. The owners will help thosewho want to, to travel in the surrounding area. Butthey expect most guests to stay on the farm, enjoyingthe fresh air and general activities. This is primarilya farm with a bed and breakfast opportunity on theside (Mechling 1990).
Graf Growers in northeastern Ohio offers a year-round collage of farm experiences including fee-basedseminars in winter months on topics such as containergardening, herb gardening, perennials, and firewood.In October, they charge for hayrides, a cornstalkmaze, apple-cider making, and pumpkins supplied toschools. Also, there are Christmas trees and poinset-tias as well as a fully stocked farmers’ market all sum-mer. All of this is well advertised with a web pageand reinforced with brochures and fact sheets (GrafGrowers 2001).
Every state seems to have similar opportunities forgenerating revenue from on-farm recreational activ-ities. The food production part of the operation, thegrain, and cover it provides, facilitate the recreation-al experience. People will pay to visit farms and viewareas containing wild and domestic animals in a nat-ural environment such as grain fields, adjacent wood-lots, streams, or ponds.
Consumer HorticultureGardening is one of the most popular recreational/
leisure activities in the United States today. Accord-ing to a National Gardening Association survey, anestimated 67 million U.S. households spent more than$33 billion on lawn and garden activities in 1999(Reedy 2001). This was an 11% increase over totaldollars spent in 1998. Gardening supplies and ser-vices constitute the fifth-largest household cash out-lay in 1997 according to the Consumer ExpenditureSurvey from the Bureau of Labor Statistics (RoperReports Worldwide 1999). More than 42 million
64 Urban and Agricultural Communities: Opportunities for Common Ground
households list flower gardening as a primary leisureactivity (Effortless Gardening 2002). For the pastthree decades, demand from home-gardeners for un-biased, research-based horticulture information hasbeen increasing continually. To meet this enormousdemand, the state of Washington’s Cooperative Ex-tension service created the Master Gardeners (MGs)program in 1972. Since its inception, the MGs pro-gram has grown from one county to more than 1,000active training programs in all 50 states and fourCanadian provinces. The jointly funded (state, coun-ty, and federal) Cooperative Extension MGs programtrains volunteer partners who in turn work underextension’s auspices to provide horticultural and land-scape information and training for urban and ruralaudiences. The MGs program emphasizes a widevariety of environmental issues such as water conser-vation and quality, environmental protection, ener-gy conservation, and yard waste management. Oth-er areas of subject matter training include communitygreening, home and community gardening, youtheducation through 4-H horticulture, and health andwell-being programming for work with elderly anddisabled individuals. In Virginia, more than 20,000people have been trained as Virginia CooperativeExtension Master Gardeners since 1980. From 1995to 2000, Oklahoma Cooperative Extension specialistshave certified 1,200 MGs, who have volunteered formore than 123,000 service hours. In larger statessuch as Florida, MGs volunteered 730,000 servicehours from 1991 to 1996. This was valued as a netin-kind donation of more than $4.6 million (Ruppert,Bradshaw, and Stewart 1997).
The increased demand for gardening, landscapeand lawn care information, educational programming,and horticulture plant and hard-good products is ex-pected to continue well into this century (Dickson2001; Reedy 2001). To meet this continued demand,the television broadcast industry, which often part-ners with LGU institutions, is focusing on ways to pro-vide gardening and landscape information to the gen-eral public. For example, the television show“Oklahoma Gardening” is a joint partnership betweenOklahoma State University and the Oklahoma Pub-lic Television Network. Initiated in 1975, this showis now broadcast twice/wk, 52 wk/yr and has a week-ly audience of 175,000. This is equivalent to 9.1 mil-lion people receiving educational gardening and land-scaping information annually. Over the past tenyears, the “Oklahoma Gardening” audience has grownby 700%. This show supplies consumers with science-based, decision-making information about plant andproduct selection, appropriate landscape design, wild-
life control, and gardening practices. The show also gen-erates revenue for businesses sponsoring the programand/or selling products and services featured on it.
Horticultural TourismPlants are an essential part of the urban tourism
experience. Flower, vegetable, and tree festivals areheld year round to promote tourism and economicdevelopment. Many states or regions hold major gar-den shows or festivals. These activities generate mil-lions of dollars for the local economy. Seattle, Bos-ton, and Philadelphia host some of the nation’s largestflower and garden shows. Nearly 40 million U.S. res-idents, or 20%, went on a garden tour, visited a bo-tanical garden, attended a gardening show or festi-val, or participated in a garden-related activity in thepast five years (TIA 2001). Plants serve many pur-poses: to make the location more relaxing and sooth-ing and to add color and excitement, among others.In a National Gardening Association survey conduct-ed by the Gallup Organization (Relf, McDaniel, andButterfield 1992), 50% of respondents indicated thatplants and flowers at theme parks, shopping centers,historic sites, golf courses, public gardens, and restau-rants contributed to the enjoyment of their visits.
Plants also serve an educational function, as evi-denced by botanical gardens and conservatories; ul-timately, they are a business investment. To deter-mine the value of interior plants to the hotel/tourismindustry, Evans and Malone (1992) conducted a studyat Opryland in Nashville, Tennessee. The 12 a. ofindoor space has approximately 18,000 plants valuedat more than $1 million. The annual horticulturalservice budget is approximately $1.2 million. Thestudy attributes several positive effects to the“greatscapes,” including a high occupancy rate of 85%and numerous national awards. Most important, thehigher costs and occupancy rates for those rooms over-looking the gardens generate $7 million in addition-al annual room revenue.
Touring Green Industry BusinessesAgritourism in the horticulture industry is increas-
ing in popularity. Because the horticulture industryproduction units often have visual appeal, at leastduring some portion of the year, considerable oppor-tunity exists to combine a production function with atourism function (Figure 6.2). The Loudoun CountyVirginia Economic Development Office organizesthree agritourism events annually and produces anattractive brochure and map for each. The Color
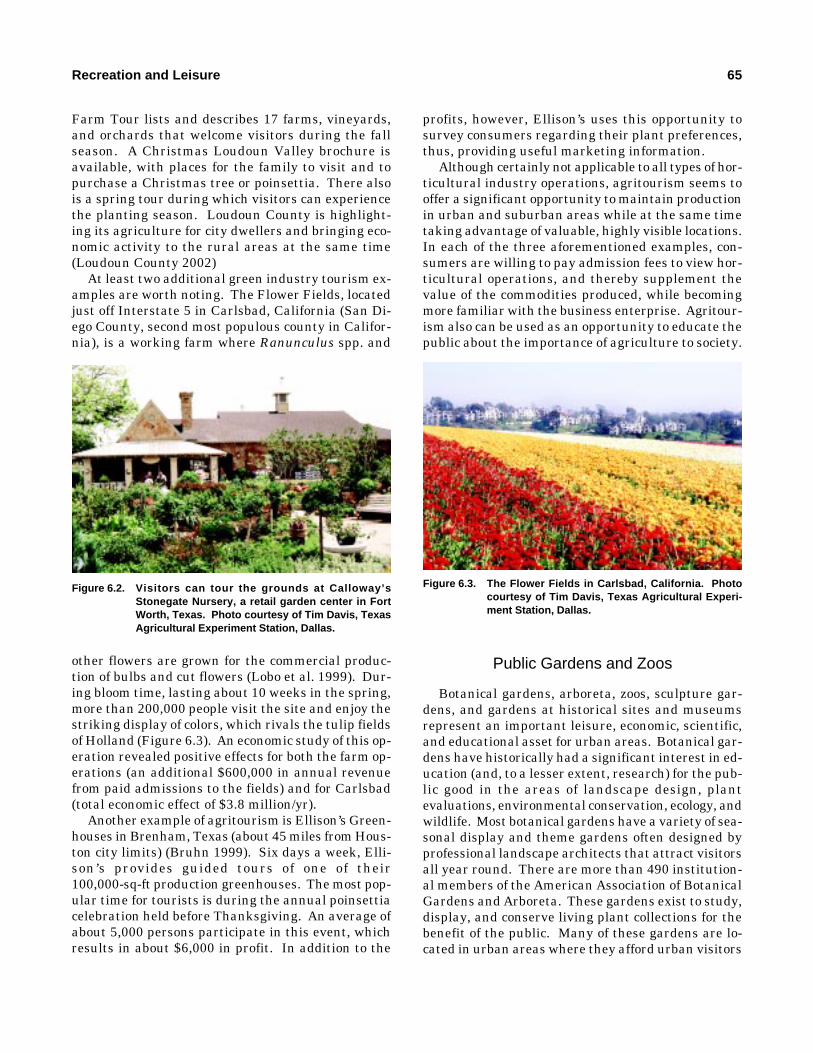
Recreation and Leisure 65
Farm Tour lists and describes 17 farms, vineyards,and orchards that welcome visitors during the fallseason. A Christmas Loudoun Valley brochure isavailable, with places for the family to visit and topurchase a Christmas tree or poinsettia. There alsois a spring tour during which visitors can experiencethe planting season. Loudoun County is highlight-ing its agriculture for city dwellers and bringing eco-nomic activity to the rural areas at the same time(Loudoun County 2002)
At least two additional green industry tourism ex-amples are worth noting. The Flower Fields, locatedjust off Interstate 5 in Carlsbad, California (San Di-ego County, second most populous county in Califor-nia), is a working farm where Ranunculus spp. and
profits, however, Ellison’s uses this opportunity tosurvey consumers regarding their plant preferences,thus, providing useful marketing information.
Although certainly not applicable to all types of hor-ticultural industry operations, agritourism seems tooffer a significant opportunity to maintain productionin urban and suburban areas while at the same timetaking advantage of valuable, highly visible locations.In each of the three aforementioned examples, con-sumers are willing to pay admission fees to view hor-ticultural operations, and thereby supplement thevalue of the commodities produced, while becomingmore familiar with the business enterprise. Agritour-ism also can be used as an opportunity to educate thepublic about the importance of agriculture to society.
Figure 6.2. Visitors can tour the grounds at Calloway’sStonegate Nursery, a retail garden center in FortWorth, Texas. Photo courtesy of Tim Davis, TexasAgricultural Experiment Station, Dallas.
Figure 6.3. The Flower Fields in Carlsbad, California. Photocourtesy of Tim Davis, Texas Agricultural Experi-ment Station, Dallas.
other flowers are grown for the commercial produc-tion of bulbs and cut flowers (Lobo et al. 1999). Dur-ing bloom time, lasting about 10 weeks in the spring,more than 200,000 people visit the site and enjoy thestriking display of colors, which rivals the tulip fieldsof Holland (Figure 6.3). An economic study of this op-eration revealed positive effects for both the farm op-erations (an additional $600,000 in annual revenuefrom paid admissions to the fields) and for Carlsbad(total economic effect of $3.8 million/yr).
Another example of agritourism is Ellison’s Green-houses in Brenham, Texas (about 45 miles from Hous-ton city limits) (Bruhn 1999). Six days a week, Elli-son’s provides guided tours of one of their100,000-sq-ft production greenhouses. The most pop-ular time for tourists is during the annual poinsettiacelebration held before Thanksgiving. An average ofabout 5,000 persons participate in this event, whichresults in about $6,000 in profit. In addition to the
Public Gardens and Zoos
Botanical gardens, arboreta, zoos, sculpture gar-dens, and gardens at historical sites and museumsrepresent an important leisure, economic, scientific,and educational asset for urban areas. Botanical gar-dens have historically had a significant interest in ed-ucation (and, to a lesser extent, research) for the pub-lic good in the areas of landscape design, plantevaluations, environmental conservation, ecology, andwildlife. Most botanical gardens have a variety of sea-sonal display and theme gardens often designed byprofessional landscape architects that attract visitorsall year round. There are more than 490 institution-al members of the American Association of BotanicalGardens and Arboreta. These gardens exist to study,display, and conserve living plant collections for thebenefit of the public. Many of these gardens are lo-cated in urban areas where they afford urban visitors
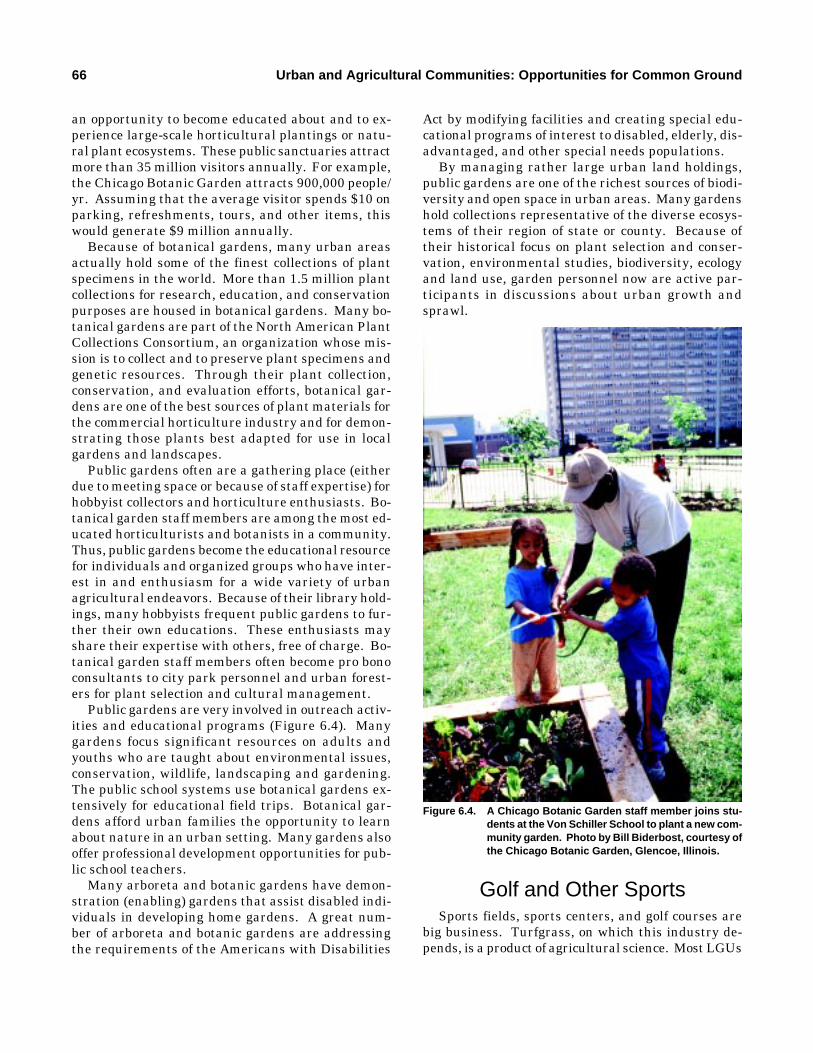
66 Urban and Agricultural Communities: Opportunities for Common Ground
an opportunity to become educated about and to ex-perience large-scale horticultural plantings or natu-ral plant ecosystems. These public sanctuaries attractmore than 35 million visitors annually. For example,the Chicago Botanic Garden attracts 900,000 people/yr. Assuming that the average visitor spends $10 onparking, refreshments, tours, and other items, thiswould generate $9 million annually.
Because of botanical gardens, many urban areasactually hold some of the finest collections of plantspecimens in the world. More than 1.5 million plantcollections for research, education, and conservationpurposes are housed in botanical gardens. Many bo-tanical gardens are part of the North American PlantCollections Consortium, an organization whose mis-sion is to collect and to preserve plant specimens andgenetic resources. Through their plant collection,conservation, and evaluation efforts, botanical gar-dens are one of the best sources of plant materials forthe commercial horticulture industry and for demon-strating those plants best adapted for use in localgardens and landscapes.
Public gardens often are a gathering place (eitherdue to meeting space or because of staff expertise) forhobbyist collectors and horticulture enthusiasts. Bo-tanical garden staff members are among the most ed-ucated horticulturists and botanists in a community.Thus, public gardens become the educational resourcefor individuals and organized groups who have inter-est in and enthusiasm for a wide variety of urbanagricultural endeavors. Because of their library hold-ings, many hobbyists frequent public gardens to fur-ther their own educations. These enthusiasts mayshare their expertise with others, free of charge. Bo-tanical garden staff members often become pro bonoconsultants to city park personnel and urban forest-ers for plant selection and cultural management.
Public gardens are very involved in outreach activ-ities and educational programs (Figure 6.4). Manygardens focus significant resources on adults andyouths who are taught about environmental issues,conservation, wildlife, landscaping and gardening.The public school systems use botanical gardens ex-tensively for educational field trips. Botanical gar-dens afford urban families the opportunity to learnabout nature in an urban setting. Many gardens alsooffer professional development opportunities for pub-lic school teachers.
Many arboreta and botanic gardens have demon-stration (enabling) gardens that assist disabled indi-viduals in developing home gardens. A great num-ber of arboreta and botanic gardens are addressingthe requirements of the Americans with Disabilities
Act by modifying facilities and creating special edu-cational programs of interest to disabled, elderly, dis-advantaged, and other special needs populations.
By managing rather large urban land holdings,public gardens are one of the richest sources of biodi-versity and open space in urban areas. Many gardenshold collections representative of the diverse ecosys-tems of their region of state or county. Because oftheir historical focus on plant selection and conser-vation, environmental studies, biodiversity, ecologyand land use, garden personnel now are active par-ticipants in discussions about urban growth andsprawl.
Figure 6.4. A Chicago Botanic Garden staff member joins stu-dents at the Von Schiller School to plant a new com-munity garden. Photo by Bill Biderbost, courtesy ofthe Chicago Botanic Garden, Glencoe, Illinois.
Golf and Other SportsSports fields, sports centers, and golf courses are
big business. Turfgrass, on which this industry de-pends, is a product of agricultural science. Most LGUs
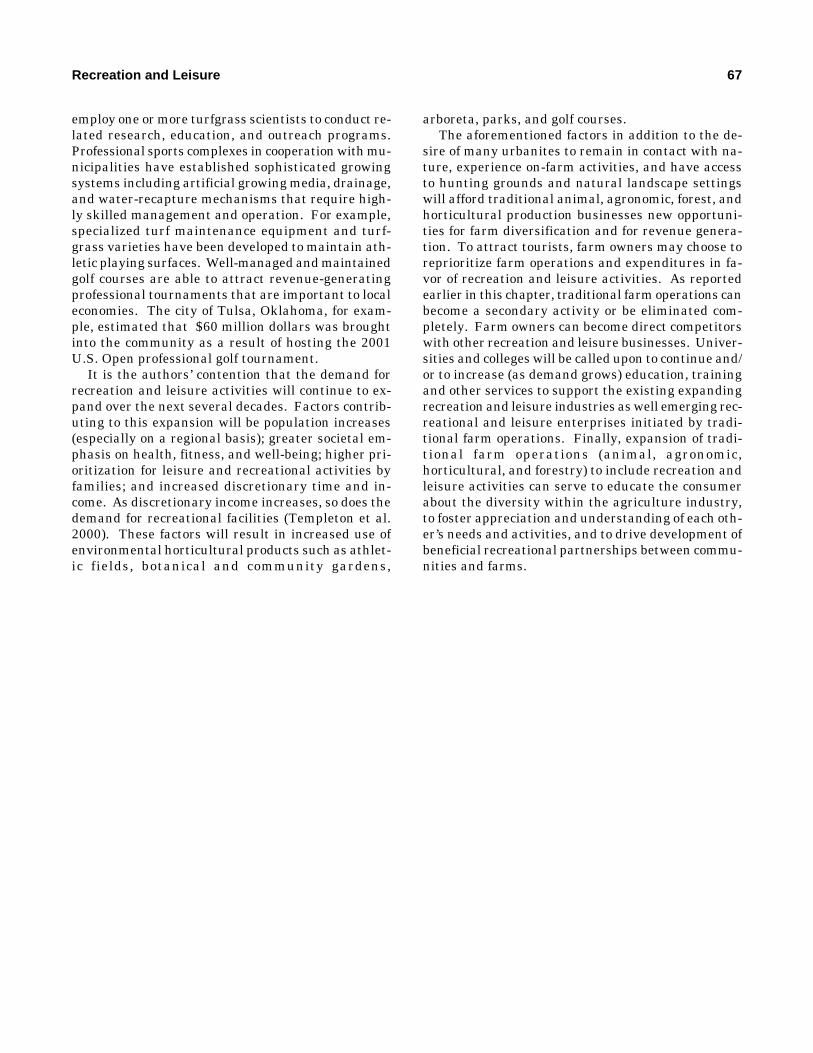
Recreation and Leisure 67
employ one or more turfgrass scientists to conduct re-lated research, education, and outreach programs.Professional sports complexes in cooperation with mu-nicipalities have established sophisticated growingsystems including artificial growing media, drainage,and water-recapture mechanisms that require high-ly skilled management and operation. For example,specialized turf maintenance equipment and turf-grass varieties have been developed to maintain ath-letic playing surfaces. Well-managed and maintainedgolf courses are able to attract revenue-generatingprofessional tournaments that are important to localeconomies. The city of Tulsa, Oklahoma, for exam-ple, estimated that $60 million dollars was broughtinto the community as a result of hosting the 2001U.S. Open professional golf tournament.
It is the authors’ contention that the demand forrecreation and leisure activities will continue to ex-pand over the next several decades. Factors contrib-uting to this expansion will be population increases(especially on a regional basis); greater societal em-phasis on health, fitness, and well-being; higher pri-oritization for leisure and recreational activities byfamilies; and increased discretionary time and in-come. As discretionary income increases, so does thedemand for recreational facilities (Templeton et al.2000). These factors will result in increased use ofenvironmental horticultural products such as athlet-ic fields, botanical and community gardens,
arboreta, parks, and golf courses.The aforementioned factors in addition to the de-
sire of many urbanites to remain in contact with na-ture, experience on-farm activities, and have accessto hunting grounds and natural landscape settingswill afford traditional animal, agronomic, forest, andhorticultural production businesses new opportuni-ties for farm diversification and for revenue genera-tion. To attract tourists, farm owners may choose toreprioritize farm operations and expenditures in fa-vor of recreation and leisure activities. As reportedearlier in this chapter, traditional farm operations canbecome a secondary activity or be eliminated com-pletely. Farm owners can become direct competitorswith other recreation and leisure businesses. Univer-sities and colleges will be called upon to continue and/or to increase (as demand grows) education, trainingand other services to support the existing expandingrecreation and leisure industries as well emerging rec-reational and leisure enterprises initiated by tradi-tional farm operations. Finally, expansion of tradi-tional farm operations (animal, agronomic,horticultural, and forestry) to include recreation andleisure activities can serve to educate the consumerabout the diversity within the agriculture industry,to foster appreciation and understanding of each oth-er’s needs and activities, and to drive development ofbeneficial recreational partnerships between commu-nities and farms.
68 Urban and Agricultural Communities: Opportunities for Common Ground
7 Policy and Institutional Dimensions ofUrban Agriculture
68
IntroductionPopulation growth and a taste for fringe or open-
country living fuel continual interest in land manage-ment policy near cities. The directions and contentof this policy agenda differ among nations, but oftencan be traced to social adjustments occurring in theaftermath of World War II. Still, many observers areimpressed by the intensity of the debate during thepast decade. Dialogue over smart growth, sprawl, andrelated land-use issues seems to be sweeping theUnited States. Studies have proliferated and mediaattention has increased. According to a recent U.S.survey (Pew Center 2000), nearly one-fifth of respon-dents listed sprawl-related issues (e.g., development,traffic, roads) as “the most important problem facingthe community where you live.” This issue was high-lighted most often by suburban, college-educated,white residents of the United States.
The Pew Center (2000) reported that 88% of U.S.workers commute to their jobs each day, with only 5%indicating that they take public transportation towork. The average commute is increasing and, notsurprisingly, the longer the commute, the more like-ly a respondent is to say that traffic congestion andother sprawl-related issues are a major problem. Fif-ty-one percent of those living in big cities say trafficcongestion is a major problem, and 46% of suburban-ites agree. Only 18% of those living in rural areasindicate that traffic is a major problem.
Forty-one percent of those living in the suburbsconsider too much growth and development as a ma-jor problem, compared with only 31% of those livingin big cities and only 21% in rural areas. Those whohave attended college are more likely to see sprawlas a major problem than those who have not (32% vs.24%, respectively). African-Americans are less like-ly to see growth and development as a problem (56%stated it is not a problem) compared with whites (42%)and Hispanics (33%) (Pew Center 2000).
Population growth is not the sole factor fuelingsprawl. For example, from 1970 to 1990, the popula-tion of Los Angeles (California) grew 45% while de-veloped land grew 200%; Cleveland’s (Ohio) popula-
tion dropped 11% while consuming 33% more land;Chicago’s (Illinois) population increased 4% whiledeveloping 46% more land. These trends continuedin the 2000 census, suggesting that sprawl tends tofollow highway construction (Freedgood, J. 2002.Personal communication). According to the USDA’sNRI, between 1982 and 1992, 29% of agricultural landconverted to urban use was prime agricultural land(USDA-NRCS 2000c). Prime and unique10 farmlandmade up 22% of 127 threatened major land resourceareas (MLRAs) identified by the American FarmlandTrust (AFT), and 32% of this resource was consumedby urban development.
Interest in growth management stems from numer-ous considerations. The 2000 Census indicates thatthe U.S. population grew by 13.1% during the 1990s.Aggregate growth rates, however, mask the dramat-ically higher growth in many sections of the country,particularly in the Sunbelt, the Intermountain West,and the Far West. During the last decade, the nation-al economy has experienced a period of unprecedent-ed growth and wealth creation. Needs for developedresidential, commercial, industrial, and transportuses have increased concomitantly. On open-spacelands in proximity to larger urban cores, low-densitydevelopment causes MAs to sprawl further into thecountryside and increases the density of settlementin these formerly rural areas. The extent of urban-ized areas and urban places, as defined by the Bureauof the Census, more than doubled over the last 40years from 25.5 million a. in 1960 to 55.9 million a. in1990; urban area may be in the range of 65 million a.when the 2000 decennial census is reported. The con-tinuation of this level of growth could put substantialpressure on the continuing availability of qualityfarmland, the nation’s ability to achieve a reasonablelevel of food self-sufficiency, and the availability ofwater and energy resources to support a shift in loca-tion to new or less productive lands.
The recently completed 1997 National ResourcesInventory (NRI), using a more expansive definition of
10Unique farmland acreage was estimated by using fruit andvegetable crops.
Policy and Institutional Dimensions of Urban Agriculture 69
land used for urban and built-up purposes, indicatedthat land conversion accelerated dramatically in theearly 1990s (USDA-NRCS 2000b, Table 8). Between1982 and 1997, the annual conversion rate was 1.2million a./yr. During the period from 1992 to 1997,however, the conversion rate had increased to 2.2million a./yr. Urban and built-up areas counted in theNRI included those measured by the Census Bureau,including developed areas as small as 10 a. outsideurban areas. The addition of roads and other trans-portation methods expands the total further. TheNRI-developed area increased from 73.2 million a. in1982, to 87 million a. in 1992, and to 98.2 million a.in 1997.
The U.S. farm, food, and agricultural industries areat the epicenter of the ongoing debate over growthmanagement in the urban periphery. The evidence,and indeed the day-to-day driving experience of manyU.S. residents, clearly shows that considerableamounts of acreage now devoted to farming and foodproduction are directly in the path of land conversion.Is production capacity jeopardized by these land con-versions? Just how can agriculture and plant indus-try businesses (e.g., horticulture, forestry) adapt tosprawl? What changes in products and services willbe needed to allow farmers to capitalize on the oppor-tunities afforded by close proximity to urban markets?Do rising land values and increasing contact with newresidents, who, more often than not, are uninformedabout modern farming practices, doom the vibrancyof farming communities? Or will farmers and plantindustry firms be able to reinvent their businesses toemphasize higher-value products, more intensive pro-duction with environmentally friendly practices, andmore urban-oriented marketing and distributionstrategies? Another key issue associated with landconversion pertains to the efforts that industry makesto build good neighborhood relationships.
The section that follows pays close attention to theroles of local, state, and federal governments ingrowth management, open-space, and farmland pro-tection policies. Tools and techniques are consideredthat combine both regulation and incentive-basedstrategies, that are used to protect farmland, and thatsupport agriculture’s economic viability. As has beenstated, land use in the rural-urban confluence, wherethe results of haphazard development often are clear-ly visible, is frequently one of the most hotly debatedissues at local and state levels. Even in rural areas,especially where there are scenic amenities or areasare within commuting distance from employment cen-ters, land management often is a divisive topic. Whengreater emphasis is given to development of the fringe
area, older suburbs and inner cities may be neglect-ed. When planners focus on one of these sectors tothe exclusion of others, outcomes often are costly andthe interests of certain groups may be favored overthose of others. Public perspectives on land use clear-ly are tied to deeply held values about individualrights, land, and automobiles. Without broad publicand private sector involvement in the process, andpublic education on the costs and benefits of proposedstrategies, it may be difficult to generate support formuch-needed land-use control measures. One of thekeys for the future will be to find ways in which dif-ferent jurisdictions can identify commonalities andcooperate on a regional basis to address the overallneeds of the rural-urban agroecosystem.
Setting PolicyTo a great extent, the answer to the aforementioned
questions will depend on policies that meld modernagriculture—including horticulture and forestry—with the emergent urban scene. These policy inter-ventions, in turn, must be calibrated to legal, social,political, and cultural parameters constituting the“rules of the game,” which must be established andrevisited continually by U.S. citizens and their gov-ernments. The texture of the debate can and indeeddoes differ from region to region of the nation. In thearid western United States, much acreage remains inthe public domain, and managing land use near ur-ban areas is connected to decisions on the use of pub-lic land. Otherwise, decisions on the use of U.S. farm-land reside very firmly in the hands of individual andcorporate owners. Privately owned land trades free-ly in real estate sale and rental markets and is passedbetween and within generations through gifts and in-heritances. Such trades and transfers are relied onheavily to ration the finite supply of agricultural landamong alternative uses.
Public authority to intervene in land markets anddecisions regarding private use and ownership of landreside largely with state and local units of govern-ment. Such authorities are threefold. First, localgovernments are empowered to levy an annual prop-erty tax on real estate. Property taxes, a principalsource of revenue for units of local government, in-crease the economic costs of owning real estate; sub-sequently, because asset values fluctuate over time,land values change. Second, the U.S. constitutiondelegates direct powers to regulate land use, common-ly referred to as the “police powers,” (zoning) to stategovernments. The states, in turn, often delegate fur-ther much of the police power to lower units of gov-
70 Urban and Agricultural Communities: Opportunities for Common Ground
ernment such as counties, cities, villages, townships,and a plethora of special districts. Finally, U.S. landpolicy is shaped by a constitutional guarantee againstthe taking of private property without just compen-sation. This guarantee applies to direct land acqui-sitions through powers of eminent domain or condem-nation. Additionally, case law has extended thisconstitutional protection to other “takings” that canresult from overzealous efforts by governments toregulate private landowners and the decisions theymake regarding the use of their land.
“Farmland lies in the middle of the spectrum of pri-vate and common interests in land” (Donahue 1999,288). The common interest in agricultural land is notwell served by most private landowners, includingfarmers and ranchers. The current economic environ-ment does little to foster the continuation of smallfarms, to promote sustainable agricultural practices,or to discourage the sale of productive land for envi-ronmentally appropriate development. Donahue(1999) anticipates that this situation is not going togo away. The question is how can we best protect ourhighest quality resources? In the best interest of to-tal society, we must prevent our best soils from beinglost. Both rural and urban people must join togetherin determining the best possible use of land, includ-ing farmland, to meet their common interests. Theseinterests might include an integrated balance of moresustainable, yet productive, uses of land for such ac-tivities as food and fiber production, open space forenvironmental services, recreation, and economicdevelopment.
Within this institutional framework, public policieson agricultural lands have evolved over the past fourdecades under the rubric of “farmland protection.” Ablend of regulatory and incentive programs exists.Primary emphasis has been placed on incentive ap-proaches designed to promote agriculture by afford-ing property owners relief from legal conflicts withadjacent property owners, reducing property taxes, orproviding compensation to farmland owners who par-ticipate in programs restricting the conversion of theirlands from future development.
Farmland protection programs have not been ig-nored at the federal level. The U.S. Congress consid-ered, but rejected, a number of legislative initiativesin the 1970s. These proposals would have given thecentral government a very noticeable and directstance in land-use planning and would have provid-ed the “deep pocket” for capitalizing farmland protec-tion efforts at state and local levels. Congress did notact during those years, in part because of a prevail-ing view that conversion of farmland to urban use did
not pose an immediate or even a longer-term threatto the nation’s capacity to meet expected food and fi-ber needs.
New research conducted in the 1970s and 1980sdemonstrated, however, that considerable farm pro-duction is in close proximity to urban population con-centrations. Conversions to urban use were shownto be, to some extent, offset by added cropland acre-age in the aftermath of drainage improvements onwetlands, deforestation, and tillage for crop rotationson former pasture and grazing lands. Much pastureand grazing land conversion, particularly in the aridwestern United States, has been induced by availabil-ity of supplemental irrigation water from groundwa-ter aquifers or from publicly financed surface waterimpoundments. According to CAST (1996), approxi-mately 75 million a. of cropland are irrigated in thewestern United States. In 1990, irrigated agricultureaccounted for nearly 85% of developed water supplyused in the West. Population growth in the westernstates has accelerated, with most growth occurring inurban areas. This growth has led to increased de-mand for water for municipal and industrial uses.The competition for available supply has intensified.Because western state legislative bodies have beendominated primarily by urban interests, a balancebetween agricultural and nonagricultural interestshas been lacking. This scenario underscores the im-portance of rural-urban collaboration to address waysin which limited natural resources such as water canbe shared equitably and protected for future genera-tions.
Despite the concern of some people during the lastquarter-century, it still seems that the nation’s domes-tic food and fiber needs are assured. Less than 50%of U.S. cropland is presently used to meet domesticfood and fiber requirements. The remainder is avail-able to service export markets. Congress is continu-ally coping with excess food and fiber production ca-pacity. Nearly 35 million a. are idled under federalsubsidy programs through enrollments in the conser-vation reserve program (CRP) (Chadbourne andChadbourne 2000). Based on 1997 USDA figures,there were 455 million a. of cropland in the UnitedStates. Between 7 and 8% of total U.S. cropland isidled under the CRP program (Vesterby and Krupa2001).
Land Protection InitiativesFor the reasons stated in the previous section, di-
rect engagement of the U.S. Congress in farmland pro-tection programs has come about in an evolutionary
Policy and Institutional Dimensions of Urban Agriculture 71
process. After an exhaustive but inconclusive feder-al assessment of the farmland protection issue in thelate 1970s (National Agricultural Lands Study 1981),Congress passed the Farmland Protection Policy Actin 1981. The USDA did not implement this act formany years and the legislation stopped short of pro-viding financial assistance to state or local govern-ments for farmland protection programs. The act didrequire federal agencies to identify any adverse effectstheir programs might have on farmland protectionand minimize the extent to which such programs in-duce unnecessary farmland conversions. This legis-lation can help ward off the most obvious conflictsbetween federal and state policies, but the direct ef-fect of this legislation on land use and conversion ofland to urban use probably has been minimal. Sucheffects are more likely to evolve out of direct U.S. Trea-sury expenditures to support state and local farmlandprotection efforts.
In the 1990s, movement in the direction of farm-land protection appeared, signaling a shift in federalpolicy. As part of the 1990 omnibus farm legislation,Congress passed the Farms for the Future Act, whichauthorized the USDA to provide federal loan guaran-tees and interest rate subsidies to state governmentsproviding matching monies to operate farmland pro-tection funds. Little was done to implement theseauthorities, but the legislation did set the stage formore focused Congressional action under the 1996Farm Bill, which established the Farmland ProtectionProgram (FPP). Funds for the FPP come from thefederal government’s Commodity Credit Corporation(CCC), which funds several USDA conservation andenvironmental programs. Total funding authorizedfor the program was $35 million (Chadbourne andChadbourne 2000), a sum quickly expended by theUSDA.
Recent (1999) legislative proposals requested a re-authorization of the FPP at $55 million/yr through2002, but the 106th Congress did not act. However,the Agricultural Risk Protection Act of 2000 provid-ed $17.5 million in financial and technical assistancefor the purposes described by the FPP in fiscal year2001. Interestingly, the Natural Resources Conser-vation Service (NRCS) has indicated that $10 millionof $17.5 million available in matching grants for pur-chase of conservation easements on agricultural landswas open to applications from private nonprofit orga-nizations such as land trusts (Lawrence, R. D. 2002.Personal communication).
Purchase of development rights (PDR) programsalone will not resolve problems associated with farm-land loss for the following reasons:
• PDR programs are not keeping up with farmers’needs for timely compensation;
• most funding is subject to bonds, appropriations,and special taxes, so that farmers cannot neces-sarily count on it for future transactions; and
• funds do not necessarily flow to farmers in areaswhere development threatens agriculture.
Although the federal government has done morethan most states to promote conservation, funds forPDR are still very inadequate. Average per capita ex-penditure on easements in states with programs isonly $0.60 (Thompson and Warman 2000).
Daniels (1999) contends, by contrast, that becausemost state and farmland preservation programs orig-inate in urban-fringe areas, most federal funds arebeing directed to those areas. Although farmlandprotection efforts are aimed at preserving open-spaceand farmland through the purchase of conservationeasements, there is considerable debate as to wheth-er they are successful at maintaining agriculture asa profitable business.
Conservation easements complement longer-livedprovisions in the federal income tax code that provideindirect financial incentives and that are legal instru-ments restricting the use of land to specified conser-vation purposes while precluding future conversionto a developed use. These incentives are targeted atindividual landowners who participate in privatefarmland protection programs operated by nonprofitorganizations. Specifically, the federal tax law en-ables taxpayers to claim deductions for charitablecontributions of conservation easements to qualifyingprivate land trusts and organizations. Some landown-ers can benefit by such contributions because the re-sultant tax deduction can decrease income tax liabil-ities on income earned from other sources.
The Farmland Protection Toolbox
Regulatory Programs
In the United States, efforts to regulate the use offarmland are manifested primarily in the implemen-tation of zoning laws. Zoning uses police power tocontrol land use. A zoning law—typically called a zon-ing ordinance in the United States—divides the landarea of a jurisdiction into various districts so that landis used for consistent, compatible purposes. Zoningordinances usually define allowable property uses,prescribe usage intensities (e.g., number of residen-tial building lots/land parcel), and specify the rules
72 Urban and Agricultural Communities: Opportunities for Common Ground
to be followed when a structure is placed on the site.Zoning first was applied in urban settings, but impor-tant examples of rural zoning date to the 1930s in afew regions of the United States. Increasing applica-tions of zoning are found on the urban fringe, or inmetropolitan counties where land development forurban-related purposes and commercial agriculturecan come into close contact (Textbox 7.1).
Zoning ordinances are promulgated by some verylocal levels of government that tailor their regulato-ry efforts to local conditions. Zoning laws often arecombined with additional rules and regulations re-garding subdivisions of land parcels into smaller own-ership units. Many localities have zoning laws ori-ented almost exclusively to controlling thedevelopment of residential and commercial proper-ties. These jurisdictions may contain substantialquantities of farmland, but often their zoning lawsmake no explicit provisions for protecting agricultur-al land from urban encroachment or for convertingland, in an orderly fashion, to future development use.Weak or ineffective regulation of this sort often issupported by developers and landowners who wanteventually to sell their agricultural land, or to devel-op it with minimal interference from local govern-ments.
According to the AFT, agricultural protection zon-ing ordinances take many forms. The AFT categorizesthese ordinances as exclusive agricultural zoning;large minimum lot size zoning; area-based allowancezoning; fixed area-based allowance zoning; and slid-ing scale area-based allowance zoning. The AFT iden-tifies agricultural protection zoning statutes in only14 states; the most restrictive exclusive agriculturalzoning statutes are found in Oregon and Wisconsin—two states with an exceptionally long history of in-volvement in zoning initiatives (AFT 2002c).
Rural communities in most states have the optionof undertaking either nonexclusive or exclusive agri-cultural zoning. A nonexclusive ordinance is designedto include nonfarm development in the farming zoneeven though farming is the preferred or priority use.An ordinance requiring homeowners to build on alarge land parcel—called large lot zoning—is a com-mon form of nonexclusive agricultural zoning. Largelots limit the number of nonfarm buildings in the ag-ricultural zone. Under exclusive agricultural zoning,nonfarm dwellings and buildings are prohibited strict-ly from the agricultural zone. Large lot development,even with an agricultural purpose, does not general-ly do much to protect agriculture and is an expensivecommunity development pattern. Government re-view of a plan to build a farm dwelling in the agricul-
tural zone also can be required. This type of ordinanceseverely restricts land management options andsometimes proves very unpopular with owners ofopen, developable land. Governments with such or-dinances can be vulnerable to legal proceedingswhereby owners seek compensation for a “taking” oftheir constitutionally guaranteed property rights.Because of political and legal pitfalls, few govern-ments pursue exclusive agricultural zoning at the lo-cal level.
Incentive ProgramsThere are a number of political realities confront-
ing U.S. public policy on farmland protection. Usingonly police power (zoning) has had limited success inprotecting and regulating farmland use. The beststrategy for farmland protection requires the com-bined use of federal, state, and local preservationmeasures (Lapping and Pfeffer 2000).
Farmland owners, especially active farmers andranchers, typically voice support for farmland protec-tion objectives but generally endorse programs thatare voluntary and provide financial incentives forparticipants. Consequently, the bulk of state/localfarmland protection programs have stressed thesetwo features in program design.
Agricultural Districts
Agricultural districts are legally recognized geo-graphic entities in which farming is recognized as apriority land use. Sixteen states have passed legisla-tion enabling the creation of agricultural districts, ac-cording to the AFT (2001a). Districts are created forfixed but renewable periods of time and feature a se-ries of pro-farming provisions that attempt to improveconditions for the continuation of farming within thedistrict’s boundaries. Pro-farming provisions differ,but can include decreased property taxes (as part ofthe use-value assessment program already discussed),state policies to encourage farming, and modificationor limitation of practices thought to hinder it. Theselatter policies include local laws that are unduly re-strictive on normal farming practices, use of condem-nation proceedings (eminent domain) on activelyfarmed land, and restrictions on publicly funded in-vestments promoting nonfarm development in anagricultural district (Textbox 7.1)
Agricultural district programs often are popularwith farmers because participation is voluntary foreach landowner. In exchange for enrollment, farm-ers receive a package of benefits, variable by state, forkeeping their land in agriculture. Similarly, local gov-
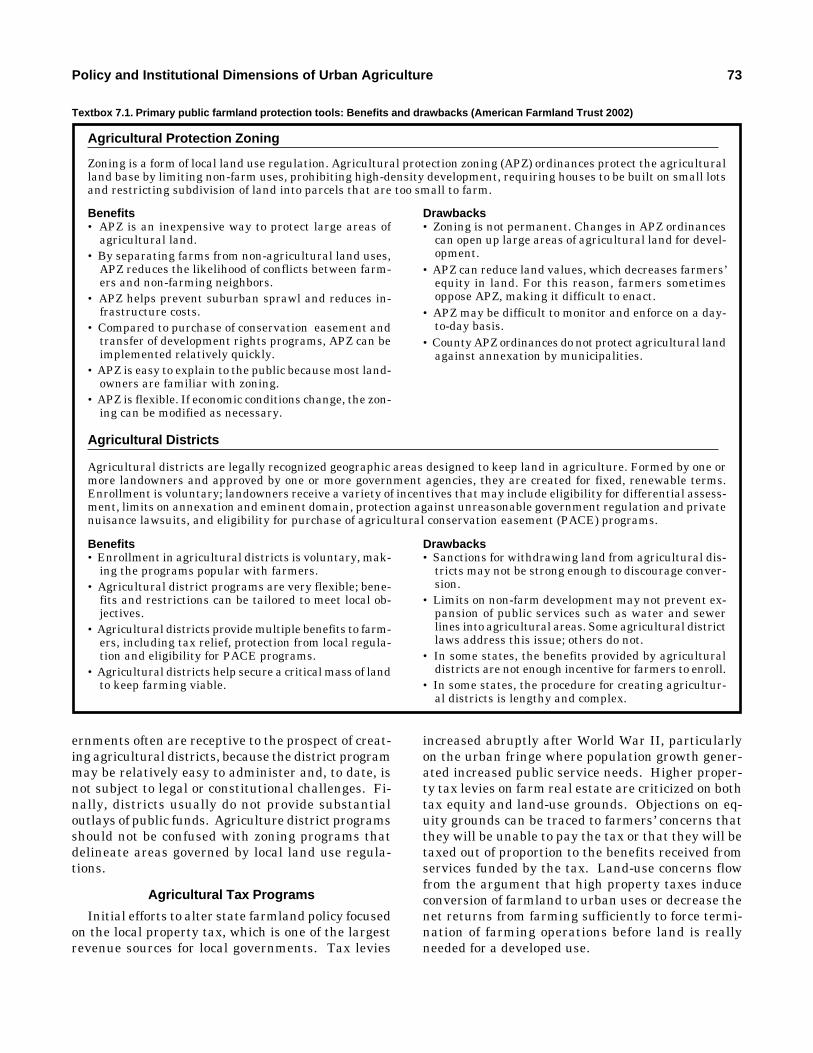
Policy and Institutional Dimensions of Urban Agriculture 73
ernments often are receptive to the prospect of creat-ing agricultural districts, because the district programmay be relatively easy to administer and, to date, isnot subject to legal or constitutional challenges. Fi-nally, districts usually do not provide substantialoutlays of public funds. Agriculture district programsshould not be confused with zoning programs thatdelineate areas governed by local land use regula-tions.
Agricultural Tax Programs
Initial efforts to alter state farmland policy focusedon the local property tax, which is one of the largestrevenue sources for local governments. Tax levies
increased abruptly after World War II, particularlyon the urban fringe where population growth gener-ated increased public service needs. Higher proper-ty tax levies on farm real estate are criticized on bothtax equity and land-use grounds. Objections on eq-uity grounds can be traced to farmers’ concerns thatthey will be unable to pay the tax or that they will betaxed out of proportion to the benefits received fromservices funded by the tax. Land-use concerns flowfrom the argument that high property taxes induceconversion of farmland to urban uses or decrease thenet returns from farming sufficiently to force termi-nation of farming operations before land is reallyneeded for a developed use.
Textbox 7.1. Primary public farmland protection tools: Benefits and drawbacks (American Farmland Trust 2002)
Benefits• Enrollment in agricultural districts is voluntary, mak-
ing the programs popular with farmers.• Agricultural district programs are very flexible; bene-
fits and restrictions can be tailored to meet local ob-jectives.
• Agricultural districts provide multiple benefits to farm-ers, including tax relief, protection from local regula-tion and eligibility for PACE programs.
• Agricultural districts help secure a critical mass of landto keep farming viable.
Agricultural districts are legally recognized geographic areas designed to keep land in agriculture. Formed by one ormore landowners and approved by one or more government agencies, they are created for fixed, renewable terms.Enrollment is voluntary; landowners receive a variety of incentives that may include eligibility for differential assess-ment, limits on annexation and eminent domain, protection against unreasonable government regulation and privatenuisance lawsuits, and eligibility for purchase of agricultural conservation easement (PACE) programs.
Agricultural Districts
Drawbacks• Sanctions for withdrawing land from agricultural dis-
tricts may not be strong enough to discourage conver-sion.
• Limits on non-farm development may not prevent ex-pansion of public services such as water and sewerlines into agricultural areas. Some agricultural districtlaws address this issue; others do not.
• In some states, the benefits provided by agriculturaldistricts are not enough incentive for farmers to enroll.
• In some states, the procedure for creating agricultur-al districts is lengthy and complex.
Benefits• APZ is an inexpensive way to protect large areas of
agricultural land.• By separating farms from non-agricultural land uses,
APZ reduces the likelihood of conflicts between farm-ers and non-farming neighbors.
• APZ helps prevent suburban sprawl and reduces in-frastructure costs.
• Compared to purchase of conservation easement andtransfer of development rights programs, APZ can beimplemented relatively quickly.
• APZ is easy to explain to the public because most land-owners are familiar with zoning.
• APZ is flexible. If economic conditions change, the zon-ing can be modified as necessary.
Zoning is a form of local land use regulation. Agricultural protection zoning (APZ) ordinances protect the agriculturalland base by limiting non-farm uses, prohibiting high-density development, requiring houses to be built on small lotsand restricting subdivision of land into parcels that are too small to farm.
Agricultural Protection Zoning
Drawbacks• Zoning is not permanent. Changes in APZ ordinances
can open up large areas of agricultural land for devel-opment.
• APZ can reduce land values, which decreases farmers’equity in land. For this reason, farmers sometimesoppose APZ, making it difficult to enact.
• APZ may be difficult to monitor and enforce on a day-to-day basis.
• County APZ ordinances do not protect agricultural landagainst annexation by municipalities.
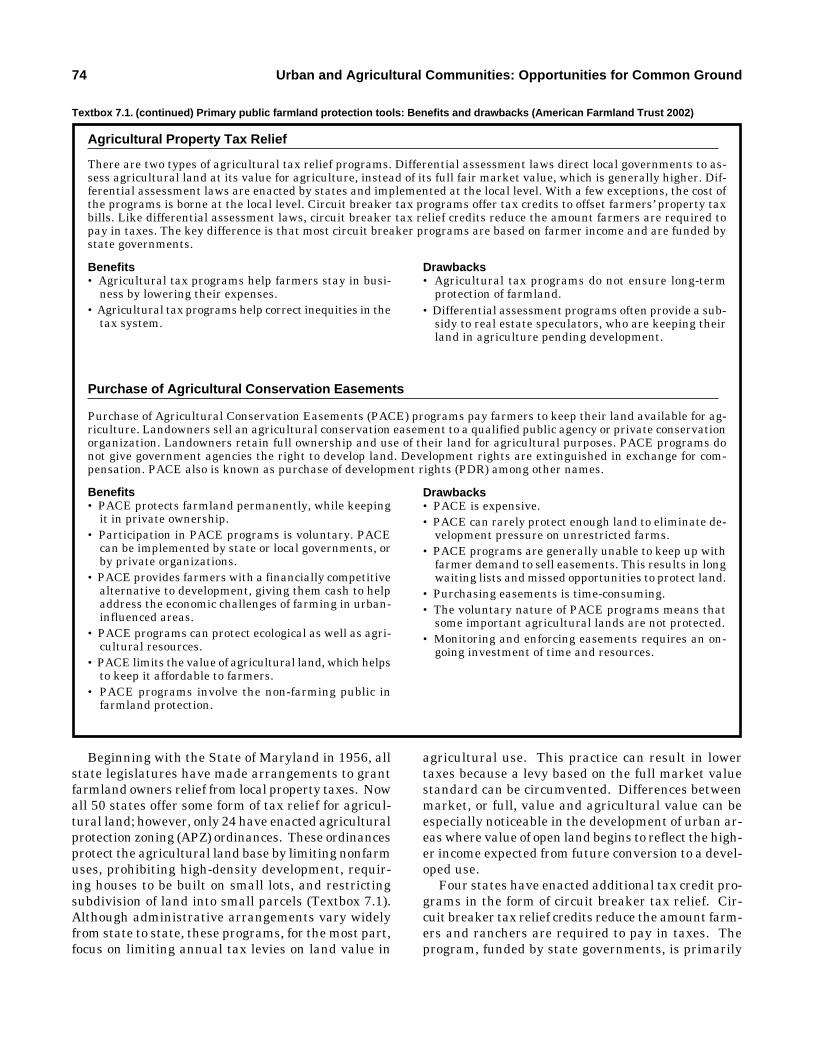
74 Urban and Agricultural Communities: Opportunities for Common Ground
Beginning with the State of Maryland in 1956, allstate legislatures have made arrangements to grantfarmland owners relief from local property taxes. Nowall 50 states offer some form of tax relief for agricul-tural land; however, only 24 have enacted agriculturalprotection zoning (APZ) ordinances. These ordinancesprotect the agricultural land base by limiting nonfarmuses, prohibiting high-density development, requir-ing houses to be built on small lots, and restrictingsubdivision of land into small parcels (Textbox 7.1).Although administrative arrangements vary widelyfrom state to state, these programs, for the most part,focus on limiting annual tax levies on land value in
agricultural use. This practice can result in lowertaxes because a levy based on the full market valuestandard can be circumvented. Differences betweenmarket, or full, value and agricultural value can beespecially noticeable in the development of urban ar-eas where value of open land begins to reflect the high-er income expected from future conversion to a devel-oped use.
Four states have enacted additional tax credit pro-grams in the form of circuit breaker tax relief. Cir-cuit breaker tax relief credits reduce the amount farm-ers and ranchers are required to pay in taxes. Theprogram, funded by state governments, is primarily
Textbox 7.1. (continued) Primary public farmland protection tools: Benefits and drawbacks (American Farmland Trust 2002)
Benefits• PACE protects farmland permanently, while keeping
it in private ownership.• Participation in PACE programs is voluntary. PACE
can be implemented by state or local governments, orby private organizations.
• PACE provides farmers with a financially competitivealternative to development, giving them cash to helpaddress the economic challenges of farming in urban-influenced areas.
• PACE programs can protect ecological as well as agri-cultural resources.
• PACE limits the value of agricultural land, which helpsto keep it affordable to farmers.
• PACE programs involve the non-farming public infarmland protection.
Purchase of Agricultural Conservation Easements (PACE) programs pay farmers to keep their land available for ag-riculture. Landowners sell an agricultural conservation easement to a qualified public agency or private conservationorganization. Landowners retain full ownership and use of their land for agricultural purposes. PACE programs donot give government agencies the right to develop land. Development rights are extinguished in exchange for com-pensation. PACE also is known as purchase of development rights (PDR) among other names.
Purchase of Agricultural Conservation Easements
Drawbacks• PACE is expensive.• PACE can rarely protect enough land to eliminate de-
velopment pressure on unrestricted farms.• PACE programs are generally unable to keep up with
farmer demand to sell easements. This results in longwaiting lists and missed opportunities to protect land.
• Purchasing easements is time-consuming.• The voluntary nature of PACE programs means that
some important agricultural lands are not protected.• Monitoring and enforcing easements requires an on-
going investment of time and resources.
Benefits• Agricultural tax programs help farmers stay in busi-
ness by lowering their expenses.• Agricultural tax programs help correct inequities in the
tax system.
There are two types of agricultural tax relief programs. Differential assessment laws direct local governments to as-sess agricultural land at its value for agriculture, instead of its full fair market value, which is generally higher. Dif-ferential assessment laws are enacted by states and implemented at the local level. With a few exceptions, the cost ofthe programs is borne at the local level. Circuit breaker tax programs offer tax credits to offset farmers’ property taxbills. Like differential assessment laws, circuit breaker tax relief credits reduce the amount farmers are required topay in taxes. The key difference is that most circuit breaker programs are based on farmer income and are funded bystate governments.
Agricultural Property Tax Relief
Drawbacks• Agricultural tax programs do not ensure long-term
protection of farmland.• Differential assessment programs often provide a sub-
sidy to real estate speculators, who are keeping theirland in agriculture pending development.
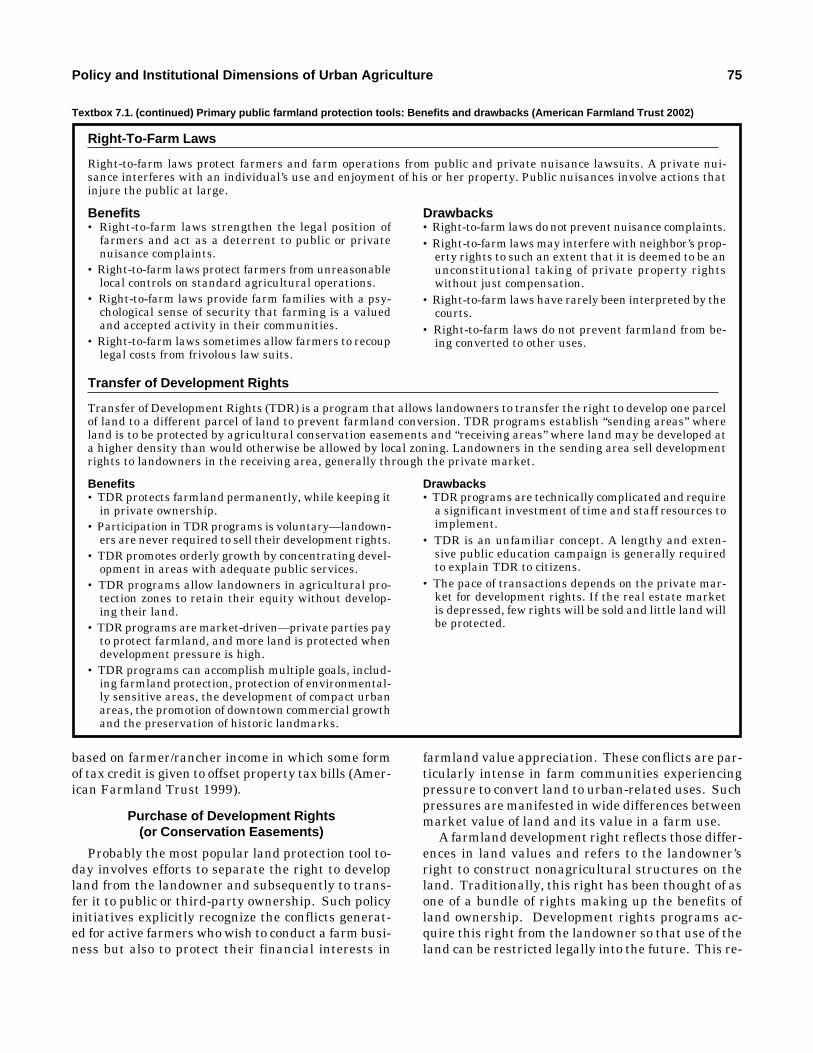
Policy and Institutional Dimensions of Urban Agriculture 75
based on farmer/rancher income in which some formof tax credit is given to offset property tax bills (Amer-ican Farmland Trust 1999).
Purchase of Development Rights(or Conservation Easements)
Probably the most popular land protection tool to-day involves efforts to separate the right to developland from the landowner and subsequently to trans-fer it to public or third-party ownership. Such policyinitiatives explicitly recognize the conflicts generat-ed for active farmers who wish to conduct a farm busi-ness but also to protect their financial interests in
farmland value appreciation. These conflicts are par-ticularly intense in farm communities experiencingpressure to convert land to urban-related uses. Suchpressures are manifested in wide differences betweenmarket value of land and its value in a farm use.
A farmland development right reflects those differ-ences in land values and refers to the landowner’sright to construct nonagricultural structures on theland. Traditionally, this right has been thought of asone of a bundle of rights making up the benefits ofland ownership. Development rights programs ac-quire this right from the landowner so that use of theland can be restricted legally into the future. This re-
Textbox 7.1. (continued) Primary public farmland protection tools: Benefits and drawbacks (American Farmland Trust 2002)
Benefits• Right-to-farm laws strengthen the legal position of
farmers and act as a deterrent to public or privatenuisance complaints.
• Right-to-farm laws protect farmers from unreasonablelocal controls on standard agricultural operations.
• Right-to-farm laws provide farm families with a psy-chological sense of security that farming is a valuedand accepted activity in their communities.
• Right-to-farm laws sometimes allow farmers to recouplegal costs from frivolous law suits.
Right-to-farm laws protect farmers and farm operations from public and private nuisance lawsuits. A private nui-sance interferes with an individual’s use and enjoyment of his or her property. Public nuisances involve actions thatinjure the public at large.
Right-To-Farm Laws
Drawbacks• Right-to-farm laws do not prevent nuisance complaints.• Right-to-farm laws may interfere with neighbor’s prop-
erty rights to such an extent that it is deemed to be anunconstitutional taking of private property rightswithout just compensation.
• Right-to-farm laws have rarely been interpreted by thecourts.
• Right-to-farm laws do not prevent farmland from be-ing converted to other uses.
Benefits• TDR protects farmland permanently, while keeping it
in private ownership.• Participation in TDR programs is voluntary—landown-
ers are never required to sell their development rights.• TDR promotes orderly growth by concentrating devel-
opment in areas with adequate public services.• TDR programs allow landowners in agricultural pro-
tection zones to retain their equity without develop-ing their land.
• TDR programs are market-driven—private parties payto protect farmland, and more land is protected whendevelopment pressure is high.
• TDR programs can accomplish multiple goals, includ-ing farmland protection, protection of environmental-ly sensitive areas, the development of compact urbanareas, the promotion of downtown commercial growthand the preservation of historic landmarks.
Transfer of Development Rights (TDR) is a program that allows landowners to transfer the right to develop one parcelof land to a different parcel of land to prevent farmland conversion. TDR programs establish “sending areas” whereland is to be protected by agricultural conservation easements and “receiving areas” where land may be developed ata higher density than would otherwise be allowed by local zoning. Landowners in the sending area sell developmentrights to landowners in the receiving area, generally through the private market.
Transfer of Development Rights
Drawbacks• TDR programs are technically complicated and require
a significant investment of time and staff resources toimplement.
• TDR is an unfamiliar concept. A lengthy and exten-sive public education campaign is generally requiredto explain TDR to citizens.
• The pace of transactions depends on the private mar-ket for development rights. If the real estate marketis depressed, few rights will be sold and little land willbe protected.
76 Urban and Agricultural Communities: Opportunities for Common Ground
striction takes the form of an easement and is record-ed with the property deed (Textbox 7.1)
Under a Purchase of Development Rights (PDR)program (sometimes called Purchase of AgriculturalConservation Easements), use of land is restrictedwith an agricultural conservation easement. In com-pensation for restricting use of the land, the ownerreceives a sum of money typically equal to the valueof the foregone development potential. Easementvalues also may be determined by a numerical scor-ing system (points) that evaluates the land’s agricul-ture production potential. This value typically is cal-culated as the fair market value of the land minus itsagricultural value. These values are determined bystandard real estate appraisal methods.
Prospects for tailoring easements to farmland pro-tection objectives were discussed initially in New Yorkin the early 1960s, when the state legislature passedenabling legislation permitting local governments toacquire land rights for the purpose of preserving openspace. Suffolk County, located on the densely popu-lated Long Island Sound in New York State, subse-quently pioneered the first nationally recognized PDRprogram, which was enacted in 1974. King County,Washington, containing the city of Seattle, soon fol-lowed with PDR acquisitions in 1979. Twenty-twostates have state or locally funded PDR programs(Freedgood, J. 2002. Personal communication). Stateboards or commissions are appointed to devise pro-cedures for reviewing applications made by ownerswishing to sell development rights. In some instanc-es, local committees or land preservation boards areestablished to assist with administration of the pro-gram and with selection of land parcels for develop-ment right acquisition.
Purchase of Development Rights programs are vol-untary, and state or local governments initiating themusually have more applications for easement sale thancan be accomplished with available funds. Fundingis crucial because easement purchase can be enor-mously expensive when a land parcel is prone to de-velopment. One of the biggest challenges for govern-ments is to find ways to pay for purchase ofconservation easements. Potential funding sourcesinclude bonds, taxes (property, sales, real estatetransfer), annual appropriations, and federal dollars(transportation funding, Farmland Protection Pro-gram), and other creative sources. Several state-op-erated programs make explicit provisions for privatecontributions from third parties—individual resi-dents, corporations, or private organizations—wish-ing to assist farmland protection efforts.
Right-to-Farm Laws
Right-to-farm laws attempt to give farmers a mea-sure of protection from private nuisance suits by mod-ifying common nuisance law. A private nuisance in-terferes with an individual’s use and enjoyment of hisor her property (Textbox 7.1).
Urban-related growth and development in tradi-tional farming communities can generate complaintsfrom new nonfarm residents about farming practic-es. Common concerns have to do with dust, odor,noise, vibration, and use of agricultural chemicals. Insome instances, offended neighbors resort to legalactions to seek relief in the form of court suits wagedagainst farm neighbors (Daniels 1999).
To assist farm operators who may need to ward offsuch legal actions, legislatures in all 50 states haveenacted right-to-farm laws. These laws have littleclout in the courts; this may change, however, as morepeople move to the urban fringe and file suits basedon trespass rather than nuisance doctrine. Conse-quently, a plaintiff could claim that noise, dust, orodor are leaving the farm, thus affecting nonfarmproperty and decreasing the neighbor’s enjoyment ofhis or her property. Nuisance suits against a farmermay have little chance of winning, but cost and ag-gravation to the farmer may be significant. In somestates, the farmer is not protected from nuisance suits,e.g., if he or she changes the operation from a dairyfarm to a hog farm (Daniels 1999). Proponents of suchlaws argue that by eliminating, or at least decreas-ing, the threat of future lawsuits over standing-farm-ing activities, the chilling effect of legal action is re-stricted greatly and farm operators subsequently willmake new investments and take other steps neededto promote the viability of their farm businesses.
Regardless of right-to-farm laws, when farmers orranchers see nearby land being developed, they tendto decrease their level of investment in their own farmin anticipation of selling the land for development.This process called impermanence syndrome describesa process of disinvestments in farming or a reductionof the intensity of farm production in anticipation offuture land use conversion (Berry 1978; Heimlich andAnderson 1987).
Transfer of Development Rights
Transfer of Development Rights (TDRs) enable thelandowner to transfer the right of development fromone parcel of land to another. The TDR programs,often established by local zoning ordinances to pro-tect farmland, can shift development from agricultur-al use areas to designated growth zones that are closerto municipal services. These programs allow land-
Policy and Institutional Dimensions of Urban Agriculture 77
owners to separate and sell the development rightsfrom their other property rights (Textbox 7.1). Trans-fer of Development Rights can be designed to addressmultiple goals including agricultural land protection,conservation of environmentally sensitive areas, andpreservation of historically significant lands. Al-though this mechanism prevents nonagricultural de-velopment of agricultural land, it also reduces themarket value of the protected land while providing theowner with liquid capital. The TDR programs can bedistinguished from PDR programs by their associa-tion with the private market. Most TDR transactionsare between private landowners and developers.
The TDRs may be more appropriate to urban ar-eas where the market is more conducive to transferof development rights, thus avoiding problems of con-fiscation and the fact that PDRs are so expensive(Lapping, M. 2000. Personal communication).
Private Land Trusts
Direct third party efforts to protect U.S. farmlandare emerging through a proliferation of private, not-for-profit land trust and conservancy organizations.Private land trusts and conservancies dedicated to
natural resource conservation have been in existencefor more than a century, but their numbers multipliedrapidly in the 1980s and 1990s. These nonprofit or-ganizations usually are registered with the U.S. In-ternal Revenue Service, and individuals or corpora-tions donating funds or property to support theirprograms may be in a position to treat donations as acharitable contribution when filing income tax re-turns. Charitable contributions are tax deductible,thereby decreasing the donor’s taxable income. In-come tax reform in the mid-1980s, combined with el-evated public concern about rural resource conserva-tion, helped stimulate interest in private land trustsat both national and regional levels.
These third-party organizations are increasinglyactive in the farmland protection arena. They oftenhave broad conservation objectives and focus on avariety of natural resources in a designated region.A 1992 study reported that more than 30% of local andregional organizations in the Northeastern UnitedStates protected some agricultural land (Weir andBills 1992). Although conservation easement dona-tions are frequently used, other methods include ed-ucational and consulting services for landowners.
78 Urban and Agricultural Communities: Opportunities for Common Ground
8 New Visions for Urban Agriculture
78
IntroductionThis report has discussed agriculture in a new
light. Agriculture’s contemporary role in an urban-izing society has been the central theme. Whenviewed broadly, agriculture can serve as a valuableresource for both rural and urban leaders concernedabout issues of community economic development,land use conservation and management, and commu-nity livability. The term urban agriculture refers toa complex system encompassing a full spectrum ofactivities from a traditional core of production, pro-cessing, marketing, distribution and consumption, tomore extensive system components including recre-ation and leisure, business entrepreneurship, individ-ual health benefits, scenic beautification, environmen-tal restoration and remediation, community healthand well-being services, and economic vitality. Thereport identifies partnership opportunities and poli-cy recommendations for urban and rural leaders anddecision makers to enable more cooperative solutionsto common and complex environmental, health, safe-ty, nutritional, social, and economic problems. Itrecommends changes that the agriculture system,universities and colleges, and various levels of gov-ernment must undertake to remain relevant to soci-ety.
An interdependency exists between rural and ur-ban areas, which is illustrated aptly by the conceptof a rural-urban agroecosystem within which agricul-ture plays a major contributory role. The rural-ur-ban agroecosystem is defined as a biological and nat-ural resource system that must be managed jointlyby rural and urban people for the purposes of
• producing safe and accessible food and nonfoodproducts,
• providing services to the environment and com-munity,
• generating direct and indirect social and economicbenefits to the rural-urban system, and
• ensuring individual and community health andwell-being.
Only in cooperation with other partners can agri-culture help resolve the challenges facing a rapidlyurbanizing society. Many problems facing the ruraland urban subsectors of U.S. society have similar ef-fects (Figure 8.1). Although the sources of problemsmay differ, their effects on the environment, the com-munity, and the individual are very similar. Success-ful response and cost-effective resource use will re-quire joint planning, problem solving, and costsharing. Each partner can bring unique knowledgeand experience to the situation and, simultaneously,can derive mutual benefits from the working relation-ship.
The last decade has brought about sweeping chang-es in the public’s interest in food systems, diet andhealth, information access, natural landscapes, andenvironmental protection and conservation. This pe-riod also has witnessed a decline in the profitabilityof farms and ranches and in the numbers of peopledirectly involved in farming and ranching, as well asin the loss of productive farmland. These changeshave been accompanied by intense debate amongstakeholders concerning which policies are needed,what the impacts of policy and funding decisions willbe, who will be affected by these decisions, and whowill pay for the proposed solutions. With increasedpopulation densities and commuting times, peopleseek additional meaning in their lives, an enhancedsense of community, and more opportunities to recon-nect with nature. Many of these expectations are oc-curring, however, as natural resources (e.g., land,water, and air) are diminishing in quality and/orquantity.
Economic growth and improvements alone cannotsustain communities. Community prosperity alsonecessitates investment in human and social capital,for example, in new sources of innovation and entre-preneurship. This may mean enticing immigrants torelocate to communities lacking sufficient human re-sources. The survival of rural communities dependson the development of strategies for such communi-ties to connect to each other and to find ways to linkto thriving metropolitan centers (Stauber 2001). Com-prehensive planning for sustainability should address

New Visions for Urban Agriculture 79
Figure 8.1. Common problems and potential impacts within the rural-urban agroecosystem. The commonality of the problems andimpacts suggests that potential solutions may have application to both rural and urban populations. This idea further sub-stantiates the value of rural-urban partnerships to preserve natural resources, maintain business and economic viability,control pollution, and build healthy and livable communities. Pooling financial and human resources can generate solu-tions more quickly and with increased economic benefits. By applying an integrated rural-urban approach, shared prob-lems can become jointly owned solutions that produce pay-offs for everyone.
Problems in the RuralAgricultural Subsystem Potential Impacts Problems in the Urban
Agricultural SubsystemAnimal Waste Disposal
• From animal/poultry feedlots (confinement operations) that generate waste
Contamination (air, soil, water),psychological stress (animals),health problems (animal,humans), increased managementcosts, disposal problems
Food Processing Waste Disposal• Plant parts and waste water disposal that generate waste
Human/Animal Waste Disposal• From residential “feedlots” (city and suburban residences), companion animals, and urban wildlife, all of which generate waste
Contamination of air and waterresources, water treatmentproblems, sewer system capacitylimitations, potential threat tohuman health
Household Waste Disposal• Plant parts and waste water disposal
Pesticide and Fertilizer Applications• For commercial crop production• For highway and utility right-of-ways, vegetation control programs• For insect control in food and grain storage facilities, farm buildings, and animals
Contamination of air, soil, andwater resources; potential dangerto human health and food safety
Pesticide and Fertilizer Applications• For lawn, tree, and shrub care, gardens and parks• Vegetation control programs for street boulevards, utility right-of-ways, parking lots, easements, waterways
Water Runoff• From croplands, feedlots, other animal confinement facilities, grain storage areas
Contamination of soil and waterresources, increased waterwayand aquifer managementchallenges and costs
Water Runoff• From gardens, lawns, and chemically treated house foundations
Soil Erosion and Soil Health• From water and wind, over-cropping, poor tillage practices, deforestation, monocropping, inadequate crop rotation
Loss of top soil, waterwaycontamination, respiratoryproblems, soil nutrient depletion
Soil Erosion and Soil Health• From water- and wind-inadequate crop rotation and vegetation coverage of gardens, drainage channels, monocropping, new subdivisions
Water Limitations• Watershed and aquifer depletion• Drought
Water rights issues, irrigationrestrictions, crop losses, increasedwaterway and aquifer managementchallenges
Water Limitations• Watershed and aquifer depletion• Drought
Contamination of air and water,cost of waste disposal andcomposting facilities, human safety
Human/Community Capital• Labor shortages• Limited youth activities• New immigrant communities• Shortage of young farmers• Shortage of local investment
Inadequate community leadershipand collaborative problem solvingcapacity, crime and delinquency,population change (in somecases, out-migration), communityconflict
Human/Community Capital• Labor shortages• Limited youth activities (e.g., inner cities)• New immigrant communities• Hobby farmers with limited farm/business experience
Depletion of natural resources, aircontamination, ozone pollution,high energy cost
Energy Consumption and FuelEfficiency of Equipment and
Practices
Energy Consumption and FuelEfficiency of Equipment and
Practices
Animal Carcass and CropResidue Disposal
• Recycling/Composting
Garbage Dumps, Landfills,Yard Waste Disposal
• Recycling/Composting
80 Urban and Agricultural Communities: Opportunities for Common Ground
both economic and resource (human and natural)availability and replenishment. If the often compet-itive needs of both urban and rural areas are not in-tegrated, however, outcomes may lack elements thatcontribute to regional competitive advantage andproblem-solving capacity.
The following domains for collaborative problemsolving have been identified by the CAST report: (1)comprehensive planning, (2) public policy, (3) highereducation, (4) research, and (5) partnerships and col-laboration. Each category includes initiatives thatcould enhance research, education, problem solving,and planning.
Comprehensive PlanningAs indicated in this report, urban agriculture is a
complex and dynamic endeavor involving many activ-ities, purposes, attributes, and outcomes. Because itis an integral part of the urban economy and ecology,it should be part of the comprehensive planning pro-cess. Land-use planning and agricultural planning,for example, will include many pragmatic dimensionsas well as input from and collaboration with diversegroups. Many individual pieces of the metropolitanagriculture puzzle are identified, but planning is need-ed sorely now to put these pieces together into a co-herent and functional whole. In international citiessuch as Dar-es-Salaam (Tanzania), Kampala (Ugan-da), Ho Chi Minh (Vietnam), and Shanghai (China),urban planning includes agriculture by identifyingpublicly controlled zones that prohibit certain typesof farming, by identifying “green belts” for communi-ty gardens, and by establishing buffer areas to helpcontrol development and protect urban soil (de Zeeuw,Gundel, and Waibel 1999).
Urban agriculture is a tool that can be used in acomprehensive planning approach to address farmand nonfarm issues related to community livability,environmental and natural resource conservation anduse, and local economic vitality. Six comprehensiveplanning initiatives to consider are the following:
1. Public support. Without an understanding ofthe rural-urban agroecosystem or the role thatboth rural and urban partners play within it, pub-lic support for institutional or policy change willbe difficult to gain. Efforts must be made tohelp both rural and urban residents under-stand and appreciate the broader applica-tions of agriculture and its potential forhelping to resolve common problems. A keystrategy involves the engagement of community
and agricultural leaders and public officials inidentifying mutual needs and opportunities.
2. Integrated, long-term rural-urban resourc-es. The multidimensional issues and needsof urban, urban-edge, and rural agriculturemust be incorporated into long-term compre-hensive economic, environmental, and socialdevelopment plans. Natural and cultural amen-ities, many located outside urban areas, are valu-able assets, especially as populations expand andmove away from their agricultural roots. Incen-tives for rural-urban cooperation can offer attrac-tive pay-offs to all participating partners. Coop-erative funding initiatives will be needed to helpmanage common resources such as watershedsand estuaries, energy sources, and natural habi-tat areas.
3. Community food systems. Planning for afunctional, safe, and sustainable urban foodsystem requires that residents and organiza-tions understand their existing food systemsand identify local or regional goals for adesired food system. Elements to consider in-clude food sources, value-added production andprocessing potentials, customer-producer rela-tionships, biowaste recycling, energy sources andcosts, economic and community development, in-dividual health, land use, and food security. An-other consideration might be institutional or gov-ernment purchases of local or regional agricultureproducts.
4. Financial incentives. Low-cost loans, tech-nical assistance, and other financial or taxincentives for entrepreneurial urban agri-cultural business activities, alternative andniche production opportunities, public gar-dens, environmental site restoration, wildlifehabitat development, farmland protection,waterway remediation, groundwater re-charge, scenic beautification, and interior-scaping for aesthetic and therapeutic valuesshould be provided.
5. Funding. Creative community-based revenuegeneration to support the outcomes of jointplanning (e.g., community grants, volunteercontributions, business-community partner-ships, and fee-for-service activities) shouldbe explored. Some of the resources often takenfor granted could have a cash value that wouldinstill local pride in the asset.
6. Existing resources. Planners should consult
New Visions for Urban Agriculture 81
with the many research-based informationresources for agriculture, including servic-es within the USDA (e.g., the CooperativeState Research, Education, and ExtensionService [CSREES] and the Natural Resourc-es Conservation Service [NRCS]), which pro-vide information about soils, plants, water,and waste handling systems. Land-grant uni-versities and metropolitan colleges and universi-ties, non-profit organizations such as AFT, andbotanical gardens are additional sources of infor-mation.
Public PolicyAcademicians and others have advocated strongly
the decoupling of agricultural policy from rural com-munity development policy because of the former’straditional focus on commodity production and the lat-ter’s on social and economic needs in a changing soci-ety. Relatively few of the nation’s policies have ad-dressed the role of agriculture within metropolitanand rural areas. Urban agriculture is at the interfaceof agricultural enterprises, local communities, and thenatural landscape. This interface requires that pub-lic policy address the common and unique needs ofeach component. Important aspects of this policy pro-cess, and the common ground they share, are land-use planning, planning for agriculture, and long-termfood security. Embedded in the planning and foodsecurity issues are the sustainability and the viabili-ty of natural resources and ecosystems and the devel-opment of alternative policies preserving the capabil-ity to use these resources wisely while ensuringquality of life. As new policies are developed and cur-rent policies scrutinized, assessments of their effectsmust be made regularly to support informed decisionmaking by policymakers and local leaders.
Farm subsidy payments can hurt rural communi-ties by absorbing financial resources. This practicelimits the availability of funds to encourage rural com-munities to work in partnership with urban neigh-bors. At the same time, current farm policies omitcertain types of farm businesses (e.g., turf and vege-table, fruit, greenhouse, nursery, and other specialtycrops) often found in MAs. A need exists to reorientagricultural policy toward programs equitably sup-porting diverse farming and/or food systems tostrengthen the relation between rural and urban ar-eas and to promote natural-resource stewardship.Policies also should reflect the realities of the kindsof current systems, the public support that exists for
family farmers, and society’s goals for more sustain-able food, agriculture, natural resource, and commu-nity systems to meet the needs of future generations.
The need for reform in U.S. farm policy was rein-forced by a recent AFT national public opinion sur-vey of registered voters, which indicated overwhelm-ing public support for the many services thatfarmland provides, including food and fiber produc-tion, wildlife habitat, scenic vistas, ecosystem servic-es, ground-water recharge, and “agritainment.” Thepublic supports the use of farm subsidy payments tohelp family farmers under stress from low marketprices, floods, or drought, and to encourage improvedconservation and stewardship practices (AFT 2001b).
Equitable rural and urban policies must be tailoredto a region’s identity and needs as well as to the wel-fare of its residents. The following three dimensionsshould be considered in the shaping of future urbanagricultural policies: land use, food systems, and hu-man capital development.
Land UseAs urban areas continue to grow and to sprawl,
they change the landscape by altering or eliminatingecologically valuable land and forest resources. Landfragmentation has become an important issue at theurban fringe. The spread of urban boundaries andhuman populations into rural areas alters the land-scape in terms of its economic, social, cultural, andnatural functions and values. How can these chang-es occur and how can they be mediated? The follow-ing suggestions are offered to address some of thechallenging agricultural land-use policy issues.
1. Analysis of alternative policy instruments.A crucial need exists for cost effectivenessanalyses of alternative land-use policy in-struments (e.g., rural zoning, urban growthboundaries, tax incentives, and agricultural con-servation easements). Alternative tools for farm-land and open-space protection and managementneed to be compared by means of selected casestudies. Because land-use change tends to be aregional phenomenon, regional technologies forguiding growth also should be analyzed for cost,effectiveness, and distributional issues. Whopays, who gains, and who loses under rural zon-ing, easement purchase programs, or tax incen-tives? Political positions are taken based on whois asked to pay the bill for protecting open space.Alternative policy scenarios, including subse-quent effects, are needed.
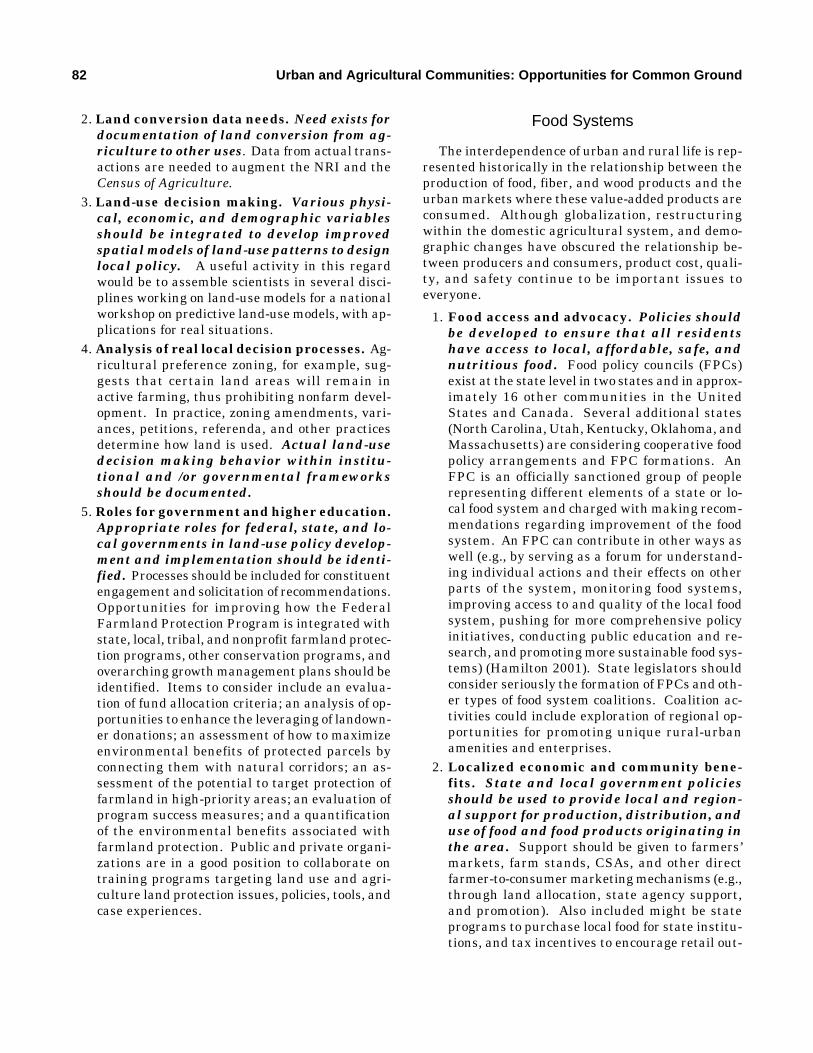
82 Urban and Agricultural Communities: Opportunities for Common Ground
2. Land conversion data needs. Need exists fordocumentation of land conversion from ag-riculture to other uses. Data from actual trans-actions are needed to augment the NRI and theCensus of Agriculture.
3. Land-use decision making. Various physi-cal, economic, and demographic variablesshould be integrated to develop improvedspatial models of land-use patterns to designlocal policy. A useful activity in this regardwould be to assemble scientists in several disci-plines working on land-use models for a nationalworkshop on predictive land-use models, with ap-plications for real situations.
4. Analysis of real local decision processes. Ag-ricultural preference zoning, for example, sug-gests that certain land areas will remain inactive farming, thus prohibiting nonfarm devel-opment. In practice, zoning amendments, vari-ances, petitions, referenda, and other practicesdetermine how land is used. Actual land-usedecision making behavior within institu-tional and /or governmental frameworksshould be documented.
5. Roles for government and higher education.Appropriate roles for federal, state, and lo-cal governments in land-use policy develop-ment and implementation should be identi-fied. Processes should be included for constituentengagement and solicitation of recommendations.Opportunities for improving how the FederalFarmland Protection Program is integrated withstate, local, tribal, and nonprofit farmland protec-tion programs, other conservation programs, andoverarching growth management plans should beidentified. Items to consider include an evalua-tion of fund allocation criteria; an analysis of op-portunities to enhance the leveraging of landown-er donations; an assessment of how to maximizeenvironmental benefits of protected parcels byconnecting them with natural corridors; an as-sessment of the potential to target protection offarmland in high-priority areas; an evaluation ofprogram success measures; and a quantificationof the environmental benefits associated withfarmland protection. Public and private organi-zations are in a good position to collaborate ontraining programs targeting land use and agri-culture land protection issues, policies, tools, andcase experiences.
Food Systems
The interdependence of urban and rural life is rep-resented historically in the relationship between theproduction of food, fiber, and wood products and theurban markets where these value-added products areconsumed. Although globalization, restructuringwithin the domestic agricultural system, and demo-graphic changes have obscured the relationship be-tween producers and consumers, product cost, quali-ty, and safety continue to be important issues toeveryone.
1. Food access and advocacy. Policies shouldbe developed to ensure that all residentshave access to local, affordable, safe, andnutritious food. Food policy councils (FPCs)exist at the state level in two states and in approx-imately 16 other communities in the UnitedStates and Canada. Several additional states(North Carolina, Utah, Kentucky, Oklahoma, andMassachusetts) are considering cooperative foodpolicy arrangements and FPC formations. AnFPC is an officially sanctioned group of peoplerepresenting different elements of a state or lo-cal food system and charged with making recom-mendations regarding improvement of the foodsystem. An FPC can contribute in other ways aswell (e.g., by serving as a forum for understand-ing individual actions and their effects on otherparts of the system, monitoring food systems,improving access to and quality of the local foodsystem, pushing for more comprehensive policyinitiatives, conducting public education and re-search, and promoting more sustainable food sys-tems) (Hamilton 2001). State legislators shouldconsider seriously the formation of FPCs and oth-er types of food system coalitions. Coalition ac-tivities could include exploration of regional op-portunities for promoting unique rural-urbanamenities and enterprises.
2. Localized economic and community bene-fits. State and local government policiesshould be used to provide local and region-al support for production, distribution, anduse of food and food products originating inthe area. Support should be given to farmers’markets, farm stands, CSAs, and other directfarmer-to-consumer marketing mechanisms (e.g.,through land allocation, state agency support,and promotion). Also included might be stateprograms to purchase local food for state institu-tions, and tax incentives to encourage retail out-
New Visions for Urban Agriculture 83
lets to take advantage of locally available foods.3. Food security and nutrition. Who consumes
what products, in what quantity, and atwhat costs in a given period of time are im-portant market issues. There are also vitalsocial and cultural issues when access toaffordable and nutritious food is unequalamong particular societal groups. Many gov-ernmental and local community programs existto serve these groups. As federal and other gov-ernmental policies decrease the size of the U.S.social welfare program, disadvantaged groupsand their patterns of consumption relative towhere they live must be monitored continually.Programs such as the Community Food SecurityProgram and others under the USDA’s Food,Nutrition, and Consumer Services auspice needcontinued public funding and support.
4. Converting and revitalizing vacant or un-derused urban lands. Policy initiatives areneeded to convert or revitalize underused ormisused urban land to encourage more lo-calized food production and access and toincrease knowledge of horticulture and oth-er food-related activities.
Human Capital Development
There is much evidence that farming, as an occu-pation, no longer is attractive to the greater portionof the U.S. population. This fact is reinforced by theincreasing average age of the U.S. farmer and by thedecline in numbers of individuals with a direct tie toproduction agriculture. Even when immigrants mi-grate to rural communities for agricultural labor pur-poses, their migration and stay often represents atemporary situation. Immigrants frequently leave arural area as soon as they can find work in a metro-politan one. Many new residents have a backgroundin agriculture and entrepreneurship from other coun-tries. Yet little effort is made to encourage them toremain in the agricultural sector at a managerial orownership level. Questions to help frame policy areas follows:
1. How can a new generation of entrepreneur-ial farmers evolve? What type of policies areneeded to offer mentoring and incentivesfor new farmers and ranchers? For example,might states identify ways to mentor and to en-courage urban entrepreneurs, immigrants, orwomen interested in entering farming or ranch-
ing as a profession? How can policy promote thedevelopment of needed skills for more sustainableproduction and marketing systems appropriate tosmaller, more intensive land parcels in urbanneighborhoods?
2. What is the role of agricultural policy in cre-ating a new generation of successful agricul-turalists who can adapt to the needs of amore urbanized society? Could policy fos-ter a healthier balance between large-scalecorporate agriculture and small to midsizedfamily farming systems that exist within ornear MAs?
3. What programs can be developed to helpyoung farmers or ranchers gain access toneeded capital? There may be ways for youngand more experienced farmers to partner inadapting a farm enterprise for the future.
Higher EducationSince the passage of the Land Grant Acts of 1862
and 1890, the study of agriculture has been perceivedby many people as largely under the purview of LGUs.Furthermore, urban studies have been perceived asmainly unrelated to agriculture and under the domainof non-LGUs, or at least outside of colleges of agricul-ture. For urban agriculture to reach its potential,LGUs, non-LGUs, and colleges within LGUs mustwork together to educate students (through formallearning processes) and the public (through informallearning processes). Metropolitan universities andcolleges are among the key players in such future re-lationships. A great number of these institutions of-fer exciting undergraduate courses and graduate pro-grams focusing on problems of the rural-urbaninterface (e.g., University of New Orleans, ClevelandState University, University of Southern Maine, Uni-versity of North Carolina–Charlotte, The EvergreenState College, and Tufts University). Some specificopportunities for higher education include the follow-ing:
1. College and university curricula. Collegeand university curricula, including generaleducation requirements, should be strength-ened to ensure that urban agriculture issuesare addressed in an interdisciplinary, sys-tems-oriented manner. The rural-urban agro-ecosystem concept and the interdependency thatexists between the sectors should be developedfurther. Curricula should include subject matter
84 Urban and Agricultural Communities: Opportunities for Common Ground
integrating such areas as resource allocationand management, horticulture and forestry,agroecosystems analysis and services, food sys-tems, conflict resolution and consensus building,social and cultural change, conservation and en-vironmental protection, technology’s social im-pacts, IPM, urban soils, land and water, policyand planning, landscape design, and applied/par-ticipatory research. Learning processes engaging
ships between urban leaders and plannersand to develop educational and outreachprograms addressing problems within therural-urban agroecosystem. Three importantfocal areas are food systems, agricultural landand open-space protection, and building entrepre-neurial capacity.• Food systems. Food-system learning
projects should be initiated. These projectswill monitor and analyze the food systems inparticular communities or regions; improveaccess of low-income residents to food sourcesby improving transportation or by influencingretail outlet location decisions; advocate for,and establish, community gardens for afford-able and fresh produce; facilitate food-relatedemployment and entrepreneurship; educateresidents and leaders about issues related tonutrition, grocery shopping, gardening, foodbuying and marketing, food preparation, andpolicy; encourage sustainable food productionand distribution; strengthen linkages betweenlocal farmers and consumers; devise innovativehunger-prevention programs; provide leader-ship to involve community leaders in the devel-opment of community food security provisionsand to formulate food and agriculture policyrecommendations at various government lev-els.
• Agricultural land and open-space protec-tion. More emphasis needs to be given toextension and applied research programsin the area of agricultural land and open-space protection. Such efforts need to bedeveloped thoughtfully to ensure neutral-ity and balance in addressing the needsand interests of all stakeholders, withoutfavoring any interest group over another.Public education based on solid data is neededabout how agriculture contributes to the com-munity and how much it contributes economi-cally. One important aspect to address is theissue of how much “critical mass” of farmingand associated infrastructure is needed to sus-tain benefits. Extension also can assume lead-ership in documenting and disseminating suc-cessful farmer adaptation strategies. Whereextension has helped in the process of farmlandand open-space policy development, it is impor-tant to document the processes used, and es-pecially those that have been successful. Howhave stakeholders been identified and en-
Figure 8.2. A faculty member points out qualities of a pond-raised hybrid striped bass for a student studyingfisheries science at Delaware State University.Photo by Scott Bauer, Agricultural Research Ser-vice, U.S. Department of Agriculture, Beltsville,Maryland.
students in real-world issues and problems facedby people in communities, governments, and theprivate sector should be encouraged (Figure 8.2).
2. Outreach and extension. Extension out-reach programs could be strengthened inseveral areas. Following the lead of some, allLGUs should establish a rural-urban inter-face team to initiate collaborative partner-
New Visions for Urban Agriculture 85
gaged? This information would be useful if itwere written up in case study form and sharedwith other communities developing participa-tory processes and policies for farmland andopen-space protection (NRCRD 2001).
• Building entrepreneurial capacity. Amer-ican economic success is rooted in entre-preneurship. Extension can play a key rolein stimulating entrepreneurial partner-ships between rural and urban constitu-encies and in assisting communities inidentifying market opportunities and cus-tomer preferences. Chances for success canbe increased when rural communities establishdirect connections to urban leaders and deci-sion makers, market outlets, and consumers.Extension can also provide entrepreneurialleadership training and support for the orga-nization of farmer marketing alliances.
3. Bridge building. Programs should be devel-oped to resolve conflict and to build partner-ships between urban and rural users of ag-ricultural information and technology,especially to serve commodity groups, otherspecial interest groups, and urban usergroups. Special attention should be paid tolearning about the needs, interests, and prioritiesof urban-oriented organizations such as the Ur-ban Land Institute, National League of Cities,National Governors Association, National Asso-ciation of Towns and Townships, American Plan-ning Association, and National Association ofCounties. Where possible, LGUs should be encour-aged to partner with, and learn from, urban-orient-ed and other appropriate nonprofit groups such asthe AFT, Kellogg Foundation, and Audubon Soci-ety. Such partnerships offer a timely opportunityfor LGUs to demonstrate where and how agricul-ture can contribute to organizational agendas.
4. Public education and promotion. Public ed-ucation to improve understanding betweenrural and urban populations about the in-terdependency of these sectors and the poten-tial contributions that agriculture can maketo improved quality of life, economic en-hancement, resource conservation, and en-vironmental preservation is needed. Distanceeducation technology offers significant opportu-nities for reaching out to a variety of place-boundaudiences about the issues of urban agricultureand their relevance to urban life. The subjectmatter of agriculture must be presented to peo-
ple of all ages, in light of current trends towardsurbanization. This presentation will call for anupdating of curricula offered by such programs asAg in the Classroom, 4-H, and Future Farmersof America (FFA). Opportunities exist to workthrough programs such as Master Gardeners,Master Composters, and docent programs in bo-tanical gardens to offer holistic strategies for ur-ban agriculture, including issues of rural-urbaninterdependency.
5. Professional development. In-service train-ing programs should be established for col-lege and university faculty and staff to helpthem deal effectively with the emerging ur-ban agriculture-related issues addressed inthis report. Opportunities to include an urbanagriculture curriculum in the training of publicschool teachers and other youth educators shouldbe identified.
6. Internal planning and organization. High-er education can benefit by sharing resourc-es, searching out new sources of funding,and addressing rural-urban agroecosystemissues. Some sharing may be made possible bymeans of creative reallocation of existing monies;it will be essential, however, to seek the supportand the participation of new partners. Resourc-es should be refocused on issues beyond commod-ity-based agriculture, to include holistic strate-gies and content more appropriate to thechanging rural and urban agricultural situation.Careful planning will be needed to identify across-disciplinary mechanism or structure thatwill foster a systems approach for responding tocommon urban-rural agricultural opportunities.
ResearchThe clear need exists for more science-based
information in designing, developing, and man-aging urban environments. Without a strong sci-ence base, decisions too often are made solely on thebasis of factors such as financial gain, political influ-ence, and public sentiment. Such decisions may seemto work in the short-term but have negative long-termconsequences. Research opportunities related to ur-ban agriculture, as broadly defined in this document,have not been clearly articulated or enumerated inwriting. Key areas of research need to be identifiedfor the agricultural, biological, and social sciences.Active engagement with urban and rural communityleadership will help individuals refine and focus this
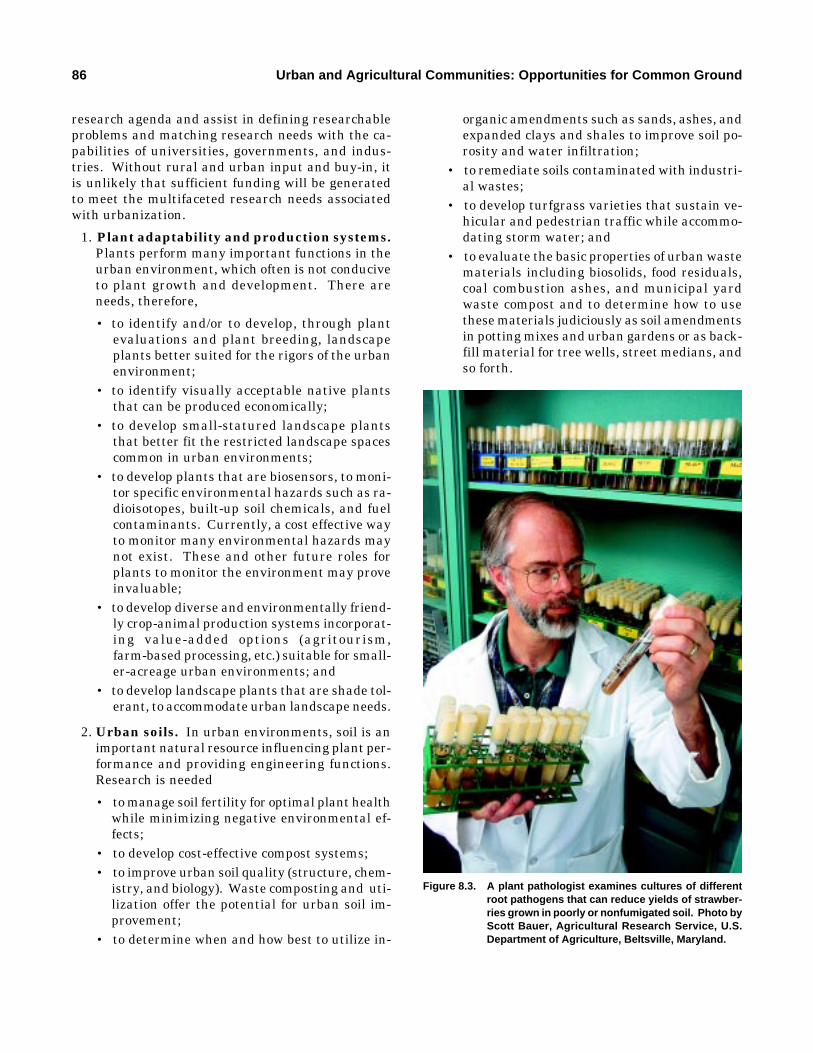
86 Urban and Agricultural Communities: Opportunities for Common Ground
research agenda and assist in defining researchableproblems and matching research needs with the ca-pabilities of universities, governments, and indus-tries. Without rural and urban input and buy-in, itis unlikely that sufficient funding will be generatedto meet the multifaceted research needs associatedwith urbanization.
1. Plant adaptability and production systems.Plants perform many important functions in theurban environment, which often is not conduciveto plant growth and development. There areneeds, therefore,
• to identify and/or to develop, through plantevaluations and plant breeding, landscapeplants better suited for the rigors of the urbanenvironment;
• to identify visually acceptable native plantsthat can be produced economically;
• to develop small-statured landscape plantsthat better fit the restricted landscape spacescommon in urban environments;
• to develop plants that are biosensors, to moni-tor specific environmental hazards such as ra-dioisotopes, built-up soil chemicals, and fuelcontaminants. Currently, a cost effective wayto monitor many environmental hazards maynot exist. These and other future roles forplants to monitor the environment may proveinvaluable;
• to develop diverse and environmentally friend-ly crop-animal production systems incorporat-ing value-added options (agritourism,farm-based processing, etc.) suitable for small-er-acreage urban environments; and
• to develop landscape plants that are shade tol-erant, to accommodate urban landscape needs.
2. Urban soils. In urban environments, soil is animportant natural resource influencing plant per-formance and providing engineering functions.Research is needed
• to manage soil fertility for optimal plant healthwhile minimizing negative environmental ef-fects;
• to develop cost-effective compost systems;• to improve urban soil quality (structure, chem-
istry, and biology). Waste composting and uti-lization offer the potential for urban soil im-provement;
• to determine when and how best to utilize in-
organic amendments such as sands, ashes, andexpanded clays and shales to improve soil po-rosity and water infiltration;
• to remediate soils contaminated with industri-al wastes;
• to develop turfgrass varieties that sustain ve-hicular and pedestrian traffic while accommo-dating storm water; and
• to evaluate the basic properties of urban wastematerials including biosolids, food residuals,coal combustion ashes, and municipal yardwaste compost and to determine how to usethese materials judiciously as soil amendmentsin potting mixes and urban gardens or as back-fill material for tree wells, street medians, andso forth.
Figure 8.3. A plant pathologist examines cultures of differentroot pathogens that can reduce yields of strawber-ries grown in poorly or nonfumigated soil. Photo byScott Bauer, Agricultural Research Service, U.S.Department of Agriculture, Beltsville, Maryland.
New Visions for Urban Agriculture 87
3. Water management. Urban water issues, es-pecially in the western and southern UnitedStates, where MAs have been increasing, arecharacterized by increasing conflict due to thedemand for high-quality water for urban con-sumption, industrial processes, and irrigation.Accordingly, an acute need exists for research
• to develop water conservation programsand landscape designs leading to moreefficient use of water;
• to identify and/or to develop landscapeplants requiring less water;
• to develop more efficient irrigation sys-tems increasing water use efficiency;
• to develop improved landscape manage-ment techniques aimed at decreasing thenegative effects of fertilizer and pesti-cides on surface- and groundwater quali-ty;
• to identify appropriate construction ma-terials and designs for construction ofgroundwater recharge systems and wet-lands that can be used to control thequantity and quality of urban storm-wa-ter runoff;
• to develop total maximum daily load(TMDL-maximum pollutant load capaci-ty) for a body of water and land in urbanwatersheds, for the purpose of designingremedial systems to restore water quali-ty; and
• to characterize the ecological risks asso-ciated with water re-use programs of in-dustries and municipalities. Based on thischaracterization, alternatives can be developedfor improving management and decreasing eco-logical and health risks.
4. Pest management. Urban landscapes face chal-lenges from insects and plant pathogens. Addi-tionally, there are other pest concerns (termites,spiders, etc.) associated with built structures andwith human diseases (Lyme disease, Nile Virus,etc.) transmitted by insects and wildlife. In ur-ban environments, however, pesticide usage is aserious concern and likely will face increasinglystringent regulation. There is a need for researchaimed at developing more environmentally-friendly pest management strategies. This needincludes development of
• insect- and disease-resistant plants;
• IPM and biocontrol systems of plants, in-sects and diseases (Figure 8.3);
• structural pest-management strategies(e.g., control of household pests, wood-destroying pests, and pests that invadestructures such as airplanes, docks, ships,railroad cars, or trucks) posing minimalrisks for humans and the environment;and
• safe methods for discouraging wildlifefrom feeding on valuable landscapeplants, for selecting plants resistant toanimal feeding, and for preventing trans-mission of animal diseases to humans.
5. Entrepreneurial products. Advancements inscience and technology have created oppor-tunities for new products and services. Agri-cultural science has made it possible to createseveral revenue streams from any one product(e.g., extraction of plant and animal compoundsfor treatment of health ailments, production offood preservatives, or generation of energy andenergy byproducts). These new developmentscreate a need for documentation of economic fea-sibility, marketing and production budgets forproducts or services such as biofuels, neutraceu-ticals, waste utilization, alternative compostingtechnologies, site remediation, natural resourcemanagement, and individual health care servic-es. Through creative partnerships, rural and ur-ban areas can work together to create a varietyof value-added products and services.
6. Social and economic dimensions. There islimited understanding of the general pub-lic’s attitudes, perceptions, and knowledge ofthe contributions of urban agriculture. Partof society’s challenge is to build public recognitionof the reciprocal value existing between rural andurban sectors and of the positive role that agri-culture, in its broadest sense, can play. There alsois a continual need to understand consumertrends and demands regarding agricultural prod-uct and service expectations, especially those re-lated to individual and community health andwell-being. Research should be conducted on thefollowing topics:
• Public attitudes and perceptions. Nation-al and local studies using targeted focusgroups should describe the general pub-lic’s understanding and perceptions ofagriculture’s role in rural and urban so-
88 Urban and Agricultural Communities: Opportunities for Common Ground
cieties. A national survey should investi-gate the degree of differentiation that thepublic makes between the two sectors, forinstance, whether the public distinguish-es between rural and urban agriculture,and how it perceives urban sprawl.
• Connections and common interests. Rel-atively little understanding exists of theactual connections and common interestsbetween farm and nonfarm (or rural andurban) people and organizations. Giventhis type of insight, people could be moreable to take advantage of existing social net-works and common denominators for improvedrural-urban policy planning.
• Individual and community health andwell-being. Research is essential to docu-ment the effect that plants have on healthand well-being of individuals and commu-nities in diverse settings and cultures.These effects can include environmental, ther-apeutic, and economic applications. Research-able areas include plant and animal roles inprevention and recovery from major illnesses,and in stress reduction; effects of plants and an-imals on decreased cost of health care; chil-dren’s plant and animal interactions and theirdevelopmental benefits; plant and animal ef-fects on worker productivity and absenteeism;and effects of attractive and well-planned land-scapes on commuter stress mitigation.
7. Farmland protection. A conference sponsoredby the American Planning Association, The Cen-ter for Agricultural and Rural Policy, The North-east Regional Center for Rural Development, TheSwank Program in Rural-Urban Policy (The OhioState University), and others was held in Septem-ber 2001 to examine the regulations surroundingland-use management (agricultural protectionzoning, right-to-farm laws, and urban growthmanagement regulations) and to identify theknowledge gaps concerning the effectiveness ofthese policies (NRCRD 2001). Conference par-ticipants, including leading scholars and programmanagers, generated recommendations tostrengthen the research agenda on farmland andopen-space protection. The section that followsdraws on the proceedings of this conference, aswell as on the suggestions of the CAST authors.The recommended areas of research are asfollows:
• Problem clarification. Documentationand understanding of the nature and theamount of converted farmland should beimproved, as should documentation andunderstanding of farmers’ adaptations tochanges at the rural-suburban fringe.Topics that should be considered include relat-ed outcomes; population changes in placeswhere farmland and open space are underthreat; personal and family factors affectingfarmers’ decision making in the face of threat;effects of industrializing the food system onfarmers’ decision making about land conver-sion; economic effects of farmland loss on com-munities; role of agriculture in local, regional,and state economies; location choices and pref-erences of residents and roles of organizationsaffecting choices; and factors influencing devel-opment of farmland and open space. Questionsto be addressed include: What is the criticalmass of farms and associated businesses need-ed for long-term farm viability? What is thenature of “sprawl” and what are its impacts onagriculture? How can agriculture help mitigatethe problems of population growth and sprawl?What are the population growth trends and theamount of agricultural land used for develop-ment?
• Public preferences and values. Public per-ceptions of farmland, including values andpreferences and perceived positives and nega-tives, are important for planning purposes. Dopeople want farms and the accompanyingchanges of economic viability, or do they wantthe amenities that come with living nearfarms? People’s willingness to pay for the out-comes of farmland and open-space protectionpolicies should be documented. Rural and ur-ban stakeholders in farmland policyshould be identified, as should their goals,including convergent and conflicting goalsets and policies.
• Integration of policy tools. Integration ofpolicy goals should be improved, as shouldanalytical methods, policy tools, and gov-ernmental boundaries. Improved under-standing of farmland protection goals to ensurethat policy design meets stakeholder preferenc-es is called for. Multidisciplinary studies help-ing explain land conversion decisions andstresses could be used to help formulate pub-lic and private responses to farmland and open
New Visions for Urban Agriculture 89
space loss. Insights from family sociology, con-flict resolution, legal, financial, and other hu-man dimensions might aid in the considerationof certain complex problems. Because policiesoften are used together, the potential comple-mentarity (or conflict) of different policy toolsis an important issue, as is the means of eval-uating “blended” policies. How to apply poli-cies across political boundaries effectively, andwhat the outcomes may be for different stake-holders and jurisdictions, need to be under-stood more clearly. Evaluation of existing re-gional growth management programs would beuseful.
• Effects of farmland protection policies.Limited research has been done to documentagricultural land protection policy options andtheir effectiveness. Studies are needed to as-certain the true effects of policies on prop-erty values, to learn the effects of grantingvariances to agricultural zoning, and tounderstand the unintended consequencesof farmland and open-space protectionpolicies, including second- and third-lev-el effects. What are the implications of policydesigns emphasizing common group goals, andhow are individual interests affected? Advanc-ing conceptual designs for policy evaluationand implementing comparative evaluationstudies across states are necessary steps.There also is a need to measure and to under-stand the effects of land-use fragmentation (or“leapfrog” development) on agriculture, aes-thetics, and wildlife habitats. Another impor-tant issue is the need to understand the envi-ronmental benefits of working agriculturallands in urban-influenced areas.
• New policy tools. Research on farmlandand open-space protection needs to bemore creative. Approaches can include iden-tifying new funding sources for PDRs; usingmultidisciplinary teams to understand farm-ers’ departure from farming, and, subsequent-ly, applying these findings to interventions;creating multidisciplinary studies of develop-ment patterns at the rural-urban interface,including roles and motivations of differentstakeholders; examining interactions amongpolicies, farmers, and residents at the rural-urban fringe, including insights into success-ful farmer adaptations; documenting who ben-efits and who pays as a result of these
programs; engaging in systems-oriented stud-ies of the relations between farmland protec-tion issues and other issues such as housing,and identifying stakeholders; and clarifying thepolitical and institutional connections.
Partnerships and CollaborationHistorically, agricultural commodity and allied in-
dustry groups have been the voices of agriculture. Byproviding financial and political support and advice,these interest groups have had a major influence onthe traditional agricultural system. Generally, theyhave defined their interests as rural; consequently,they probably have not appreciated the value of anurban partnership fully. Likewise, urban populationsprobably have failed to appreciate fully the value ofpartnering with rural constituencies. The changingagricultural support base, increasing environmentalconcerns, diminishing natural resources, and increas-ing public demand for recreational and open spaceswill continue to make rural-urban partnerships ex-tremely important. If agriculture is to survive, albe-it in a different form, in an urbanizing society, part-nerships between traditional agricultural groups andurban interest groups will be imperative. These newrelationships hold promise for all participants andhave the potential to secure new resources, to preserveproductive agriculture land and open space, to con-trol sprawl, to maintain equitable access to naturalresources, and so on.
Partnerships and coalitions among diverse organi-zations can play a crucial role in solving problems andcreating new opportunities, especially when urbanagricultural issues are so complex, multidimension-al, and often unprecedented. Urban agriculture canattract a wide group of stakeholders, ranging fromindividuals in higher education to those in state andlocal governments or in the private sector. Govern-ment agencies include those with nonagriculturalorientations such as planning, environmental health,economic development, and tourism. Together, a co-alition of broad-based interests could be a formidableforce with which to address the opportunities andchallenges of urban agriculture.
Regardless of one’s institutional affiliation, the ad-vantages of expanding relationships beyond thosewithin the organizations with which one normally as-sociates are many. For urban leaders and planners,establishing ties with agricultural partners can leadto new knowledge, information, and resources. For
90 Urban and Agricultural Communities: Opportunities for Common Ground
rural and urban leaders, establishing partnershipsopens opportunities to connect the two sectors, there-by expanding resources, generating economic oppor-tunities, and providing better customer insights. Fornonprofit organizations, new partnerships can expandthe scientific resource base and enable developmentof an area of expertise pertinent to their missions. Theprivate sector can benefit from university partner-ships by accessing new science-based knowledge withwhich to strengthen the competitive advantage. Part-nerships between agencies and urban leaders can helpbusinesses through product exposure and can providetimely insights into urban needs and priorities.
As the agricultural agenda shifts towards urban in-terests, LGUs have an opportunity to reposition them-selves in response to societal needs. Land-grant uni-versities, whose mission includes outreach and serviceto all of society, must identify new and creative waysof doing business to reach their full potentials in anurbanizing environment. The enormous intellectualcapital held in LGUs has the capacity to help fuel anurban agriculture success story paralleling that of therural agricultural agenda over the past 100 years.The urban agricultural agenda offers LGUs a uniqueopportunity to engage collectively both urban andrural constituents. Strong relationships between ur-ban leaders and organizations bringing a different setof experiences and perspectives to the table canstrengthen both rural and urban areas and the agri-cultural institution itself. Land-grant universitieshave an opportunity to reinvent themselves by devis-ing strategies to service rural needs while simulta-neously adapting science and services to meet theneeds of a growing urban sector.
The challenge is to build new strategic partner-ships and new forms of public support while respond-ing to the expectations of traditional clientele. Theengaging of new partnerships will require leadershipand focused efforts in which common problems, goals,and agendas are shaped together, for mutual bene-fit. The value of diverse partnerships, for example,with K–12 education, community colleges, and otherpublic and private four-year institutions of highereducation, has been articulated clearly in reports bythe Kellogg Commission on the Future of State andLand Grant Universities (1999, 2000). According tothe commission, universities must continue to changeto meet societal expectations. One way to accomplishchange is to create two-way partnerships defined bymutual respect and joint commitments to finding so-lutions to real societal problems. Issues to be rede-fined in more contemporary terms include education
and the economy, agriculture and food, urban revital-ization, and environmental and natural resources.The “urban-rural common ground” concept, to whichthis report directs attention, fits clearly within theKellogg Commission mandate. The questions thatthis CAST report raises require a range of problem-solving, financial, and other resources. Six sugges-tions are provided to stimulate ideas about potentialpartnerships through which to address the complexissues of the rural-urban agroecosystem.
1. Expanded representation. The strength ofpartnerships is the breadth of experiencesand backgrounds brought together. This isthe crucial mandate of urban agricultureand will call for coalition building amongdiverse organizations whose agendas corre-spond with certain components of the rural-urban agroecosystem. Key partners include thefollowing:
• Higher education. The LGU departments(e.g., sociology, psychology, marketing, polit-ical science, languages, ethics, history, archi-tecture and landscape design, urban plan-ning, engineering, environmental sciences,extension services, and various agriculturalsciences), community colleges, private univer-sities, and medical and technical schools.
• Government agencies. County/state lead-ership (e.g., commerce and trade, tourism,planning, transportation, parks and recre-ation, community and economic development,land use, and agriculture) and federal agen-cies such as the Department of Education, theEnvironmental Protection Agency (EPA), theUSDA Sustainable Agriculture Research andEducation, CSREES, the Food and Drug Ad-ministration, the National Institutes ofHealth, the National Science Foundation, anddepartments of public works.
• Nonprofit organizations and other asso-ciations. Botanical gardens and arboreta,zoos, community food coalitions, communitygardens, greening organizations, the faithcommunity, conservation, wildlife and envi-ronmental organizations (e.g., Audubon, Si-erra Club, Ducks Unlimited, AFT, Land TrustAlliance, Trust for Public Lands), privatefoundations (e.g., W. K. Kellogg, Kerr, Noble,Mott), sustainable agriculture, and consum-er advocacy. Associations include such groupsas the Urban Land Institute, The National
New Visions for Urban Agriculture 91
League of Cities, The National Governors As-sociation, National Association of Towns andTownships, American Planning Association,and National Association of Counties.
• Private sector firms. Green industry, land-scape firms, tourism industry, processing anddistribution businesses, retail outlets, hospi-tals, nursing care facilities, and agronomicand equipment firms.
2. Partner engagement. The urban agricultureagenda offers higher education an opportu-nity to involve the entire campus communi-ty in solving complex urban agricultureproblems. Furthermore, developing a multi-disciplinary university effort in partnershipwith both urban and rural communities,public and private agencies, and privateindustry offers an excellent holistic modelfor developing programs addressing contem-porary societal needs. Opportunities for off-campus partnerships include the following:
• Community food systems partnerships.Building partnerships between farmers andmore urban-based groups (e.g., horticulture as-sociations, food systems councils, consumer ad-vocacy organizations, and farmers’ markets)could be very beneficial. One example couldinclude the integration of CSA initiatives(whereby consumers share the risks and ben-efits of farming) with the agenda of a food pol-icy council concerned about state or local foodpolicy. Community food projects can connectfood producers, consumers, and local food sys-tems to community objectives such as im-proved local health and diet, public education,food access, youth development, and recre-ation.
• Community greening partnerships be-tween urban and rural areas. The Ameri-can Community Gardening Association, forexample, is composed of various professionalgroups and volunteers who believe that gar-dening and landscaping activities are catalystsfor neighborhood and community development.
• Government, nonprofit organizations,and community partnerships. The UrbanResource Partnership (URP) is a USDA initia-tive encouraging neighborhood conservationpartnerships for education, resource protectionand enhancement, and community develop-
ment. The URP effort also is supported bypartnerships with other federal agencies. TheNRCS partners with AFT to support the Farm-land Information Center and to supply farm-land protection information.
• Wildlife and recreation area partner-ships. For example, the Audubon CooperativeSanctuary System, a partnership betweenAudubon International and the U.S. Golf As-sociation, encourages golf courses to developresource management programs to improveenvironmental quality for both people andwildlife.
• Watershed protection partnerships. TheNew York City Watershed Protection Pro-grams, established under the 1996 WatershedAgreement, reflect a partnership among up-state New York watershed communities, envi-ronmental organizations, New York City, NewYork state, and the EPA (Pfeffer and Wagenet1999). At stake is 1.4 billion gal. of high-qual-ity drinking water for daily consumption by al-most 9 million New York City residents. Thispartnership implements a comprehensivemanagement and water quality enhancementprogram to protect the watershed, the drink-ing water supply, and the economic viability ofthe agriculture-based economy within the wa-tershed communities.
3. Future faculty roles. The urban agricultureagenda calls for integrated and interdisci-plinary discovery, learning, and engagementapproaches within universities. Facultyparticipating in these collaborative activi-ties run the risk of not being rewarded bytheir institutional culture unless evaluationand reward guidelines are adapted to recog-nize individual contributions to the wholepartnership. This calls for revision of traditionalreward systems based solely on refereed journalarticles, grant dollars received, and individualachievement. Recognition of creativity and col-laborative scholarship will be an important mo-tivator to entice faculty contributions to partner-ships associated with complex urban agricultureproblems (Boyer 1990).
4. Cooperative extension. Extension remainsone of the country’s most unique mechanismsfor reaching beyond the university campusinto constituent communities. Nationwide,there are 74 LGUs classified as 1862 or 1890
92 Urban and Agricultural Communities: Opportunities for Common Ground
LGUs, 30 LGUs classified as 1994 institutions,and 3,150 county administrative units. In 1999–2000, there were 32,000 extension employees and2.8 million extension volunteers. In 1997 (the lastyear for which data are available), staff in exten-sion reached more than 110.5 million U.S. resi-dents. In spite of the strength of these resourc-es, most extension personnel are not situated inmetropolitan counties, and fewer yet are address-ing rural-urban agroecosystem issues/problems.The following suggestions offer means ofstrengthening extension’s effects in this impor-tant area:
• Broaden campuswide extension partner-ships to provide a wider base of expertiseon urban agriculture issues.
• Offer educational opportunities to orientorganizations about the values of urbanpartnerships. Develop a team approach thatincludes key urban agroecological elements(e.g., forest and natural resources, social andeconomic, environmental, business and mar-keting, nutrition and health, planning and de-sign, consumer horticulture, and crop produc-tion information).
• Assume leadership for urban and ruralagriculture coalition building and forengaging various interest communities inurban agriculture planning, program de-velopment, and funding. These joint coali-tions could address regional opportunities forachieving a competitive advantage aroundunique urban-rural enterprises, culturalamenities, and alliances.
• Enhance extension’s human resource ca-pacity by offering urban agriculture pro-fessional development opportunities in-volving specialized training fromnontraditional partners and the campus-wide community; identify opportunitiesfor extension personnel to learn from,and work with, new urban agriculturepartners and cooperators.
• Support and enhance volunteer-basedprograms such as extension Master Garden-ers and extension Master Composters, and ex-pand the concept to include “master entrepre-neurs” or other appropriate volunteer-basedprograms.
5. Experiential learning. An opportunity exists
to engage K–12 education, undergraduate,and graduate students attending public andprivate schools, colleges, and universities, inthe issues and problems of urban agricul-ture. Engagement can be facilitated through stu-dent experiential learning or service-learningopportunities such as internships, traineeships,and applied research projects. Through service-learning courses and community-based programsof study, students from different disciplines cancollaborate with the private and public sectorsand with nonprofit organizations to create mean-ingful community activities for academic credit.The service learning model, where institutional-ized, can enrich the learning and discovery expe-riences of faculty, students, and members of bothrural and urban agriculture communities. Spe-cific suggestions for universities attempting tostrengthen the experiential learning experiencefor students, faculty, and partners follow:• A campuswide center or institute should
be created to address the rural-urbanagroecosystem. A collaborative unit pat-terned after Clemson University’s SandhillCollaboration Center could bring together di-verse college and extension expertise, environ-mental and sustainability interests, communi-ty leaders, and others. State agency partnersmight include commercial, natural resource,environmental, recreational, and touristgroups. University and other organizationalinvestments would be necessary.
• University resources should be investedin a community of scholars program tosupport rural-urban agroecosystem expe-riential learning opportunities.
• Partnerships should be encouraged be-tween faculty in agricultural sciences andthe social sciences to bring together in aservice learning setting students of agri-culture and those interested in urbanand/or related human issues. The intentwould be to collaborate with urban profession-als and to use agricultural applications to meetcommunity needs.
6. Funding strategies. To finance or to supportthe building of partnerships and the urbanagriculture agenda, creative funding strat-egies are needed. One of the major challengesto supporting urban agriculture initiatives will bethe perception that funds will be diverted from
New Visions for Urban Agriculture 93
already underfunded rural commitments. Thisdilemma highlights the importance of a well-planned strategy evidencing clear understandingof the benefits to all partners. Funding resourc-es must be identified and shared so that all part-ners benefit. Although redirection of resourcesmay be one way to support new initiatives, reve-nue streams may be limited. Some alternativefunding strategies are as follows:
• Target state and federal grant initiativesto engage rural and urban people in plan-ning processes that address the rural-ur-ban agroecosystem.
• Form a rural-urban coalition of intereststo identify and to respond to common ru-ral concerns.
• Engage legislators, businesses, nonprofitorganizations, government agencies, andcommunity leaders in development ofjoint proposals. A broad base of ownershipin the proposal concept, its implementation,and problem solving approaches should be built(e.g., through think tanks, coalitions, centers,and/or institutes).
• Approach private and nonprofit fundingsources to support rural-urban agricul-ture partnership initiatives.
• Create innovative business models forprofit- and resource-sharing (e.g., of facili-ties, personnel, expertise, or funds) that involveprivate industry, local communities, familyfarmers, retailers, etc.
• Develop fee-based university-delivereddistance learning and professional devel-opment programs.
ConclusionsAgriculture is an integral part of urban growth and
population change. This fact often is unrecognized bythe general public, mainstream agricultural interests,and political leaders. In the minds of many, there issometimes a rural-urban split that results in compe-tition for resources, separate policies, and inaccuratestereotypes. But the interests and goals of rural andurban areas must be addressed together, and agricul-ture may provide a framework in which to do this.Many people have a deep-seated cultural need, some-times expressed in terms of the satisfaction of work-ing in the soil, of being close to nature, of sharing time
with a pet, or of knowing the farmers who producetheir food. This document has attempted to paint abroad picture of agriculture beyond its traditionalrural roots and production focus and to move the dis-cussion towards viewing agriculture as a commondenominator across rural and urban communities andenvironments. This CAST report has documentedsome of the many diverse components of agriculturethat are embedded in the rural-urban agroecosystem,a holistic concept used to highlight the connectionsbetween rural and urban economic, environmental,and human factors (see Figure 1.1).
The objectives of this report have been (1) to broad-en the understanding of agriculture in an urbanizingsociety; (2) to identify opportunities for rural and ur-ban constituencies to work cooperatively toward com-mon goals; (3) to document the contributions and/orservices that agriculture provides to both rural andurban sectors; (4) to stimulate broad debate and dis-cussions about program and policy directions andpriorities pertaining to agriculture in an urbanizingsociety; and (5) to propose ways in which contempo-rary agriculture, with other partners, can help soci-ety meet the challenges associated with urbanization.The audience for the report has been governmentpolicymakers and planners; administrators and fac-ulty of colleges and universities; and members of di-verse agricultural interest groups. Although the con-tents are applicable to the interests of traditionalagricultural clientele, such as agriculture commodi-ty groups, they have direct relevance to the needs oflocal government decision makers and planners, andto urban-oriented organizations focused on problemsof urban growth, economic development, communityadvocacy, food security, resource management, andother issues.
Several useful, though not necessarily new, con-cepts have been discussed: urban agriculture and therural-urban agroecosystem. Terms such as rural, ur-ban, metropolitan, and farm have been clarified. Thedocument has provided background on the historical,political, geographical, and demographic context ofagriculture, discussed the myths and stereotypes as-sociated with agriculture, and documented the met-ropolitan nature of today’s agriculture. For example,by 1997, metropolitan counties accounted for morethan half of all agricultural employment.
The report has summarized the services providedby contemporary agriculture to both urban and ruralareas, e.g., restoration and remediation, planning andrevitalization, and modifying landscapes and conserv-ing energy. Other benefits of agriculture, such as
94 Urban and Agricultural Communities: Opportunities for Common Ground
business and economic contributions, individual andcommunity health and well-being, and recreation andtourism, have been described. Growth managementand agricultural land-use policy, including an over-view of tools and strategies for agricultural land andopen space protection, have been addressed. The con-cluding section has proposed important new visionsto consider for agriculture in an urbanizing society.A number of different elements within each of thetopics presented have received attention: comprehen-sive planning, higher education, research, and part-nerships and collaboration.
This clearly is an appropriate time to redefine ag-riculture in the context of an urban society. Thewealth of knowledge associated with the wide array
of agricultural sciences could be put to valuable usein helping to meet many of the challenges of urban-ization. Together, rural and urban communities havethe potential to create a mutually beneficial situationbased on their unique resources, experiences, andcommon needs. Success will be achieved, however,only with proactive leadership, shared resources, cre-ative policy options, and effective collaboration. Land-grant universities, industry, traditional agriculturalinterest groups and urban partners—such as metro-politan educational institutions, city leaders, and ur-ban planners—will need to work together to embracechange and provide a new and exciting future foreveryone.
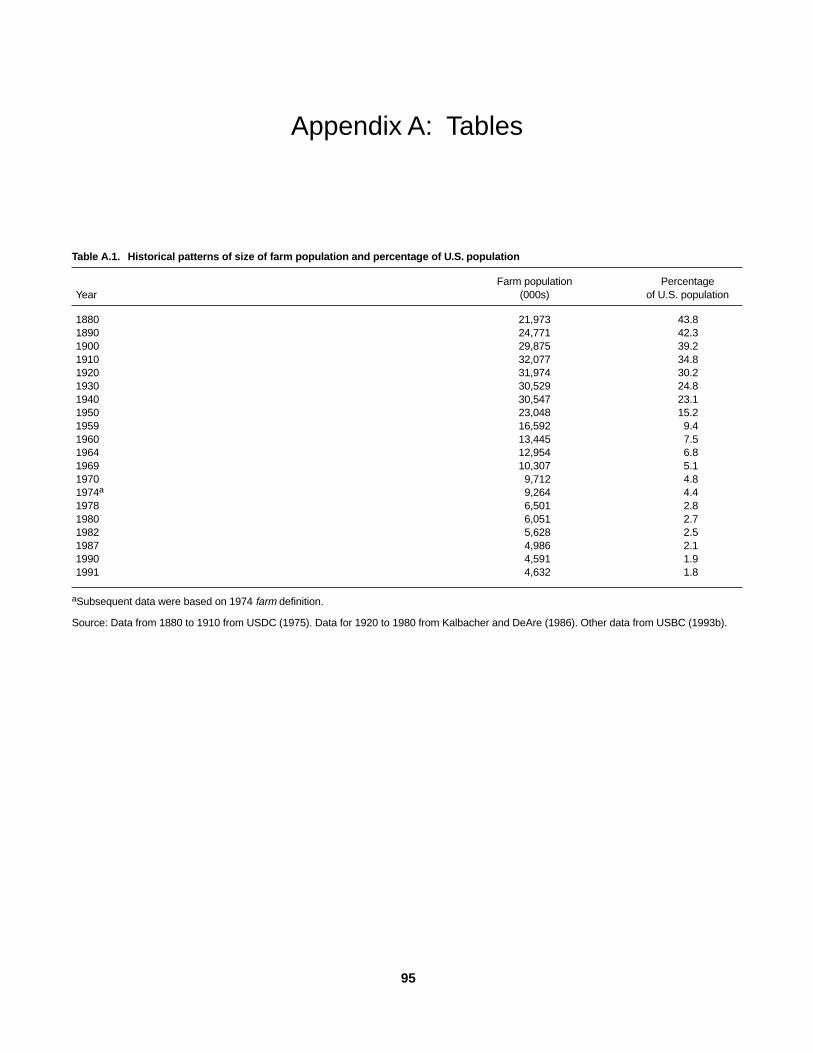
Appendix A: Tables 95
95
Appendix A: Tables
Table A.1. Historical patterns of size of farm population and percentage of U.S. population
Farm population PercentageYear (000s) of U.S. population
1880 21,973 43.81890 24,771 42.31900 29,875 39.21910 32,077 34.81920 31,974 30.21930 30,529 24.81940 30,547 23.11950 23,048 15.21959 16,592 9.41960 13,445 7.51964 12,954 6.81969 10,307 5.11970 9,712 4.81974a 9,264 4.41978 6,501 2.81980 6,051 2.71982 5,628 2.51987 4,986 2.11990 4,591 1.91991 4,632 1.8
aSubsequent data were based on 1974 farm definition.
Source: Data from 1880 to 1910 from USDC (1975). Data for 1920 to 1980 from Kalbacher and DeAre (1986). Other data from USBC (1993b).
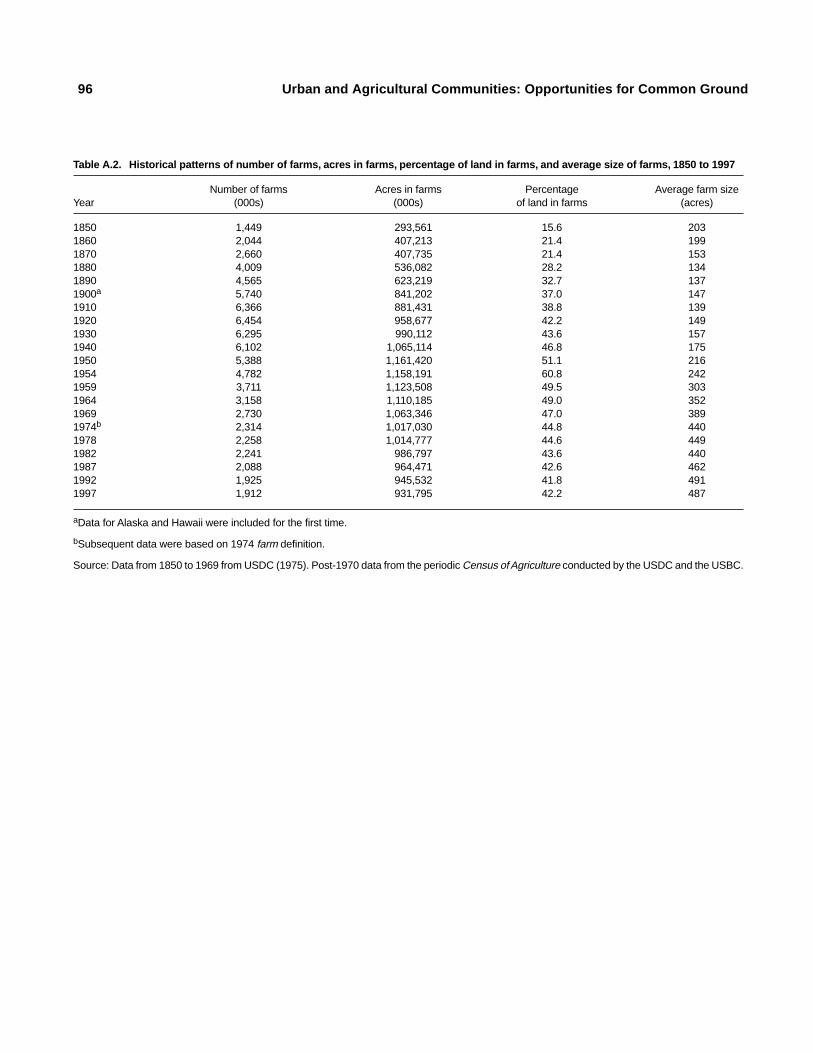
96 Urban and Agricultural Communities: Opportunities for Common Ground
Table A.2. Historical patterns of number of farms, acres in farms, percentage of land in farms, and average size of farms, 1850 to 1997
Number of farms Acres in farms Percentage Average farm sizeYear (000s) (000s) of land in farms (acres)
1850 1,449 293,561 15.6 2031860 2,044 407,213 21.4 1991870 2,660 407,735 21.4 1531880 4,009 536,082 28.2 1341890 4,565 623,219 32.7 1371900a 5,740 841,202 37.0 1471910 6,366 881,431 38.8 1391920 6,454 958,677 42.2 1491930 6,295 990,112 43.6 1571940 6,102 1,065,114 46.8 1751950 5,388 1,161,420 51.1 2161954 4,782 1,158,191 60.8 2421959 3,711 1,123,508 49.5 3031964 3,158 1,110,185 49.0 3521969 2,730 1,063,346 47.0 3891974b 2,314 1,017,030 44.8 4401978 2,258 1,014,777 44.6 4491982 2,241 986,797 43.6 4401987 2,088 964,471 42.6 4621992 1,925 945,532 41.8 4911997 1,912 931,795 42.2 487
aData for Alaska and Hawaii were included for the first time.
bSubsequent data were based on 1974 farm definition.
Source: Data from 1850 to 1969 from USDC (1975). Post-1970 data from the periodic Census of Agriculture conducted by the USDC and the USBC.
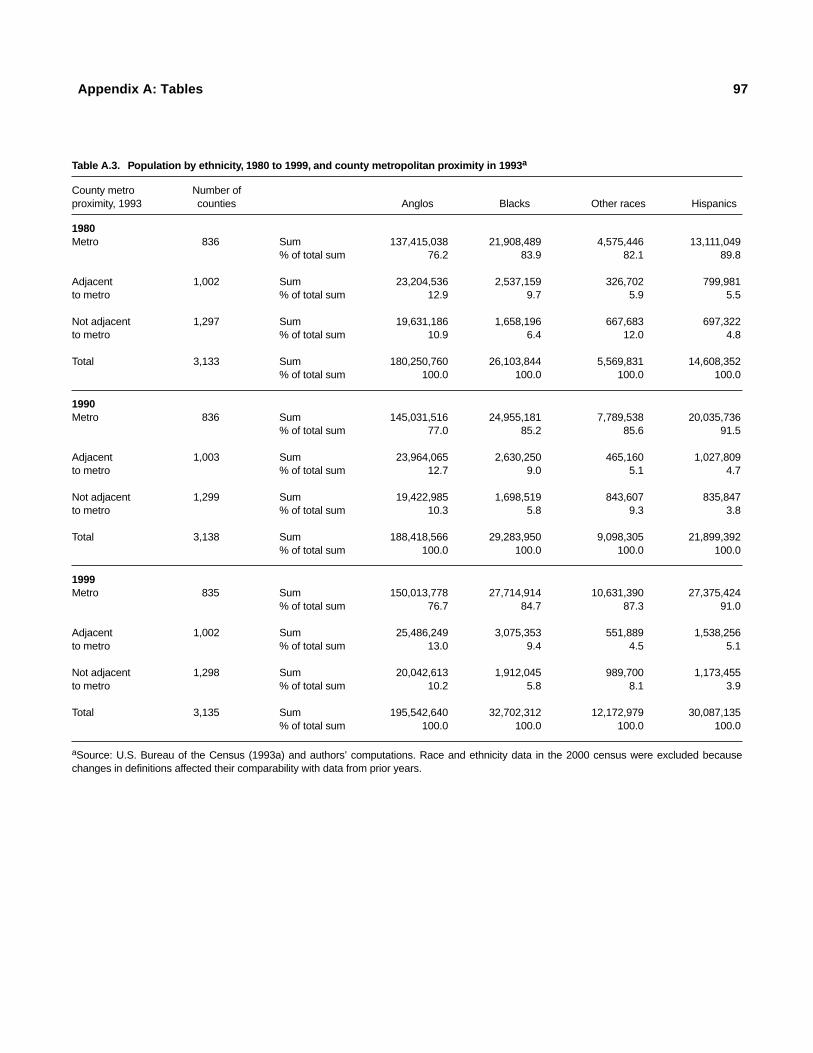
Appendix A: Tables 97
Table A.3. Population by ethnicity, 1980 to 1999, and county metropolitan proximity in 1993a
County metro Number ofproximity, 1993 counties Anglos Blacks Other races Hispanics
1980Metro 836 Sum 137,415,038 21,908,489 4,575,446 13,111,049
% of total sum 76.2 83.9 82.1 89.8
Adjacent 1,002 Sum 23,204,536 2,537,159 326,702 799,981to metro % of total sum 12.9 9.7 5.9 5.5
Not adjacent 1,297 Sum 19,631,186 1,658,196 667,683 697,322to metro % of total sum 10.9 6.4 12.0 4.8
Total 3,133 Sum 180,250,760 26,103,844 5,569,831 14,608,352% of total sum 100.0 100.0 100.0 100.0
1990Metro 836 Sum 145,031,516 24,955,181 7,789,538 20,035,736
% of total sum 77.0 85.2 85.6 91.5
Adjacent 1,003 Sum 23,964,065 2,630,250 465,160 1,027,809to metro % of total sum 12.7 9.0 5.1 4.7
Not adjacent 1,299 Sum 19,422,985 1,698,519 843,607 835,847to metro % of total sum 10.3 5.8 9.3 3.8
Total 3,138 Sum 188,418,566 29,283,950 9,098,305 21,899,392% of total sum 100.0 100.0 100.0 100.0
1999Metro 835 Sum 150,013,778 27,714,914 10,631,390 27,375,424
% of total sum 76.7 84.7 87.3 91.0
Adjacent 1,002 Sum 25,486,249 3,075,353 551,889 1,538,256to metro % of total sum 13.0 9.4 4.5 5.1
Not adjacent 1,298 Sum 20,042,613 1,912,045 989,700 1,173,455to metro % of total sum 10.2 5.8 8.1 3.9
Total 3,135 Sum 195,542,640 32,702,312 12,172,979 30,087,135% of total sum 100.0 100.0 100.0 100.0
aSource: U.S. Bureau of the Census (1993a) and authors’ computations. Race and ethnicity data in the 2000 census were excluded becausechanges in definitions affected their comparability with data from prior years.
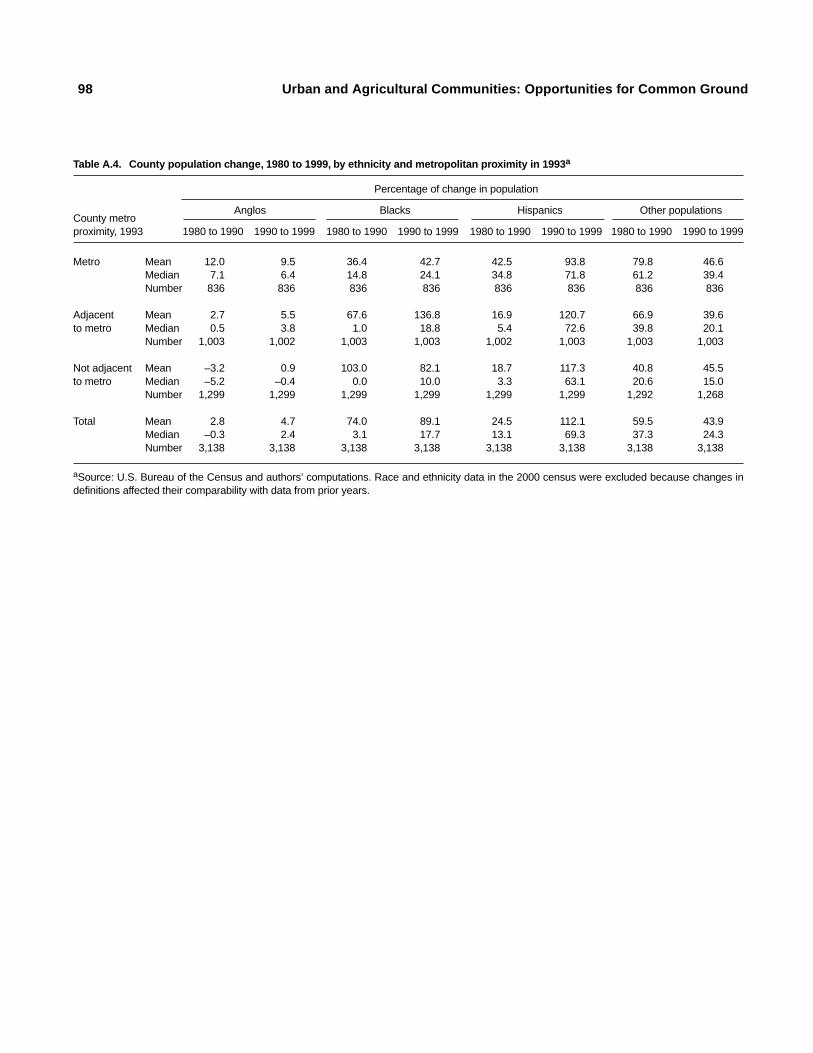
98 Urban and Agricultural Communities: Opportunities for Common Ground
Table A.4. County population change, 1980 to 1999, by ethnicity and metropolitan proximity in 1993a
Percentage of change in population
County metroAnglos Blacks Hispanics Other populations
proximity, 1993 1980 to 1990 1990 to 1999 1980 to 1990 1990 to 1999 1980 to 1990 1990 to 1999 1980 to 1990 1990 to 1999
Metro Mean 12.0 9.5 36.4 42.7 42.5 93.8 79.8 46.6Median 7.1 6.4 14.8 24.1 34.8 71.8 61.2 39.4Number 836 836 836 836 836 836 836 836
Adjacent Mean 2.7 5.5 67.6 136.8 16.9 120.7 66.9 39.6to metro Median 0.5 3.8 1.0 18.8 5.4 72.6 39.8 20.1
Number 1,003 1,002 1,003 1,003 1,002 1,003 1,003 1,003
Not adjacent Mean –3.2 0.9 103.0 82.1 18.7 117.3 40.8 45.5to metro Median –5.2 –0.4 0.0 10.0 3.3 63.1 20.6 15.0
Number 1,299 1,299 1,299 1,299 1,299 1,299 1,292 1,268
Total Mean 2.8 4.7 74.0 89.1 24.5 112.1 59.5 43.9Median –0.3 2.4 3.1 17.7 13.1 69.3 37.3 24.3Number 3,138 3,138 3,138 3,138 3,138 3,138 3,138 3,138
aSource: U.S. Bureau of the Census and authors’ computations. Race and ethnicity data in the 2000 census were excluded because changes indefinitions affected their comparability with data from prior years.
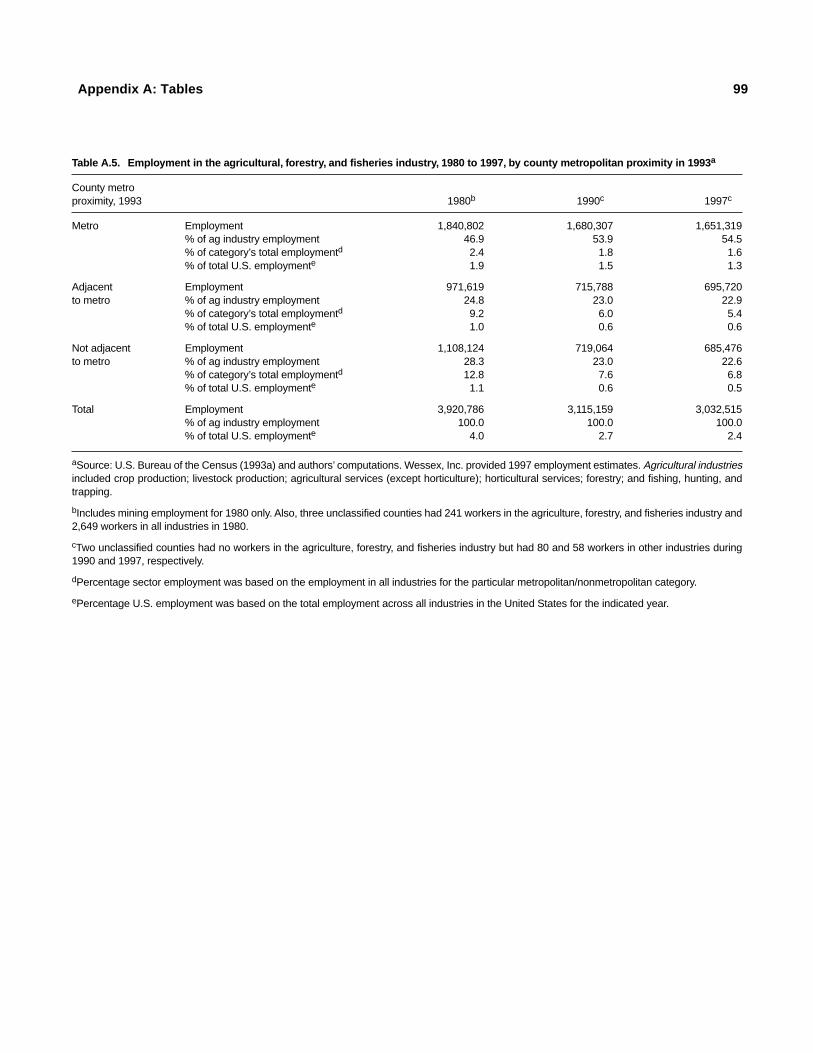
Appendix A: Tables 99
Table A.5. Employment in the agricultural, forestry, and fisheries industry, 1980 to 1997, by county metropolitan proximity in 1993a
County metroproximity, 1993 1980b 1990c 1997c
Metro Employment 1,840,802 1,680,307 1,651,319% of ag industry employment 46.9 53.9 54.5% of category’s total employmentd 2.4 1.8 1.6% of total U.S. employmente 1.9 1.5 1.3
Adjacent Employment 971,619 715,788 695,720to metro % of ag industry employment 24.8 23.0 22.9
% of category’s total employmentd 9.2 6.0 5.4% of total U.S. employmente 1.0 0.6 0.6
Not adjacent Employment 1,108,124 719,064 685,476to metro % of ag industry employment 28.3 23.0 22.6
% of category’s total employmentd 12.8 7.6 6.8% of total U.S. employmente 1.1 0.6 0.5
Total Employment 3,920,786 3,115,159 3,032,515% of ag industry employment 100.0 100.0 100.0% of total U.S. employmente 4.0 2.7 2.4
aSource: U.S. Bureau of the Census (1993a) and authors’ computations. Wessex, Inc. provided 1997 employment estimates. Agricultural industriesincluded crop production; livestock production; agricultural services (except horticulture); horticultural services; forestry; and fishing, hunting, andtrapping.
bIncludes mining employment for 1980 only. Also, three unclassified counties had 241 workers in the agriculture, forestry, and fisheries industry and2,649 workers in all industries in 1980.
cTwo unclassified counties had no workers in the agriculture, forestry, and fisheries industry but had 80 and 58 workers in other industries during1990 and 1997, respectively.
dPercentage sector employment was based on the employment in all industries for the particular metropolitan/nonmetropolitan category.
ePercentage U.S. employment was based on the total employment across all industries in the United States for the indicated year.
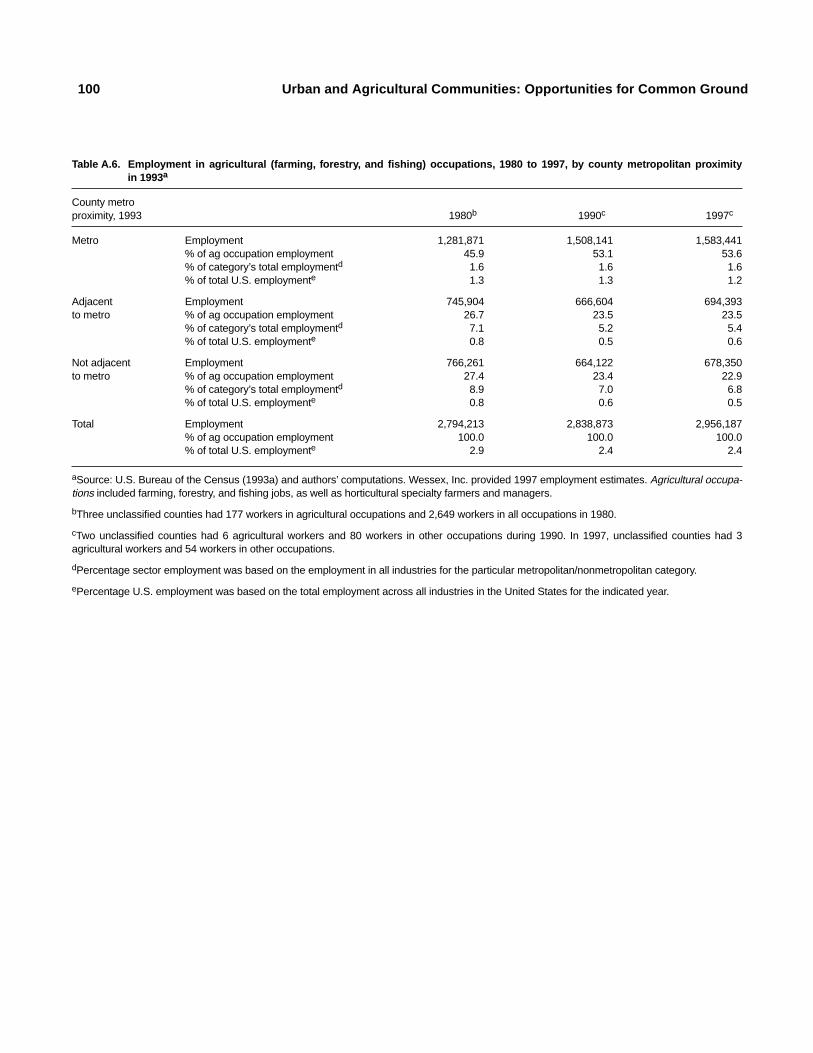
100 Urban and Agricultural Communities: Opportunities for Common Ground
Table A.6. Employment in agricultural (farming, forestry, and fishing) occupations, 1980 to 1997, by county metropolitan proximityin 1993a
County metroproximity, 1993 1980b 1990c 1997c
Metro Employment 1,281,871 1,508,141 1,583,441% of ag occupation employment 45.9 53.1 53.6% of category’s total employmentd 1.6 1.6 1.6% of total U.S. employmente 1.3 1.3 1.2
Adjacent Employment 745,904 666,604 694,393to metro % of ag occupation employment 26.7 23.5 23.5
% of category’s total employmentd 7.1 5.2 5.4% of total U.S. employmente 0.8 0.5 0.6
Not adjacent Employment 766,261 664,122 678,350to metro % of ag occupation employment 27.4 23.4 22.9
% of category’s total employmentd 8.9 7.0 6.8% of total U.S. employmente 0.8 0.6 0.5
Total Employment 2,794,213 2,838,873 2,956,187% of ag occupation employment 100.0 100.0 100.0% of total U.S. employmente 2.9 2.4 2.4
aSource: U.S. Bureau of the Census (1993a) and authors’ computations. Wessex, Inc. provided 1997 employment estimates. Agricultural occupa-tions included farming, forestry, and fishing jobs, as well as horticultural specialty farmers and managers.
bThree unclassified counties had 177 workers in agricultural occupations and 2,649 workers in all occupations in 1980.
cTwo unclassified counties had 6 agricultural workers and 80 workers in other occupations during 1990. In 1997, unclassified counties had 3agricultural workers and 54 workers in other occupations.
dPercentage sector employment was based on the employment in all industries for the particular metropolitan/nonmetropolitan category.
ePercentage U.S. employment was based on the total employment across all industries in the United States for the indicated year.
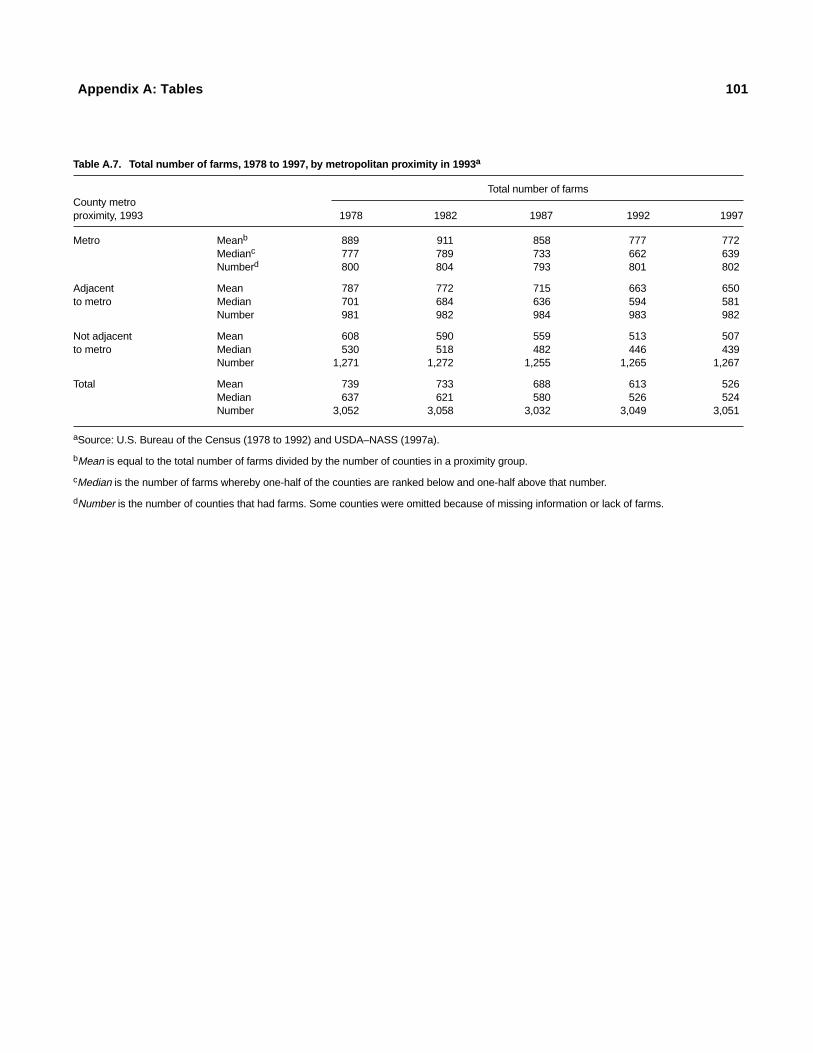
Appendix A: Tables 101
Table A.7. Total number of farms, 1978 to 1997, by metropolitan proximity in 1993a
Total number of farmsCounty metroproximity, 1993 1978 1982 1987 1992 1997
Metro Meanb 889 911 858 777 772Medianc 777 789 733 662 639Numberd 800 804 793 801 802
Adjacent Mean 787 772 715 663 650to metro Median 701 684 636 594 581
Number 981 982 984 983 982
Not adjacent Mean 608 590 559 513 507to metro Median 530 518 482 446 439
Number 1,271 1,272 1,255 1,265 1,267
Total Mean 739 733 688 613 526Median 637 621 580 526 524Number 3,052 3,058 3,032 3,049 3,051
aSource: U.S. Bureau of the Census (1978 to 1992) and USDA–NASS (1997a).
bMean is equal to the total number of farms divided by the number of counties in a proximity group.
cMedian is the number of farms whereby one-half of the counties are ranked below and one-half above that number.
dNumber is the number of counties that had farms. Some counties were omitted because of missing information or lack of farms.
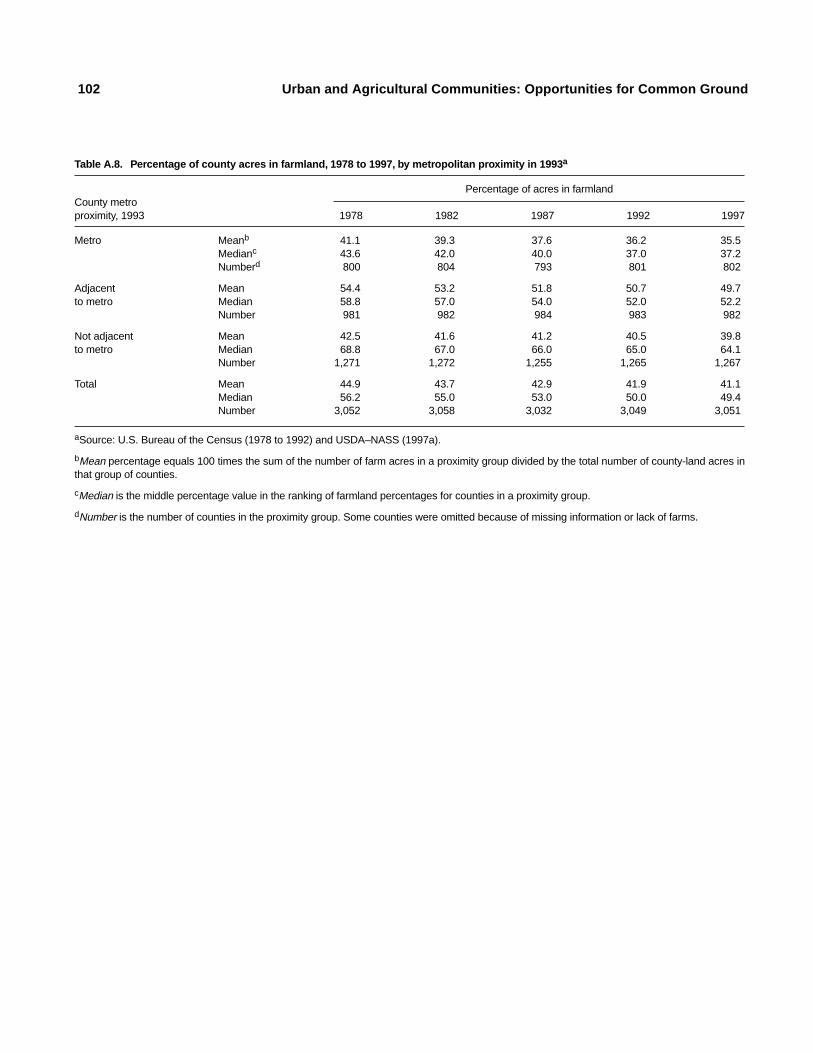
102 Urban and Agricultural Communities: Opportunities for Common Ground
Table A.8. Percentage of county acres in farmland, 1978 to 1997, by metropolitan proximity in 1993a
Percentage of acres in farmlandCounty metroproximity, 1993 1978 1982 1987 1992 1997
Metro Meanb 41.1 39.3 37.6 36.2 35.5Medianc 43.6 42.0 40.0 37.0 37.2Numberd 800 804 793 801 802
Adjacent Mean 54.4 53.2 51.8 50.7 49.7to metro Median 58.8 57.0 54.0 52.0 52.2
Number 981 982 984 983 982
Not adjacent Mean 42.5 41.6 41.2 40.5 39.8to metro Median 68.8 67.0 66.0 65.0 64.1
Number 1,271 1,272 1,255 1,265 1,267
Total Mean 44.9 43.7 42.9 41.9 41.1Median 56.2 55.0 53.0 50.0 49.4Number 3,052 3,058 3,032 3,049 3,051
aSource: U.S. Bureau of the Census (1978 to 1992) and USDA–NASS (1997a).
bMean percentage equals 100 times the sum of the number of farm acres in a proximity group divided by the total number of county-land acres inthat group of counties.
cMedian is the middle percentage value in the ranking of farmland percentages for counties in a proximity group.
dNumber is the number of counties in the proximity group. Some counties were omitted because of missing information or lack of farms.
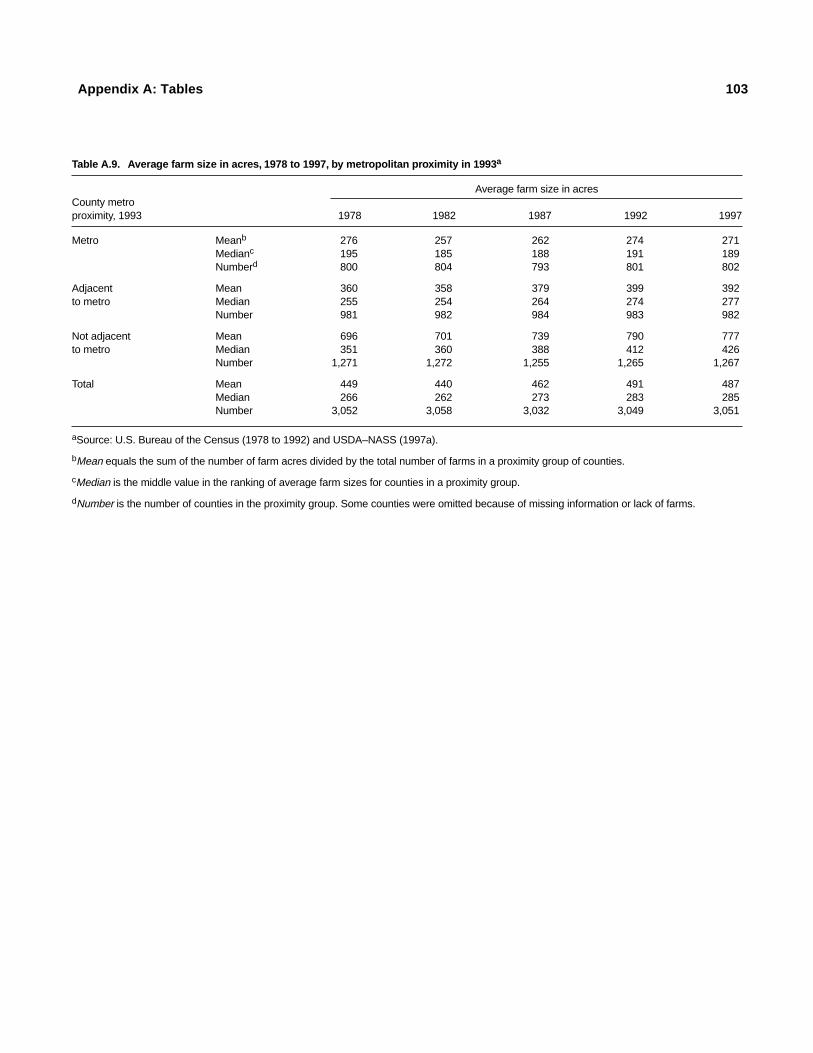
Appendix A: Tables 103
Table A.9. Average farm size in acres, 1978 to 1997, by metropolitan proximity in 1993a
Average farm size in acresCounty metroproximity, 1993 1978 1982 1987 1992 1997
Metro Meanb 276 257 262 274 271Medianc 195 185 188 191 189Numberd 800 804 793 801 802
Adjacent Mean 360 358 379 399 392to metro Median 255 254 264 274 277
Number 981 982 984 983 982
Not adjacent Mean 696 701 739 790 777to metro Median 351 360 388 412 426
Number 1,271 1,272 1,255 1,265 1,267
Total Mean 449 440 462 491 487Median 266 262 273 283 285Number 3,052 3,058 3,032 3,049 3,051
aSource: U.S. Bureau of the Census (1978 to 1992) and USDA–NASS (1997a).
bMean equals the sum of the number of farm acres divided by the total number of farms in a proximity group of counties.
cMedian is the middle value in the ranking of average farm sizes for counties in a proximity group.
dNumber is the number of counties in the proximity group. Some counties were omitted because of missing information or lack of farms.
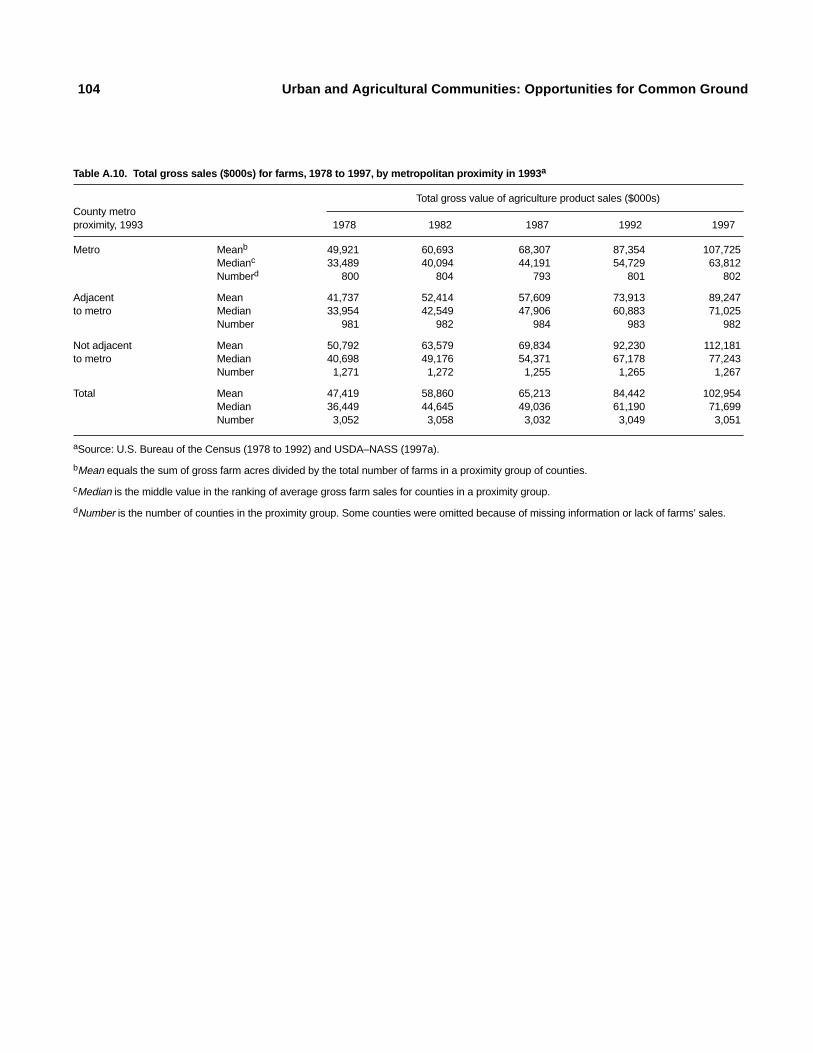
104 Urban and Agricultural Communities: Opportunities for Common Ground
Table A.10. Total gross sales ($000s) for farms, 1978 to 1997, by metropolitan proximity in 1993a
Total gross value of agriculture product sales ($000s)County metroproximity, 1993 1978 1982 1987 1992 1997
Metro Meanb 49,921 60,693 68,307 87,354 107,725Medianc 33,489 40,094 44,191 54,729 63,812Numberd 800 804 793 801 802
Adjacent Mean 41,737 52,414 57,609 73,913 89,247to metro Median 33,954 42,549 47,906 60,883 71,025
Number 981 982 984 983 982
Not adjacent Mean 50,792 63,579 69,834 92,230 112,181to metro Median 40,698 49,176 54,371 67,178 77,243
Number 1,271 1,272 1,255 1,265 1,267
Total Mean 47,419 58,860 65,213 84,442 102,954Median 36,449 44,645 49,036 61,190 71,699Number 3,052 3,058 3,032 3,049 3,051
aSource: U.S. Bureau of the Census (1978 to 1992) and USDA–NASS (1997a).
bMean equals the sum of gross farm acres divided by the total number of farms in a proximity group of counties.
cMedian is the middle value in the ranking of average gross farm sales for counties in a proximity group.
dNumber is the number of counties in the proximity group. Some counties were omitted because of missing information or lack of farms’ sales.
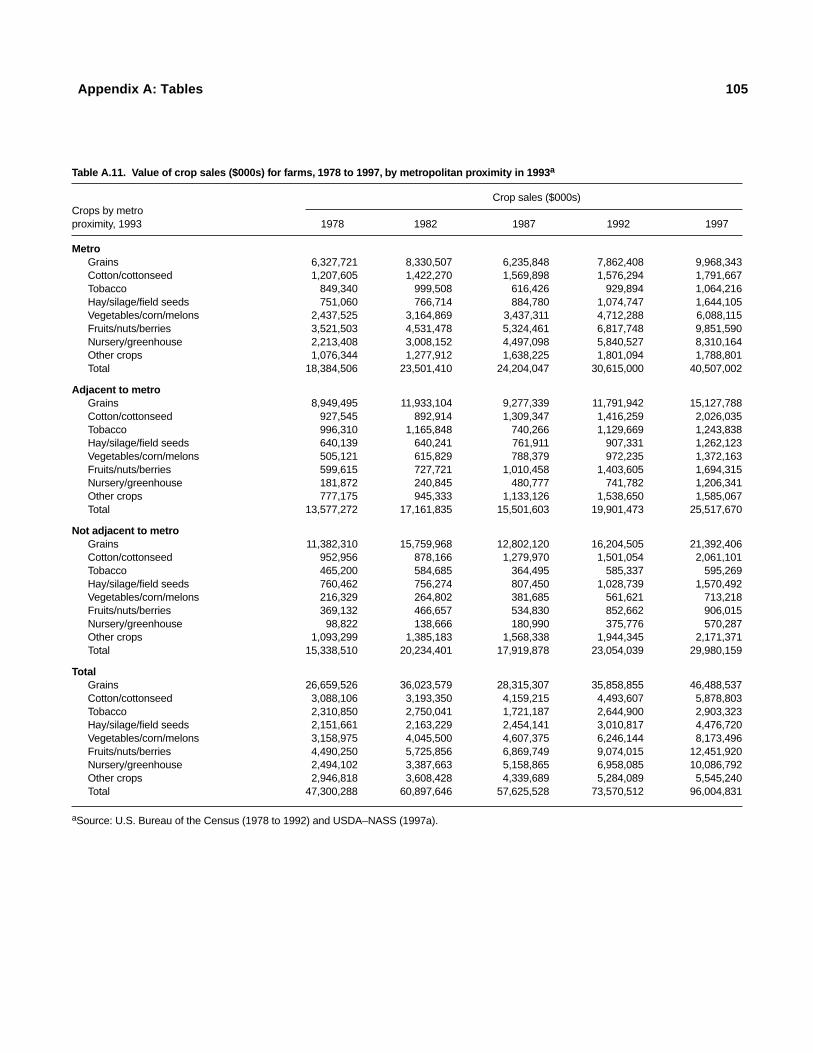
Appendix A: Tables 105
Table A.11. Value of crop sales ($000s) for farms, 1978 to 1997, by metropolitan proximity in 1993a
Crop sales ($000s)Crops by metroproximity, 1993 1978 1982 1987 1992 1997
MetroGrains 6,327,721 8,330,507 6,235,848 7,862,408 9,968,343Cotton/cottonseed 1,207,605 1,422,270 1,569,898 1,576,294 1,791,667Tobacco 849,340 999,508 616,426 929,894 1,064,216Hay/silage/field seeds 751,060 766,714 884,780 1,074,747 1,644,105Vegetables/corn/melons 2,437,525 3,164,869 3,437,311 4,712,288 6,088,115Fruits/nuts/berries 3,521,503 4,531,478 5,324,461 6,817,748 9,851,590Nursery/greenhouse 2,213,408 3,008,152 4,497,098 5,840,527 8,310,164Other crops 1,076,344 1,277,912 1,638,225 1,801,094 1,788,801Total 18,384,506 23,501,410 24,204,047 30,615,000 40,507,002
Adjacent to metroGrains 8,949,495 11,933,104 9,277,339 11,791,942 15,127,788Cotton/cottonseed 927,545 892,914 1,309,347 1,416,259 2,026,035Tobacco 996,310 1,165,848 740,266 1,129,669 1,243,838Hay/silage/field seeds 640,139 640,241 761,911 907,331 1,262,123Vegetables/corn/melons 505,121 615,829 788,379 972,235 1,372,163Fruits/nuts/berries 599,615 727,721 1,010,458 1,403,605 1,694,315Nursery/greenhouse 181,872 240,845 480,777 741,782 1,206,341Other crops 777,175 945,333 1,133,126 1,538,650 1,585,067Total 13,577,272 17,161,835 15,501,603 19,901,473 25,517,670
Not adjacent to metroGrains 11,382,310 15,759,968 12,802,120 16,204,505 21,392,406Cotton/cottonseed 952,956 878,166 1,279,970 1,501,054 2,061,101Tobacco 465,200 584,685 364,495 585,337 595,269Hay/silage/field seeds 760,462 756,274 807,450 1,028,739 1,570,492Vegetables/corn/melons 216,329 264,802 381,685 561,621 713,218Fruits/nuts/berries 369,132 466,657 534,830 852,662 906,015Nursery/greenhouse 98,822 138,666 180,990 375,776 570,287Other crops 1,093,299 1,385,183 1,568,338 1,944,345 2,171,371Total 15,338,510 20,234,401 17,919,878 23,054,039 29,980,159
TotalGrains 26,659,526 36,023,579 28,315,307 35,858,855 46,488,537Cotton/cottonseed 3,088,106 3,193,350 4,159,215 4,493,607 5,878,803Tobacco 2,310,850 2,750,041 1,721,187 2,644,900 2,903,323Hay/silage/field seeds 2,151,661 2,163,229 2,454,141 3,010,817 4,476,720Vegetables/corn/melons 3,158,975 4,045,500 4,607,375 6,246,144 8,173,496Fruits/nuts/berries 4,490,250 5,725,856 6,869,749 9,074,015 12,451,920Nursery/greenhouse 2,494,102 3,387,663 5,158,865 6,958,085 10,086,792Other crops 2,946,818 3,608,428 4,339,689 5,284,089 5,545,240Total 47,300,288 60,897,646 57,625,528 73,570,512 96,004,831
aSource: U.S. Bureau of the Census (1978 to 1992) and USDA–NASS (1997a).
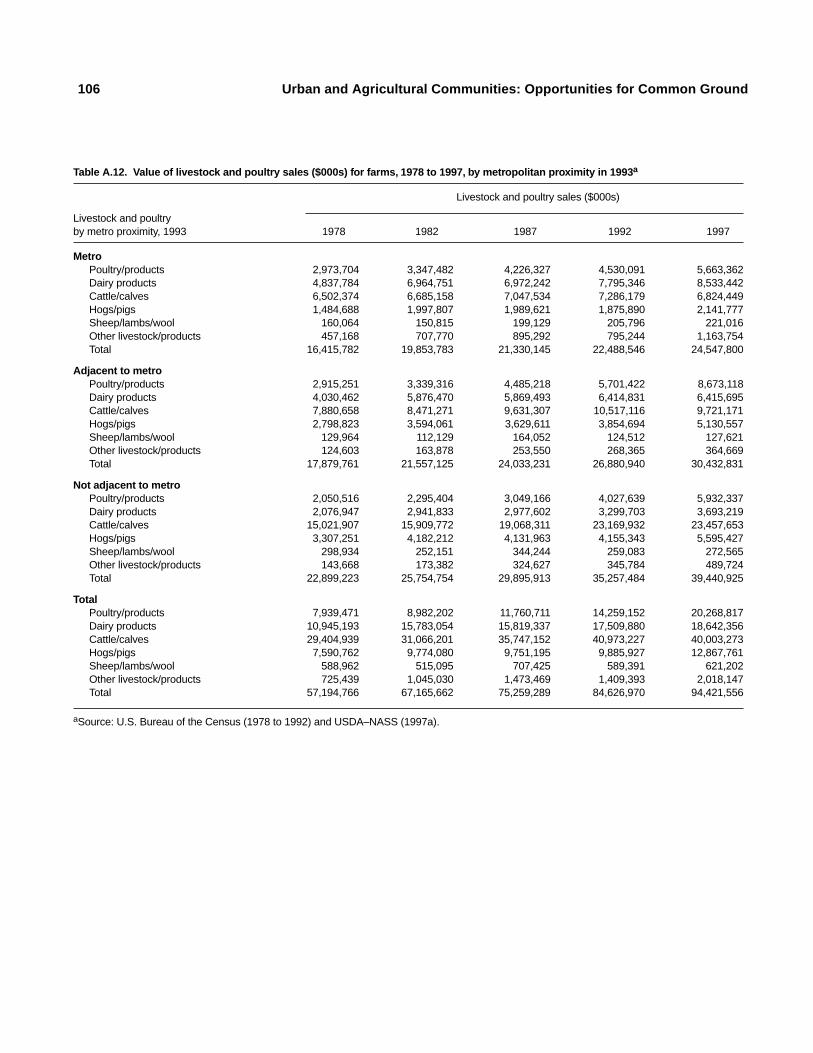
106 Urban and Agricultural Communities: Opportunities for Common Ground
Table A.12. Value of livestock and poultry sales ($000s) for farms, 1978 to 1997, by metropolitan proximity in 1993a
Livestock and poultry sales ($000s)
Livestock and poultryby metro proximity, 1993 1978 1982 1987 1992 1997
MetroPoultry/products 2,973,704 3,347,482 4,226,327 4,530,091 5,663,362Dairy products 4,837,784 6,964,751 6,972,242 7,795,346 8,533,442Cattle/calves 6,502,374 6,685,158 7,047,534 7,286,179 6,824,449Hogs/pigs 1,484,688 1,997,807 1,989,621 1,875,890 2,141,777Sheep/lambs/wool 160,064 150,815 199,129 205,796 221,016Other livestock/products 457,168 707,770 895,292 795,244 1,163,754Total 16,415,782 19,853,783 21,330,145 22,488,546 24,547,800
Adjacent to metroPoultry/products 2,915,251 3,339,316 4,485,218 5,701,422 8,673,118Dairy products 4,030,462 5,876,470 5,869,493 6,414,831 6,415,695Cattle/calves 7,880,658 8,471,271 9,631,307 10,517,116 9,721,171Hogs/pigs 2,798,823 3,594,061 3,629,611 3,854,694 5,130,557Sheep/lambs/wool 129,964 112,129 164,052 124,512 127,621Other livestock/products 124,603 163,878 253,550 268,365 364,669Total 17,879,761 21,557,125 24,033,231 26,880,940 30,432,831
Not adjacent to metroPoultry/products 2,050,516 2,295,404 3,049,166 4,027,639 5,932,337Dairy products 2,076,947 2,941,833 2,977,602 3,299,703 3,693,219Cattle/calves 15,021,907 15,909,772 19,068,311 23,169,932 23,457,653Hogs/pigs 3,307,251 4,182,212 4,131,963 4,155,343 5,595,427Sheep/lambs/wool 298,934 252,151 344,244 259,083 272,565Other livestock/products 143,668 173,382 324,627 345,784 489,724Total 22,899,223 25,754,754 29,895,913 35,257,484 39,440,925
TotalPoultry/products 7,939,471 8,982,202 11,760,711 14,259,152 20,268,817Dairy products 10,945,193 15,783,054 15,819,337 17,509,880 18,642,356Cattle/calves 29,404,939 31,066,201 35,747,152 40,973,227 40,003,273Hogs/pigs 7,590,762 9,774,080 9,751,195 9,885,927 12,867,761Sheep/lambs/wool 588,962 515,095 707,425 589,391 621,202Other livestock/products 725,439 1,045,030 1,473,469 1,409,393 2,018,147Total 57,194,766 67,165,662 75,259,289 84,626,970 94,421,556
aSource: U.S. Bureau of the Census (1978 to 1992) and USDA–NASS (1997a).
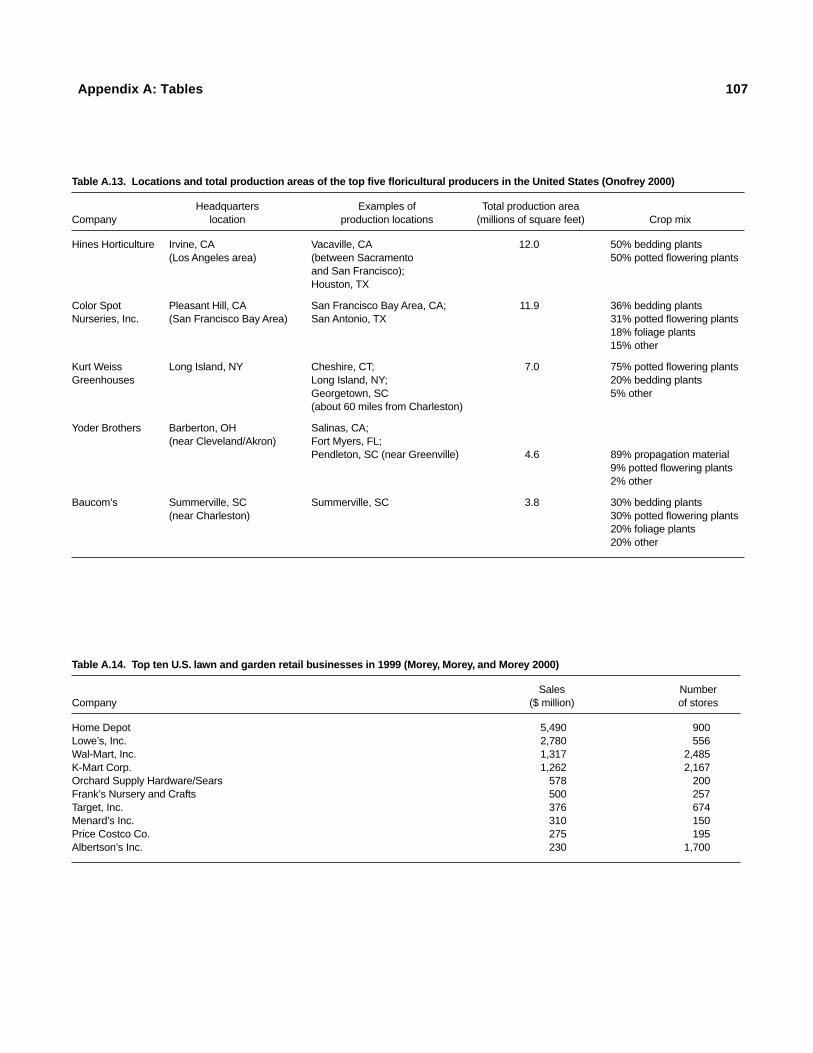
Appendix A: Tables 107
Table A.13. Locations and total production areas of the top five floricultural producers in the United States (Onofrey 2000)
Headquarters Examples of Total production areaCompany location production locations (millions of square feet) Crop mix
Hines Horticulture Irvine, CA Vacaville, CA 12.0 50% bedding plants(Los Angeles area) (between Sacramento 50% potted flowering plants
and San Francisco);Houston, TX
Color Spot Pleasant Hill, CA San Francisco Bay Area, CA; 11.9 36% bedding plantsNurseries, Inc. (San Francisco Bay Area) San Antonio, TX 31% potted flowering plants
18% foliage plants15% other
Kurt Weiss Long Island, NY Cheshire, CT; 7.0 75% potted flowering plantsGreenhouses Long Island, NY; 20% bedding plants
Georgetown, SC 5% other(about 60 miles from Charleston)
Yoder Brothers Barberton, OH Salinas, CA;(near Cleveland/Akron) Fort Myers, FL;
Pendleton, SC (near Greenville) 4.6 89% propagation material9% potted flowering plants2% other
Baucom’s Summerville, SC Summerville, SC 3.8 30% bedding plants(near Charleston) 30% potted flowering plants
20% foliage plants20% other
Table A.14. Top ten U.S. lawn and garden retail businesses in 1999 (Morey, Morey, and Morey 2000)
Sales NumberCompany ($ million) of stores
Home Depot 5,490 900Lowe’s, Inc. 2,780 556Wal-Mart, Inc. 1,317 2,485K-Mart Corp. 1,262 2,167Orchard Supply Hardware/Sears 578 200Frank’s Nursery and Crafts 500 257Target, Inc. 376 674Menard’s Inc. 310 150Price Costco Co. 275 195Albertson’s Inc. 230 1,700
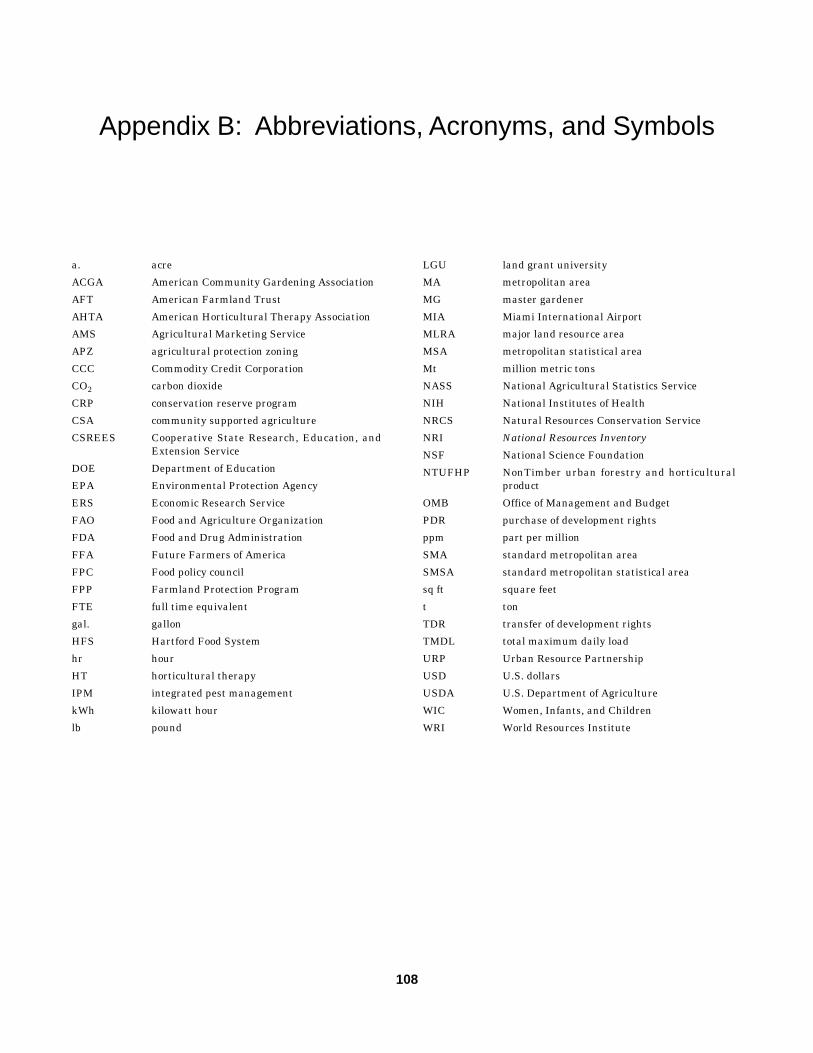
108
Appendix B: Abbreviations, Acronyms, and Symbols
a. acre
ACGA American Community Gardening Association
AFT American Farmland Trust
AHTA American Horticultural Therapy Association
AMS Agricultural Marketing Service
APZ agricultural protection zoning
CCC Commodity Credit Corporation
CO2 carbon dioxide
CRP conservation reserve program
CSA community supported agriculture
CSREES Cooperative State Research, Education, andExtension Service
DOE Department of Education
EPA Environmental Protection Agency
ERS Economic Research Service
FAO Food and Agriculture Organization
FDA Food and Drug Administration
FFA Future Farmers of America
FPC Food policy council
FPP Farmland Protection Program
FTE full time equivalent
gal. gallon
HFS Hartford Food System
hr hour
HT horticultural therapy
IPM integrated pest management
kWh kilowatt hour
lb pound
LGU land grant university
MA metropolitan area
MG master gardener
MIA Miami International Airport
MLRA major land resource area
MSA metropolitan statistical area
Mt million metric tons
NASS National Agricultural Statistics Service
NIH National Institutes of Health
NRCS Natural Resources Conservation Service
NRI National Resources Inventory
NSF National Science Foundation
NTUFHP NonTimber urban forestry and horticulturalproduct
OMB Office of Management and Budget
PDR purchase of development rights
ppm part per million
SMA standard metropolitan area
SMSA standard metropolitan statistical area
sq ft square feet
t ton
TDR transfer of development rights
TMDL total maximum daily load
URP Urban Resource Partnership
USD U.S. dollars
USDA U.S. Department of Agriculture
WIC Women, Infants, and Children
WRI World Resources Institute
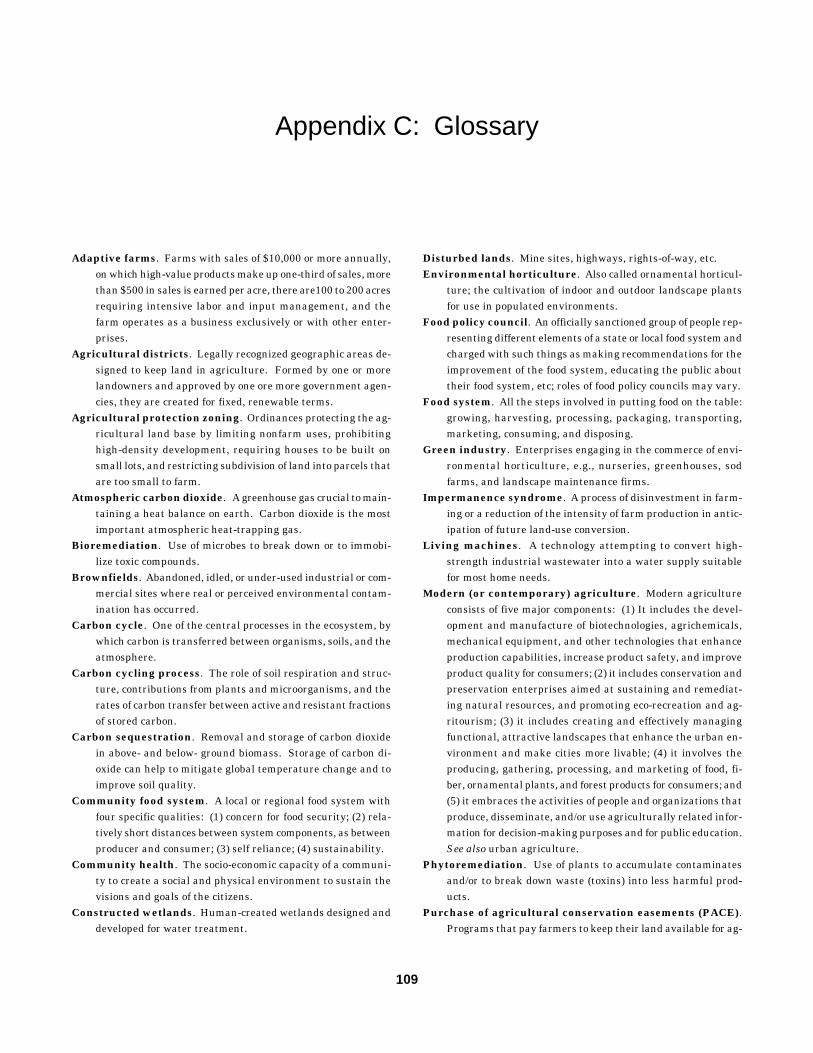
Appendix C: Glossary 109
109
Appendix C: Glossary
Adaptive farms. Farms with sales of $10,000 or more annually,on which high-value products make up one-third of sales, morethan $500 in sales is earned per acre, there are100 to 200 acresrequiring intensive labor and input management, and thefarm operates as a business exclusively or with other enter-prises.
Agricultural districts. Legally recognized geographic areas de-signed to keep land in agriculture. Formed by one or morelandowners and approved by one ore more government agen-cies, they are created for fixed, renewable terms.
Agricultural protection zoning. Ordinances protecting the ag-ricultural land base by limiting nonfarm uses, prohibitinghigh-density development, requiring houses to be built onsmall lots, and restricting subdivision of land into parcels thatare too small to farm.
Atmospheric carbon dioxide. A greenhouse gas crucial to main-taining a heat balance on earth. Carbon dioxide is the mostimportant atmospheric heat-trapping gas.
Bioremediation. Use of microbes to break down or to immobi-lize toxic compounds.
Brownfields. Abandoned, idled, or under-used industrial or com-mercial sites where real or perceived environmental contam-ination has occurred.
Carbon cycle. One of the central processes in the ecosystem, bywhich carbon is transferred between organisms, soils, and theatmosphere.
Carbon cycling process. The role of soil respiration and struc-ture, contributions from plants and microorganisms, and therates of carbon transfer between active and resistant fractionsof stored carbon.
Carbon sequestration. Removal and storage of carbon dioxidein above- and below- ground biomass. Storage of carbon di-oxide can help to mitigate global temperature change and toimprove soil quality.
Community food system. A local or regional food system withfour specific qualities: (1) concern for food security; (2) rela-tively short distances between system components, as betweenproducer and consumer; (3) self reliance; (4) sustainability.
Community health. The socio-economic capacity of a communi-ty to create a social and physical environment to sustain thevisions and goals of the citizens.
Constructed wetlands. Human-created wetlands designed anddeveloped for water treatment.
Disturbed lands. Mine sites, highways, rights-of-way, etc.Environmental horticulture. Also called ornamental horticul-
ture; the cultivation of indoor and outdoor landscape plantsfor use in populated environments.
Food policy council. An officially sanctioned group of people rep-resenting different elements of a state or local food system andcharged with such things as making recommendations for theimprovement of the food system, educating the public abouttheir food system, etc; roles of food policy councils may vary.
Food system. All the steps involved in putting food on the table:growing, harvesting, processing, packaging, transporting,marketing, consuming, and disposing.
Green industry. Enterprises engaging in the commerce of envi-ronmental horticulture, e.g., nurseries, greenhouses, sodfarms, and landscape maintenance firms.
Impermanence syndrome. A process of disinvestment in farm-ing or a reduction of the intensity of farm production in antic-ipation of future land-use conversion.
Living machines. A technology attempting to convert high-strength industrial wastewater into a water supply suitablefor most home needs.
Modern (or contemporary) agriculture. Modern agricultureconsists of five major components: (1) It includes the devel-opment and manufacture of biotechnologies, agrichemicals,mechanical equipment, and other technologies that enhanceproduction capabilities, increase product safety, and improveproduct quality for consumers; (2) it includes conservation andpreservation enterprises aimed at sustaining and remediat-ing natural resources, and promoting eco-recreation and ag-ritourism; (3) it includes creating and effectively managingfunctional, attractive landscapes that enhance the urban en-vironment and make cities more livable; (4) it involves theproducing, gathering, processing, and marketing of food, fi-ber, ornamental plants, and forest products for consumers; and(5) it embraces the activities of people and organizations thatproduce, disseminate, and/or use agriculturally related infor-mation for decision-making purposes and for public education.See also urban agriculture.
Phytoremediation. Use of plants to accumulate contaminatesand/or to break down waste (toxins) into less harmful prod-ucts.
Purchase of agricultural conservation easements (PACE).Programs that pay farmers to keep their land available for ag-
110 Urban and Agricultural Communities: Opportunities for Common Ground
riculture. Landowners sell an agricultural conservation ease-ment to a qualified public agency or private conservation or-ganization. See also purchase of development rights (PDR).
Purchase of development rights (PDR). A community growthmanagement strategy intended to provide increased protec-tion for farmland, forest, and natural areas by removing de-velopment potential from land areas placed in a protected sta-tus. See also purchase of agricultural conservations easements(PACE).
Recreational farms. Farms with sales of less than $10,000 an-nually, having less than 100 acres, and requiring little dailymanagement.
Right-to-farm laws. Laws protecting farmers and farm opera-tions from both public and private nuisance lawsuits. A pri-vate nuisance interferes with an individual's use and enjoy-ment of his or her property. A public nuisance involves actionsthat injure the public at large.
Rural-urban agroecosystem. A biological and natural resourc-es system managed jointly by rural and urban people (1) toprovide services to the environment and community, (2) to gen-erate direct and indirect business (including food productionand marketing) and health benefits for society as a whole, and(3) to contribute recreation and leisure outlets for an urban-izing society (See Figures 1.1 and 1.3 in Chapter 1.)
Self-sufficiency index. Percentage of total program expenses cov-ered by sales.
Smart growth strategies. Strategies used by planners to influ-ence the pattern and density of human population develop-ment.
Sprawl. Inflation that occurs over time in the amount of land areaconsumed per unit of human activity, and the degree of dis-persal between land areas; the unavoidable consequence ofsociety's use of automobiles. Anthony Downs, policy analyst,identified the following ten traits of sprawl: unlimited outwardexpansion; low-density residential and commercial settle-ments; leapfrog development; fragmentation of powers overland use among many small localities; dominance of transpor-tation by private vehicles; no planning or control of land uses;
widespread strip commercial development; great fiscal dispar-ities among localities; segregation of types of land uses in dif-ferent zones; and reliance on trickle-down to provide housingto low-income households. (Sprawl Guide, http://www.plannersweb.com/sprawl/define.html [28 April 2001])
Traditional farms. Farms with sales of more than $10,000 an-nually, high-value products making up one-third or less ofsales with $500 or less sales/acres, or conventional livestockand/or crops that make up more than one-third of sales, morethan 200 acres (the largest of the three types of farms), littleoff-farm employment, and extensive management rather thanintensive management.
Traffic calming. A technique by which landscaped circles andspeed control mechanisms slow traffic and reclaim streets forpedestrians and neighborhoods.
Transfer of development rights (TDR). A program allowinglandowners to transfer the right to develop one parcel of landto a different parcel of land to prevent farmland conversion.TDR programs establish "sending areas" where land is to beprotected by agricultural conservation easements and "receiv-ing areas" where land may be developed at a higher densitythan otherwise would be allowed by local zoning.
Urban agriculture. A complex system encompassing a full spec-trum of activities from a traditional core of production, pro-cessing, marketing, distribution and consumption, to moreextensive system components including recreation and leisure,business entrepreneurship, individual health benefits, scenicbeautification, environmental restoration and remediation,community health and well-being services, and economic vi-tality. See also modern (or contemporary) agriculture.
Urban-influenced. Areas within statistical metropolitan coun-ties or adjacent counties.
Water re-use. Reclamation, or “gray,” water from waste treatmentfacilities that is used to sustain recreational areas and irri-gation of nonfood crops.
Zoning law. Division of land within a jurisdictional area into variousdistricts so that land is used for consistent, compatible purposes.
Literature Cited 111
111
Literature Cited
Abel, J., J. Thomson, and A. Maretzki. 1999. Extension’s role withfarmers’ markets: Working with farmers, consumers, and com-munities. J Extension 35. <http://joe.org/joe/1999october/a4.html> (19 February 2002)
Albrecht, D. E. and S. H. Murdock. 1990. The Sociology of U.S.Agriculture: An Ecological Perspective. Iowa State UniversityPress, Ames.
American Farmland Trust (AFT). 1999. Fact sheet. The farm-land protection toolbox, <www.farmland.org> (12 April 2002)
American Farmland Trust (AFT). 2001a. Farmland informationcenter fact sheet, <http://www.farmlandinfo.org> (5 March2002)
American Farmland Trust (AFT). 2001b. Protecting our mostvaluable resources. The results of a national public opinion poll,10 October, <http://www.farmland.org/news_2001/101001_il.htm> (25 April 2002)
American Farmland Trust (AFT). 2001c. State farmland protec-tion statuses by category, 6 June, <http://www.farmlandinfo.org/fic/laws/fpkeytab.html> (13 February 2002)
The American Horse Council Foundation. 1996. The economicimpact of the horse industry in the United States. The Ameri-can Horse Council Foundation, Washington D.C.
The American Horticultural Therapy Association (AHTA). 2001.Homepage, <http://www.ahta.org> (31 December 2001)
American Nursery and Landscape Association (ANLA). 2001.About the industry, <http://www.anla.org/industry/index.htm>(31 December 2001)
American Nurseryman. 1997. $1.48 billion spent annually on res-idential tree care. Am Nurseryman 186:20.
Ames, R. G. 1980. The sociology of urban tree planting. J Arbori-cult 6:120–123.
Audubon International. 2001. Audubon cooperative sanctuaryprogram for golf courses, <http://www.usga.org/green/environ-ment/audubon_program.html> (31 December 2001)
Ayres, A. (ed.). 1992. The Wit and Wisdom of Abraham Lincoln.Penguin Books, New York.
Azuma, A. and A. Fisher. 2001. Healthy farms, healthy kids:Evaluating the barriers and opportunities for farm to schoolprograms. Community Food Security Coalition, Los Angeles,California
Bachman, S. S. 2002. Pawprints and purrs, <http://www.sniksnak.com/didyou.html> (3 January 2002)
Bastian, R. K. and D. Hammer. 1993. The use of constructed wet-lands for wastewater treatment and recycling. P. 59. In G. A.Moshiri (ed.). Constructed Wetlands for Water Quality Improve-ment. Lewis Publishers, CRC Press, Boca Raton, Florida.
Bat Conservation International (BCI). 2001. Homepage, Decem-ber 4, <http://www.batcon.org> (31 December 2001)
Baun, M. M., K. Oetting, and N. Bergstrom. 1991. Health bene-fits of companion animals in relation to the physiologic indicesof relaxation. Holistic Nurs Prac 5:16–23.
Beard, J. B. and R. L. Green. 1994. The role of turfgrasses in en-
vironmental protection and their benefits to humans. J Envi-ron Qual 23:452–460.
Bender, L. D., B. L. Green, T. F. Hady, J. A. Kuehn, M. K. Nelson,L. B. Perkinson, and P. J. Ross. 1985. The diverse social andeconomic structure of nonmetropolitan America. Rural Devel-opment Research Report Number 49. U.S. Government Print-ing Office, Washington, D.C.
Berka, C., D. McCallam, and B. Wernick. 1995. Land use impactson water quality: Case studies in three watersheds. Paper pre-sented at The Lower Fraser Basin in Transition: A Symposiumand Workshop, May 4, 1995, Kwantlen University College,Surrey, British Columbia. <http://www.ire.ubc.ca/ecoresearch/publica3.html> (20 March 2002)
Berry, D. 1978. Effects of urbanization on agricultural activities.Growth Change 9:2–8.
Black, H. 1999. Phytoremediation: A growing field with someconcerns, March 1, <http://www.the-scientist.com> (31 Decem-ber 2001)
Blair, D., C. C. Giesecke, and S. Sherman. 1991. A dietary, social,and economic evaluation of the Philadelphia urban gardeningproject. J Nutr Ed 23:161–167.
Bowie, P. and G. Mountain. 1997. The relationship between pa-tient behaviour and environmental quality for the demented.Intl J Geriat Psychiatry 12:718–723.
Boyer, E. 1990. Scholarship Reconsidered: Priorities of theProfessorate. The Carnegie Foundation for the Advance-ment of Teaching. Jossey-Bass Publishers, San Francisco,California.
Bradley, G. 1995. Urban Forest Landscapes: Integrating Multi-disciplinary Perspectives. University of Washington Press,Seattle.
Brasher, P. 2000. “USDA adopts rules for organic foods.” TheColumbus Dispatch, December 21.
Brogan, D. R. and J. L. Douglas. 1980. Physical environment cor-relates of psychosocial health among urban residents. Am JCommun Psychol 8:507–522.
Browne, C. A. 1992. The role of nature for the promotion of well-being of the elderly. In D. Relf (ed.). The Role of Horticulturein Human Well-Being and Social Development: A NationalSymposium. Timber Press, Portland, Oregon.
Bruhn, S. 1999. Texas greenhouse becomes popular tourist attrac-tion. GrowerTalks 62:28–32.
Buettner, L. 1995. Therapeutic recreation as an intervention foragitation in persons with dementia: A case study of Mrs. M.Therapeut Recreat J 29:63–69.
Bullock, S., S. Bell, T. Jenkins, C. Bullock, J. Hey, P. Bennett, J.Ripley, N. Planck, and J. Smye. 2000. The economic benefitsof farmers’ markets. Friends of the Earth Trust, London. 32pp.
Butler, M. A. and C. L. Beale. 1994. Rural-Urban ContinuumCodes for metro and nonmetro counties, 1993. Staff ReportNumber AGES 9425. Agricultural and Rural Economy Divi-
112 Urban and Agricultural Communities: Opportunities for Common Ground
sion, Economic Research Service, U.S. Department of Agricul-ture, Washington, D.C.
Butler, L. M. and R. Carkner. 2001. Bridges to sustainability:Links between agriculture, community and ecosystems. Pp158–173. In C. Flora (ed.). Interactions Between Agroecosys-tems and Rural Communities. CRC Press, Boca Raton,Florida.
Butterfield, B. 1998. National Gardening Survey 1997–1998.National Gardening Association, South Burlington, Vermont.
Butterfield, B. 2000. National Gardening Survey 1999–2000.National Gardening Association, South Burlington, Vermont.
Caswell, J. 1998. How labeling of safety and process attributesaffects markets for food. Agric Resource Econ Rev October:151–158.
Chadbourne, J. H. and M. M. Chadbourne. 2000. Common Ground-work. A Practical Guide to Protecting Rural and Urban Land.3rd ed. Chadbourne and Chadbourne, Inc., Chagrin Falls, Ohio.394 pp.
Chambers, K. and L. Eisgruber. 1997. Green marketing as greenand competitive. Paper presented at preconference workshopBusiness-Led Initiatives in Environmental Management: TheNext Generation of Policy?, American Association of AgriculturalEconomists Annual Meeting, Toronto, Ontario, July 26.
Cimprich, B. 1993. Development of an intervention to restore at-tention in cancer patients. Cancer Nursing 16:83–92.
Clancy, K. 2000. Reconnecting farmers and citizens in the foodsystem. Pp. 47-57. In W. L. Lockeretz (ed.). Visions of Ameri-can Agriculture. Iowa State University Press, Ames.
Clark, W, T. Jorling, and W. Merrell. 1999. The state of the na-tion’s ecosystems, <http://www.us-ecosystems.org/history.html> (4 March 2002)
Coder, K. D. 1996. Identified benefits of community trees and for-ests, October, <http://www.forestry.uga.edu/warnell/service/li-brary/index.php3?doc ID = 124> (11 September 2001)
Community Resources. 1996. Community Greening for UrbanRevitalization Greenstein Fellowship. Presentation to the as-sociation, Fall 1996, Baltimore, Maryland, <http://www.communityresources.org/greenpresent.html> (25 April2002)
Community Resources. 2000. Exploring urban non-timber forestproducts: The hidden nutritional, economic, cultural, and edu-cational resources of the urban environment, <http://communityresources.org/ntfp.html> (4 April 2002)
Conservation Fund. 2002. Homepage, <http://www.conservationfund.org> (29 March 2002)
Consortium for Agricultural Soils Mitigation of Greenhouse Gas-es. 2001. Homepage, <http://www.casmgs.colostate.edu> (31December 2001)
Cook, P. J. and K. L. Mizer. 1994. Revised ERS county typology:An overview. Economic Research Service, U.S. Department ofAgriculture, Washington, D.C.
Cornell Waste Management Institute (CWMI). 1999. Compost-ing challenges and solutions in New York State: A final report.Center for the Environment, Ithaca, New York.
Costanza, R., R. d’Arge, R. deGroot, S. Farber, M. Grasso, B. Han-non, K. Limburg, S. Naeem, R. V. O’Neill, J. Paruelo, R. G.Raskin, P. Sutton, and M. van den Belt. 1997. The value of theworld’s ecosystem services and natural capital. Nature 387:253–260. <http://www.wri.org/wr-98-99/ecoserv.htm#valuable> (ad-aptation; 31 December 2001)
Council for Agricultural Science and Technology (CAST). 1992a.Preparing U.S. Agriculture for Global Climate Change. ReportNumber 119. Council for Agricultural Science and Technology,
Ames, Iowa.Council for Agricultural Science and Technology (CAST). 1992b.
Water Quality: Agriculture’s Role. Report Number 120. Coun-cil for Agricultural Science and Technology, Ames, Iowa.
Council for Agricultural Science and Technology (CAST). 1996.Future of Irrigated Agriculture. Report Number 127. Councilfor Agricultural Science and Technology, Ames, Iowa.
Council for Agricultural Science and Technology (CAST). 1999.Benefits of Biodiversity. Report Number 134. Council for Agri-cultural Science and Technology, Ames, Iowa.
Cronon, W. 1991. Nature’s Metropolis: Chicago and the Great West.W. W. Norton, New York.
Curtis, P. D. 2001. Impacts and economic costs of deer in subur-ban landscapes, <http://www.arec.umd.edu/policycenter/Deer-Management-in-Maryland/curtis.htm> (31 December 2001)
Daniels, T. 1999. When City and Country Collide: ManagingGrowth in the Metropolitan Fringe. Island Press, Washington,D.C. 273 pp.
De Zeeuw, H., S. Gundell, and H. Waibel. 1999. The integrationof agriculture in urban policies. In N. Bakker, M. Dubbeling,S. Guendel, U. Sabel-Koschella, and H. de Zeeuw (eds.). A NewReader on Urban Agriculture. Research Center on Urban Ag-riculture and Forestry, Luesden, the Netherlands.<http://www.ruaf.org/ruaf_inf_fr.html> (18 April 2002)
Dickson, G. June 12, 2001. New products: Garden varieties. C/net News, <http://www.investor.cnet.com/investor/news/news-item/0-9900-1028-6258377-0.html> (29 March 2002)
Donahue, B. 1999. Reclaiming the Commons: Community Farmsand Forests in a New England Town. Yale University Press,New Haven, Connecticut.
Dwyer, J. F., E. G. McPherson, H. W. Schroeder, and R. A. Rown-tree. 1992. Assessing the benefits and costs of the urban for-est. J Arboricult 18:227–234.
Effortless Gardening. 2002. Facts about gardening and pain,< h t t p : / / w w w . e f f o r t l e s s g a r d e n i n g . c o m / p r e s s _gardeningfacts.html> (29 March 2002)
Environmental News Network (ENN). 2001. Chicken farms helpclean rivers by recycling manure, July 23, <http://www.enn.com/news/enn-stories/2001/07/07232001/manure_ 44383.asp> (17February 2002)
Evans, M. R. and H. Malone. 1992. People and plants: A case studyin the hotel industry. In D. Relf (ed.). The Role of Horticulturein Human Well-Being and Social Development: A NationalSymposium. Timber Press, Portland, Oregon.
Farmer, F. L. 1997. Definition of rural. Pp. 623–626. In G. A.Gorham (ed.). Encyclopaedia of Rural America: The Land andPeople. Vol. 2. ABC-CLIO Publishing, Santa Barbara,California.
Feenstra, G., S. McGrew, and D. Campbell. 1999. Entrepreneur-ial community gardens: Growing food, skills, jobs and commu-nities. Agricultural and Natural Resources Publication 21587.University of California, Davis.
Ferguson, B. 2001. Urban aquaculture: Ethnic markets sustainnew business. Community scale economics. New Village J 2,<http://www.newvillage.net/2aquaculture.html> (19 March2002)
Fields, S. 1993. Regulations and policies relating to the use ofwetlands for nonpoint source pollution control. Pp. 151–158.In R. K. Olson (ed.). Created and Natural Wetlands for Con-trolling Nonpoint Source Pollution. CRC Press, Boca Raton,Florida.
Fjeld, T. 2000. The effect of interior planting on health and dis-comfort among workers and school children. HortTechnol
Literature Cited 113
10:46–52.Flora, C. B. 1990. Presidential address: Rural peoples in a global
economy. Rural Sociol 55:157–177.Flora-Stats. 1998. American floral endowment, Glen Carbon, Il-
linois. 9pp.Food and Agriculture Organization (FAO). 1999a. Issues in ur-
ban agriculture, January, <http://www.fao.org/ag/magazine/9901sp2.htm> (31 December 2001)
Food and Agricultural Organization (FAO). 1999b. Trade year-book, 1998. United Nations, Rome.
Food and Agriculture Organization (FAO). 2001. Creating andstrengthening carbon sinks, <http://www.fao.org/Lead/Toolbox/Grazing/CarbonSq.htm> (31 December 2001)
Francis, M. F. M. 1987. Urban open spaces. In E. Zube and G.Moore (eds.). Advances in Environment, Behavior and Design.Plenum Press, New York.
Frey, J. E. 1981. Preferences, satisfaction, and the physical envi-ronments of urban neighborhoods. Ph.D. diss. University ofMichigan, Ann Arbor.
Fried, M. 1982. Residential attachment: Sources of residentialand community satisfaction. J Soc Sci 38:107–119.
Getz, D. A., A. Karow, and J. J. Kielbaso. 1982. Inner city prefer-ences for trees and urban forestry programs. J Arboricult 8:258–263.
Ghelfi, L. M. and T. S. Parker. 1995. A new county-level measureof urban influence. Paper presented at the Annual Meeting ofthe Rural Sociological Society, Washington, D.C., August.
Glenn, J. 1998. Putting manure to work profitably. BioCycle Feb-ruary:56–57.
Goldburg, R. J., M. S. Elliott, and R. L. Naylor. 2001. Marineaquaculture in the United States. SeaWeb Aquaculture Clear-inghouse, <http://www.seaweb.org/resources/sac/reports.html>(13 March 2002)
Goldman, R. and D. R. Dickens. 1983. The selling of rural Amer-ica. Rural Sociol 48:585–606.
Goldsmith, H. F., D. S. Puskin, and D. J. Stiles. 1993. Improvingthe operational definition of “rural areas” for federal programs,<http://www.ruralhealth.hrsa.gov/Goldsmith.htm> (31 Decem-ber 2001)
Goldstein, J. 1999. Certified organic farm relies on compost. Bio-Cycle December:60–61.
Goodall, C. R., K. Kafadar, and J. W. Tukey. 1998. Computingand using rural versus urban measures in statistical applica-tion. Am Statist 52:101–111.
Gowda, V. 2002. Whose garden is it? Congressional Quarterly DBAGoverning Magazine, March, <http://governing.com/archive/>(18 February 2002)
Graf Growers. 2001. Homepage, <http://www.grafgrowers.com>(29 March 2002)
Gray, K. 1998. Moving Municipal Organics to Agricultural Mar-kets. BioCycle December:49–50.
Guither, H. D., H. S. Baumes, W. H. Meyers. 1994. Farm prices,income, stability, and distribution. Pp. 223–236. In M. C. Hall-berg, R. G. F. Spitze, and D. E. Ray (eds.). Food, Agriculture,and Rural Policy into the Twenty-First Century: Issues andTradeoffs. Westview Press, Boulder, Colorado.
Hallberg, M. C., R. G. F. Spitze, and D. E. Ray (eds.). 1994. Food,Agriculture, and Rural Policy into the Twenty-First Century:Issues and Trade-Offs. Westview Press, Boulder, Colorado.
Hamilton, N. D. 2001. Putting a face on our food: How state andlocal food policies can promote the new agriculture. Paper pre-sented to the Midwest Sustainable Agriculture Working Group,West Des Moines, Iowa, November 30, 2001.
Hammer, D. A. 1992. Designing constructed wetlands systems totreat agricultural nonpoint source pollution. Ecological Engr1:49–82.
Heaton, T. 1980. Metropolitan influences on United States farm-land use and capital intensity. Rural Sociol 45:501–508.
Heimlich, R. E. and W. D. Anderson. 1987. Dynamics of land usechange in urbanizing areas. In W. Lockeretz (ed.). SustainingAgriculture Near Cities. Soil and Water Conservation Society,Ankeny, Iowa. 149 pp.
Heimlich, R. E. and W. D. Anderson. 2001. Development at theurban fringe and beyond: Impacts on agriculture and rural land,24 July, <http://www.ers.usda.gov/publications/aer803> (31December 2001)
Heimlich, R. E. and C. H. Barnard. 1997. Agricultural adapta-tions to urbanization: Farm types and agricultural sustainabil-ity in U.S. metropolitan areas. Pp. 283–303. In I. Audirac (ed.).Rural Sustainable Development in America. John Wiley andSons, Inc., New York.
Hill, C. O. and P. D. Relf. 1982. Gardening as an outdoor activityin geriatric institutions. Activ Adapt Aging 3:47–54.
Honeyman, M. 1987. Vegetation and stress: A comparison studyof varying amounts of vegetation in countryside and urbanscenes. Master’s Thesis. Kansas State University, Manhattan.
Hope Wohl Associates. 2000. The Feasibility of Urban Agricul-ture with Recommendations for Philadelphia. The Pennsylva-nia Horticultural Society, Philadelphia.
Horne, J. E. 2001. The Next Green Revolution. Haworth Press,Inc., Binghamton, New York. 312 pp.
Huang, J., H. Akbari, H. Taha, and A. Rosenfeld. 1987. The po-tential of vegetation in reducing summer cooling loads in resi-dential buildings. J Climate Appl Meteorol 26:1103–1106.
Integrity Systems Cooperative Co. in association with Sustainabil-ity Ventures Group. 1997. Adding values to our food system:An economic analysis of sustainable community food systems,<http://www.manyfoldfarm.com/comfoosys/main.htm> (9March 2002)
Irvine, R. J. 1999. Phytoremediation, <http://www.geocities.com/Athens/Atlantis/5476/phytoremediation.html> (31 December2001)
Jefferson, T. 1984. Writings. Library of America, New York.Johnson, D. C. and R. L. Christensen. 1995. The green industry
today: Some issues and future prospects. J Agribusiness 13:63–76.
Johnson, K. M. 1989. Recent population redistribution trends innonmetropolitan America. Rural Sociol 54:301–326.
Johnson, K. M. 1993. Demographic change in nonmetropolitanAmerica, 1980 to 1990. Rural Sociol 58:347–365.
Johnson, K. M. and C. L. Beale. 1994. The recent revival of wide-spread population growth in nonmetropolitan areas of the Unit-ed States. Rural Sociol 59:655–667.
Kadlec, R. H. 1995. Overview: Surface flow constructed wetlands.Water Sci Technol 32:1–12.
Kadlec, R. H. and R. L. Knight. 1996. Treatment Wetlands. LewisPublishers, CRC Press, Boca Raton, Florida. 893 pp.
Kalbacher, J. Z. and D. DeAre. 1986. Farm Population of theUnited States 1985. Current Population Reports. P–27, Num-ber 59. Bureau of Census, U.S. Department of Census, Wash-ington, D.C.
Kaplan, S., J. F. Talbot, and R. Kaplan. 1988. Coping with dailyhassles: The impact of nearby nature on the work environment.Project Report. Urban Forestry Unit Cooperative Agreement23–85–08. North Central Forest Experiment Station, ForestService, U.S. Department of Agriculture, St. Paul, Minnesota.
114 Urban and Agricultural Communities: Opportunities for Common Ground
Kaufman, J. and M. Bailkey. 2000. Farming inside cities: Entre-preneurial urban agriculture in the United States. Lincoln In-stitute of Land Policy Working Paper, Cambridge,Massachusetts.
Keith, D. L. 1997. Lecture 1. Supplementary Notes, September29, <http://citvsgi1.unl.edu/ento407/html/LECT1.html> (31December 2001)
Kellogg Commission on the Future of State Land Grant Universi-ties. 1999. Returning to our roots: The engaged institution.National Association of State Universities and Colleges, Wash-ington D.C.
Kellogg Commission on the Future of State Land Grant Universi-ties. 2000. Renewing the covenant. Learning, discovery andengagement in a new age and different world. National Asso-ciation of State Universities and Colleges, Washington D.C.
Kuo, F. E. and W. C. Sullivan. 1996. Do trees strengthen urbancommunities, reduce domestic violence? Forest Report R8–FR55. Technical Bulletin Number 4. Southern Region, ForestService, U.S. Department of Agriculture, Athens, Georgia.
Kuo, F. E. and W. C. Sullivan. 2001. Human environment researchlaboratory, March 5, <http://www.aces.uiuc.edu/~herl/welcome.html> (31 December 2001)
Lal, L., J. Kimble, and R. F. Follett (eds.). 1997. Agricultural prac-tices to sequester carbon into soils. In Management of CarbonSequestration in Soil. CRC Press, New York.
Landicho, S. 2000. Growing the industry. Interior Landscape17:20–25.
Lapping, M. B. and M. J. Pfeffer. 2000. City and county: Forgingnew connections through agriculture. Pp. 91–104. In WillianLockeretz (ed.). Visions of American Agriculture. Iowa StateUniversity Press, Ames.
Lard, C. F. and C. E. Hall. 1996. Texas turfgrass economic impactstudy. Horticultural Economics Research Report Number 96–4. Texas Agricultural Experiment Station, Dallas. 1 p.
Lazarus, C. 2000. Urban agriculture: Join the revolution. NewVillage J 2:64–73.
Lewis, C. A. 1988. Hidden value. Am Nurseryman 168:111–115.Littman, M. 1996. Green city: Gardening and urban agriculture
resources. The Neighborhood Works 19 (3).Living Machines, Inc. 2001. Homepage, <http://
www.livingtechnologies.com> (12 January 2002)Lobo, R. E., G. E. Goldman, D. A. Jolley, B. D. Wallace, W. L.
Schrader, and S. A. Parker. 1999. Agritourism benefits agri-culture in San Diego county. Calif Agric 53:20–24.
Local Government Commission. 2001. Health and physical activ-ity, <http://www.lgc.org/people/health.html> (31 December2001)
Lockwood, I. M. and T. Stillings. 2001. Traffic calming for crimereduction and neighborhood revitalization, <http://www.ite.org/traffic/documents/AHA98A19.pdf> (31 December 2001)
Lohr, V. I. 1992a. Research on human issues in horticulture mo-tivates students to learn science. HortTechnol 2:257–259.
Lohr, V. I. 1992b. The contribution of interior plants to relativehumidity in an office. Pp. 117–119. In D. Relf (ed.). The Roleof Horticulture in Human Well-Being and Social Development.Timber Press, Portland, Oregon.
Lohr, V. I. and C. H. Pearson-Mims. 1996. Particulate matteraccumulation on horizontal surfaces in interiors: Influence offoliage plants. Atmospheric Environ 30:2565–2568.
Lohr, V. I. and C. H. Pearson-Mims. 2000. Physical discomfortmay be reduced in the presence of interior plants. HortTech-nol 10:53–58.
Lohr, V. I., C. H. Pearson-Mims, and G. K. Goodwin. 1996. Interi-
or plants may improve worker productivity and reduce stressin a windowless environment. J Environ Hort 14:97–100.
Loudoun County, Virginia. Office of Rural Economic Development.2002. Homepage, <http://www.rural-loudoun.state.va.us> (29March 2002)
Macpherson, M. 1993. Benefits of urban greening. Merck FamilyFund, Milton, Massachusetts.
Malakoff, D. 1995. What good is community greening? AmericanCommunity Gardening Association Monograph. PennsylvaniaHorticultural Society, Philadelphia.
Markus, T. A. 1967. The function of windows: A reappraisal.Building Sci 2:97–121.
Martinez-Espinoza, M. 2000. Urban and periurban aquaculture.Feeding Asian cities. Regional Seminar, Food and AgricultureOrganization, November 27–30, 2000. <www.fao.org/ag/search/agfind.asp> (19 March 2002).
Matsuo, E. 1995. Horticulture helps us to live as human beings:Providing balance and harmony in our behavior and thoughtand life worth living. Acta Hort 391:19–30.
McGovern, G. S. (ed.). 1967. Agricultural Thought in the 20thCentury. Bobbs-Merrill, Indianapolis, Indiana.
McGuire, D. L. 1997. Implementing horticultural therapy into ageriatric long-term care facility. Pp. 61–80. Horticultural Ther-apy and the Older Adult Population. Haworth Press Inc, Bing-hamton, New York.
McPherson, E. G. and R. A. Rowntree. 1993. Energy conservationpotential of urban tree planting. J Arboricult 19:321–331.
McPherson, G. and J. R. Simpson. 1995. Shade trees as a demand-side resource, Home Energy Magazine Online, (March/April),<http://hem.dis.anl.gov/eehem/95/950307.html> (31 December2001)
Mechling, P. 1990. Bed and breakfast. In W. Grafton and A. Far-rise (eds.). Income Opportunities for the Private Land Ownerthrough Management of Natural Resources and RecreationalAccess. West Virginia Cooperative Extension Service, Morgan-town.
Miller, D. 1999. Farming the wild side. Progressive Farmer Au-gust:20–22.
Molnar, J. J. and L. S. Wu. 1989. Agrarianism, family farming,and support for state intervention in agriculture. Rural Sociol54:227–245.
Monroe-Santos, S. 1998. Longevity in urban community gardens.Master’s thesis. University of California, Davis.
Morey, R. W., J. Morey, and C. Morey. 2000. Nursery retailer 100.Nursery Retailer 45:71–78.
Mougeot, L. J. A. 2000. Urban agriculture: Definition, presence,potentials and risks. Pp. 1–42. In N. Bakker, M. Bubbeling, S.Guendel, U. Sabel-Koschella, and H. de Zeeuw (eds.). GrowingCities, Growing Food: Urban Agriculture on the Policy Agenda.A Reader in Urban Agriculture. Feldafing: Deutsche Stiftungfür internationale Entwicklung, Bonn, Germany.
Munn, D. and Murray, F. 1999. Reclaiming acid mine soil withdrywall and manure. Biocycle October:59–60.
Murdock, S. H. 1995. An America Challenged: Population Changeand the Future of the United States. Westview Press, Boulder,Colorado.
Murdock, S. H. and F. L. Leistritz (eds.). 1988. The Socioeconom-ic Impacts of the Farm Financial Crisis. Westview Press, Boul-der, Colorado.
Namazi, K. H. and S. R. Haynes. 1994. Sensory stimuli reminis-cence for patients with Alzheimer’s disease: Relevance andimplications. Clin Gerontol 14:29–45.
National Agricultural Lands Study. 1981. Final Report. An in-
Literature Cited 115
teragency study jointly sponsored by the President’s Council onEnvironmental Quality and the U.S. Department of Agriculture,with 12 participating Federal Agencies, Washington, D.C.
Natural Resources Defense Council (NRDC). 1999. Stormwaterstrategies. Community responses to runoff pollution, <http://www.nrdc.org/water/pollution/storm/stoinx.asp> (4 March2002)
New, M. B. 1997. Aquaculture and the culture of fishes: Balanc-ing the scales. World Aquaculture 28:37–45.
North Carolina State University (NCSU), Cooperative Extension.2001a. Balancing the benefits and problems of bats, <http://gaston.ces.state.nc.us/staff/bats.html> (31 December 2001)
North Carolina State University (NCSU), Water Quality Group.2001b. Wetland management, <http://www.h20sparc.wq.ncsu.edu/info/wetlands/manage.html> (13 December 2001)
Northeast Regional Center for Rural Development (NRCRD). 2002.Protecting farmland at the fringe: Do regulations work?Strengthening the research agenda. Regional Rural Develop-ment Paper Number 7. Northeast Regional Center for RuralDevelopment, Pennsylvania State University, University Park.
Onofrey, D. 2000. State of the industry. Greenhouse Grower 18:16–34.
Oregon Department of Agriculture (ODA). 2001. Grass seed bytype: Production by type, Oregon, 1935-98, <http://www.oda.state.or.us/oass/grsedpro.htm> (31 December 2001)
Orland, V. and A. Ebreo. 1992. The effect of street trees on per-ceived values of residential property. Environ Behav 24:298–325.
Paarlberg, D. 1980. Farm and Food Policy: Issues in the 1980s.University of Nebraska Press, Lincoln.
Palleschi, L., F. Vetta, E. Degennaaro, and G. Idone. 1996. Effectof aerobic training on the cognitive performance of elderly pa-tients with senile dementia of Alzheimer’s type. Arch GerontolGeriatr (Supplement 5):47–50.
Parsons, R., L. G. Tassinary, R. S. Ulrich, M. R. Hebl, and M. Gross-man-Alexander. 1998. The view from the road: Implicationsfor stress recovery and immunization. J Environ Psychol18:113–140.
Pew Center for Civic Journalism. 2000. Straight talk from Amer-icans 2000. A national survey for the Pew Center for Civic Jour-nalism, conducted by Princeton Survey Research Associates,< h t t p : / / w w w . p e w c e n t e r . o r g / d o i n g c j / r e s e a r c h /r_ST2000nat1.html#highlights> (14 February 2002)
Pezzini, M. and T. R. Wojan. 2001. Leveraging amenities for ru-ral development: Direction, dialogue, and negotiation. Pp. 121–138. In Exploring Policy Options for a New Rural America.Center for the Study of Rural America, Federal Reserve Bankof Kansas City, Kansas City, Missouri.
Pfeffer, M. J. and K. P. Wagenet. 1999. Planning for environmen-tal responsibility and equity: A critical appraisal of rural/ur-ban relations in the New York City watershed. Pp. 179–196.In O. Furuseth and M. Lapping (eds.). Contested Countryside:The Rural Urban Fringe in North America. Ashgate Publish-ing, Aldershot, U.K. and Brookfield, Vermont.
Pittenger, D. R., V. A. Gibeault, and S. T. Cockerham. 1991. En-vironmental horticulture: Growth industry in California. Ca-lif Agric 45:15–17.
Pothukuchi, K. and J. Bickes. 2001. Youth nutrition gardens inDetroit: A report on benefits, potential, and challenges. WayneState University, Detroit, Michigan.
Redefer, L. A. and J. F. Goodman. 1989. Brief report: Pet-facili-tated therapy with autistic children. J Austism Devel Disor-ders 19:461–467.
Reedy, S. June 28, 2001. Lawn and garden sales surpass $33 billion,<http://www.homeaccentstoday.com/NewsAnalysis061801.asp> (29March 2002)
Relf, P. D. 1978. Horticulture as a recreational activity. Am HealthCare Assoc J 4:68–71.
Relf, D., A. R. McDaniel, and B. Butterfield. 1992. Attitudes to-ward plants and gardening. HortTechnol 2:201–204.
Ricketts, T. C., K. D. Johnson-Webb, and P. Taylor. 1998. Defini-tions of rural: A handbook for health policy makers and re-searchers. A Technical Paper. Cecil G. Sheps Center for HealthServices Research, Chapel Hill, North Carolina.
Robinette, G. O. 1972. Plants, people and environmental quality.National Parks Service, U.S. Department of the Interior, Wash-ington, D.C. 140 pp.
Roper Reports Worldwide. 1999. 1998 year in review. Excerptedby Army Morale, Welfare, and Recreation, <http://www.armymwr.com/mwr/marketing/tidbits/may99.html> (29 March2002)
Ruppert, K. C., J. Bradshaw, and A. Z. Stewart. 1997. The Flori-da master gardner program: History, use, and trends. Hort-Technol 7:348–353.
Sanitation Districts of Los Angeles County. 2001. Pomona WaterReclamation Plant (WRP), <http://www.lacsd.org/waswater/wrp/pomona.htm> (31 December 2001)
Sarno, M. T. and N. Chambers. 1997. A horticulture therapy pro-gram for individuals with acquired aphasia. Activ Adapt Ag-ing 22:81–91.
Schultz, R. C., J. P Colletti, T. M. Isenhart, W. W. Simpkins, C. W.Mize, and M. L. Thompson. 1995. Design and placement of amulti-species riparian buffer strip system. Agroforestry Syst29:201–226.
Schusky, E. L. 1989. Culture and Agriculture: An Ecological In-troduction to Traditional and Modern Farming Systems. Ber-gin and Garvey Publishers, New York.
Scott, K. I., J. R. Simpson, and G. McPherson. 1999. Effects oftree cover on parking lot microclimate and vehicle emissions.J Arboricult 25:129–142.
Seifert, L. S. 1998. Structured activities reveal residual functionin Alzheimer’s type dementia. Clin Gerontol 19:35–43.
Shoemaker, C. A., K. Randal, P. D. Relf, and E. S. Geller. 1992.Relationships between plants, behavior and attitudes in an of-fice environment. HortTechnol 2:205–206.
Siegel, J. M. 1990. Stressful life events and use of physician ser-vices among the elderly: The moderating role of pet ownership.J Personality Soc Psychol 58:1081–1086.
Smit, J. 1996. Urban agriculture, progress and prospect: 1975–2005, March, <http://www.idrc.ca/cfp/rep18_e.html> (31 Decem-ber 2001)
Sokolow, W. D. 2000. Agriculture in urbanizing communities.Presentation to USDA Policy Advisory Committee on FarmlandListening Forum, University of California, Davis, July 21,<http://www.aic.ucdavis.edu/research/USDAA 20152072100.pdf> (19 April 2002)
Sorensen, A. A., R. P. Greene, and K. Russ. 1997. Farming on theedge. American Farmland Trust, DeKalb, Illinois.
Spitze, R. G. F. and B. L. Flinchbaugh. 1994. Evolution of U.S.food and agricultural policy: 1970s to 1990s. Pp. 41–45. In M.C. Hallberg, R. G. F. Spitze, and D. E. Ray (eds.). Food, Agri-culture, and Rural Policy into the Twenty-First Century: Issuesand Tradeoffs. Westview Press, Boulder, Colorado.
Sprawl Guide. 2001. Planning Commissioners Journal,< http://www.plannersweb.com/sprawl/define.html> (28 April2002)
116 Urban and Agricultural Communities: Opportunities for Common Ground
Stauber, K. N. 2001. Why invest in rural America. And how? Acritical public policy question for the 21st Century. Pp. 9–29.In Exploring Policy Options for a New Rural America. Centerfor the Study of Rural America, Federal Reserve Bank of Kan-sas City, Kansas City, Missouri.
Stickney, R. R. 1994. Principles of Aquaculture. John Wiley andSons, New York.
Taylor, M. K. 1990. The healthy gardener. Flower and GardenMarch/April:46–47.
Templeton, S. R., C. Brown, G. E. Goldman, S. J. Yoo, and V. S.Pradhan. 2000. An economic analysis of environmental horti-culture with a focus on California. HortSci 35:987–992.
Theta Reports. 2001. Companion animals: New markets forhuman pharmaceuticals and agrochemicals, <http://thetareports.com> (31 December 2001)
Thomas, W. H. 1994. The Eden Alternative: Nature, Hope, andNursing Homes. Eden Alternative Foundation, Sherburne, NewYork.
Thompson, E., Jr. 1996. Toward a More Strategic Approach toFarmland Protection. American Farmland Trust, Washington,D.C.
Thompson, E., Jr. and T. W. Warman. 2000. Meeting the chal-lenge of farmland protection in the 21st Century. Am Farm-land 21:12–20.
Thompson, P. B. 2000. Jefferson and agrarianism. In P. B. Th-ompson and T. H. Hilde (eds.). Agrarian Roots of Pragmatism.Vanderbilt University Press, Nashville, Tennessee.
Travel Industry Association of America (TIA). 2001. The pressroom, <http://www.tia.org/Press/trends.asp> (29 March 2002)
Turner, S. C. and W. Kriesel. 1995. The relative importance ofthe green industry in the U.S. agricultural economy. J Agri-business 13:51–62.
Ulrich, R. S. 1979. Visual landscapes and psychological well-be-ing. Landscape Res 4:17–23.
Ulrich, R. S. 1981. Natural versus urban scenes: Some psycho-physiological effects. Environ Behavior 13:523–556.
Ulrich, R. S. 1984. View through a window may influence recov-ery from surgery. Science 224:420–421.
Ulrich, R. S. and R. Parsons. 1992. Influence of passive experi-ences with plants on individual well-being and health. Pp. 93–105. In D. Relf (ed.). The Role of Horticulture in Human Well-Being and Social Development. Timber Press, Portland, Oregon.
Ulrich, R. S. and R. F. Simons. 1986. Recovery from stress duringexposure to everyday outdoor environments. Pp. 115–122. InJ. Wineman, R. Barnes, and C. Zimring (eds.). The Costs of NotKnowing. Proceedings of the 17th Annual Conference of theEnvironmental Research and Design Association, Washington,D.C.
University of Wisconsin–Madison. Center for Integrated Agricul-tural Systems. 2001. Research Brief Number 21. Communitysupported agriculture: Growing food and community, <http://www.wisc.edu/cias/pubs/briefs/021.html> (31 December 2001)
U.S. Bureau of the Census (USBC). 1993a. Census of Populationand Housing, 1990. Summary Tape File 3. U.S. Bureau of theCensus, U.S. Department of Commerce, Washington, D.C.
U.S. Bureau of the Census (USBC). 1993b. Statistical Abstractof the United States: 1993. 113th ed. U.S Bureau of the Cen-sus, U.S. Department of Commerce, U.S. Government PrintingOffice, Washington, D.C.
U.S. Bureau of the Census (USBC). 1998. Statistical Abstract ofthe United States: 1998. 118th ed. U.S Bureau of the Census,U.S. Department of Commerce, U.S. Government Printing Of-fice, Washington, D.C.
U.S. Department of Agriculture–Cooperative States Research Ser-vice (USDA–CSRS). 1994. Did you know that: Aquaculturefact sheet. Office of Aquaculture, Cooperative States ResearchService, U.S. Department of Agriculture, Washington, D.C.
U.S. Department of Agriculture–Economic Research Service(USDA–ERS). 1995. Aquaculture outlook. Supplement to live-stock, dairy, and poultry situation and outlook. Economic Re-search Service, U.S. Department of Agriculture, Washington,D.C.
U.S. Department of Agriculture–Animal and Plant Health Inspec-tion Service (USDA–APHIS). 1996. Importing cut flowers,June, <http://www.aphis.usda.gov/oa/pubs/flowers.html> (31December 2001)
U.S. Department of Agriculture–National Agricultural StatisticsService (USDA–NASS). 1997a. Census of Agriculture, <http://www.nass.usda.gov/census/census97/volume1/us-51/toc297.htm> (31 December 2001)
U.S. Department of Agriculture–Economic Research Service(USDA-ERS). 1997b. U.S. “green industry” faces import com-petition. Agric Outlook June:10–13.
U.S. Department of Agriculture–Natural Resources ConservationService (USDA–NRCS). 1997c. National Resources Inventory.< http://www.nhq.nres.usda.gov/land/pubs/97highlights.html >(15 April 2002)
U.S. Department of Agriculture–Economic Research Service(USDA–ERS). 1999. Green industry cash receipts growing de-spite import competition. Agricultural Outlook (Jan.-Feb.):3–5.
U.S. Department of Agriculture–Economic Research Service(USDA–ERS). 2000a. Floriculture and environmental horti-culture briefing room, <http://www.ers.usda.gov/briefing/floral/index.htm>
U.S. Department of Agriculture–Natural Resource ConservationService (USDA–NRCS). 2000b. Summary Report: 1997 Na-tional Resources Inventory. Appendix 3. Glossary of SelectedTerms, <http://www.nhq.usda.gov/NRI/1997/summary_report/original/glossary.html> (13 January 2002)
U.S. Department of Agriculture–Natural Resource ConservationService (USDA–NRCS). 2000c. Summary Report: 1997 Na-tional Resources Inventory. Washington, D. C.
U.S. Department of Agriculture (USDA). 2001a. Farmers marketfacts, <http://www.ams.usda.gov/farmersmarkets/facts.htm>(13 January 2002)
U.S. Department of Agriculture (USDA). 2001b. Maintaining farmand forest lands in rapidly growing areas. Report to the Secre-tary of Agriculture from the USDA Policy Advisory Committeeon Farm and Forest Land Protection and Land Use. U.S. De-partment of Agriculture, Washington, D.C.
U. S. Department of Agriculture (USDA). 2001c. The new Amer-ican farmer: Profiles of American innovation. SustainableAgriculture Research Education Program, U.S. Department ofAgriculture, Washington, D.C.
U.S. Department of Commerce (USDC). 1975. Historical statis-tics of the United States: Colonial times to 1970. U.S. Bureauof the Census, U.S. Department of Commerce, Washington, D.C.
U.S. Department of Commerce (USDC). 1981. Census of Agricul-ture. 1978 Final File. Technical Documentation. U.S. Bureauof the Census, Department of Commerce, Washington, D.C.
U.S. Department of Commerce (USDC). 1984. 1982 Census ofAgriculture. Volume 1. United States, Summary and StateData. Bureau of the Census, U.S. Department of Commerce,Washington D.C.
U.S. Department of Commerce (USDC). 1989. 1987 Census of
Literature Cited 117
Agriculture. Volume 1. United States, Summary and StateData. Bureau of the Census, U.S. Department of Commerce,Washington D.C.
U.S. Department of Commerce (USDC). 1991. Census of Popula-tion and Housing, 1990: Summary Tape File 3. Technical Doc-umentation. U.S. Bureau of the Census, U.S. Department ofCommerce, Washington, D.C.
U.S. Department of Commerce (USDC). 1995. 1992 Census ofAgriculture. Volume 1. United States, Summary and StateData. Bureau of the Census, U.S. Department of Commerce,Washington D.C.
U.S. Department of Commerce (USDC). 1996. 1992 Census ofAgriculture. Volume 4. Subject Series Part 4. History. U.S.Bureau of the Census, U.S. Department of Commerce, Wash-ington, D.C.
U.S. Department of Energy (DOE). Energy Efficiency and Renew-able Energy Network. 1993. Cooling our cities, November,<http://www.eren.doe.gov/cities_counties/coolcit.html> (31December 2001)
U.S. Environmental Protection Agency (EPA). 1988. Design man-ual: Constructed wetlands and aquatic plant systems for mu-nicipal wastewater treatment. EPA/625/1–88/022. Office ofResearch and Development, U.S. Environmental ProtectionAgency, Washington, D.C. 83 pp.
U.S. Environmental Protection Agency (EPA). 1999. Preliminarydata summary of urban storm water best management prac-tices. EPA–821–R–99–012. Office of Water, U.S. Environmen-tal Protection Agency, Washington D.C., <http://www.epa.gov/ost/stormwater/> (3 March 2002)
U.S. Environmental Protection Agency (EPA). 2000. What is abrownfield? August 31, <http://www.epa.gov/R5Brownfields/htm/brownfld.htm> (31 December 2001)
U. S. Geological Survey. 2001. Selected findings and current per-spectives on urban and agricultural water quality by the Na-tional Water-Quality Assessment, 1 January, <http://www.drilleronline.com/BNPCoverStoryItem?0,3641,69809,00.html>(4 March 2002)
Verderber, S. F. 1986. Dimensions of person-window transactionsin the hospital environment. Environ Behavior 18:450–466.
Vesterby, M. and K. S. Krupa. 2001. Major uses of land in theUnited States, 1997. Statistical Bulletin Number 973. Econom-ic Research Service, U.S. Department of Agriculture, Washing-ton, D.C.
Waliczek, T. M., R. H. Mattson, and J. M. Zajicek. 1996. Benefits
of community gardening to quality of life issues. J Environ Hort14:204–209.
Weir, S. and N. Bills. 1992. Protecting farmland: Not-for-Profitland trusts in the northeastern United States. Policy IssuesRural Land Use 5(2).
West, B. and R. Ott. 1997. The answer may lie within. LawnLandscape 18:92–96, 115.
Wilkins, J. 2000. Community food systems. Linking food, nutri-tion and agriculture. Ask the nutrition expert. Cornell Coop-erative Extension Food and Nutrition, <http://cce.cornell.edu/food/expfiles/topics/wilkins/wilkinsoverview.html> (9 March2002)
Wilkinson, K. P. 1991. The Community in Rural America. Green-wood Press, Westport, Connecticut.
Wolf, K. 1998. Urban forest values: Economic benefits of treesin cities, November, <http://www.cfr.washington.edu/research.envmind/HumanBens/EconBens-Fs3.pdf> (31 Decem-ber 2001)
Wolverton, B. C., A. Johnson, and K. Bounds. 1989. Interior land-scape plants for indoor air pollution abatement. Final report.Plants for clear air. National Aeronautics and Space Adminis-tration–ALCA, <http://www.ssc.nasa.gov/~ssctrs/documents/1989/indr_landscape.pdf>
Wolverton, B. C., R. C. McDonald, and H. H. Mesick. 1985. Foli-age plants for indoor removal of the primary combustion gasescarbon monoxide and nitrogen dioxide. J Miss Acad Sci XXX:1–8.
Wolverton, B. C., R. C. McDonald, and E. A. Watkins, Jr. 1984.Foliage plants for removing indoor air pollutants from energy-efficient homes. Econ Bot 38:224–228.
Wood, M. 2000. Phytoremediation. Using plants to clean up soils.Agric Res 48:4–11.
Wood, S., K. Sebastian, and S. J. Scherr. 2000. Pilot analysis ofglobal ecosystems. Agroecosystems. International Food Poli-cy Research Institute and World Resources Institute, Washing-ton, D.C. < http://ifpri.cgiar.org/books/page.htm > (21 October2001)
World Resources Institute (WRI). 1996. World Resources 1996-97: A Guide to the Global Environment—The Urban Environ-ment. Oxford University Press, New York.
Zelarney, P. T. and J. A. Ciarlo. 1999. Defining and describingfrontier areas in the United States: An update. Letter to theField Number 22. Frontier Mental Health Services ResourceNetwork, Denver, Colorado.
118 Urban and Agricultural Communities: Opportunities for Common Ground
118
Index
A
Access in food systems, 82Acid mine soils, 30Adaptive farms, 56, 57, 109Advocacy in food systems, 82Ag in the Classroom, 85Agribusinesses, 15
distinction between farming and, 16Agricultural conservation easements, purchase of, 74Agricultural districts, 2, 9, 72-73, 109
benefits, 73drawbacks, 73
Agricultural industry, employment in, 23, 99, 100Agricultural land and open-space protection, 84-85Agricultural Marketing Service (AMS) of USDA, 58
Sustainable Agriculture Research and Education, 90Agricultural protection zoning (APZ), 1, 9, 106
benefits, 73drawbacks, 73ordinances for, 72, 73, 74
Agricultural Risk Protection Act (2000), 71Agricultural tax programs, 2, 9, 73-75
property tax relief, 74benefits, 74drawbacks, 74
Agriculture, 5, 12. See also Urban agriculturebenefits of, to urbanizing society, 8business contributions to urbanizing society, 41-47changes in, 7components of, 4-5, 13contemporary, 4contributions to community health and well-being, 48contributions to urbanization, 1educational events in, 62historical context of, 7, 15-17myths, stereotypes, and realities, 24-25opportunity offered by, 7, 17-18planning in, 80public perception of, 25role of, in urban society, 1, 4rural-urban, 23-24service role of, 8
in planning and revitalization, 33-40in urbanizing society, 27-32
sustainable, 14Agriculture, U.S. Department ofAgricultural Marketing Service, 58AgriRecycle, Inc., 30Agritainment, 81Agritourism events, 64-65Agrochemicals, development and manufacture of, 4Agroecology, 48
Agroecosystem services for restoration and remediation, 27-28Air pollution, 34Air quality, indoor-outdoor, 36Alternative composting technologies, 87American Association of Botanical Gardens and Arboreta, 65American Community Gardening Association (ACGA), 56, 91American Farmland Trust (AFT), 9, 38, 68, 90American Planning Association, 85, 88, 90Americans with Disabilities Act (ADA) (1990), 66Anglo-Americans, 22, 23Animals, 26
companion, 12, 46, 48-49human interactions with, 49range sciences and, 38
Animal science, 48Aquaculture industries, 15, 26, 47Aquatic treatments, 29Aquifers, 28
reduction, 28Arboreta, 65Area-based allowance zoning, 72, 73Atmospheric carbon dioxide, 31, 106Audubon Cooperative Sanctuary System, 91Audubon International, 91Audubon Society, 85, 90
B
Back Roads Adventures, 63Bacterial water pollution, 38Bats, 37Bed and breakfast establishments, 62Bedding plants, 43Beneficial insects, 26Benson, Ezra Taft, 24Biodiverse plant life, 25Biofuels, 87Biological pollution, 47Bioremediation, 31-32, 109Biotechnologies, development and manufacture of, 4Bird watching, 8, 62Botanical gardens, 8-9, 65-66Bridge building in higher education, 10, 85Brownfields, remediation of, 27, 31-32, 109Business and economic benefits, 1
C
Canopy density, 36Canopy management, 35Carbon cycle, 31, 109Carbon cycling process, 31, 109Carbon dioxide, atmospheric, 31
Index 119
Carbon monoxide, 36Carbon sequestration processes, 8, 25, 27, 31, 109Carlyle Consulting, 30Center for Agricultural and Rural Policy, 88Chemical pollution, 47Chicago Botanic Garden, 66Chincoteague National Wildlife Refuge, 63Christmas trees, 63, 65Circuit breaker tax relief, 74-75City dairies, 19nCity life, 15City-managed parks, 39Clean water, 25Collaborative problem solving, domains for, 80College and university curricula in higher education, 83-84Commodity Credit Corporation (CCC), 71Community, in partnerships and collaboration, 91Community development, 17-18, 48Community food projects, 91Community Food Security Program, 83Community food systems, 8, 10, 11, 53, 61, 109
in comprehensive planning, 80in partnerships and collaboration, 91
Community gardens, 8, 12, 39, 51Community Greening Grants Revitalization Program (Baltimore),
38Community greening partnerships between urban and rural areas
in partnerships and collaboration, 91Community Greening programs, 11, 38-39Community health and well-being, 1, 109
agriculture's contributions to, 48Community planning processes, 33Community quality of life, 51-53Community supported agriculture (CSA), 8, 54-55, 82Commuting, 50Companion animals, 12, 46, 48-49Composting, 25, 27, 30-31Comprehensive planning, 1, 9, 11
community food systems in, 80existing resources in, 81financial incentives in, 80funding in, 80initiatives in, 2, 10integrated, long-term rural-urban resources in, 80public support in, 80
Computer technology, 26Conditional use, 39Connecticut Farmers' Market Nutrition program, 55Conservation, 4, 15, 27Conservation easements, 71, 75-76Conservation Fund, 63Conservation reserve program, 70Conserving and revitalizing land areas, 38-40Constructed wetlands, 29, 109Construction, 8Consumer horticulture, 63-64Container gardening, 63Contemporary agriculture, 4Converting and revitalizing vacant or underused urban lands in
food systems, 83Cooperative extension
in partnerships and collaboration, 91-92personnel in, 11
Cooperative Extension Master Gardeners program, 64
Cooperative State Research, Education, and Extension Service(CSREES), 81, 90
Country life, 15County population change, 98Cranberry marshes, 19nCrime, impact of community gardens on, 52Cronon, William, 16Cross-cutting dimensions of urban agriculture, 17Crossover products, 46Currency exchange and investments, 26Cut flowers, 42, 43, 45-46
D
Demographic changes, 7, 22-23Desert ecosystem, 37Developed land, 20Direct marketing strategies, 56Discount department stores, 43Disease management, 36-38Disturbed lands, 109
rehabilitation of, 27Ducks Unlimited, 90
E
Ecological restoration, 52Economic development, 17-18Economic growth and improvements, 78Economic production similarities and differences, 23-24Economic Research Service (ERS), 19nEcosystems, 13
defined, 13-14Ecosystem services, 81Eden Alternative, 49Ellison's Greenhouses, 65Entomology, 38Entrepreneurial capacity, building, in higher education, 85Entrepreneurial food gardens and farms, 54, 55-58Entrepreneurial products in research, 87Environmental horticulture, 41-46, 109Environmental protection, 12Environmental Protection Agency, 90Environmental risk mitigation, 27Equestrian activities, 8, 62Equine industries, 15, 46-47Ethnic distribution, 22-23, 97Eutrophication, 47Exclusive agricultural zoning, 72, 73Existing resources in comprehensive planning, 81Experiential learning in partnerships and collaboration, 92
F
Farmers' market, 8, 12, 54, 58-60Farming
distinction between agribusiness and, 16economic crisis affecting, 17improvements in techniques, 21metropolitan, 33
Farmland development right, 75-76Farmland protection, 9, 38, 70
agricultural tax programs, 73-75conservation easements, 75-76
120 Urban and Agricultural Communities: Opportunities for Common Ground
effect of policies on, 89incentive programs, 72-73private land trusts, 77purchase of development rights, 75-76regulatory programs, 71-72in research, 88-89right-to-farm laws, 76transfer of development rights, 76-77
Farmland Protection Policy Act (1981), 9, 71Farmland Protection Program (FPP), 71Farm population, 21
historical patterns of size of, 95Farms
acreage in, 21adaptive, 56, 57, 109average size in acres, 103changes in definitions of, 18-19definition of, 19nentrepreneurial, 54, 55-58historical patterns of number of, 96livestock and poultry sales for, 106mean size of, 23percentage of county acres in, 102recreational, 56-57, 110sod, 44subsidy payments for, 81tenant, 19ntotal gross sales for, 104traditional, 56, 57, 110value of crop sales for, 105
Farms for the Future Act, 71Farm-to-school programs, 61Farm-to-table programs, 54, 60-61Federal Farmland Protection Program, 82Fertility, 8Fertilization, 45Filtration systems for surface waters, 27Financial incentives in comprehensive planning, 80Firewood, 63Fish and Wildlife Service, 63Fisheries industry, employment in, 98, 100Fixed area-based allowance zoning, 72, 73Floral product wholesalers, 45-46Floriculture producers, locations and total production areas of, 107Flower Fields, 65Flower gardening, 64Flowering plants, potted, 42Flowers, cut, 42, 43, 45-46Foliage plants, 42, 44
interiorscapes and, 44-45Food and Drug Administration, 90Food and fiber production, 81Food and plant gathering, 26Food buying clubs, 54Food policy councils (FPCs), 82, 109Food production, 25Food systems, 109
access and advocacy, 82converting and revitalizing vacant or underused urban lands, 83learning projects, 84localized economic and community benefits, 82-83policies, 10public policy on, 82-83security and nutrition, 83
Forestry, 26, 48employment in, 99, 100
Forming alliances, 564-H Club, 854-H horticulture, 64Franklin, Benjamin, 7, 15Fresh Aire Farms, 30FreshMarket Aquafarm, 47Friends of Holcomb Farm Estate, 55Funding
in comprehensive planning, 80strategies in partnerships and collaboration, 92-93
Future Farmers of America (FFA), 85
G
Garden centers, 43Gardening, 8, 62
container, 63flower, 64herb, 63supplies for, 63
Gardensbotanical, 8-9, 65-66community, 8, 12, 39, 51entrepreneurial food gardens, 54, 55-58public, 65-66sculpture, 65
Geological Survey's National Water Quality Assessment Program,35
Goldsmith Rural Modification scheme, 19nGolf courses, 29, 37, 62Golfing, 8, 66-67Government agencies in partnerships and collaboration, 90, 91Government-related obstacles, 39Graf Growers, 63Grain sales, 24Grass seed production, 44Greatscapes, 64Greenbelts, 29, 80Greenhouse crop production, 42-43Greenhouses, 19nGreen industry, 41-46, 58, 109
indirect economic benefits of, 44total grower receipts for crops, 42touring businesses, 64-65
Groundwater contamination, 28Groundwater recharge, 27, 81Growth, managing, 34-35Gypsy moths, 37
H
Habitat modification, 47Hamilton, Alexander, 25Hartford Food System (HFS), 55Herb gardening, 63Higher and better uses, 39Higher education. See also Land-grant universities (LGUs)
bridge building, 85building entrepreneurial capacity, 85college and university curricula, 83-84initiatives in, 2, 10internal planning and organization, 85
Index 121
outreach and extension, 84-85in partnerships and collaboration, 90professional development, 85public education and promotion, 85public policy on, 83-85
Highway medians, vegetation controls on, 28Hiking, 8, 62Hispanics, 22, 23Holiday decorating, 45Home improvement centers, 43Homestead Act, 7, 15Horticultural therapy, 12, 49-50Horticultural tourism, 64-67Horticulture, 26, 38, 48
consumer, 63-64environmental, 41-46, 1094-H, 64ornamental, 41-46
Human and community health, 12Human-animal interactions, 49Human capital development, 10
public policy on, 83Human-companion animal relationships, 48Human-plant interactions, 49
I
Immigrant populations, 4, 12Immunization effect, 50Impermanence syndrome, 76, 109Incentive programs, 2, 9, 72-73Individual health and well-being, 1, 48-51Individual health care services, 87Indoor-outdoor air quality, 36Insect management, 36-38Insect rearing, 26Integration
long-term rural-urban resources, in comprehensive planning, 80of policy tools, 88-89
Intergenerational equity, 14Interiorscapes, production of foliage plants for, 44Internal planning and organization in higher education, 85Irrigated parks, 29Irrigation water, storage sites for, 27
J
Japanese beetles, 37Jefferson, Thomas, 7, 15, 24, 25Just compensation, 70
K
Kellogg Commission on the Future of State and Land Grant Uni-versities, 90
Kellogg Foundation, 85, 90Kerr Foundation, 90
L
Labeling, 57Land areas, conserving and revitalizing, 38-40Land conservation, 38Land fragmentation, 81Land-grant universities (LGUs), 3, 11, 15, 64, 81, 83, 84, 90. See
also Higher education
agricultural colleges in, 41in strengthening community vitality, 17turfgrass and, 66-67
Land management, public interest in, 1Land protection initiatives, 70-71Landscape and energy modifications, 35-36Landscape architects, 49-50Landscape design, 8
installation, and maintenance, 43-44Landscapes, 29
influence on real estate values, 44Land Trust Alliance, 90Land use, 10
analysis of alternative instruments, 81analysis of real local decision processes, 82conversion data needs, 82decision making, 82fragmentation, 89planning, 27, 80public policy on, 81-82roles for government and higher education, 82
Large lot zoning, 72Large minimum lot size zoning, 72, 73Lawn and garden retail businesses, top ten United States, 107Lawn clippings, 37Leapfrog development, 89Leased hunting, 63Lewis and Clark Expedition, 25Lincoln, Abraham, 24Livestock sales, 24, 103Living Machines, 29-30, 109Localized economic and community benefits in food systems, 82-
83Louisiana Purchase, 25Lyme disease, 37, 38
M
Major land resource areas (MLRAs), 68M and M Hunting Lodge, 63Master Composters, 85, 91Master Gardeners (MGs), 64, 85, 91Mechanical equipment, development and manufacture of, 4Metropolitan, 20Metropolitan area (MA), 19, 19n, 20n
continued growth of, 22standard definitions of, 20n
Metropolitan counties, agricultural jobs in, 23Metropolitan farming, 33Metropolitan statistical area, 20-21Migration, 4, 12, 22Minority populations, growth of, 22Modern agriculture, 109Money, 12-13Mosquitoes, 37Mott Foundation, 90
N
National Association of Counties, 85, 90National Association of Towns and Townships, 85, 90National Governors Association, 85, 90National Institutes of Health, 90National League of Cities, 85, 90National Science Foundation, 90
122 Urban and Agricultural Communities: Opportunities for Common Ground
Natural areas, 27Natural resource management, 87Natural Resources Conservation Service (NRCS), 71, 81Neglected sites, 38Neutraceuticals, 87New York City Watershed Protection Programs, 91Noble Foundation, 90Noise pollution, 34Nonexclusive ordinance, 72NonHispanic blacks, 22, 23Nonmetropolitan area, 19Nonmetropolitan county, 20, 21Nonmetropolitan population, growth in, 22Nonprofit organizations in partnerships and collaboration, 90, 91North American Plant Collections Consortium, 66Northeast Regional Center for Rural Development, 88Nursery crop production, 42-43Nursery services, 8Nursery stock, 43
O
Oklahoma Cooperative Extension, 64Oklahoma Gardening, 64On-farm recreation and entertainment farming, 62-63Open space conservation, 9Open space lands, 27, 68Organic Foods Production Act (1990), 57Organic production systems, 57Ornamental horticulture, 41-46Outdoor spaces, design and maintenance of, 52Outreach and extension in higher education, 84-85
P
Parkscity-managed, 39irrigated, 29public, 8
Partnerships and collaboration, 89-93community food systems, 91community greening partnerships between urban and rural
areas, 91cooperative extension, 91-92experiential learning, 92funding strategies, 92-93government, nonprofit organizations, and community, 91government agencies, 90higher education, 90initiatives in, 2-3, 11nonprofit organizations and other associations, 90private sector firms, 90-91watershed protection, 91wildlife and recreation area, 91
Perception-related obstacles, 40Perdue Farms, Inc., 30Perennials, 63Pesticide
applications, 45fertilizer use and, 8, 27nutrient runoff and, 28use, 13
Pest management, 10, 87Phytoremediation, 8, 27, 31-32, 109
Planning and revitalization, 1agriculture's service role in, 33-40
Planning process, merging interests of stakeholders in, 40Plant adaptability and production systems, 10, 86Plants
agricultural functions performed by, 35bedding, 43common interior, 36engineering functions performed by, 35foliage, 42, 44-45human interactions with, 49installations, 8pathology, 37, 38potted, 42potted flowering, 42rotations, 44-45spacing, 35utilitarian purposes of, 35
Poinsettias, 63, 65Police powers, 69-70Policy
institutional dimensions of urban agriculture and, 1, 9-10, 68-77
new tools, 89setting, 69-70
Pollution, 14air, 34bacterial water, 38biological, 47chemical, 47noise, 34
Pollution abatement, 27Pollution control, 27Population
by ethnicity, 97farm, 21growth, 1
Potted flowering plants, 42Potted plants, 43Poultry product sales, 24Poultry sales, 24, 106Power, 12Preservation, 4, 15Prime agricultural land, 34Private land trusts, 2, 10, 77Private sector firms in partnerships and collaboration, 90-91Problem clarification, 88Procedural obstacles, 39Professional development in higher education, 85Property taxes, 69Pruning, 45Public education and promotion in higher education, 85Public gardens, 65-66
outreach activities and educational programs, 66Public housing neighborhoods, planted landscapes in, 51-52Public parks, 8Public policy, 81
on food systems, 82-83on higher education, 83-85on human capital development, 83initiatives in, 2, 10on land use, 81-82
Public preferences and values, 88Public services for residential development, 33
Index 123
Public support in comprehensive planning, 80Purchase of Agricultural Conservation Easements (PACE), 9-10,
76, 109benefits, 74drawbacks, 74
Purchase of development rights (PDR), 2, 9, 34, 71, 75-76, 89, 109
Q
Quality-of-life amenities, 25
R
Railroads, 7, 15Real estate values, landscapes influence on, 44Recharge areas for aquifers, 27Recreational farms, 56-57, 110Recreational pursuits, 25Recreation and leisure, 1, 8-9, 62-67Recycled wastewater, 54Recycling, waste, 30-31Regulatory programs, 1, 9-10, 71-72Remediation of brownfields, 25, 31-32Research, 85-89
entrepreneurial products, 87farmland protection, 88-89initiatives in, 2, 10-11pest management, 87plant adaptability and production systems, 86social and economic dimensions, 87-88urban soils, 86water management, 86-87
Residential development, public services for, 33Restoration and remediation, 1
agroecosystem services for, 27-28Retail garden centers and nurseries, 43Right-to-farm laws, 2, 9, 76, 110
benefits, 75drawbacks, 75
Roadside stand operations, 54Roosevelt, Theodore, 24Rural, relevance for community life, 19Rural communities, survival of, 78-79Rural frontiers, 19Rural myth, 16Rural people, lifestyles of, 5, 13Rural sociology, 38Rural-urban agriculture, 23-24Rural-urban agroecosystem, 4, 13-14, 78, 110
common problems and impacts on, 79defined, 5ultimate goal of, 14
Rural-Urban Continuum Codes, 19n, 20
S
Santa Ana National Wildlife Refuge, 63Scenic vistas, 81Schools, 29Sculpture gardens, 65Security and nutrition in food systems, 83Sedentary life style, 50-51Sedimentation/filtration systems, 28
Seed production, 58Self-sufficiency index, 56, 110Sensory stimulation and reminiscence, 50Service role, of agriculture in urbanizing society, 8, 27-32Sharecroppers, 19nSharers, 55Sick building syndrome, 36Sierra Club, 90Site-related obstacles, 39Site remediation, 27, 87Sliding scale area-based allowance zoning, 72, 73Smart growth programs, 9, 34, 107Social and economic dimensions in research, 87-88Social networks, 26Sociology, 48Sod, 44Sod farms, 44Soil
erosion, 27, 28fertility, 27retention, 8
Spadra Landfill, 29Sports, 66-67Sprawl, 9, 14, 34, 68, 110
common characteristics of, 33Stahlbush Island Farms, 57-58Stakeholders, merging interests of, in planning process, 40Standard metropolitan statistical area (SMSA), 20nSteamboat Landing, 60Storm water management, 8, 27-28Subsurface water flow, 27Suburban, 18Sustainable agriculture, 14Swank Program in Rural-Urban Policy, 88
T
Takings, 70Tax abatements, 12Tax credit programs, 74Teikei movements in Japan, 55Temporary use, 39Tenant farms, 19nTherapeutic riding, 12Total crop sales, 24Tourism, 8-9
attractions in, 62horticultural, 64-67
Toxic dumps, 38Traditional farms, 56, 57, 110Traffic calming, 52, 107Traffic congestion, 68Transfer of development rights (TDR), 2, 9, 34, 34n, 76-77, 110
benefits, 75drawbacks, 75
Transpirational cooling, 36Transportation industry, 15Transportation systems, 26Tree festivals, 64Trust for Public Lands, 90Trusts, private land, 77Turfgrass, 66-67
production and management, 44Tyson Foods, 30
124 Urban and Agricultural Communities: Opportunities for Common Ground
U
United Nation's Food and Agricultural Organization, 19nU.S. agricultural census, 18U.S. Golf Association, 91Universities. See Higher education; Land-grant universities (LGUs)U-pick operations, 54, 57Urban
defined, 19nliberal use of term, 19
Urban agriculture, 12, 110cross-cutting dimensions of, 17defined, 5-6, 14new visions for, 2-3, 10-11, 78-94policy and institutional dimensions of, 9-10, 68-77scope of, 7-8, 25-26as underrecognized component of, 15-16
Urban built-up areas, 19-20Urban edge, 18Urban entomology, 37Urban food systems, 54Urban fringe, 19nUrban growth, 12
boundaries of, 34Urban-influenced, 25, 110Urban-influenced counties, 8Urban Influences Codes, 19nUrbanization, agriculture's contributions to, 1Urbanizing society
agriculture's benefits to, 8agriculture's business contributions to, 41-47agriculture's service role in, 27-32
Urban Land Institute, 85, 90Urban people, lifestyles of, 5, 13Urban plant communities, 51Urban Resource Partnership (URP), 91Urban society, role of agriculture in, 1, 4Urban soils, 10
in research, 86Urban sprawl, reusing brownfields and, 32Urban tree-planting programs, 51
V
Vacant lands, 38Vegetation controls, on highway medians, 28Vegetation strips, 28Vegetative cover, failure to maintain, 28Veterinary immunodiagnostics sector, 46
Veterinary medicine, 38, 48Virginia Cooperative Extension Master Gardeners, 64
W
Wal-Mech Farm Bed and Breakfast, 63Waste disposal, 28Waste recycling, 8, 27, 30-31Waste utilization, 87Wastewater reclamation, 28-32Wastewater remediation, 8, 27Water availability, 14Water management, 10, 86-87Water pollution, bacterial, 38Water remediation, 28-32Water reuse, 27, 110Watershed protection, 11
in partnerships and collaboration, 91Wetlands, constructed, 29Wildlife and recreation area in partnerships and collaboration, 91Wildlife habitat, 11, 25, 81Wildlife management, 36-38, 37Wildlife viewing, 8, 62Wire service delivery, 45-46Women Infants and Children (WIC)
coupon programs, 58-59Farmers' Market Nutrition Program, 60
World Resources Institute (WRI), 19n
Y
Youth education, 64
Z
Zone of hunters, 16Zone of intensive agriculture, 16Zone of livestock and lumber production, 16Zoning, 10, 69-70
agricultural protection, 1, 9, 72, 73, 74, 109area-based allowance, 72, 73large lot, 72large minimum lot size, 72, 73laws on, 72, 110sliding scale area-based allowance, 72, 73
Zoning amendments, 82Zoning ordinances, 71-72Zoos, 8, 65-66


![WELCOME [prod-media.coolaustralia.org]...urban communities, and creating unforgettable moments for families. The Royal Agricultural Society of Victoria looks forward to welcoming you](https://img.pdfslide.us/doc/110x75/60b05f7b50e2f550a9645da3/welcome-prod-media-urban-communities-and-creating-unforgettable-moments.jpg)