Embed Size (px)
Citation preview
EEA Monograph
Assessment and Management of
Urban Air Qualityin Europe
no. 5
The management of air quality is a complex task consisting of
assessing the situation including monotoring and the appropri-
ate usage of data, existence of a legislative framwork allowing
the control of emissions and, enforcement of such legislation in
situations where air quality standards or objectives are not
being achived. The aim of the monograph is to give a compre-
hensive overview of the situation in European cities. A short
introduction into general air pollution problems is followed by a
summary of air quality guidelines and monitoring and data
assessment techniques frequently employed. The air quality
monitoring and management capability of 72 major urban
agglomerations within 32 countries is assessed on a city by city
basis. A further analysis of 10 detailed case studies into the
relative importance of key factors such as climate, economic,
topographic and demographic viewpoints is conducted and
recommendations on how to improve air quality conditions
most efficiently are suggested.
Preface ix
1 Introduction, Data and Information Sources 1Urban Air Quality: Importance of the Issue 1Air Quality in European Cities and their
Monitoring and Management Capabilities 2Ambient Air Pollutants 3Area of Investigation, Sources of Data and Information 4Overview and Report Structure 8
2 Understanding Urban Air Pollution Problems -Sources, Impact and Control Strategies 11
Emissions to Urban Air 11Emissions from Mobile Sources 12Emissions from Stationary Sources 14Urban Air Pollutant Concentrations 14Impacts of Urban Air Pollution 15Current Control Strategies 16
3 Air Quality Standards and Guidelines 19Formulation of Air Quality Standards 19
4 Urban Air Quality Monitoring and Assessment 25Design of Air Quality Monitoring Networks 25Current State of European Air Quality Monitoring Information and Exchange 26
Monitoring Development - An Example: Suspended Particulate Matter 28
5 Analysis of Local Impacts on Air Quality 29The City and Its Population 30Environmental Indicators 30Climate and Meteorology 31The Average Dispersion Index 33Emission Indices 35
Relevant Pollutants 35Occurrence of Emission Source Classes 36
Emission Control Strategies 38Development and Use of Smog Potential Indices 38
iii
Contents
Meteorological Winter Smog Potential Index 39Meteorological Summer Smog Potential Index 41
Index Performance 41Case Studies 42
Barcelona 43Belfast 44Bucharest 44Gothenburg 45Hannover 46Lisbon 46Paris 47Rome 47Vienna 48Warsaw 49
6 Long-Range Transboundary Air Pollution in Europe 51International Initiatives 52Acid Deposition 53Photochemical Smog Episodes - Summer Smog 56
Assessment of Summer Smog Occurrences 56Winter Smog 58
Assessment of Winter Smog Occurrence 59Control of Transboundary Air Pollution 60
7 Urban Air Quality in Europe 63Underlying Aspects 63
Data Availability 65Traditional Air Pollutants - Current Concentrations and Trends 66
Sulphur Dioxide 66Particulate Matter 68Oxides of Nitrogen 72Carbon Monoxide 72Airborne Lead 74Volatile Organic Compounds 76
Ozone 77Hazardous Air Pollutants 79
8 Exposure Assessment 81Public Health Effects 82
Epidemiological Studies 82Findings of Past Research 83Estimation of Urban Population Exposure 84
Ecosystems 90Terrestrial Biotopes 92Aquatic Biotopes 92
Materials 95Research Findings 96
9 Urban Air Quality Management 97Indicators of Air Quality Management Capabilities 98Evaluation of the Management and Assessment Capabilities Survey 100
Air Quality Measurement Capacity Index 100Data Assessment and Availability Index 102Emissions Estimates Index 104Management Enabling Capabilities Index 106Air Quality Management and Assessment Capabilities Index 108
iv
Contents
Case Studies 109Barcelona 109Belfast 113Bucharest 113Gothenburg 114Hannover 115Lisbon 115Paris 116Rome 117Vienna 117Warsaw 118
Air Quality Modelling 119
10 The Way Forward 121Air Quality Management in an Overall European Pollution Control Context 121Management Objectives 122Air Quality Management - Questions and Data Requirements 122Urban Air Quality Problems - Present and Future 123Air Quality Monitoring and Assessment Capability 124Recommendations for The Future 126
References 127
AppendicesAppendix 1 - The Questionnaire for the Air Quality Assessment
and Management Capability Survey 131Appendix 2 - Population Location, Area and Population Density for Cities 137Appendix 3 - The Vehicle Emission Index calculated for the
Investigated Cities 139
List of Maps, Tables and Figures
Maps1.1 Geographic region and European countries included in the report 51.2 Distribution of the cities investigated numbered in alphabetical order 6
4.1 Monitoring techniques used by investigated cities for particulate matter 27
5.1 Distribution map of cities showing population density classes 325.2 Average Dispersion Index for investigated cities 345.3 Winter Smog Emission Index for investigated cities 365.4 Summer Smog Emission Index for investigated cities 375.5 Meteorological Winter Smog Potential for investigated cities 395.6 Meteorological Summer Smog Potential for investigated cities 40
6.1 Frequency of summer smog conditions with exceedance of O3guidelines for city background levels 58
6.2 Occurrence of winter smog conditions and the reported exceedancelevels of Air Quality Guidelines for SO2 59
7.1 Kerbside monitoring programmes for air pollutant compounds in theinvestigated cities 64
7.2 Annual average SO2 concentration reported by investigated citiesin recent years 67
7.3 Trends in annual average SO2 concentration reported byinvestigated cities in recent years 69
v
Contents
7.4 Annual average particulate matter concentration reported by investigatedcities in recent years 70
7.5 Trends in annual average particulate matter concentration reportedby investigated cities 71
7.6 Annual average NO2 concentration reported by investigated citiesin recent years 73
7.7 Trends in annual average NO2 concentration reported by investigatedcities in recent years 74
7.8 Urban CO concentration reported by investigated cities in recent years 757.9 Annual average lead concentration reported by investigated cities
in recent years 767.10 1 hour maximum O3 concentration reported by investigated
cities in recent years 78
8.1 Proportion of urban populations exposed to SO2 concentrations> 125 (µg/m3) 85
8.2 Proportion of urban populations exposed to particulate matterconcentrations > 120/180 (µg/m3) 86
8.3 Proportion of urban populations exposed to NO2 concentrations>200 (µg/m3) 87
8.4 Proportion of urban populations exposed to CO concentrations>10/30 (mg/m3) 88
8.5 Proportion of urban populations exposed to O3 concentrations> 180/270 (µg/m3) 89
9.1 Response of investigated cities to the Questionnaire on Air QualityAssessment and Management Capability 101
9.2 Measurement Capacity Index for investigated cities 1039.3 Data Assessment and Availability Index for investigated cities 1049.4 Emissions Estimates Index for investigated cities 1059.5 Air Quality Management Capability Index for investigated cities 1079.6 Overall Air Quality Assessment and Management Capability of
investigated cities 112
Tables1.1 Countries and cities investigated 71.2 Europe’s four regions and constituent countries as used
in this Report 8
2.1 Total estimated emissions of SO2, NOx, CO and NMVOC and the% contribution of each Main Source Category (SNAP Level 1)(CORINAIR í90, 1996) 12
2.2 Detailed emission inventories for four European cities 13
3.1 Acute, chronic and toxic health effects of common air pollutants 203.2 WHO Air Quality Guidelines for Europe 1987 and the 1996 update
(WHO, 1987, WHO, 1995c,d) 213.3 EC Limit and Guideline values for SO2 and suspended particulates
(EC Directive 80/779/EEC) 223.4 EC Limit and Guideline values for NO2 (EC Directive 85/203/EEC)
and lead in air (EC Directive 82/884/EEC) 223.5 EC Threshold concentrations for O3 (EC Directive 92/72/EEC) 233.6 Examples of CO guidelines in Europe 23
5.1 Description and calculation of Index classes (after RIVM, 1995a) 315.2 Topographical Siting Index (after RIVM, 1995a) 33
vi
Contents
5.3 Expected effects of siting on dispersion characteristics (RIVM, 1995a) 355.4 Summary of Index results for the 10 case study cities 43
6.1 EU Air Pollutant Emission Reduction Targets (COM (95) 624, 1995) 566.2 Comparison of total emissions in the CORINAIR‘90 and ‘94 Inventories
of the EU 15 countries (EEA Newsletter 9) 566.3 Reported exceedances of ozone guideline values in the
Czech Republic 576.4 Examples of pollutant concentrations (µg/m3) which trigger
smog warnings 60
8.1 Percentage of city population exposed to elevated NO2concentrations in cities with data after 1985 (WHO, 1995a) 84
8.2 Comparison of exposure estimates for NO2 (WHO, 1995a) 918.3 Comparison of exposure estimates for SO2 (WHO, 1995a, RIVM,
1995a) 918.4 Comparison of exposure estimates for particulate matter (WHO,
1995a, RIVM, 1995a) 918.5 Materials and pollutants investigated in the ICP (Kucera and Fitz,
1995) 96
9.1 Bandings of individual and overall Index scores (WHO/UNEP, 1996) 1009.2 Atmospheric models (Moussiopoulos, 1996) 119
Figures1.1 Traditional air pollutants and their major emission sources 3
2.1 Key factors which influence emissions from combustion processes 132.2 Proportion of traffic emissions for NOx and CO in four cities 142.3 Estimated annual mean CO and NOx concentrations for the UK
in 1991 (AEAT, 1996) 152.4 Possible approaches towards emission reduction 18
5.1 Distribution of population size and area of investigated cities 305.2 Distribution of city population densities in five classes 31
6.1 Chemical composition of particulates (EPAQS, 1995) 536.2 Physical composition of particulates (UNEP/WHO, 1994b) 536.3 Short-term smog management measures 536.4 Exceedance of critical loads for acid deposition (RIVM/CCE, 1995) 556.5 Large sulphur-emitting point sources in Europe (Barrett and
Protheroe, 1995) 556.6 The Black Triangle (Budnikowski in Pape, 1995) 556.7 Concentrations of ozone in Austria at 13.00 and 16.00 hours on
22nd August 1996 566.8 Result of ozone concentration prediction for the UK on 4th May1995
using a trajectory model 57
7.1 1 hour CO concentrations at three different sites in Athens 657.2 Concentrations of SO2 at three different sites in Athens 657.3 Comparison of 1 hour and 8 hour means for CO concentration in
Patission (Athens) 657.4 Air pollution data availability per % of population 667.5 Air pollution data availability per number of cities 667.6 Mapping of annual mean and P95 daily concentrations of
particulate matter in Prague in 1994 68
vii
Contents
7.7 Mapping of annual mean and P95 daily concentrations of SO2in Prague in 1994 68
7.8 Pollution trends in Krakow (VIEPC, 1996) 687.9 Comparison of benzene concentrations in three cities 777.10 Seasonal and diurnal variations of ozone in Brussels (APIS, 1996) 777.11 Average concentration of cadmium and nickel in three UK cities
1984-1993 (DoE, 1995) 797.12 Curly Kale - Biomonitoring Network in Berlin (UISonline, 1996) 79
8.1 Types of assessment conducted in European cities to determineair quality impacts on public health 83
8.2 Proportion of population for which there is available data onpollution exposure, and the percentage of this group exposedto pollutant concentrations exceeding short-term guideline values 90
8.3 Proportion of population for which there is available data onpollution exposure, and the percentage of this group exposedto pollutant concentrations exceeding long-term guideline values 90
8.4 Forest condition in Europe (EC-UN/ECE, 1996) 938.5 Zones with potential and observed freshwater acidification (Kristensen
and Hansen, 1995) 94
9.1 Air quality management cycle (After UNEP/WHO, 1996) 989.2 Fundamental capabilities required for successful air quality
management 999.3 Questionnaire reply rate and average score by region 1029.4 Apportion of index bandings for measurement capacity 1029.5 Apportion of index bandings for data assessment and availability 1039.6 Apportion of index bandings for emissions estimates 1069.7 Apportion of index bandings for management capability 1069.8 Apportion of index bandings to overall Air Quality Assessment
and Management Capabilities Index score 1089.9 Average contribution of each indicator to overall score 1089.10 Scores for investigated cities for Index components and
overall capability 1109.11 Distribution of overall Air Quality Assessment and Management
Capabilities Index score by region 1099.12 Example of NOx forecast for Gothenburg 1149.13 Application by cities of air quality models with emission and/or
meteorological data 120
Photograph credits
All photographs supplied by Environmental Images Ltd., London,except p72 (Image Factory Group, Guildford).
viii
Contents
This report provides an overview of the state of air pollution in major European cities
with populations in excess of half a million. Air pollution is a feature of life across
Europe, where over 70% of the population live in urban agglomerations. Many air pollu-
tion studies have addressed issues at a global level, in particular in relation to climate
change, and at regional level, with particular respect to transboundary delivery of acid
rain from industrialised areas. However, it is increasingly recognised that population
exposure to air pollutants is largely dependent on city-generated air pollution.
Therefore, the detailed examination of air quality in European cities presented here is
both relevant and timely.
In this report, each city is examined in terms of its potential for air pollution problems.
This is partly related to the topography and climate of the city, which may predispose it
to the build-up of pollutants at particular times of the year, leading to summer or winter
smogs. The nature and amount of pollutant emission in a city depends on the popula-
tion size, level of industrial activity, traffic density, and the mode and extent of domestic
heating and air conditioning use. Thus, in some cities, the dependence on sulphur-rich
fuels causes substantial risks of winter smogs. If the emission levels and topographic
predisposition for smog-forming conditions are compared with known exceedances of
mandatory and guideline health limits, estimates can then be provided of population
exposure. From these, it can be seen that nearly all the cities under consideration in this
report pose an air pollution health threat to at least some of their citizens; in some cases
over two-thirds of the population may be exposed to unacceptable pollutant levels.
Examination of trends in reported data over the years shows that the issue is not static
but developing on many fronts. For example, the removal of lead in petrol has greatly
reduced the threat of lead toxicity in most cities, although in some an ageing vehicle fleet
and the introduction only recently of lead-free petrol means that there is still some way
to go. Many cities have reduced dependence on coal as a domestic fuel and have intro-
duced high stacks for power generation plants; this has lead to a reduction in city levels
of particulates and SO2, although it has increased the risk of transboundary pollution. On
the other hand, increasing vehicular emissions of NOx and secondary vehicular pollu-
tants, such as ozone, continue to cause growing concern in many cities.
ix
P re f a c e
The capability of Europe’s cities to manage the air pollution situation is an essential
requirement for its control. A unique feature of this report is the assessment, through
questionnaires, of air quality management capability in terms of measurement capacity,
assessment capacity, data availability, emission estimation, legislation and the imple-
mentation of control measures. The report’s results show the considerable variations in
management policy and highlight individual cities’ strengths and weaknesses within the
various components of management capability.
This review concludes that there is capacity for improvement in air pollution manage-
ment in all of the investigated cities. The report identifies a number of needs which
would assist this process – for example, greater harmonisation of measurement and
reporting methods, and greater information delivery to populations exposed to health
risks during peak air pollution periods. The European Environment Agency, who com-
missioned this report, are playing an active role in bringing countries and cities together
in order to exchange information and discuss the way forward to providing healthy and
sustainable cities into the next millennium. The concept of sustainable healthy cities
was recognised at the Rio summit and, through Agenda 21, made a priority environmen-
tal issue for the future in both Europe and the developing world. It is hoped that by
highlighting the European experience, this report will generate management ideas and
options world-wide.
This report was prepared by the Monitoring and Assessment Research Centre (MARC), King’sCollege London, and the views expressed herein are the sole responsibility of MARC and are notnecessarily those of the European Commission or the European Environment Agency.
A c k n o w l e d g e m e n t s
This report has been written by Dorothee Richter and W. Peter Williams of MARC. However, thereport could not have been prepared without the immense help that was received from respon-dents, too numerous to name individually, from the participating cities. However, special mentionis due to Darius Krochmal who helped co-ordinate the Polish city responses and provided muchuseful information on air quality in Polish cities. In addition, a great deal of data was provided bythe European Topic Centre - Air Quality and particular thanks are due to Rob Sluyter and HansEeerens who offered unstinting assistance throughout. We are also grateful to European NationalFocal Points where they have provided information or contacts. At King’s College, we should like toacknowledge the assistance of MARC staff, particularly Fiona Preston for secretarial and proofreading assistance and Roma Beaumont from the Geography Department for assistance in theproduction of maps. We are also grateful to the EEA for entrusting us with the project and, in par-ticular, to Mr. D. Stanners and Mr. G. Kielland who have provided constructive advice and criticalappraisal throughout.
x
Over the last few decades the state of the globalenvironment has become an issue of major
concern. All three environmental media – air,water and land – have suffered pollution caused byhuman activity, and in addition, a wide variety ofnatural processes can influence environmentalquality significantly. Although humans have alwayshad an impact on their surroundings, the deterio-ration of the environment has drastically acceler-ated recently, due to rapid population growth anddevelopment. Problems have become especiallyapparent in densely populated areas, such asEurope, and in urban areas in particular. Since wehave no choice but to breathe the air surroundingus, air quality is an important issue for the wholepopulation. A variety of guidelines and standards,suggesting upper limits of pollutant concentrationsin ambient air, have been developed to protecthuman health and the environment from adverseeffects. Where these levels are breached, negativeconsequences must be expected, the extent ofwhich depend on the level and the duration ofe x c e e d a n c e .
Urban Air Quality – Importance of the Issue
Atmospheric pollution can be investigated on dif-ferent spatial and temporal scales. On the macro-scale, global problems of importance are thedepletion of the stratospheric ozone layer andglobal warming, which is caused by the emissionand accumulation of greenhouse gases in theatmosphere. The meso-scale includes regional and
Chapter 1
I n t roduction, Data andI n f o rmation Sourc e s
1
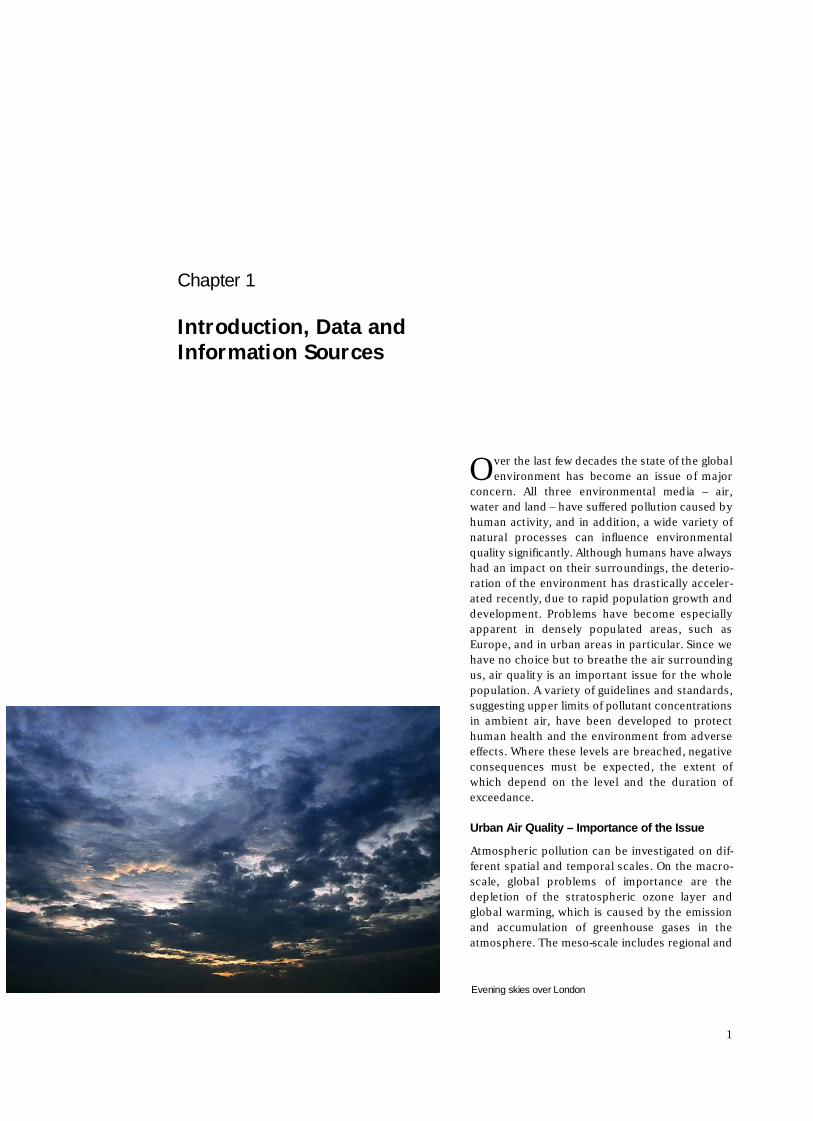
Evening skies over London
local air quality and pollution. On a regional scale,the transboundary transport of pollutants can beresponsible for acid deposition or the formation ofphotochemical smog. Air quality on a local andurban scale is closely related to emissions arisingfrom almost all human activities, and to local char-acteristics such as topography, climate and alsoeconomy. Aspects of air quality investigated on amicro-scale include studies on emissions from asingle point source, indoor pollution from oil orwood burning stoves, or the dispersion of pollu-tants in a street canyon.
More than 70% of the European population,which will grow to about 523 million by the year2000, live in urban areas (UNEP, 1993). They areoften exposed to elevated levels of air pollutants,predominantly emitted from a variety of sourcesconcentrated in the city; the most important ofthese are usually road traffic, domestic dwellings,industrial facilities and power generation plants.Besides the emissions generated within the citylimits, transboundary transport of pollutants cancause elevated concentrations, but almost allurban agglomerations are net emitters. Thus citiesare liable to have a detrimental effect on the airquality in surrounding areas, particularly down-wind from the centre in the so-called city plume.
Many epidemiological investigations havedemonstrated that the exposure of the populationto air pollution causes adverse health effects,which can be divided into acute or chronic effects.The level of impact will depend on the durationand level of exposure. Recent studies have sug-gested that even pollution concentrations aroundand below levels generally considered safe accord-ing to current guidelines and standards might posea risk to human health (Katsouyanni et al., 1995).Thus urban populations are likely to suffer fromair pollution and certain groups of i n d i v i d u a l s
such as children, asthmatics and elderly peoplewill be particularly vulnerable. Furthermore, manypollutants affect the vegetation in and around thecity as well as building materials and monuments,exacerbating the deterioration of structures andcultural heritage.
On several occasions episodes of poor airquality have caused high numbers of additionaldeaths, which have been directly related to the ele-vated concentrations of certain pollutants in theurban air. The best known tragic example is proba-bly that of the so-called London pea-soup fogs,which occurred in December 1952 and wereresponsible for nearly 4,000 premature deaths.These Londoners were killed by breathing air con-taining extraordinarily high concentrations ofblack smoke and sulphur dioxide (SO2) trappedover the city during a persistent temperatureinversion, a weather condition where warm air isblanketed by a layer of cold air and whereextremely little movement of air masses occurs;this leads to an accumulation of pollutants asthere is no dispersion and dilution (Box 5).
As will be described later in this report, themajority of cities investigated still have incidencesof poor air quality where EU or WHO Air QualityGuidelines are exceeded for one or more air qual-ity pollutants, and where large proportions of theurban community are exposed. For some pollu-tants, particularly those associated with traffic, lev-els are increasing in many cities and thus airpollution will continue to be a major health issueinto the foreseeable future.
Air Quality in European Cities and TheirMonitoring and Management Capabilities
The aim of this report on Urban Air Quality is togive a comprehensive overview of the situation inEuropean cities. This will be achieved by reportingcurrent concentrations of major pollutants and byconsidering the various factors which have animpact on air quality. Analysis of trends and pre-dictions of future air quality, as well as an estima-tion of the impacts of air pollution, are otherimportant aspects of this report. Additionally, theair quality monitoring and management capabilityof all major urban agglomerations in Europe isassessed on a city-by-city basis. To enable the for-mulation of recommendations on how to developand improve management strategies, and thus airquality in the short and long term, the differentcomponents of monitoring and management capa-bilities are assessed.
The management of air quality is a complextask consisting of several elements which are:
Introduction, Data and Information Sources
2
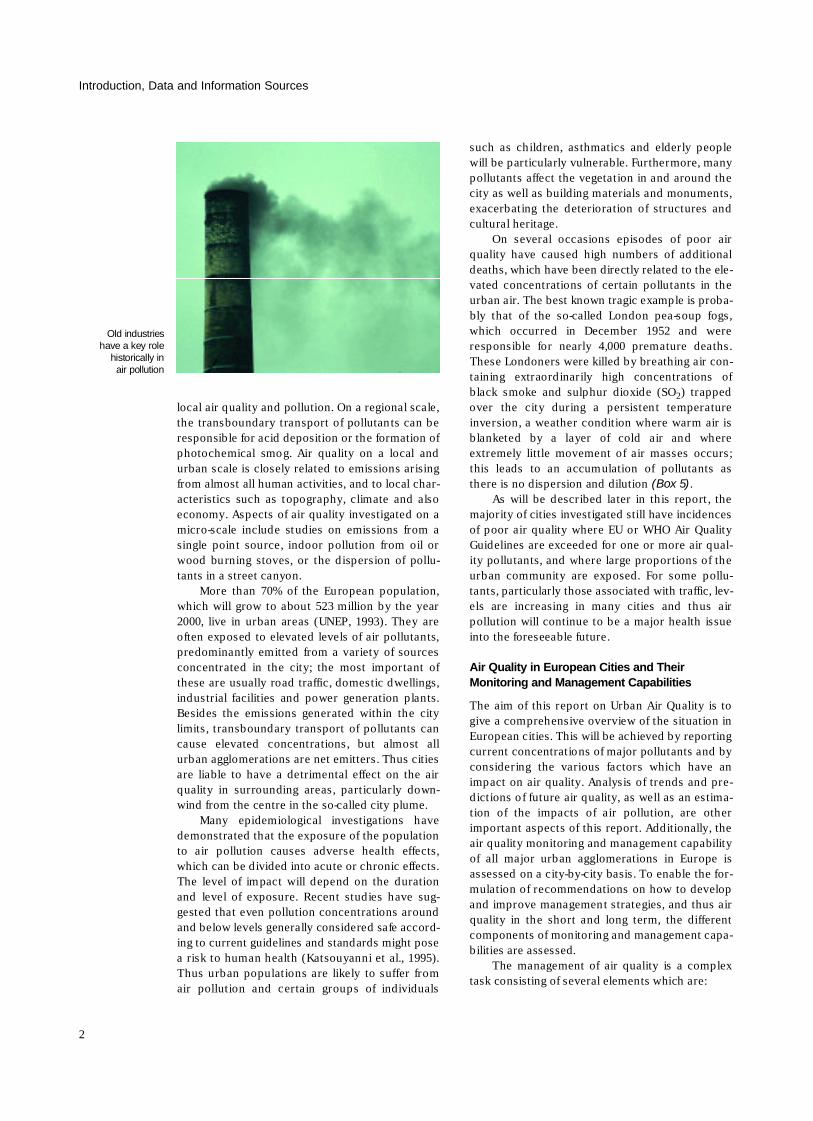
Old industrieshave a key role
historically inair pollution
• assessment of air quality including monitoringand appropriate usage of data,
• existence of a legislative framework allowing thecontrol of emissions, and
• enforcement of such legislation in situationswhere air quality standards or objectives are notbeing achieved.
Air quality in major European cities, and theircapabilities to assess and manage it, will bedescribed and discussed in this report.
Ambient Air Pollutants
Chemical compounds, present in the atmosphere,are considered ambient air pollutants when theyoccur in unnaturally high concentrations and havethe potential to cause harm to the environment.There is a very wide literature on air pollution andonly a brief overview is provided here to set thescene for the report. Air contaminants, are oftengrouped according to their chemical nature, thelevels at which they are present in ambient air, ortheir impacts. Although there are no universallyadopted classification schemes, two groups havebeen identified by the OECD (OECD, 1995):
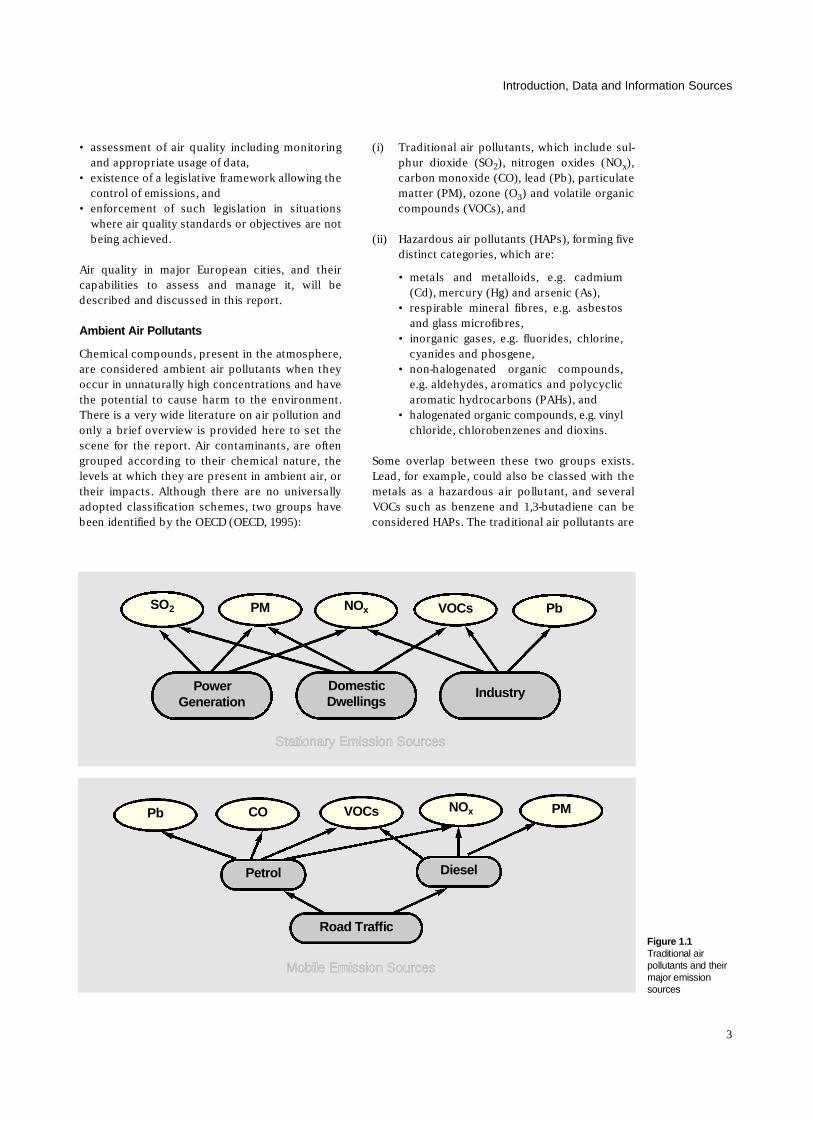
( i ) Traditional air pollutants, which include sul-phur dioxide (SO2), nitrogen oxides (NOx) ,carbon monoxide (CO), lead (Pb), particulatematter (PM), ozone (O3) and volatile organiccompounds (VOCs), and
( i i ) Hazardous air pollutants (HAPs), forming fivedistinct categories, which are:
• metals and metalloids, e.g. cadmium(Cd), mercury (Hg) and arsenic (As),
• respirable mineral fibres, e.g. asbestosand glass microfibres,
• inorganic gases, e.g. fluorides, chlorine,cyanides and phosgene,
• non-halogenated organic compounds,e.g. aldehydes, aromatics and polycyclicaromatic hydrocarbons (PAHs), and
• halogenated organic compounds, e.g. vinylchloride, chlorobenzenes and dioxins.
Some overlap between these two groups exists.Lead, for example, could also be classed with themetals as a hazardous air pollutant, and severalVOCs such as benzene and 1,3-butadiene can beconsidered HAPs. The traditional air pollutants are
Introduction, Data and Information Sources
3
Power G e n e r a t i o n
D o m e s t i cD w e l l i n g s
I n d u s t r y
V O C sS O2 P bP M
Stationary Emission Sources
Mobile Emission Sources
Road Traffic
D i e s e lP e t r o l
P MN OxV O C sC OP b
N Ox
Figure 1.1Traditional airpollutants and theirmajor emissions o u r c e s
ubiquitous and their impact on society and theenvironment is experienced throughout Europe.Thus monitoring efforts generally concentrate onthese pollutants and available data are much morecomplete and up to date. Hazardous air pollutantsare often only measured on a spatially and/ortemporally restricted scale in monitoring surveys,for example near potential industrial emissions o u r c e s .
The term particulate matter describes a verydiverse mixture of pollutants, consisting of parti-cles suspended in the atmosphere. These cover awide range of sizes and chemical characteristics(Chapter 4), including PAHs, acid aerosols anddiesel particulates (WHO, 1995c). The majorsources of the most common air pollutants aredepicted in Figure 1.1.
Several of these primary emissions take partin chemical reactions in the atmosphere, the prin-c ipal processes of secondary pollutant productiona r e :
• the formation of ozone (O3) ,• the creation of secondary aerosols, and• the oxidation of nitric oxide (NO) into nitrogen
dioxide (NO2) .
Area of Investigation, Sources of Dataand Information
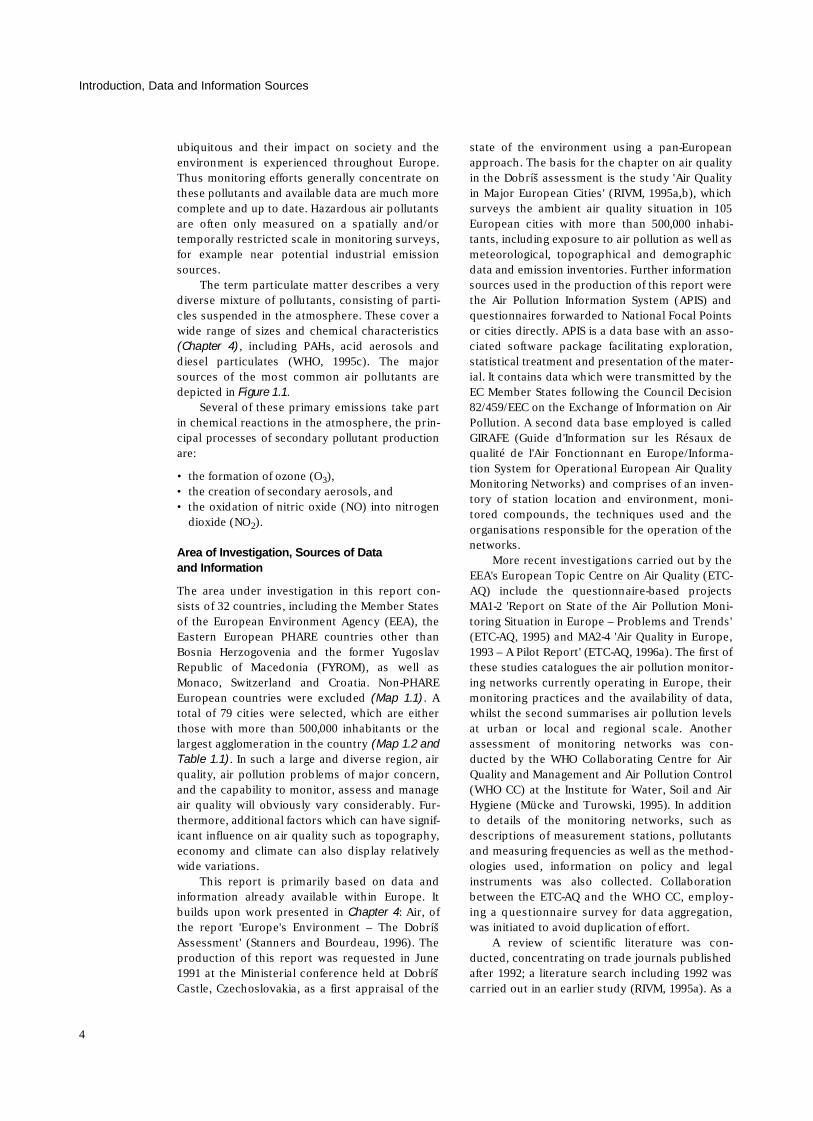
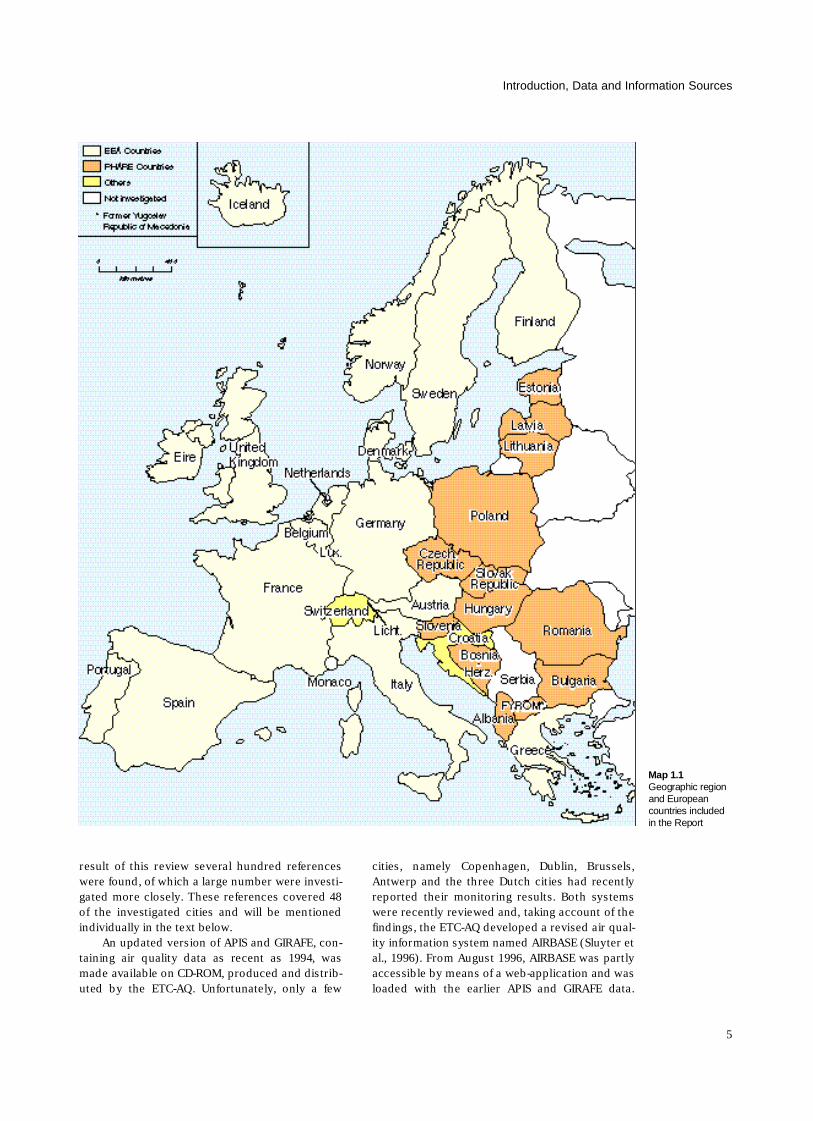
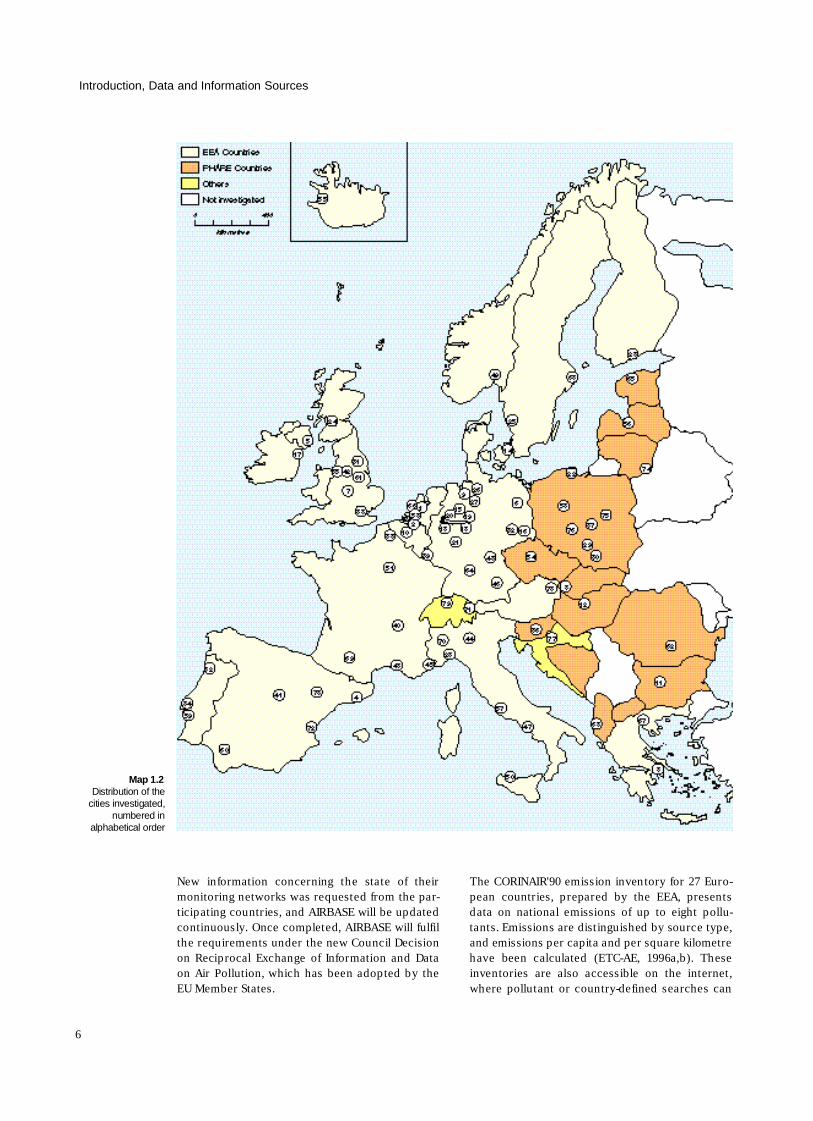
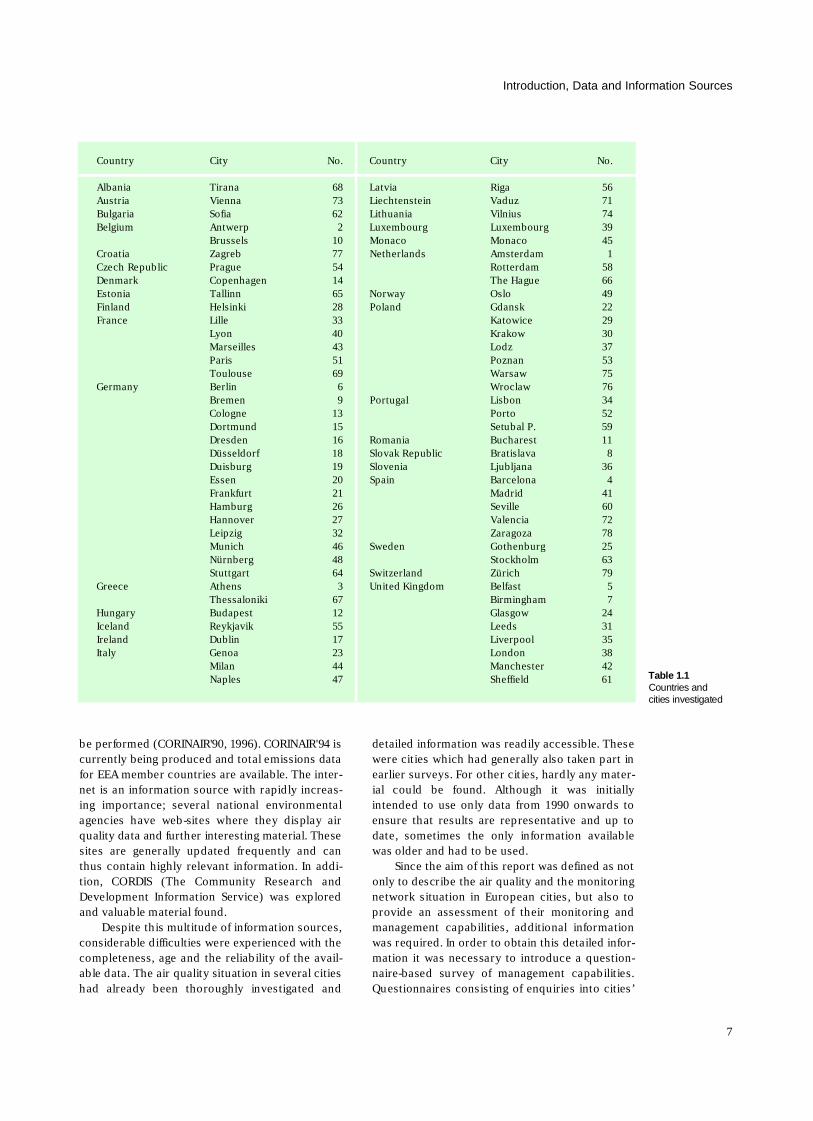
The area under investigation in this report con-sists of 32 countries, including the Member Statesof the European Environment Agency (EEA), theEastern European PHARE countries other thanBosnia Herzogovenia and the former YugoslavRepublic of Macedonia (FYROM), as well asMonaco, Switzerland and Croatia. Non-PHAREEuropean countries were excluded (Map 1.1). Atotal of 79 cities were selected, which are eitherthose with more than 500,000 inhabitants or thelargest agglomeration in the country (Map 1.2 andTable 1.1). In such a large and diverse region, airquality, air pollution problems of major concern,and the capability to monitor, assess and manageair quality will obviously vary considerably. Fur-thermore, additional factors which can have signif-icant influence on air quality such as topography,economy and climate can also display relativelywide variations.
This report is primarily based on data andinformation already available within Europe. Itbuilds upon work presented in Chapter 4: Air, ofthe report 'Europe's Environment – The Dobrís̆Assessment' (Stanners and Bourdeau, 1996). Theproduction of this report was requested in June1991 at the Ministerial conference held at Dobrís̆Castle, Czechoslovakia, as a first appraisal of the
state of the environment using a pan-Europeanapproach. The basis for the chapter on air qualityin the Dobrís̆ assessment is the study 'Air Qualityin Major European Cities' (RIVM, 1995a,b), whichsurveys the ambient air quality situation in 105European cities with more than 500,000 inhabi-tants, including exposure to air pollution as well asmeteorological, topographical and demographicdata and emission inventories. Further informationsources used in the production of this report werethe Air Pollution Information System (APIS) andquestionnaires forwarded to National Focal Pointsor cities directly. APIS is a data base with an asso-ciated software package facilitating exploration,statistical treatment and presentation of the mater-ial. It contains data which were transmitted by theEC Member States following the Council Decision82/459/EEC on the Exchange of Information on AirPollution. A second data base employed is calledGIRAFE (Guide d'Information sur les Résaux dequalité de l'Air Fonctionnant en Europe/Informa-tion System for Operational European Air QualityMonitoring Networks) and comprises of an inven-tory of station location and environment, moni-tored compounds, the techniques used and theorganisations responsible for the operation of then e t w o r k s .
More recent investigations carried out by theEEA's European Topic Centre on Air Quality (ETC-AQ) include the questionnaire-based projectsMA1-2 'Report on State of the Air Pollution Moni-toring Situation in Europe – Problems and Trends'(ETC-AQ, 1995) and MA2-4 'Air Quality in Europe,1993 – A Pilot Report' (ETC-AQ, 1996a). The first ofthese studies catalogues the air pollution monitor-ing networks currently operating in Europe, theirmonitoring practices and the availability of data,whilst the second summarises air pollution levelsat urban or local and regional scale. Anotherassessment of monitoring networks was con-ducted by the WHO Collaborating Centre for AirQuality and Management and Air Pollution Control(WHO CC) at the Institute for Water, Soil and AirHygiene (Mücke and Turowski, 1995). In additionto details of the monitoring networks, such asdescriptions of measurement stations, pollutantsand measuring frequencies as well as the method-ologies used, information on policy and legalinstruments was also collected. Collaborationbetween the ETC-AQ and the WHO CC, employ-ing a questionnaire survey for data aggregation,was initiated to avoid duplication of effort.
A review of scientific literature was con-ducted, concentrating on trade journals publishedafter 1992; a literature search including 1992 wascarried out in an earlier study (RIVM, 1995a). As a
Introduction, Data and Information Sources
4
result of this review several hundred referenceswere found, of which a large number were investi-gated more closely. These references covered 48of the investigated cities and will be mentionedindividually in the text below.
An updated version of APIS and GIRAFE, con-taining air quality data as recent as 1994, wasmade available on CD-ROM, produced and distrib-uted by the ETC-AQ. Unfortunately, only a few
cities, namely Copenhagen, Dublin, Brussels,Antwerp and the three Dutch cities had recentlyreported their monitoring results. Both systemswere recently reviewed and, taking account of thefindings, the ETC-AQ developed a revised air qual-ity information system named AIRBASE (Sluyter etal., 1996). From August 1996, AIRBASE was partlyaccessible by means of a web-application and wasloaded with the earlier APIS and GIRAFE data.
Introduction, Data and Information Sources
5
Map 1.1Geographic regionand European countries included in the Report
New information concerning the state of theirmonitoring networks was requested from the par-ticipating countries, and AIRBASE will be updatedcontinuously. Once completed, AIRBASE will fulfilthe requirements under the new Council Decisionon Reciprocal Exchange of Information and Dataon Air Pollution, which has been adopted by theEU Member States.
The CORINAIR'90 emission inventory for 27 Euro-pean countries, prepared by the EEA, presentsdata on national emissions of up to eight pollu-tants. Emissions are distinguished by source type,and emissions per capita and per square kilometrehave been calculated (ETC-AE, 1996a,b). Theseinventories are also accessible on the internet,where pollutant or country-defined searches can
Introduction, Data and Information Sources
6
Map 1.2Distribution of the
cities investigated,numbered in
alphabetical order
be performed (CORINAIR'90, 1996). CORINAIR'94 iscurrently being produced and total emissions datafor EEA member countries are available. The inter-net is an information source with rapidly increas-ing importance; several national environmentalagencies have web-sites where they display airquality data and further interesting material. Thesesites are generally updated frequently and canthus contain highly relevant information. In addi-tion, CORDIS (The Community Research andDevelopment Information Service) was exploredand valuable material found.
Despite this multitude of information sources,considerable difficulties were experienced with thecompleteness, age and the reliability of the avail-able data. The air quality situation in several citieshad already been thoroughly investigated and
detailed information was readily accessible. Thesewere cities which had generally also taken part inearlier surveys. For other cities, hardly any mater-ial could be found. Although it was initiallyintended to use only data from 1990 onwards toensure that results are representative and up todate, sometimes the only information availablewas older and had to be used.
Since the aim of this report was defined as notonly to describe the air quality and the monitoringnetwork situation in European cities, but also toprovide an assessment of their monitoring andmanagement capabilities, additional informationwas required. In order to obtain this detailed infor-mation it was necessary to introduce a question-naire-based survey of management capabilities.Questionnaires consisting of enquiries into cities’
Introduction, Data and Information Sources
7
C o u n t r y C i t y N o . C o u n t r y C i t y N o .
A l b a n i a T i r a n a 6 8 L a t v i a R i g a 5 6A u s t r i a V i e n n a 7 3 L i e c h t e n s t e i n V a d u z 7 1B u l g a r i a S o f i a 6 2 L i t h u a n i a V i l n i u s 7 4B e l g i u m A n t w e r p 2 L u x e m b o u r g L u x e m b o u r g 3 9
B r u s s e l s 1 0 M o n a c o M o n a c o 4 5C r o a t i a Z a g r e b 7 7 N e t h e r l a n d s A m s t e r d a m 1Czech Republic P r a g u e 5 4 R o t t e r d a m 5 8D e n m a r k C o p e n h a g e n 1 4 The Hague 6 6E s t o n i a T a l l i n n 6 5 N o r w a y O s l o 4 9F i n l a n d H e l s i n k i 2 8 P o l a n d G d a n s k 2 2F r a n c e L i l l e 3 3 K a t o w i c e 2 9
L y o n 4 0 K r a k o w 3 0M a r s e i l l e s 4 3 L o d z 3 7Paris 5 1 P o z n a n 5 3T o u l o u s e 6 9 W a r s a w 7 5
G e r m a n y B e r l i n 6 W r o c l a w 7 6B r e m e n 9 P o r t u g a l L i s b o n 3 4C o l o g n e 1 3 P o r t o 5 2D o r t m u n d 1 5 Setubal P. 5 9D r e s d e n 1 6 R o m a n i a B u c h a r e s t 1 1D ü s s e l d o r f 1 8 Slovak Republic B r a t i s l a v a 8D u i s b u r g 1 9 S l o v e n i a L j u b l j a n a 3 6E s s e n 2 0 S p a i n B a r c e l o n a 4F r a n k f u r t 2 1 M a d r i d 4 1H a m b u r g 2 6 S e v i l l e 6 0H a n n o v e r 2 7 V a l e n c i a 7 2L e i p z i g 3 2 Z a r a g o z a 7 8M u n i c h 4 6 S w e d e n G o t h e n b u r g 2 5N ü r n b e r g 4 8 S t o c k h o l m 6 3S t u t t g a r t 6 4 S w i t z e r l a n d Z ü r i c h 7 9
G r e e c e A t h e n s 3 United Kingdom B e l f a s t 5T h e s s a l o n i k i 6 7 B i r m i n g h a m 7
H u n g a r y B u d a p e s t 1 2 G l a s g o w 2 4I c e l a n d R e y k j a v i k 5 5 L e e d s 3 1I r e l a n d D u b l i n 1 7 L i v e r p o o l 3 5I t a l y G e n o a 2 3 L o n d o n 3 8
M i l a n 4 4 M a n c h e s t e r 4 2N a p l e s 4 7 S h e f f i e l d 6 1 Table 1.1
Countries and cities investigated
measurement capacity, data assessment and avail-ability, emission estimates and air quality manage-ment were forwarded to contact persons in EEANational Focal Points, city councils and organisa-tions responsible for air quality monitoring at localand national level (Appendix 1). In order to sim-plify the replies, only yes/no answers were neces-sary and the material analysed in the literaturereview was used to pre-fill the individual question-naires as completely as possible before sendingthem. The returned responses were evaluatedusing an index scoring system, developed anddescribed in detail elsewhere (WHO/UNEP, 1996)and summarised in Chapter 9. In addition, emissioninventories were collected from the individualcities by the EEA's European Topic Centre on AirEmissions (ETC-AE). These inventories and allinformation sources mentioned above wereemployed to cross check the questionnaireresponses before calculating the index score.
Questionnaire responses were received ini-tially from 45 of the 79 cities. A further 17 wereeventually returned following reminder letters orby approaching alternative contacts, giving a finalreply rate of 80%. Twenty-one cities sent emissioninventories or air quality information, and a further11 indicated in their questionnaire responses thatemission inventories had been produced withinthe last five years. Due to the variety of informa-tion sources, contradictory statements and datawere found on a number of occasions. Priority wasgenerally given to the newest publication and toresponses on the collected questionnaires, sincethe contact persons in the countries and citieswere considered to be the most qualified special-ists in providing relevant information. It has to beassumed that those cities which did not take partin this nor any of the earlier studies, possess onlylimited air quality monitoring, assessment and
management capabilities, and are thus less willingto take part in surveys and give information.
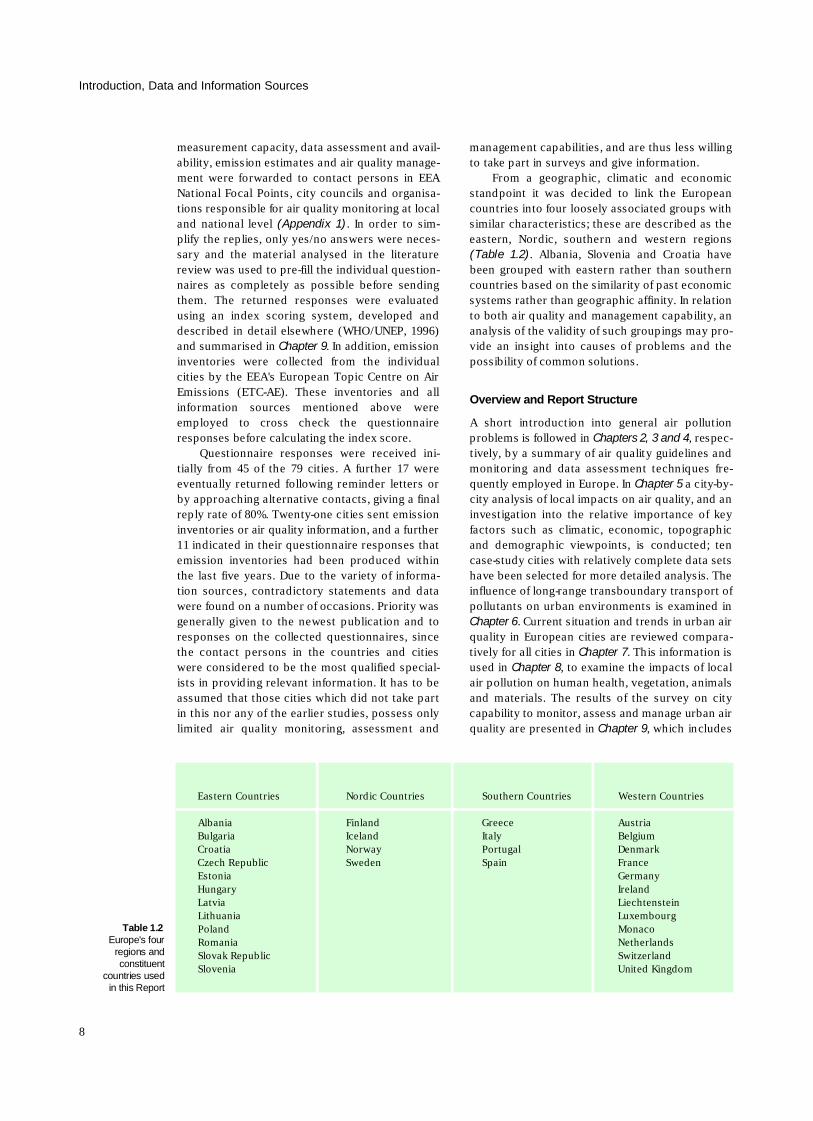
From a geographic, climatic and economicstandpoint it was decided to link the Europeancountries into four loosely associated groups withsimilar characteristics; these are described as theeastern, Nordic, southern and western regions(Table 1.2). Albania, Slovenia and Croatia havebeen grouped with eastern rather than southerncountries based on the similarity of past economicsystems rather than geographic affinity. In relationto both air quality and management capability, ananalysis of the validity of such groupings may pro-vide an insight into causes of problems and thepossibility of common solutions.
Overview and Report Structure
A short introduction into general air pollutionproblems is followed in Chapters 2, 3 and 4, respec-tively, by a summary of air quality guidelines andmonitoring and data assessment techniques fre-quently employed in Europe. In Chapter 5 a city-by-city analysis of local impacts on air quality, and aninvestigation into the relative importance of keyfactors such as climatic, economic, topographicand demographic viewpoints, is conducted; tencase-study cities with relatively complete data setshave been selected for more detailed analysis. Theinfluence of long-range transboundary transport ofpollutants on urban environments is examined inChapter 6. Current situation and trends in urban airquality in European cities are reviewed compara-tively for all cities in Chapter 7. This information isused in Chapter 8, to examine the impacts of localair pollution on human health, vegetation, animalsand materials. The results of the survey on citycapability to monitor, assess and manage urban airquality are presented in Chapter 9, which includes
Introduction, Data and Information Sources
8
Eastern Countries Nordic Countries Southern Countries Western Countries
A l b a n i a F i n l a n d G r e e c e A u s t r i aB u l g a r i a I c e l a n d I t a l y B e l g i u mC r o a t i a N o r w a y P o r t u g a l D e n m a r kCzech Republic S w e d e n S p a i n F r a n c eE s t o n i a G e r m a n yH u n g a r y I r e l a n dL a t v i a L i e c h t e n s t e i nL i t h u a n i a L u x e m b o u r gP o l a n d M o n a c oR o m a n i a N e t h e r l a n d sSlovak Republic S w i t z e r l a n dS l o v e n i a United Kingdom
Table 1.2Europe's four
regions andc o n s t i t u e n t
countries usedin this Report

a further analysis of the 10 detailed case studies,and recommendations on how to improve air qual-ity conditions most efficiently. Finally, conclusions
are drawn and a way forward, with recommenda-tions which would lead to better air quality inurban areas, is suggested.
Introduction, Data and Information Sources
9

The primary determinants of air quality areatmospheric emissions, although a wide range
of natural factors, such as climate and topographywill also have a significant impact. This is particu-larly true in urban areas, where emission sourcesare concentrated and where the large number ofpeople present are potentially exposed to poor airquality. The actual pollutant concentrations pre-sent in the air we breathe are determined by thedispersion of emissions, and are thus closely relatedto wind speed and direction as well as local topog-raphy. Currently, air pollution control is oftenachieved by emission reduction, which can be acc-omplished by various means. It is used to tackleshort-term impacts during episodes of particularlyhigh pollution and also as a solution to long-termproblems of elevated background concentrations.
Emissions to Urban Air
Emissions can be either of natural or of anthro-pogenic origin, but human activity, especially thecombustion of fossil fuels, is the predominantcause of air pollution. In rural areas agriculture,animal breeding and natural sources contributelarge amounts of specific pollutants, mainly ammo-nia (NH3), nitrous oxide (N2O) and methane (CH4)(ETC-AE, 1996). Urban emission sources are gener-ally divided into mobile or stationary; another pos-sibility is spatial distinction between area, pointand line sources. A differentiation between 277emission source activities according to the SNAPLevel 3 code (Selected Nomenclature of Air Pollu-t a n t s ) was undertaken in the CORINAIR'90
Chapter 2
Understanding Urban AirPollution Problems -S o u rces, Impacts andC o n t rol Strategies
11
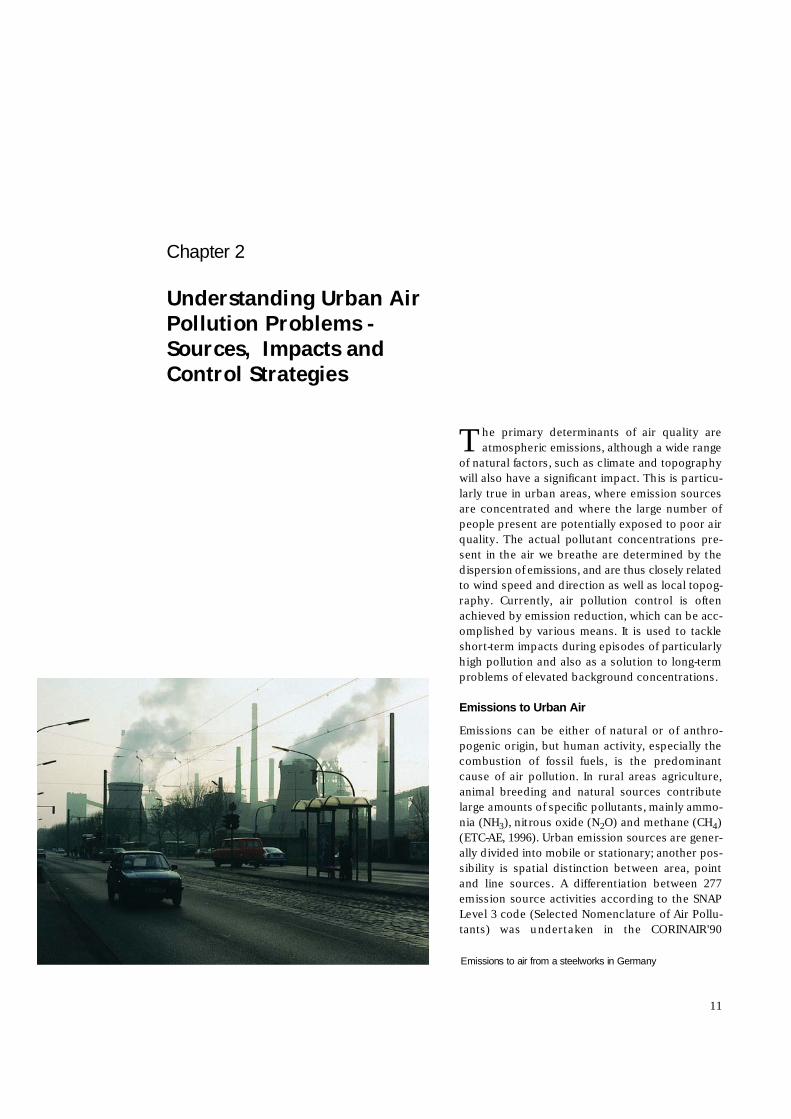
Emissions to air from a steelworks in Germany
Understanding Urban Air Pollution Problems - Sources, Impacts and Control Strategies
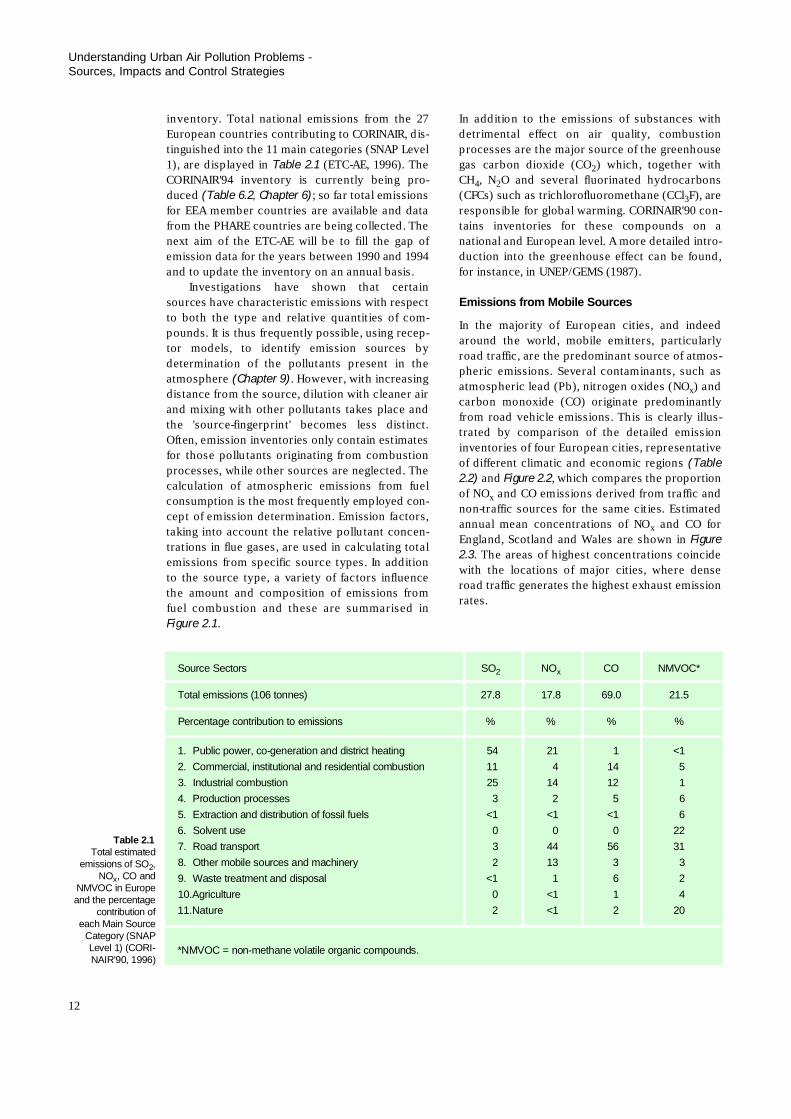
i n v e ntory. Total national emissions from the 27European countries contributing to CORINAIR, dis-tinguished into the 11 main categories (SNAP Level1), are displayed in Table 2.1 (ETC-AE, 1996). TheCORINAIR'94 inventory is currently being pro-duced (Table 6.2, Chapter 6); so far total emissionsfor EEA member countries are available and datafrom the PHARE countries are being collected. Thenext aim of the ETC-AE will be to fill the gap ofemission data for the years between 1990 and 1994and to update the inventory on an annual basis.
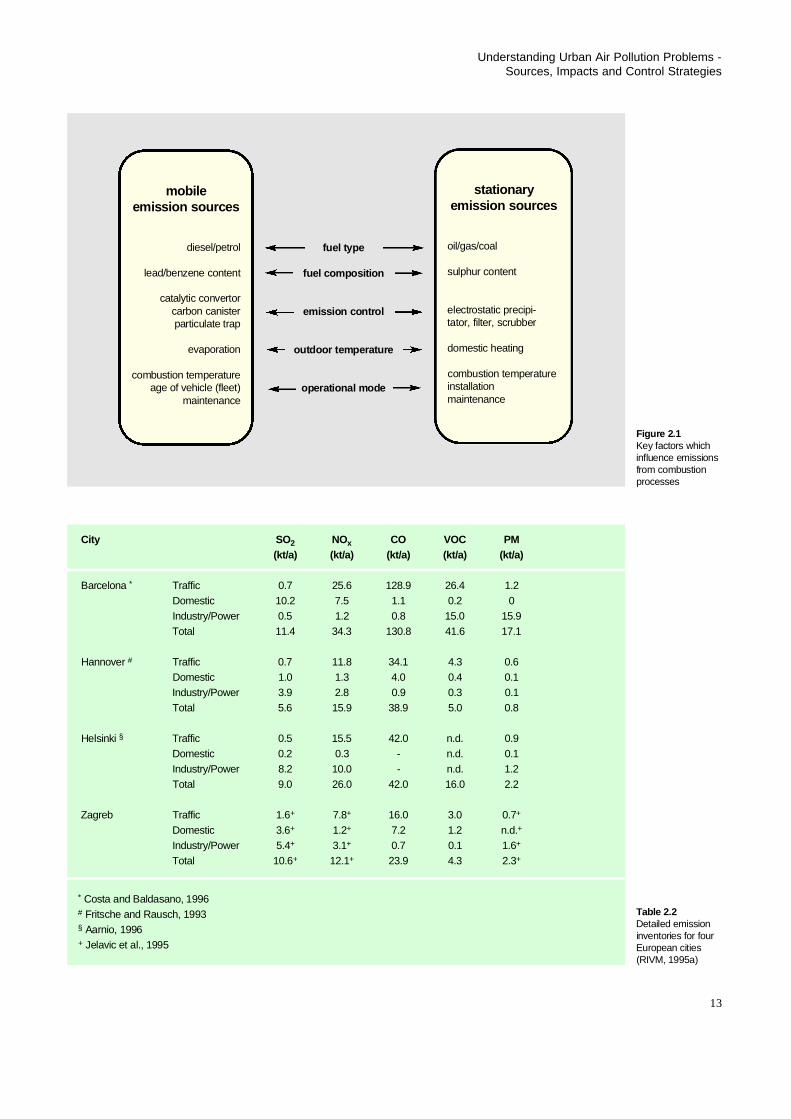
Investigations have shown that certainsources have characteristic emissions with respectto both the type and relative quantities of com-pounds. It is thus frequently possible, using recep-tor models, to identify emission sources bydetermination of the pollutants present in theatmosphere (Chapter 9). However, with increasingdistance from the source, dilution with cleaner airand mixing with other pollutants takes place andthe 'source-fingerprint' becomes less distinct.Often, emission inventories only contain estimatesfor those pollutants originating from combustionprocesses, while other sources are neglected. Thecalculation of atmospheric emissions from fuelconsumption is the most frequently employed con-cept of emission determination. Emission factors,taking into account the relative pollutant concen-trations in flue gases, are used in calculating totalemissions from specific source types. In additionto the source type, a variety of factors influencethe amount and composition of emissions fromfuel combustion and these are summarised inFigure 2.1.
In addition to the emissions of substances withdetrimental effect on air quality, combustionprocesses are the major source of the greenhousegas carbon dioxide (CO2) which, together withC H4, N2O and several fluorinated hydrocarbons(CFCs) such as trichlorofluoromethane (CCl3F), areresponsible for global warming. CORINAIR'90 con-tains inventories for these compounds on anational and European level. A more detailed intro-duction into the greenhouse effect can be found,for instance, in UNEP/GEMS (1987).
Emissions from Mobile Sources
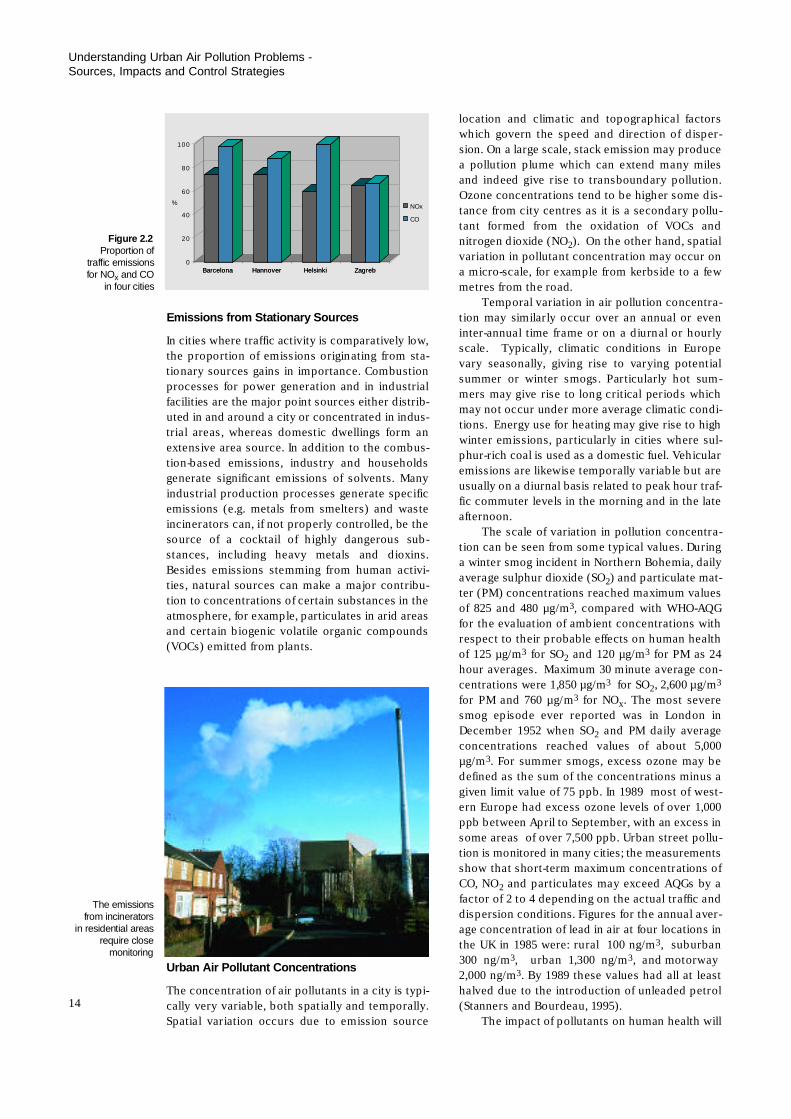
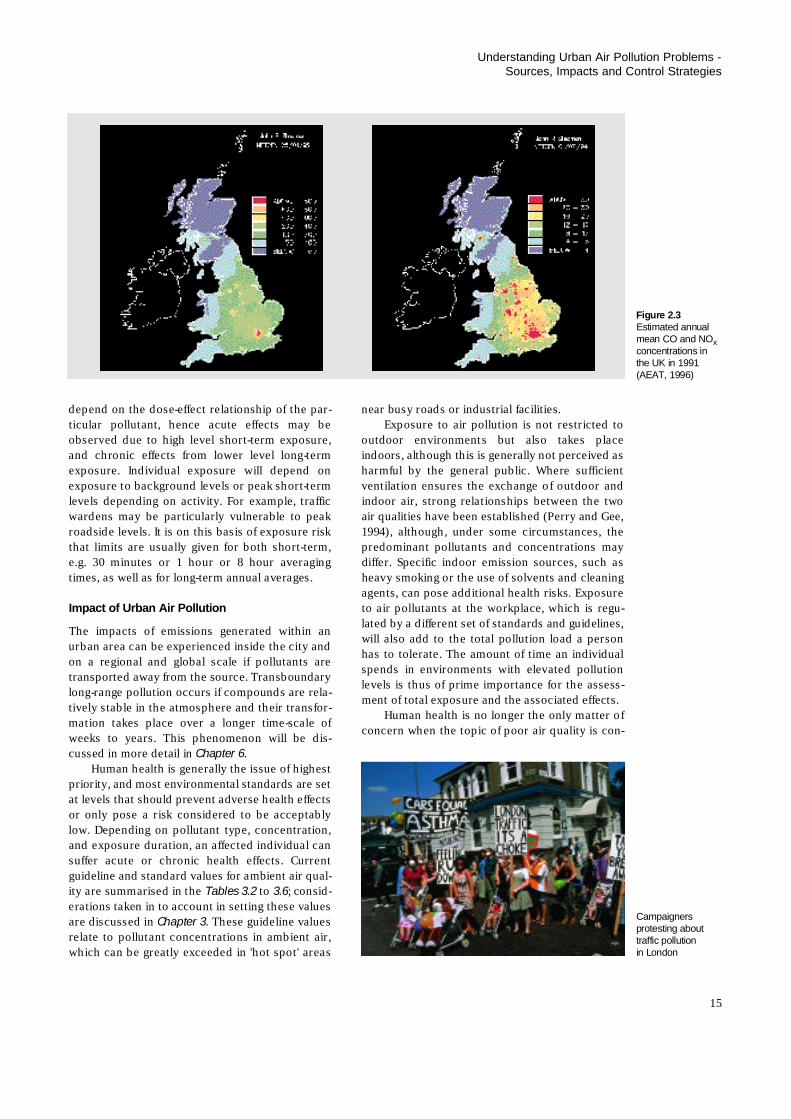
In the majority of European cities, and indeedaround the world, mobile emitters, particularlyroad traffic, are the predominant source of atmos-pheric emissions. Several contaminants, such asatmospheric lead (Pb), nitrogen oxides (NOx) andcarbon monoxide (CO) originate predominantlyfrom road vehicle emissions. This is clearly illus-trated by comparison of the detailed emissioninventories of four European cities, representativeof different climatic and economic regions ( T a b l e2 . 2 ) and Figure 2.2, which compares the proportionof NOx and CO emissions derived from traffic andnon-traffic sources for the same cities. Estimatedannual mean concentrations of NOx and CO forEngland, Scotland and Wales are shown in F i g u r e2 . 3. The areas of highest concentrations coincidewith the locations of major cities, where denseroad traffic generates the highest exhaust emissionr a t e s .
1 2
Source Sectors S O2 N Ox C O N M V O C *
Total emissions (106 tonnes) 2 7 . 8 1 7 . 8 6 9 . 0 2 1 . 5
Percentage contribution to emissions % % % %
1 . Public power, co-generation and district heating 5 4 2 1 1 < 1
2 . Commercial, institutional and residential combustion 1 1 4 1 4 5
3 . Industrial combustion 2 5 1 4 1 2 1
4 . Production processes 3 2 5 6
5 . Extraction and distribution of fossil fuels < 1 < 1 < 1 6
6 . Solvent use 0 0 0 2 2
7 . Road transport 3 4 4 5 6 3 1
8 . Other mobile sources and machinery 2 1 3 3 3
9 . Waste treatment and disposal < 1 1 6 2
1 0 .A g r i c u l t u r e 0 < 1 1 4
1 1 .N a t u r e 2 < 1 2 2 0
*NMVOC = non-methane volatile organic compounds.
Table 2.1Total estimated
emissions of SO2,N Ox, CO and
NMVOC in Europeand the percentage
contribution of each Main Source
Category (SNAPLevel 1) (CORI-NAIR'90, 1996)
13
Understanding Urban Air Pollution Problems - Sources, Impacts and Control Strategies
C i t y S O2 N Ox C O V O C P M( k t / a ) ( k t / a ) ( k t / a ) ( k t / a ) ( k t / a )
Barcelona * T r a f f i c 0 . 7 2 5 . 6 1 2 8 . 9 2 6 . 4 1 . 2D o m e s t i c 1 0 . 2 7 . 5 1 . 1 0 . 2 0I n d u s t r y / P o w e r 0 . 5 1 . 2 0 . 8 1 5 . 0 1 5 . 9T o t a l 1 1 . 4 3 4 . 3 1 3 0 . 8 4 1 . 6 1 7 . 1
Hannover # T r a f f i c 0 . 7 1 1 . 8 3 4 . 1 4 . 3 0 . 6D o m e s t i c 1 . 0 1 . 3 4 . 0 0 . 4 0 . 1I n d u s t r y / P o w e r 3 . 9 2 . 8 0 . 9 0 . 3 0 . 1T o t a l 5 . 6 1 5 . 9 3 8 . 9 5 . 0 0 . 8
Helsinki § T r a f f i c 0 . 5 1 5 . 5 4 2 . 0 n . d . 0 . 9D o m e s t i c 0 . 2 0 . 3 - n . d . 0 . 1I n d u s t r y / P o w e r 8 . 2 1 0 . 0 - n . d . 1 . 2T o t a l 9 . 0 2 6 . 0 4 2 . 0 1 6 . 0 2 . 2
Z a g r e b T r a f f i c 1 . 6+ 7 . 8+ 1 6 . 0 3 . 0 0 . 7+
D o m e s t i c 3 . 6+ 1 . 2+ 7 . 2 1 . 2 n . d .+
I n d u s t r y / P o w e r 5 . 4+ 3 . 1+ 0 . 7 0 . 1 1 . 6+
T o t a l 1 0 . 6+ 1 2 . 1+ 2 3 . 9 4 . 3 2 . 3+
* Costa and Baldasano, 1996# Fritsche and Rausch, 1993§ Aarnio, 1996+ Jelavic et al., 1995
Table 2.2Detailed emissioninventories for fourEuropean cities(RIVM, 1995a)
s t a t i o n a r yemission sources
o i l / g a s / c o a l
sulphur content
electrostatic precipi-tator, filter, scrubber
domestic heating
combustion temperaturei n s t a l l a t i o nm a i n t e n a n c e
m o b i l eemission sources
d i e s e l / p e t r o l
lead/benzene content
catalytic convertorcarbon canisterparticulate trap
e v a p o r a t i o n
combustion temperatureage of vehicle (fleet)
m a i n t e n a n c e
Figure 2.1Key factors whichinfluence emissionsfrom combustionp r o c e s s e s
fuel type
fuel composition
emission control
outdoor temperature
operational mode
Emissions from Stationary Sources
In cities where traffic activity is comparatively low,the proportion of emissions originating from sta-tionary sources gains in importance. Combustionprocesses for power generation and in industrialfacilities are the major point sources either distrib-uted in and around a city or concentrated in indus-trial areas, whereas domestic dwellings form anextensive area source. In addition to the combus-tion-based emissions, industry and householdsgenerate significant emissions of solvents. Manyindustrial production processes generate specificemissions (e.g. metals from smelters) and wasteincinerators can, if not properly controlled, be thesource of a cocktail of highly dangerous sub-stances, including heavy metals and dioxins.Besides emissions stemming from human activi-ties, natural sources can make a major contribu-tion to concentrations of certain substances in theatmosphere, for example, particulates in arid areasand certain biogenic volatile organic compounds(VOCs) emitted from plants.
Urban Air Pollutant Concentrations
The concentration of air pollutants in a city is typi-cally very variable, both spatially and temporally.Spatial variation occurs due to emission source
location and climatic and topographical factorswhich govern the speed and direction of disper-sion. On a large scale, stack emission may producea pollution plume which can extend many milesand indeed give rise to transboundary pollution.Ozone concentrations tend to be higher some dis-tance from city centres as it is a secondary pollu-tant formed from the oxidation of VOCs andnitrogen dioxide (NO2). On the other hand, spatialvariation in pollutant concentration may occur ona micro-scale, for example from kerbside to a fewmetres from the road.
Temporal variation in air pollution concentra-tion may similarly occur over an annual or eveninter-annual time frame or on a diurnal or hourlyscale. Typically, climatic conditions in Europevary seasonally, giving rise to varying potentialsummer or winter smogs. Particularly hot sum-mers may give rise to long critical periods whichmay not occur under more average climatic condi-tions. Energy use for heating may give rise to highwinter emissions, particularly in cities where sul-phur-rich coal is used as a domestic fuel. Vehicularemissions are likewise temporally variable but areusually on a diurnal basis related to peak hour traf-fic commuter levels in the morning and in the latea f t e r n o o n .
The scale of variation in pollution concentra-tion can be seen from some typical values. Duringa winter smog incident in Northern Bohemia, dailyaverage sulphur dioxide (SO2) and particulate mat-ter (PM) concentrations reached maximum valuesof 825 and 480 µg/m3, compared with WHO-AQGfor the evaluation of ambient concentrations withrespect to their probable effects on human healthof 125 µg/m3 for SO2 and 120 µg/m3 for PM as 24hour averages. Maximum 30 minute average con-centrations were 1,850 µg/m3 for SO2, 2,600 µg/m3
for PM and 760 µg/m3 for NOx. The most severesmog episode ever reported was in London inDecember 1952 when SO2 and PM daily averageconcentrations reached values of about 5,000µ g / m3. For summer smogs, excess ozone may bedefined as the sum of the concentrations minus agiven limit value of 75 ppb. In 1989 most of west-ern Europe had excess ozone levels of over 1,000ppb between April to September, with an excess insome areas of over 7,500 ppb. Urban street pollu-tion is monitored in many cities; the measurem e n t sshow that short-term maximum concentrations ofCO, NO2 and particulates may exceed AQGs by afactor of 2 to 4 depending on the actual traffic anddispersion conditions. Figures for the annual aver-age concentration of lead in air at four locations inthe UK in 1985 were: rural 100 ng/m3, suburban300 ng/m3, urban 1,300 ng/m3, and motorway2,000 ng/m3. By 1989 these values had all at leasthalved due to the introduction of unleaded petrol(Stanners and Bourdeau, 1995).
The impact of pollutants on human health will
Understanding Urban Air Pollution Problems - Sources, Impacts and Control Strategies
14
Barcelona Hannover Helsinki Zagreb0
20
40
60
80
100
%
Barcelona Hannover Helsinki Zagreb
NOx
CO
Figure 2.2Proportion of
traffic emissionsfor NOx and CO
in four cities
The emissionsfrom incinerators
in residential areasrequire close
m o n i t o r i n g
depend on the dose-effect relationship of the par-ticular pollutant, hence acute effects may beobserved due to high level short-term exposure,and chronic effects from lower level long-termexposure. Individual exposure will depend onexposure to background levels or peak short-termlevels depending on activity. For example, trafficwardens may be particularly vulnerable to peakroadside levels. It is on this basis of exposure riskthat limits are usually given for both short-term,e.g. 30 minutes or 1 hour or 8 hour averagingtimes, as well as for long-term annual averages.
Impact of Urban Air Pollution
The impacts of emissions generated within anurban area can be experienced inside the city andon a regional and global scale if pollutants aretransported away from the source. Transboundarylong-range pollution occurs if compounds are rela-tively stable in the atmosphere and their transfor-mation takes place over a longer time-scale ofweeks to years. This phenomenon will be dis-cussed in more detail in Chapter 6.
Human health is generally the issue of highestpriority, and most environmental standards are setat levels that should prevent adverse health effectsor only pose a risk considered to be acceptablylow. Depending on pollutant type, concentration,and exposure duration, an affected individual cansuffer acute or chronic health effects. Currentguideline and standard values for ambient air qual-ity are summarised in the Tables 3.2 to 3 . 6; consid-erations taken in to account in setting these valuesare discussed in Chapter 3. These guideline valuesrelate to pollutant concentrations in ambient air,which can be greatly exceeded in 'hot spot' areas
near busy roads or industrial facilities.Exposure to air pollution is not restricted to
outdoor environments but also takes placeindoors, although this is generally not perceived asharmful by the general public. Where sufficientventilation ensures the exchange of outdoor andindoor air, strong relationships between the twoair qualities have been established (Perry and Gee,1994), although, under some circumstances, thepredominant pollutants and concentrations maydiffer. Specific indoor emission sources, such asheavy smoking or the use of solvents and cleaningagents, can pose additional health risks. Exposureto air pollutants at the workplace, which is regu-lated by a different set of standards and guidelines,will also add to the total pollution load a personhas to tolerate. The amount of time an individualspends in environments with elevated pollutionlevels is thus of prime importance for the assess-ment of total exposure and the associated effects.
Human health is no longer the only matter ofconcern when the topic of poor air quality is con-
15
Understanding Urban Air Pollution Problems - Sources, Impacts and Control Strategies
Figure 2.3Estimated annualmean CO and NOxconcentrations inthe UK in 1991(AEAT, 1996)
C a m p a i g n e r sprotesting abouttraffic pollutionin London
sidered, as vegetation inside and outside urbanareas has suffered severe damage from air pollu-tion. Forest damage in many parts of Europe andthe acidification of fresh waters in Scandinavia(Chapter 6) initiated measures to protect the envi-ronment from detrimental impacts of atmosphericemissions (Stanners and Bourdeau, 1995). It is nowaccepted that the long-range transport and subse-quent deposition of air pollutants on soils havecontributed to both acidification and eutrophica-tion in several areas (UNEP, 1992). Many plantspecies, especially mosses and lichens, are verysensitive to certain pollutants and their presencein biotopes or their appearance can indicate theair quality. This fact is exploited in the applicationof biomonitoring techniques, where bioindicatorsare either intentionally distributed in the environ-ment, collected and analysed after a certain expo-sure period, or naturally-occurring plants areinvestigated. The advantages of biomonitoring areits low cost and flexibility, but standard monitoringprogrammes have yet to be developed (UNEP/WHO, 1994a).
Air pollutants can also attack building materi-als and increase the deterioration rate of buildingsand cultural heritage (Chapter 8). Black smoke andparticulate matter can soil the surface of buildings,ruin their appearance and necessitate frequentcleaning. An even worse effect is the destruction ofcalcareous sandstone which, in many Europeancities, is the predominant construction material ofmonuments. Corrosion of metals used as struc-tural material or for roofs and facades is acceler-ated by elevated sulphur dioxide and chloridedeposition levels (RIVM, 1995a). The economiccosts involved in the restoration of cultural her-itage can be enormous, but they are easilyexceeded by the damage the economy suffersfrom health effects in humans, particularly in the
workforce. In addition to emission of air pollutants,other environmental impacts with negative effectson the quality of life, such as noise and odour,often originate from the same source.
Current Control Strategies
Without control and management of urban airquality, standards and guideline values are fre-quently breached. The development and applica-tion of strategies to improve and sustain air qualityis therefore required. The pollution abatementstrategies most often practised with the intentionof reducing the exposure of the population toharmful substances are:
• emission reduction,• land-use changes, and• wider dispersion of emissions.
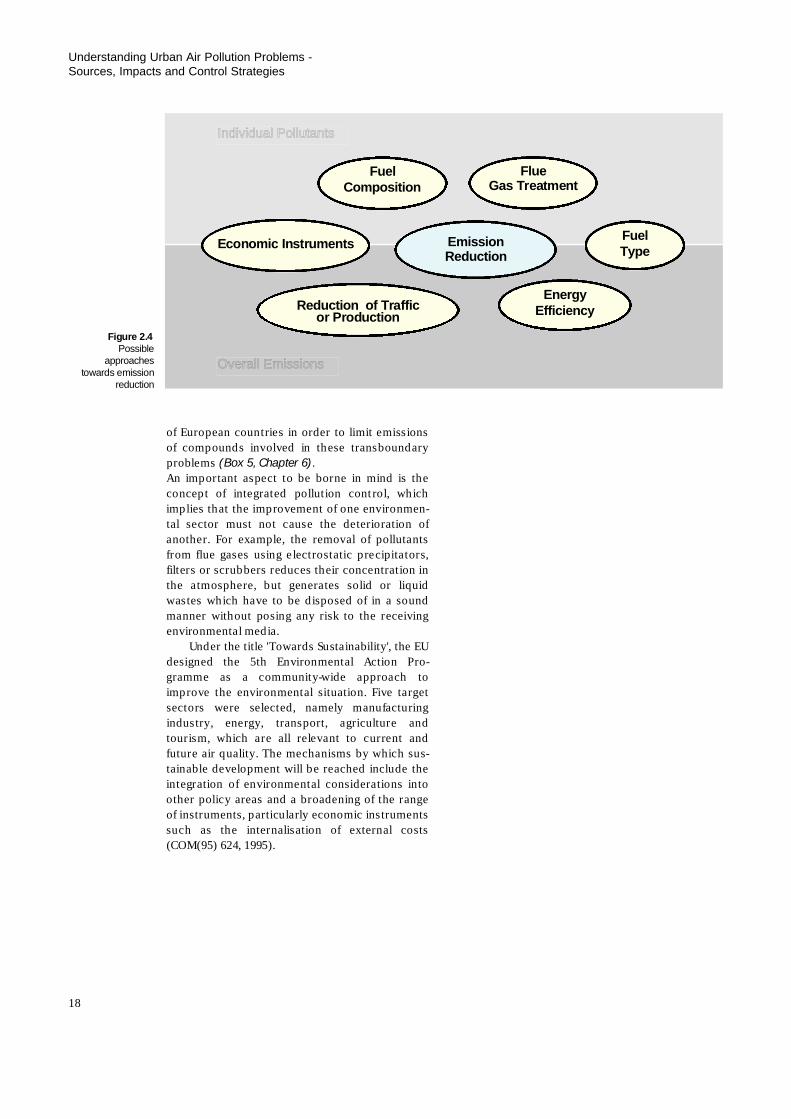
The reduction of pollutant concentrations in ambi-ent air and near 'hot spots' can, in most cases,obviously be achieved by emission reduction.Methods of emission reduction for the variouscombustion sources are outlined in Box 1.
For secondary pollutants, like ozone, the situa-tion is different and more difficult to control ( C h a p -ter 6). Emission limits can focus on individualpollutants or total emissions, the production ofpolluting compounds can be reduced, or they canbe prevented from reaching the atmosphere bycleansing of flue gases (Figure 2.4). Measures canbe proactive, aiming at prevention of the occur-rence of pollution episodes by cutting the long-term emission pressure, or reactive, by employingad-hoc initiatives in situations of deteriorating airquality. Different strategies to curb emissions havebeen applied separately or in combination withvarying success. The implementation of pollutionabatement is generally connected with major capi-tal investments. Thus, the effectiveness of possiblemeasures in relation to their costs must beinspected before a decision on which strategy toemploy can be made. Although there is now con-siderable experience with various methods of airquality management, and expertise in how todevelop and accomplish strategies is readily avail-able, each specific situation still needs thoroughconsideration. Measures, which have been imple-mented successfully in one or several areas, mightnot prove feasible in other parts of Europe or theworld. Besides topographic, climatic and demo-graphic factors, the economic, social and culturalbackgrounds of the population are extremelyimportant (Elsom, 1996). If the general public doesnot support pollution abatement programmesthen their success will be very limited. Economicinstruments applied cover emission charges, taxesand fines. If they are comparatively high, they willencourage investment into emission reduction byother means.
The enforcement of emission reductions canmeet strong opposition, especially when highcosts or the restriction of the individual's freedomof choice are involved. The extent to which mea-
Understanding Urban Air Pollution Problems - Sources, Impacts and Control Strategies
16
Swedish spruce,showing the effects
of acid deposition
sures have to be applied depends mainly on thenature of the air quality problem. During short-term episodes of high air pollution, when a largerpart of the population experiences health prob-lems, more drastic solutions can and have to bechosen, and will be more readily accepted by thepublic. To decrease long-term mean concentra-tions of pollutants in ambient air, gradual and sus-tainable approaches, such as changes in land use,can be applied. Another means of achieving grad-ual change is the adoption of new legislation,which permits certain periods of time before fullcompliance has to be achieved.
With respect to mobile emission sources, sev-eral new laws and regulations have been intro-duced in recent years to reduce emissions fromroad traffic. These have operated at different levelseither by controlling the amount and flow of trafficon a local basis, or by limiting the amounts of cer-tain pollutants emitted by individual polluters (ECDirective 94/12/EC). However, investigations intothe effectiveness of these measures showed thatup to 80% of the CO and VOC emissions arecaused by only 20% of the vehicle fleet. These so-called gross polluters are the vehicles which donot comply with the set standards (Rayfield et al.,1 9 9 5 ) .
An important step towards better air qualitywas the introduction of unleaded petrol in mostEuropean countries in 1989 (EC Directive85/210/EEC) combined with catalytic converters(EC Directive 91/441/EEC). The removal of leadanti-knock compounds and their replacement byaromatic hydrocarbons, which maintain the highoctane number in petrol and thus guaranteeknock-free combustion, can, however, create newproblems. Lead compounds were banned frompetrol after a relationship between impaired intelli-gence development in children and high levels ofatmospheric lead had been established. Financialincentives strongly encouraged the use ofunleaded petrol, quickly increasing market shares.Unleaded petrol is also required by catalyst-equipped cars, since free lead would poison thecatalysts and render them ineffective. However,unleaded petrol is being used in cars without cat-alytic converters, increasing the emissions ofvolatile organic compounds (VOCs), particularlybenzene, a proven genotoxic carcinogen which canincrease the risk of developing leukaemia (EPAQS,1994). In this case, the removal of one harmfulcompound and its replacement by others m i g h thave shifted, rather than removed, the problem.The introduction of three-way catalytic converters,which reduce amounts of CO, HC and NOx in theexhaust gases of new petrol-driven cars registeredafter 1 January 1993 (EC Directive 91/441/EEC), willlower atmospheric concentrations of these pollu-tants. However, the turnover of the vehicle fleetwill take several years, and any increase in number
of journeys undertaken in private cars will reduceand eventually offset improvements (Elsom, 1996).
A reduction of air pollutant concentrations inthe vicinity of industrial facilities or waste incinera-tors can be achieved by regulating minimum stackheights, thus ensuring a wider distribution anddilution of the pollutants. The temperature of thegases is also important, since warmer gases willrise as they leave the stack and thus the plume willbe dispersed over a larger area. This approach isthe strategy most often applied since it does lowerthe impact on individuals and the environment inthe vicinity of the plant, although it does notreduce the total emissions and simply dispersesthe pollutants over a larger area. Unfortunately,this approach may thus lead to transboundarylong-range pollution problems. Several interna-tional agreements have been signed by a majority
17
Understanding Urban Air Pollution Problems - Sources, Impacts and Control Strategies
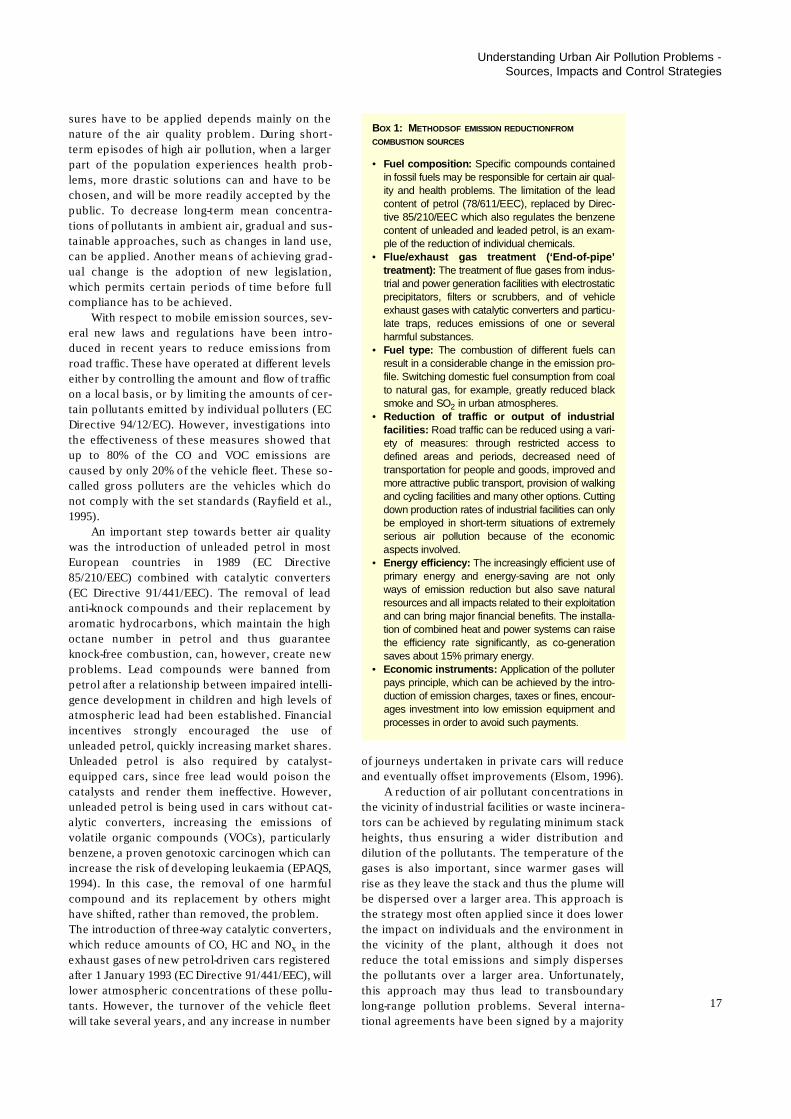
BO X 1: ME T H O D SO F E M I S S I O N R E D U C T I O NF R O M
C O M B U S T I O N S O U R C E S
• Fuel composition: Specific compounds containedin fossil fuels may be responsible for certain air qual-ity and health problems. The limitation of the leadcontent of petrol (78/611/EEC), replaced by Direc-tive 85/210/EEC which also regulates the benzenecontent of unleaded and leaded petrol, is an exam-ple of the reduction of individual chemicals.
• Flue/exhaust gas treatment (‘End-of-pipe’treatment): The treatment of flue gases from indus-trial and power generation facilities with electrostaticprecipitators, filters or scrubbers, and of vehicleexhaust gases with catalytic converters and particu-late traps, reduces emissions of one or severalharmful substances.
• Fuel type: The combustion of different fuels canresult in a considerable change in the emission pro-file. Switching domestic fuel consumption from coalto natural gas, for example, greatly reduced blacksmoke and SO2 in urban atmospheres.
• Reduction of traffic or output of industrialf a c i l i t i e s : Road traffic can be reduced using a vari-ety of measures: through restricted access todefined areas and periods, decreased need oftransportation for people and goods, improved andmore attractive public transport, provision of walkingand cycling facilities and many other options. Cuttingdown production rates of industrial facilities can onlybe employed in short-term situations of extremelyserious air pollution because of the economicaspects involved.
• Energy efficiency: The increasingly efficient use ofprimary energy and energy-saving are not onlyways of emission reduction but also save naturalresources and all impacts related to their exploitationand can bring major financial benefits. The installa-tion of combined heat and power systems can raisethe efficiency rate significantly, as co-generationsaves about 15% primary energy.
• Economic instruments: Application of the polluterpays principle, which can be achieved by the intro-duction of emission charges, taxes or fines, encour-ages investment into low emission equipment andprocesses in order to avoid such payments.
of European countries in order to limit emissionsof compounds involved in these transboundaryproblems (Box 5, Chapter 6).An important aspect to be borne in mind is theconcept of integrated pollution control, whichimplies that the improvement of one environmen-tal sector must not cause the deterioration ofanother. For example, the removal of pollutantsfrom flue gases using electrostatic precipitators,filters or scrubbers reduces their concentration inthe atmosphere, but generates solid or liquidwastes which have to be disposed of in a soundmanner without posing any risk to the receivingenvironmental media.
Under the title 'Towards Sustainability', the EUdesigned the 5th Environmental Action Pro-gramme as a community-wide approach toimprove the environmental situation. Five targetsectors were selected, namely manufacturingindustry, energy, transport, agriculture andtourism, which are all relevant to current andfuture air quality. The mechanisms by which sus-tainable development will be reached include theintegration of environmental considerations intoother policy areas and a broadening of the rangeof instruments, particularly economic instrumentssuch as the internalisation of external costs(COM(95) 624, 1995).
Understanding Urban Air Pollution Problems - Sources, Impacts and Control Strategies
18
E m i s s i o nR e d u c t i o n
Fuel C o m p o s i t i o n
F l u eGas Treatment
F u e lT y p e
E n e r g yE f f i c i e n c yR e d u c t i o neof Traffic
or Production
Individual Pollutants
Overall Emissions
Economic Instruments
Figure 2.4P o s s i b l e
a p p r o a c h e stowards emission
r e d u c t i o n
The relationship between air quality andhuman health and the state of the environ-
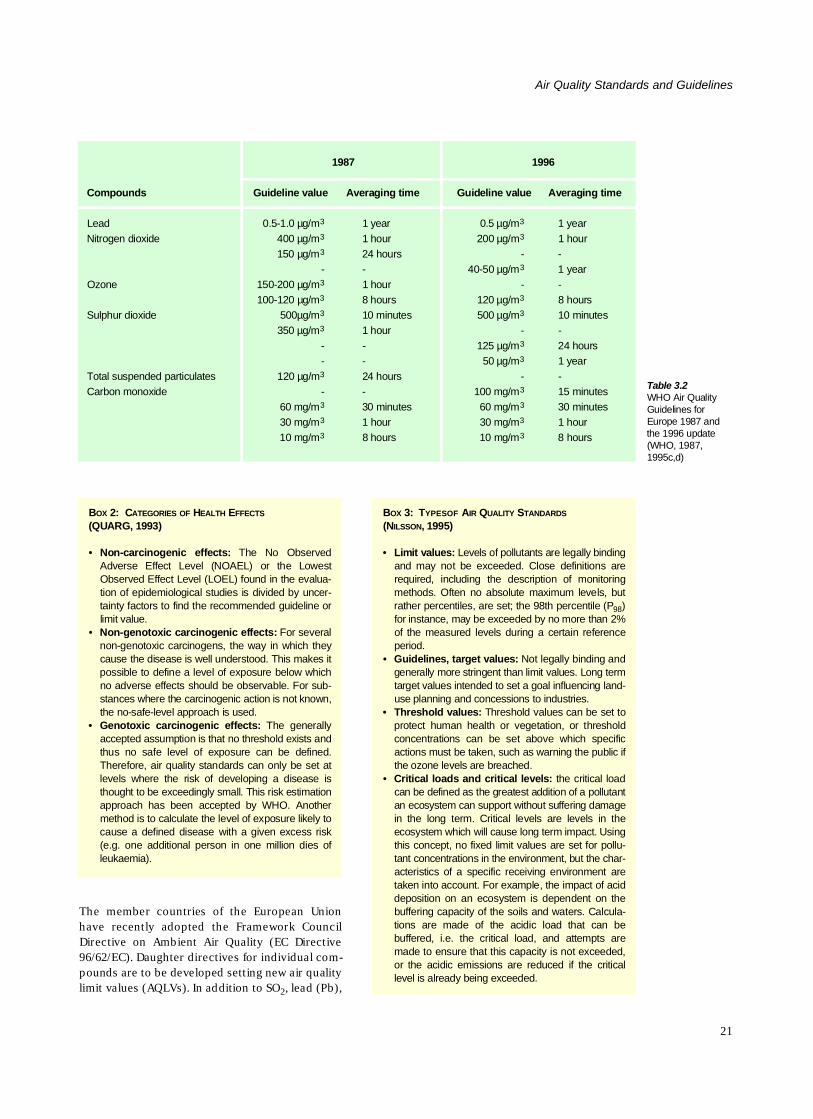
ment as a whole has been recognised for a longtime. In order to protect humans, animals and veg-etation from adverse effects that are caused by ele-vated concentrations of air pollutants, limit valuesfor pollutant concentrations have to be set andenforced. The acute and chronic health effects ofthe major air pollutants are described in Table 3.1.A first set of European air quality guidelines cover-ing 28 compounds was suggested by the WHO in1987 (WHO, 1987). Currently these guidelines arebeing revised and amended, and will be extendedto 38 individual and mixtures of air pollutants.Although these guideline values have no legalpower, many countries have based the develop-ment of national air quality standards on them(WHO, 1995a). Summaries of guidelines, limits andthresholds for the major air pollutants are given inTables 3.2 to 3 . 5.
Formulation of Air Quality Standards
The level at which air quality standards are fixed,are generally a compromise between maximumprotection and technically and economically feasi-ble limits. The implementation of air pollutionabatement measures can involve major capitalinvestment, but this should be balanced againstthe advantages of clean and healthy air. This costbenefit analysis is hardly ever carried out. The pro-tection of human health is the aspect of predomi-nant concern in the process of setting guidelinelevels. Toxicological information derived from
Chapter 3
Air Quality Standard sand Guidelines
19
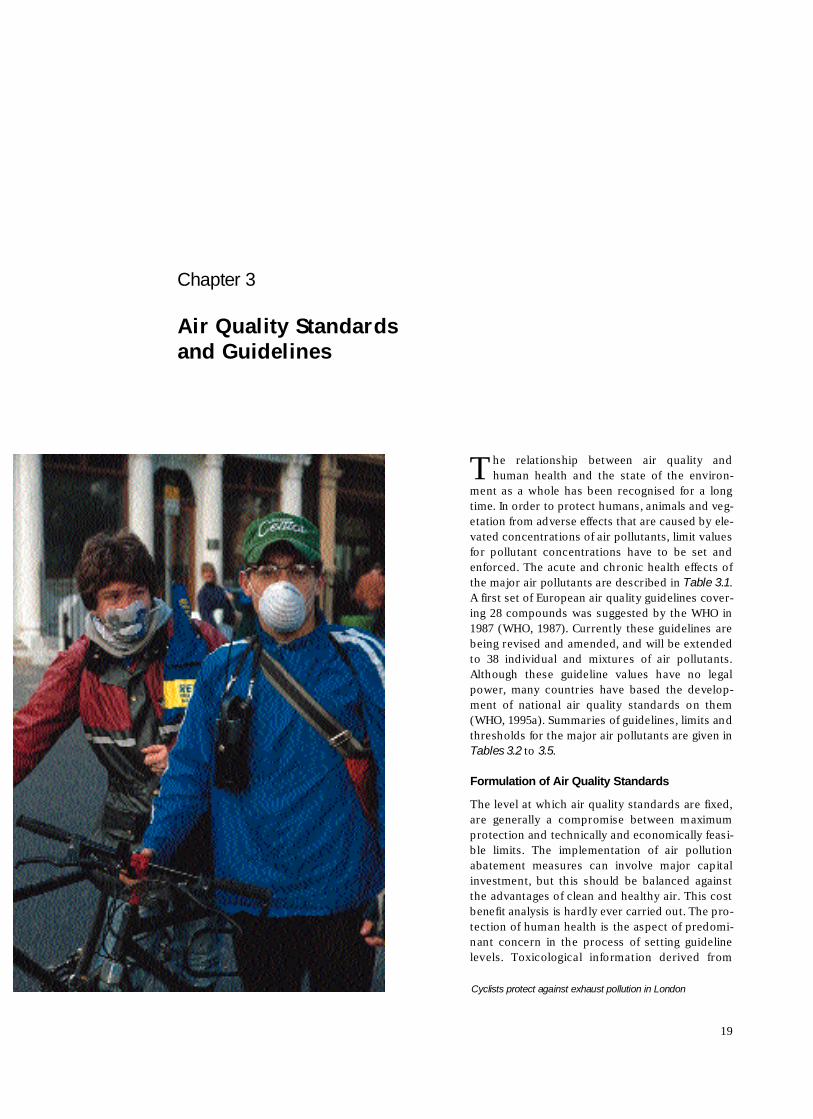
Cyclists protect against exhaust pollution in London
e p idemiological studies is evaluated, the nature ofthe health effect is taken into account (Box 2), a n dadditional safety factors are used, taking into con-sideration more vulnerable members of societyand assuming a lifetime exposure, to calculate anacceptable value (Nilsson, 1995). Box 3 s u m m a-rizes different approaches to the definition of airquality standards. It is important that those levelseventually adopted are, on the one hand, achiev-able but, on the other, pose a challenge for con-stant improvement of air quality. They must not beperceived as upper limits which may be reached ifthat entails a deterioration of present air quality.
Compounds are generally treated in isolation,whereas possible interactions, which can causeadditive, synergistic or antagonistic effects, aregenerally ignored. Few toxicological studies oncombined exposure have been undertaken and the
lack of data makes evaluation virtually impossible.Exposure to the same substance by one or moreroutes, e.g. by inhalation and consumption of food,is assumed to have no more than an additiveeffect. So far, only one air quality standard govern-ing the simultaneous occurrence of pollutants hasbeen set in the EU. The compounds are sulphurdioxide (SO2) and particulates which are thoughtto have synergistic effects (Nilsson, 1995). Histori-cally, they were often present at the same time,since their common source is domestic and indus-trial combustion of coal. On the whole, knowledgeof the effects of mixtures of pollutants is veryrestricted; intensive research and the developmentand enforcement of guidelines, to protect humansand the environment from the toxic cocktail of pol-lutants sometimes present in ambient air, is clearlynecessary (AGMAAPE, 1995).
Air Quality Standards and Guidelines
20
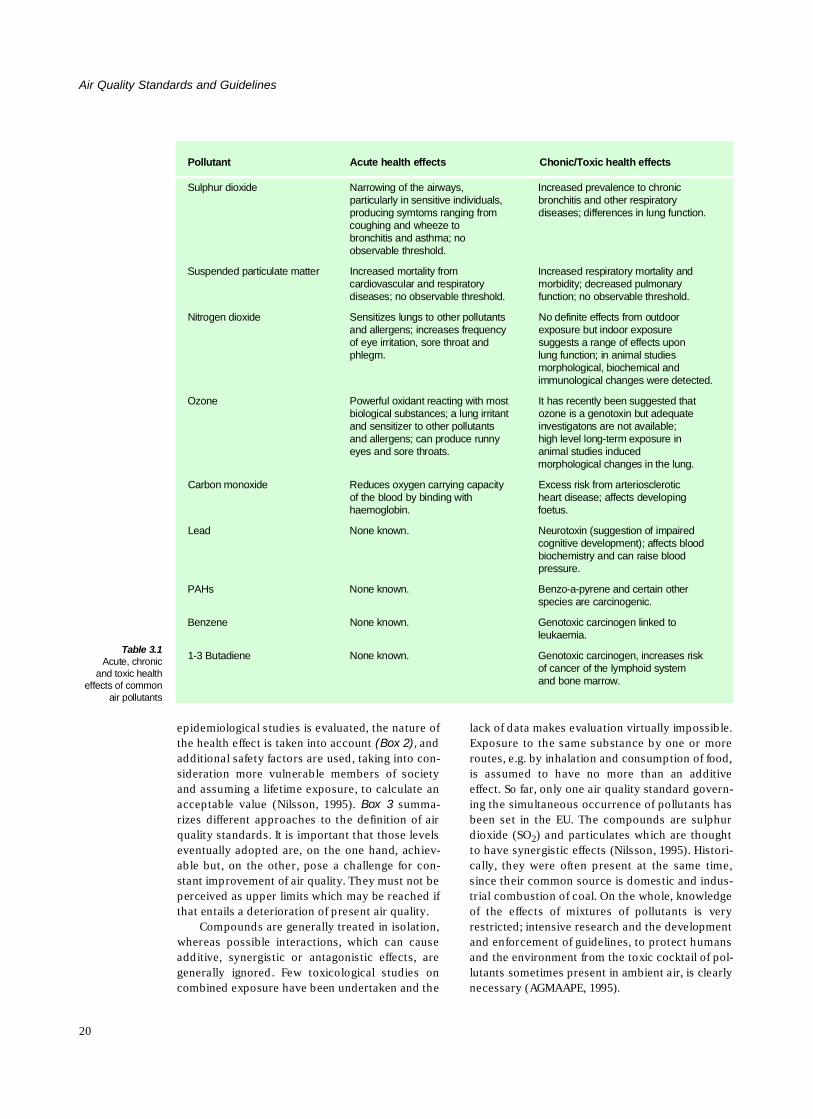
Table 3.1Acute, chronic
and toxic healtheffects of common
air pollutants
P o l l u t a n t Acute health effects Chonic/Toxic health effects
Sulphur dioxide Narrowing of the airways, Increased prevalence to chronic particularly in sensitive individuals, bronchitis and other respiratoryproducing symtoms ranging from diseases; differences in lung function. coughing and wheeze tobronchitis and asthma; noobservable threshold.
Suspended particulate matter Increased mortality from Increased respiratory mortality andcardiovascular and respiratory morbidity; decreased pulmonarydiseases; no observable threshold. function; no observable threshold.
Nitrogen dioxide Sensitizes lungs to other pollutants No definite effects from outdoorand allergens; increases frequency exposure but indoor exposureof eye irritation, sore throat and suggests a range of effects uponp h l e g m . lung function; in animal studies
morphological, biochemical andimmunological changes were detected.
O z o n e Powerful oxidant reacting with most It has recently been suggested that biological substances; a lung irritant ozone is a genotoxin but adequateand sensitizer to other pollutants investigatons are not available;and allergens; can produce runny high level long-term exposure ineyes and sore throats. animal studies induced
morphological changes in the lung.
Carbon monoxide Reduces oxygen carrying capacity Excess risk from arterioscleroticof the blood by binding with heart disease; affects developing h a e m o g l o b i n . f o e t u s .
L e a d None known. Neurotoxin (suggestion of impaired cognitive development); affects blood biochemistry and can raise bloodp r e s s u r e .
P A H s None known. Benzo-a-pyrene and certain other species are carcinogenic.
B e n z e n e None known. Genotoxic carcinogen linked to l e u k a e m i a .
1-3 Butadiene None known. Genotoxic carcinogen, increases riskof cancer of the lymphoid systemand bone marrow.
The member countries of the European Unionhave recently adopted the Framework CouncilDirective on Ambient Air Quality (EC Directive96/62/EC). Daughter directives for individual com-pounds are to be developed setting new air qualitylimit values (AQLVs). In addition to SO2, lead (Pb),
21
Air Quality Standards and Guidelines
BO X 2: CA T E G O R I E S O F HE A L T H EF F E C T S
(QUARG, 1993)
• Non-carcinogenic effects: The No ObservedAdverse Effect Level (NOAEL) or the LowestObserved Effect Level (LOEL) found in the evalua-tion of epidemiological studies is divided by uncer-tainty factors to find the recommended guideline orlimit value.
• Non-genotoxic carcinogenic effects: For severalnon-genotoxic carcinogens, the way in which theycause the disease is well understood. This makes itpossible to define a level of exposure below whichno adverse effects should be observable. For sub-stances where the carcinogenic action is not known,the no-safe-level approach is used.
• Genotoxic carcinogenic effects: The generallyaccepted assumption is that no threshold exists andthus no safe level of exposure can be defined.Therefore, air quality standards can only be set atlevels where the risk of developing a disease isthought to be exceedingly small. This risk estimationapproach has been accepted by WHO. Anothermethod is to calculate the level of exposure likely tocause a defined disease with a given excess risk(e.g. one additional person in one million dies ofl e u k a e m i a ) .
1 9 8 7 1 9 9 6
C o m p o u n d s Guideline value Averaging time Guideline value Averaging time
L e a d 0.5-1.0 µg/m3 1 year 0.5 µg/m3 1 yearNitrogen dioxide 400 µg/m3 1 hour 200 µg/m3 1 hour
150 µg/m3 24 hours - -- - 40-50 µg/m3 1 year
O z o n e 150-200 µg/m3 1 hour - -100-120 µg/m3 8 hours 120 µg/m3 8 hours
Sulphur dioxide 5 0 0 µ g /m3 10 minutes 500 µg/m3 10 minutes350 µg/m3 1 hour - -
- - 125 µg/m3 24 hours- - 50 µg/m3 1 year
Total suspended particulates 120 µg/m3 24 hours - -Carbon monoxide - - 100 mg/m3 15 minutes
60 mg/m3 30 minutes 60 mg/m3 30 minutes30 mg/m3 1 hour 30 mg/m3 1 hour10 mg/m3 8 hours 10 mg/m3 8 hours
Table 3.2WHO Air QualityGuidelines forEurope 1987 andthe 1996 update(WHO, 1987,1 9 9 5 c , d )
BO X 3: TY P E SO F AI R QU A L I T Y ST A N D A R D S
( NI L S S O N, 1995)
• Limit values: Levels of pollutants are legally bindingand may not be exceeded. Close definitions arerequired, including the description of monitoringmethods. Often no absolute maximum levels, butrather percentiles, are set; the 98th percentile (P9 8)for instance, may be exceeded by no more than 2%of the measured levels during a certain referencep e r i o d .
• Guidelines, target values: Not legally binding andgenerally more stringent than limit values. Long termtarget values intended to set a goal influencing land-use planning and concessions to industries.
• Threshold values: Threshold values can be set toprotect human health or vegetation, or thresholdconcentrations can be set above which specificactions must be taken, such as warning the public ifthe ozone levels are breached.
• Critical loads and critical levels: the critical loadcan be defined as the greatest addition of a pollutantan ecosystem can support without suffering damagein the long term. Critical levels are levels in theecosystem which will cause long term impact. Usingthis concept, no fixed limit values are set for pollu-tant concentrations in the environment, but the char-acteristics of a specific receiving environment aretaken into account. For example, the impact of aciddeposition on an ecosystem is dependent on thebuffering capacity of the soils and waters. Calcula-tions are made of the acidic load that can bebuffered, i.e. the critical load, and attempts aremade to ensure that this capacity is not exceeded,or the acidic emissions are reduced if the criticallevel is already being exceeded.
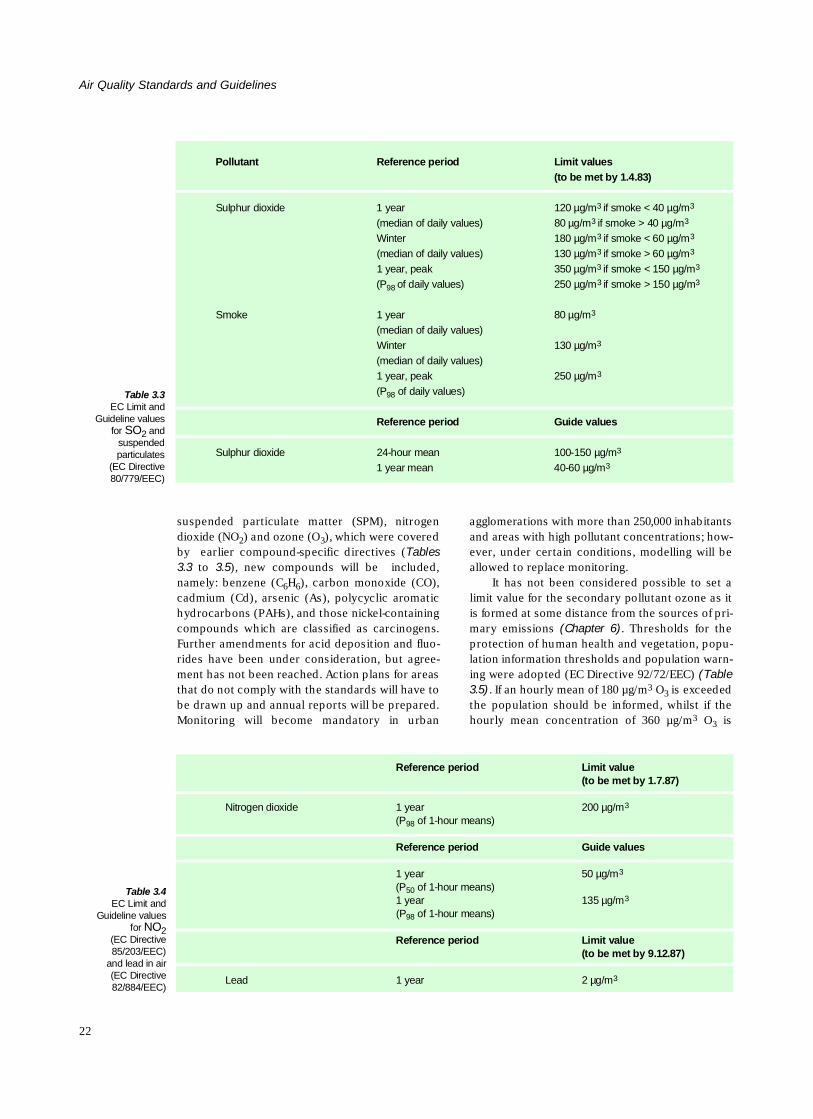
suspended particulate matter (SPM), nitrogendioxide (NO2) and ozone (O3), which were coveredby earlier compound-specific directives (T a b l e s3 . 3 to 3 . 5), new compounds will be included,namely: benzene (C6H6), carbon monoxide (CO),cadmium (Cd), arsenic (As), polycyclic aromatichydrocarbons (PAHs), and those nickel-containingcompounds which are classified as carcinogens.Further amendments for acid deposition and fluo-rides have been under consideration, but agree-ment has not been reached. Action plans for areasthat do not comply with the standards will have tobe drawn up and annual reports will be prepared.Monitoring will become mandatory in urban
agglomerations with more than 250,000 inhabitantsand areas with high pollutant concentrations; how-ever, under certain conditions, modelling will beallowed to replace monitoring.
It has not been considered possible to set alimit value for the secondary pollutant ozone as itis formed at some distance from the sources of pri-mary emissions (Chapter 6). Thresholds for theprotection of human health and vegetation, popu-lation information thresholds and population warn-i n g were adopted (EC Directive 92/72/EEC) ( T a b l e3 . 5 ). If an hourly mean of 180 µg/m3 O3 is exceededthe population should be informed, whilst if thehourly mean concentration of 360 µg/m3 O3 i s
Air Quality Standards and Guidelines
22
P o l l u t a n t Reference period Limit values
(to be met by 1.4.83)
Sulphur dioxide 1 year 120 µg/m3 if smoke < 40 µg/m3
(median of daily values) 80 µg/m3 if smoke > 40 µg/m3
W i n t e r 180 µg/m3 if smoke < 60 µg/m3
(median of daily values) 130 µg/m3 if smoke > 60 µg/m3
1 year, peak 350 µg/m3 if smoke < 150 µg/m3
( P98 of daily values) 250 µg/m3 if smoke > 150 µg/m3
S m o k e 1 year 80 µg/m3
(median of daily values)W i n t e r 130 µg/m3
(median of daily values)1 year, peak 250 µg/m3
( P9 8 of daily values)
Reference period Guide values
Sulphur dioxide 24-hour mean 100-150 µg/m3
1 year mean 40-60 µg/m3
Table 3.3 EC Limit and
Guideline valuesfor S O2 a n d
s u s p e n d e dp a r t i c u l a t e s
(EC Directive8 0 / 7 7 9 / E E C )
Reference period Limit value(to be met by 1.7.87)
Nitrogen dioxide 1 year 200 µg/m3
( P9 8 of 1-hour means)
Reference period Guide values
1 year 50 µg/m3
( P5 0 of 1-hour means)1 year 135 µg/m3
( P9 8 of 1-hour means)
Reference period Limit value(to be met by 9.12.87)
L e a d 1 year 2 µg/m3
Table 3.4EC Limit and
Guideline valuesfor N O2
(EC Directive8 5 / 2 0 3 / E E C )
and lead in air(EC Directive8 2 / 8 8 4 / E E C )
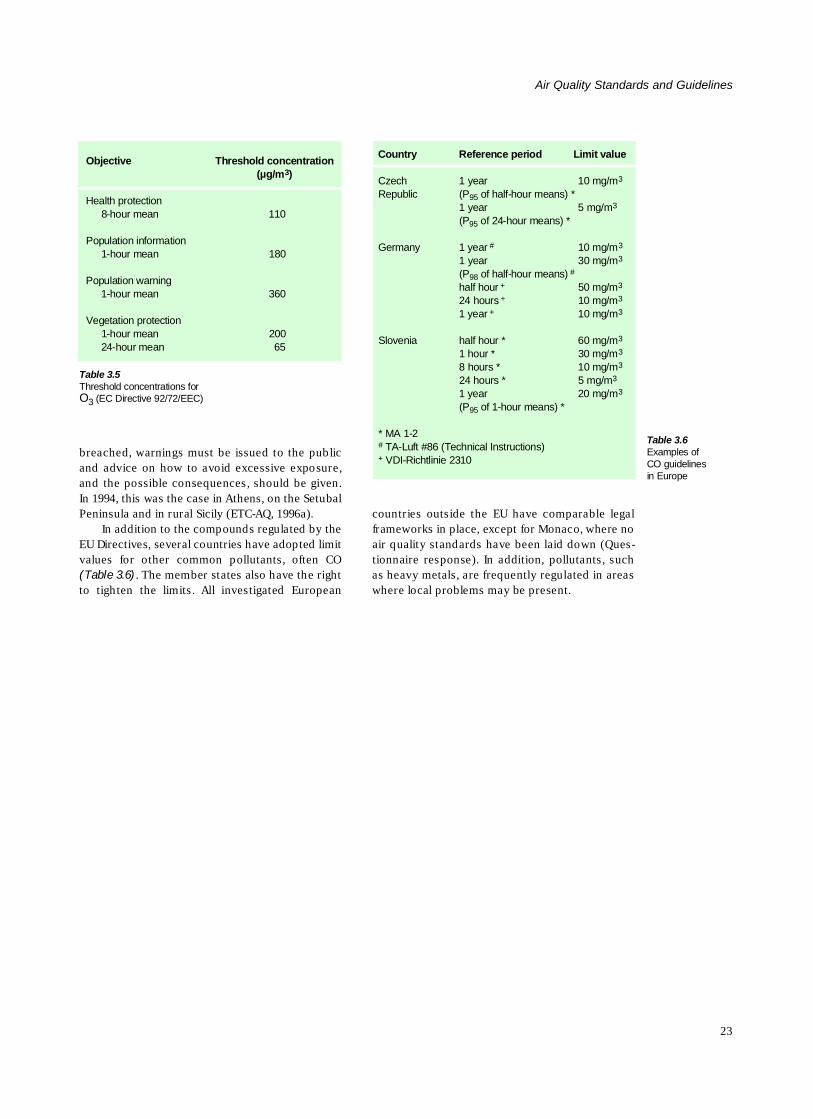
breached, warnings must be issued to the publicand advice on how to avoid excessive exposure,and the possible consequences, should be given.In 1994, this was the case in Athens, on the SetubalPeninsula and in rural Sicily (ETC-AQ, 1996a).
In addition to the compounds regulated by theEU Directives, several countries have adopted limitvalues for other common pollutants, often CO(Table 3.6). The member states also have the rightto tighten the limits. All investigated European
countries outside the EU have comparable legalframeworks in place, except for Monaco, where noair quality standards have been laid down (Ques-tionnaire response). In addition, pollutants, suchas heavy metals, are frequently regulated in areaswhere local problems may be present.
23
Air Quality Standards and Guidelines
O b j e c t i v e Threshold concentration( µ g /m3)
Health protection8-hour mean 1 1 0
Population information1-hour mean 1 8 0
Population warning1-hour mean 3 6 0
Vegetation protection1-hour mean 2 0 024-hour mean 6 5
C o u n t r y Reference period Limit value
C z e c h 1 year 10 mg/m3
R e p u b l i c ( P9 5 of half-hour means) *1 year 5 mg/m3
( P9 5 of 24-hour means) *
G e r m a n y 1 year # 10 mg/m3
1 year 30 mg/m3
( P9 8 of half-hour means) #
half hour + 50 mg/m3
24 hours + 10 mg/m3
1 year + 10 mg/m3
Slovenia half hour * 60 mg/m3
1 hour * 30 mg/m3
8 hours * 10 mg/m3
24 hours * 5 mg/m3
1 year 20 mg/m3
( P9 5 of 1-hour means) *
* MA 1-2# TA-Luft #86 (Technical Instructions)+ VDI-Richtlinie 2310
Table 3.6Examples ofCO guidelinesin Europe
Table 3.5Threshold concentrations forO3 (EC Directive 92/72/EEC)

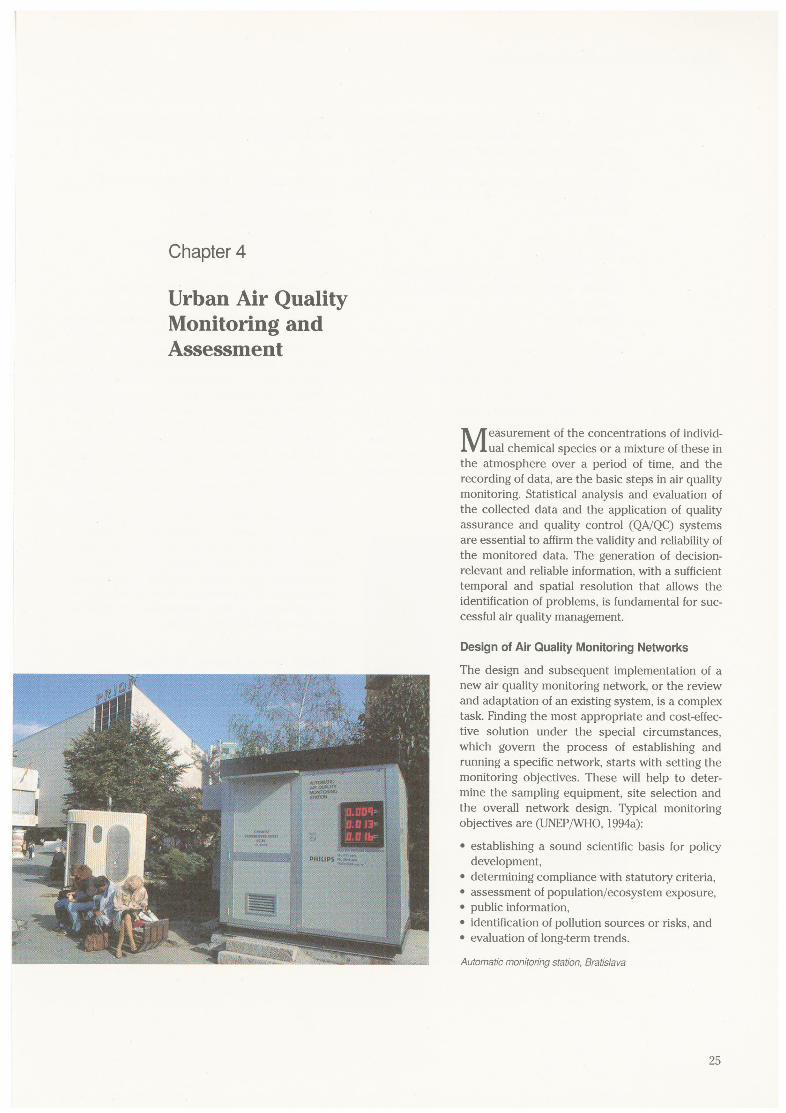
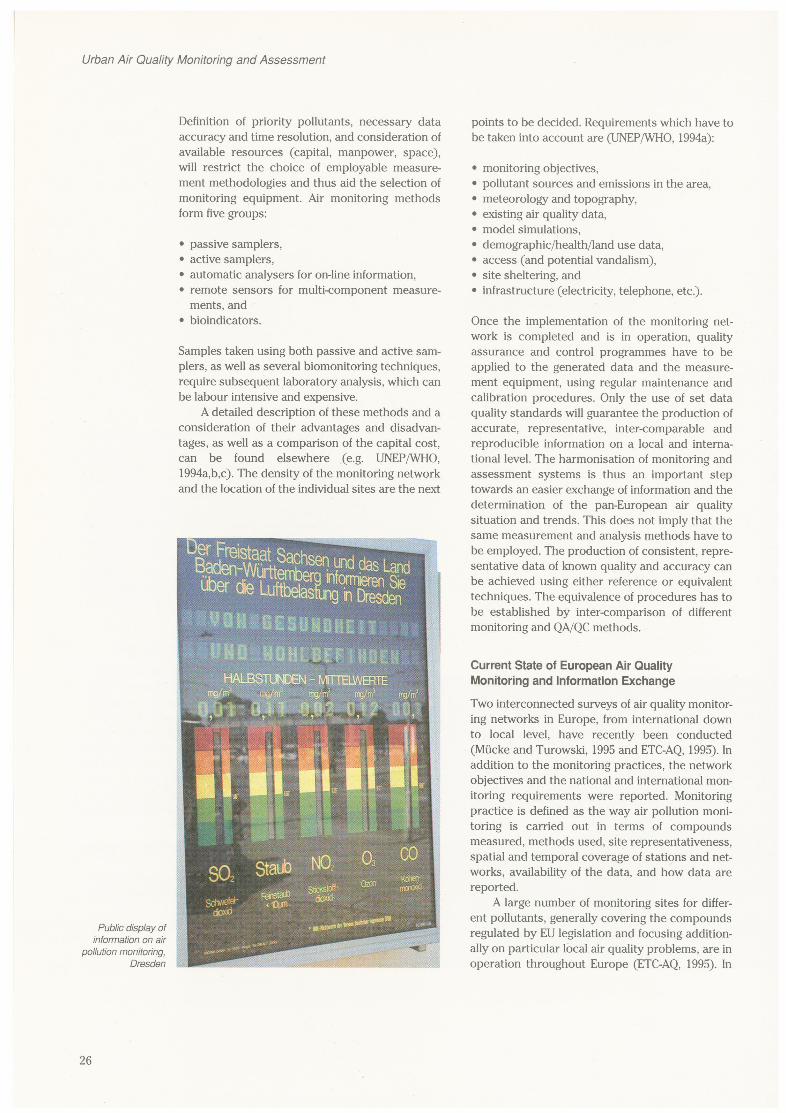
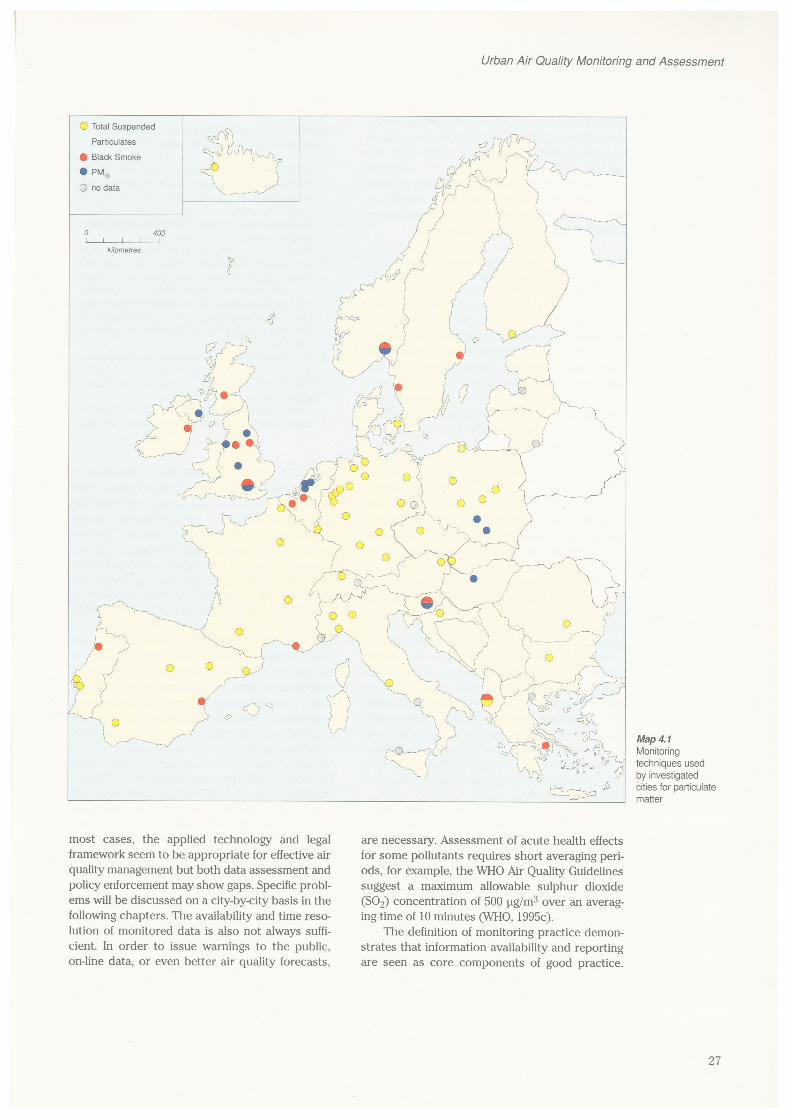
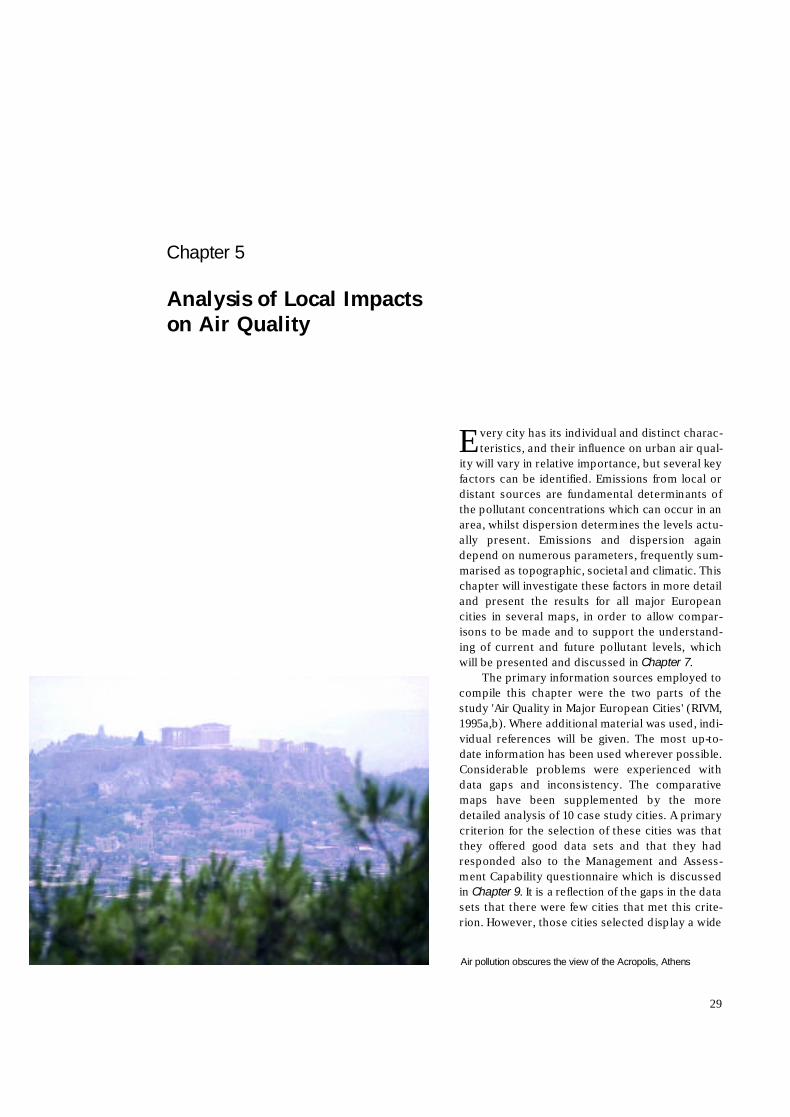
Every city has its individual and distinct charac-teristics, and their influence on urban air qual-
ity will vary in relative importance, but several keyfactors can be identified. Emissions from local ordistant sources are fundamental determinants ofthe pollutant concentrations which can occur in anarea, whilst dispersion determines the levels actu-ally present. Emissions and dispersion againdepend on numerous parameters, frequently sum-marised as topographic, societal and climatic. Thischapter will investigate these factors in more detailand present the results for all major Europeancities in several maps, in order to allow compar-isons to be made and to support the understand-ing of current and future pollutant levels, whichwill be presented and discussed in Chapter 7.
The primary information sources employed tocompile this chapter were the two parts of thestudy 'Air Quality in Major European Cities' (RIVM,1995a,b). Where additional material was used, indi-vidual references will be given. The most up-to-date information has been used wherever possible.Considerable problems were experienced withdata gaps and inconsistency. The comparativemaps have been supplemented by the moredetailed analysis of 10 case study cities. A primarycriterion for the selection of these cities was thatthey offered good data sets and that they hadresponded also to the Management and Assess-ment Capability questionnaire which is discussedin Chapter 9. It is a reflection of the gaps in the datasets that there were few cities that met this crite-rion. However, those cities selected display a wide
Chapter 5
Analysis of Local Impactson Air Quality
29
Air pollution obscures the view of the Acropolis, Athens
range of geographic, social and economic condi-tions and provide data that throw considerablelight on the range of air quality problems experi-enced by cities in Europe.
The City and Its Population
This study aimed at investigating European citieswith more than 500,000 inhabitants. However, insome smaller countries, where urban populationsdo not reach this number, the largest city, oftenthe capital, was selected. It is difficult to defineboundaries of a city and various approaches con-sidering administrative units (municipalities), pop-ulation density or building density have beenattempted, but none of these was entirely satisfac-tory. The concept of morphological city bound-aries defining a conurbation was adopted, makingthe assessment of large urban agglomerations pos-sible. London and Paris are examples for this typeof extensive urban areas, where a prime (core) cityis surrounded by secondary satellite towns andsuburbs. Thus a core municipality together withits morphologically integrated neighbouringcities/towns, or a city and its suburbs, excludingsecondary towns or suburbs separated by more
than 2.5 km from the prime city, is termed a conur-bation (RIVM, 1995a). Where possible, the built-uparea of the city has been obtained or estimated aswell as the total area, since emission sources andpotentially exposed population are concentratedin the former.
Urban areas, which fall under this definition inthe parts of Europe investigated, are inhabited byabout 100 million people, 19% of the total popula-tion. London is spatially the most extensive conur-bation considered with 1,580 km2 and, with 10.6million inhabitants, it also has the largest popula-tion. The distribution of inhabitant numbers andbuilt-up or total areas is shown in Figure 5.1. Thisshows a wide diversity of city area for each popu-lation category, but most cities with populations ofover 0.5 million cover an area of more than 100k m2, with 28 cities occupying areas of greater than200 km2.
In several cases, highly industrialised areas,consisting of more than one municipality, withlarge total populations were considered relevantfor this report. So the Katowice region with about3 million inhabitants, only about a tenth of whichlive in Katowice itself, and the Setubal Peninsulawith a total population of 650,000 in nine munici-palities including Barreiro/Seixal and Setubalwhich is inhabited by 105,000 people, were takeninto account as well. Both areas are pollution hotspots with industrial facilities of national importance.
Environmental Indicators
In recent years there has been a perceived needfor data analyses that address management needsfor decision-making. Increasingly, the use of aggre-gated data to produce numerical environmentalindicators has been seen as a useful managementtool. An environmental indicator should have anumber of attributes including:
• its base parameters should be measurable in areliable and quality controlled manner, and
• the indicator should be responsive to the rangeof environmental conditions that it describes.
A number of air quality indices have beendesigned to express key determinants of air qualityin an accessible and understandable manner. Inthis chapter the indices developed and used in ‘AirQuality in Major European Cities’ (RIVM, 1995a,b)are briefly described and used to examine air qual-ity determinants in the investigated cities. Otherindices developed in the ‘Air Quality Managementand Assessment Capabilities in 20 Major Cities’(UNEP/WHO, 1996) are used in Chapter 9.
Analysis of Local Impacts on Air Quality
30
< 0.5 0.5 - 1 1 - 2 > 2
< 5
05
0 -
10
01
00
- 2
00
> 2
000
2
4
6
8
10
12
14
Figure 5.1Distribution of
population sizeand area of
investigated cities
population (millions) a r e a( k m2)
Amsterdam showsthat road vehicles
are not the onlyform of transport
causing air pollution
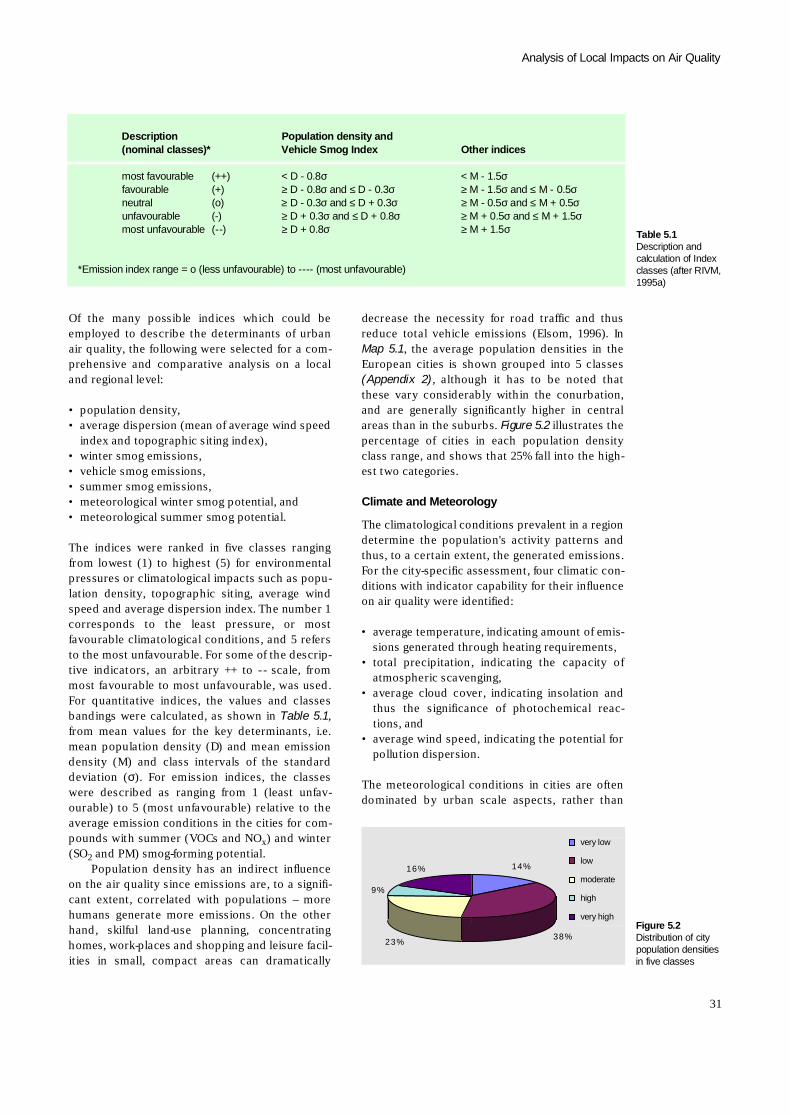
Of the many possible indices which could beemployed to describe the determinants of urbanair quality, the following were selected for a com-prehensive and comparative analysis on a localand regional level:
• population density,• average dispersion (mean of average wind speed
index and topographic siting index),• winter smog emissions,• vehicle smog emissions,• summer smog emissions,• meteorological winter smog potential, and• meteorological summer smog potential.
The indices were ranked in five classes rangingfrom lowest (1) to highest (5) for environmentalpressures or climatological impacts such as popu-lation density, topographic siting, average windspeed and average dispersion index. The number 1corresponds to the least pressure, or mostfavourable climatological conditions, and 5 refersto the most unfavourable. For some of the descrip-tive indicators, an arbitrary ++ to - - scale, frommost favourable to most unfavourable, was used.For quantitative indices, the values and classesbandings were calculated, as shown in Table 5.1,from mean values for the key determinants, i.e.mean population density (D) and mean emissiondensity (M) and class intervals of the standarddeviation (σ). For emission indices, the classeswere described as ranging from 1 (least unfav-ourable) to 5 (most unfavourable) relative to theaverage emission conditions in the cities for com-pounds with summer (VOCs and NOx) and winter( S O2 and PM) smog-forming potential.
Population density has an indirect influenceon the air quality since emissions are, to a signifi-cant extent, correlated with populations – morehumans generate more emissions. On the otherhand, skilful land-use planning, concentratinghomes, work-places and shopping and leisure facil-ities in small, compact areas can dramatically
decrease the necessity for road traffic and thusreduce total vehicle emissions (Elsom, 1996). InMap 5.1, the average population densities in theEuropean cities is shown grouped into 5 classes(Appendix 2), although it has to be noted thatthese vary considerably within the conurbation,and are generally significantly higher in centralareas than in the suburbs. Figure 5.2 illustrates thepercentage of cities in each population densityclass range, and shows that 25% fall into the high-est two categories.
Climate and Meteorology
The climatological conditions prevalent in a regiondetermine the population's activity patterns andthus, to a certain extent, the generated emissions.For the city-specific assessment, four climatic con-ditions with indicator capability for their influenceon air quality were identified:
• average temperature, indicating amount of emis-sions generated through heating requirements,
• total precipitation, indicating the capacity ofatmospheric scavenging,
• average cloud cover, indicating insolation andthus the significance of photochemical reac-tions, and
• average wind speed, indicating the potential forpollution dispersion.
The meteorological conditions in cities are oftendominated by urban scale aspects, rather than
31
Analysis of Local Impacts on Air Quality
Description Population density and(nominal classes)* Vehicle Smog Index Other indices
most favourable ( + + ) < D - 0.8σ < M - 1.5σf a v o u r a b l e ( + ) ≥ D - 0.8σ and ≤ D - 0.3σ ≥ M - 1.5σ and ≤ M - 0 . 5σn e u t r a l ( o ) ≥ D - 0.3σ and ≤ D + 0.3σ ≥ M - 0.5σ and ≤ M + 0.5σu n f a v o u r a b l e ( - ) ≥ D + 0.3σ and ≤ D + 0.8σ ≥ M + 0.5σ and ≤ M + 1.5σmost unfavourable (-- ) ≥ D + 0.8σ ≥ M + 1.5σ
*Emission index range = o (less unfavourable) to ---- (most unfavourable)
Table 5.1Description andcalculation of Indexclasses (after RIVM,1 9 9 5 a )
14%
38%23%
9%
16%
1
2
3
4
5Figure 5.2Distribution of citypopulation densitiesin five classes
very low
l o w
m o d e r a t e
h i g h
very high
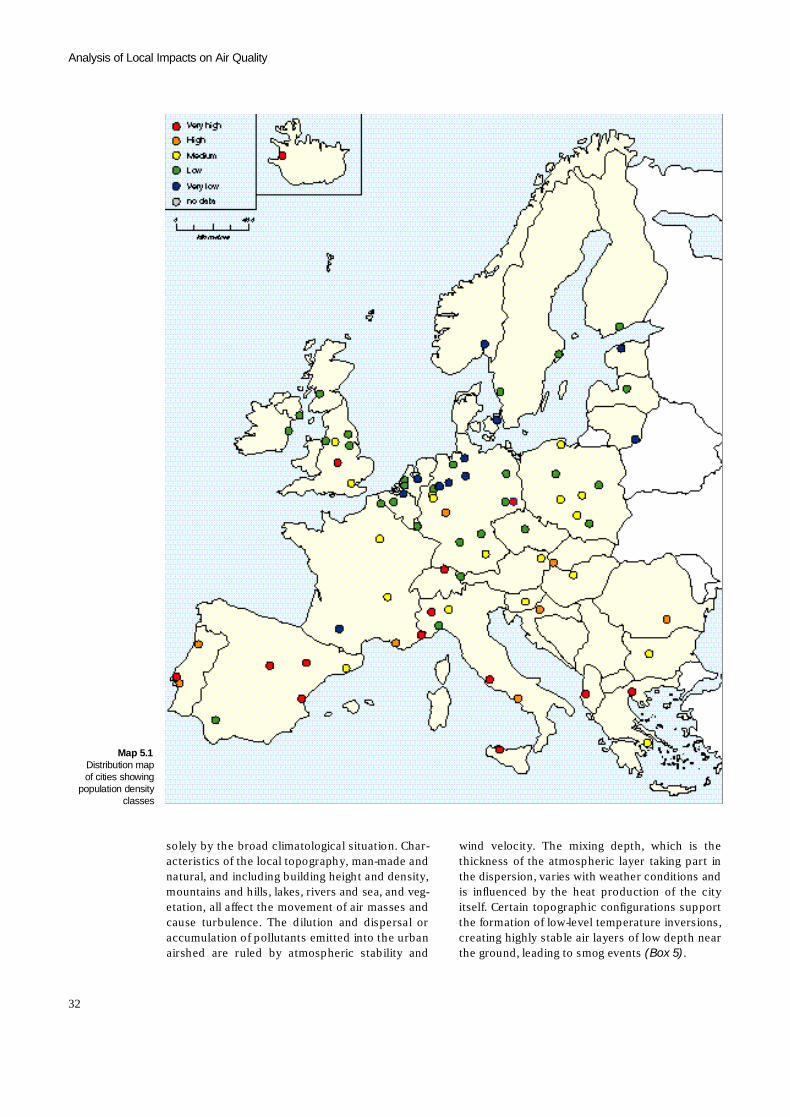
solely by the broad climatological situation. Char-acteristics of the local topography, man-made andnatural, and including building height and density,mountains and hills, lakes, rivers and sea, and veg-etation, all affect the movement of air masses andcause turbulence. The dilution and dispersal oraccumulation of pollutants emitted into the urbanairshed are ruled by atmospheric stability and
wind velocity. The mixing depth, which is thethickness of the atmospheric layer taking part inthe dispersion, varies with weather conditions andis influenced by the heat production of the cityitself. Certain topographic configurations supportthe formation of low-level temperature inversions,creating highly stable air layers of low depth nearthe ground, leading to smog events (Box 5).
Analysis of Local Impacts on Air Quality
32
Map 5.1Distribution mapof cities showing
population densityc l a s s e s
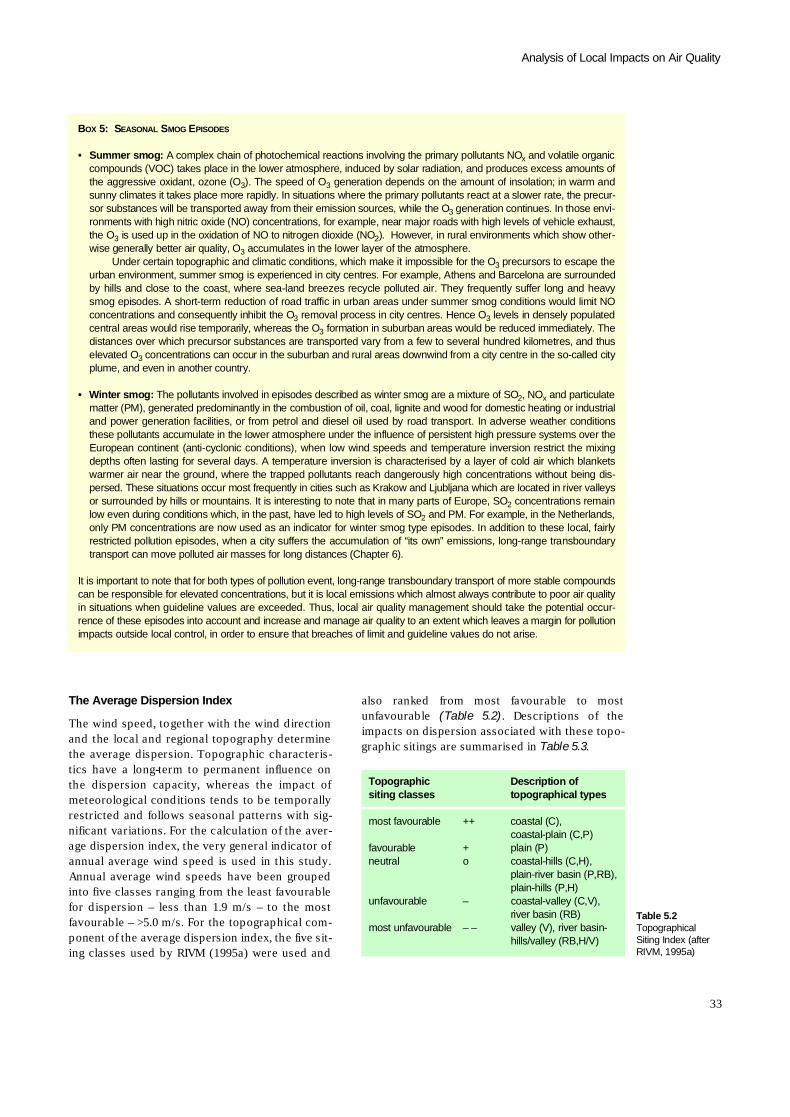
The Average Dispersion Index
The wind speed, together with the wind directionand the local and regional topography determinethe average dispersion. Topographic characteris-tics have a long-term to permanent influence onthe dispersion capacity, whereas the impact ofmeteorological conditions tends to be temporallyrestricted and follows seasonal patterns with sig-nificant variations. For the calculation of the aver-age dispersion index, the very general indicator ofannual average wind speed is used in this study.Annual average wind speeds have been groupedinto five classes ranging from the least favourablefor dispersion – less than 1.9 m/s – to the mostfavourable – >5.0 m/s. For the topographical com-ponent of the average dispersion index, the five sit-ing classes used by RIVM (1995a) were used and
also ranked from most favourable to mostunfavourable (Table 5.2). Descriptions of theimpacts on dispersion associated with these topo-graphic sitings are summarised in Table 5.3.
33
Analysis of Local Impacts on Air Quality
BO X 5: SE A S O N A L SM O G EP I S O D E S
• Summer smog: A complex chain of photochemical reactions involving the primary pollutants NOx and volatile organiccompounds (VOC) takes place in the lower atmosphere, induced by solar radiation, and produces excess amounts ofthe aggressive oxidant, ozone (O3). The speed of O3 generation depends on the amount of insolation; in warm andsunny climates it takes place more rapidly. In situations where the primary pollutants react at a slower rate, the precur-sor substances will be transported away from their emission sources, while the O3 generation continues. In those envi-ronments with high nitric oxide (NO) concentrations, for example, near major roads with high levels of vehicle exhaust,the O3 is used up in the oxidation of NO to nitrogen dioxide (NO2). However, in rural environments which show other-wise generally better air quality, O3 accumulates in the lower layer of the atmosphere.
Under certain topographic and climatic conditions, which make it impossible for the O3 precursors to escape theurban environment, summer smog is experienced in city centres. For example, Athens and Barcelona are surroundedby hills and close to the coast, where sea-land breezes recycle polluted air. They frequently suffer long and heavysmog episodes. A short-term reduction of road traffic in urban areas under summer smog conditions would limit NOconcentrations and consequently inhibit the O3 removal process in city centres. Hence O3 levels in densely populatedcentral areas would rise temporarily, whereas the O3 formation in suburban areas would be reduced immediately. Thedistances over which precursor substances are transported vary from a few to several hundred kilometres, and thuselevated O3 concentrations can occur in the suburban and rural areas downwind from a city centre in the so-called cityplume, and even in another country.
• Winter smog: The pollutants involved in episodes described as winter smog are a mixture of SO2, NOx and particulatematter (PM), generated predominantly in the combustion of oil, coal, lignite and wood for domestic heating or industrialand power generation facilities, or from petrol and diesel oil used by road transport. In adverse weather conditionsthese pollutants accumulate in the lower atmosphere under the influence of persistent high pressure systems over theEuropean continent (anti-cyclonic conditions), when low wind speeds and temperature inversion restrict the mixingdepths often lasting for several days. A temperature inversion is characterised by a layer of cold air which blanketswarmer air near the ground, where the trapped pollutants reach dangerously high concentrations without being dis-persed. These situations occur most frequently in cities such as Krakow and Ljubljana which are located in river valleysor surrounded by hills or mountains. It is interesting to note that in many parts of Europe, SO2 concentrations remainlow even during conditions which, in the past, have led to high levels of SO2 and PM. For example, in the Netherlands,only PM concentrations are now used as an indicator for winter smog type episodes. In addition to these local, fairlyrestricted pollution episodes, when a city suffers the accumulation of “its own” emissions, long-range transboundarytransport can move polluted air masses for long distances (Chapter 6).
It is important to note that for both types of pollution event, long-range transboundary transport of more stable compoundscan be responsible for elevated concentrations, but it is local emissions which almost always contribute to poor air qualityin situations when guideline values are exceeded. Thus, local air quality management should take the potential occur-rence of these episodes into account and increase and manage air quality to an extent which leaves a margin for pollutionimpacts outside local control, in order to ensure that breaches of limit and guideline values do not arise.
T o p o g r a p h i c Description ofsiting classes topographical types
most favourable + + coastal (C),coastal-plain (C,P)
favourable + plain (P)neutral o coastal-hills (C,H),
plain-river basin (P,RB),plain-hills (P,H)
unfavourable – coastal-valley (C,V),river basin (RB)
most unfavourable – – valley (V), river basin-hills/valley (RB,H/V)
Table 5.2T o p o g r a p h i c a lSiting Index (afterRIVM, 1995a)
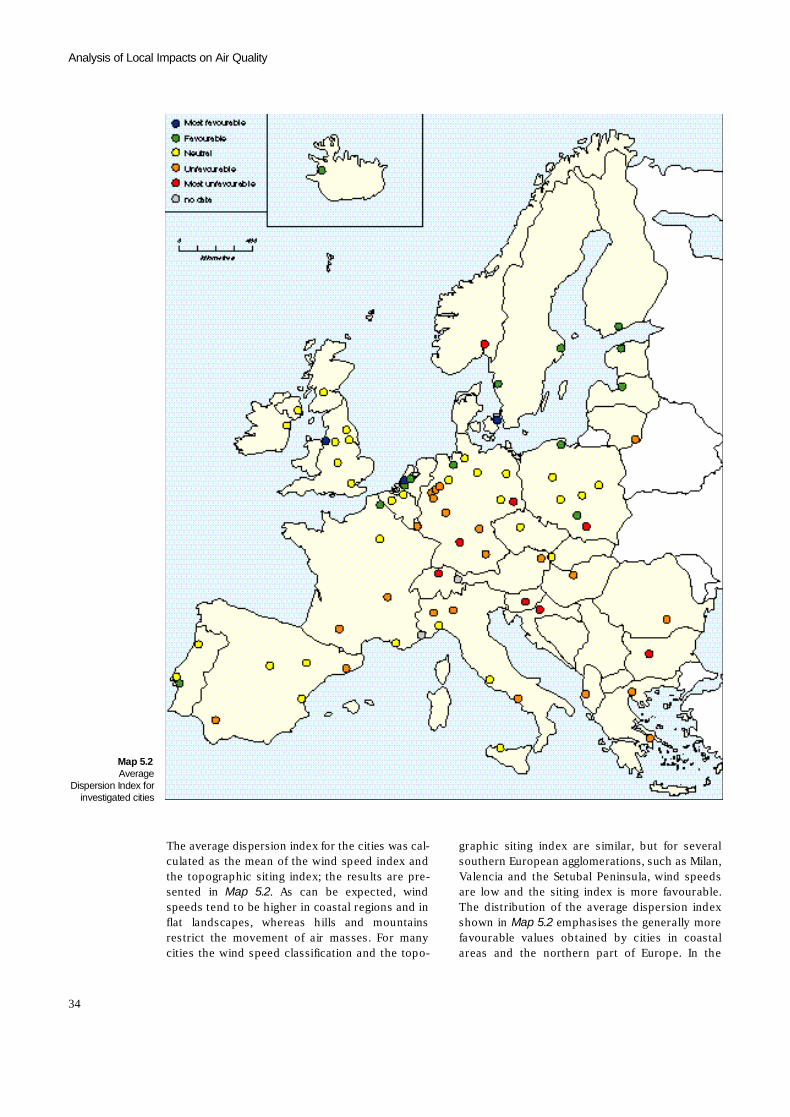
The average dispersion index for the cities was cal-culated as the mean of the wind speed index andthe topographic siting index; the results are pre-sented in Map 5.2. As can be expected, windspeeds tend to be higher in coastal regions and inflat landscapes, whereas hills and mountainsrestrict the movement of air masses. For manycities the wind speed classification and the topo-
graphic siting index are similar, but for severalsouthern European agglomerations, such as Milan,Valencia and the Setubal Peninsula, wind speedsare low and the siting index is more favourable.The distribution of the average dispersion indexshown in Map 5.2 emphasises the generally morefavourable values obtained by cities in coastalareas and the northern part of Europe. In the
Analysis of Local Impacts on Air Quality
34
Map 5.2A v e r a g e
Dispersion Index forinvestigated cities
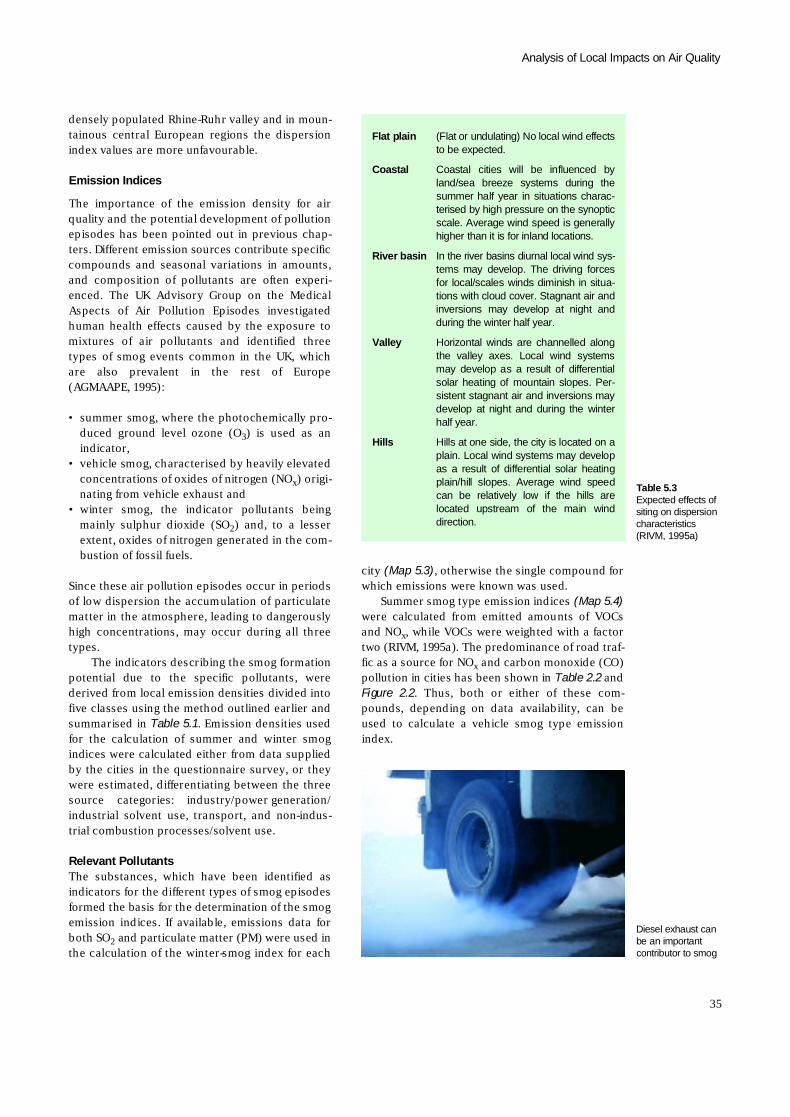
densely populated Rhine-Ruhr valley and in moun-tainous central European regions the dispersionindex values are more unfavourable.
Emission Indices
The importance of the emission density for airquality and the potential development of pollutionepisodes has been pointed out in previous chap-ters. Different emission sources contribute specificcompounds and seasonal variations in amounts,and composition of pollutants are often experi-enced. The UK Advisory Group on the MedicalAspects of Air Pollution Episodes investigatedhuman health effects caused by the exposure tomixtures of air pollutants and identified threetypes of smog events common in the UK, whichare also prevalent in the rest of Europe(AGMAAPE, 1995):
• summer smog, where the photochemically pro-duced ground level ozone (O3) is used as ani n d i c a t o r ,
• vehicle smog, characterised by heavily elevatedconcentrations of oxides of nitrogen (NOx) origi-nating from vehicle exhaust and
• winter smog, the indicator pollutants beingmainly sulphur dioxide (SO2) and, to a lesserextent, oxides of nitrogen generated in the com-bustion of fossil fuels.
Since these air pollution episodes occur in periodsof low dispersion the accumulation of particulatematter in the atmosphere, leading to dangerouslyhigh concentrations, may occur during all threet y p e s .
The indicators describing the smog formationpotential due to the specific pollutants, werederived from local emission densities divided intofive classes using the method outlined earlier andsummarised in Table 5.1. Emission densities usedfor the calculation of summer and winter smogindices were calculated either from data suppliedby the cities in the questionnaire survey, or theywere estimated, differentiating between the threesource categories: industry/power g e n e r a t i o n /industrial solvent use, transport, and non-indus-trial combustion processes/solvent use.
Relevant PollutantsThe substances, which have been identified asindicators for the different types of smog episodesformed the basis for the determination of the smogemission indices. If available, emissions data forboth SO2 and particulate matter (PM) were used inthe calculation of the winter-smog index for each
city (Map 5.3), otherwise the single compound forwhich emissions were known was used.
Summer smog type emission indices (Map 5.4)were calculated from emitted amounts of VOCsand NOx, while VOCs were weighted with a factortwo (RIVM, 1995a). The predominance of road traf-fic as a source for NOx and carbon monoxide (CO)pollution in cities has been shown in Table 2.2 a n dFigure 2.2. Thus, both or either of these com-pounds, depending on data availability, can beused to calculate a vehicle smog type emissioni n d e x .
35
Analysis of Local Impacts on Air Quality
Flat plain (Flat or undulating) No local wind effectsto be expected.
C o a s t a l Coastal cities will be influenced byland/sea breeze systems during thesummer half year in situations charac-terised by high pressure on the synopticscale. Average wind speed is generallyhigher than it is for inland locations.
River basin In the river basins diurnal local wind sys-tems may develop. The driving forcesfor local/scales winds diminish in situa-tions with cloud cover. Stagnant air andinversions may develop at night andduring the winter half year.
V a l l e y Horizontal winds are channelled alongthe valley axes. Local wind systemsmay develop as a result of differentialsolar heating of mountain slopes. Per-sistent stagnant air and inversions maydevelop at night and during the winterhalf year.
H i l l s Hills at one side, the city is located on aplain. Local wind systems may developas a result of differential solar heatingplain/hill slopes. Average wind speedcan be relatively low if the hills arelocated upstream of the main windd i r e c t i o n .
Table 5.3Expected effects ofsiting on dispersionc h a r a c t e r i s t i c s(RIVM, 1995a)
Diesel exhaust canbe an importantcontributor to smog
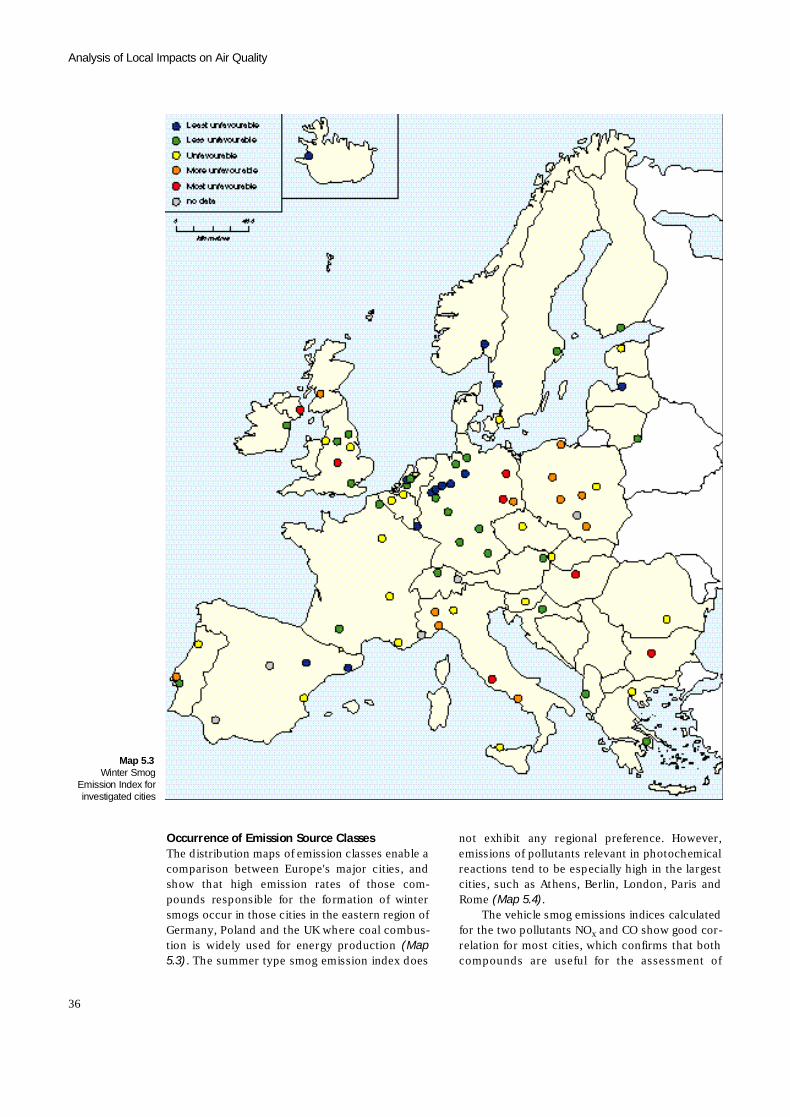
Occurrence of Emission Source ClassesThe distribution maps of emission classes enable acomparison between Europe's major cities, andshow that high emission rates of those com-pounds responsible for the formation of wintersmogs occur in those cities in the eastern region ofGermany, Poland and the UK where coal combus-tion is widely used for energy production ( M a p5 . 3 ). The summer type smog emission index does
not exhibit any regional preference. However,emissions of pollutants relevant in photochemicalreactions tend to be especially high in the largestcities, such as Athens, Berlin, London, Paris andR o m e (Map 5.4).
The vehicle smog emissions indices calculatedfor the two pollutants NOx and CO show good cor-relation for most cities, which confirms that bothcompounds are useful for the assessment of
Analysis of Local Impacts on Air Quality
36
Map 5.3Winter Smog
Emission Index forinvestigated cities
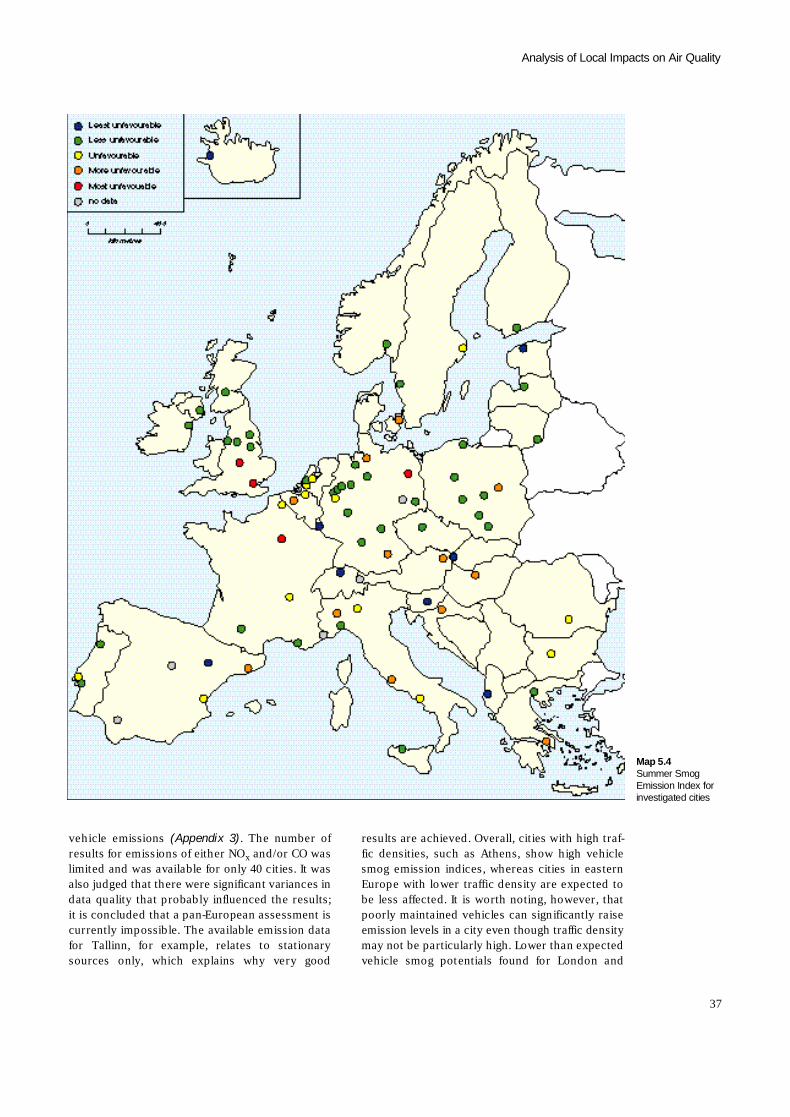
vehicle emissions (Appendix 3). The number ofresults for emissions of either NOx and/or CO waslimited and was available for only 40 cities. It wasalso judged that there were significant variances indata quality that probably influenced the results;it is concluded that a pan-European assessment iscurrently impossible. The available emission datafor Tallinn, for example, relates to stationarysources only, which explains why very good
results are achieved. Overall, cities with high traf-fic densities, such as Athens, show high vehiclesmog emission indices, whereas cities in easternEurope with lower traffic density are expected tobe less affected. It is worth noting, however, thatpoorly maintained vehicles can significantly raiseemission levels in a city even though traffic densitymay not be particularly high. Lower than expectedvehicle smog potentials found for London and
37
Analysis of Local Impacts on Air Quality
Map 5.4Summer SmogEmission Index forinvestigated cities
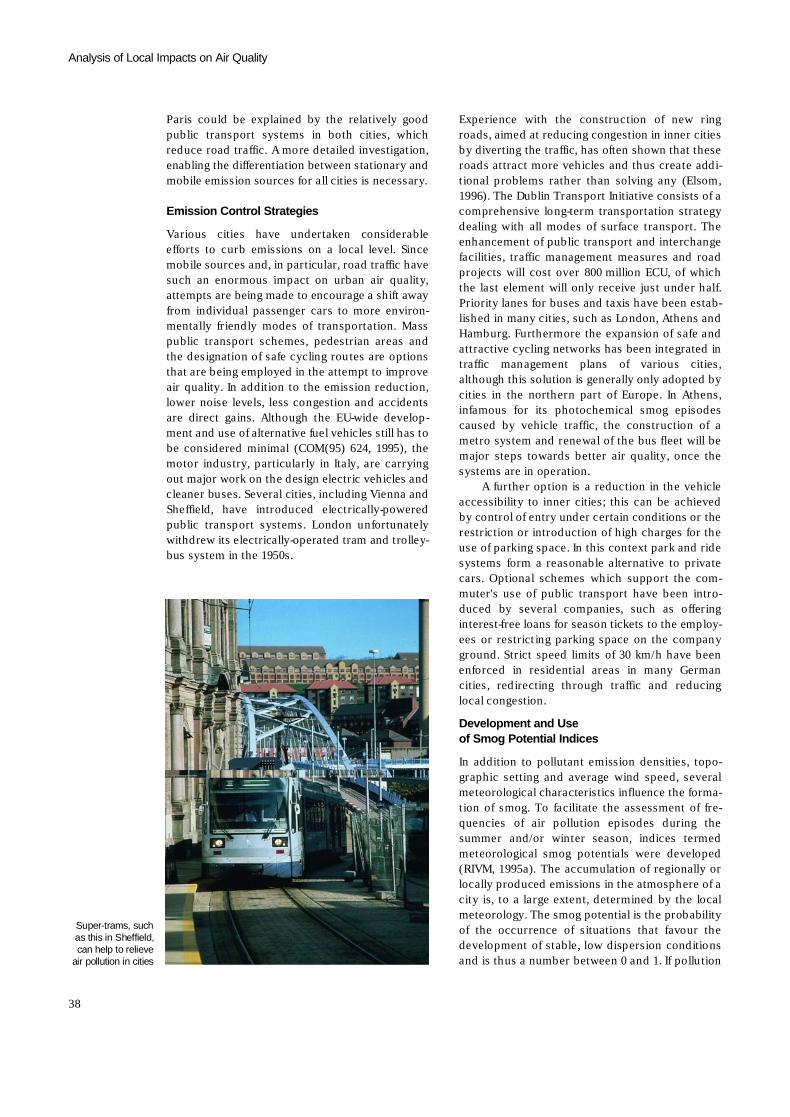
Paris could be explained by the relatively goodpublic transport systems in both cities, whichreduce road traffic. A more detailed investigation,enabling the differentiation between stationary andmobile emission sources for all cities is necessary.
Emission Control Strategies
Various cities have undertaken considerableefforts to curb emissions on a local level. Sincemobile sources and, in particular, road traffic havesuch an enormous impact on urban air quality,attempts are being made to encourage a shift awayfrom individual passenger cars to more environ-mentally friendly modes of transportation. Masspublic transport schemes, pedestrian areas andthe designation of safe cycling routes are optionsthat are being employed in the attempt to improveair quality. In addition to the emission reduction,lower noise levels, less congestion and accidentsare direct gains. Although the EU-wide develop-ment and use of alternative fuel vehicles still has tobe considered minimal (COM(95) 624, 1995), themotor industry, particularly in Italy, are carryingout major work on the design electric vehicles andcleaner buses. Several cities, including Vienna andSheffield, have introduced electrically-poweredpublic transport systems. London unfortunatelywithdrew its electrically-operated tram and trolley-bus system in the 1950s.
Experience with the construction of new ringroads, aimed at reducing congestion in inner citiesby diverting the traffic, has often shown that theseroads attract more vehicles and thus create addi-tional problems rather than solving any (Elsom,1996). The Dublin Transport Initiative consists of acomprehensive long-term transportation strategydealing with all modes of surface transport. Theenhancement of public transport and interchangefacilities, traffic management measures and roadprojects will cost over 800 million ECU, of whichthe last element will only receive just under half.Priority lanes for buses and taxis have been estab-lished in many cities, such as London, Athens andHamburg. Furthermore the expansion of safe andattractive cycling networks has been integrated intraffic management plans of various cities,although this solution is generally only adopted bycities in the northern part of Europe. In Athens,infamous for its photochemical smog episodescaused by vehicle traffic, the construction of ametro system and renewal of the bus fleet will bemajor steps towards better air quality, once thesystems are in operation.
A further option is a reduction in the vehicleaccessibility to inner cities; this can be achievedby control of entry under certain conditions or therestriction or introduction of high charges for theuse of parking space. In this context park and ridesystems form a reasonable alternative to privatecars. Optional schemes which support the com-muter's use of public transport have been intro-duced by several companies, such as offeringinterest-free loans for season tickets to the employ-ees or restricting parking space on the companyground. Strict speed limits of 30 km/h have beenenforced in residential areas in many Germancities, redirecting through traffic and reducinglocal congestion.
Development and Useof Smog Potential Indices
In addition to pollutant emission densities, topo-graphic setting and average wind speed, severalmeteorological characteristics influence the forma-tion of smog. To facilitate the assessment of fre-quencies of air pollution episodes during thesummer and/or winter season, indices termedmeteorological smog potentials were developed(RIVM, 1995a). The accumulation of regionally orlocally produced emissions in the atmosphere of acity is, to a large extent, determined by the localmeteorology. The smog potential is the probabilityof the occurrence of situations that favour thedevelopment of stable, low dispersion conditionsand is thus a number between 0 and 1. If pollution
Analysis of Local Impacts on Air Quality
38
Super-trams, suchas this in Sheffield,can help to relieve
air pollution in cities
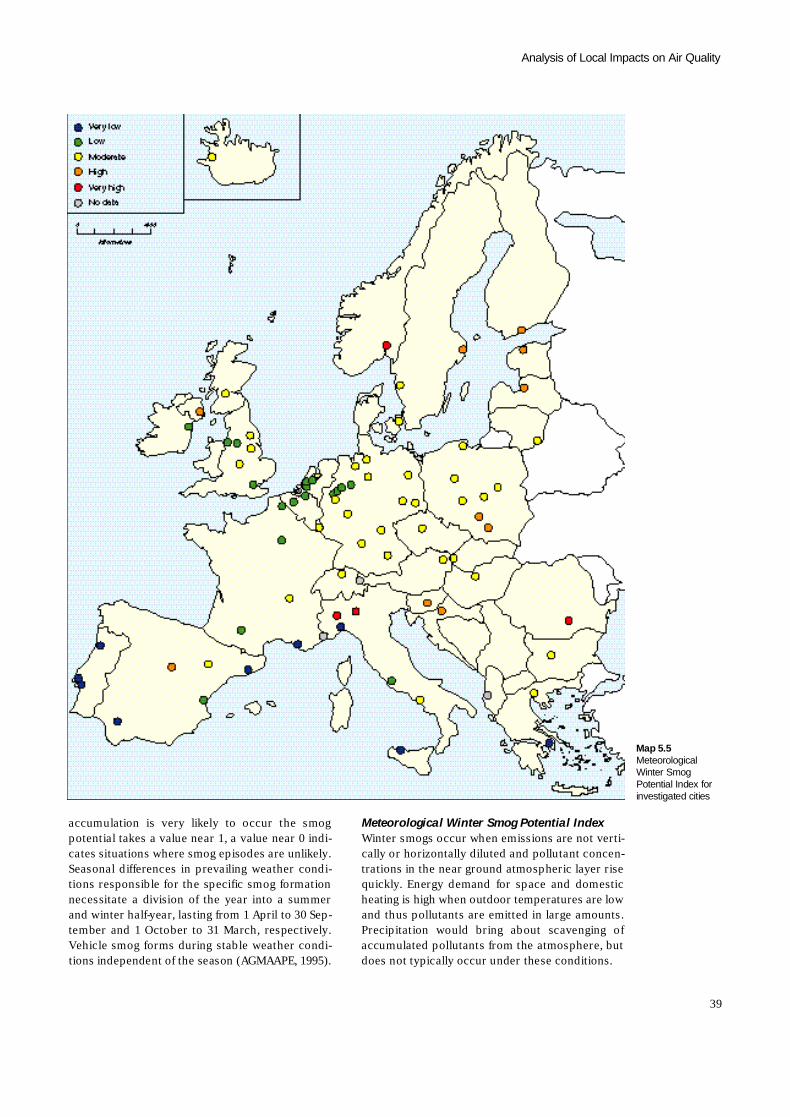
accumulation is very likely to occur the smogpotential takes a value near 1, a value near 0 indi-cates situations where smog episodes are unlikely.Seasonal differences in prevailing weather condi-tions responsible for the specific smog formationnecessitate a division of the year into a summerand winter half-year, lasting from 1 April to 30 Sep-tember and 1 October to 31 March, respectively.Vehicle smog forms during stable weather condi-tions independent of the season (AGMAAPE, 1995).
Meteorological Winter Smog Potential IndexWinter smogs occur when emissions are not verti-cally or horizontally diluted and pollutant concen-trations in the near ground atmospheric layer risequickly. Energy demand for space and domesticheating is high when outdoor temperatures are lowand thus pollutants are emitted in large amounts.Precipitation would bring about scavenging ofaccumulated pollutants from the atmosphere, butdoes not typically occur under these conditions.
39
Analysis of Local Impacts on Air Quality
Map 5.5M e t e o r o l o g i c a lWinter SmogPotential Index forinvestigated cities
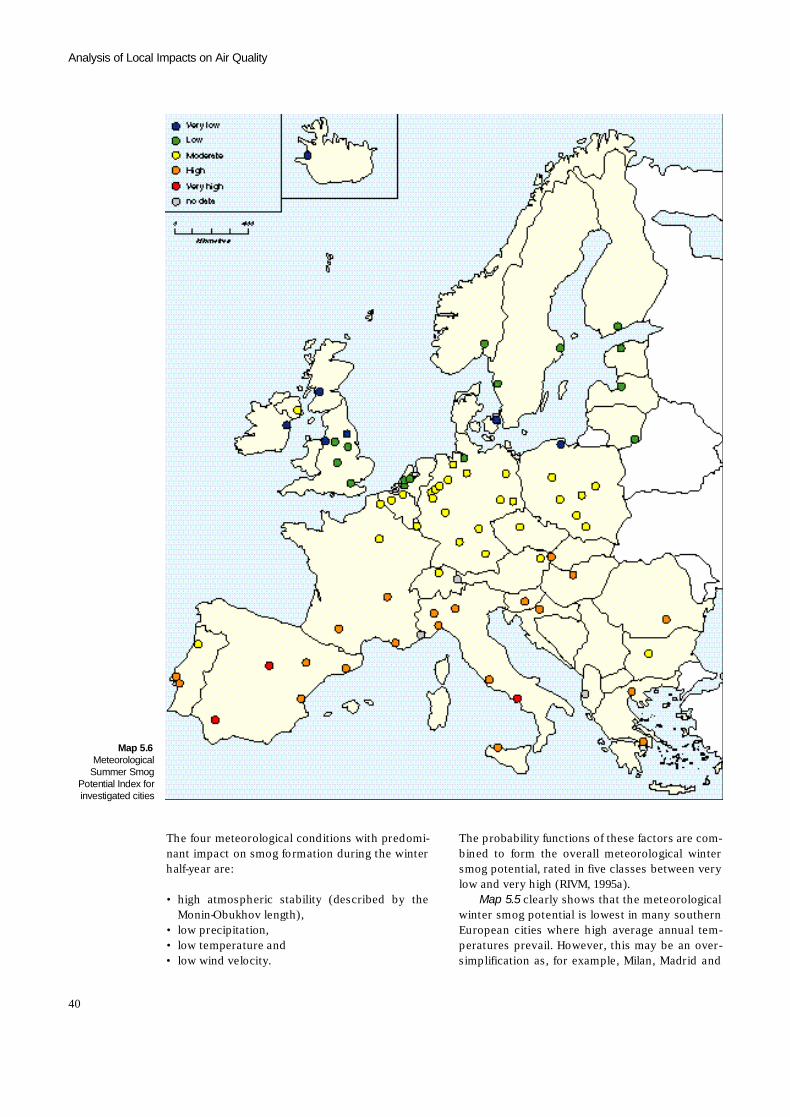
The four meteorological conditions with predomi-nant impact on smog formation during the winterhalf-year are:
• high atmospheric stability (described by theMonin-Obukhov length),
• low precipitation,• low temperature and• low wind velocity.
The probability functions of these factors are com-bined to form the overall meteorological wintersmog potential, rated in five classes between verylow and very high (RIVM, 1995a).
Map 5.5 clearly shows that the meteorologicalwinter smog potential is lowest in many southernEuropean cities where high average annual tem-peratures prevail. However, this may be an over-simplification as, for example, Milan, Madrid and
Analysis of Local Impacts on Air Quality
40
Map 5.6M e t e o r o l o g i c a l
Summer SmogPotential Index forinvestigated cities
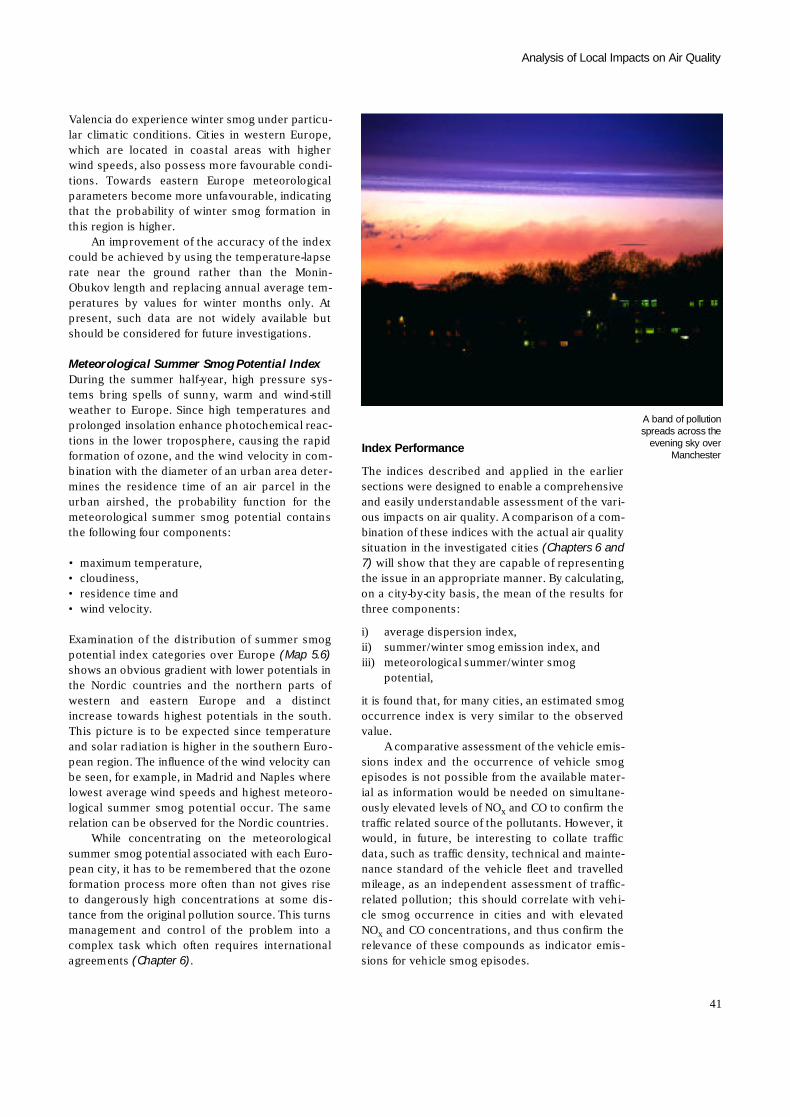
Valencia do experience winter smog under particu-lar climatic conditions. Cities in western Europe,which are located in coastal areas with higherwind speeds, also possess more favourable condi-tions. Towards eastern Europe meteorologicalparameters become more unfavourable, indicatingthat the probability of winter smog formation inthis region is higher.
An improvement of the accuracy of the indexcould be achieved by using the temperature-lapserate near the ground rather than the Monin-Obukov length and replacing annual average tem-peratures by values for winter months only. Atpresent, such data are not widely available butshould be considered for future investigations.
Meteorological Summer Smog Potential IndexDuring the summer half-year, high pressure sys-tems bring spells of sunny, warm and wind-stillweather to Europe. Since high temperatures andprolonged insolation enhance photochemical reac-tions in the lower troposphere, causing the rapidformation of ozone, and the wind velocity in com-bination with the diameter of an urban area deter-mines the residence time of an air parcel in theurban airshed, the probability function for themeteorological summer smog potential containsthe following four components:
• maximum temperature,• c l o u d i n e s s ,• residence time and• wind velocity.
Examination of the distribution of summer smogpotential index categories over Europe (Map 5.6)shows an obvious gradient with lower potentials inthe Nordic countries and the northern parts ofwestern and eastern Europe and a distinctincrease towards highest potentials in the south.This picture is to be expected since temperatureand solar radiation is higher in the southern Euro-pean region. The influence of the wind velocity canbe seen, for example, in Madrid and Naples wherelowest average wind speeds and highest meteoro-logical summer smog potential occur. The samerelation can be observed for the Nordic countries.
While concentrating on the meteorologicalsummer smog potential associated with each Euro-pean city, it has to be remembered that the ozoneformation process more often than not gives riseto dangerously high concentrations at some dis-tance from the original pollution source. This turnsmanagement and control of the problem into acomplex task which often requires internationalagreements (Chapter 6).
Index Performance
The indices described and applied in the earliersections were designed to enable a comprehensiveand easily understandable assessment of the vari-ous impacts on air quality. A comparison of a com-bination of these indices with the actual air qualitysituation in the investigated cities (Chapters 6 and7 ) will show that they are capable of representingthe issue in an appropriate manner. By calculating,on a city-by-city basis, the mean of the results forthree components:
i ) average dispersion index,i i ) summer/winter smog emission index, andi i i ) meteorological summer/winter smog
p o t e n t i a l ,
it is found that, for many cities, an estimated smogoccurrence index is very similar to the observedv a l u e .
A comparative assessment of the vehicle emis-sions index and the occurrence of vehicle smogepisodes is not possible from the available mater-ial as information would be needed on simultane-ously elevated levels of NOx and CO to confirm thetraffic related source of the pollutants. However, itwould, in future, be interesting to collate trafficdata, such as traffic density, technical and mainte-nance standard of the vehicle fleet and travelledmileage, as an independent assessment of traffic-related pollution; this should correlate with vehi-cle smog occurrence in cities and with elevatedN Ox and CO concentrations, and thus confirm therelevance of these compounds as indicator emis-sions for vehicle smog episodes.
41
Analysis of Local Impacts on Air Quality
A band of pollutionspreads across the
evening sky overM a n c h e s t e r
For about 85% of the cities, the difference betweencalculated and reported winter smog occurrencelies within plus/minus one class. Results for mea-sured and estimated summer smog occurrence dif-fer more significantly than for winter smog, but thevariation was less than one class for over 65% ofthe cities where sufficient information was avail-able. Figure 5.3 shows the number of cities in eachclass of smog occurrence difference, attained by
subtracting the monitored value from the calcu-lated index. More cities achieved negative resultswhich indicates that the calculated indices aremore likely to underestimate summer and wintersmog occurrence.
Divergence between predicted and calculatedwinter and summer smogs can be caused by awide variety of factors, including unrepresentativedata for emissions and/or maximum pollutant con-centrations or the impact of specific local condi-tions on summer and winter smog formation,which cannot be assessed by the three indicesused. Material used for the calculation of theindices frequently relates to years other thanthose when smog occurrences were observed;thus, annual variations may give rise to the differ-ences found. The poorer correlation of calculatedand observed results for summer smog episodesmay be explained by the strong impact of meteoro-logical conditions on ozone formation. In yearswhere cities experience hotter and sunnier sum-mers, high ozone concentrations and frequentexceedances of guideline values are recorded,whereas in cooler years fewer summer smogepisodes occur (AEAT, 1996). Another explanationfor the differences could be offered by the fact thatcalculated indices are based on annual averageemission values, which might not be representa-tive of the emissions during a particular episode.
For Prague, significant under-estimations ofboth smog occurrences were found. Pollutionepisodes were reported for both the summer andwinter half-year, whereas the calculated indicesindicated only a moderate likelihood of smog con-ditions. Data used for emission estimates and sum-mer smog occurrence for 1994 were taken from arecent report (CHMI, 1995), winter smog data wereavailable for 1993 (ETC-AQ, 1995) and the disper-sion index and meteorological smog indices werecalculated for the period 1985–1989 (RIVM, 1995a).The fact that both calculated smog indices do notrepresent the actual situation indicates that disper-sion conditions during pollution episodes differsignificantly from the theoretical average disper-sion index. A more detailed assessment of the rele-vant meteorological data in combination withrecent emission and air quality data could explainthe divergence.
Case Studies
In this section the different indices developed andassessed for all major European cities will be dis-cussed in more detail using the examples of tencities. These cities were selected because of theirwidely varying characteristics and their location in
Analysis of Local Impacts on Air Quality
42
0
2
4
6
8
10
12
14
< -
2
-1.3
- -
2
-1
-0.7
-0.3
0
0.3
0.7 1
1.3
- 2 >
2
∆ smog occurence
num
ber
of c
itie
s
wintersummer
Smog at duskover Paris
Figure 5.3Comparison ofcalculated and
monitored smogo c c u r e n c e
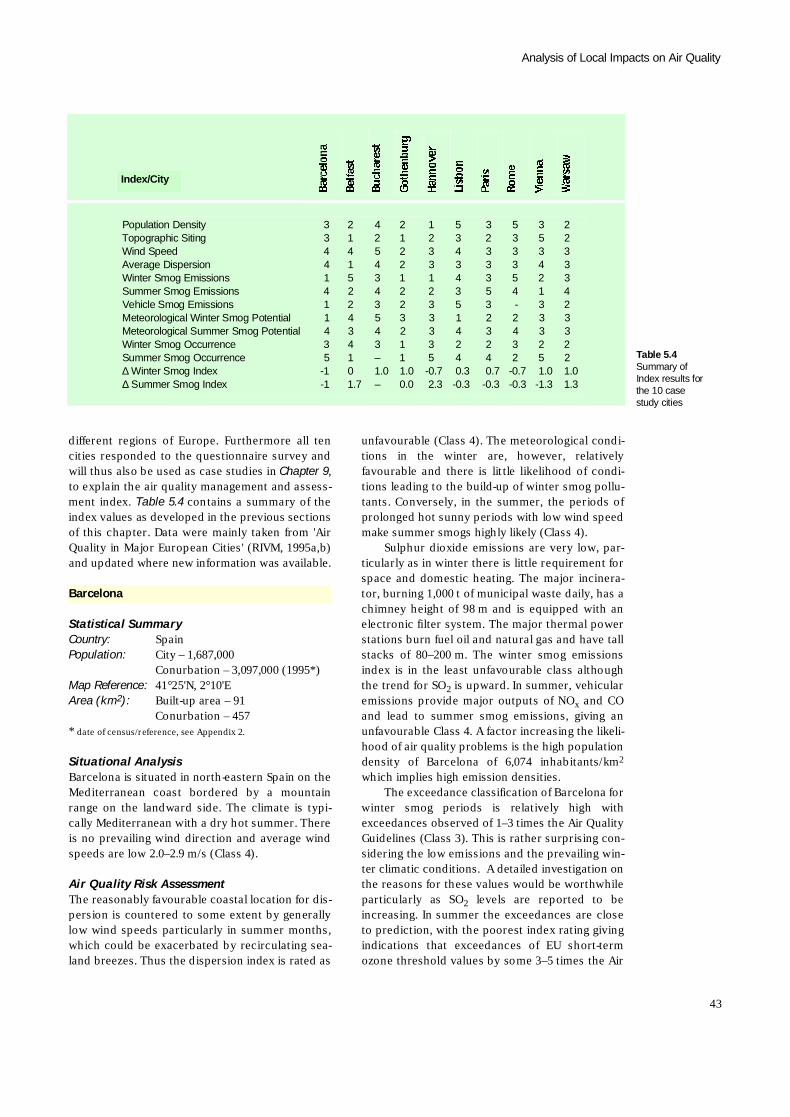
different regions of Europe. Furthermore all tencities responded to the questionnaire survey andwill thus also be used as case studies in Chapter 9,to explain the air quality management and assess-ment index. Table 5.4 contains a summary of theindex values as developed in the previous sectionsof this chapter. Data were mainly taken from 'AirQuality in Major European Cities' (RIVM, 1995a,b)and updated where new information was available.
Statistical SummaryC o u n t r y : S p a i nP o p u l a t i o n : C i t y – 1 , 6 8 7 , 0 0 0
C o n u r b a t i o n – 3,097,000 (1995*)Map Reference: 41°25'N, 2°10'EArea (km2) : Built-up area – 91
Conurbation – 457* date of census/reference, see Appendix 2.
Situational AnalysisBarcelona is situated in north-eastern Spain on theMediterranean coast bordered by a mountainrange on the landward side. The climate is typi-cally Mediterranean with a dry hot summer. Thereis no prevailing wind direction and average windspeeds are low 2.0–2.9 m/s (Class 4).
Air Quality Risk AssessmentThe reasonably favourable coastal location for dis-persion is countered to some extent by generallylow wind speeds particularly in summer months,which could be exacerbated by recirculating sea-land breezes. Thus the dispersion index is rated as
unfavourable (Class 4). The meteorological condi-tions in the winter are, however, relativelyfavourable and there is little likelihood of condi-tions leading to the build-up of winter smog pollu-tants. Conversely, in the summer, the periods ofprolonged hot sunny periods with low wind speedmake summer smogs highly likely (Class 4).
Sulphur dioxide emissions are very low, par-ticularly as in winter there is little requirement forspace and domestic heating. The major incinera-tor, burning 1,000 t of municipal waste daily, has achimney height of 98 m and is equipped with anelectronic filter system. The major thermal powerstations burn fuel oil and natural gas and have tallstacks of 80–200 m. The winter smog emissionsindex is in the least unfavourable class althoughthe trend for SO2 is upward. In summer, vehicularemissions provide major outputs of NOx and COand lead to summer smog emissions, giving anunfavourable Class 4. A factor increasing the likeli-hood of air quality problems is the high populationdensity of Barcelona of 6,074 inhabitants/km2
which implies high emission densities.The exceedance classification of Barcelona for
winter smog periods is relatively high withexceedances observed of 1–3 times the Air QualityGuidelines (Class 3). This is rather surprising con-sidering the low emissions and the prevailing win-ter climatic conditions. A detailed investigation onthe reasons for these values would be worthwhileparticularly as SO2 levels are reported to beincreasing. In summer the exceedances are closeto prediction, with the poorest index rating givingindications that exceedances of EU short-termozone threshold values by some 3–5 times the Air
43
Analysis of Local Impacts on Air Quality
I n d e x / C i t y
Population Density 3 2 4 2 1 5 3 5 3 2Topographic Siting 3 1 2 1 2 3 2 3 5 2Wind Speed 4 4 5 2 3 4 3 3 3 3Average Dispersion 4 1 4 2 3 3 3 3 4 3Winter Smog Emissions 1 5 3 1 1 4 3 5 2 3Summer Smog Emissions 4 2 4 2 2 3 5 4 1 4Vehicle Smog Emissions 1 2 3 2 3 5 3 - 3 2Meteorological Winter Smog Potential 1 4 5 3 3 1 2 2 3 3Meteorological Summer Smog Potential 4 3 4 2 3 4 3 4 3 3Winter Smog Occurrence 3 4 3 1 3 2 2 3 2 2Summer Smog Occurrence 5 1 – 1 5 4 4 2 5 2∆ Winter Smog Index - 1 0 1 . 0 1 . 0 - 0 . 7 0 . 3 0 . 7 - 0 . 7 1 . 0 1 . 0∆ Summer Smog Index - 1 1 . 7 – 0 . 0 2 . 3 - 0 . 3 - 0 . 3 - 0 . 3 - 1 . 3 1 . 3
Table 5.4Summary ofIndex results forthe 10 casestudy cities
B a r c e l o n a
Quality Guidelines have been observed. It is esti-mated that over 66% of the population are affectedby O3 levels in excess of 180 µg/m3, with concen-trations possibly up to 270 µg/m3, and that over66% of the population have been exposed to maxi-mum NO2 levels in excess of 200 µg/m3.
Barcelona reports several local policies toreduce air pollution, with all new industry requiredto present an environmental impact report and aninspection programme for already establishedindustry. All domestic/space heating systems mustcarry a certificate of yearly inspection. There is anenvironmental control service that controls theemissions from cars in the city.
Statistical Summary
C o u n t r y : United KingdomP o p u l a t i o n : C i t y – 295,000
C o n u r b a t i o n – 3 9 2 , 0 0 0Map Reference: 54°40'N, 5°50'WArea (km2) : Built-up area – 106
Situational AnalysisBelfast is situated on the east coast of NorthernIreland and lies in an enclosed basin where hills onthe west act as a barrier to dispersion. The climateis classified as moderate, coastal with a mild win-ter and warm summer and no dry season. Hotsunny spells are rare but can cause photochemicalsmog formation whilst low wind speeds can hinderthe dispersion of emitted primary pollutants. Theprevailing wind direction is westerly (SSW-NNW59%, 17% still, 24% other directions).
Air Quality Risk AssessmentFactors which influence the risk of serious air qual-ity problems in Belfast include the coastal locationand prevailing wind direction which will generallydisperse emissions away from the city out to seain a westerly direction. However, the western hillssurrounding the city and the east coast locationprotect the city from strong westerly winds andgive a low average wind speed (the wind speedindex is an unfavourable 2.0–2.9 m/s). These condi-tions lead to a Class 3 dispersion index which indi-cates that climatic and topographic conditions areaverage for the dispersion of air pollutants awayfrom the city.
A favourable factor is that Belfast has a rela-tively low population density of 2,783 inhabi-t a n t s / k m2. However, the pattern of fuel use inBelfast is far from favourable since approximately70% of homes use coal for heating (compared with
12% in the UK as a whole) and similarly the mainpower generation station is fuelled by bituminouscoal with an annual consumption of 341,305 t/a(1990–91). This places Belfast in the mostunfavourable winter emissions category (Class 5)whilst the summer emissions index is considerablyless unfavourable (Class 2). Vehicular emissions inBelfast are classified as fairly low.
With an average dispersion index it can beexpected that, under particular weather condi-tions, the high level of emission from coal burningwill lead to pollution episodes. Closer examinationof the meteorological data indicates that there is ahigh meteorological potential for winter smog dueto periods of climatic stability and a mediumpotential for summer smog. Regionally this placesBelfast as an outlier since these values are moretypical of central and eastern Europe.
The high level of winter emissions is thusexacerbated by the high meteorological wintersmog potential, and this is confirmed by records ofpoor air quality. This is reflected in a high wintersmog exceedance category (Class 4), based on1990 data on the occurrence of highest observedconcentrations of SO2 and particulate matter(black smoke) exceeding twice the WHO Air Qual-ity Guidelines on 6 and 8 days respectively (RIVM,1995). In terms of the number of inhabitantsexposed to these exceedances, it is estimated thatover 66% of the population were exposed. For par-ticulates it was estimated that over 66% of the pop-ulation were exposed to levels over 120 µg/m3 a n dup to 33% to the higher level of 180 µg/m3.
Belfast has an on-going smoke control pro-gramme which was started in 1967 and will becompleted in 1997. Since 1955, smoke levels havebeen reduced by around 80%. Sulphur dioxide lev-els dropped steadily until the early 1980s butshowed a slight increase in the late 1980s (RIVM,1995). More recent data show that since 1992/3there have been no breaches of EC limit values,although most sites still regularly exceed guide val-ues. The number of hours of poor air quality forS O2 has declined steadily since 1991 (BCC, 1995).
In view of the low summer smog potential andemissions, exceedance of O3 levels have not beenobserved and are unlikely to occur.
Statistical SummaryC o u n t r y : R o m a n i aP o p u l a t i o n : Conurbation – 2,388,000Map Reference: 44°28'N, 26°07'EArea (km2) : Built-up area – 182
Conurbation – 228
Analysis of Local Impacts on Air Quality
44
B e l f a s t
B u c h a r e s t
Situational AnalysisBucharest is situated on a flat plain in south-eastEurope, 225 km from the Black Sea and 120 kmfrom the Carpathian mountains. It is described ashaving a Mediterranean climate with a dry hotsummer. Average wind speeds are very light in therange 1.0–1.9 m/s.
Air Quality Risk AssessmentFactors which influence the risk of air quality prob-lems in Bucharest include the location on a flatplain, which will favour dispersion, but this iscountered by the generally low wind speeds,which will enhance accumulation of pollutantsover the city. This gives an unfavourable disper-sion index (Class 4). The calculated meteorologicalrisks of summer and winter smogs are veryunfavourable (Class 5) and unfavourable (Class 4)respectively. These calculations are based on thelikelihood of summer and winter temperaturei n v e r s i o n s .
The emissions inventory for 1990 shows largeoutputs of SO2 mainly from heavy industry andpower plants. Bucharest is responsible for approx-imately 13% of the total industrial output of Roma-nia. Oxides of nitrogen emissions are seen toderive primarily from industry and power plantswith traffic contributing about 15% of the total.Winter smog emissions are classified as fairlyunfavourable (Class 3) and summer smog emis-sions as more unfavourable (Class 4).
Exceedance of short-term WHO-AQG of1 – 3 times AQG have been reported for wintersmog but no data are available for summer smogoccurrence since O3 concentrations are not cur-rently monitored. However, NO2 levels above amaximum of 200 µg/m3 are reported to affect over66% of the population. For all pollutants, the highpopulation density of 13,121 inhabitants per km2
would lead to very high percentage populationexposure if limits were exceeded.
Bucharest is one of the cities of the formerEastern Europe COMECON group which have onlyvery recently introduced unleaded petrol, and carswith catalytic converters are not common. Thereare relatively few cars and the public transportsystem is well developed with approximately1,556,700 passengers km/a by electric-poweredpublic transport, with non-electric transport atabout 310,000 passengers km/a (1990). There isalso widespread provision of district heating(30%). These factors may have served to reducethe risk of poor quality air pollution in the past.Recently, with the break up of the Soviet Unionand the east European economic partnership,there has been an economic downturn, which has
led to a reduction in emissions. New policiesinclude plans to modernise emission control sys-tems and to stimulate the use of low-sulphur fuels.Access for heavy freight traffic to the city centre isrestricted and more restrictions are planned. Carowners will be encouraged to install catalytic con-verters. Further development of central heatingusing natural gas and decreased reliance onwood/coal are planned.
Statistical SummaryC o u n t r y : S w e d e nP o p u l a t i o n : City – 514,000
Conurbation – 734,000Map Reference: 57°43'N, 11°58'EArea (km2) : Built-up area – 132
Conurbation – 654
Situational AnalysisGothenburg is situated on the Gotä älv estuary sur-rounded by hills, with three to four valleys leadinginto the city centre. The climate is coastal with rel-atively warm summers; there is no dry season and,despite the northerly latitude, there is seldomsnow or ice due to exposure to warm westerlywinds. The city is an important administrative cen-tre with major industrial activities, including thelargest car factory in Sweden. In addition, there arepetrochemical industries on the north side of theh a r b o u r .
Air Quality Risk AssessmentThe average wind speed is favourable for pollu-tant dispersion and this, with the coastal location,gives Gothenburg a favourable dispersion index(Class 2). The meteorological potential for wintersmog and summer smog has been classified asmoderate (Class 3) and low (Class 2) respectively.
Emission inventories are available and theseshow that SO2 from traffic is equal to that pro-duced by heating, industry and power plants com-bined. Recorded levels of ambient SO2 have showna major decrease over a long period. Particulatestoo have declined significantly but recent levelsshow an increase. For NOx, CO and VOC, the emis-sions from traffic are, as would be expected, by farthe major source of pollution.
The total emissions are quite small and thoselikely to cause winter smog are rated as leastunfavourable (Class 1) whilst the largely trafficrelated emissions give a more unfavourable sum-mer smog emissions index (Class 2). It is interest-ing to note that, in 1992/3, 40% of cars already hadcatalytic converters. Data indicate that WHO and
45
Analysis of Local Impacts on Air Quality
G o t h e n b u r g
EU-AQG have not been exceeded for either wintersmog or summer smog-forming pollutants. Thecity is classified in the lowest exceedance class forboth types, i.e. exceedances and exposure of thepopulation to high pollution levels are unlikelyalthough it is considered likely that the O3 t h r e s h-old value of 180 µg/m3 could be exceeded.
Gothenburg has adopted numerous policies toreduce air pollution: emission constraints areplaced on new or rebuilt power plants of over 50MW output. Traffic emissions of VOC were tar-geted to be reduced by 40% and NOx by 30% by1996 compared with 1988 values, and total emis-sions of NOx from combustion and space heatingmust not exceed 1,200 t/a.
Statistical SummaryC o u n t r y : G e r m a n yP o p u l a t i o n : City – 514,000Map Reference: 52°33'N, 9°44'EArea (km2) : Built-up area – 204
Situational AnalysisHannover has a central European location on thenorth-west European plain in Lower Saxony. Theclimate is classified as coastal with warm summerswith the hottest month exceeding 22°C. The low-land open location with exposure to winds fromnorth, east and west leads to relatively high windspeeds averaging 3.3–3.4 m/s (wind speed index 3).
Air Quality Risk AssessmentThe location and wind speed analysis, and theresultant average dispersion index (Class 3), sug-gest that the risk of poor air quality will be relatedto specific periods of wind-still rather than likely tooccur under average conditions. A further factorreducing risk is the very low population density of2,520 inhabitants per km2. Climatic data indicate amedium vulnerability to both winter and summersmogs. The former is due to the winter occurrenceof periods when a high pressure system aboveEurope persists for several days. The likelihood ofthese episodes increases along a W-E axis acrossEurope, and Hannover is typical of its region. Sum-mer smogs also tend to occur during episodes ofhigh pressure and low wind velocities, leading tohigh urban concentrations of ozone. The potentialfor this to occur generally increases along a N-Saxis and again Hannover is typical of a centralEuropean belt of intermediate potential. Hannoveris a thriving industrial city with several importantindustrial activities including railway engineering,cars, engines, electrotechnics, synthetic materials
and food generation. There appears to be anincreasing tendency for summer smogs and areducing tendency for winter smogs, which isprobably due to increasing vehicular emissionsand more control of SO2 and particulates. In 1989there were six days in which observed levels ofS O2 exceeded WHO-AQG and 1 day of exceedanceof twice the WHO-AQG. The figures for TSP were15 and 10 days respectively. This placed Hannoverin an unfavourable exceedance Class 3 for wintersmogs but the available data are relatively old(1989) and further improvements are believed tohave occurred. The estimated proportion of popu-lation exposed to SO2 and particulate matterexceedances is in the 33–66% band.
For O3 the WHO-AQG were also exceeded,with observed exceedance but of unknown num-ber and duration of episodes for summer smogs. Itis also estimated that more than two thirds of thepopulation are affected by O3 concentrations inexcess of 180 µg/m3.
Statistical SummaryC o u n t r y : P o r t u g a lP o p u l a t i o n : C i t y – 1 , 3 2 9 , 0 0 0
C o n u r b a t i o n – 2 , 0 0 0 , 0 0 0Map Reference: 38°44'N, 9°08'WArea (km2) : Built-up area – 100
Situational AnalysisLisbon is both the most southerly and most west-erly of the cities considered in detail in this report.It has a Mediterranean climate with a hot dry sum-mer season. The highest monthly mean tempera-ture exceeds 22°C. Lisbon is situated on the westbank of the River Tagus and is protected to thewest and north by a range of coastal mountainsreaching an altitude of 866 m .
Air Quality Risk AssessmentThe population density of the built-up area of Lis-bon is estimated to be 20,000 per km2 which ranksamongst the highest in Europe. The situation isless favourable than one might expect for a city soclose to the Atlantic Ocean because it lies behind arange of coastal hills and effectively lies in a rivervalley. Wind speeds are fairly low (Class 4) onaverage and the overall dispersion index is ratedas Class 3. The high population density gives riseto high winter, and very high vehicular, emissions;those emissions involved in the formation of sum-mer smogs are average.
Despite the stronger winter winds, wintersmogs do occur and exceedance of short-term
Analysis of Local Impacts on Air Quality
46
H a n n o v e r
L i s b o n
WHO-AQG for SO2 has been observed; between33–66% of the population are believed to havebeen affected by levels exceeding 125 µg/m3. Therisk of summer smog is substantially higher (Class4) and maximum ozone levels reached 341 µg/m3
in 1990, which is double the WHO-AQG and closeto the EU population warning limit (1h 360 µg/m3) .It is estimated that over two-thirds of the popula-tion are affected by levels exceeding 270 µg/m3.There is no available information on the number ofdays on which exceedances occurred. It is alsoworthy of note that the trend for NO2 is stronglyupwards, which indicates that increasing traffic inthe future is likely to exacerbate current problemsunless further stringent action is taken.
Statistical SummaryC o u n t r y : F r a n c eP o p u l a t i o n : City – 2,189,000
Conurbation – 8,510,000Map Reference: 48°52'N, 2° 20'EArea (km2) : City – 105
Conurbation – 1,200
Situational AnalysisThe conurbation of Paris lies in the depression ofthe Paris Basin. The climate is classified as amarine west-coast climate typical of westernEurope. Paris is about 160 km from the coast andis therefore not directly influenced by coastal diur-nal wind changes. The conurbation is surroundedby wind-shielding hills which can prevent the dis-persion of air from the basin during wind-still peri-ods and temperature inversions.
The average wind speed is a relatively strong3.5 m/s. The strongest winds come from the south-south-west followed by north-north eastern andwestern winds. Wind speeds are generally lowestin summer.
Air Quality Risk AssessmentFactors that influence the risk of air quality prob-lems in Paris include the topography of a shelteredbasin but the generally high wind speed tends toassist dispersion. In the winter, episodes likely tolead to winter smog may occur, particularly in Jan-uary and February. There are relatively short peri-ods of anti-cyclonic conditions with temperaturesin the range of, or slightly below, 0°C, clear sky andvery light, mostly easterly winds; this combinationgives rise to stable atmospheric conditions withlow-altitude inversion layers which sometimesinclude dense low-level fog (winter smog potentialClass 2). In summer, the generally lower wind
speeds also provide some meteorological potentialfor summer smog. Emissions are particularly highin summer (Class 5) whilst the winter smog emis-sion index is a more moderate Class 3.
These combinations of emission, climatic andtopographic indices for smog potential agree withthe observed occurrences of episodes of poor airquality. Exceedances of WHO-AQG were still beingobserved for SO2 in the 1980s. However, SO2 l e v e l shave been measured in Paris since the 1950s, fromwhich point values have fallen by almost 80% andare now below the EC limit values. Noexceedances have been reported recently,although exceedance and population exposure isstill considered possible.
Summer smog emissions are very high, as evi-denced by the need to control city traffic flowsduring the summer smog of 1997. Over two-thirdsof the population are estimated to be exposed toN O2 values above 200 µg/m3 and an increase inconcentrations was reported in recent years. Simi-larly, O3 levels exceed EU guidelines on 1–5 days ayear during which time over two-thirds of the pop-ulation have been affected at the lower 180 µg/m3
threshold and up to one-third may have beenaffected by the higher 270 µg/m3 l e v e l .
Statistical SummaryC o u n t r y : I t a l yP o p u l a t i o n : City – 2,830,000
Conurbation – 3,710,000 (1991)Map Reference: 41°53N, 12°30' EArea (km2) : Built-up area – 125
Situational AnalysisRome is situated on the River Tiber where thevalley opens out on to the coastal plain. The cli-mate is classified as Mediterranean temperaterainy. Winters are wet and summers dry due to analternation of moist polar air masses in winter withdry maritime tropical air masses in summer.
Air Quality Risk AssessmentRome is regarded as having a moderate situationin terms of risk of poor air quality as it is situatedat the widest part of the Tiber valley and is notclosely surrounded by mountains. The averagewind speed is broadly within the range 3.0–3.9 m/s(Class 3). These two factors give a moderate (Class3) dispersion index. However, in the summermonths prolonged hot sunny spells provide condi-tions for photochemical smog and the summerdrought favours episodes of dust pollution. Thepotential for summer smog is placed in the
47
Analysis of Local Impacts on Air Quality
P a r i s
R o m e
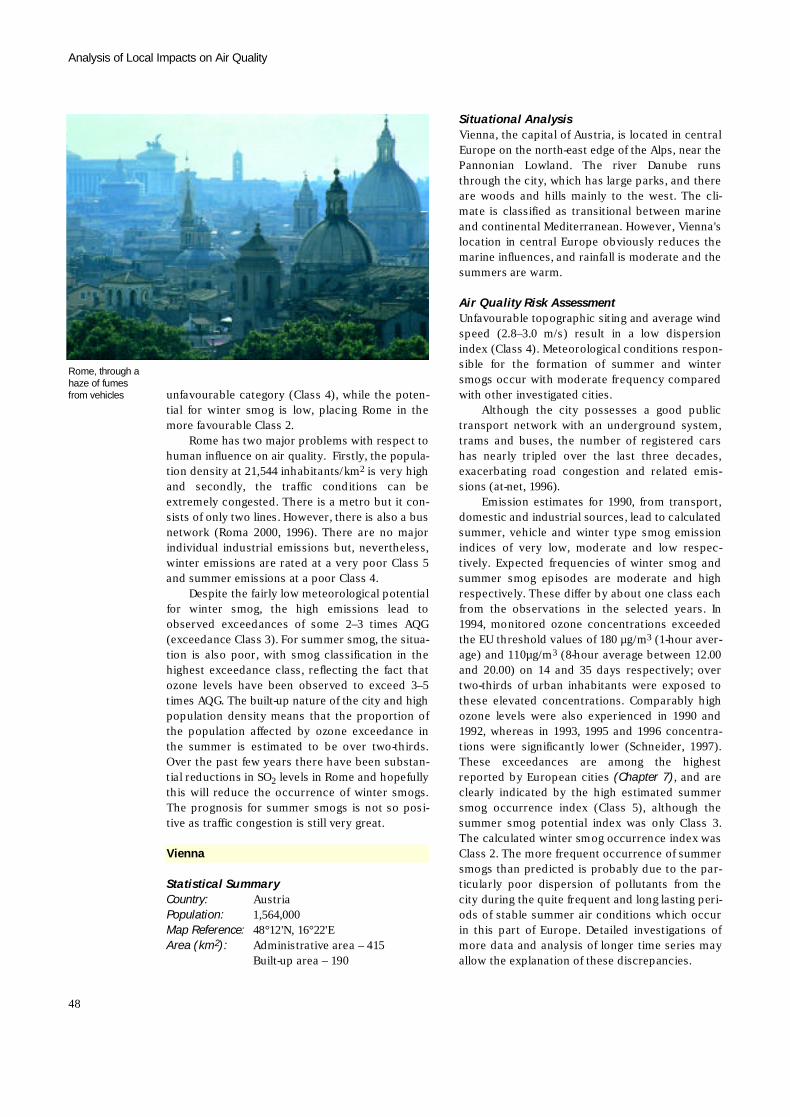
unfavourable category (Class 4), while the poten-tial for winter smog is low, placing Rome in themore favourable Class 2.
Rome has two major problems with respect tohuman influence on air quality. Firstly, the popula-tion density at 21,544 inhabitants/km2 is very highand secondly, the traffic conditions can beextremely congested. There is a metro but it con-sists of only two lines. However, there is also a busnetwork (Roma 2000, 1996). There are no majorindividual industrial emissions but, nevertheless,winter emissions are rated at a very poor Class 5and summer emissions at a poor Class 4.
Despite the fairly low meteorological potentialfor winter smog, the high emissions lead toobserved exceedances of some 2–3 times AQG(exceedance Class 3). For summer smog, the situa-tion is also poor, with smog classification in thehighest exceedance class, reflecting the fact thatozone levels have been observed to exceed 3–5times AQG. The built-up nature of the city and highpopulation density means that the proportion ofthe population affected by ozone exceedance inthe summer is estimated to be over two-thirds.Over the past few years there have been substan-tial reductions in SO2 levels in Rome and hopefullythis will reduce the occurrence of winter smogs.The prognosis for summer smogs is not so posi-tive as traffic congestion is still very great.
Statistical SummaryC o u n t r y : A u s t r i aP o p u l a t i o n : 1 , 5 6 4 , 0 0 0Map Reference: 48°12'N, 16°22'EArea (km2) : Administrative area – 415
Built-up area – 190
Situational AnalysisVienna, the capital of Austria, is located in centralEurope on the north-east edge of the Alps, near thePannonian Lowland. The river Danube runsthrough the city, which has large parks, and thereare woods and hills mainly to the west. The cli-mate is classified as transitional between marineand continental Mediterranean. However, Vienna'slocation in central Europe obviously reduces themarine influences, and rainfall is moderate and thesummers are warm.
Air Quality Risk AssessmentUnfavourable topographic siting and average windspeed (2.8–3.0 m/s) result in a low dispersionindex (Class 4). Meteorological conditions respon-sible for the formation of summer and wintersmogs occur with moderate frequency comparedwith other investigated cities.
Although the city possesses a good publictransport network with an underground system,trams and buses, the number of registered carshas nearly tripled over the last three decades,exacerbating road congestion and related emis-sions (at-net, 1996).
Emission estimates for 1990, from transport,domestic and industrial sources, lead to calculatedsummer, vehicle and winter type smog emissionindices of very low, moderate and low respec-tively. Expected frequencies of winter smog andsummer smog episodes are moderate and highrespectively. These differ by about one class eachfrom the observations in the selected years. In1994, monitored ozone concentrations exceededthe EU threshold values of 180 µg/m3 (1-hour aver-age) and 110µg/m3 (8-hour average between 12.00and 20.00) on 14 and 35 days respectively; overtwo-thirds of urban inhabitants were exposed tothese elevated concentrations. Comparably highozone levels were also experienced in 1990 and1992, whereas in 1993, 1995 and 1996 concentra-tions were significantly lower (Schneider, 1997).These exceedances are among the highestreported by European cities (Chapter 7), and areclearly indicated by the high estimated summersmog occurrence index (Class 5), although thesummer smog potential index was only Class 3.The calculated winter smog occurrence index wasClass 2. The more frequent occurrence of summersmogs than predicted is probably due to the par-ticularly poor dispersion of pollutants from thecity during the quite frequent and long lasting peri-ods of stable summer air conditions which occurin this part of Europe. Detailed investigations ofmore data and analysis of longer time series mayallow the explanation of these discrepancies.
Analysis of Local Impacts on Air Quality
48
V i e n n a
Rome, through ahaze of fumesfrom vehicles
Statistical SummaryC o u n t r y : P o l a n dP o p u l a t i o n : 1 , 6 5 3 , 0 0 0Map Reference: 52°13'N, 21°01' EArea (km2) : Built-up area – 495
Situational AnalysisWarsaw, the capital of Poland, lies in the valley ofthe River Vistula which flows through the city.Hills surround the city on all sides but they do notexceed an altitude of 200 m and thus present onlya minor windshield. Warsaw is classified as havinga humid continental climate with precipitation inall months and no dry season. The temperaturerange is sub-arctic with the coldest month averag-ing less than -3°C but with relatively warm sum-mers where the warmest month is less than 22°C.
Air Quality Risk AssessmentThe climatic typology of Warsaw can give rise toprolonged cold winter periods with stagnating airand inversions favouring pollutant accumulationwhilst, in the short summer, conditions can befavourable for photochemical smog formation.
The topographical situation of Warsaw isfavourable since it is surrounded by only low lyinghills and this, combined with a moderately highaverage wind speed of 3.9 m/s, leads to a moderatedispersion index (Class 3). However, the averagewind speed in some years falls into the higher cat-egory of 4.0–4.9 m/s indicating that the dispersionindex may sometimes be more favourable.
The winter smog potential of Warsaw is average(Class 3) and the winter smog emissions are alsoclassified as average (Class 3). The meteorologicalsummer smog potential is also average but thesummer smog emissions index is moreunfavourable (Class 4), thus indicating an aboveaverage risk of summer smogs. The data on actualair quality conditions in Warsaw suggest that SO2
maximum city background levels do not exceedWHO-AQG and hence the winter smog potentialwas not realised in the year under investigation.For summer smog the exceedance class is rated asClass 2, i.e. no days of exceedance recorded, butlevels suggest that there is a possibility that theymay do so from time to time.
Warsaw is an interesting example of a cityfrom eastern Europe where the apparent potentialfor the risk of poor air quality is moderate butactual exceedances did not occur in the investi-gated year. The current population density is low;the vehicles present and their emission index isalso quite low. Several cities from eastern Europehave reported reduced economic activity in recentyears and this may have offered a temporaryrespite from smog risks. The implications of this,however, may be that the main future risk will belinked to increased standards of living which maygenerate increasing emissions – particularly thoseassociated with summer smog, i.e. vehicular emis-sions. Any major increase would almost certainlylead to the realisation of the high meteorologicalsummer smog potential.
49
Analysis of Local Impacts on Air Quality
W a r s a w

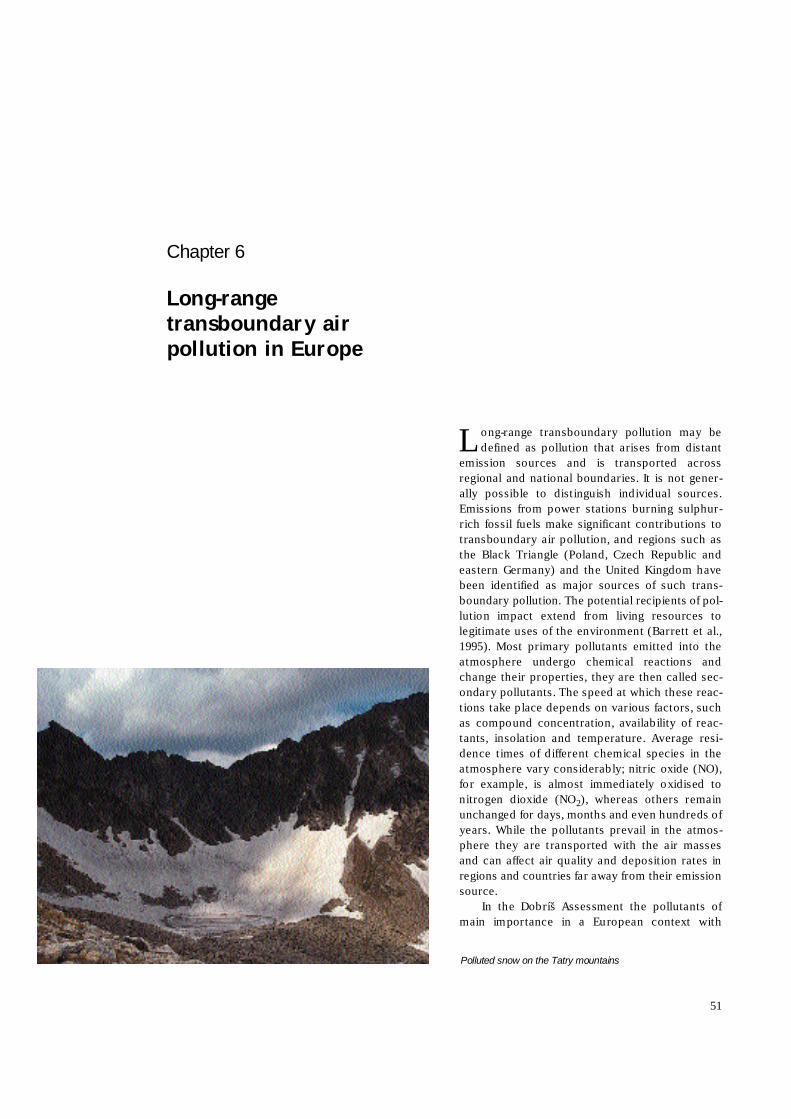
L ong-range transboundary pollution may bedefined as pollution that arises from distant
emission sources and is transported acrossregional and national boundaries. It is not gener-ally possible to distinguish individual sources.Emissions from power stations burning sulphur-rich fossil fuels make significant contributions totransboundary air pollution, and regions such asthe Black Triangle (Poland, Czech Republic andeastern Germany) and the United Kingdom havebeen identified as major sources of such trans-boundary pollution. The potential recipients of pol-lution impact extend from living resources tolegitimate uses of the environment (Barrett et al.,1995). Most primary pollutants emitted into theatmosphere undergo chemical reactions andchange their properties, they are then called sec-ondary pollutants. The speed at which these reac-tions take place depends on various factors, suchas compound concentration, availability of reac-tants, insolation and temperature. Average resi-dence times of different chemical species in theatmosphere vary considerably; nitric oxide (NO),for example, is almost immediately oxidised tonitrogen dioxide (NO2), whereas others remainunchanged for days, months and even hundreds ofyears. While the pollutants prevail in the atmos-phere they are transported with the air massesand can affect air quality and deposition rates inregions and countries far away from their emissions o u r c e .
In the Dobrís̆ Assessment the pollutants ofmain importance in a European context with
Chapter 6
Long-range t r a n s b o u n d a ry air pollution in Euro p e
5 1
Polluted snow on the Tatry mountains
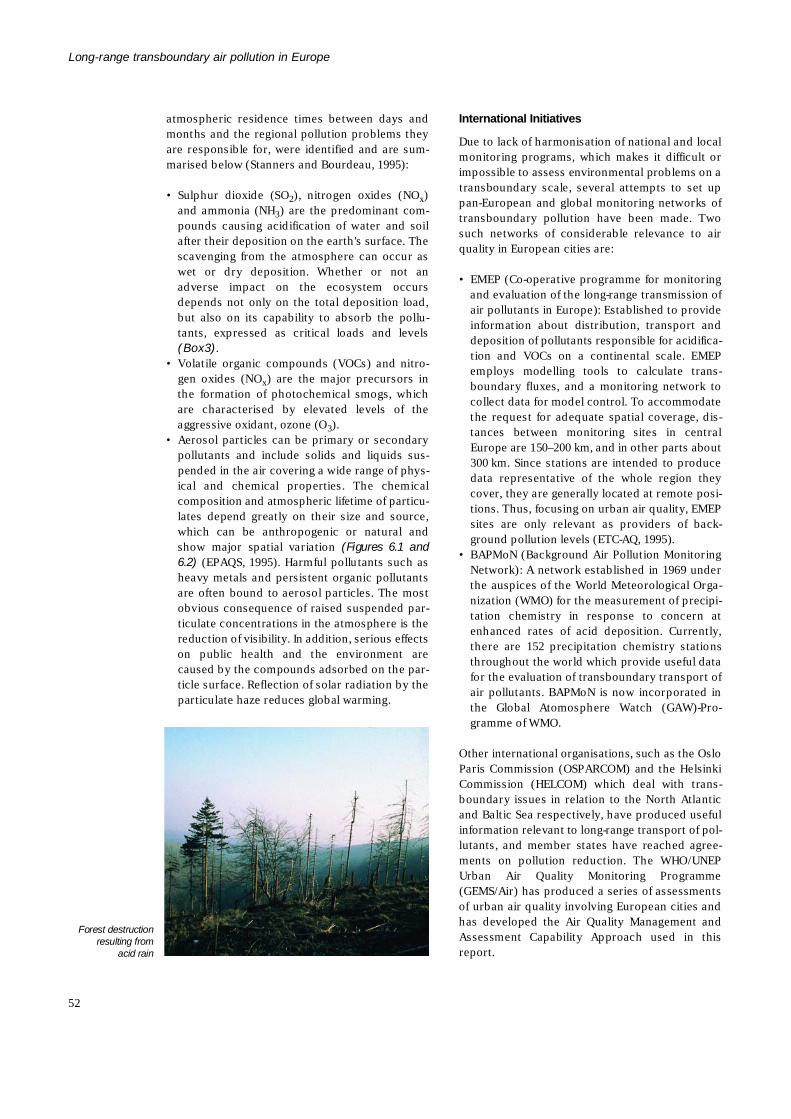
atmospheric residence times between days andmonths and the regional pollution problems theyare responsible for, were identified and are sum-marised below (Stanners and Bourdeau, 1995):
• Sulphur dioxide (SO2), nitrogen oxides (NOx)and ammonia (NH3) are the predominant com-pounds causing acidification of water and soilafter their deposition on the earth's surface. Thescavenging from the atmosphere can occur aswet or dry deposition. Whether or not anadverse impact on the ecosystem occursdepends not only on the total deposition load,but also on its capability to absorb the pollu-tants, expressed as critical loads and levels( B o x3 ).
• Volatile organic compounds (VOCs) and nitro-gen oxides (NOx) are the major precursors inthe formation of photochemical smogs, whichare characterised by elevated levels of theaggressive oxidant, ozone (O3) .
• Aerosol particles can be primary or secondarypollutants and include solids and liquids sus-pended in the air covering a wide range of phys-ical and chemical properties. The chemicalcomposition and atmospheric lifetime of particu-lates depend greatly on their size and source,which can be anthropogenic or natural andshow major spatial variation (Figures 6.1 and6 . 2 ) (EPAQS, 1995). Harmful pollutants such asheavy metals and persistent organic pollutantsare often bound to aerosol particles. The mostobvious consequence of raised suspended par-ticulate concentrations in the atmosphere is thereduction of visibility. In addition, serious effectson public health and the environment arecaused by the compounds adsorbed on the par-ticle surface. Reflection of solar radiation by theparticulate haze reduces global warming.
International Initiatives
Due to lack of harmonisation of national and localmonitoring programs, which makes it difficult orimpossible to assess environmental problems on atransboundary scale, several attempts to set uppan-European and global monitoring networks oftransboundary pollution have been made. Twosuch networks of considerable relevance to airquality in European cities are:
• EMEP (Co-operative programme for monitoringand evaluation of the long-range transmission ofair pollutants in Europe): Established to provideinformation about distribution, transport anddeposition of pollutants responsible for acidifica-tion and VOCs on a continental scale. EMEPemploys modelling tools to calculate trans-boundary fluxes, and a monitoring network tocollect data for model control. To accommodatethe request for adequate spatial coverage, dis-tances between monitoring sites in centralEurope are 150–200 km, and in other parts about3 0 0 km. Since stations are intended to producedata representative of the whole region theycover, they are generally located at remote posi-tions. Thus, focusing on urban air quality, EMEPsites are only relevant as providers of back-ground pollution levels (ETC-AQ, 1995).
• BAPMoN (Background Air Pollution MonitoringNetwork): A network established in 1969 underthe auspices of the World Meteorological Orga-nization (WMO) for the measurement of precipi-tation chemistry in response to concern atenhanced rates of acid deposition. Currently,there are 152 precipitation chemistry stationsthroughout the world which provide useful datafor the evaluation of transboundary transport ofair pollutants. BAPMoN is now incorporated inthe Global Atomosphere Watch (GAW)-Pro-gramme of WMO.
Other international organisations, such as the OsloParis Commission (OSPARCOM) and the HelsinkiCommission (HELCOM) which deal with trans-boundary issues in relation to the North Atlanticand Baltic Sea respectively, have produced usefulinformation relevant to long-range transport of pol-lutants, and member states have reached agree-ments on pollution reduction. The WHO/UNEPUrban Air Quality Monitoring Programme(GEMS/Air) has produced a series of assessmentsof urban air quality involving European cities andhas developed the Air Quality Management andAssessment Capability Approach used in thisr e p o r t .
Long-range transboundary air pollution in Europe
52
Forest destructionresulting from
acid rain
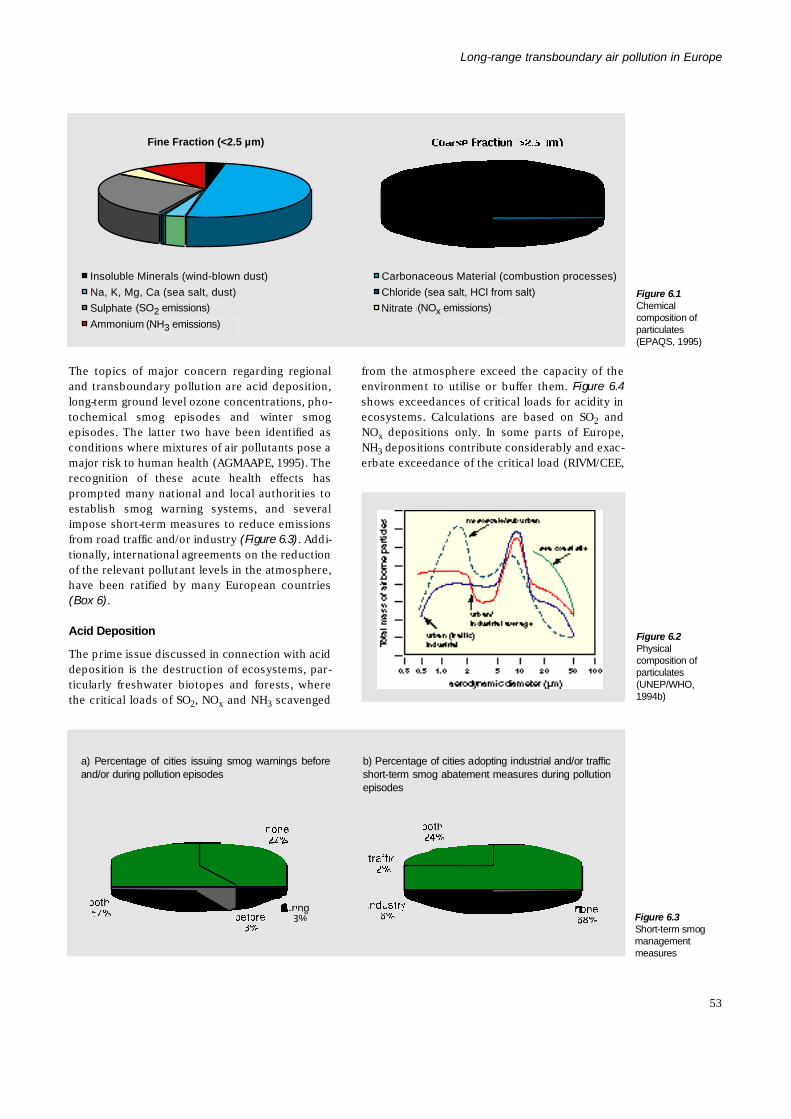
The topics of major concern regarding regionaland transboundary pollution are acid deposition,long-term ground level ozone concentrations, pho-tochemical smog episodes and winter smogepisodes. The latter two have been identified asconditions where mixtures of air pollutants pose amajor risk to human health (AGMAAPE, 1995). Therecognition of these acute health effects hasprompted many national and local authorities toestablish smog warning systems, and severalimpose short-term measures to reduce emissionsfrom road traffic and/or industry (Figure 6.3). Addi-tionally, international agreements on the reductionof the relevant pollutant levels in the atmosphere,have been ratified by many European countries(Box 6).
Acid Deposition
The prime issue discussed in connection with aciddeposition is the destruction of ecosystems, par-ticularly freshwater biotopes and forests, wherethe critical loads of SO2, NOx and NH3 s c a v e n g e d
from the atmosphere exceed the capacity of theenvironment to utilise or buffer them. Figure 6.4shows exceedances of critical loads for acidity inecosystems. Calculations are based on SO2 a n dN Ox depositions only. In some parts of Europe,N H3 depositions contribute considerably and exac-erbate exceedance of the critical load (RIVM/CEE,
53
Long-range transboundary air pollution in Europe
Figure 6.1C h e m i c a lcomposition ofp a r t i c u l a t e s(EPAQS, 1995)
Figure 6.2 P h y s i c a lcomposition ofp a r t i c u l a t e s( U N E P / W H O ,1 9 9 4 b )
Figure 6.3Short-term smogm a n a g e m e n tm e a s u r e s
Fine Fraction (<2.5 µm)
Insoluble Minerals (wind-blown dust) Carbonaceous Material (combustion processes)
Na, K, Mg, Ca (sea salt, dust) Chloride (sea salt, HCl from salt)
Sulphate (SO2 emissions) Nitrate (NOx emissions)
Ammonium (NH3 emissions)
a) Percentage of cities issuing smog warnings beforeand/or during pollution episodes
b) Percentage of cities adopting industrial and/or trafficshort-term smog abatement measures during pollutione p i s o d e s
during13%
( S O2 e m i s s i o n s )
( N H3 e m i s s i o n s )
( N Ox e m i s s i o n s )
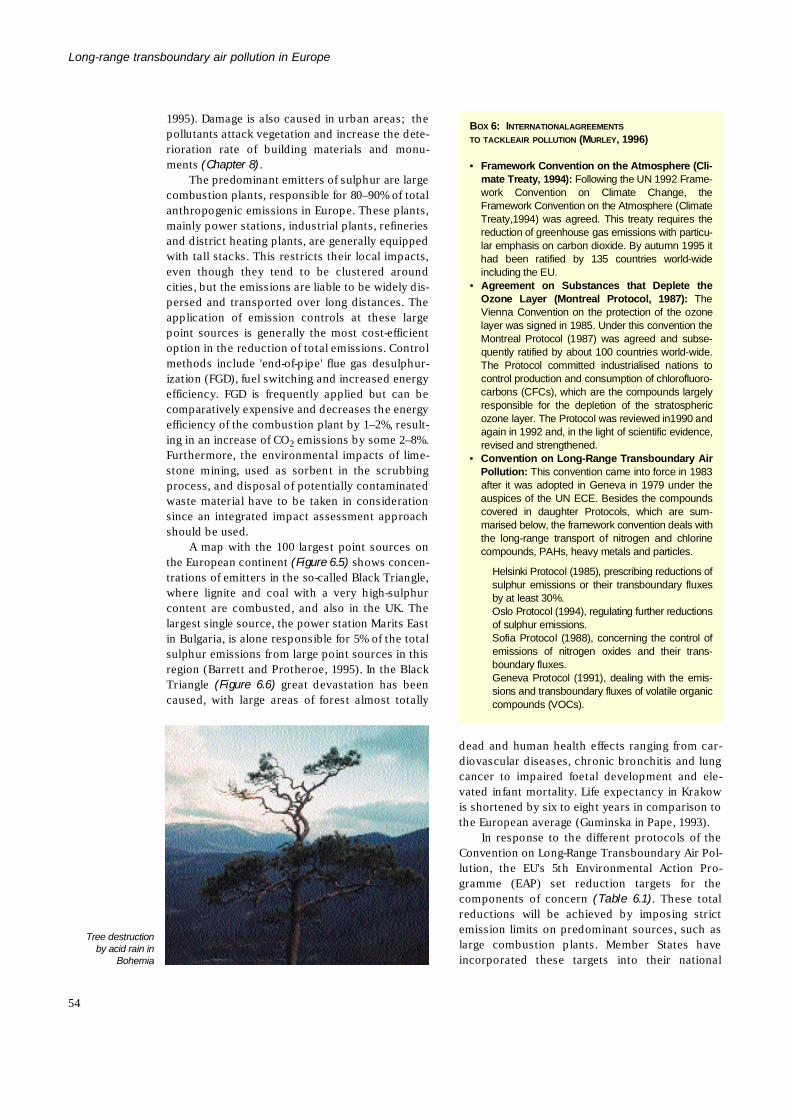
1995). Damage is also caused in urban areas; thepollutants attack vegetation and increase the dete-rioration rate of building materials and monu-ments (Chapter 8).
The predominant emitters of sulphur are largecombustion plants, responsible for 80–90% of totalanthropogenic emissions in Europe. These plants,mainly power stations, industrial plants, refineriesand district heating plants, are generally equippedwith tall stacks. This restricts their local impacts,even though they tend to be clustered aroundcities, but the emissions are liable to be widely dis-persed and transported over long distances. Theapplication of emission controls at these largepoint sources is generally the most cost-efficientoption in the reduction of total emissions. Controlmethods include 'end-of-pipe' flue gas desulphur-ization (FGD), fuel switching and increased energyefficiency. FGD is frequently applied but can becomparatively expensive and decreases the energyefficiency of the combustion plant by 1–2%, result-ing in an increase of CO2 emissions by some 2–8%.Furthermore, the environmental impacts of lime-stone mining, used as sorbent in the scrubbingprocess, and disposal of potentially contaminatedwaste material have to be taken in considerationsince an integrated impact assessment approachshould be used.
A map with the 100 largest point sources onthe European continent (Figure 6.5) shows concen-trations of emitters in the so-called Black Triangle,where lignite and coal with a very high-sulphurcontent are combusted, and also in the UK. Thelargest single source, the power station Marits Eastin Bulgaria, is alone responsible for 5% of the totalsulphur emissions from large point sources in thisregion (Barrett and Protheroe, 1995). In the BlackTriangle (Figure 6.6) great devastation has beencaused, with large areas of forest almost totally
dead and human health effects ranging from car-diovascular diseases, chronic bronchitis and lungcancer to impaired foetal development and ele-vated infant mortality. Life expectancy in Krakowis shortened by six to eight years in comparison tothe European average (Guminska in Pape, 1993).
In response to the different protocols of theConvention on Long-Range Transboundary Air Pol-lution, the EU's 5th Environmental Action Pro-gramme (EAP) set reduction targets for thecomponents of concern (Table 6.1). These totalreductions will be achieved by imposing strictemission limits on predominant sources, such aslarge combustion plants. Member States haveincorporated these targets into their national
Long-range transboundary air pollution in Europe
54
BO X 6: IN T E R N A T I O N A LA G R E E M E N T S
T O T A C K L EA I R P O L L U T I O N ( MU R L E Y, 1996)
• Framework Convention on the Atmosphere (Cli-mate Treaty, 1994): Following the UN 1992 Frame-work Convention on Climate Change, theFramework Convention on the Atmosphere (ClimateTreaty,1994) was agreed. This treaty requires thereduction of greenhouse gas emissions with particu-lar emphasis on carbon dioxide. By autumn 1995 ithad been ratified by 135 countries world-wideincluding the EU.
• Agreement on Substances that Deplete theOzone Layer (Montreal Protocol, 1987): T h eVienna Convention on the protection of the ozonelayer was signed in 1985. Under this convention theMontreal Protocol (1987) was agreed and subse-quently ratified by about 100 countries world-wide.The Protocol committed industrialised nations tocontrol production and consumption of chlorofluoro-carbons (CFCs), which are the compounds largelyresponsible for the depletion of the stratosphericozone layer. The Protocol was reviewed in1990 andagain in 1992 and, in the light of scientific evidence,revised and strengthened.
• Convention on Long-Range Transboundary AirP o l l u t i o n : This convention came into force in 1983after it was adopted in Geneva in 1979 under theauspices of the UN ECE. Besides the compoundscovered in daughter Protocols, which are sum-marised below, the framework convention deals withthe long-range transport of nitrogen and chlorinecompounds, PAHs, heavy metals and particles.
Helsinki Protocol (1985), prescribing reductions ofsulphur emissions or their transboundary fluxesby at least 30%.Oslo Protocol (1994), regulating further reductionsof sulphur emissions.Sofia Protocol (1988), concerning the control ofemissions of nitrogen oxides and their trans-boundary fluxes.Geneva Protocol (1991), dealing with the emis-sions and transboundary fluxes of volatile organiccompounds (VOCs).
Tree destructionby acid rain in
B o h e m i a
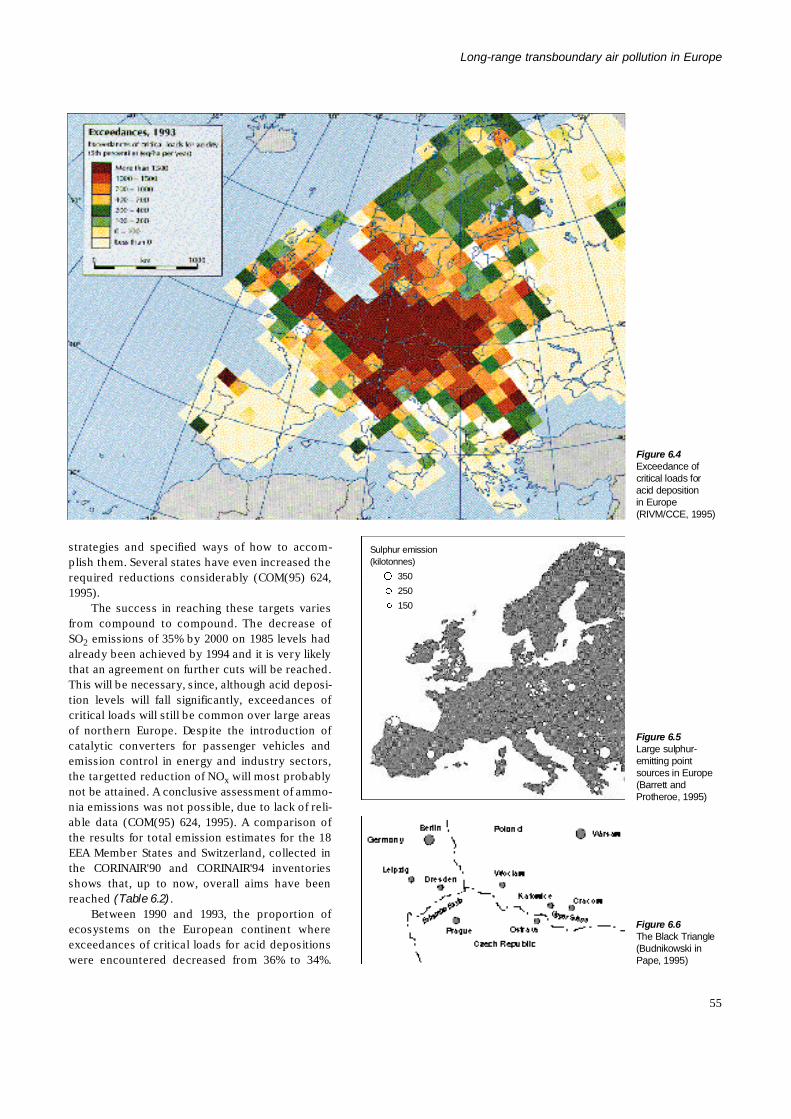
strategies and specified ways of how to accom-plish them. Several states have even increased therequired reductions considerably (COM(95) 624,1 9 9 5 ) .
The success in reaching these targets variesfrom compound to compound. The decrease ofS O2 emissions of 35% by 2000 on 1985 levels hadalready been achieved by 1994 and it is very likelythat an agreement on further cuts will be reached.This will be necessary, since, although acid deposi-tion levels will fall significantly, exceedances ofcritical loads will still be common over large areasof northern Europe. Despite the introduction ofcatalytic converters for passenger vehicles andemission control in energy and industry sectors,the targetted reduction of NOx will most probablynot be attained. A conclusive assessment of ammo-nia emissions was not possible, due to lack of reli-able data (COM(95) 624, 1995). A comparison ofthe results for total emission estimates for the 18EEA Member States and Switzerland, collected inthe CORINAIR'90 and CORINAIR'94 inventoriesshows that, up to now, overall aims have beenreached (Table 6.2).
Between 1990 and 1993, the proportion ofecosystems on the European continent whereexceedances of critical loads for acid depositionswere encountered decreased from 36% to 34%.
55
Long-range transboundary air pollution in Europe
Figure 6.4Exceedance ofcritical loads foracid depositionin Europe(RIVM/CCE, 1995)
Figure 6.5Large sulphur-emitting pointsources in Europe(Barrett andProtheroe, 1995)
Figure 6.6The Black Triangle (Budnikowski inPape, 1995)
Sulphur emission( k i l o t o n n e s )
3 5 0
2 5 0
1 5 0
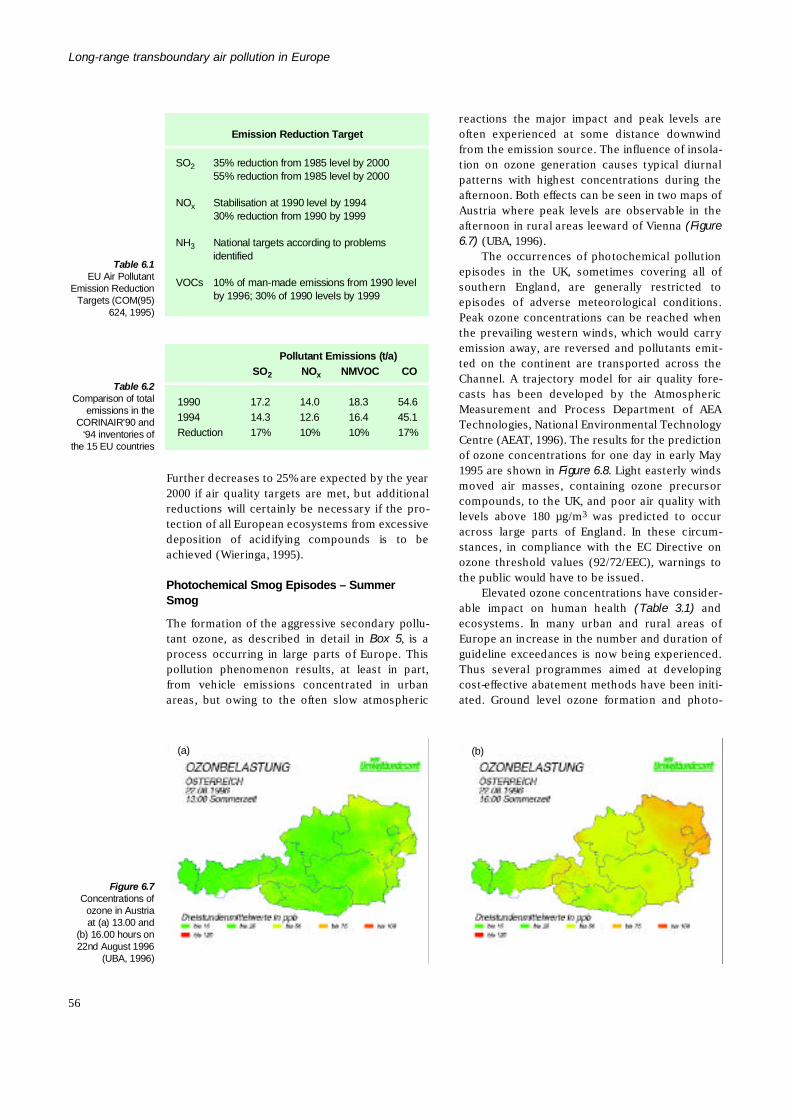
Further decreases to 25% are expected by the year2000 if air quality targets are met, but additionalreductions will certainly be necessary if the pro-tection of all European ecosystems from excessivedeposition of acidifying compounds is to beachieved (Wieringa, 1995).
Photochemical Smog Episodes – SummerS m o g
The formation of the aggressive secondary pollu-tant ozone, as described in detail in Box 5, is aprocess occurring in large parts of Europe. Thispollution phenomenon results, at least in part,from vehicle emissions concentrated in urbanareas, but owing to the often slow atmospheric
reactions the major impact and peak levels areoften experienced at some distance downwindfrom the emission source. The influence of insola-tion on ozone generation causes typical diurnalpatterns with highest concentrations during theafternoon. Both effects can be seen in two maps ofAustria where peak levels are observable in theafternoon in rural areas leeward of Vienna ( F i g u r e6 . 7 ) (UBA, 1996).
The occurrences of photochemical pollutionepisodes in the UK, sometimes covering all ofsouthern England, are generally restricted toepisodes of adverse meteorological conditions.Peak ozone concentrations can be reached whenthe prevailing western winds, which would carryemission away, are reversed and pollutants emit-ted on the continent are transported across theChannel. A trajectory model for air quality fore-casts has been developed by the AtmosphericMeasurement and Process Department of AEATechnologies, National Environmental TechnologyCentre (AEAT, 1996). The results for the predictionof ozone concentrations for one day in early May1995 are shown in Figure 6.8. Light easterly windsmoved air masses, containing ozone precursorcompounds, to the UK, and poor air quality withlevels above 180 µg/m3 was predicted to occuracross large parts of England. In these circum-stances, in compliance with the EC Directive onozone threshold values (92/72/EEC), warnings tothe public would have to be issued.
Elevated ozone concentrations have consider-able impact on human health (Table 3.1) a n decosystems. In many urban and rural areas ofEurope an increase in the number and duration ofguideline exceedances is now being experienced.Thus several programmes aimed at developingcost-effective abatement methods have been initi-ated. Ground level ozone formation and photo-
Long-range transboundary air pollution in Europe
56
Pollutant Emissions (t/a)
S O2 N Ox N M V O C C O
1 9 9 0 1 7 . 2 1 4 . 0 1 8 . 3 5 4 . 61 9 9 4 1 4 . 3 1 2 . 6 1 6 . 4 4 5 . 1R e d u c t i o n 1 7 % 1 0 % 1 0 % 1 7 %
Table 6.2Comparison of total
emissions in theCORINAIR’90 and
‘94 inventories ofthe 15 EU countries
Emission Reduction Target
S O2 35% reduction from 1985 level by 200055% reduction from 1985 level by 2000
N Ox Stabilisation at 1990 level by 199430% reduction from 1990 by 1999
N H3 National targets according to problemsi d e n t i f i e d
V O C s 10% of man-made emissions from 1990 levelby 1996; 30% of 1990 levels by 1999
Table 6.1EU Air Pollutant
Emission ReductionTargets (COM(95)
624, 1995)
Figure 6.7Concentrations of
ozone in Austriaat (a) 13.00 and
(b) 16.00 hours on22nd August 1996
(UBA, 1996)
( a ) ( b )
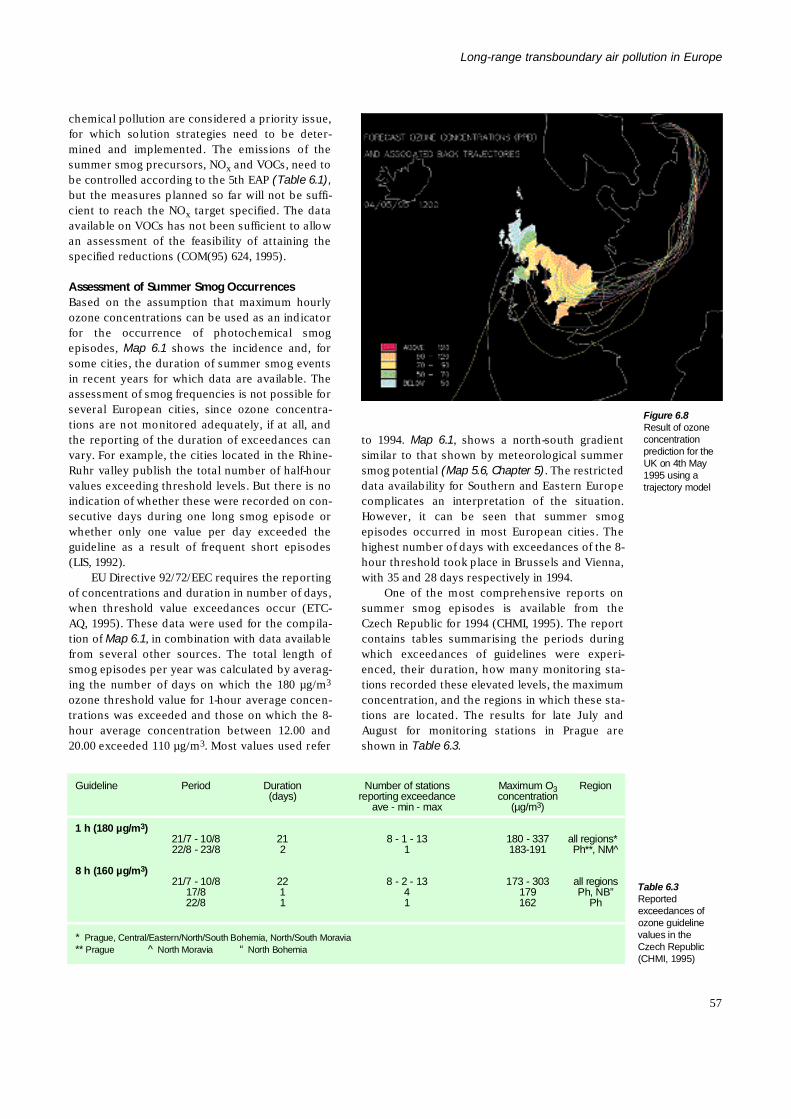
chemical pollution are considered a priority issue,for which solution strategies need to be deter-mined and implemented. The emissions of thesummer smog precursors, NOx and VOCs, need tobe controlled according to the 5th EAP (Table 6.1),but the measures planned so far will not be suffi-cient to reach the NOx target specified. The dataavailable on VOCs has not been sufficient to allowan assessment of the feasibility of attaining thespecified reductions (COM(95) 624, 1995).
Assessment of Summer Smog OccurrencesBased on the assumption that maximum hourlyozone concentrations can be used as an indicatorfor the occurrence of photochemical smogepisodes, Map 6.1 shows the incidence and, forsome cities, the duration of summer smog eventsin recent years for which data are available. Theassessment of smog frequencies is not possible forseveral European cities, since ozone concentra-tions are not monitored adequately, if at all, andthe reporting of the duration of exceedances canvary. For example, the cities located in the Rhine-Ruhr valley publish the total number of half-hourvalues exceeding threshold levels. But there is noindication of whether these were recorded on con-secutive days during one long smog episode orwhether only one value per day exceeded theguideline as a result of frequent short episodes(LIS, 1992).
EU Directive 92/72/EEC requires the reportingof concentrations and duration in number of days,when threshold value exceedances occur (ETC-AQ, 1995). These data were used for the compila-tion of Map 6.1, in combination with data availablefrom several other sources. The total length ofsmog episodes per year was calculated by averag-ing the number of days on which the 180 µg/m3
ozone threshold value for 1-hour average concen-trations was exceeded and those on which the 8-hour average concentration between 12.00 and20.00 exceeded 110 µg/m3. Most values used refer
to 1994. Map 6.1, shows a north-south gradientsimilar to that shown by meteorological summersmog potential (Map 5.6, Chapter 5). The restricteddata availability for Southern and Eastern Europecomplicates an interpretation of the situation.However, it can be seen that summer smogepisodes occurred in most European cities. Thehighest number of days with exceedances of the 8-hour threshold took place in Brussels and Vienna,with 35 and 28 days respectively in 1994.
One of the most comprehensive reports onsummer smog episodes is available from theCzech Republic for 1994 (CHMI, 1995). The reportcontains tables summarising the periods duringwhich exceedances of guidelines were experi-enced, their duration, how many monitoring sta-tions recorded these elevated levels, the maximumconcentration, and the regions in which these sta-tions are located. The results for late July andAugust for monitoring stations in Prague areshown in Table 6.3.
57
Long-range transboundary air pollution in Europe
Table 6.3R e p o r t e dexceedances ofozone guidelinevalues in theCzech Republic(CHMI, 1995)
G u i d e l i n e P e r i o d D u r a t i o n Number of stations Maximum O3 R e g i o n( d a y s ) reporting exceedance c o n c e n t r a t i o n
ave - min - max ( µ g / m3)
1 h (180 µg/m3)21/7 - 10/8 2 1 8 - 1 - 13 180 - 337 all regions*22/8 - 23/8 2 1 1 8 3 - 1 9 1 Ph**, NM^
8 h (160 µg/m3)21/7 - 10/8 2 2 8 - 2 - 13 173 - 303 all regions
1 7 / 8 1 4 1 7 9 Ph, NB”2 2 / 8 1 1 1 6 2 P h
* Prague, Central/Eastern/North/South Bohemia, North/South Moravia* * Prague ^ North Moravia “ North Bohemia
Figure 6.8Result of ozonec o n c e n t r a t i o nprediction for theUK on 4th May1995 using a trajectory model
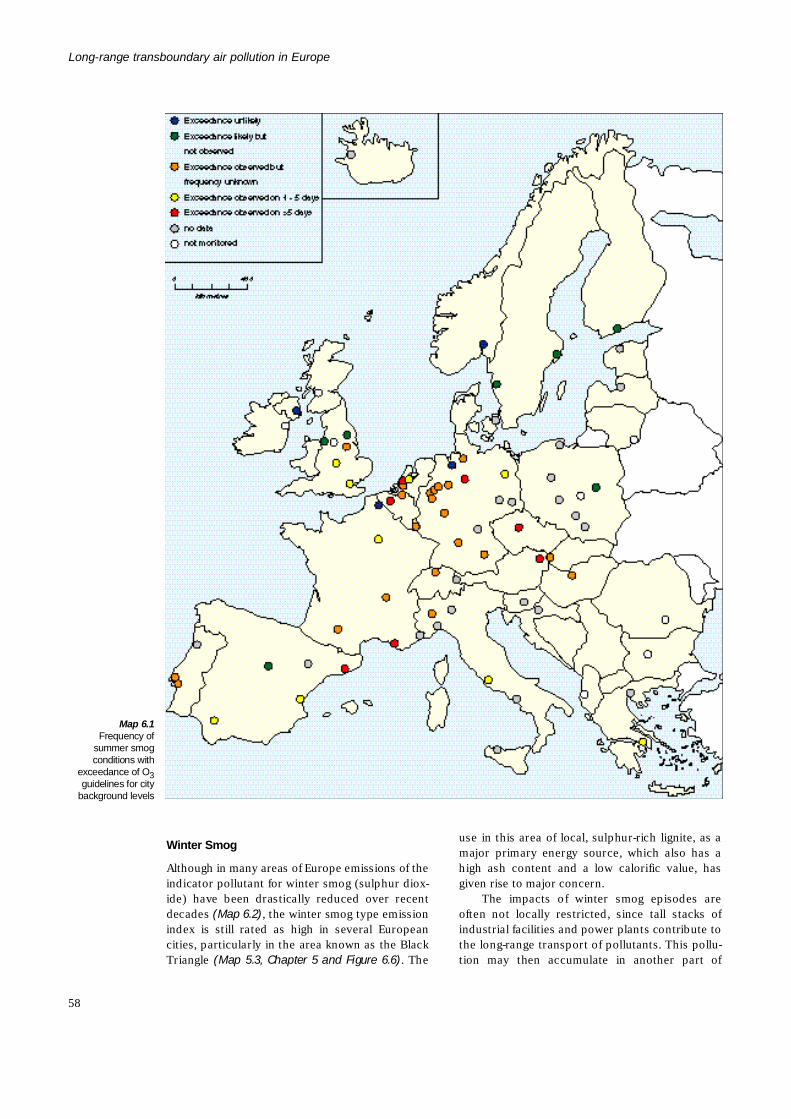
Winter Smog
Although in many areas of Europe emissions of theindicator pollutant for winter smog (sulphur diox-ide) have been drastically reduced over recentdecades (Map 6.2), the winter smog type emissionindex is still rated as high in several Europeancities, particularly in the area known as the BlackTriangle (Map 5.3, Chapter 5 and Figure 6.6). The
use in this area of local, sulphur-rich lignite, as amajor primary energy source, which also has ahigh ash content and a low calorific value, hasgiven rise to major concern.
The impacts of winter smog episodes areoften not locally restricted, since tall stacks ofindustrial facilities and power plants contribute tothe long-range transport of pollutants. This pollu-tion may then accumulate in another part of
Long-range transboundary air pollution in Europe
58
Map 6.1Frequency of
summer smog conditions with
exceedance of O3guidelines for city
background levels
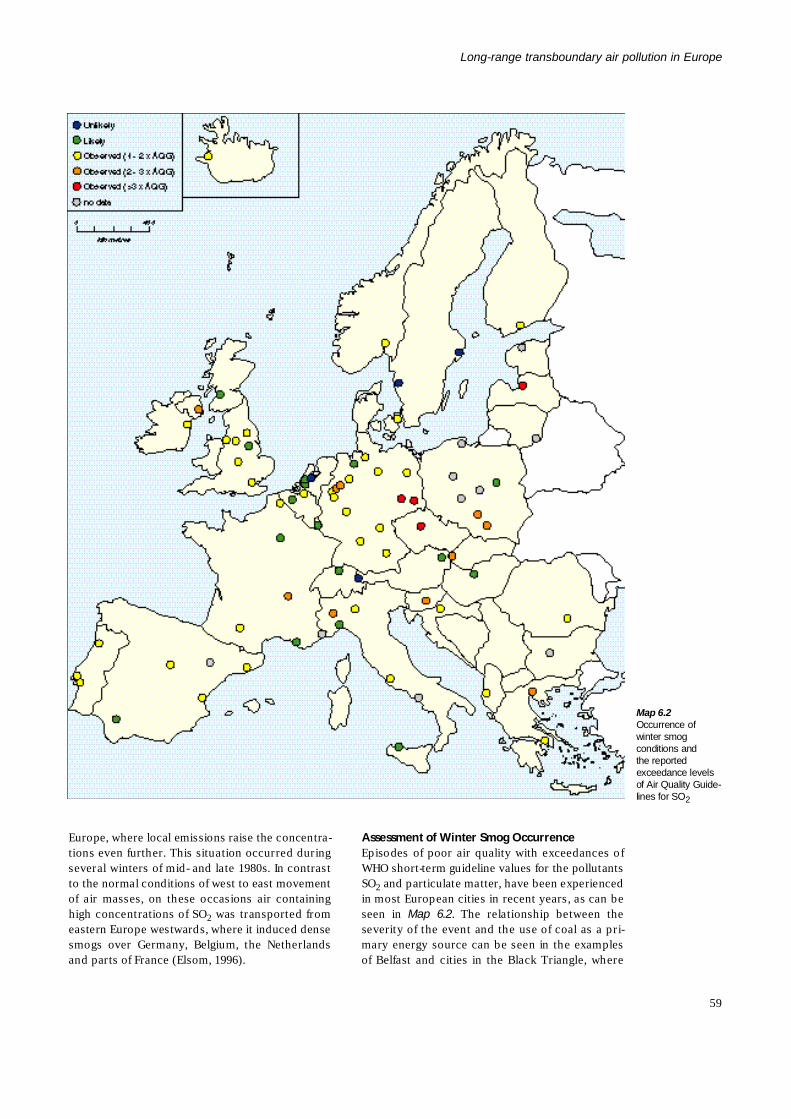
Europe, where local emissions raise the concentra-tions even further. This situation occurred duringseveral winters of mid- and late 1980s. In contrastto the normal conditions of west to east movementof air masses, on these occasions air containinghigh concentrations of SO2 was transported fromeastern Europe westwards, where it induced densesmogs over Germany, Belgium, the Netherlandsand parts of France (Elsom, 1996).
Assessment of Winter Smog OccurrenceEpisodes of poor air quality with exceedances ofWHO short-term guideline values for the pollutantsS O2 and particulate matter, have been experiencedin most European cities in recent years, as can beseen in Map 6.2. The relationship between theseverity of the event and the use of coal as a pri-mary energy source can be seen in the examplesof Belfast and cities in the Black Triangle, where
59
Long-range transboundary air pollution in Europe
Map 6.2Occurrence of winter smog conditions and the reportedexceedance levelsof Air Quality Guide-lines for SO2
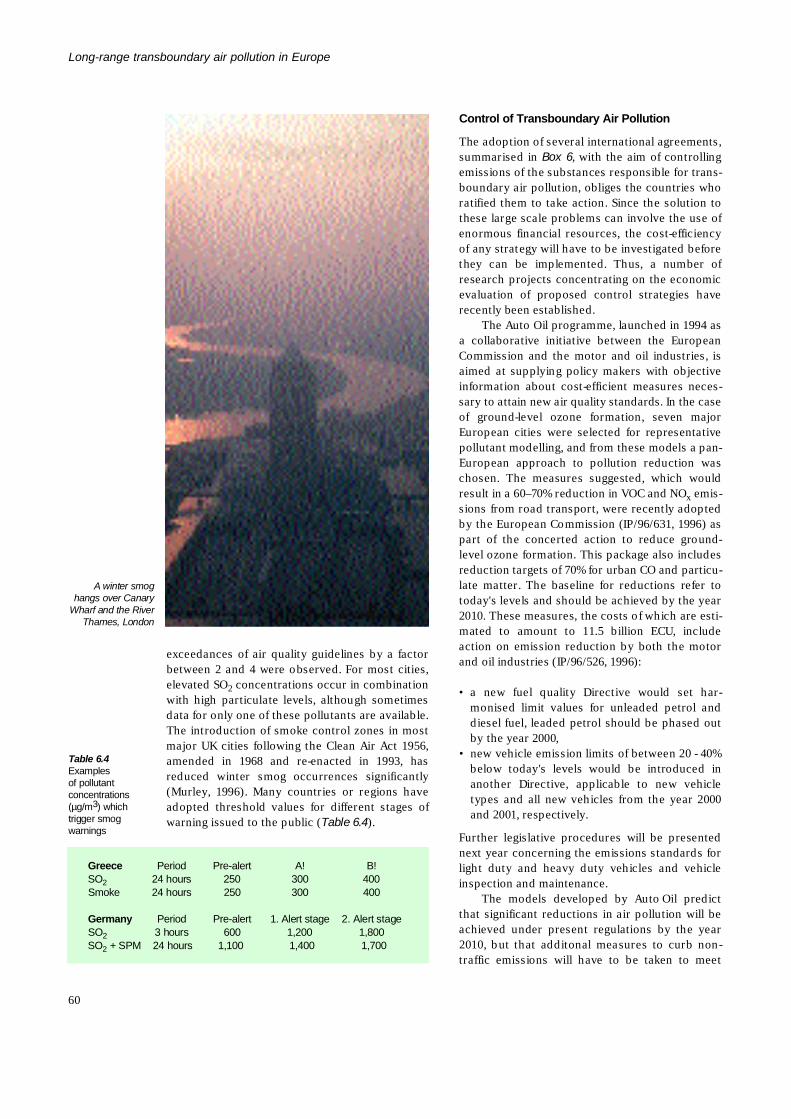
exceedances of air quality guidelines by a factorbetween 2 and 4 were observed. For most cities,elevated SO2 concentrations occur in combinationwith high particulate levels, although sometimesdata for only one of these pollutants are available.The introduction of smoke control zones in mostmajor UK cities following the Clean Air Act 1956,amended in 1968 and re-enacted in 1993, hasreduced winter smog occurrences significantly(Murley, 1996). Many countries or regions haveadopted threshold values for different stages ofwarning issued to the public (Table 6.4) .
Control of Transboundary Air Pollution
The adoption of several international agreements,summarised in Box 6, with the aim of controllingemissions of the substances responsible for trans-boundary air pollution, obliges the countries whoratified them to take action. Since the solution tothese large scale problems can involve the use ofenormous financial resources, the cost-efficiencyof any strategy will have to be investigated beforethey can be implemented. Thus, a number ofresearch projects concentrating on the economicevaluation of proposed control strategies haverecently been established.
The Auto Oil programme, launched in 1994 asa collaborative initiative between the EuropeanCommission and the motor and oil industries, isaimed at supplying policy makers with objectiveinformation about cost-efficient measures neces-sary to attain new air quality standards. In the caseof ground-level ozone formation, seven majorEuropean cities were selected for representativepollutant modelling, and from these models a pan-European approach to pollution reduction waschosen. The measures suggested, which wouldresult in a 60–70% reduction in VOC and NOx e m i s-sions from road transport, were recently adoptedby the European Commission (IP/96/631, 1996) aspart of the concerted action to reduce ground-level ozone formation. This package also includesreduction targets of 70% for urban CO and particu-late matter. The baseline for reductions refer totoday's levels and should be achieved by the year2010. These measures, the costs of which are esti-mated to amount to 11.5 billion ECU, includeaction on emission reduction by both the motorand oil industries (IP/96/526, 1996):
• a new fuel quality Directive would set har-monised limit values for unleaded petrol anddiesel fuel, leaded petrol should be phased outby the year 2000,
• new vehicle emission limits of between 20 - 40%below today's levels would be introduced inanother Directive, applicable to new vehicletypes and all new vehicles from the year 2000and 2001, respectively.
Further legislative procedures will be presentednext year concerning the emissions standards forlight duty and heavy duty vehicles and vehicleinspection and maintenance.
The models developed by Auto Oil predictthat significant reductions in air pollution will beachieved under present regulations by the year2010, but that additonal measures to curb non-t r a ffic emissions will have to be taken to meet
Long-range transboundary air pollution in Europe
60
G r e e c e P e r i o d P r e - a l e r t A ! B !S O2 24 hours 2 5 0 3 0 0 4 0 0S m o k e 24 hours 2 5 0 3 0 0 4 0 0
G e r m a n y P e r i o d P r e - a l e r t 1. Alert stage 2. Alert stageS O2 3 hours 6 0 0 1 , 2 0 0 1 , 8 0 0S O2 + SPM 24 hours 1 , 1 0 0 1 , 4 0 0 1 , 7 0 0
Table 6.4Examples of pollutant c o n c e n t r a t i o n s( µ g / m3) which trigger smogw a r n i n g s
A winter smoghangs over Canary
Wharf and the RiverThames, London
ozone air quality standards. The Auto Oil pro-gramme has examined a wide range of differentemission reduction measures which covered:
• improved vehicle technology;• improved fuel quality;• better vehicle maintenance and annual inspec-
tion tests;• local initiatives such as road pricing and public
t r a n s p o r t .
The results show that very strict standards forvehicles and severe fuel measures would beneeded to reach emission targets using transportmeasures alone. Clearly, these will be very costlyto implement. Auto Oil suggest that a far more cer-tain and, indeed, necessary path to attaining airquality targets in Europe is to tackle emissions
from stationary sources. The European Commis-sion has suggested a follow-up to the Auto Oil pro-gramme to evaluate the need for further measures,and other EU initiatives are under way which tar-get stationary source emission controls (CON-CAWE, 1996).
The problems of acidification and ground-levelozone formation in Europe will be addressed in astudy evaluating the cost effectiveness of differentcontrol techniques. Least cost solutions for trans-boundary air pollution issues, including meetingcritical loads and levels, must be identified. Thepreparation of a number of directives, includingthe review of the 'Large Combustion Plants' Direc-tive (EC Directive 88/609/EEC), will be influencedby the results of this study; cost-efficiency will thusbe a major aspect in policy formulation (S216,1 9 9 5 ) .
61
Long-range transboundary air pollution in Europe

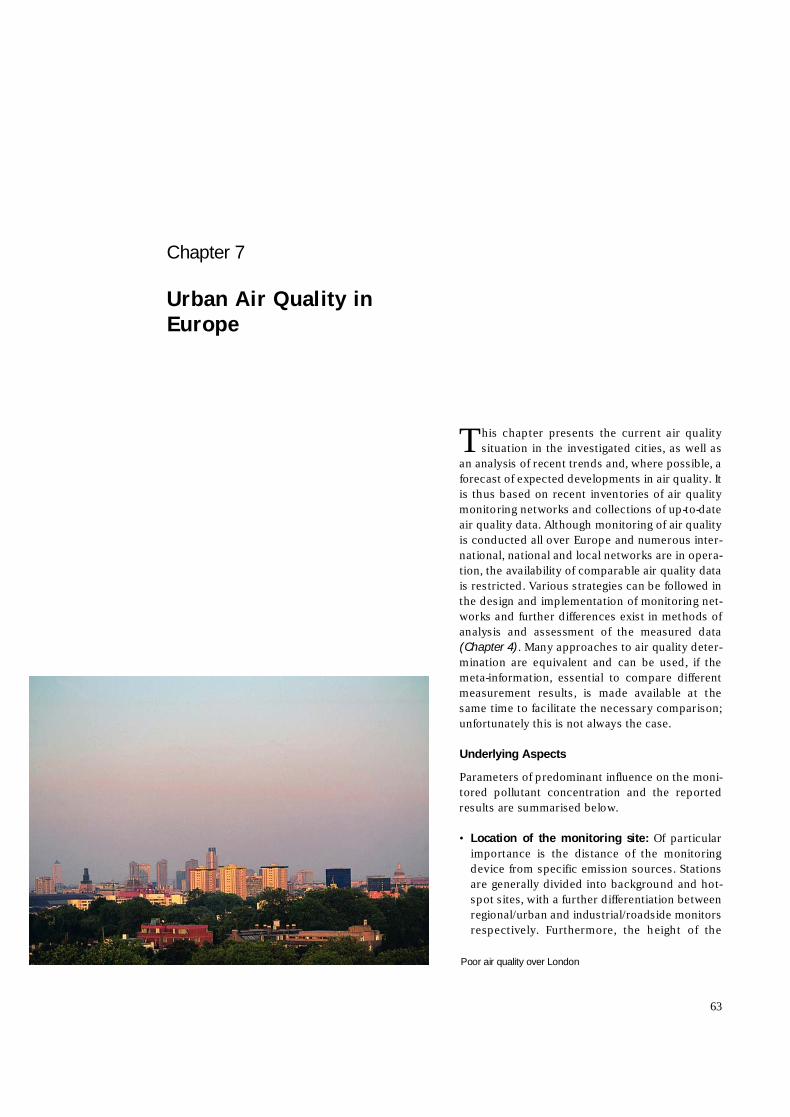
This chapter presents the current air qualitys i t u a t i o n in the investigated cities, as well as
an analysis of recent trends and, where possible, aforecast of expected developments in air quality. Itis thus based on recent inventories of air qualitymonitoring networks and collections of up-to-dateair quality data. Although monitoring of air qualityis conducted all over Europe and numerous inter-national, national and local networks are in opera-tion, the availability of comparable air quality datais restricted. Various strategies can be followed inthe design and implementation of monitoring net-works and further differences exist in methods ofanalysis and assessment of the measured data(Chapter 4). Many approaches to air quality deter-mination are equivalent and can be used, if themeta-information, essential to compare differentmeasurement results, is made available at thesame time to facilitate the necessary comparison;unfortunately this is not always the case.
Underlying Aspects
Parameters of predominant influence on the moni-tored pollutant concentration and the reportedresults are summarised below.
• Location of the monitoring site: Of particularimportance is the distance of the monitoringdevice from specific emission sources. Stationsare generally divided into background and hot-spot sites, with a further differentiation betweenregional/urban and industrial/roadside monitorsrespectively. Furthermore, the height of the
Chapter 7
Urban Air Quality inE u ro p e
6 3
Poor air quality over London
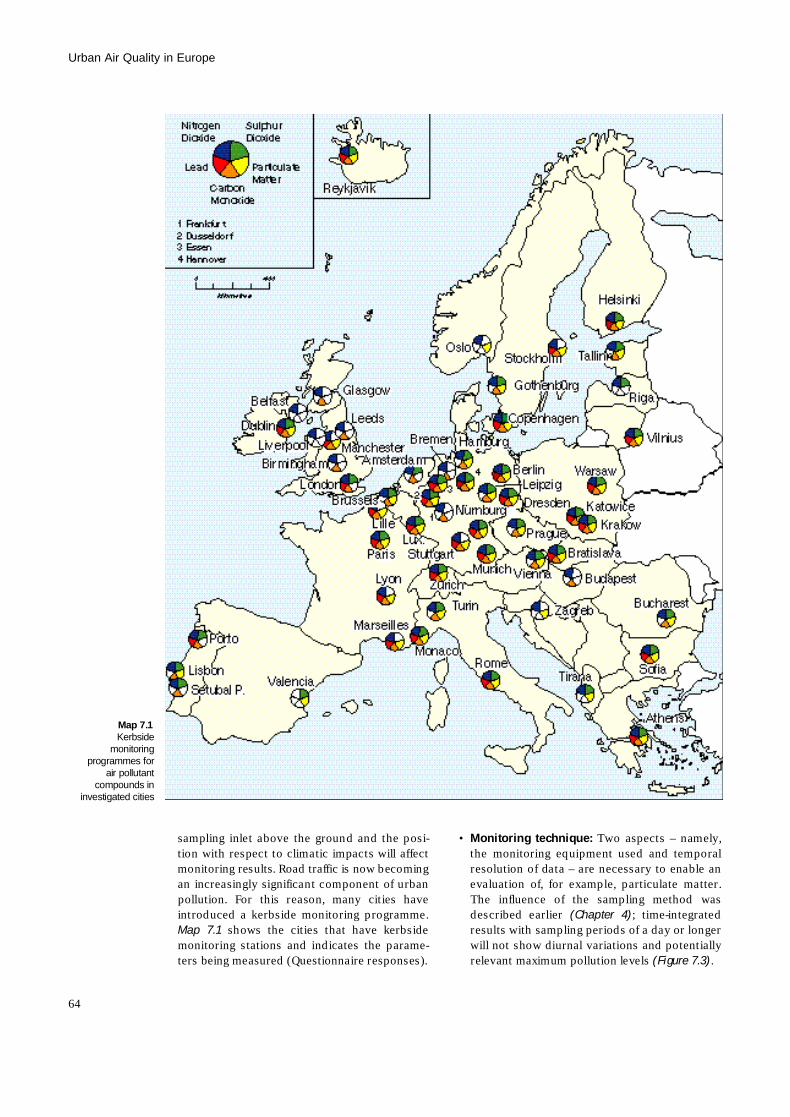
sampling inlet above the ground and the posi-tion with respect to climatic impacts will affectmonitoring results. Road traffic is now becomingan increasingly significant component of urbanpollution. For this reason, many cities haveintroduced a kerbside monitoring programme.M a p 7 . 1 shows the cities that have kerbsidemonitoring stations and indicates the parame-ters being measured (Questionnaire responses).
• Monitoring technique: Two aspects – namely,the monitoring equipment used and temporalresolution of data – are necessary to enable anevaluation of, for example, particulate matter.The influence of the sampling method wasdescribed earlier (Chapter 4); time-integratedresults with sampling periods of a day or longerwill not show diurnal variations and potentiallyrelevant maximum pollution levels (Figure 7.3).
Urban Air Quality in Europe
64
Map 7.1K e r b s i d e
monitoring programmes for
air pollutant compounds in
investigated cities
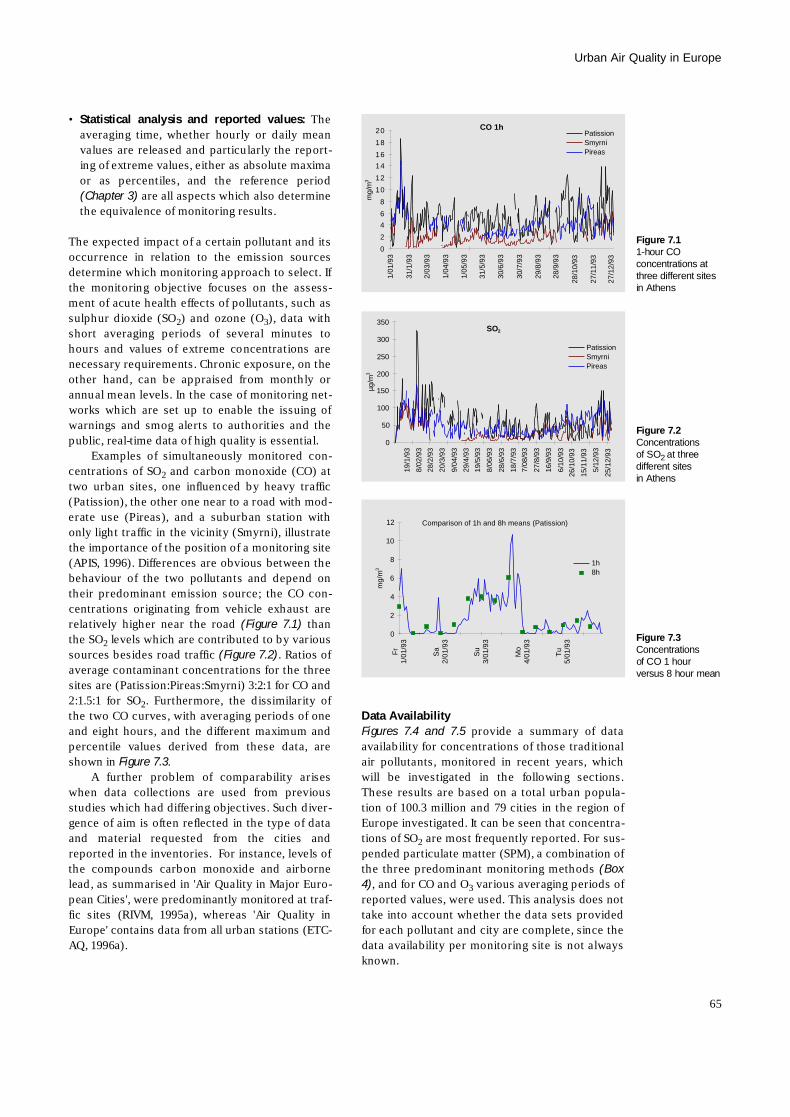
• Statistical analysis and reported values: T h eaveraging time, whether hourly or daily meanvalues are released and particularly the report-ing of extreme values, either as absolute maximaor as percentiles, and the reference period(Chapter 3) are all aspects which also determinethe equivalence of monitoring results.
The expected impact of a certain pollutant and itsoccurrence in relation to the emission sourcesdetermine which monitoring approach to select. Ifthe monitoring objective focuses on the assess-ment of acute health effects of pollutants, such assulphur dioxide (SO2) and ozone (O3), data withshort averaging periods of several minutes tohours and values of extreme concentrations arenecessary requirements. Chronic exposure, on theother hand, can be appraised from monthly orannual mean levels. In the case of monitoring net-works which are set up to enable the issuing ofwarnings and smog alerts to authorities and thepublic, real-time data of high quality is essential.
Examples of simultaneously monitored con-centrations of SO2 and carbon monoxide (CO) attwo urban sites, one influenced by heavy traffic(Patission), the other one near to a road with mod-erate use (Pireas), and a suburban station withonly light traffic in the vicinity (Smyrni), illustratethe importance of the position of a monitoring site(APIS, 1996). Differences are obvious between thebehaviour of the two pollutants and depend ontheir predominant emission source; the CO con-centrations originating from vehicle exhaust arerelatively higher near the road (Figure 7.1) t h a nthe SO2 levels which are contributed to by varioussources besides road traffic (Figure 7.2). Ratios ofaverage contaminant concentrations for the threesites are (Patission:Pireas:Smyrni) 3:2:1 for CO and2:1.5:1 for SO2. Furthermore, the dissimilarity ofthe two CO curves, with averaging periods of oneand eight hours, and the different maximum andpercentile values derived from these data, areshown in F i g u r e 7 . 3.
A further problem of comparability ariseswhen data collections are used from previousstudies which had differing objectives. Such diver-gence of aim is often reflected in the type of dataand material requested from the cities andreported in the inventories. For instance, levels ofthe compounds carbon monoxide and airbornelead, as summarised in 'Air Quality in Major Euro-pean Cities', were predominantly monitored at traf-fic sites (RIVM, 1995a), whereas 'Air Quality inEurope' contains data from all urban stations (ETC-AQ, 1996a).
Data AvailabilityFigures 7.4 and 7.5 provide a summary of dataavailability for concentrations of those traditionalair pollutants, monitored in recent years, whichwill be investigated in the following sections.These results are based on a total urban popula-tion of 100.3 million and 79 cities in the region ofEurope investigated. It can be seen that concentra-tions of SO2 are most frequently reported. For sus-pended particulate matter (SPM), a combination ofthe three predominant monitoring methods ( B o x4 ), and for CO and O3 various averaging periods ofreported values, were used. This analysis does nottake into account whether the data sets providedfor each pollutant and city are complete, since thedata availability per monitoring site is not alwaysk n o w n .
65
Urban Air Quality in Europe
CO 1h
0
2
4
6
8
10
12
14
16
18
20
1/0
1/9
3
31/1
/93
2/0
3/9
3
1/0
4/9
3
1/0
5/9
3
31/5
/93
30/6
/93
30/7
/93
29/8
/93
28/9
/93
28/1
0/9
3
27/1
1/9
3
27/1
2/9
3
mg/m
3
PatissionSmyrniPireas
Figure 7.11-hour COconcentrations atthree different sitesin Athens
SO2
0
50
100
150
200
250
300
350
19
/1/9
3
8/0
2/9
3
28
/2/9
3
20
/3/9
3
9/0
4/9
3
29
/4/9
3
19
/5/9
3
8/0
6/9
3
28
/6/9
3
18
/7/9
3
7/0
8/9
3
27
/8/9
3
16
/9/9
3
6/1
0/9
3
26
/10
/93
15
/11
/93
5/1
2/9
3
25
/12
/93
µg/m
3
PatissionSmyrniPireas
Figure 7.2C o n c e n t r a t i o n sof SO2 at threedifferent sitesin Athens
Comparison of 1h and 8h means (Patission)
0
2
4
6
8
10
12
Fr
1/0
1/9
3
Sa
2
/01
/93
Su
3
/01
/93
Mo
4
/01
/93
Tu
5
/01
/93
mg
/m3
1h8h
Figure 7.3C o n c e n t r a t i o n sof CO 1 hourversus 8 hour mean
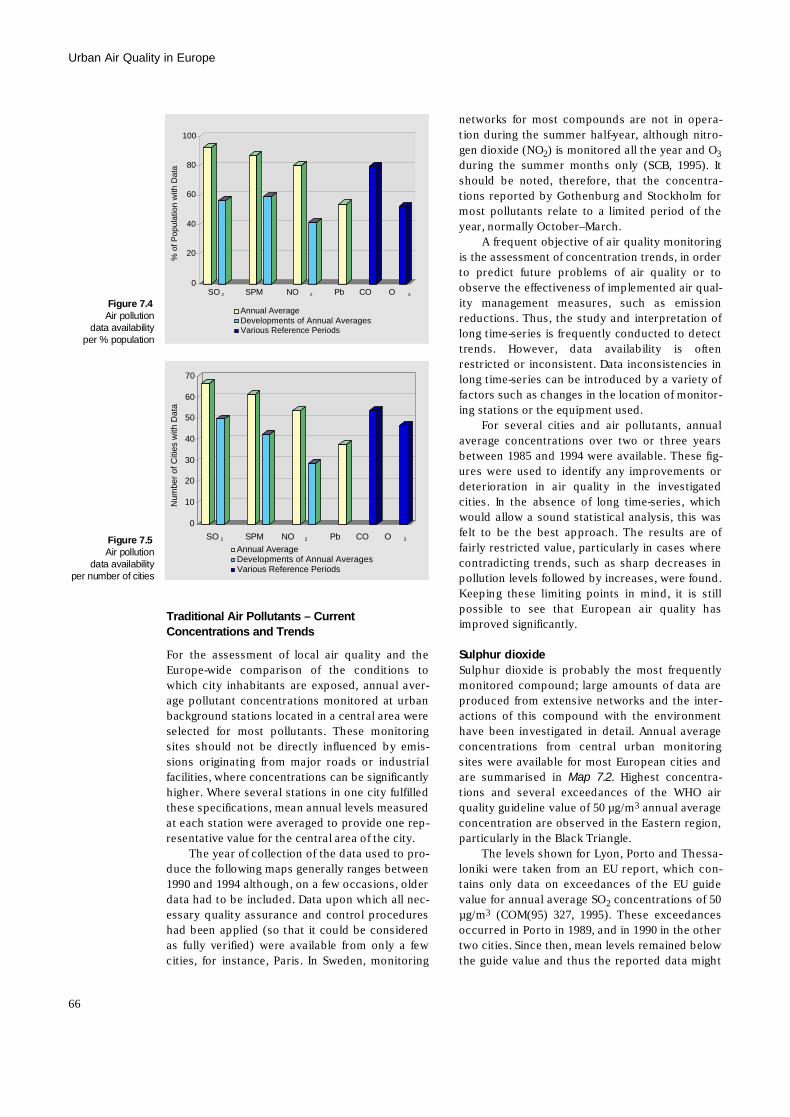
Traditional Air Pollutants – Current Concentrations and Trends
For the assessment of local air quality and theEurope-wide comparison of the conditions towhich city inhabitants are exposed, annual aver-age pollutant concentrations monitored at urbanbackground stations located in a central area wereselected for most pollutants. These monitoringsites should not be directly influenced by emis-sions originating from major roads or industrialfacilities, where concentrations can be significantlyhigher. Where several stations in one city fulfilledthese specifications, mean annual levels measuredat each station were averaged to provide one rep-resentative value for the central area of the city.
The year of collection of the data used to pro-duce the following maps generally ranges between1990 and 1994 although, on a few occasions, olderdata had to be included. Data upon which all nec-essary quality assurance and control procedureshad been applied (so that it could be consideredas fully verified) were available from only a fewcities, for instance, Paris. In Sweden, monitoring
n e tworks for most compounds are not in opera-tion during the summer half-year, although nitro-gen dioxide (NO2) is monitored all the year and O3
during the summer months only (SCB, 1995). Itshould be noted, therefore, that the concentra-tions reported by Gothenburg and Stockholm formost pollutants relate to a limited period of theyear, normally October–March.
A frequent objective of air quality monitoringis the assessment of concentration trends, in orderto predict future problems of air quality or toobserve the effectiveness of implemented air qual-ity management measures, such as emissionreductions. Thus, the study and interpretation oflong time-series is frequently conducted to detecttrends. However, data availability is oftenrestricted or inconsistent. Data inconsistencies inlong time-series can be introduced by a variety offactors such as changes in the location of monitor-ing stations or the equipment used.
For several cities and air pollutants, annualaverage concentrations over two or three yearsbetween 1985 and 1994 were available. These fig-ures were used to identify any improvements ordeterioration in air quality in the investigatedcities. In the absence of long time-series, whichwould allow a sound statistical analysis, this wasfelt to be the best approach. The results are offairly restricted value, particularly in cases wherecontradicting trends, such as sharp decreases inpollution levels followed by increases, were found.Keeping these limiting points in mind, it is stillp o s s i b l e to see that European air quality hasimproved significantly.
Sulphur dioxideSulphur dioxide is probably the most frequentlymonitored compound; large amounts of data areproduced from extensive networks and the inter-actions of this compound with the environmenthave been investigated in detail. Annual averageconcentrations from central urban monitoringsites were available for most European cities andare summarised in Map 7.2. Highest concentra-tions and several exceedances of the WHO airquality guideline value of 50 µg/m3 annual averageconcentration are observed in the Eastern region,particularly in the Black Triangle.
The levels shown for Lyon, Porto and Thessa-loniki were taken from an EU report, which con-tains only data on exceedances of the EU guidevalue for annual average SO2 concentrations of 50µ g / m3 (COM(95) 327, 1995). These exceedancesoccurred in Porto in 1989, and in 1990 in the othertwo cities. Since then, mean levels remained belowthe guide value and thus the reported data might
Urban Air Quality in Europe
66
0
10
20
30
40
50
60
70
Num
ber
of C
ities
with
Dat
a
SO 2 SPM NO 2 Pb CO O 3
Annual AverageDevelopments of Annual AveragesVarious Reference Periods
Figure 7.5Air pollution
data availabilityper number of cities
0
20
40
60
80
100
% o
f Pop
ulat
ion
with
Dat
a
SO 2 SPM NO 2 Pb CO O 3
Annual AverageDevelopments of Annual AveragesVarious Reference Periods
Figure 7.4Air pollution
data availabilityper % population
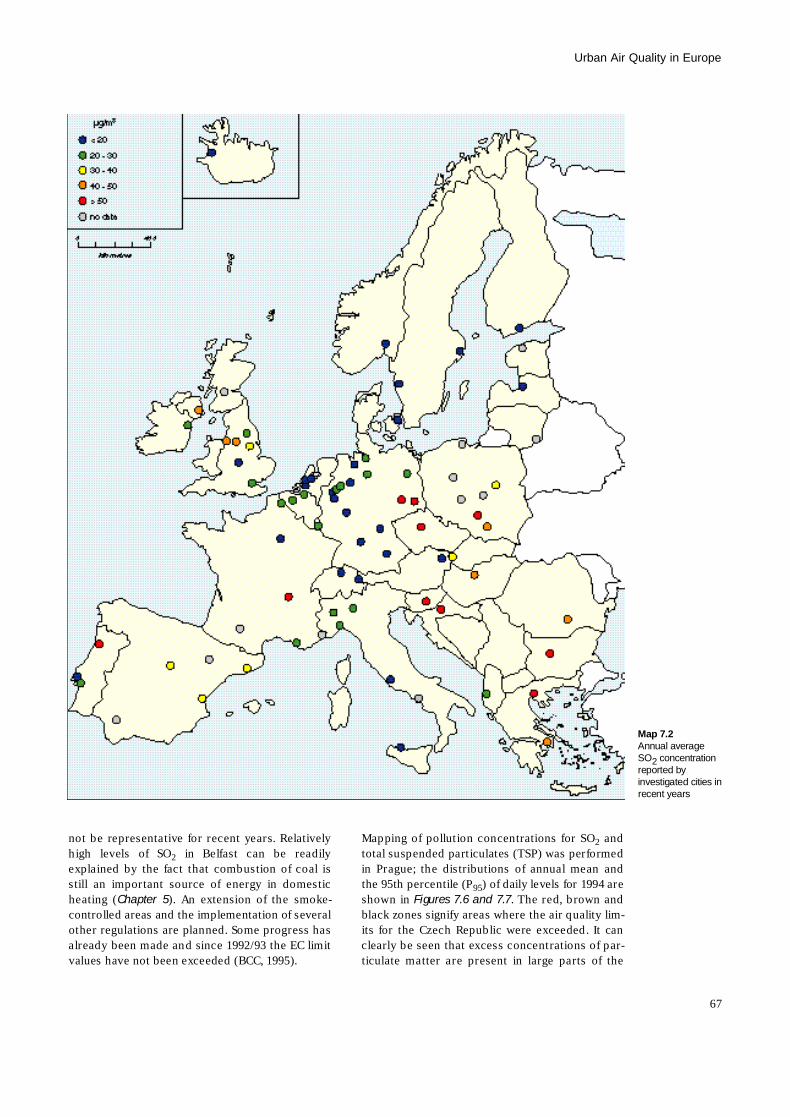
not be representative for recent years. Relativelyhigh levels of SO2 in Belfast can be readilyexplained by the fact that combustion of coal isstill an important source of energy in domesticheating (Chapter 5). An extension of the smoke-controlled areas and the implementation of severalother regulations are planned. Some progress hasalready been made and since 1992/93 the EC limitvalues have not been exceeded (BCC, 1995).
Mapping of pollution concentrations for SO2 a n dtotal suspended particulates (TSP) was performedin Prague; the distributions of annual mean andthe 95th percentile (P9 5) of daily levels for 1994 areshown in Figures 7.6 and 7.7. The red, brown andblack zones signify areas where the air quality lim-its for the Czech Republic were exceeded. It canclearly be seen that excess concentrations of par-ticulate matter are present in large parts of the
67
Urban Air Quality in Europe
Map 7.2Annual averageS O2 c o n c e n t r a t i o nreported by investigated cities inrecent years
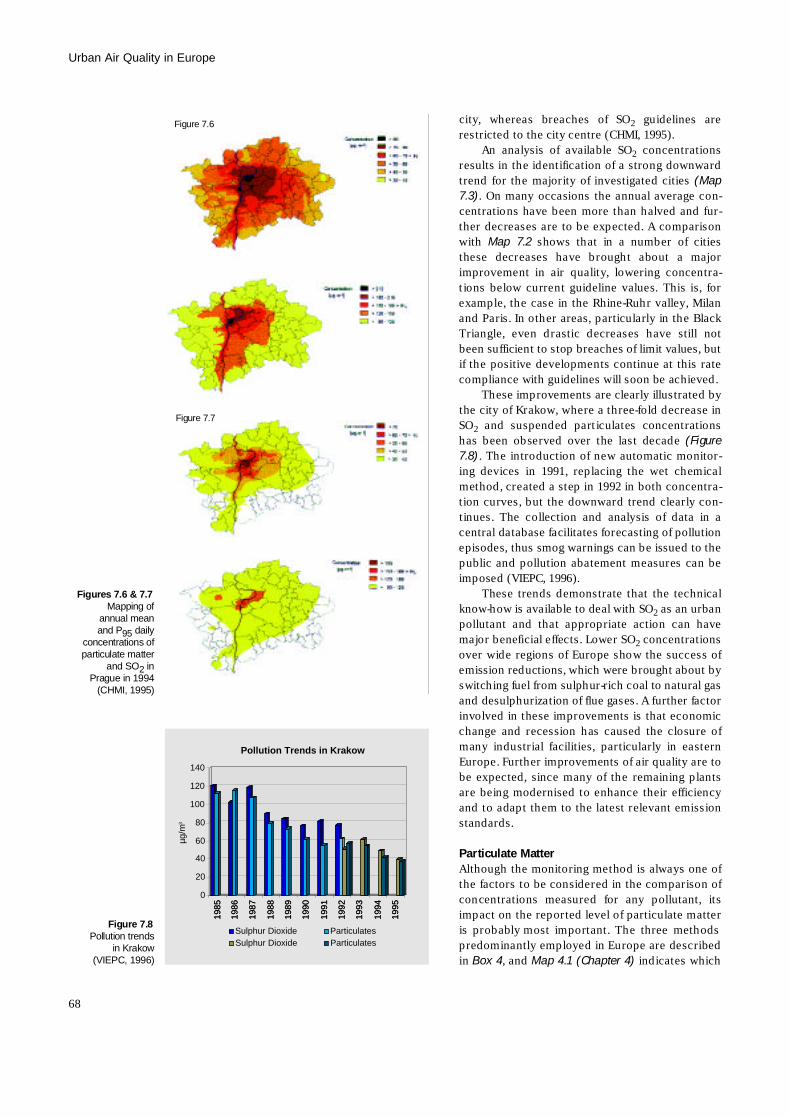
city, whereas breaches of SO2 guidelines arerestricted to the city centre (CHMI, 1995).
An analysis of available SO2 c o n c e n t r a t i o n sresults in the identification of a strong downwardtrend for the majority of investigated cities ( M a p7 . 3 ). On many occasions the annual average con-centrations have been more than halved and fur-ther decreases are to be expected. A comparisonwith Map 7.2 shows that in a number of citiesthese decreases have brought about a majorimprovement in air quality, lowering concentra-tions below current guideline values. This is, forexample, the case in the Rhine-Ruhr valley, Milanand Paris. In other areas, particularly in the BlackTriangle, even drastic decreases have still notbeen sufficient to stop breaches of limit values, butif the positive developments continue at this ratecompliance with guidelines will soon be achieved.
These improvements are clearly illustrated bythe city of Krakow, where a three-fold decrease inS O2 and suspended particulates concentrationshas been observed over the last decade ( F i g u r e7 . 8 ). The introduction of new automatic monitor-ing devices in 1991, replacing the wet chemicalmethod, created a step in 1992 in both concentra-tion curves, but the downward trend clearly con-tinues. The collection and analysis of data in acentral database facilitates forecasting of pollutionepisodes, thus smog warnings can be issued to thepublic and pollution abatement measures can beimposed (VIEPC, 1996).
These trends demonstrate that the technicalknow-how is available to deal with SO2 as an urbanpollutant and that appropriate action can havemajor beneficial effects. Lower SO2 c o n c e n t r a t i o n sover wide regions of Europe show the success ofemission reductions, which were brought about byswitching fuel from sulphur-rich coal to natural gasand desulphurization of flue gases. A further factorinvolved in these improvements is that economicchange and recession has caused the closure ofmany industrial facilities, particularly in easternEurope. Further improvements of air quality are tobe expected, since many of the remaining plantsare being modernised to enhance their efficiencyand to adapt them to the latest relevant emissions t a n d a r d s .
Particulate MatterAlthough the monitoring method is always one ofthe factors to be considered in the comparison ofconcentrations measured for any pollutant, itsimpact on the reported level of particulate matteris probably most important. The three methodspredominantly employed in Europe are describedin Box 4, and Map 4.1 (Chapter 4) indicates which
Urban Air Quality in Europe
68
Figure 7.6
Figure 7.7
Figures 7.6 & 7.7Mapping of
annual meanand P9 5 d a i l y
concentrations ofparticulate matter
and SO2 i nPrague in 1994
(CHMI, 1995)
1985
1986
1987
1988
1989
1990
1991
1992
1993
1994
1995
0
20
40
60
80
100
120
140
µg/m
3
1985
1986
1987
1988
1989
1990
1991
1992
1993
1994
1995
Pollution Trends in Krakow
Sulphur Dioxide ParticulatesSulphur Dioxide Particulates
Figure 7.8Pollution trends
in Krakow(VIEPC, 1996)
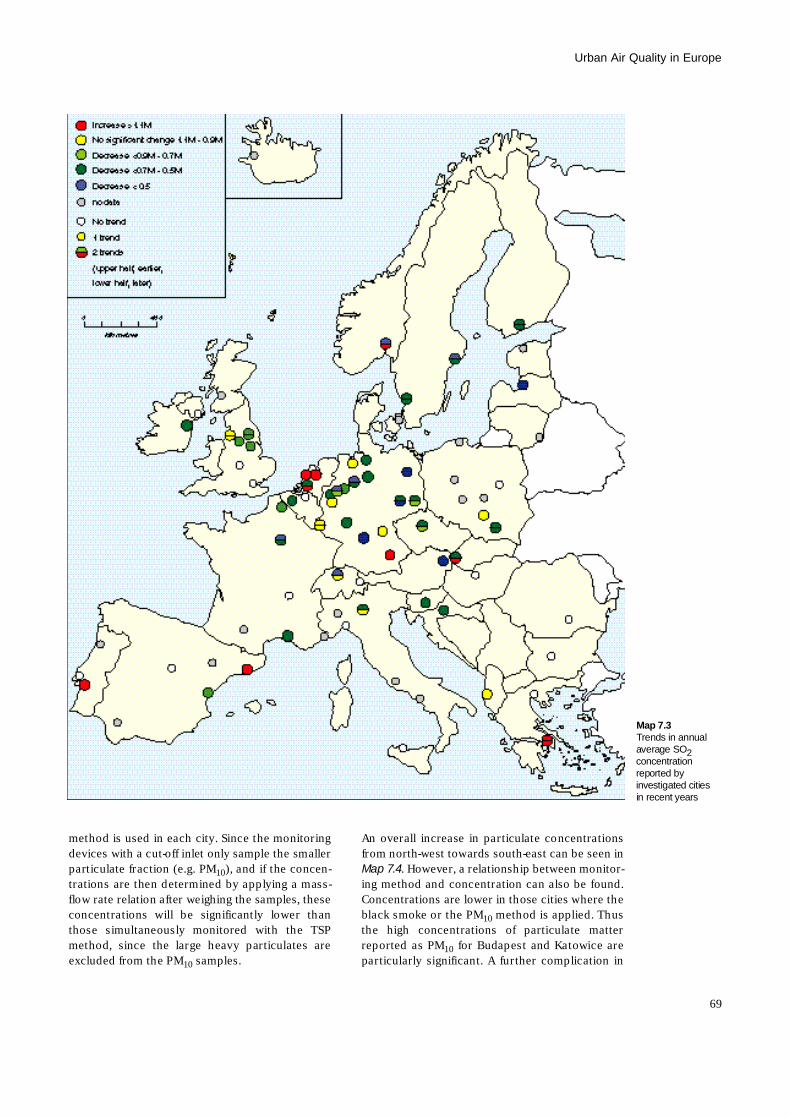
method is used in each city. Since the monitoringdevices with a cut-off inlet only sample the smallerparticulate fraction (e.g. PM1 0), and if the concen-trations are then determined by applying a mass-flow rate relation after weighing the samples, theseconcentrations will be significantly lower thanthose simultaneously monitored with the TSPmethod, since the large heavy particulates areexcluded from the PM1 0 s a m p l e s .
An overall increase in particulate concentrationsfrom north-west towards south-east can be seen inMap 7.4. However, a relationship between monitor-ing method and concentration can also be found.Concentrations are lower in those cities where theblack smoke or the PM1 0 method is applied. Thusthe high concentrations of particulate matterreported as PM1 0 for Budapest and Katowice areparticularly significant. A further complication in
69
Urban Air Quality in Europe
Map 7.3Trends in annualaverage SO2c o n c e n t r a t i o nreported by investigated citiesin recent years
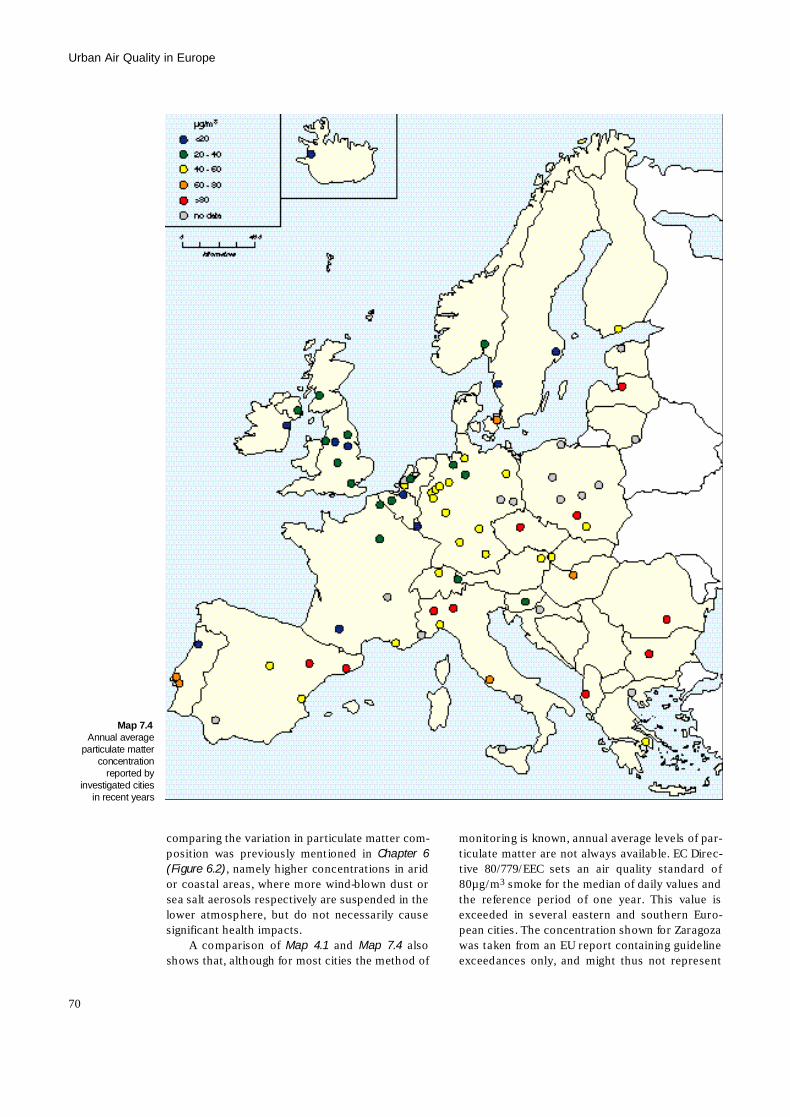
comparing the variation in particulate matter com-position was previously mentioned in Chapter 6(Figure 6.2), namely higher concentrations in aridor coastal areas, where more wind-blown dust orsea salt aerosols respectively are suspended in thelower atmosphere, but do not necessarily causesignificant health impacts.
A comparison of Map 4.1 and Map 7.4 a l s oshows that, although for most cities the method of
monitoring is known, annual average levels of par-ticulate matter are not always available. EC Direc-tive 80/779/EEC sets an air quality standard of8 0µ g / m3 smoke for the median of daily values andthe reference period of one year. This value isexceeded in several eastern and southern Euro-pean cities. The concentration shown for Zaragozawas taken from an EU report containing guidelineexceedances only, and might thus not represent
Urban Air Quality in Europe
70
Map 7.4Annual average
particulate matterconcentration
reported by investigated cities
in recent years
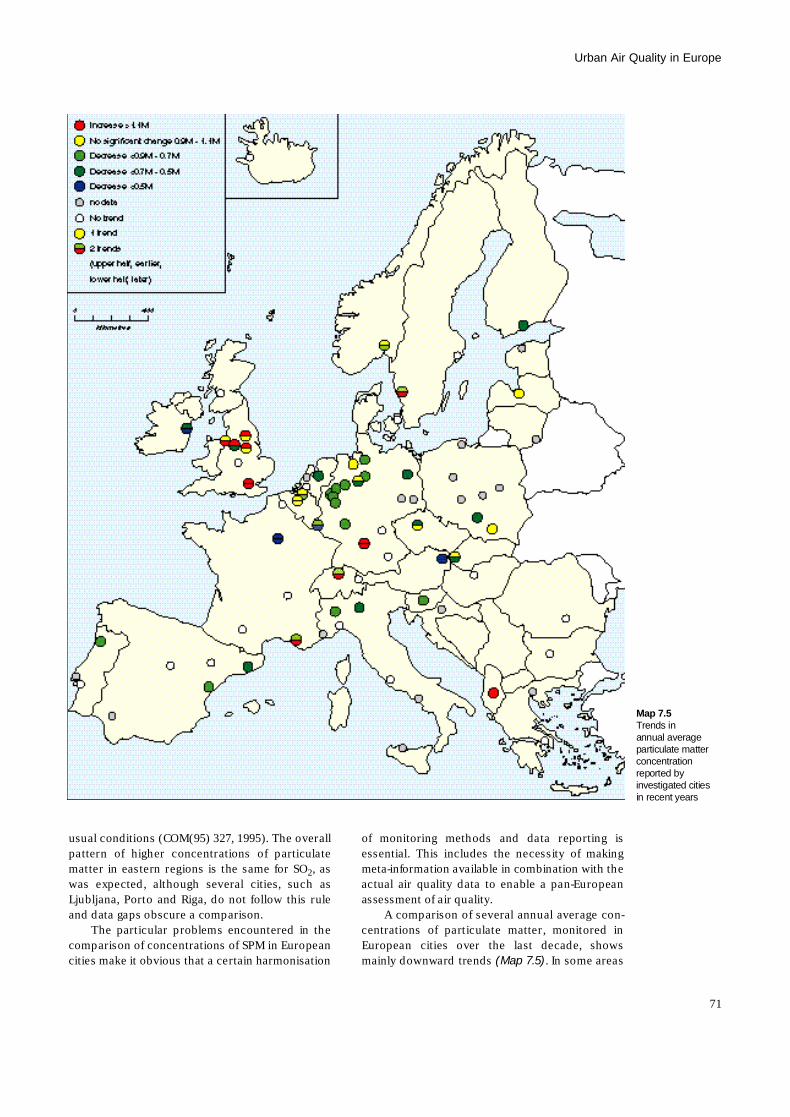
usual conditions (COM(95) 327, 1995). The overallpattern of higher concentrations of particulatematter in eastern regions is the same for SO2, aswas expected, although several cities, such asLjubljana, Porto and Riga, do not follow this ruleand data gaps obscure a comparison.
The particular problems encountered in thecomparison of concentrations of SPM in Europeancities make it obvious that a certain harmonisation
of monitoring methods and data reporting isessential. This includes the necessity of makingmeta-information available in combination with theactual air quality data to enable a pan-Europeanassessment of air quality.
A comparison of several annual average con-centrations of particulate matter, monitored inEuropean cities over the last decade, showsmainly downward trends (Map 7.5). In some areas
71
Urban Air Quality in Europe
Map 7.5Trends inannual averageparticulate matterc o n c e n t r a t i o nreported by investigated citiesin recent years
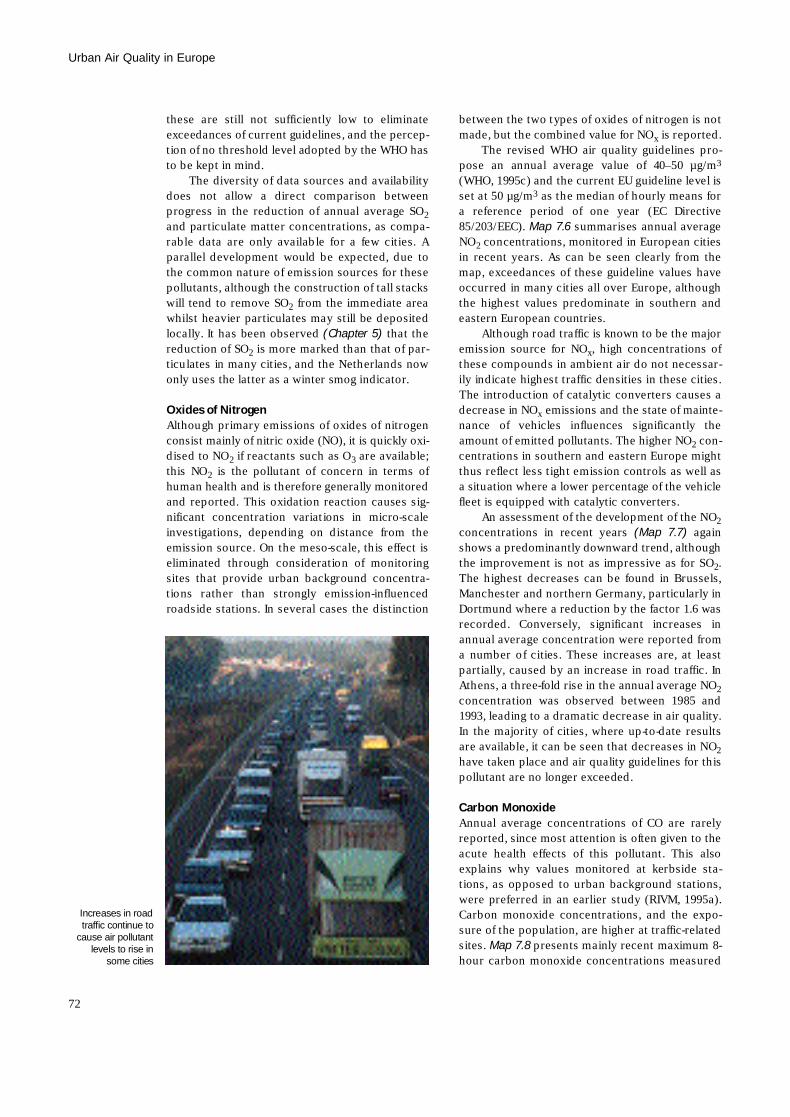
these are still not sufficiently low to eliminateexceedances of current guidelines, and the percep-tion of no threshold level adopted by the WHO hasto be kept in mind.
The diversity of data sources and availabilitydoes not allow a direct comparison betweenprogress in the reduction of annual average SO2
and particulate matter concentrations, as compa-rable data are only available for a few cities. Aparallel development would be expected, due tothe common nature of emission sources for thesepollutants, although the construction of tall stackswill tend to remove SO2 from the immediate areawhilst heavier particulates may still be depositedlocally. It has been observed (Chapter 5) that thereduction of SO2 is more marked than that of par-ticulates in many cities, and the Netherlands nowonly uses the latter as a winter smog indicator.
Oxides of NitrogenAlthough primary emissions of oxides of nitrogenconsist mainly of nitric oxide (NO), it is quickly oxi-dised to NO2 if reactants such as O3 are available;this NO2 is the pollutant of concern in terms ofhuman health and is therefore generally monitoredand reported. This oxidation reaction causes sig-nificant concentration variations in micro-scaleinvestigations, depending on distance from theemission source. On the meso-scale, this effect iseliminated through consideration of monitoringsites that provide urban background concentra-tions rather than strongly emission-influencedroadside stations. In several cases the distinction
between the two types of oxides of nitrogen is notmade, but the combined value for NOx is reported.
The revised WHO air quality guidelines pro-pose an annual average value of 40–50 µg/m3
(WHO, 1995c) and the current EU guideline level isset at 50 µg/m3 as the median of hourly means fora reference period of one year (EC Directive85/203/EEC). Map 7.6 summarises annual averageN O2 concentrations, monitored in European citiesin recent years. As can be seen clearly from themap, exceedances of these guideline values haveoccurred in many cities all over Europe, althoughthe highest values predominate in southern andeastern European countries.
Although road traffic is known to be the majoremission source for NOx, high concentrations ofthese compounds in ambient air do not necessar-ily indicate highest traffic densities in these cities.The introduction of catalytic converters causes adecrease in NOx emissions and the state of mainte-nance of vehicles influences significantly theamount of emitted pollutants. The higher NO2 c o n-centrations in southern and eastern Europe mightthus reflect less tight emission controls as well asa situation where a lower percentage of the vehiclefleet is equipped with catalytic converters.
An assessment of the development of the NO2
concentrations in recent years (Map 7.7) a g a i nshows a predominantly downward trend, althoughthe improvement is not as impressive as for SO2.The highest decreases can be found in Brussels,Manchester and northern Germany, particularly inDortmund where a reduction by the factor 1.6 wasrecorded. Conversely, significant increases inannual average concentration were reported froma number of cities. These increases are, at leastpartially, caused by an increase in road traffic. InAthens, a three-fold rise in the annual average NO2
concentration was observed between 1985 and1993, leading to a dramatic decrease in air quality.In the majority of cities, where up-to-date resultsare available, it can be seen that decreases in NO2
have taken place and air quality guidelines for thispollutant are no longer exceeded.
Carbon MonoxideAnnual average concentrations of CO are rarelyreported, since most attention is often given to theacute health effects of this pollutant. This alsoexplains why values monitored at kerbside sta-tions, as opposed to urban background stations,were preferred in an earlier study (RIVM, 1995a).Carbon monoxide concentrations, and the expo-sure of the population, are higher at traffic-relatedsites. Map 7.8 presents mainly recent maximum 8-hour carbon monoxide concentrations measured
Urban Air Quality in Europe
72
Increases in roadtraffic continue to
cause air pollutantlevels to rise in
some cities
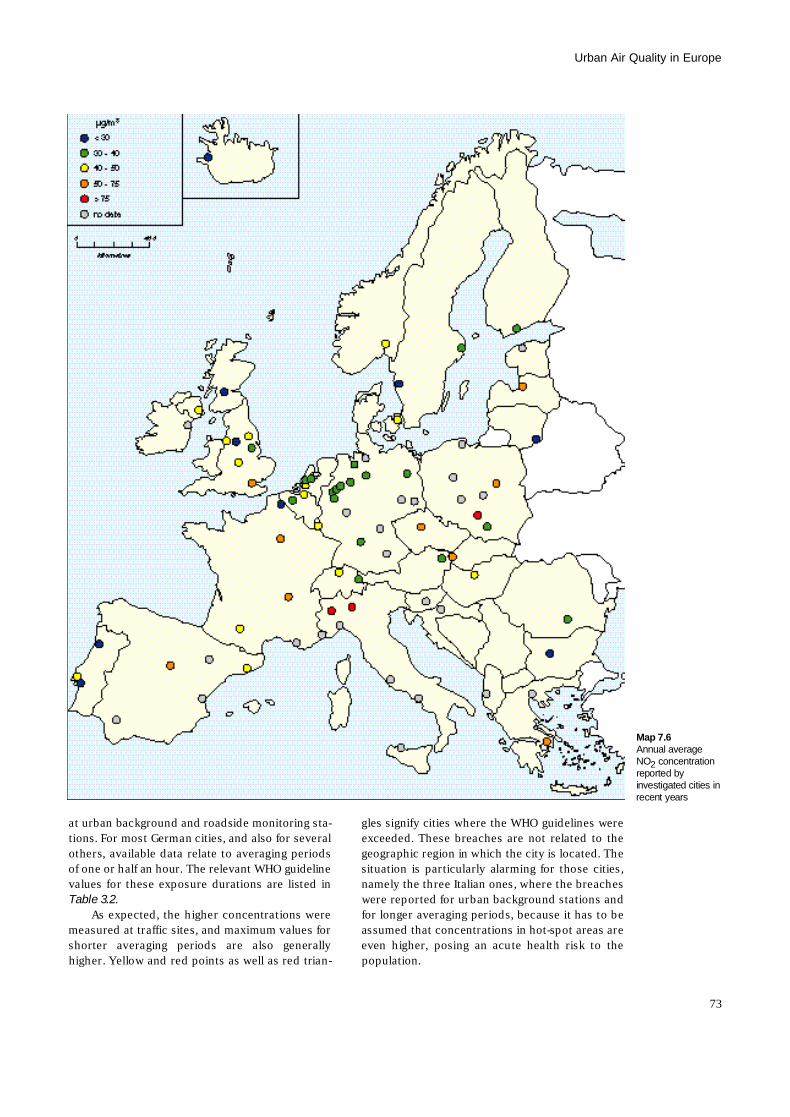
at urban background and roadside monitoring sta-tions. For most German cities, and also for severalothers, available data relate to averaging periodsof one or half an hour. The relevant WHO guidelinevalues for these exposure durations are listed inTable 3.2.
As expected, the higher concentrations weremeasured at traffic sites, and maximum values forshorter averaging periods are also generallyhigher. Yellow and red points as well as red trian-
gles signify cities where the WHO guidelines wereexceeded. These breaches are not related to thegeographic region in which the city is located. Thesituation is particularly alarming for those cities,namely the three Italian ones, where the breacheswere reported for urban background stations andfor longer averaging periods, because it has to beassumed that concentrations in hot-spot areas areeven higher, posing an acute health risk to thep o p u l a t i o n .
73
Urban Air Quality in Europe
Map 7.6Annual averageN O2 c o n c e n t r a t i o nreported by investigated cities inrecent years
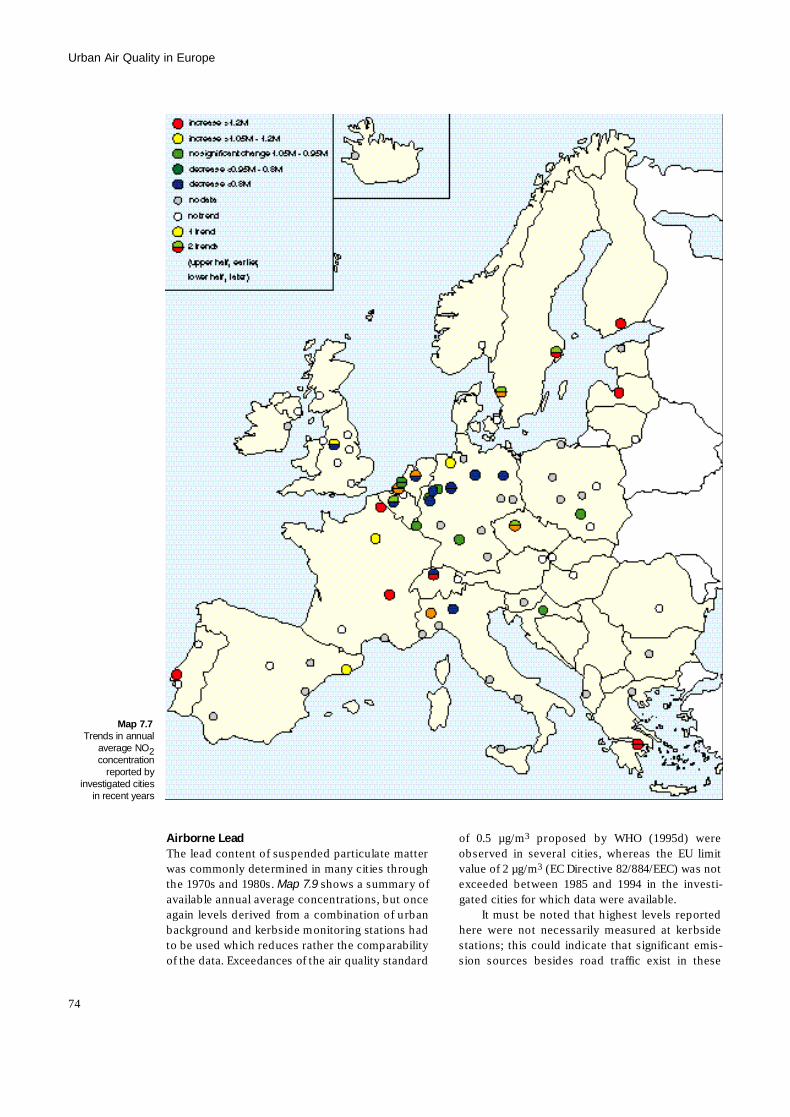
Airborne LeadThe lead content of suspended particulate matterwas commonly determined in many cities throughthe 1970s and 1980s. Map 7.9 shows a summary ofavailable annual average concentrations, but onceagain levels derived from a combination of urbanbackground and kerbside monitoring stations hadto be used which reduces rather the comparabilityof the data. Exceedances of the air quality standard
of 0.5 µg/m3 proposed by WHO (1995d) wereobserved in several cities, whereas the EU limitvalue of 2 µg/m3 (EC Directive 82/884/EEC) was notexceeded between 1985 and 1994 in the investi-gated cities for which data were available.
It must be noted that highest levels reportedhere were not necessarily measured at kerbsidestations; this could indicate that significant emis-sion sources besides road traffic exist in these
Urban Air Quality in Europe
74
Map 7.7Trends in annual
average NO2c o n c e n t r a t i o n
reported by investigated cities
in recent years
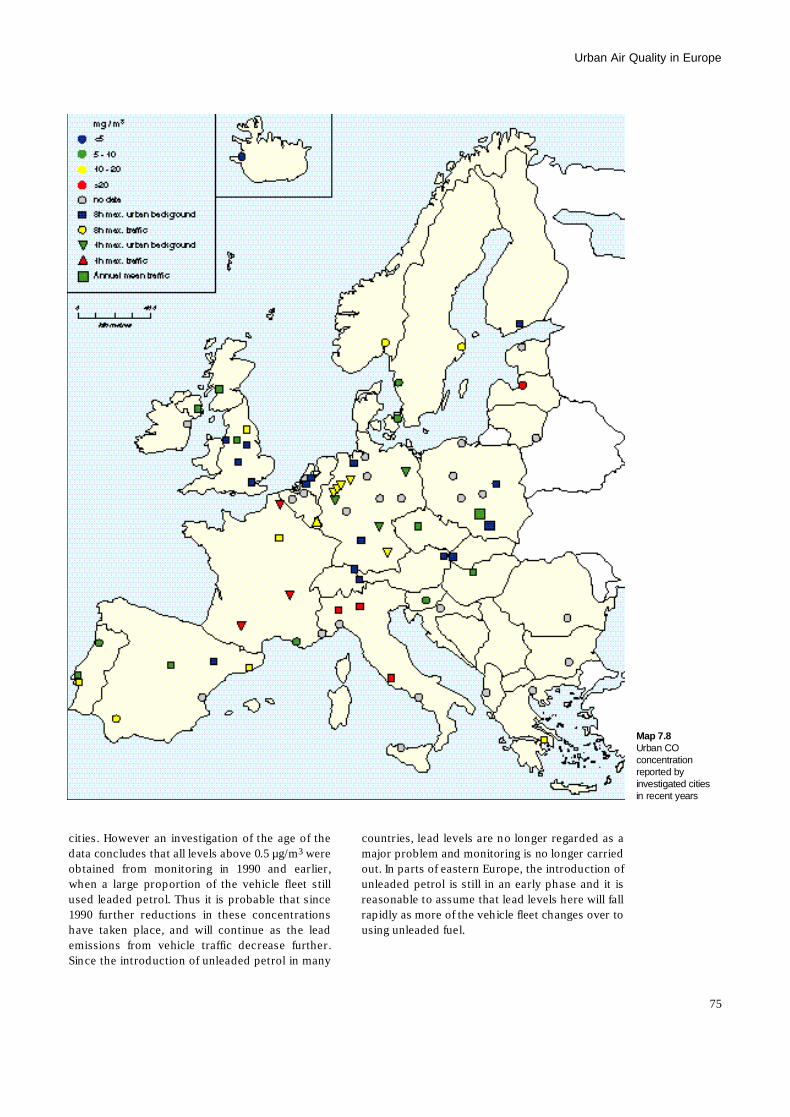
cities. However an investigation of the age of thedata concludes that all levels above 0.5 µg/m3 w e r eobtained from monitoring in 1990 and earlier,when a large proportion of the vehicle fleet stillused leaded petrol. Thus it is probable that since1990 further reductions in these concentrationshave taken place, and will continue as the leademissions from vehicle traffic decrease further.Since the introduction of unleaded petrol in many
countries, lead levels are no longer regarded as amajor problem and monitoring is no longer carriedout. In parts of eastern Europe, the introduction ofunleaded petrol is still in an early phase and it isreasonable to assume that lead levels here will fallrapidly as more of the vehicle fleet changes over tousing unleaded fuel.
75
Urban Air Quality in Europe
Map 7.8Urban COc o n c e n t r a t i o nreported by investigated citiesin recent years
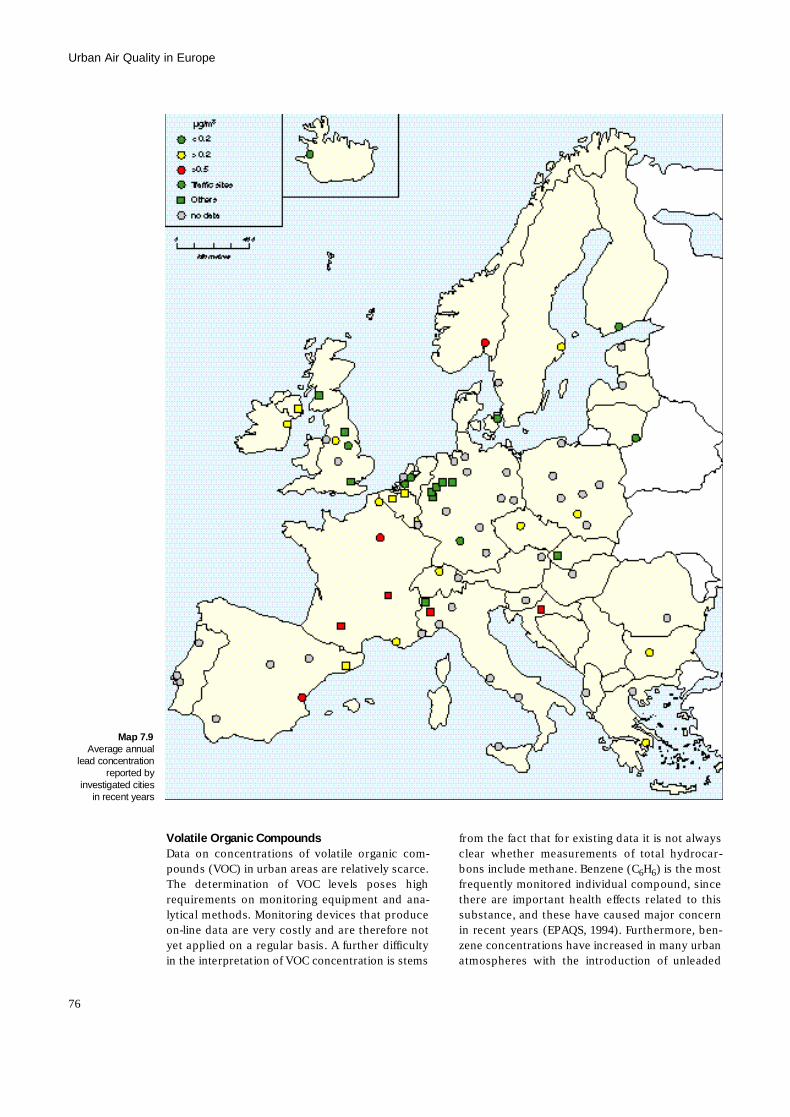
Volatile Organic CompoundsData on concentrations of volatile organic com-pounds (VOC) in urban areas are relatively scarce.The determination of VOC levels poses highrequirements on monitoring equipment and ana-lytical methods. Monitoring devices that produceon-line data are very costly and are therefore notyet applied on a regular basis. A further difficultyin the interpretation of VOC concentration is stems
from the fact that for existing data it is not alwaysclear whether measurements of total hydrocar-bons include methane. Benzene (C6H6) is the mostfrequently monitored individual compound, sincethere are important health effects related to thissubstance, and these have caused major concernin recent years (EPAQS, 1994). Furthermore, ben-zene concentrations have increased in many urbanatmospheres with the introduction of unleaded
Urban Air Quality in Europe
76
Map 7.9Average annual
lead concentrationreported by
investigated citiesin recent years
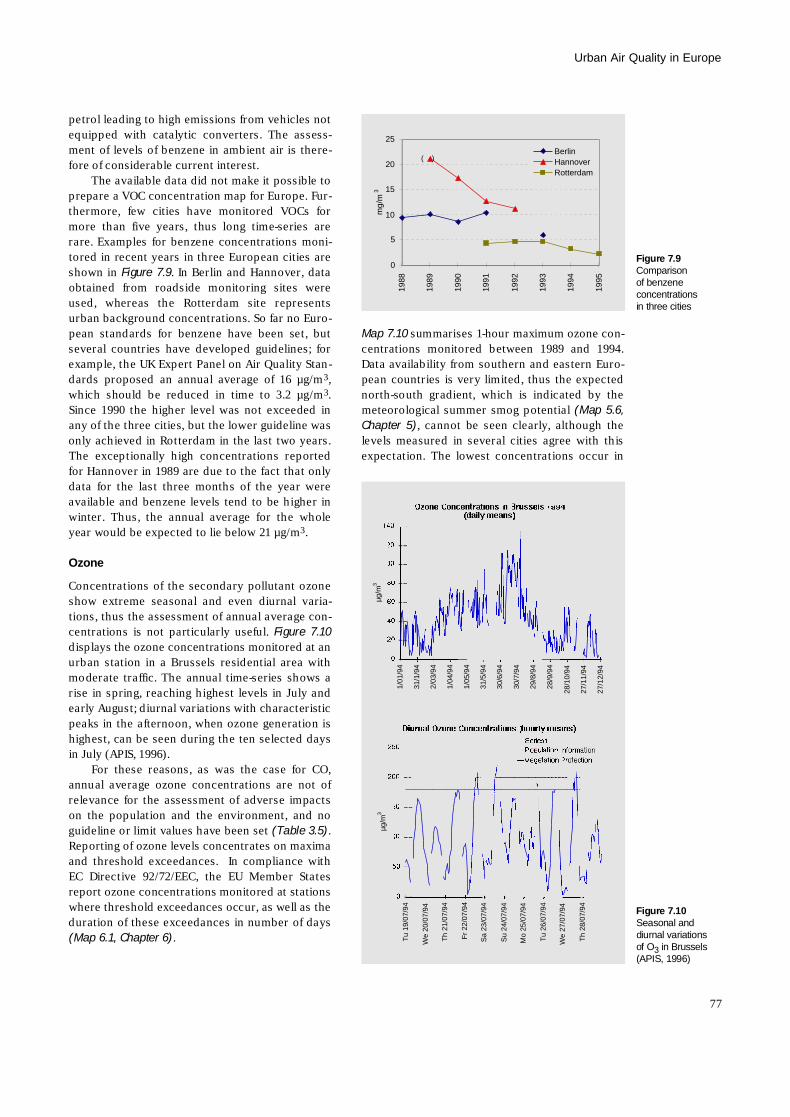
petrol leading to high emissions from vehicles notequipped with catalytic converters. The assess-ment of levels of benzene in ambient air is there-fore of considerable current interest.
The available data did not make it possible toprepare a VOC concentration map for Europe. Fur-thermore, few cities have monitored VOCs formore than five years, thus long time-series arerare. Examples for benzene concentrations moni-tored in recent years in three European cities areshown in Figure 7.9. In Berlin and Hannover, dataobtained from roadside monitoring sites wereused, whereas the Rotterdam site representsurban background concentrations. So far no Euro-pean standards for benzene have been set, butseveral countries have developed guidelines; forexample, the UK Expert Panel on Air Quality Stan-dards proposed an annual average of 16 µg/m3,which should be reduced in time to 3.2 µg/m3.Since 1990 the higher level was not exceeded inany of the three cities, but the lower guideline wasonly achieved in Rotterdam in the last two years.The exceptionally high concentrations reportedfor Hannover in 1989 are due to the fact that onlydata for the last three months of the year wereavailable and benzene levels tend to be higher inwinter. Thus, the annual average for the wholeyear would be expected to lie below 21 µg/m3.
O z o n e
Concentrations of the secondary pollutant ozoneshow extreme seasonal and even diurnal varia-tions, thus the assessment of annual average con-centrations is not particularly useful. Figure 7.10displays the ozone concentrations monitored at anurban station in a Brussels residential area withmoderate traffic. The annual time-series shows arise in spring, reaching highest levels in July andearly August; diurnal variations with characteristicpeaks in the afternoon, when ozone generation ishighest, can be seen during the ten selected daysin July (APIS, 1996).
For these reasons, as was the case for CO,annual average ozone concentrations are not ofrelevance for the assessment of adverse impactson the population and the environment, and noguideline or limit values have been set (Table 3.5).Reporting of ozone levels concentrates on maximaand threshold exceedances. In compliance withEC Directive 92/72/EEC, the EU Member Statesreport ozone concentrations monitored at stationswhere threshold exceedances occur, as well as theduration of these exceedances in number of days(Map 6.1, Chapter 6).
Map 7.10 summarises 1-hour maximum ozone con-centrations monitored between 1989 and 1994.Data availability from southern and eastern Euro-pean countries is very limited, thus the expectednorth-south gradient, which is indicated by themeteorological summer smog potential (Map 5.6,Chapter 5), cannot be seen clearly, although thelevels measured in several cities agree with thisexpectation. The lowest concentrations occur in
77
Urban Air Quality in Europe
Figure 7.10Seasonal anddiurnal variationsof O3 in Brussels(APIS, 1996)
1/0
1/94
31/1
/94
2/0
3/94
1/0
4/94
1/0
5/94
31/5
/94
30/6
/94
30/7
/94
29/8
/94
28/9
/94
28/1
0/94
27/1
1/94
27/1
2/94
µg/m
3
Tu
19/0
7/94
We
20/0
7/94
Th
21/0
7/94
Fr
22/0
7/94
Sa
23/0
7/94
Su
24/0
7/94
Mo
25/0
7/94
Tu
26/0
7/94
We
27/0
7/94
Th
28/0
7/94
µg/m
3
( )
0
5
10
15
20
25
1988
1989
1990
1991
1992
1993
1994
1995
mg/
m3
BerlinHannoverRotterdam
Figure 7.9C o m p a r i s o nof benzenec o n c e n t r a t i o n sin three cities
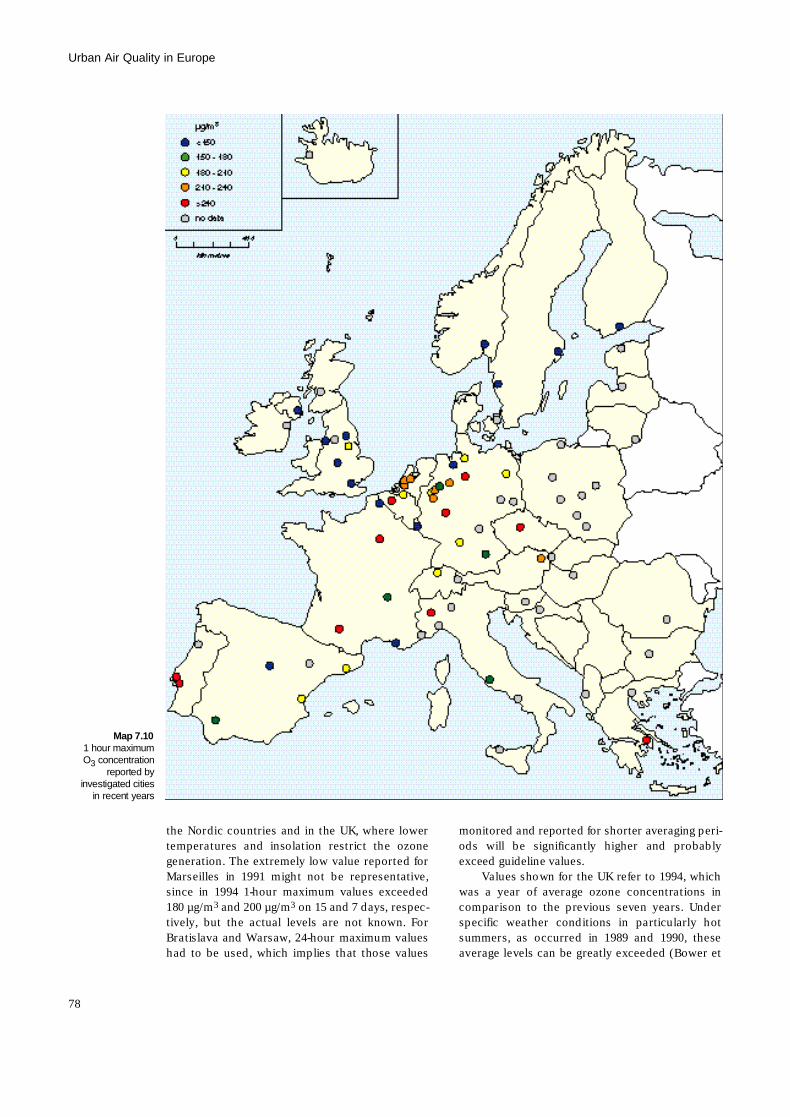
the Nordic countries and in the UK, where lowertemperatures and insolation restrict the ozonegeneration. The extremely low value reported forMarseilles in 1991 might not be representative,since in 1994 1-hour maximum values exceeded180 µg/m3 and 200 µg/m3 on 15 and 7 days, respec-tively, but the actual levels are not known. ForBratislava and Warsaw, 24-hour maximum valueshad to be used, which implies that those values
monitored and reported for shorter averaging peri-ods will be significantly higher and probablyexceed guideline values.
Values shown for the UK refer to 1994, whichwas a year of average ozone concentrations incomparison to the previous seven years. Underspecific weather conditions in particularly hotsummers, as occurred in 1989 and 1990, theseaverage levels can be greatly exceeded (Bower et
Urban Air Quality in Europe
78
Map 7.101 hour maximumO3 c o n c e n t r a t i o n
reported by investigated cities
in recent years
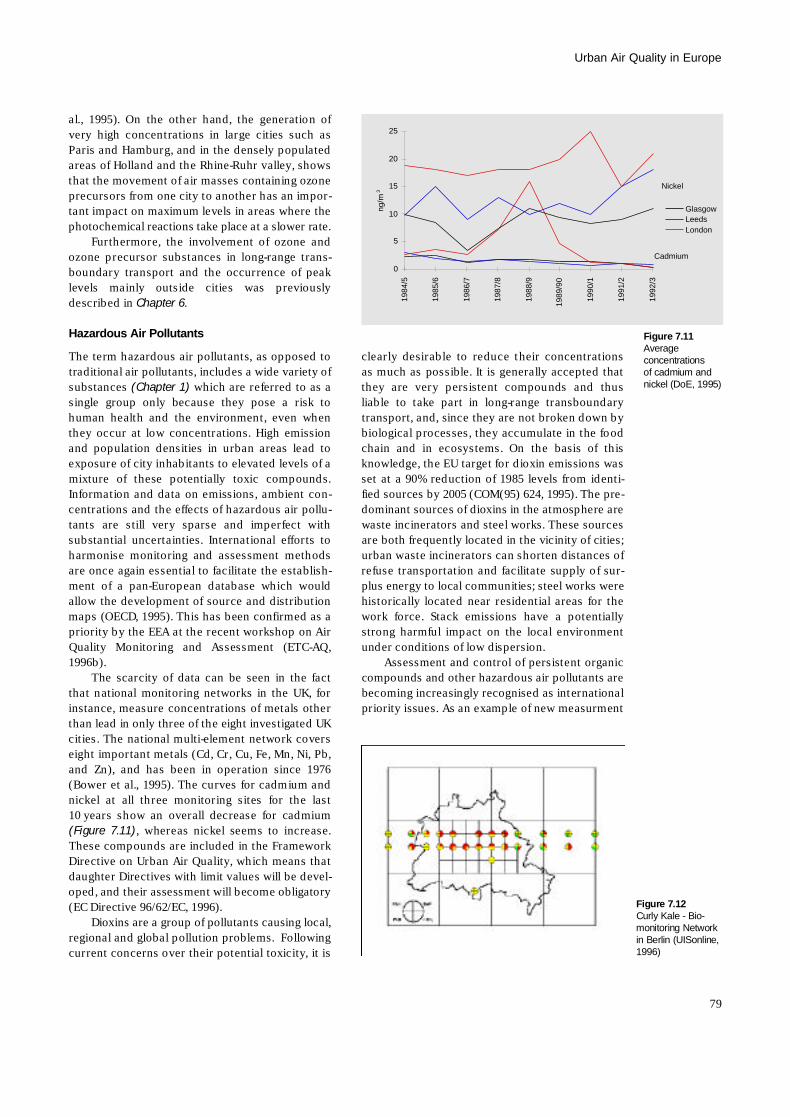
al., 1995). On the other hand, the generation ofvery high concentrations in large cities such asParis and Hamburg, and in the densely populatedareas of Holland and the Rhine-Ruhr valley, showsthat the movement of air masses containing ozoneprecursors from one city to another has an impor-tant impact on maximum levels in areas where thephotochemical reactions take place at a slower rate.
Furthermore, the involvement of ozone andozone precursor substances in long-range trans-boundary transport and the occurrence of peaklevels mainly outside cities was previouslydescribed in Chapter 6.
Hazardous Air Pollutants
The term hazardous air pollutants, as opposed totraditional air pollutants, includes a wide variety ofsubstances (Chapter 1) which are referred to as asingle group only because they pose a risk tohuman health and the environment, even whenthey occur at low concentrations. High emissionand population densities in urban areas lead toexposure of city inhabitants to elevated levels of amixture of these potentially toxic compounds.Information and data on emissions, ambient con-centrations and the effects of hazardous air pollu-tants are still very sparse and imperfect withsubstantial uncertainties. International efforts toharmonise monitoring and assessment methodsare once again essential to facilitate the establish-ment of a pan-European database which wouldallow the development of source and distributionmaps (OECD, 1995). This has been confirmed as apriority by the EEA at the recent workshop on AirQuality Monitoring and Assessment (ETC-AQ,1 9 9 6 b ) .
The scarcity of data can be seen in the factthat national monitoring networks in the UK, forinstance, measure concentrations of metals otherthan lead in only three of the eight investigated UKcities. The national multi-element network coverseight important metals (Cd, Cr, Cu, Fe, Mn, Ni, Pb,and Zn), and has been in operation since 1976(Bower et al., 1995). The curves for cadmium andnickel at all three monitoring sites for the last1 0 years show an overall decrease for cadmium(Figure 7.11), whereas nickel seems to increase.These compounds are included in the FrameworkDirective on Urban Air Quality, which means thatdaughter Directives with limit values will be devel-oped, and their assessment will become obligatory(EC Directive 96/62/EC, 1996).
Dioxins are a group of pollutants causing local,regional and global pollution problems. Followingcurrent concerns over their potential toxicity, it is
clearly desirable to reduce their c o n c e n t r a t i o n sas much as possible. It is generally accepted thatthey are very persistent compounds and thusliable to take part in long-range transboundarytransport, and, since they are not broken down bybiological processes, they accumulate in the foodchain and in ecosystems. On the basis of thisknowledge, the EU target for dioxin emissions wasset at a 90% reduction of 1985 levels from identi-fied sources by 2005 (COM(95) 624, 1995). The pre-dominant sources of dioxins in the atmosphere arewaste incinerators and steel works. These sourcesare both frequently located in the vicinity of cities;urban waste incinerators can shorten distances ofrefuse transportation and facilitate supply of sur-plus energy to local communities; steel works werehistorically located near residential areas for thework force. Stack emissions have a potentiallystrong harmful impact on the local environmentunder conditions of low dispersion.
Assessment and control of persistent organiccompounds and other hazardous air pollutants arebecoming increasingly recognised as internationalpriority issues. As an example of new measurment
79
Urban Air Quality in Europe
Nickel
Cadmium
0
5
10
15
20
25
1984
/5
1985
/6
1986
/7
1987
/8
1988
/9
1989
/90
1990
/1
1991
/2
1992
/3
ng/m
3
GlasgowLeedsLondon
Figure 7.11A v e r a g econcentrations of cadmium andnickel (DoE, 1995)
Figure 7.12Curly Kale - Bio-monitoring Networkin Berlin (UISonline,1 9 9 6 )

systems, Berlin has established a comprehensivebiomonitoring programme consisting of severalactive and passive monitor species for pollutantaccumulation and reaction indication. The objec-tive of the network is aimed at assessing the eco-logical impact of air quality and characterising theeffects of regional short- and long-term exposure toatmospheric pollutants. The network covers cen-tral and suburban parts of the city. In hot spot
areas, close to motorways for example, the densityof monitors is increased. Curly kale (Brassica oler -acea acepala) is used for cumulative determina-tion of PAHs, using the indicator pollutantsbenzo[a]pyrene (BaP), PCBs and PCDD/PCDFs(dioxins and furans). Results for 1993/94 are dis-played in F i g u r e7 . 1 2, where green, yellow and redindicate low medium and high exposure stress,respectively (UISonline, 1996).
Urban Air Quality in Europe
80
The assessment of the impact of air pollutionon the global environment is generally split
into three different sectors, namely human health,ecosystems and building materials. An economicvalue can be given to all three fields and thus theconservation of clean and healthy air should benot only a prime medical and environmental issue,but also an economic issue. Costs are associatedw i t h :
• raised numbers of respiratory and cardiovascu-lar diseases, leading to higher numbers of visitsat general practices and increased application ofmedication, reduced well-being and stress,reduced life expectancy, development of chronicdiseases and cancer as well as genotoxic effects;
• reduction of crop yield and loss of biodiversityin combination with decrease in recreationalvalue of a landscape;
• cleaning, restoration and replacement of build-ings and structures and the irreversible loss ofcultural heritage.
In combination with the recent adoption of the EUFramework Directive on Ambient Air QualityAssessment and Management (EC, 1996), an eco-nomic evaluation, with the aim of identifying theleast-cost solution to meet the limit values, will beconducted. This evaluation will cover the sub-stances sulphur dioxide (SO2), nitrogen dioxide( N O2), fine and suspended particulates, as well aslead (Pb). Analysis based on costs and benefits,with emphasis on the estimation of monetary gain
Chapter 8
E x p o s u re Assessment
81
Cyclist in smog, London
from reduced harm to human health, but also pay-ing attention to damage of ecosystems and materi-als, will be carried out. The impact on ecosystemsand material welfare should, where possible, beexpressed in monetary terms as well, otherwisephysical terms will be used. The cost assessmentwill include capital and operating costs for mobileand stationary sources, expressed per ton ofabated emission, employing technical and non-technical emission control methods (S030, 1996).
Public Health Effects
Although in certain areas specific pollutants mayplay a predominant role in the exposure patternand even in pollution episodes some indicator pol-lutants have been identified, a mixture of harmfulsubstances is generally present in the ambient air.Thus the assessment of the impact that individualsubstances have on their environment is often dif-ficult and a wide range of confounding factors hasto be considered. The interactions of pollutants,which may occur together in the atmosphere,have hardly ever been investigated. The effects onorganisms and materials, caused by two or morechemicals attacking them simultaneously, can beadditive, synergistic or antagonistic, yet investiga-tions, particularly controlled-chamber studies, usu-ally concentrate on single pollutants.
On the other hand, in epidemiological studies,the effects of individual pollutants are difficult todistinguish since the concentration curves of sev-eral pollutants, originating mainly from the samesource or generated under similar conditions, canfollow a parallel course; this is the case for SO2
and suspended particulate matter (SPM) emittedfrom coal combustion facilities. Another problemencountered in epidemiological studies is the pos-sible presence of unidentified (and thus not mea-sured) confounding factors, which could havesome impact on the selected health criteria underinvestigation. Confounding factors of particularimportance in air quality investigations, for whichcontrols are generally applied, are:
• meteorological variables, such as temperature,humidity, wind velocity,
• personal variables, such as smoker/non-smoker,education, income,
• seasonal or other chronological variables, suchas day of the week, holidays, and
• others, such as influenza epidemics and pollenl e v e l s .
Epidemiological StudiesTwo types of epidemiological studies can be differ-entiated; one investigates single air pollution
episodes, whereas in the other, daily health eventsare computed. In the first type, the derivation ofdirect evidence for the occurrence of health effectsand suggestions on how to practice abatement, ispossible from the data. The second type, time-series studies, either focuses on panels or uses thewhole population. They allow control for con-founding factors and result in the definition of acoefficient, which describes the relationshipbetween health effects and air pollution(AGMAAPE, 1995). Such a coefficient can then beused in the definition of air quality standards.
Many earlier studies suggested that the pollu-tion concentrations normally experienced in themajor part of Europe, even during episodes of ele-vated contaminant levels, do not cause harm tootherwise healthy individuals, but can have amajor impact on sensitive individuals. Personswith respiratory diseases, such as asthma, willgenerally increase the administration of medica-tion to compensate for the effects. If this is notpossible or not successful, deterioration of health(morbidity) may occur and, in extreme cases, mor-tality rates will increase. A Europe-wide study onshort-term effects was recently initiated and pre-liminary results indicate that even levels around orbelow current guideline values could be harmful tohealth (Katsouyanni et al., 1995). This project,called APHEA (Air Pollution on Health: EuropeanApproach), analyses epidemiological time-seriesdata in combination with monitored air pollutionlevels and information on potential confounders.By aiming to harmonise analytical techniques, andenhance the comparability of epidemiologicalstudies conducted in different parts of Europe andthe world, this collaborative project will contributeto the standardisation of methodology and theexchange of expertise. Furthermore, the findingswill be advantageous in the revision and update ofcurrent air quality guidelines. The application ofmeta-analysis to results of individual studies willcreate even more valuable information than couldbe achieved from the separate investigations.
Guideline values are generally adoptedaccording to the state of current knowledge, underthe assumption that even lifetime exposure tothese concentrations will have no, or only accept-ably low, adverse effects (Chapter 3). The effect ofa pollutant does not necessarily show a linear risein relation to its concentration; in the case ofozone (O3), for instance, higher levels will causemore harm than expected (WHO, 1995c). Anotherunresolved problem is the behaviour of the expo-sure-impact curve in the low concentration zone. Itis widely discussed whether threshold values canand should be defined; for instance, the impact of
Exposure Assessment
82
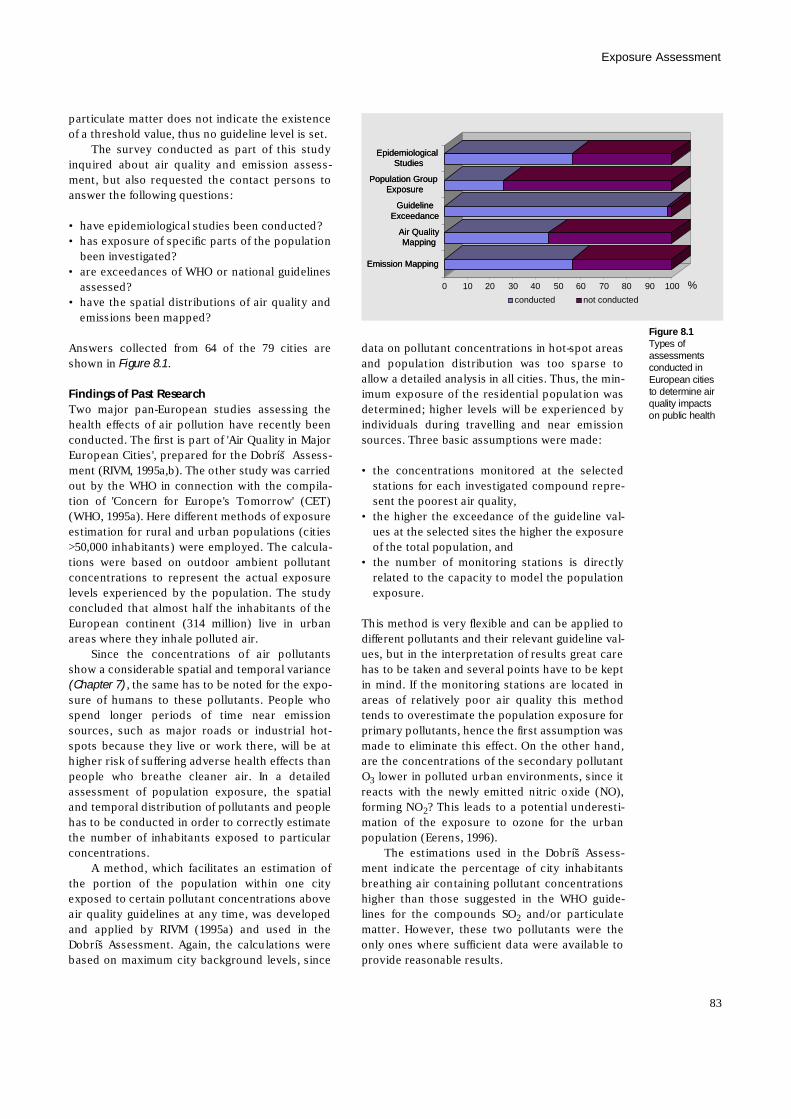
particulate matter does not indicate the existenceof a threshold value, thus no guideline level is set.
The survey conducted as part of this studyinquired about air quality and emission assess-ment, but also requested the contact persons toanswer the following questions:
• have epidemiological studies been conducted?• has exposure of specific parts of the population
been investigated?• are exceedances of WHO or national guidelines
a s s e s s e d ?• have the spatial distributions of air quality and
emissions been mapped?
Answers collected from 64 of the 79 cities areshown in Figure 8.1.
Findings of Past ResearchTwo major pan-European studies assessing thehealth effects of air pollution have recently beenconducted. The first is part of 'Air Quality in MajorEuropean Cities', prepared for the Dobrís̆ Assess-ment (RIVM, 1995a,b). The other study was carriedout by the WHO in connection with the compila-tion of 'Concern for Europe's Tomorrow' (CET)(WHO, 1995a). Here different methods of exposureestimation for rural and urban populations (cities>50,000 inhabitants) were employed. The calcula-tions were based on outdoor ambient pollutantconcentrations to represent the actual exposurelevels experienced by the population. The studyconcluded that almost half the inhabitants of theEuropean continent (314 million) live in urbanareas where they inhale polluted air.
Since the concentrations of air pollutantsshow a considerable spatial and temporal variance(Chapter 7), the same has to be noted for the expo-sure of humans to these pollutants. People whospend longer periods of time near emissionsources, such as major roads or industrial hot-spots because they live or work there, will be athigher risk of suffering adverse health effects thanpeople who breathe cleaner air. In a detailedassessment of population exposure, the spatialand temporal distribution of pollutants and peoplehas to be conducted in order to correctly estimatethe number of inhabitants exposed to particularc o n c e n t r a t i o n s .
A method, which facilitates an estimation ofthe portion of the population within one cityexposed to certain pollutant concentrations aboveair quality guidelines at any time, was developedand applied by RIVM (1995a) and used in theD o b r ís̆ Assessment. Again, the calculations werebased on maximum city background levels, since
data on pollutant concentrations in hot-spot areasand population distribution was too sparse toallow a detailed analysis in all cities. Thus, the min-imum exposure of the residential population wasdetermined; higher levels will be experienced byindividuals during travelling and near emissionsources. Three basic assumptions were made:
• the concentrations monitored at the selectedstations for each investigated compound repre-sent the poorest air quality,
• the higher the exceedance of the guideline val-ues at the selected sites the higher the exposureof the total population, and
• the number of monitoring stations is directlyrelated to the capacity to model the populatione x p o s u r e .
This method is very flexible and can be applied todifferent pollutants and their relevant guideline val-ues, but in the interpretation of results great carehas to be taken and several points have to be keptin mind. If the monitoring stations are located inareas of relatively poor air quality this methodtends to overestimate the population exposure forprimary pollutants, hence the first assumption wasmade to eliminate this effect. On the other hand,are the concentrations of the secondary pollutantO3 lower in polluted urban environments, since itreacts with the newly emitted nitric oxide (NO),forming NO2? This leads to a potential underesti-mation of the exposure to ozone for the urbanpopulation (Eerens, 1996).
The estimations used in the Dobrís̆ Assess-ment indicate the percentage of city inhabitantsbreathing air containing pollutant concentrationshigher than those suggested in the WHO guide-lines for the compounds SO2 and/or particulatematter. However, these two pollutants were theonly ones where sufficient data were available toprovide reasonable results.
83
Exposure Assessment
Emission Mapping
Air QualityMapping
GuidelineExceedance
Population GroupExposure
EpidemiologicalStudies
0 10 20 30 40 50 60 70 80 90 100
Emission Mapping
Air QualityMapping
GuidelineExceedance
Population GroupExposure
EpidemiologicalStudies
conducted not conducted
Figure 8.1Types of a s s e s s m e n t sconducted in European cities to determine airquality impacts on public health
%
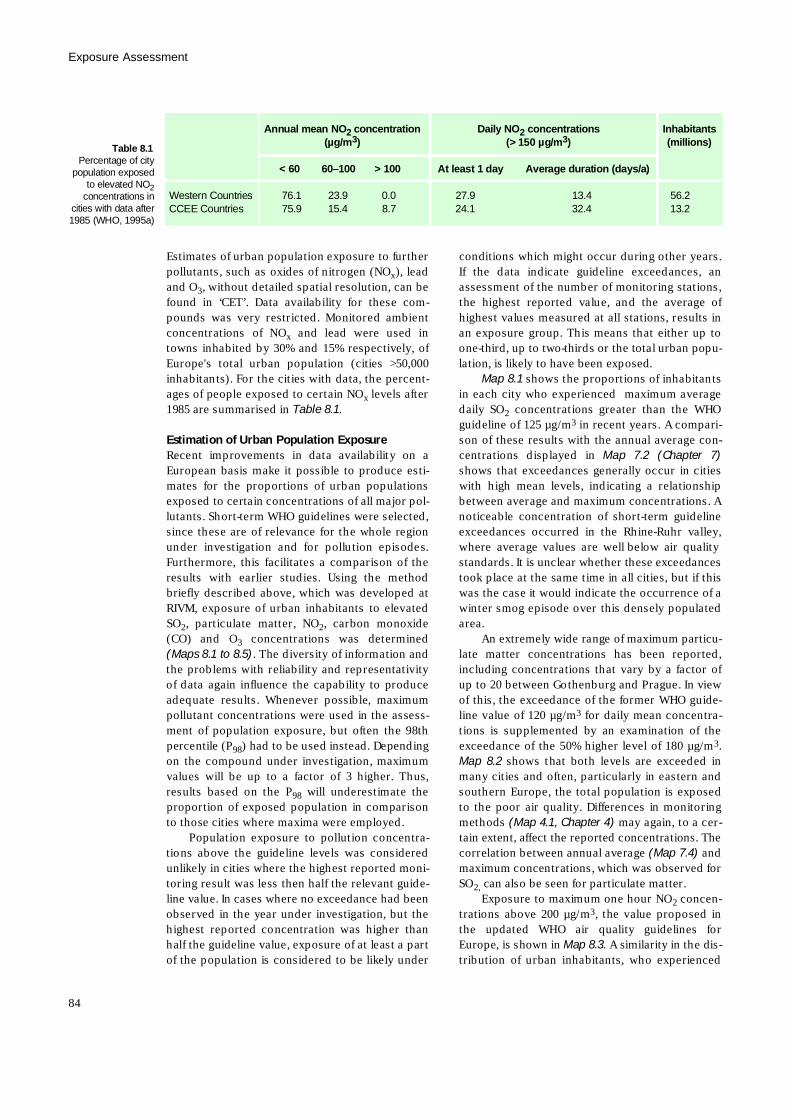
Estimates of urban population exposure to furtherpollutants, such as oxides of nitrogen (NOx), leadand O3, without detailed spatial resolution, can befound in ‘CET’. Data availability for these com-pounds was very restricted. Monitored ambientconcentrations of NOx and lead were used intowns inhabited by 30% and 15% respectively, ofEurope's total urban population (cities >50,000inhabitants). For the cities with data, the percent-ages of people exposed to certain NOx levels after1985 are summarised in Table 8.1.
Estimation of Urban Population ExposureRecent improvements in data availability on aEuropean basis make it possible to produce esti-mates for the proportions of urban populationsexposed to certain concentrations of all major pol-lutants. Short-term WHO guidelines were selected,since these are of relevance for the whole regionunder investigation and for pollution episodes.Furthermore, this facilitates a comparison of theresults with earlier studies. Using the methodbriefly described above, which was developed atRIVM, exposure of urban inhabitants to elevatedS O2, particulate matter, NO2, carbon monoxide(CO) and O3 concentrations was determined(Maps 8.1 to 8.5). The diversity of information andthe problems with reliability and representativityof data again influence the capability to produceadequate results. Whenever possible, maximumpollutant concentrations were used in the assess-ment of population exposure, but often the 98thpercentile (P9 8) had to be used instead. Dependingon the compound under investigation, maximumvalues will be up to a factor of 3 higher. Thus,results based on the P9 8 will underestimate theproportion of exposed population in comparisonto those cities where maxima were employed.
Population exposure to pollution concentra-tions above the guideline levels was consideredunlikely in cities where the highest reported moni-toring result was less then half the relevant guide-line value. In cases where no exceedance had beenobserved in the year under investigation, but thehighest reported concentration was higher thanhalf the guideline value, exposure of at least a partof the population is considered to be likely under
conditions which might occur during other years.If the data indicate guideline exceedances, anassessment of the number of monitoring stations,the highest reported value, and the average ofhighest values measured at all stations, results inan exposure group. This means that either up toone-third, up to two-thirds or the total urban popu-lation, is likely to have been exposed.
Map 8.1 shows the proportions of inhabitantsin each city who experienced maximum averagedaily SO2 concentrations greater than the WHOguideline of 125 µg/m3 in recent years. A compari-son of these results with the annual average con-centrations displayed in Map 7.2 (Chapter 7)shows that exceedances generally occur in citieswith high mean levels, indicating a relationshipbetween average and maximum concentrations. Anoticeable concentration of short-term guidelineexceedances occurred in the Rhine-Ruhr valley,where average values are well below air qualitystandards. It is unclear whether these exceedancestook place at the same time in all cities, but if thiswas the case it would indicate the occurrence of awinter smog episode over this densely populatedarea.
An extremely wide range of maximum particu-late matter concentrations has been reported,including concentrations that vary by a factor ofup to 20 between Gothenburg and Prague. In viewof this, the exceedance of the former WHO guide-line value of 120 µg/m3 for daily mean concentra-tions is supplemented by an examination of theexceedance of the 50% higher level of 180 µg/m3.Map 8.2 shows that both levels are exceeded inmany cities and often, particularly in eastern andsouthern Europe, the total population is exposedto the poor air quality. Differences in monitoringmethods (Map 4.1, Chapter 4) may again, to a cer-tain extent, affect the reported concentrations. Thecorrelation between annual average (Map 7.4) a n dmaximum concentrations, which was observed forS O2 , can also be seen for particulate matter.
Exposure to maximum one hour NO2 c o n c e n-trations above 200 µg/m3, the value proposed inthe updated WHO air quality guidelines forEurope, is shown in Map 8.3. A similarity in the dis-tribution of urban inhabitants, who experienced
Exposure Assessment
84
Annual mean NO2 c o n c e n t r a t i o n Daily NO2 c o n c e n t r a t i o n s I n h a b i t a n t s( µ g / m3) (> 150 µg/m3) ( m i l l i o n s )
< 60 6 0 – 1 0 0 > 100 At least 1 day Average duration (days/a)
Western Countries 7 6 . 1 2 3 . 9 0 . 0 2 7 . 9 1 3 . 4 5 6 . 2CCEE Countries 7 5 . 9 1 5 . 4 8 . 7 2 4 . 1 3 2 . 4 1 3 . 2
Table 8.1Percentage of city
population exposedto elevated NO2
concentrations incities with data after1985 (WHO, 1995a)
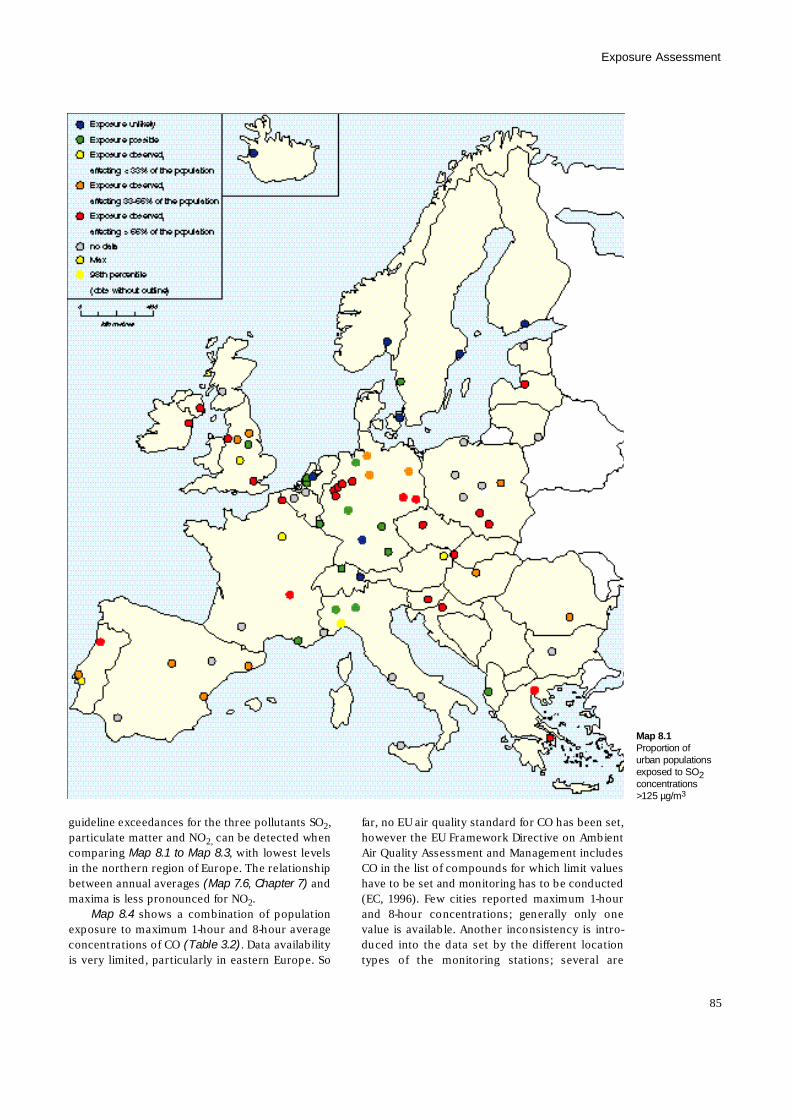
guideline exceedances for the three pollutants SO2,particulate matter and NO2 , can be detected whencomparing Map 8.1 to Map 8.3, with lowest levelsin the northern region of Europe. The relationshipbetween annual averages (Map 7.6, Chapter 7) a n dmaxima is less pronounced for NO2.
Map 8.4 shows a combination of populationexposure to maximum 1-hour and 8-hour averageconcentrations of CO (Table 3.2). Data availabilityis very limited, particularly in eastern Europe. So
far, no EU air quality standard for CO has been set,however the EU Framework Directive on AmbientAir Quality Assessment and Management includesCO in the list of compounds for which limit valueshave to be set and monitoring has to be conducted(EC, 1996). Few cities reported maximum 1-hourand 8-hour concentrations; generally only onevalue is available. Another inconsistency is intro-duced into the data set by the different locationtypes of the monitoring stations; several are
85
Exposure Assessment
Map 8.1Proportion ofurban populationsexposed to SO2c o n c e n t r a t i o n s>125 µg/m3
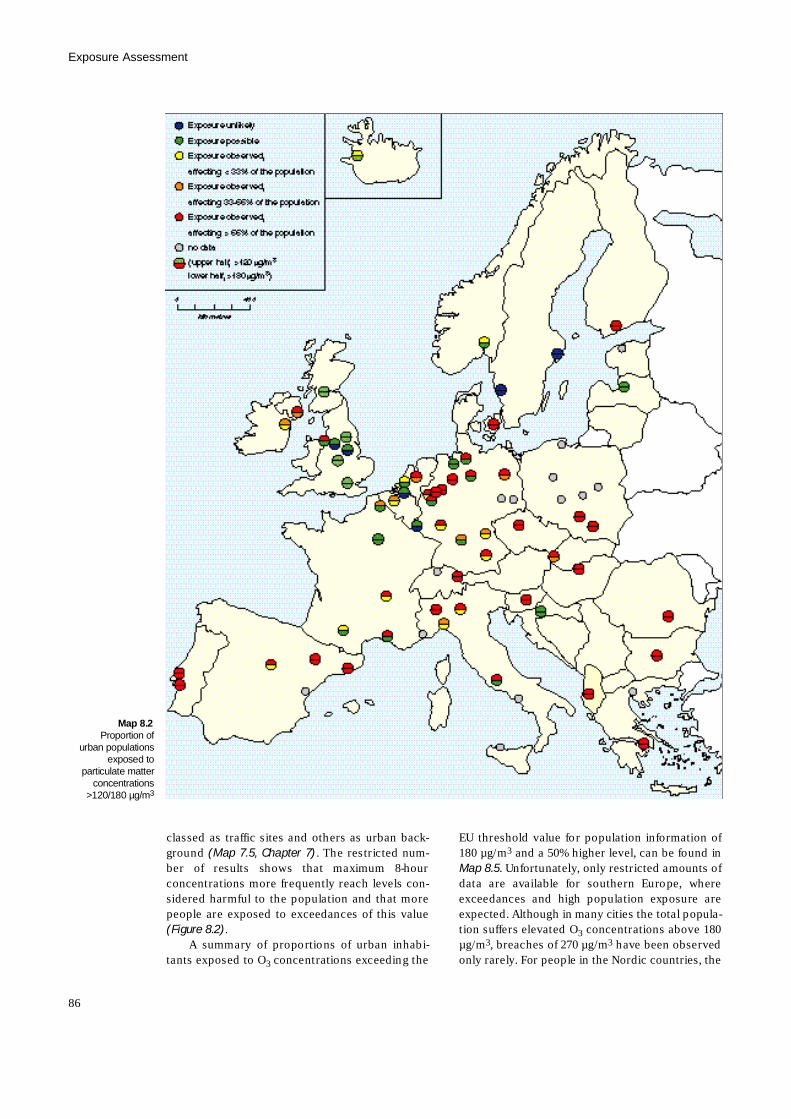
classed as traffic sites and others as urban back-ground (Map 7.5, Chapter 7). The restricted num-ber of results shows that maximum 8-hourconcentrations more frequently reach levels con-sidered harmful to the population and that morepeople are exposed to exceedances of this value(Figure 8.2).
A summary of proportions of urban inhabi-tants exposed to O3 concentrations exceeding the
EU threshold value for population information of180 µg/m3 and a 50% higher level, can be found inMap 8.5. Unfortunately, only restricted amounts ofdata are available for southern Europe, whereexceedances and high population exposure areexpected. Although in many cities the total popula-tion suffers elevated O3 concentrations above 180µ g / m3, breaches of 270 µg/m3 have been observedonly rarely. For people in the Nordic countries, the
Exposure Assessment
86
Map 8.2Proportion of
urban populationsexposed to
particulate matterc o n c e n t r a t i o n s
>120/180 µg/m3
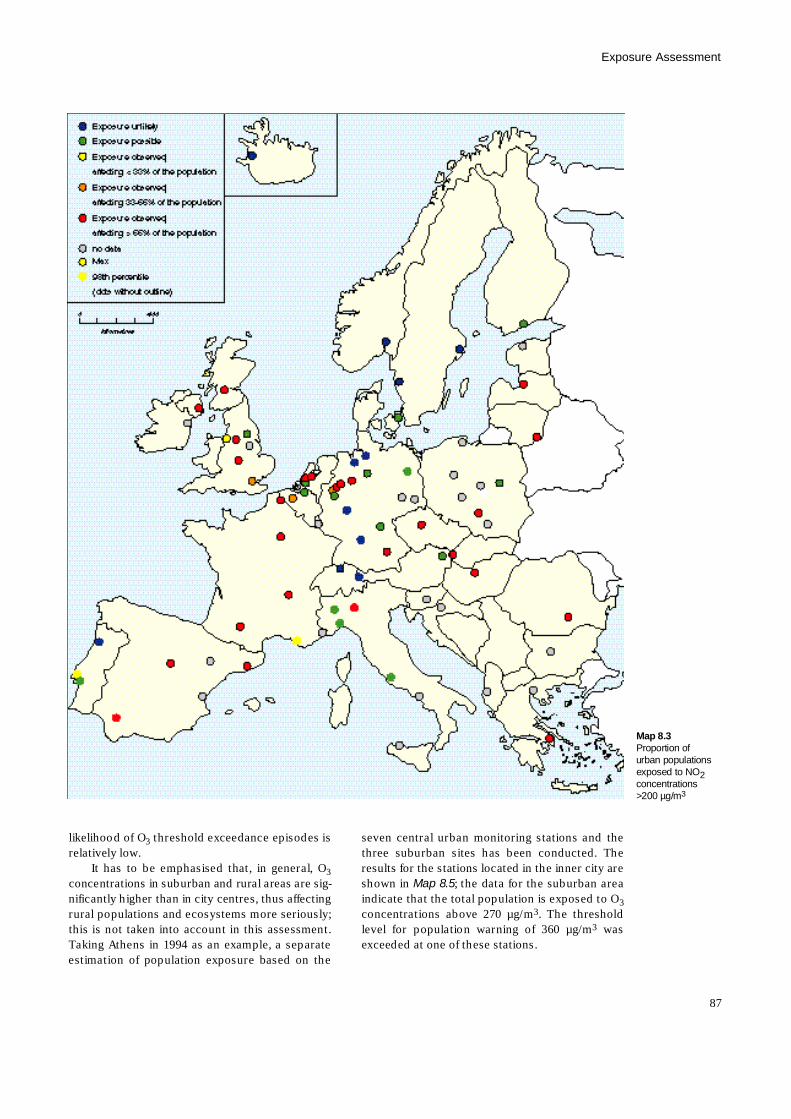
likelihood of O3 threshold exceedance episodes isrelatively low.
It has to be emphasised that, in general, O3
concentrations in suburban and rural areas are sig-nificantly higher than in city centres, thus affectingrural populations and ecosystems more seriously;this is not taken into account in this assessment.Taking Athens in 1994 as an example, a separateestimation of population exposure based on the
seven central urban monitoring stations and thethree suburban sites has been conducted. Theresults for the stations located in the inner city areshown in Map 8.5; the data for the suburban areaindicate that the total population is exposed to O3
concentrations above 270 µg/m3. The thresholdlevel for population warning of 360 µg/m3 w a sexceeded at one of these stations.
87
Exposure Assessment
Map 8.3Proportion ofurban populationsexposed to NO2c o n c e n t r a t i o n s>200 µg/m3
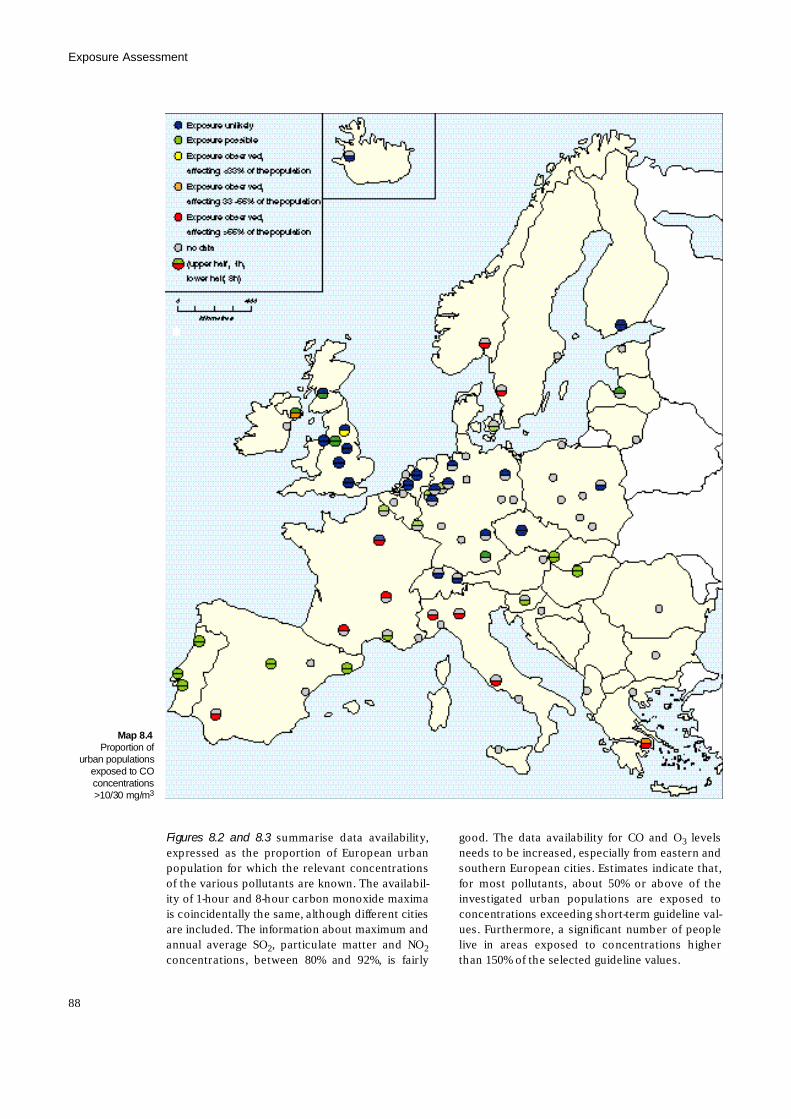
Figures 8.2 and 8.3 summarise data availability,expressed as the proportion of European urbanpopulation for which the relevant concentrationsof the various pollutants are known. The availabil-ity of 1-hour and 8-hour carbon monoxide maximais coincidentally the same, although different citiesare included. The information about maximum andannual average SO2, particulate matter and NO2
concentrations, between 80% and 92%, is fairly
good. The data availability for CO and O3 l e v e l sneeds to be increased, especially from eastern andsouthern European cities. Estimates indicate that,for most pollutants, about 50% or above of theinvestigated urban populations are exposed toconcentrations exceeding short-term guideline val-ues. Furthermore, a significant number of peoplelive in areas exposed to concentrations higherthan 150% of the selected guideline values.
Exposure Assessment
88
Map 8.4Proportion of
urban populationsexposed to COc o n c e n t r a t i o n s>10/30 mg/m3
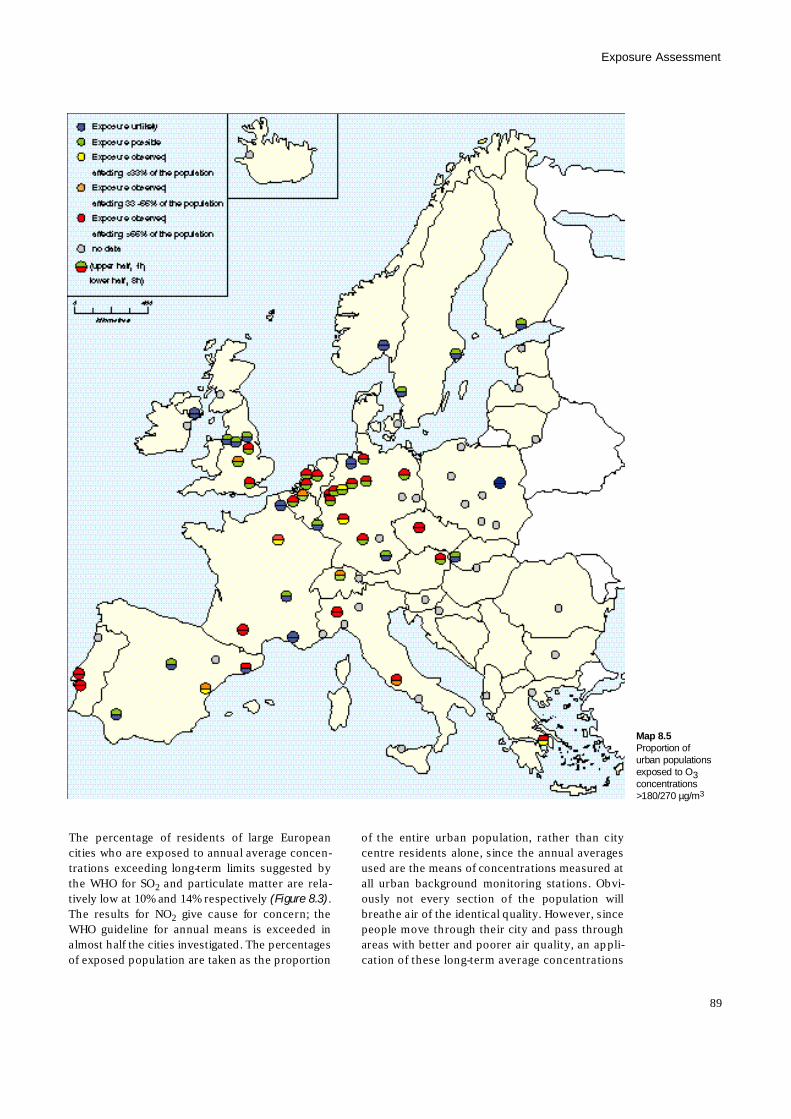
Exposure Assessment
The percentage of residents of large Europeancities who are exposed to annual average concen-trations exceeding long-term limits suggested bythe WHO for SO2 and particulate matter are rela-tively low at 10% and 14% respectively (Figure 8.3).The results for NO2 give cause for concern; theWHO guideline for annual means is exceeded inalmost half the cities investigated. The percentagesof exposed population are taken as the proportion
of the entire urban population, rather than citycentre residents alone, since the annual averagesused are the means of concentrations measured atall urban background monitoring stations. Obvi-ously not every section of the population willbreathe air of the identical quality. However, sincepeople move through their city and pass throughareas with better and poorer air quality, an appli-cation of these long-term average concentrations
89
Map 8.5Proportion ofurban populationsexposed to O3c o n c e n t r a t i o n s>180/270 µg/m3
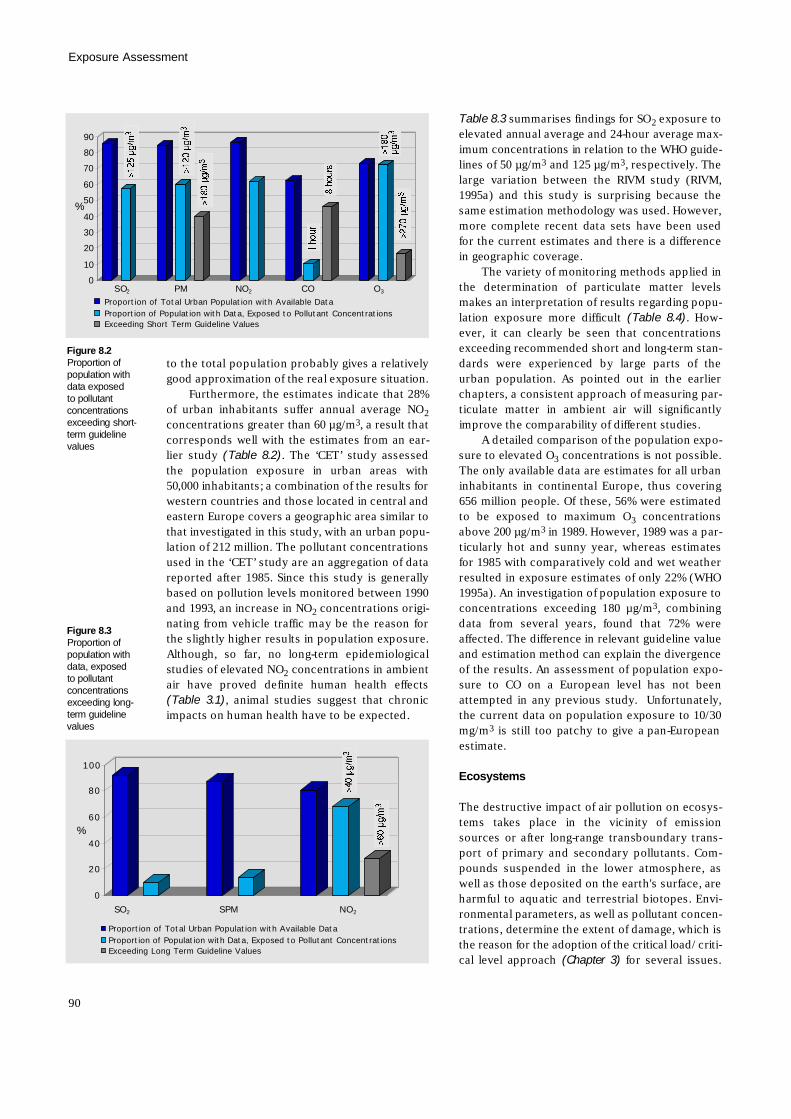
to the total population probably gives a relativelygood approximation of the real exposure situation.
Furthermore, the estimates indicate that 28%of urban inhabitants suffer annual average NO2
concentrations greater than 60 µg/m3, a result thatcorresponds well with the estimates from an ear-lier study (Table 8.2). The ‘CET’ study assessedthe population exposure in urban areas with50,000 inhabitants; a combination of the results forwestern countries and those located in central andeastern Europe covers a geographic area similar tothat investigated in this study, with an urban popu-lation of 212 million. The pollutant concentrationsused in the ‘CET’ study are an aggregation of datareported after 1985. Since this study is generallybased on pollution levels monitored between 1990and 1993, an increase in NO2 concentrations origi-nating from vehicle traffic may be the reason forthe slightly higher results in population exposure.Although, so far, no long-term epidemiologicalstudies of elevated NO2 concentrations in ambientair have proved definite human health effects(Table 3.1), animal studies suggest that chronicimpacts on human health have to be expected.
Table 8.3 summarises findings for SO2 exposure toelevated annual average and 24-hour average max-imum concentrations in relation to the WHO guide-lines of 50 µg/m3 and 125 µg/m3, respectively. Thelarge variation between the RIVM study (RIVM,1995a) and this study is surprising because thesame estimation methodology was used. However,more complete recent data sets have been usedfor the current estimates and there is a differencein geographic coverage.
The variety of monitoring methods applied inthe determination of particulate matter levelsmakes an interpretation of results regarding popu-lation exposure more difficult (Table 8.4). How-ever, it can clearly be seen that concentrationsexceeding recommended short and long-term stan-dards were experienced by large parts of theurban population. As pointed out in the earlierchapters, a consistent approach of measuring par-ticulate matter in ambient air will significantlyimprove the comparability of different studies.
A detailed comparison of the population expo-sure to elevated O3 concentrations is not possible.The only available data are estimates for all urbaninhabitants in continental Europe, thus covering656 million people. Of these, 56% were estimatedto be exposed to maximum O3 c o n c e n t r a t i o n sabove 200 µg/m3 in 1989. However, 1989 was a par-ticularly hot and sunny year, whereas estimatesfor 1985 with comparatively cold and wet weatherresulted in exposure estimates of only 22% (WHO1995a). An investigation of population exposure toconcentrations exceeding 180 µg/m3, combiningdata from several years, found that 72% wereaffected. The difference in relevant guideline valueand estimation method can explain the divergenceof the results. An assessment of population expo-sure to CO on a European level has not beenattempted in any previous study. Unfortunately,the current data on population exposure to 10/30m g / m3 is still too patchy to give a pan-Europeane s t i m a t e .
E c o s y s t e m s
The destructive impact of air pollution on ecosys-tems takes place in the vicinity of emissionsources or after long-range transboundary trans-port of primary and secondary pollutants. Com-pounds suspended in the lower atmosphere, aswell as those deposited on the earth's surface, areharmful to aquatic and terrestrial biotopes. Envi-ronmental parameters, as well as pollutant concen-trations, determine the extent of damage, which isthe reason for the adoption of the critical load/ criti-cal level approach (Chapter 3) for several issues.
Exposure Assessment
90
0
10
20
30
40
50
60
70
80
90
SO2 PM NO2 CO O3
Proportion of Total Urban Population with Available DataProportion of Population with Data, Exposed to Pollutant Concentrations Exceeding Short Term Guideline Values
Figure 8.2Proportion ofpopulation withdata exposedto pollutantc o n c e n t r a t i o n sexceeding short-term guidelinev a l u e s
0
20
40
60
80
100
SO2 SPM NO2
Proportion of Total Urban Population with Available DataProportion of Population with Data, Exposed to Pollutant ConcentrationsExceeding Long Term Guideline Values
Figure 8.3Proportion ofpopulation withdata, exposedto pollutantc o n c e n t r a t i o n sexceeding long-term guidelinev a l u e s
%
%
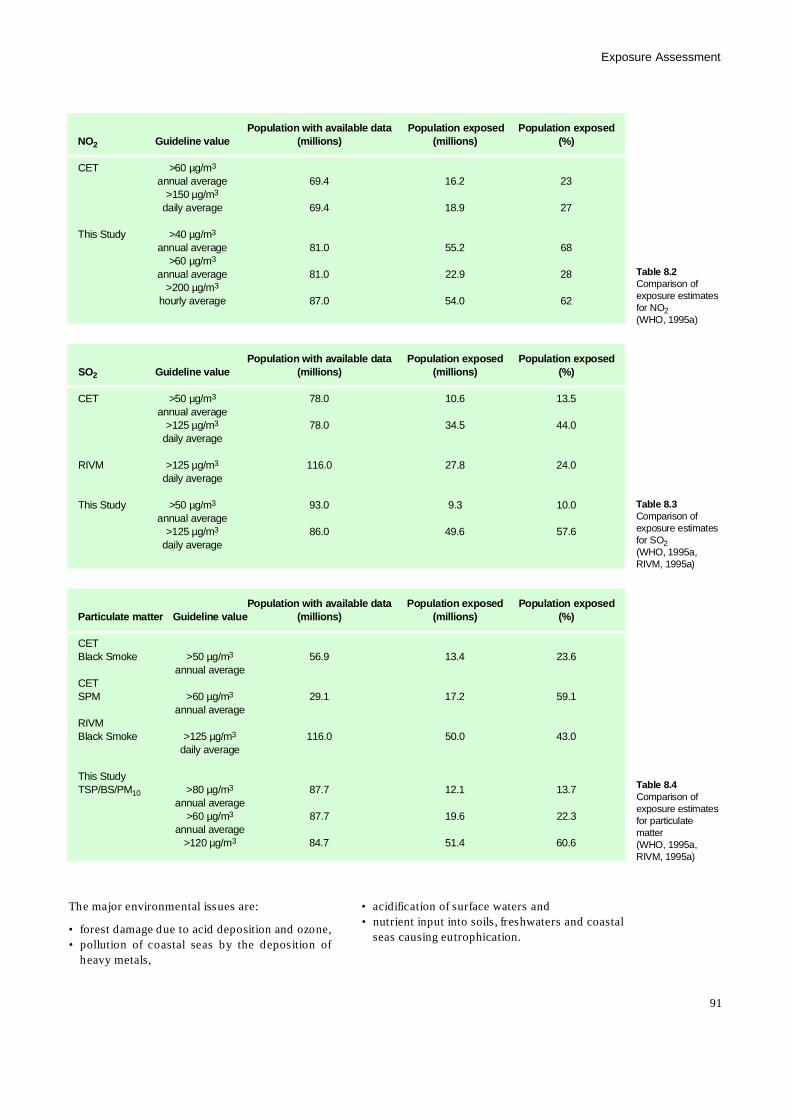
The major environmental issues are:
• forest damage due to acid deposition and ozone,• pollution of coastal seas by the deposition of
heavy metals,
• acidification of surface waters and• nutrient input into soils, freshwaters and coastal
seas causing eutrophication.
91
Exposure Assessment
Population with available data Population exposed Population exposedS O2 Guideline value ( m i l l i o n s ) ( m i l l i o n s ) ( % )
C E T >50 µg/m3 7 8 . 0 1 0 . 6 1 3 . 5annual average
>125 µg/m3 7 8 . 0 3 4 . 5 4 4 . 0daily average
R I V M >125 µg/m3 1 1 6 . 0 2 7 . 8 2 4 . 0daily average
This Study >50 µg/m3 9 3 . 0 9 . 3 1 0 . 0annual average
>125 µg/m3 8 6 . 0 4 9 . 6 5 7 . 6daily average
Table 8.3Comparison ofexposure estimatesfor SO2(WHO, 1995a,RIVM, 1995a)
Population with available data Population exposed Population exposedN O2 Guideline value ( m i l l i o n s ) ( m i l l i o n s ) ( % )
C E T >60 µg/m3
annual average 6 9 . 4 1 6 . 2 2 3>150 µg/m3
daily average 6 9 . 4 1 8 . 9 2 7
This Study >40 µg/m3
annual average 8 1 . 0 5 5 . 2 6 8>60 µg/m3
annual average 8 1 . 0 2 2 . 9 2 8>200 µg/m3
hourly average 8 7 . 0 5 4 . 0 6 2
Table 8.2Comparison ofexposure estimatesfor NO2(WHO, 1995a)
Population with available data Population exposed Population exposedParticulate matter Guideline value ( m i l l i o n s ) ( m i l l i o n s ) ( % )
C E TBlack Smoke >50 µg/m3 5 6 . 9 1 3 . 4 2 3 . 6
annual averageC E TS P M >60 µg/m3 2 9 . 1 1 7 . 2 5 9 . 1
annual averageR I V MBlack Smoke >125 µg/m3 1 1 6 . 0 5 0 . 0 4 3 . 0
daily average
This StudyT S P / B S / P M1 0 >80 µg/m3 8 7 . 7 1 2 . 1 1 3 . 7
annual average>60 µg/m3 8 7 . 7 1 9 . 6 2 2 . 3
annual average>120 µg/m3 8 4 . 7 5 1 . 4 6 0 . 6
Table 8.4Comparison ofexposure estimatesfor particulatem a t t e r(WHO, 1995a,RIVM, 1995a)
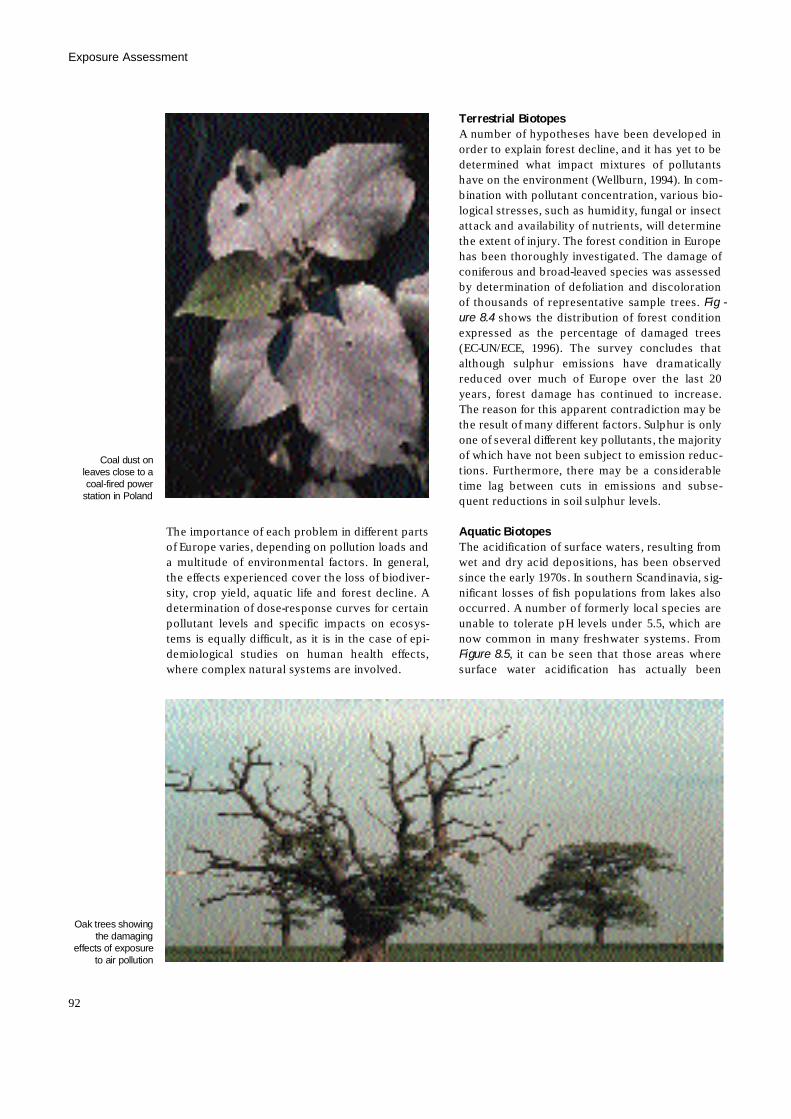
The importance of each problem in different partsof Europe varies, depending on pollution loads anda multitude of environmental factors. In general,the effects experienced cover the loss of biodiver-sity, crop yield, aquatic life and forest decline. Adetermination of dose-response curves for certainpollutant levels and specific impacts on ecosys-tems is equally difficult, as it is in the case of epi-demiological studies on human health effects,where complex natural systems are involved.
Terrestrial BiotopesA number of hypotheses have been developed inorder to explain forest decline, and it has yet to bedetermined what impact mixtures of pollutantshave on the environment (Wellburn, 1994). In com-bination with pollutant concentration, various bio-logical stresses, such as humidity, fungal or insectattack and availability of nutrients, will determinethe extent of injury. The forest condition in Europehas been thoroughly investigated. The damage ofconiferous and broad-leaved species was assessedby determination of defoliation and discolorationof thousands of representative sample trees. F i g -u r e 8 . 4 shows the distribution of forest conditionexpressed as the percentage of damaged trees(EC-UN/ECE, 1996). The survey concludes thatalthough sulphur emissions have dramaticallyreduced over much of Europe over the last 20years, forest damage has continued to increase.The reason for this apparent contradiction may bethe result of many different factors. Sulphur is onlyone of several different key pollutants, the majorityof which have not been subject to emission reduc-tions. Furthermore, there may be a considerabletime lag between cuts in emissions and subse-quent reductions in soil sulphur levels.
Aquatic BiotopesThe acidification of surface waters, resulting fromwet and dry acid depositions, has been observedsince the early 1970s. In southern Scandinavia, sig-nificant losses of fish populations from lakes alsooccurred. A number of formerly local species areunable to tolerate pH levels under 5.5, which arenow common in many freshwater systems. FromF i g u r e 8 . 5, it can be seen that those areas wheresurface water acidification has actually been
Exposure Assessment
92
Coal dust onleaves close to acoal-fired power
station in Poland
Oak trees showingthe damaging
effects of exposureto air pollution
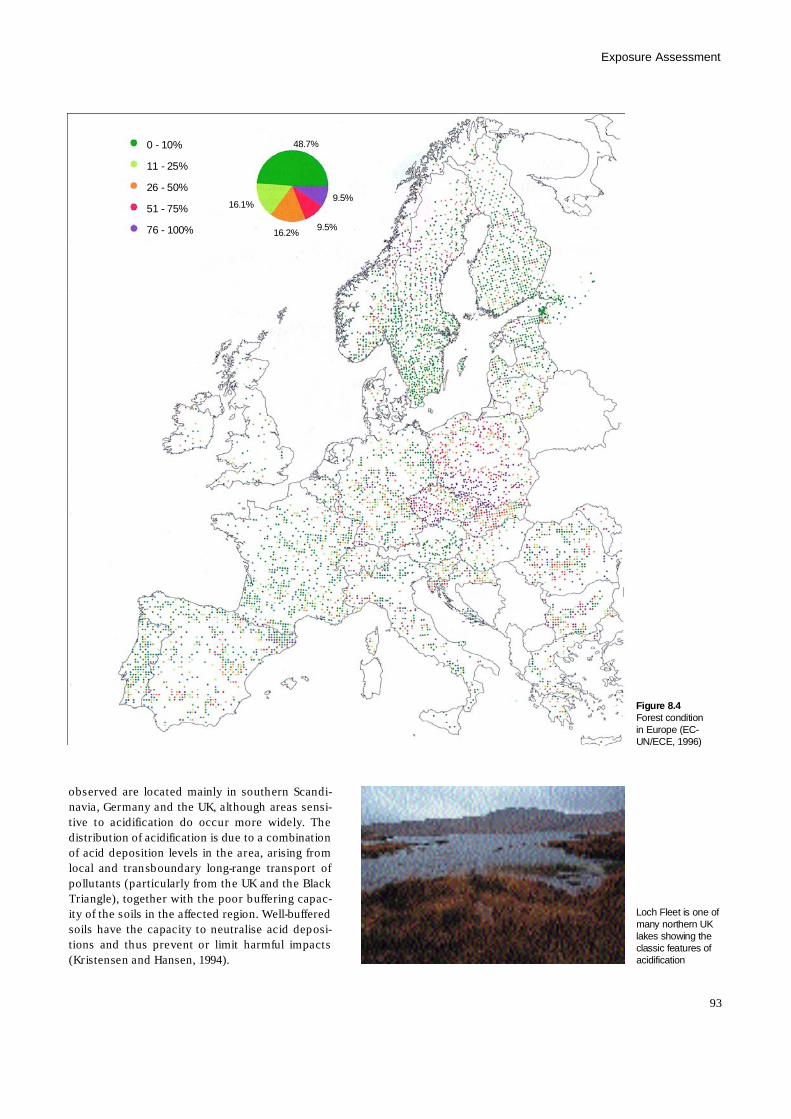
observed are located mainly in southern Scandi-navia, Germany and the UK, although areas sensi-tive to acidification do occur more widely. Thedistribution of acidification is due to a combinationof acid deposition levels in the area, arising fromlocal and transboundary long-range transport ofpollutants (particularly from the UK and the BlackTriangle), together with the poor buffering capac-ity of the soils in the affected region. Well-bufferedsoils have the capacity to neutralise acid deposi-tions and thus prevent or limit harmful impacts(Kristensen and Hansen, 1994).
93
Exposure Assessment
Figure 8.4Forest conditionin Europe (EC-UN/ECE, 1996)
Loch Fleet is one ofmany northern UKlakes showing theclassic features ofa c i d i f i c a t i o n
4 8 . 7 %
9 . 5 %
9 . 5 %
1 6 . 1 %
1 6 . 2 %
0 - 10%
11 - 25%
26 - 50%
51 - 75%
76 - 100%
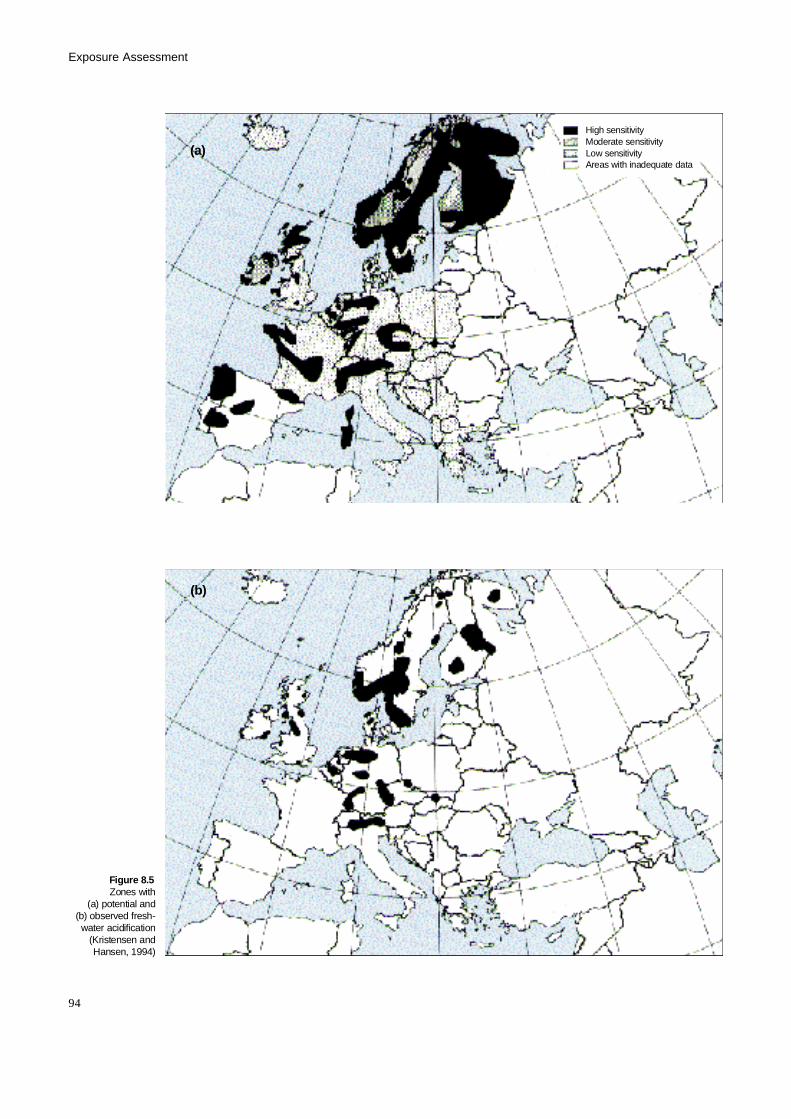
Exposure Assessment
94
High sensitivityModerate sensitivityLow sensitivityAreas with inadequate data
Figure 8.5Zones with
(a) potential and(b) observed fresh-water acidification
(Kristensen andHansen, 1994)
( a )
( b )
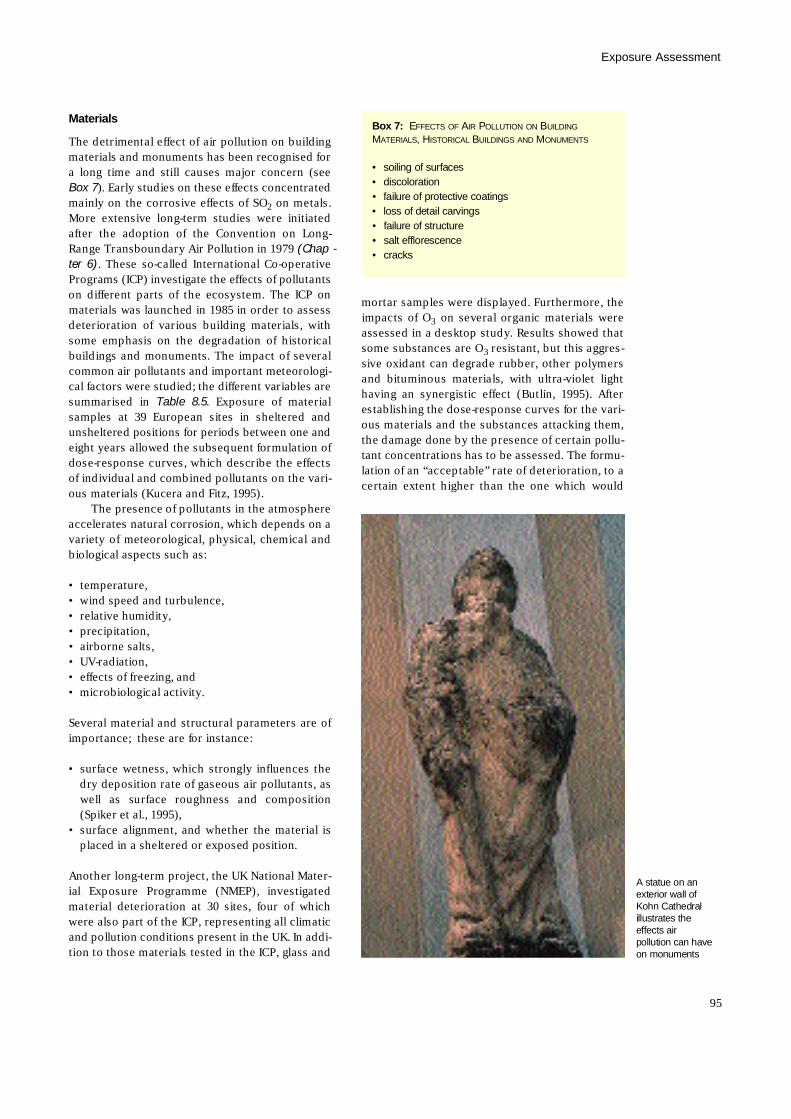
M a t e r i a l s
The detrimental effect of air pollution on buildingmaterials and monuments has been recognised fora long time and still causes major concern (seeBox 7). Early studies on these effects concentratedmainly on the corrosive effects of SO2 on metals.More extensive long-term studies were initiatedafter the adoption of the Convention on Long-Range Transboundary Air Pollution in 1979 ( C h a p -ter 6). These so-called International Co-operativePrograms (ICP) investigate the effects of pollutantson different parts of the ecosystem. The ICP onmaterials was launched in 1985 in order to assessdeterioration of various building materials, withsome emphasis on the degradation of historicalbuildings and monuments. The impact of severalcommon air pollutants and important meteorologi-cal factors were studied; the different variables aresummarised in Table 8.5. Exposure of materialsamples at 39 European sites in sheltered andunsheltered positions for periods between one andeight years allowed the subsequent formulation ofdose-response curves, which describe the effectsof individual and combined pollutants on the vari-ous materials (Kucera and Fitz, 1995).
The presence of pollutants in the atmosphereaccelerates natural corrosion, which depends on avariety of meteorological, physical, chemical andbiological aspects such as:
• t e m p e r a t u r e ,• wind speed and turbulence,• relative humidity,• p r e c i p i t a t i o n ,• airborne salts,• U V - r a d i a t i o n ,• effects of freezing, and• microbiological activity.
Several material and structural parameters are ofimportance; these are for instance:
• surface wetness, which strongly influences thedry deposition rate of gaseous air pollutants, aswell as surface roughness and composition(Spiker et al., 1995),
• surface alignment, and whether the material isplaced in a sheltered or exposed position.
Another long-term project, the UK National Mater-ial Exposure Programme (NMEP), investigatedmaterial deterioration at 30 sites, four of whichwere also part of the ICP, representing all climaticand pollution conditions present in the UK. In addi-tion to those materials tested in the ICP, glass and
mortar samples were displayed. Furthermore, theimpacts of O3 on several organic materials wereassessed in a desktop study. Results showed thatsome substances are O3 resistant, but this aggres-sive oxidant can degrade rubber, other polymersand bituminous materials, with ultra-violet lighthaving an synergistic effect (Butlin, 1995). Afterestablishing the dose-response curves for the vari-ous materials and the substances attacking them,the damage done by the presence of certain pollu-tant concentrations has to be assessed. The formu-lation of an “acceptable” rate of deterioration, to acertain extent higher than the one which would
95
Exposure Assessment
Box 7: EF F E C T S O F AI R PO L L U T I O N O N BU I L D I N G
MA T E R I A L S, HI S T O R I C A L BU I L D I N G S A N D MO N U M E N T S
• soiling of surfaces• d i s c o l o r a t i o n• failure of protective coatings• loss of detail carvings• failure of structure• salt efflorescence• c r a c k s
A statue on anexterior wall ofKohn Cathedralillustrates theeffects airpollution can haveon monuments
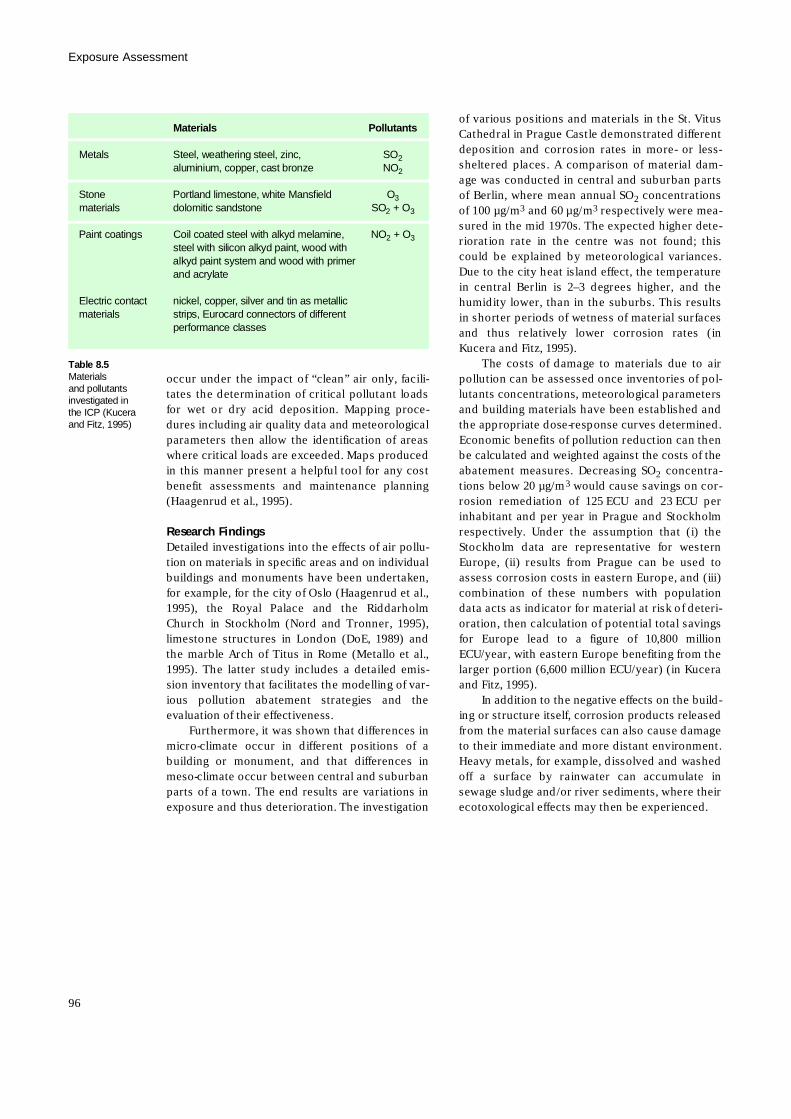
occur under the impact of “clean” air only, facili-tates the determination of critical pollutant loadsfor wet or dry acid deposition. Mapping proce-dures including air quality data and meteorologicalparameters then allow the identification of areaswhere critical loads are exceeded. Maps producedin this manner present a helpful tool for any costbenefit assessments and maintenance planning(Haagenrud et al., 1995).
Research FindingsDetailed investigations into the effects of air pollu-tion on materials in specific areas and on individualbuildings and monuments have been undertaken,for example, for the city of Oslo (Haagenrud et al.,1995), the Royal Palace and the RiddarholmChurch in Stockholm (Nord and Tronner, 1995),limestone structures in London (DoE, 1989) andthe marble Arch of Titus in Rome (Metallo et al.,1995). The latter study includes a detailed emis-sion inventory that facilitates the modelling of var-ious pollution abatement strategies and theevaluation of their effectiveness.
Furthermore, it was shown that differences inmicro-climate occur in different positions of abuilding or monument, and that differences inmeso-climate occur between central and suburbanparts of a town. The end results are variations inexposure and thus deterioration. The investigation
of various positions and materials in the St. VitusCathedral in Prague Castle demonstrated differentdeposition and corrosion rates in more- or less-sheltered places. A comparison of material dam-age was conducted in central and suburban partsof Berlin, where mean annual SO2 c o n c e n t r a t i o n sof 100 µg/m3 and 60 µg/m3 respectively were mea-sured in the mid 1970s. The expected higher dete-rioration rate in the centre was not found; thiscould be explained by meteorological variances.Due to the city heat island effect, the temperaturein central Berlin is 2–3 degrees higher, and thehumidity lower, than in the suburbs. This resultsin shorter periods of wetness of material surfacesand thus relatively lower corrosion rates (inKucera and Fitz, 1995).
The costs of damage to materials due to airpollution can be assessed once inventories of pol-lutants concentrations, meteorological parametersand building materials have been established andthe appropriate dose-response curves determined.Economic benefits of pollution reduction can thenbe calculated and weighted against the costs of theabatement measures. Decreasing SO2 c o n c e n t r a-tions below 20 µg/m3 would cause savings on cor-rosion remediation of 125 ECU and 23 ECU perinhabitant and per year in Prague and Stockholmrespectively. Under the assumption that (i) theStockholm data are representative for westernEurope, (ii) results from Prague can be used toassess corrosion costs in eastern Europe, and (iii)combination of these numbers with populationdata acts as indicator for material at risk of deteri-oration, then calculation of potential total savingsfor Europe lead to a figure of 10,800 millionECU/year, with eastern Europe benefiting from thelarger portion (6,600 million ECU/year) (in Kuceraand Fitz, 1995).
In addition to the negative effects on the build-ing or structure itself, corrosion products releasedfrom the material surfaces can also cause damageto their immediate and more distant environment.Heavy metals, for example, dissolved and washedoff a surface by rainwater can accumulate insewage sludge and/or river sediments, where theirecotoxological effects may then be experienced.
Exposure Assessment
96
M a t e r i a l s P o l l u t a n t s
M e t a l s Steel, weathering steel, zinc, S O2aluminium, copper, cast bronze N O2
S t o n e Portland limestone, white Mansfield O3m a t e r i a l s dolomitic sandstone S O2 + O3
Paint coatings Coil coated steel with alkyd melamine, N O2 + O3steel with silicon alkyd paint, wood with alkyd paint system and wood with primer and acrylate
Electric contact nickel, copper, silver and tin as metallicm a t e r i a l s strips, Eurocard connectors of different
performance classes
Table 8.5M a t e r i a l sand pollutantsinvestigated inthe ICP (Kuceraand Fitz, 1995)
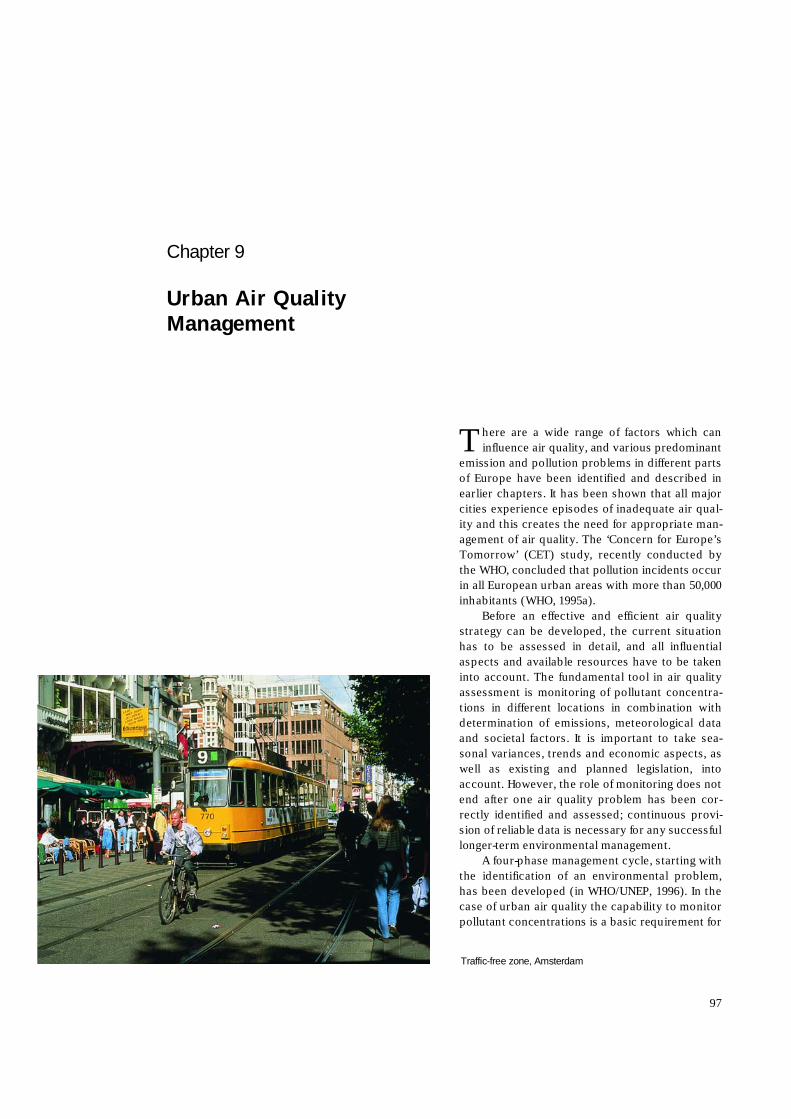
There are a wide range of factors which caninfluence air quality, and various predominant
emission and pollution problems in different partsof Europe have been identified and described inearlier chapters. It has been shown that all majorcities experience episodes of inadequate air qual-ity and this creates the need for appropriate man-agement of air quality. The ‘Concern for Europe’sTomorrow’ (CET) study, recently conducted bythe WHO, concluded that pollution incidents occurin all European urban areas with more than 50,000inhabitants (WHO, 1995a).
Before an effective and efficient air qualitystrategy can be developed, the current situationhas to be assessed in detail, and all influentialaspects and available resources have to be takeninto account. The fundamental tool in air qualityassessment is monitoring of pollutant concentra-tions in different locations in combination withdetermination of emissions, meteorological dataand societal factors. It is important to take sea-sonal variances, trends and economic aspects, aswell as existing and planned legislation, intoaccount. However, the role of monitoring does notend after one air quality problem has been cor-rectly identified and assessed; continuous provi-sion of reliable data is necessary for any successfullonger-term environmental management.
A four-phase management cycle, starting withthe identification of an environmental problem,has been developed (in WHO/UNEP, 1996). In thecase of urban air quality the capability to monitorpollutant concentrations is a basic requirement for
Chapter 9
Urban Air Quality M a n a g e m e n t
97
Traffic-free zone, Amsterdam
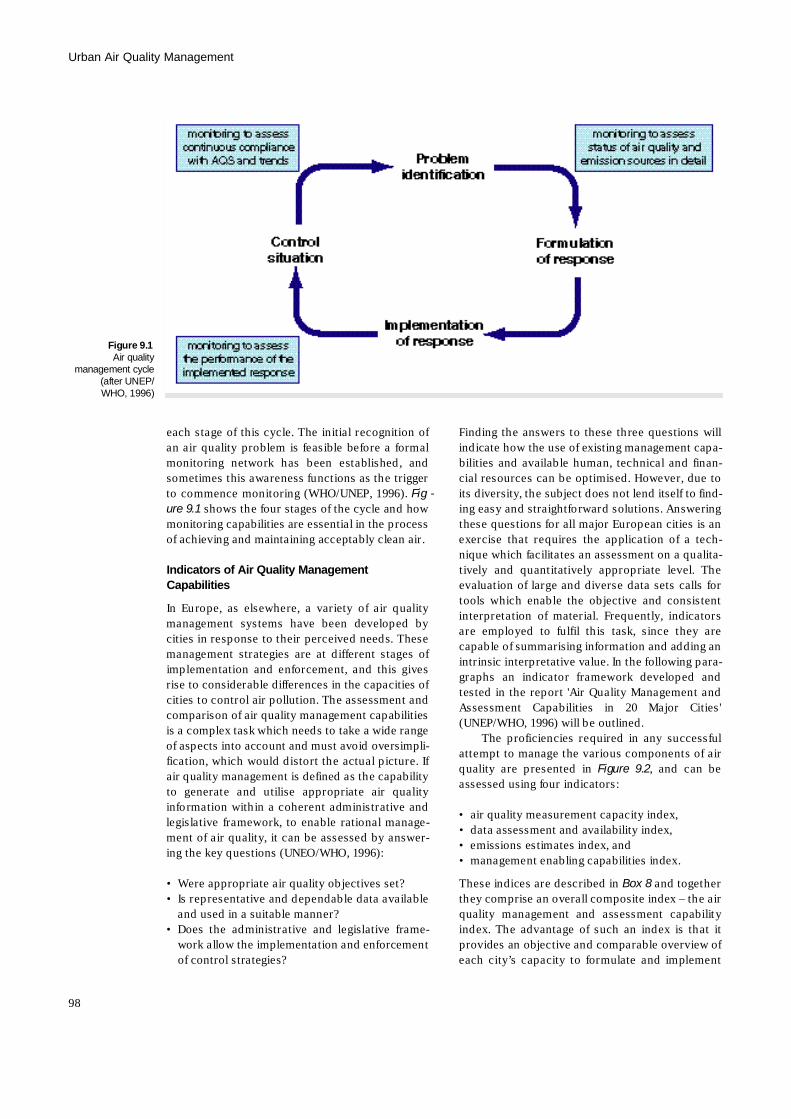
each stage of this cycle. The initial recognition ofan air quality problem is feasible before a formalmonitoring network has been established, andsometimes this awareness functions as the triggerto commence monitoring (WHO/UNEP, 1996). F i g -ure 9.1 shows the four stages of the cycle and howmonitoring capabilities are essential in the processof achieving and maintaining acceptably clean air.
Indicators of Air Quality Management C a p a b i l i t i e s
In Europe, as elsewhere, a variety of air qualitymanagement systems have been developed bycities in response to their perceived needs. Thesemanagement strategies are at different stages ofimplementation and enforcement, and this givesrise to considerable differences in the capacities ofcities to control air pollution. The assessment andcomparison of air quality management capabilitiesis a complex task which needs to take a wide rangeof aspects into account and must avoid oversimpli-fication, which would distort the actual picture. Ifair quality management is defined as the capabilityto generate and utilise appropriate air qualityinformation within a coherent administrative andlegislative framework, to enable rational manage-ment of air quality, it can be assessed by answer-ing the key questions (UNEO/WHO, 1996):
• Were appropriate air quality objectives set?• Is representative and dependable data available
and used in a suitable manner?• Does the administrative and legislative frame-
work allow the implementation and enforcementof control strategies?
Finding the answers to these three questions willindicate how the use of existing management capa-bilities and available human, technical and finan-cial resources can be optimised. However, due toits diversity, the subject does not lend itself to find-ing easy and straightforward solutions. Answeringthese questions for all major European cities is anexercise that requires the application of a tech-nique which facilitates an assessment on a qualita-tively and quantitatively appropriate level. Theevaluation of large and diverse data sets calls fortools which enable the objective and consistentinterpretation of material. Frequently, indicatorsare employed to fulfil this task, since they arecapable of summarising information and adding anintrinsic interpretative value. In the following para-graphs an indicator framework developed andtested in the report 'Air Quality Management andAssessment Capabilities in 20 Major Cities'(UNEP/WHO, 1996) will be outlined.
The proficiencies required in any successfulattempt to manage the various components of airquality are presented in Figure 9.2, and can beassessed using four indicators:
• air quality measurement capacity index,• data assessment and availability index,• emissions estimates index, and• management enabling capabilities index.
These indices are described in Box 8 and togetherthey comprise an overall composite index – the airquality management and assessment capabilityindex. The advantage of such an index is that itprovides an objective and comparable overview ofeach city’s capacity to formulate and implement
Urban Air Quality Management
98
Figure 9.1Air quality
management cycle(after UNEP/WHO, 1996)
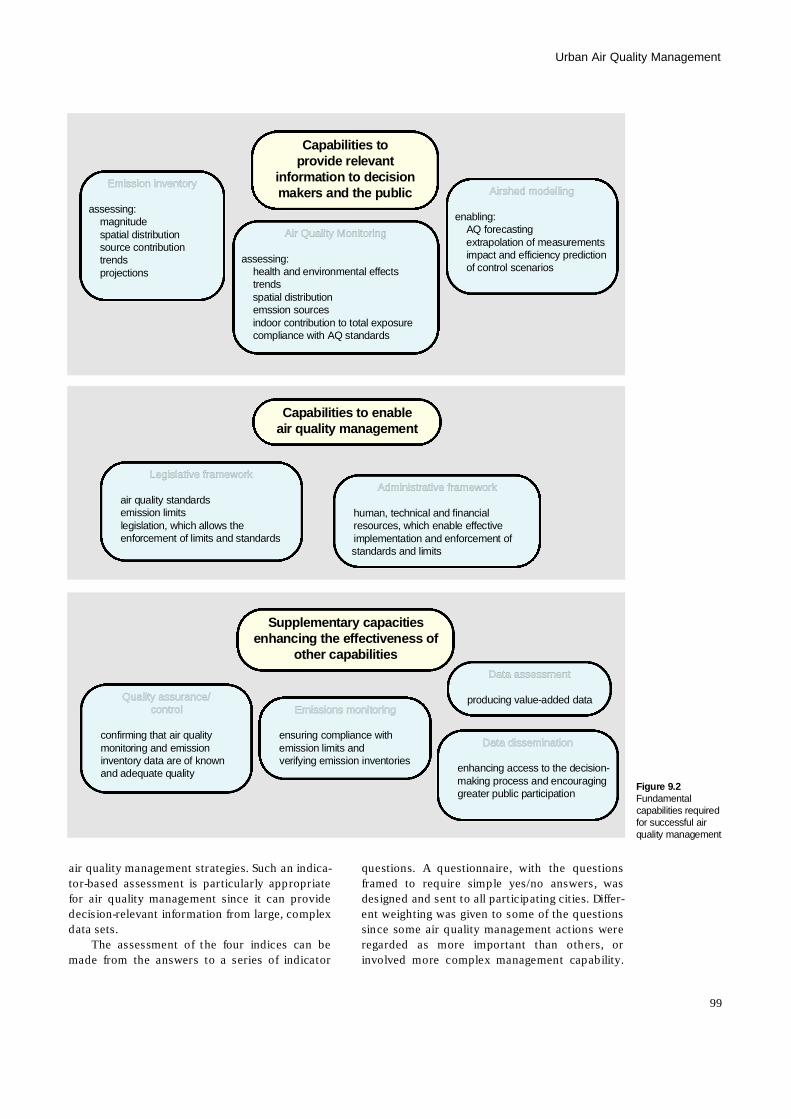
air quality management strategies. Such an indica-tor-based assessment is particularly appropriatefor air quality management since it can providedecision-relevant information from large, complexdata sets.
The assessment of the four indices can bemade from the answers to a series of indicator
questions. A questionnaire, with the questionsframed to require simple yes/no answers, wasdesigned and sent to all participating cities. Differ-ent weighting was given to some of the questionssince some air quality management actions wereregarded as more important than others, orinvolved more complex management capability.
99
Urban Air Quality Management
Capabilities to provide relevant
information to decisionmakers and the public
Air Quality Monitoring
a s s e s s i n g :health and environmental effectst r e n d sspatial distribution emssion sourcesindoor contribution to total exposurecompliance with AQ standards
Emission inventory
a s s e s s i n g :m a g n i t u d espatial distributionsource contributiont r e n d sp r o j e c t i o n s
Airshed modelling
e n a b l i n g :AQ forecastingextrapolation of measurementsimpact and efficiency prediction of control scenarios
Capabilities to enableair quality management
Legislative framework
air quality standardsemission limitslegislation, which allows the enforcement of limits and standards
Administrative framework
human, technical and financial resources, which enable effective implementation and enforcement of standards and limits
Supplementary capacitiesenhancing the effectiveness of
other capabilities
Quality assurance/control
confirming that air quality monitoring and emission inventory data are of known and adequate quality
Data assessment
producing value-added data
Data dissemination
enhancing access to the decision-making process and encouraging greater public participation
Emissions monitoring
ensuring compliance with emission limits and verifying emission inventories
Figure 9.2F u n d a m e n t a lcapabilities requiredfor successful airquality management
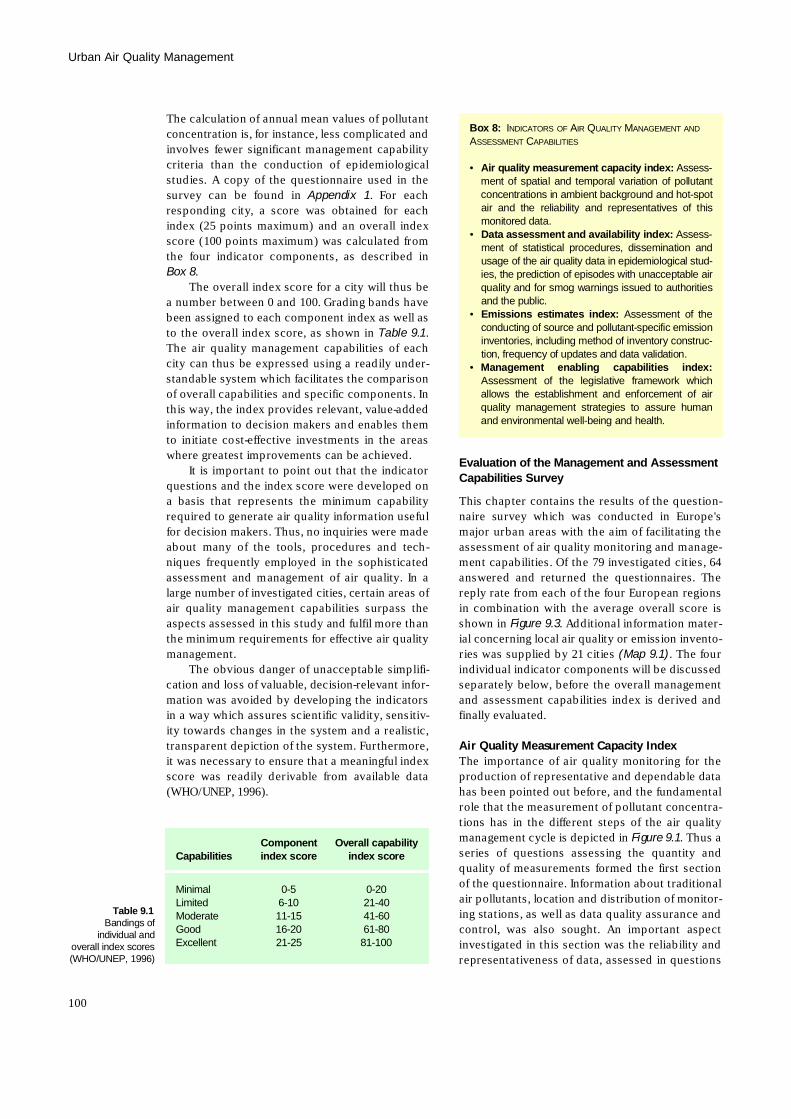
The calculation of annual mean values of pollutantconcentration is, for instance, less complicated andinvolves fewer significant management capabilitycriteria than the conduction of epidemiologicalstudies. A copy of the questionnaire used in thesurvey can be found in Appendix 1. For eachresponding city, a score was obtained for eachindex (25 points maximum) and an overall indexscore (100 points maximum) was calculated fromthe four indicator components, as described inBox 8.
The overall index score for a city will thus bea number between 0 and 100. Grading bands havebeen assigned to each component index as well asto the overall index score, as shown in Table 9.1.The air quality management capabilities of eachcity can thus be expressed using a readily under-standable system which facilitates the comparisonof overall capabilities and specific components. Inthis way, the index provides relevant, value-addedinformation to decision makers and enables themto initiate cost-effective investments in the areaswhere greatest improvements can be achieved.
It is important to point out that the indicatorquestions and the index score were developed ona basis that represents the minimum capabilityrequired to generate air quality information usefulfor decision makers. Thus, no inquiries were madeabout many of the tools, procedures and tech-niques frequently employed in the sophisticatedassessment and management of air quality. In alarge number of investigated cities, certain areas ofair quality management capabilities surpass theaspects assessed in this study and fulfil more thanthe minimum requirements for effective air qualitym a n a g e m e n t .
The obvious danger of unacceptable simplifi-cation and loss of valuable, decision-relevant infor-mation was avoided by developing the indicatorsin a way which assures scientific validity, sensitiv-ity towards changes in the system and a realistic,transparent depiction of the system. Furthermore,it was necessary to ensure that a meaningful indexscore was readily derivable from available data(WHO/UNEP, 1996).
Evaluation of the Management and AssessmentCapabilities Survey
This chapter contains the results of the question-naire survey which was conducted in Europe'smajor urban areas with the aim of facilitating theassessment of air quality monitoring and manage-ment capabilities. Of the 79 investigated cities, 64answered and returned the questionnaires. Thereply rate from each of the four European regionsin combination with the average overall score isshown in Figure 9.3. Additional information mater-ial concerning local air quality or emission invento-ries was supplied by 21 cities (Map 9.1). The fourindividual indicator components will be discussedseparately below, before the overall managementand assessment capabilities index is derived andfinally evaluated.
Air Quality Measurement Capacity IndexThe importance of air quality monitoring for theproduction of representative and dependable datahas been pointed out before, and the fundamentalrole that the measurement of pollutant concentra-tions has in the different steps of the air qualitymanagement cycle is depicted in Figure 9.1. Thus aseries of questions assessing the quantity andquality of measurements formed the first sectionof the questionnaire. Information about traditionalair pollutants, location and distribution of monitor-ing stations, as well as data quality assurance andcontrol, was also sought. An important aspectinvestigated in this section was the reliability andrepresentativeness of data, assessed in questions
Urban Air Quality Management
100
Box 8: IN D I C A T O R S O F AI R QU A L I T Y MA N A G E M E N T A N D
AS S E S S M E N T CA P A B I L I T I E S
• Air quality measurement capacity index: A s s e s s-ment of spatial and temporal variation of pollutantconcentrations in ambient background and hot-spotair and the reliability and representatives of thismonitored data.
• Data assessment and availability index: A s s e s s-ment of statistical procedures, dissemination andusage of the air quality data in epidemiological stud-ies, the prediction of episodes with unacceptable airquality and for smog warnings issued to authoritiesand the public.
• Emissions estimates index: Assessment of theconducting of source and pollutant-specific emissioninventories, including method of inventory construc-tion, frequency of updates and data validation.
• Management enabling capabilities index:Assessment of the legislative framework whichallows the establishment and enforcement of airquality management strategies to assure humanand environmental well-being and health.
C o m p o n e n t Overall capabilityC a p a b i l i t i e s index score index score
M i n i m a l 0 - 5 0 - 2 0L i m i t e d 6 - 1 0 2 1 - 4 0M o d e r a t e 1 1 - 1 5 4 1 - 6 0G o o d 1 6 - 2 0 6 1 - 8 0E x c e l l e n t 2 1 - 2 5 8 1 - 1 0 0
Table 9.1Bandings of
individual andoverall index scores(WHO/UNEP, 1996)
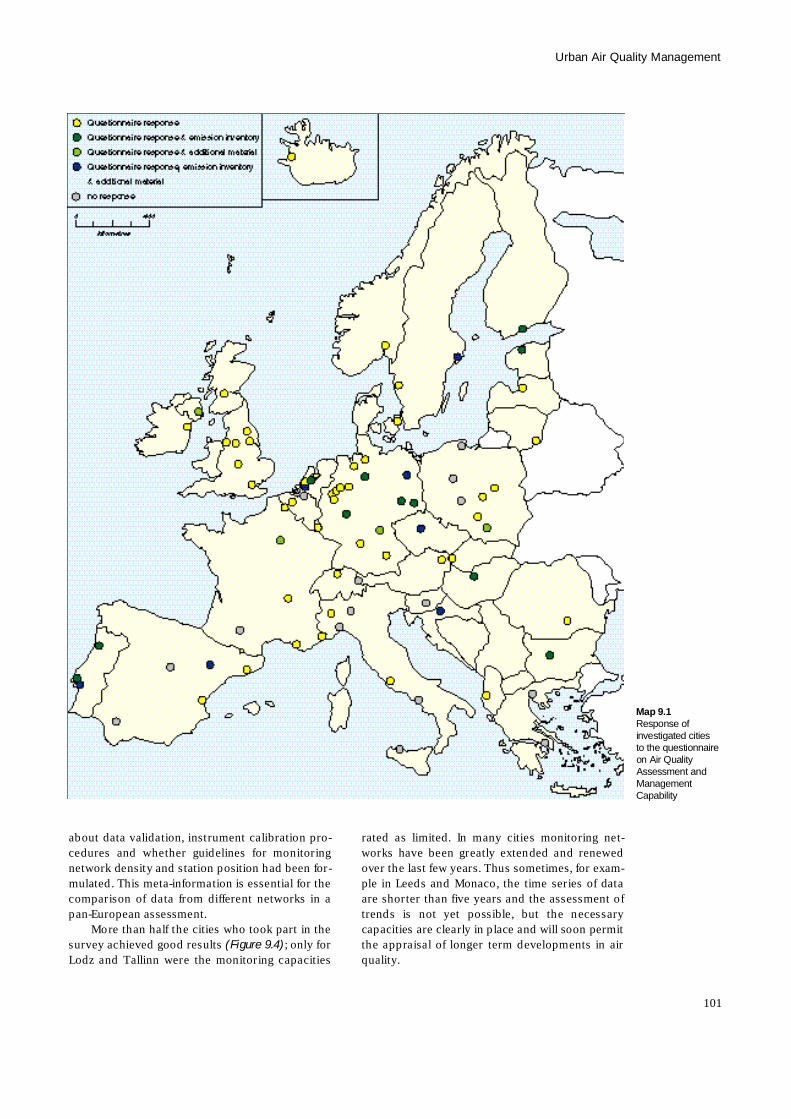
about data validation, instrument calibration pro-cedures and whether guidelines for monitoringnetwork density and station position had been for-mulated. This meta-information is essential for thecomparison of data from different networks in apan-European assessment.
More than half the cities who took part in thesurvey achieved good results (Figure 9.4); only forLodz and Tallinn were the monitoring capacities
rated as limited. In many cities monitoring net-works have been greatly extended and renewedover the last few years. Thus sometimes, for exam-ple in Leeds and Monaco, the time series of dataare shorter than five years and the assessment oftrends is not yet possible, but the necessarycapacities are clearly in place and will soon permitthe appraisal of longer term developments in airq u a l i t y .
101
Urban Air Quality Management
Map 9.1Response of investigated citiesto the questionnaireon Air QualityAssessment andM a n a g e m e n tC a p a b i l i t y
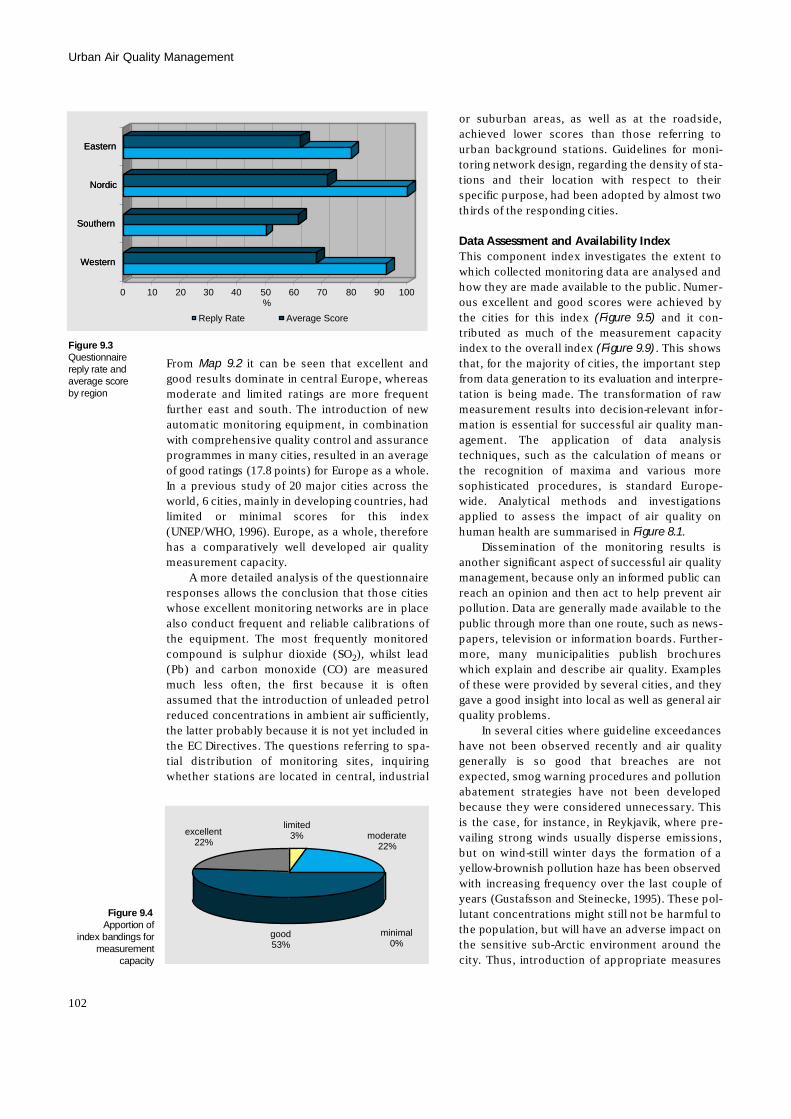
From Map 9.2 it can be seen that excellent andgood results dominate in central Europe, whereasmoderate and limited ratings are more frequentfurther east and south. The introduction of newautomatic monitoring equipment, in combinationwith comprehensive quality control and assuranceprogrammes in many cities, resulted in an averageof good ratings (17.8 points) for Europe as a whole.In a previous study of 20 major cities across theworld, 6 cities, mainly in developing countries, hadlimited or minimal scores for this index(UNEP/WHO, 1996). Europe, as a whole, thereforehas a comparatively well developed air qualitymeasurement capacity.
A more detailed analysis of the questionnaireresponses allows the conclusion that those citieswhose excellent monitoring networks are in placealso conduct frequent and reliable calibrations ofthe equipment. The most frequently monitoredcompound is sulphur dioxide (SO2), whilst lead(Pb) and carbon monoxide (CO) are measuredmuch less often, the first because it is oftenassumed that the introduction of unleaded petrolreduced concentrations in ambient air sufficiently,the latter probably because it is not yet included inthe EC Directives. The questions referring to spa-tial distribution of monitoring sites, inquiringwhether stations are located in central, industrial
or suburban areas, as well as at the roadside,achieved lower scores than those referring tourban background stations. Guidelines for moni-toring network design, regarding the density of sta-tions and their location with respect to theirspecific purpose, had been adopted by almost twothirds of the responding cities.
Data Assessment and Availability IndexThis component index investigates the extent towhich collected monitoring data are analysed andhow they are made available to the public. Numer-ous excellent and good scores were achieved bythe cities for this index (Figure 9.5) and it con-tributed as much of the measurement capacityindex to the overall index (Figure 9.9). This showsthat, for the majority of cities, the important stepfrom data generation to its evaluation and interpre-tation is being made. The transformation of rawmeasurement results into decision-relevant infor-mation is essential for successful air quality man-agement. The application of data analysistechniques, such as the calculation of means orthe recognition of maxima and various moresophisticated procedures, is standard Europe-wide. Analytical methods and investigationsapplied to assess the impact of air quality onhuman health are summarised in Figure 8.1.
Dissemination of the monitoring results isanother significant aspect of successful air qualitymanagement, because only an informed public canreach an opinion and then act to help prevent airpollution. Data are generally made available to thepublic through more than one route, such as news-papers, television or information boards. Further-more, many municipalities publish brochureswhich explain and describe air quality. Examplesof these were provided by several cities, and theygave a good insight into local as well as general airquality problems.
In several cities where guideline exceedanceshave not been observed recently and air qualitygenerally is so good that breaches are notexpected, smog warning procedures and pollutionabatement strategies have not been developedbecause they were considered unnecessary. Thisis the case, for instance, in Reykjavik, where pre-vailing strong winds usually disperse emissions,but on wind-still winter days the formation of ay e llow-brownish pollution haze has been observedwith increasing frequency over the last couple ofyears (Gustafsson and Steinecke, 1995). These pol-lutant concentrations might still not be harmful tothe population, but will have an adverse impact onthe sensitive sub-Arctic environment around thecity. Thus, introduction of appropriate measures
Urban Air Quality Management
102
Figure 9.4Apportion of
index bandings form e a s u r e m e n t
c a p a c i t y
Eastern
Nordic
Southern
Western
0 10 20 30 40 50 60 70 80 90 100%
Eastern
Nordic
Southern
Western
Reply Rate Average Score
Figure 9.3Q u e s t i o n n a i r ereply rate andaverage scoreby region
limited3%
good53%
moderate22%
minimal0%
excellent22%
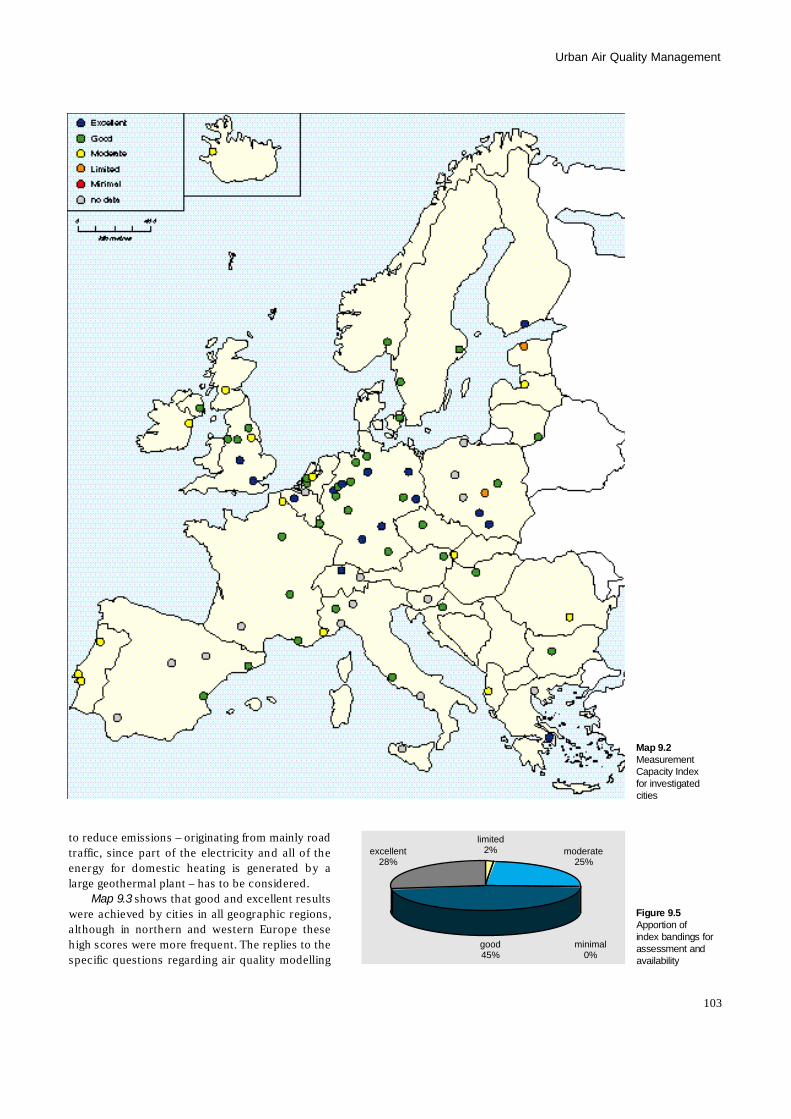
to reduce emissions – originating from mainly roadtraffic, since part of the electricity and all of theenergy for domestic heating is generated by alarge geothermal plant – has to be considered.
Map 9.3 shows that good and excellent resultswere achieved by cities in all geographic regions,although in northern and western Europe thesehigh scores were more frequent. The replies to thespecific questions regarding air quality modelling
103
Urban Air Quality Management
Figure 9.5Apportion ofindex bandings forassessment anda v a i l a b i l i t y
good45%
excellent28%
limited2%
minimal0%
moderate25%
Map 9.2M e a s u r e m e n tCapacity Indexfor investigatedc i t i e s
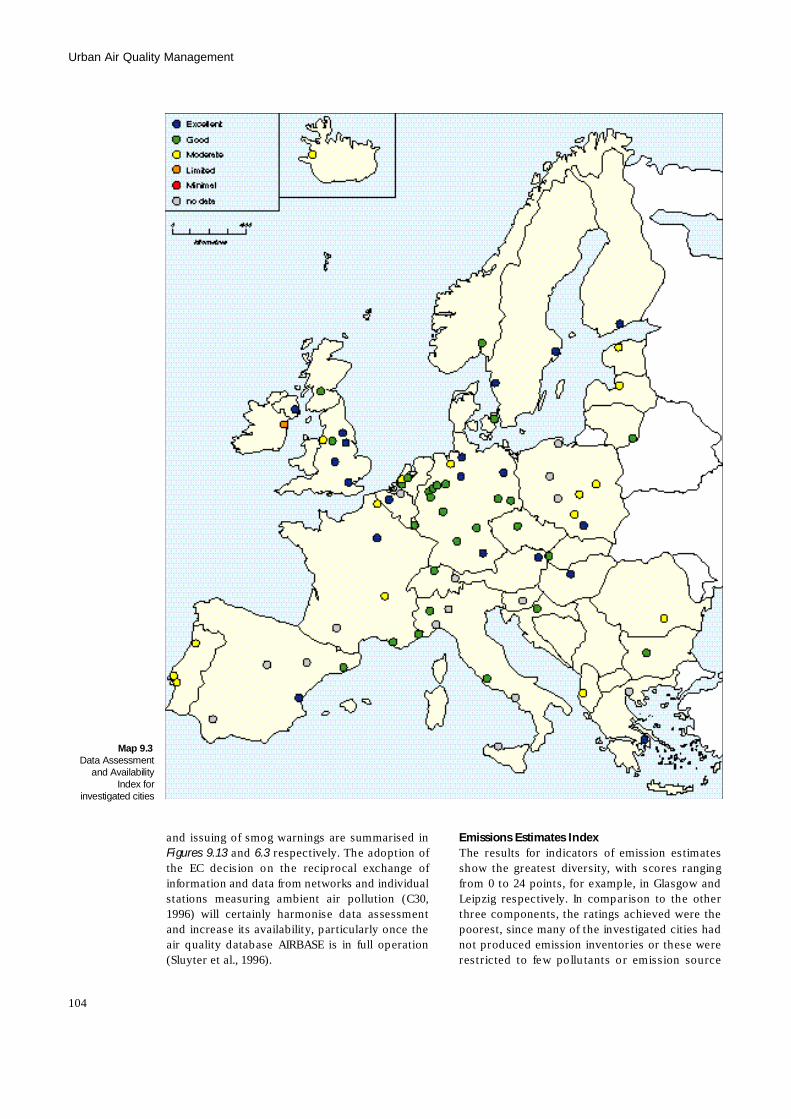
and issuing of smog warnings are summarised inFigures 9.13 and 6 . 3 respectively. The adoption ofthe EC decision on the reciprocal exchange ofinformation and data from networks and individualstations measuring ambient air pollution (C30,1996) will certainly harmonise data assessmentand increase its availability, particularly once theair quality database AIRBASE is in full operation(Sluyter et al., 1996).
Emissions Estimates IndexThe results for indicators of emission estimatesshow the greatest diversity, with scores rangingfrom 0 to 24 points, for example, in Glasgow andLeipzig respectively. In comparison to the otherthree components, the ratings achieved were thepoorest, since many of the investigated cities hadnot produced emission inventories or these wererestricted to few pollutants or emission source
Urban Air Quality Management
104
Map 9.3Data Assessment
and AvailabilityIndex for
investigated cities
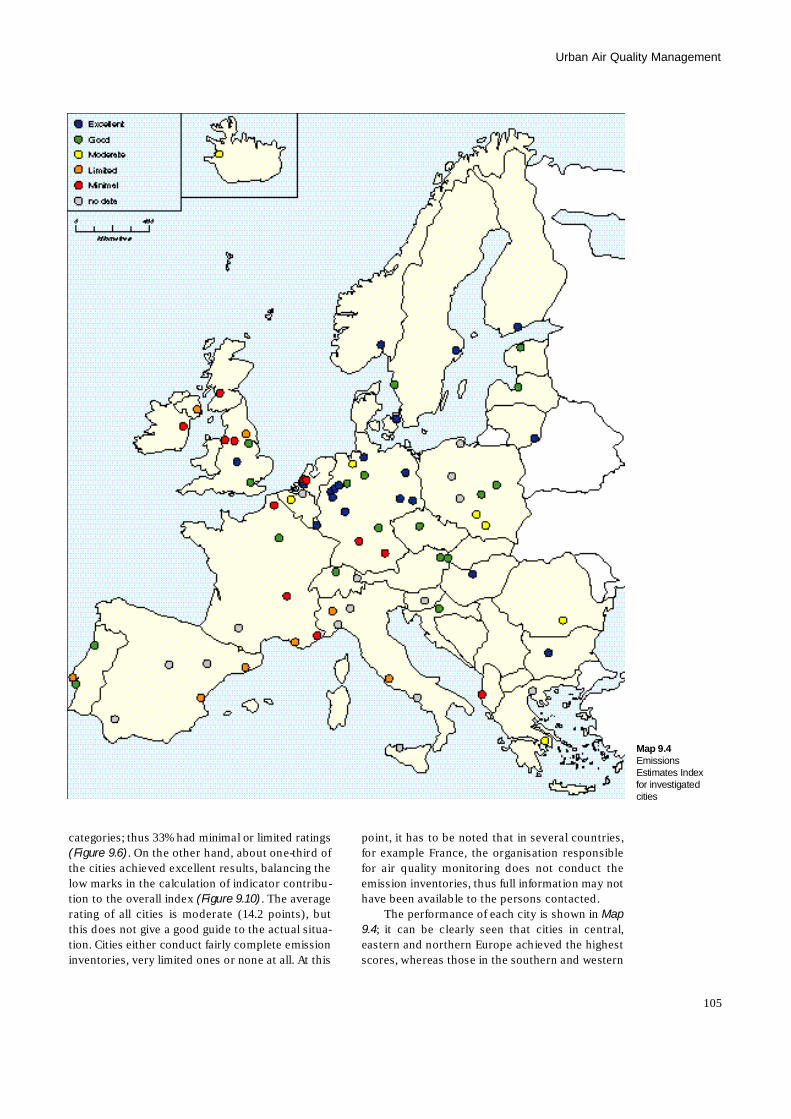
categories; thus 33% had minimal or limited ratings(Figure 9.6). On the other hand, about one-third ofthe cities achieved excellent results, balancing thelow marks in the calculation of indicator contribu-tion to the overall index (Figure 9.10). The averagerating of all cities is moderate (14.2 points), butthis does not give a good guide to the actual situa-tion. Cities either conduct fairly complete emissioninventories, very limited ones or none at all. At this
point, it has to be noted that in several countries,for example France, the organisation responsiblefor air quality monitoring does not conduct theemission inventories, thus full information may nothave been available to the persons contacted.
The performance of each city is shown in M a p9 . 4; it can be clearly seen that cities in central,eastern and northern Europe achieved the highestscores, whereas those in the southern and western
105
Urban Air Quality Management
Map 9.4E m i s s i o n sEstimates Indexfor investigatedc i t i e s
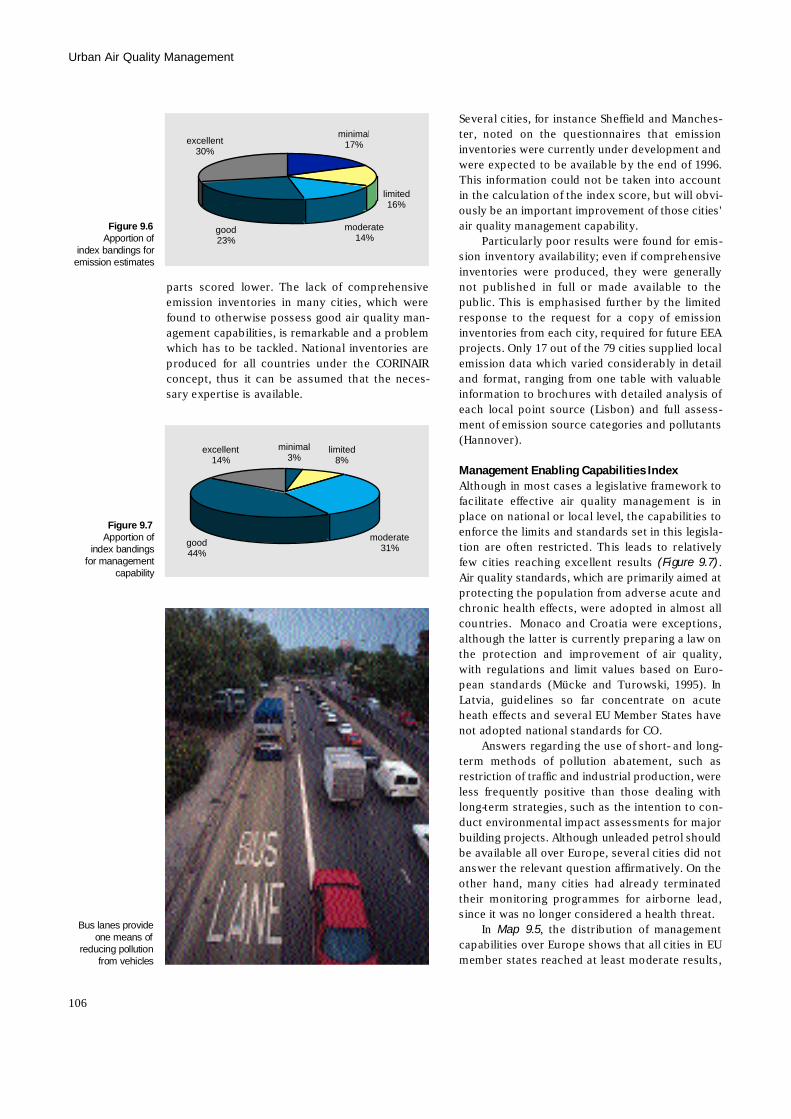
parts scored lower. The lack of comprehensiveemission inventories in many cities, which werefound to otherwise possess good air quality man-agement capabilities, is remarkable and a problemwhich has to be tackled. National inventories areproduced for all countries under the CORINAIRconcept, thus it can be assumed that the neces-sary expertise is available.
Several cities, for instance Sheffield and Manches-ter, noted on the questionnaires that emissioninventories were currently under development andwere expected to be available by the end of 1996.This information could not be taken into accountin the calculation of the index score, but will obvi-ously be an important improvement of those cities'air quality management capability.
Particularly poor results were found for emis-sion inventory availability; even if comprehensiveinventories were produced, they were generallynot published in full or made available to thepublic. This is emphasised further by the limitedresponse to the request for a copy of emissioninventories from each city, required for future EEAprojects. Only 17 out of the 79 cities supplied localemission data which varied considerably in detailand format, ranging from one table with valuableinformation to brochures with detailed analysis ofeach local point source (Lisbon) and full assess-ment of emission source categories and pollutants( H a n n o v e r ) .
Management Enabling Capabilities IndexAlthough in most cases a legislative framework tofacilitate effective air quality management is inplace on national or local level, the capabilities toenforce the limits and standards set in this legisla-tion are often restricted. This leads to relativelyfew cities reaching excellent results (Figure 9.7).Air quality standards, which are primarily aimed atprotecting the population from adverse acute andchronic health effects, were adopted in almost allcountries. Monaco and Croatia were exceptions,although the latter is currently preparing a law onthe protection and improvement of air quality,with regulations and limit values based on Euro-pean standards (Mücke and Turowski, 1995). InLatvia, guidelines so far concentrate on acuteheath effects and several EU Member States havenot adopted national standards for CO.
Answers regarding the use of short- and long-term methods of pollution abatement, such asrestriction of traffic and industrial production, wereless frequently positive than those dealing withlong-term strategies, such as the intention to con-duct environmental impact assessments for majorbuilding projects. Although unleaded petrol shouldbe available all over Europe, several cities did notanswer the relevant question affirmatively. On theother hand, many cities had already terminatedtheir monitoring programmes for airborne lead,since it was no longer considered a health threat.
In Map 9.5, the distribution of managementcapabilities over Europe shows that all cities in EUmember states reached at least moderate results,
Urban Air Quality Management
106
minimal17%
moderate14%
good23%
excellent30%
limited16%
Figure 9.6Apportion of
index bandings foremission estimates
minimal3%
limited8%
good44%
excellent14%
moderate31%
Figure 9.7Apportion of
index bandingsfor management
c a p a b i l i t y
Bus lanes provideone means of
reducing pollutionfrom vehicles
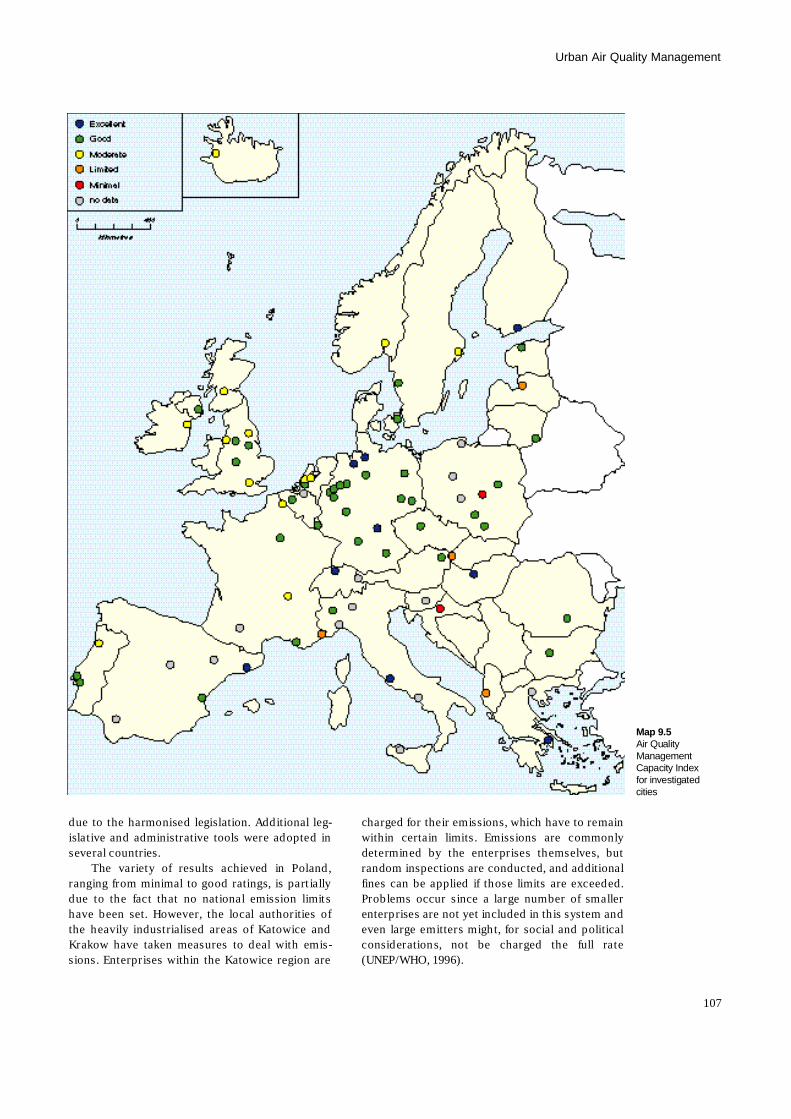
due to the harmonised legislation. Additional leg-islative and administrative tools were adopted inseveral countries.
The variety of results achieved in Poland,ranging from minimal to good ratings, is partiallydue to the fact that no national emission limitshave been set. However, the local authorities ofthe heavily industrialised areas of Katowice andKrakow have taken measures to deal with emis-sions. Enterprises within the Katowice region are
charged for their emissions, which have to remainwithin certain limits. Emissions are commonlydetermined by the enterprises themselves, butrandom inspections are conducted, and additionalfines can be applied if those limits are exceeded.Problems occur since a large number of smallerenterprises are not yet included in this system andeven large emitters might, for social and politicalconsiderations, not be charged the full rate(UNEP/WHO, 1996).
107
Urban Air Quality Management
Map 9.5Air QualityM a n a g e m e n tCapacity Indexfor investigatedc i t i e s
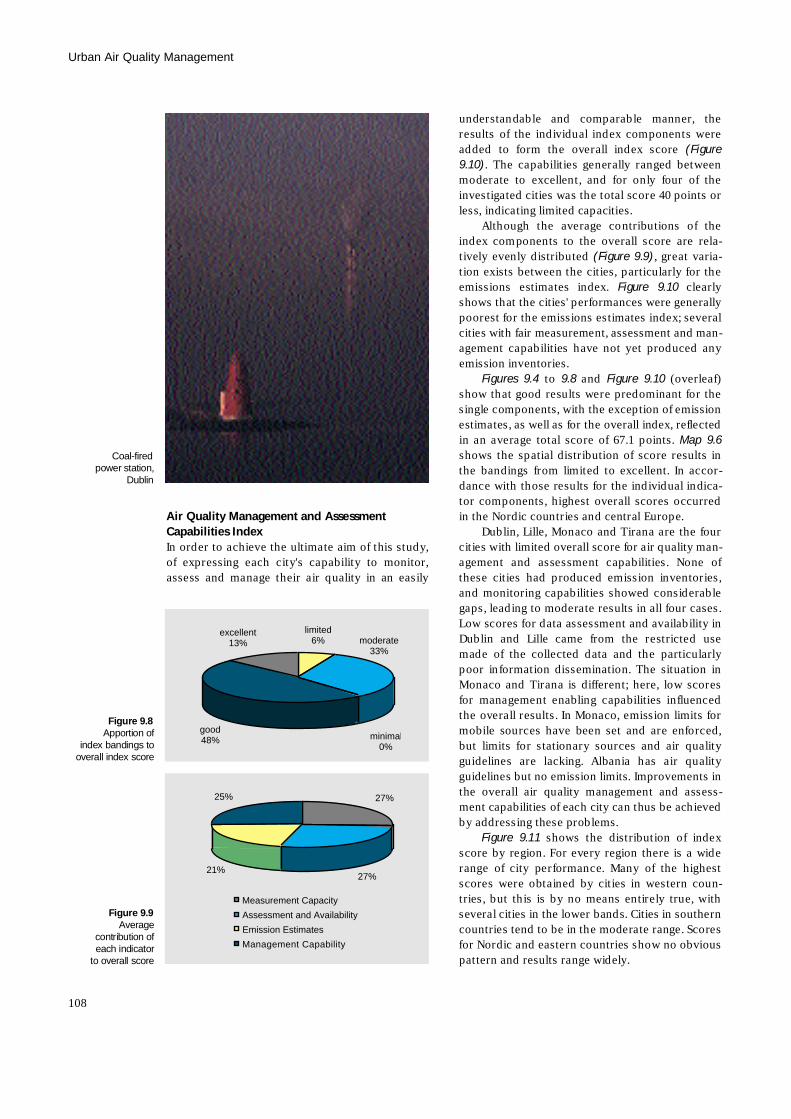
Air Quality Management and Assessment Capabilities IndexIn order to achieve the ultimate aim of this study,of expressing each city's capability to monitor,assess and manage their air quality in an easily
understandable and comparable manner, theresults of the individual index components wereadded to form the overall index score ( F i g u r e9 . 1 0 ). The capabilities generally ranged betweenmoderate to excellent, and for only four of theinvestigated cities was the total score 40 points orless, indicating limited capacities.
Although the average contributions of theindex components to the overall score are rela-tively evenly distributed (Figure 9.9), great varia-tion exists between the cities, particularly for theemissions estimates index. Figure 9.10 c l e a r l yshows that the cities' performances were generallypoorest for the emissions estimates index; severalcities with fair measurement, assessment and man-agement capabilities have not yet produced anyemission inventories.
Figures 9.4 to 9 . 8 and Figure 9.10 ( o v e r l e a f )show that good results were predominant for thesingle components, with the exception of emissionestimates, as well as for the overall index, reflectedin an average total score of 67.1 points. Map 9.6shows the spatial distribution of score results inthe bandings from limited to excellent. In accor-dance with those results for the individual indica-tor components, highest overall scores occurredin the Nordic countries and central Europe.
Dublin, Lille, Monaco and Tirana are the fourcities with limited overall score for air quality man-agement and assessment capabilities. None ofthese cities had produced emission inventories,and monitoring capabilities showed considerablegaps, leading to moderate results in all four cases.Low scores for data assessment and availability inDublin and Lille came from the restricted usemade of the collected data and the particularlypoor information dissemination. The situation inMonaco and Tirana is different; here, low scoresfor management enabling capabilities influencedthe overall results. In Monaco, emission limits formobile sources have been set and are enforced,but limits for stationary sources and air qualityguidelines are lacking. Albania has air qualityguidelines but no emission limits. Improvements inthe overall air quality management and assess-ment capabilities of each city can thus be achievedby addressing these problems.
Figure 9.11 shows the distribution of indexscore by region. For every region there is a widerange of city performance. Many of the highestscores were obtained by cities in western coun-tries, but this is by no means entirely true, withseveral cities in the lower bands. Cities in southerncountries tend to be in the moderate range. Scoresfor Nordic and eastern countries show no obviouspattern and results range widely.
Urban Air Quality Management
108
limited6%
good48%
excellent13% moderate
33%
minimal0%
Figure 9.8Apportion of
index bandings tooverall index score
Figure 9.9A v e r a g e
contribution ofeach indicator
to overall score
C o a l - f i r e dpower station,
D u b l i n
27%
27%21%
25%
Measurement Capacity
Assessment and Availability
Emission Estimates
Management Capability
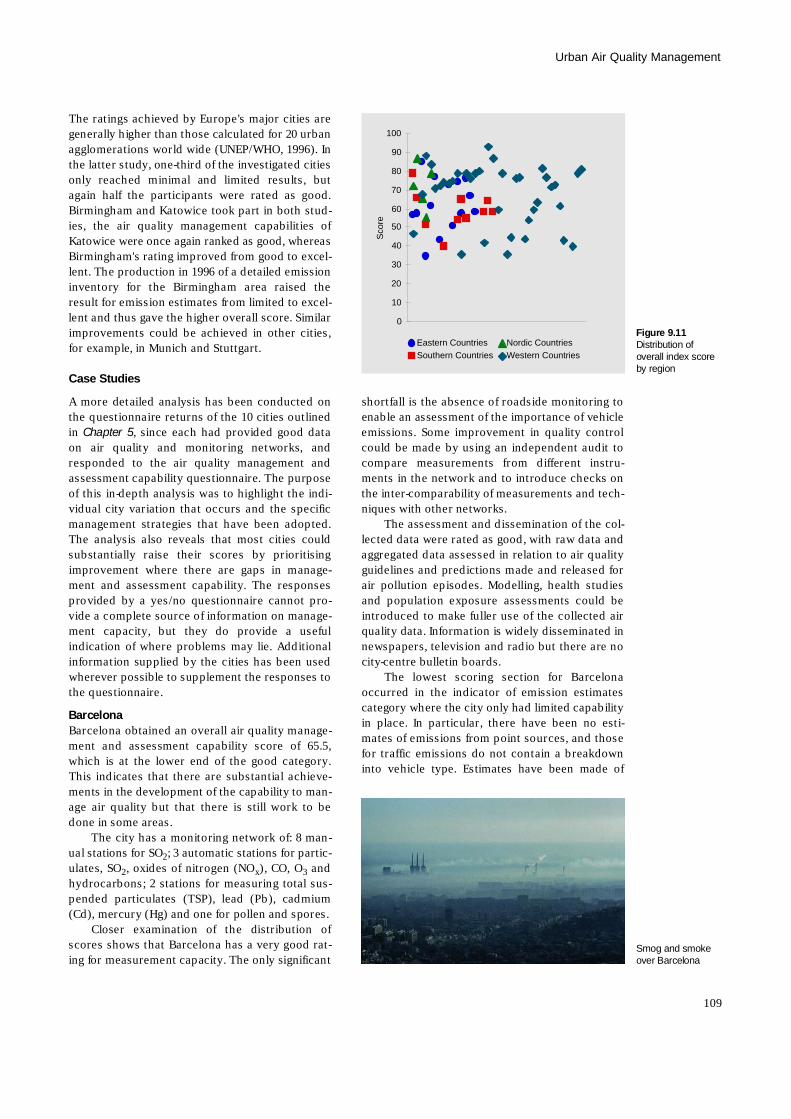
The ratings achieved by Europe's major cities aregenerally higher than those calculated for 20 urbanagglomerations world wide (UNEP/WHO, 1996). Inthe latter study, one-third of the investigated citiesonly reached minimal and limited results, butagain half the participants were rated as good.Birmingham and Katowice took part in both stud-ies, the air quality management capabilities ofKatowice were once again ranked as good, whereasBirmingham's rating improved from good to excel-lent. The production in 1996 of a detailed emissioninventory for the Birmingham area raised theresult for emission estimates from limited to excel-lent and thus gave the higher overall score. Similarimprovements could be achieved in other cities,for example, in Munich and Stuttgart.
Case Studies
A more detailed analysis has been conducted onthe questionnaire returns of the 10 cities outlinedin Chapter 5, since each had provided good dataon air quality and monitoring networks, andresponded to the air quality management andassessment capability questionnaire. The purposeof this in-depth analysis was to highlight the indi-vidual city variation that occurs and the specificmanagement strategies that have been adopted.The analysis also reveals that most cities couldsubstantially raise their scores by prioritisingimprovement where there are gaps in manage-ment and assessment capability. The responsesprovided by a yes/no questionnaire cannot pro-vide a complete source of information on manage-ment capacity, but they do provide a usefulindication of where problems may lie. Additionalinformation supplied by the cities has been usedwherever possible to supplement the responses tothe questionnaire.
B a r c e l o n aBarcelona obtained an overall air quality manage-ment and assessment capability score of 65.5,which is at the lower end of the good category.This indicates that there are substantial achieve-ments in the development of the capability to man-age air quality but that there is still work to bedone in some areas.
The city has a monitoring network of: 8 man-ual stations for SO2; 3 automatic stations for partic-ulates, SO2, oxides of nitrogen (NOx), CO, O3 a n dhydrocarbons; 2 stations for measuring total sus-pended particulates (TSP), lead (Pb), cadmium(Cd), mercury (Hg) and one for pollen and spores.
Closer examination of the distribution ofscores shows that Barcelona has a very good rat-ing for measurement capacity. The only significant
shortfall is the absence of roadside monitoring toenable an assessment of the importance of vehicleemissions. Some improvement in quality controlcould be made by using an independent audit tocompare measurements from different instru-ments in the network and to introduce checks onthe inter-comparability of measurements and tech-niques with other networks.
The assessment and dissemination of the col-lected data were rated as good, with raw data andaggregated data assessed in relation to air qualityguidelines and predictions made and released forair pollution episodes. Modelling, health studiesand population exposure assessments could beintroduced to make fuller use of the collected airquality data. Information is widely disseminated innewspapers, television and radio but there are nocity-centre bulletin boards.
The lowest scoring section for Barcelonaoccurred in the indicator of emission estimatescategory where the city only had limited capabilityin place. In particular, there have been no esti-mates of emissions from point sources, and thosefor traffic emissions do not contain a breakdowninto vehicle type. Estimates have been made of
109
Urban Air Quality Management
Figure 9.11Distribution ofoverall index scoreby region
Smog and smokeover Barcelona
0
10
20
30
40
50
60
70
80
90
100
Sco
re
Eastern Countries Nordic CountriesSouthern Countries Western Countries
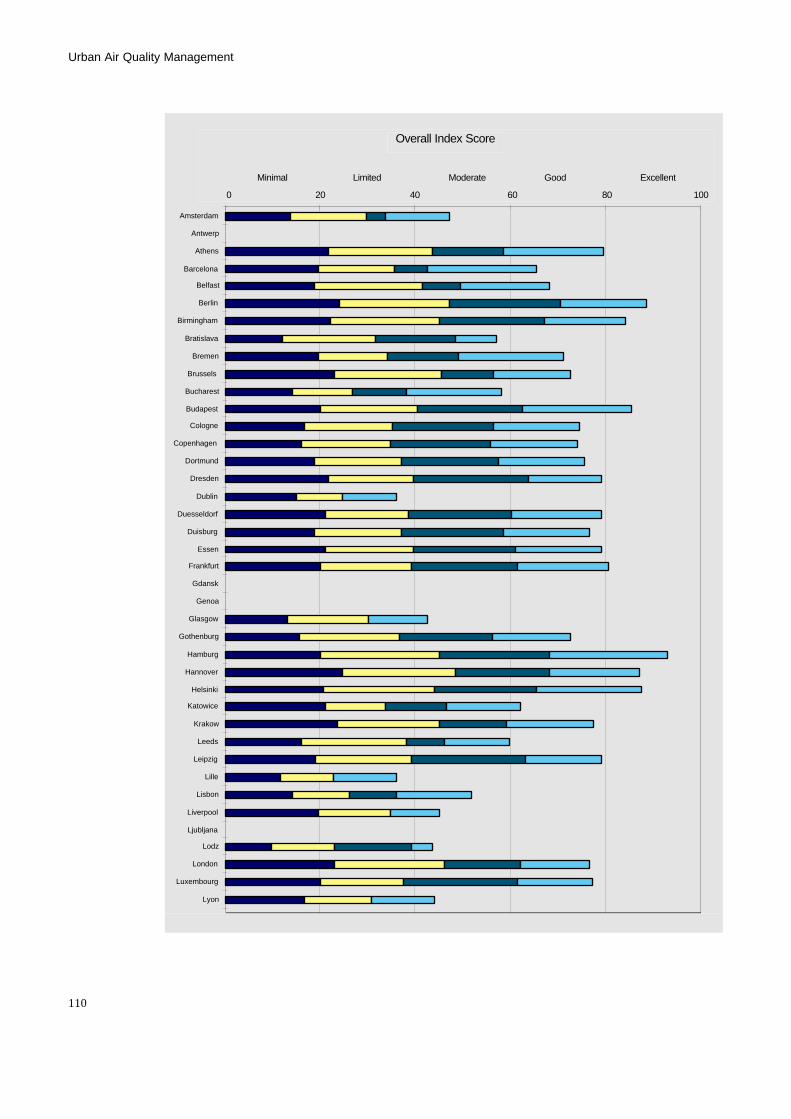
Urban Air Quality Management
110
Overall Index Score
0 20 40 60 80 100
Amsterdam
Antwerp
Athens
Barcelona
Belfast
Berlin
Birmingham
Bratislava
Bremen
Brussels
Bucharest
Budapest
Cologne
Copenhagen
Dortmund
Dresden
Dublin
Duesseldorf
Duisburg
Essen
Frankfurt
Gdansk
Genoa
Glasgow
Gothenburg
Hamburg
Hannover
Helsinki
Katowice
Krakow
Leeds
Leipzig
Lille
Lisbon
Liverpool
Ljubljana
Lodz
London
Luxembourg
Lyon
Madrid
Minimal Limited Moderate Good ExcellentM i n i m a l L i m i t e d M o d e r a t e G o o d E x c e l l e n t
Overall Index Score
0 2 0 4 0 6 0 8 0 1 0 0
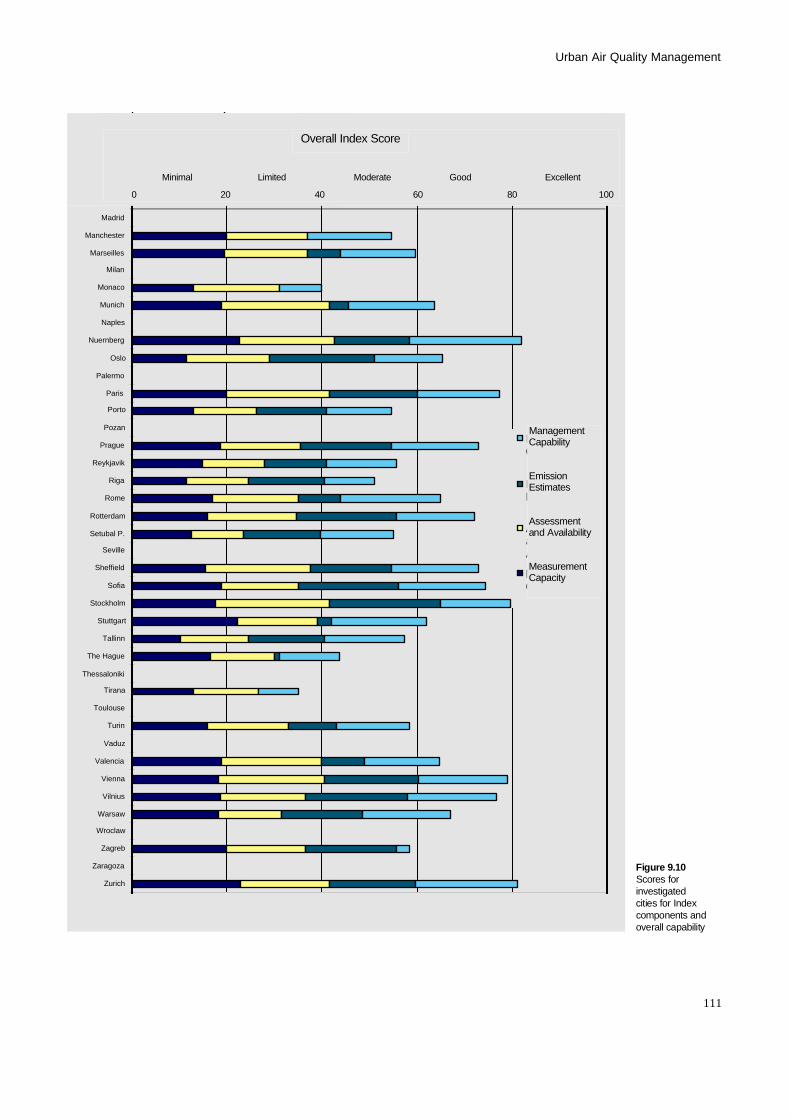
111
Urban Air Quality Management
Figure 9.10Scores fori n v e s t i g a t e dcities for Indexcomponents andoverall capability
Liverpool
Ljubljana
Lodz
London
Luxembourg
Lyon
Madrid
Manchester
Marseilles
Milan
Monaco
Munich
Naples
Nuernberg
Oslo
Palermo
Paris
Porto
Pozan
Prague
Reykjavik
Riga
Rome
Rotterdam
Setubal P.
Seville
Sheffield
Sofia
Stockholm
Stuttgart
Tallinn
The Hague
Thessaloniki
Tirana
Toulouse
Turin
Vaduz
Valencia
Vienna
Vilnius
Warsaw
Wroclaw
Zagreb
Zaragoza
Zurich
ManagementCapability
EmissionEstimates
AssessmentandAvailability
MeasurementCapacity
M i n i m a l L i m i t e d M o d e r a t e G o o d E x c e l l e n t
Overall Index Score
0 2 0 4 0 6 0 8 0 1 0 0
M a n a g e m e n tC a p a b i l i t y
E m i s s i o nE s t i m a t e s
A s s e s s m e n tand Availability
M e a s u r e m e n tC a p a c i t y
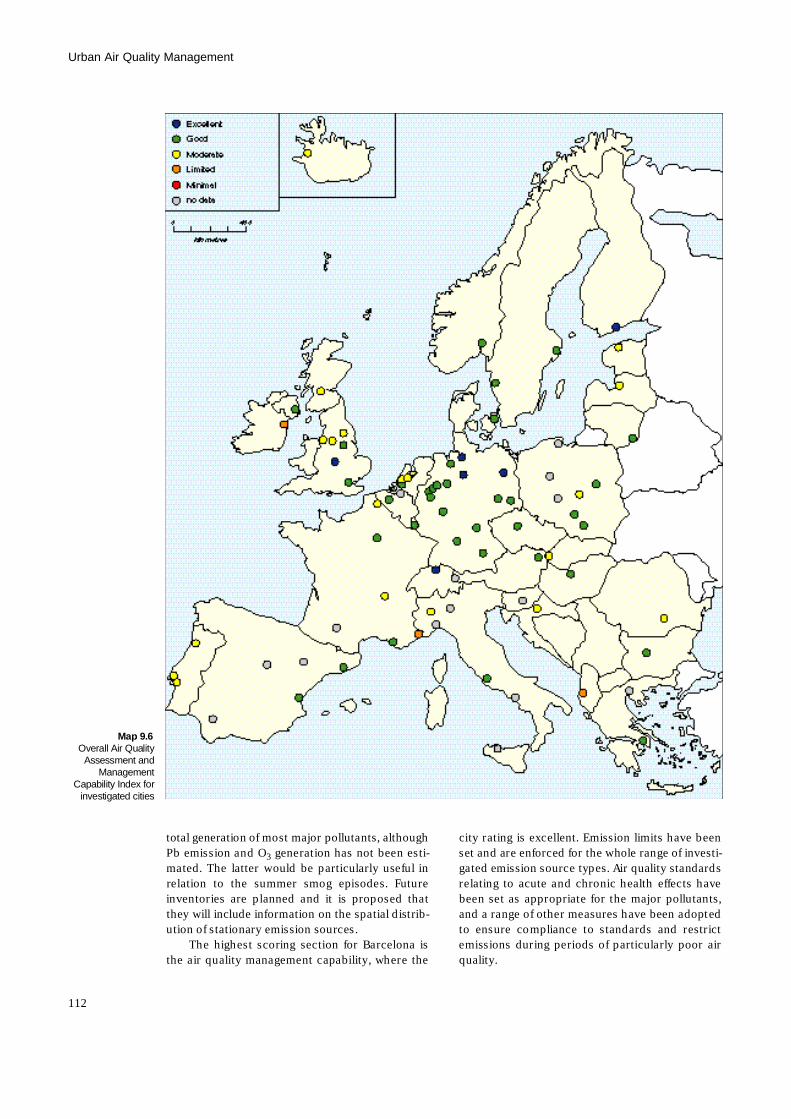
total generation of most major pollutants, althoughPb emission and O3 generation has not been esti-mated. The latter would be particularly useful inrelation to the summer smog episodes. Futureinventories are planned and it is proposed thatthey will include information on the spatial distrib-ution of stationary emission sources.
The highest scoring section for Barcelona isthe air quality management capability, where the
city rating is excellent. Emission limits have beenset and are enforced for the whole range of investi-gated emission source types. Air quality standardsrelating to acute and chronic health effects havebeen set as appropriate for the major pollutants,and a range of other measures have been adoptedto ensure compliance to standards and restrictemissions during periods of particularly poor airq u a l i t y .
Urban Air Quality Management
112
Map 9.6Overall Air Quality
Assessment andM a n a g e m e n t
Capability Index forinvestigated cities
B e l f a s tThe overall capability index score for Belfast was68.0, which lies in the mid-range of the good cate-gory. This indicates that the city has taken serioussteps to develop its air quality management capa-bility, but a closer look at the scores for differentcomponents of the index reveals shortcomingsthat could be overcome in the future.
Belfast has a monitoring network of 6 stationsmeasuring smoke and SO2, 4 sites for nitrogendioxide (NO2) (1 kerbside, 1 intermediate and 2urban background sites), plus 1 station which ispart of the UK automatic urban network (AUN)and measures NOx, SO2, CO, O3 and particulatescontinuously (BCC, 1996).
Examining the response to the questionnaireon measurement capacity, Belfast was found toscore in the good category. The shortfalls in thissection are namely that the pollutants NO2, CO, Pband O3 have not been monitored for at least fiveyears and so trend evaluation is not yet possible.Longer records are available for SO2 and particu-lates. This is perhaps to be expected as the majorair pollution concern in Belfast in the past hasrelated to the widespread use of coal as a maindomestic fuel.
The score for data assessment and availabilityis excellent, with a wide range of data analysis pro-cedures conducted, using the results as input datafor computer models and in epidemiological stud-ies. However, exposure assessment for differentpopulation groups has not been carried out. Thedata are widely available as aggregated data, anddissemination through the media is complementedby the use of information boards in the city. Warn-ings are issued to the public prior to and duringepisodes of poor air quality.
In common with many of the cities scoring anoverall moderate-good capability score, Belfast hasonly a limited rating for emission indicators. Emis-sions estimates are available for domestic output,power generation, industry and total traffic, butthere is no breakdown for the different types ofvehicle. Furthermore, the figures are restricted toS O2 and particulates/smoke. The emission esti-mates were based on fuel consumption alone,rather than by being supported and validated byemission monitoring. Future inventories areplanned and it would be beneficial if these wereextended to all relevant pollutant and sourcetypes. The inventories are not published in full butare partially available to the public.
The score for the air quality managementcapability index is good and borders on excellent.Limits are set for emissions of all types and thereare enforced penalties for any exceedance. In
accordance with EU legislation, air quality stan-dards relating to acute and chronic exposure havebeen set for all major pollutants except for CO.Further measures include the use of environmentalimpact assessment (EIA) for major new develop-ments; unleaded petrol is also available. There areno additional restrictions adopted during periodsof particularly poor air quality.
B u c h a r e s tWith a total of 58.0 points for the overall index ofair quality management and assessment capability,Bucharest falls into the moderate category. Thisgenerally indicates that the air quality monitoringnetwork is somewhat limited and that there areseveral areas where improvements could be made.
Air quality is monitored at 14 stations inBucharest. Of these stations, 5 belong to theBucharest Environmental Protection Agency, 5 tothe Ministry of Environment and 4 to the Preven-tive Health Centre. Sulphur dioxide, NO2, dust,heavy metals and ammonia (NH3) are sampled ona 24-hour basis (RIVM, 1995b).
The city scores 14.0 on the measurementcapacity index, which is lower than average forresponding cities. The primary reason for this isthe fact that data are only collected for NO2, SO2
and particulates. Lead, CO and O3 are not routinelymonitored. However, for those parameters that aremeasured, the records are good and provide datafor urban, suburban and industrial areas of thecity. The quality control procedures within the net-work are partially in place, calibration proceduresare sound, but there is no audit procedure forcomparing measurements using different instru-ments. However, the locations of sites arereviewed periodically to ensure they meet theobjectives of the network and guidelines for siteselection are given.
Bucharest scores only 12.5 on the index ofdata assessment and availability, which is one ofthe five lowest scores of cities taking part in thequestionnaire survey. The data assessment isgood, although the data are not used to give a spa-tial distribution of pollution conditions and thereare no exposure assessments of different popula-tion groups. The collected data are normally notreleased to the public but can be made availableon request. A considerable improvement to thisindex could be achieved by formal reporting anddissemination of information to the public. Smogwarnings are, however, issued to the public duringepisodes of poor air quality.
The index score for emissions estimates forBucharest is in the moderate category, in thelower quartile of responding cities. However, the
113
Urban Air Quality Management
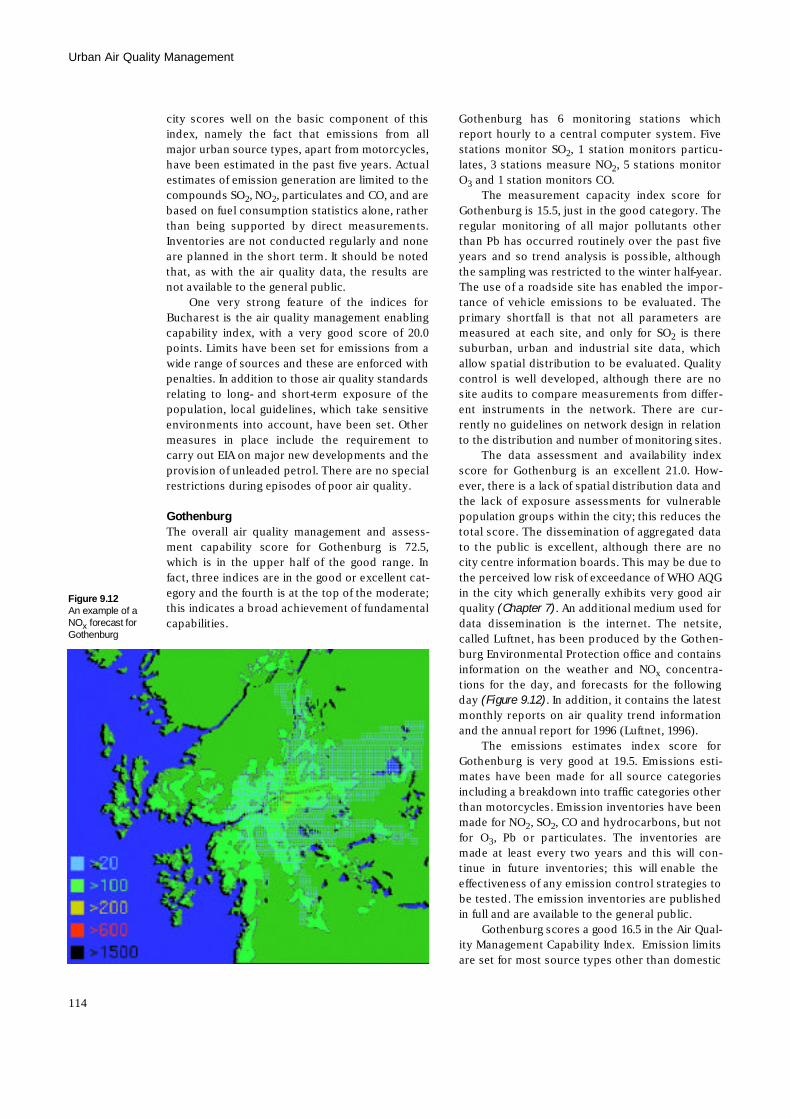
city scores well on the basic component of thisindex, namely the fact that emissions from allmajor urban source types, apart from motorcycles,have been estimated in the past five years. Actualestimates of emission generation are limited to thecompounds SO2, NO2, particulates and CO, and arebased on fuel consumption statistics alone, ratherthan being supported by direct measurements.Inventories are not conducted regularly and noneare planned in the short term. It should be notedthat, as with the air quality data, the results arenot available to the general public.
One very strong feature of the indices forBucharest is the air quality management enablingcapability index, with a very good score of 20.0points. Limits have been set for emissions from awide range of sources and these are enforced withpenalties. In addition to those air quality standardsrelating to long- and short-term exposure of thepopulation, local guidelines, which take sensitiveenvironments into account, have been set. Othermeasures in place include the requirement tocarry out EIA on major new developments and theprovision of unleaded petrol. There are no specialrestrictions during episodes of poor air quality.
G o t h e n b u r gThe overall air quality management and assess-ment capability score for Gothenburg is 72.5,which is in the upper half of the good range. Infact, three indices are in the good or excellent cat-egory and the fourth is at the top of the moderate;this indicates a broad achievement of fundamentalc a p a b i l i t i e s .
Gothenburg has 6 monitoring stations whichreport hourly to a central computer system. Fivestations monitor SO2, 1 station monitors particu-lates, 3 stations measure NO2, 5 stations monitorO3 and 1 station monitors CO.
The measurement capacity index score forGothenburg is 15.5, just in the good category. Theregular monitoring of all major pollutants otherthan Pb has occurred routinely over the past fiveyears and so trend analysis is possible, althoughthe sampling was restricted to the winter half-year.The use of a roadside site has enabled the impor-tance of vehicle emissions to be evaluated. Theprimary shortfall is that not all parameters aremeasured at each site, and only for SO2 is theresuburban, urban and industrial site data, whichallow spatial distribution to be evaluated. Qualitycontrol is well developed, although there are nosite audits to compare measurements from differ-ent instruments in the network. There are cur-rently no guidelines on network design in relationto the distribution and number of monitoring sites.
The data assessment and availability indexscore for Gothenburg is an excellent 21.0. How-ever, there is a lack of spatial distribution data andthe lack of exposure assessments for vulnerablepopulation groups within the city; this reduces thetotal score. The dissemination of aggregated datato the public is excellent, although there are nocity centre information boards. This may be due tothe perceived low risk of exceedance of WHO AQGin the city which generally exhibits very good airquality (Chapter 7). An additional medium used fordata dissemination is the internet. The netsite,called Luftnet, has been produced by the Gothen-burg Environmental Protection office and containsinformation on the weather and NOx c o n c e n t r a-tions for the day, and forecasts for the followingday (Figure 9.12). In addition, it contains the latestmonthly reports on air quality trend informationand the annual report for 1996 (Luftnet, 1996).
The emissions estimates index score forGothenburg is very good at 19.5. Emissions esti-mates have been made for all source categoriesincluding a breakdown into traffic categories otherthan motorcycles. Emission inventories have beenmade for NO2, SO2, CO and hydrocarbons, but notfor O3, Pb or particulates. The inventories aremade at least every two years and this will con-tinue in future inventories; this will enable theeffectiveness of any emission control strategies tobe tested. The emission inventories are publishedin full and are available to the general public.
Gothenburg scores a good 16.5 in the Air Qual-ity Management Capability Index. Emission limitsare set for most source types other than domestic
Urban Air Quality Management
114
Figure 9.12An example of aN Ox forecast forG o t h e n b u r g
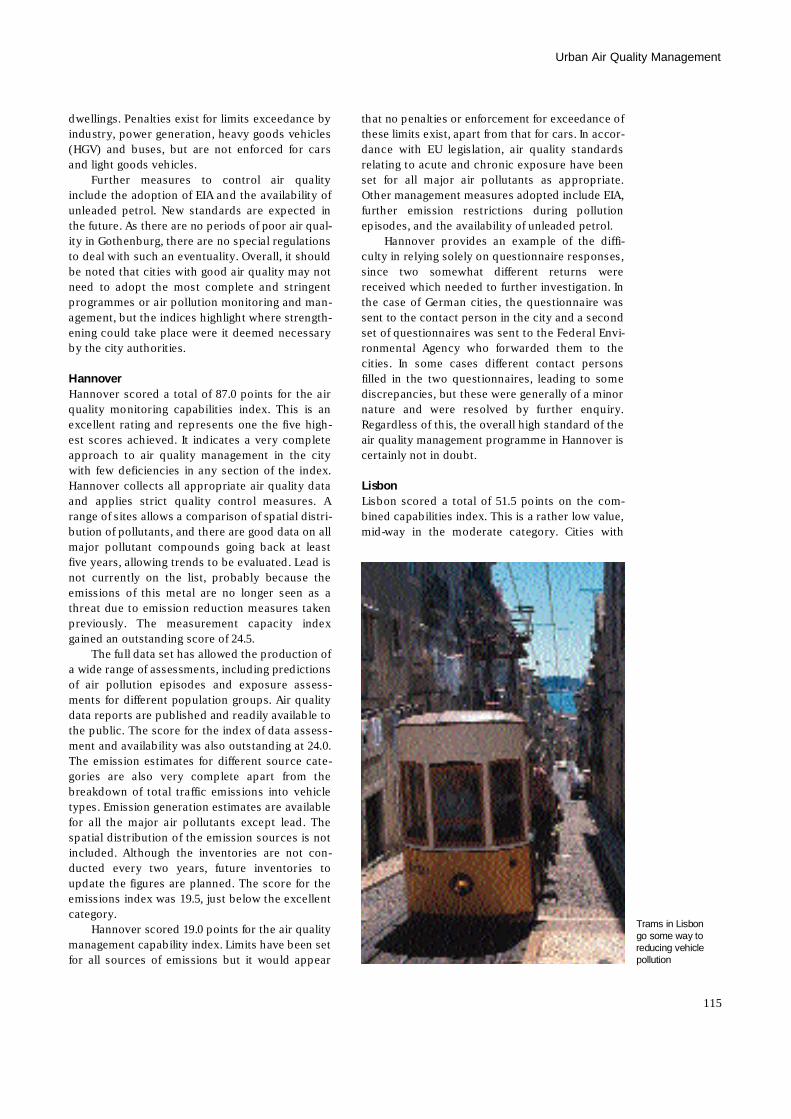
dwellings. Penalties exist for limits exceedance byindustry, power generation, heavy goods vehicles(HGV) and buses, but are not enforced for carsand light goods vehicles.
Further measures to control air qualityinclude the adoption of EIA and the availability ofunleaded petrol. New standards are expected inthe future. As there are no periods of poor air qual-ity in Gothenburg, there are no special regulationsto deal with such an eventuality. Overall, it shouldbe noted that cities with good air quality may notneed to adopt the most complete and stringentprogrammes or air pollution monitoring and man-agement, but the indices highlight where strength-ening could take place were it deemed necessaryby the city authorities.
H a n n o v e rHannover scored a total of 87.0 points for the airquality monitoring capabilities index. This is anexcellent rating and represents one the five high-est scores achieved. It indicates a very completeapproach to air quality management in the citywith few deficiencies in any section of the index.Hannover collects all appropriate air quality dataand applies strict quality control measures. Arange of sites allows a comparison of spatial distri-bution of pollutants, and there are good data on allmajor pollutant compounds going back at leastfive years, allowing trends to be evaluated. Lead isnot currently on the list, probably because theemissions of this metal are no longer seen as athreat due to emission reduction measures takenpreviously. The measurement capacity indexgained an outstanding score of 24.5.
The full data set has allowed the production ofa wide range of assessments, including predictionsof air pollution episodes and exposure assess-ments for different population groups. Air qualitydata reports are published and readily available tothe public. The score for the index of data assess-ment and availability was also outstanding at 24.0.The emission estimates for different source cate-gories are also very complete apart from thebreakdown of total traffic emissions into vehicletypes. Emission generation estimates are availablefor all the major air pollutants except lead. Thespatial distribution of the emission sources is notincluded. Although the inventories are not con-ducted every two years, future inventories toupdate the figures are planned. The score for theemissions index was 19.5, just below the excellentc a t e g o r y .
Hannover scored 19.0 points for the air qualitymanagement capability index. Limits have been setfor all sources of emissions but it would appear
that no penalties or enforcement for exceedance ofthese limits exist, apart from that for cars. In accor-dance with EU legislation, air quality standardsrelating to acute and chronic exposure have beenset for all major air pollutants as appropriate.Other management measures adopted include EIA,further emission restrictions during pollutionepisodes, and the availability of unleaded petrol.
Hannover provides an example of the diffi-culty in relying solely on questionnaire responses,since two somewhat different returns werereceived which needed to further investigation. Inthe case of German cities, the questionnaire wassent to the contact person in the city and a secondset of questionnaires was sent to the Federal Envi-ronmental Agency who forwarded them to thecities. In some cases different contact personsfilled in the two questionnaires, leading to somediscrepancies, but these were generally of a minornature and were resolved by further enquiry.Regardless of this, the overall high standard of theair quality management programme in Hannover iscertainly not in doubt.
L i s b o nLisbon scored a total of 51.5 points on the com-bined capabilities index. This is a rather low value,mid-way in the moderate category. Cities with
115
Urban Air Quality Management
Trams in Lisbongo some way toreducing vehiclep o l l u t i o n
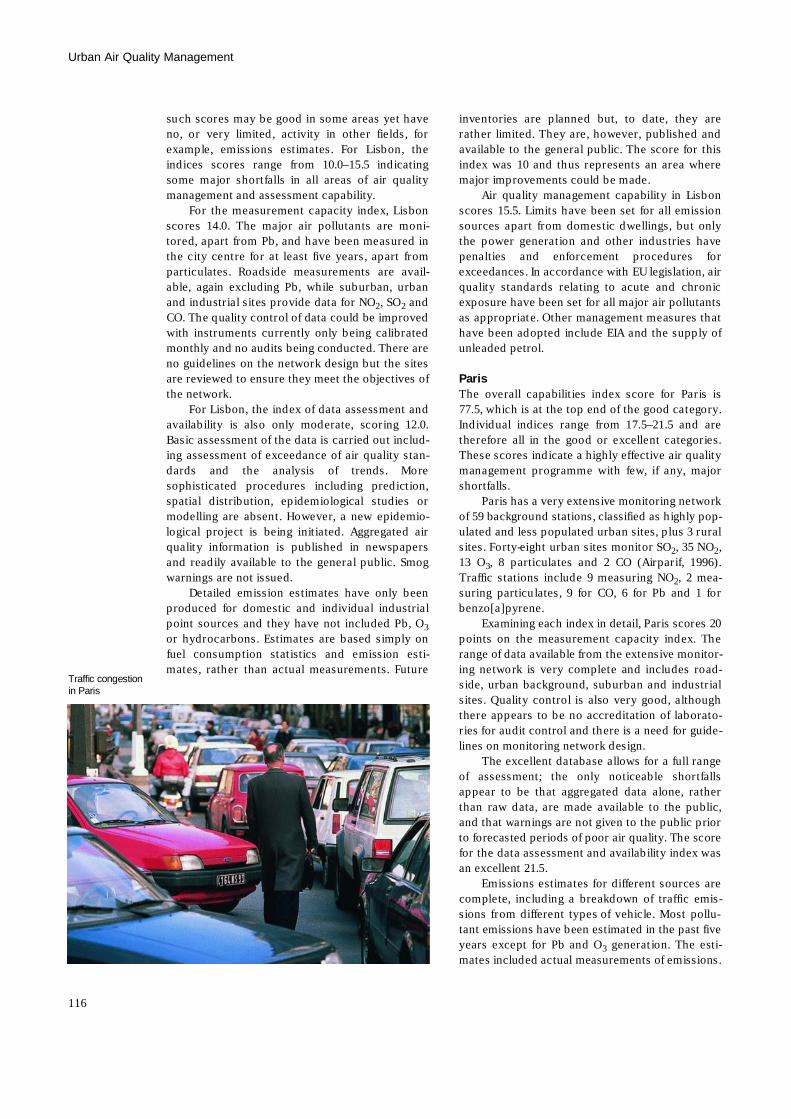
such scores may be good in some areas yet haveno, or very limited, activity in other fields, forexample, emissions estimates. For Lisbon, theindices scores range from 10.0–15.5 indicatingsome major shortfalls in all areas of air qualitymanagement and assessment capability.
For the measurement capacity index, Lisbonscores 14.0. The major air pollutants are moni-tored, apart from Pb, and have been measured inthe city centre for at least five years, apart fromparticulates. Roadside measurements are avail-able, again excluding Pb, while suburban, urbanand industrial sites provide data for NO2, SO2 a n dCO. The quality control of data could be improvedwith instruments currently only being calibratedmonthly and no audits being conducted. There areno guidelines on the network design but the sitesare reviewed to ensure they meet the objectives ofthe network.
For Lisbon, the index of data assessment andavailability is also only moderate, scoring 12.0.Basic assessment of the data is carried out includ-ing assessment of exceedance of air quality stan-dards and the analysis of trends. Moresophisticated procedures including prediction,spatial distribution, epidemiological studies ormodelling are absent. However, a new epidemio-logical project is being initiated. Aggregated airquality information is published in newspapersand readily available to the general public. Smogwarnings are not issued.
Detailed emission estimates have only beenproduced for domestic and individual industrialpoint sources and they have not included Pb, O3
or hydrocarbons. Estimates are based simply onfuel consumption statistics and emission esti-mates, rather than actual measurements. Future
inventories are planned but, to date, they arerather limited. They are, however, published andavailable to the general public. The score for thisindex was 10 and thus represents an area wheremajor improvements could be made.
Air quality management capability in Lisbonscores 15.5. Limits have been set for all emissionsources apart from domestic dwellings, but onlythe power generation and other industries havepenalties and enforcement procedures forexceedances. In accordance with EU legislation, airquality standards relating to acute and chronicexposure have been set for all major air pollutantsas appropriate. Other management measures thathave been adopted include EIA and the supply ofunleaded petrol.
P a r i sThe overall capabilities index score for Paris is77.5, which is at the top end of the good category.Individual indices range from 17.5–21.5 and aretherefore all in the good or excellent categories.These scores indicate a highly effective air qualitymanagement programme with few, if any, majors h o r t f a l l s .
Paris has a very extensive monitoring networkof 59 background stations, classified as highly pop-ulated and less populated urban sites, plus 3 ruralsites. Forty-eight urban sites monitor SO2, 35 NO2,13 O3, 8 particulates and 2 CO (Airparif, 1996).Traffic stations include 9 measuring NO2, 2 mea-suring particulates, 9 for CO, 6 for Pb and 1 forb e n z o [ a ] p y r e n e .
Examining each index in detail, Paris scores 20points on the measurement capacity index. Therange of data available from the extensive monitor-ing network is very complete and includes road-side, urban background, suburban and industrialsites. Quality control is also very good, althoughthere appears to be no accreditation of laborato-ries for audit control and there is a need for guide-lines on monitoring network design.
The excellent database allows for a full rangeof assessment; the only noticeable shortfallsappear to be that aggregated data alone, ratherthan raw data, are made available to the public,and that warnings are not given to the public priorto forecasted periods of poor air quality. The scorefor the data assessment and availability index wasan excellent 21.5.
Emissions estimates for different sources arecomplete, including a breakdown of traffic emis-sions from different types of vehicle. Most pollu-tant emissions have been estimated in the past fiveyears except for Pb and O3 generation. The esti-mates included actual measurements of emissions.
Urban Air Quality Management
116
Traffic congestionin Paris
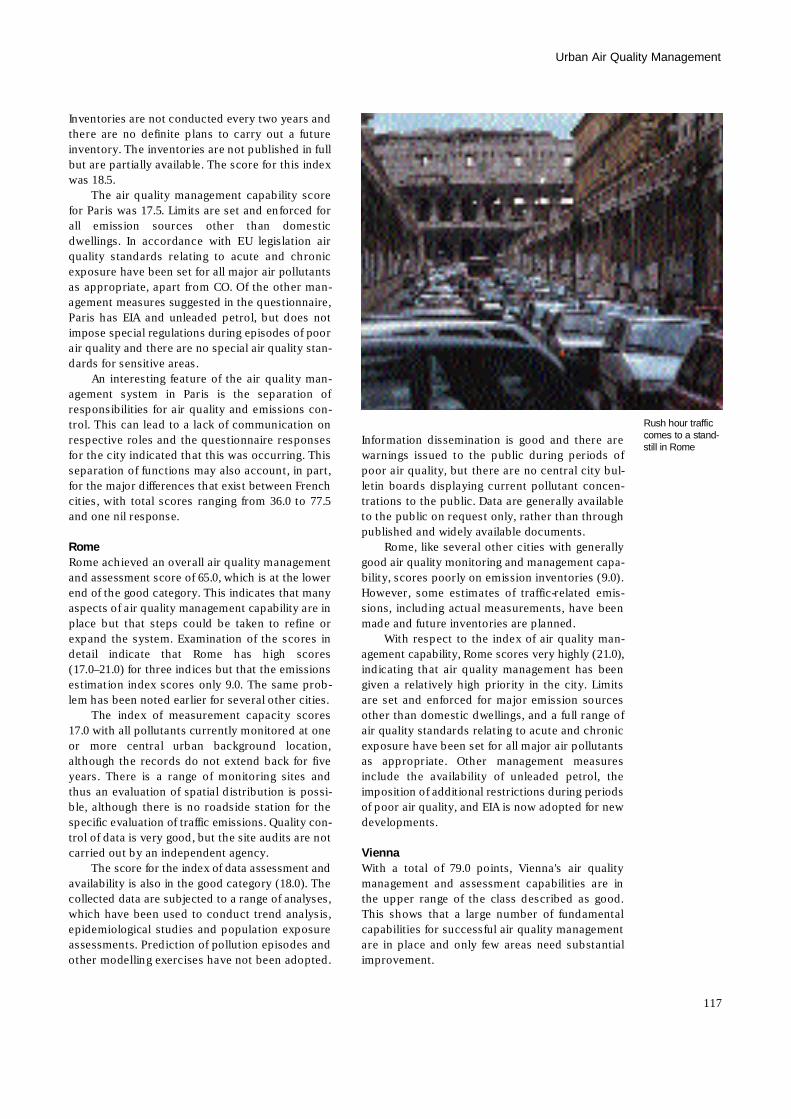
Inventories are not conducted every two years andthere are no definite plans to carry out a futureinventory. The inventories are not published in fullbut are partially available. The score for this indexwas 18.5.
The air quality management capability scorefor Paris was 17.5. Limits are set and enforced forall emission sources other than domesticdwellings. In accordance with EU legislation airquality standards relating to acute and chronicexposure have been set for all major air pollutantsas appropriate, apart from CO. Of the other man-agement measures suggested in the questionnaire,Paris has EIA and unleaded petrol, but does notimpose special regulations during episodes of poorair quality and there are no special air quality stan-dards for sensitive areas.
An interesting feature of the air quality man-agement system in Paris is the separation ofresponsibilities for air quality and emissions con-trol. This can lead to a lack of communication onrespective roles and the questionnaire responsesfor the city indicated that this was occurring. Thisseparation of functions may also account, in part,for the major differences that exist between Frenchcities, with total scores ranging from 36.0 to 77.5and one nil response.
R o m eRome achieved an overall air quality managementand assessment score of 65.0, which is at the lowerend of the good category. This indicates that manyaspects of air quality management capability are inplace but that steps could be taken to refine orexpand the system. Examination of the scores indetail indicate that Rome has high scores(17.0–21.0) for three indices but that the emissionsestimation index scores only 9.0. The same prob-lem has been noted earlier for several other cities.
The index of measurement capacity scores17.0 with all pollutants currently monitored at oneor more central urban background location,although the records do not extend back for fiveyears. There is a range of monitoring sites andthus an evaluation of spatial distribution is possi-ble, although there is no roadside station for thespecific evaluation of traffic emissions. Quality con-trol of data is very good, but the site audits are notcarried out by an independent agency.
The score for the index of data assessment andavailability is also in the good category (18.0). Thecollected data are subjected to a range of analyses,which have been used to conduct trend analysis,epidemiological studies and population exposureassessments. Prediction of pollution episodes andother modelling exercises have not been adopted.
Information dissemination is good and there arewarnings issued to the public during periods ofpoor air quality, but there are no central city bul-letin boards displaying current pollutant concen-trations to the public. Data are generally availableto the public on request only, rather than throughpublished and widely available documents.
Rome, like several other cities with generallygood air quality monitoring and management capa-bility, scores poorly on emission inventories (9.0).However, some estimates of traffic-related emis-sions, including actual measurements, have beenmade and future inventories are planned.
With respect to the index of air quality man-agement capability, Rome scores very highly (21.0),indicating that air quality management has beengiven a relatively high priority in the city. Limitsare set and enforced for major emission sourcesother than domestic dwellings, and a full range ofair quality standards relating to acute and chronicexposure have been set for all major air pollutantsas appropriate. Other management measuresinclude the availability of unleaded petrol, theimposition of additional restrictions during periodsof poor air quality, and EIA is now adopted for newd e v e l o p m e n t s .
V i e n n aWith a total of 79.0 points, Vienna's air qualitymanagement and assessment capabilities are inthe upper range of the class described as good.This shows that a large number of fundamentalcapabilities for successful air quality managementare in place and only few areas need substantiali m p r o v e m e n t .
117
Urban Air Quality Management
Rush hour trafficcomes to a stand-still in Rome
The urban monitoring network consists of 18 sta-tions in different areas of the city determining con-centrations of most traditional air pollutants(Mücke and Turowski, 1995). For the measurementcapacity, Vienna scored 18.0. Deduction of pointsfrom the maximum achievable score had to bemade since levels of airborne lead are not moni-tored and so far no guidelines for monitoring net-work design and station location have beena d o p t e d .
Comprehensive data assessment and dissemi-nation of data were conducted and the score forthis index was 22.5. However, no forecasts of airquality are produced, and therefore smog warn-ings can only be issued during pollution episodes.Information given to the public in advance, whendeterioration of the air quality can be anticipated,could help to reduce and avoid peak pollutionevents. However, all monitored data are availableto the public through a variety of media.
Very detailed emission inventories for mostimportant pollutants and all significant urban emis-sion source types are produced, including emis-sions from non-combustion processes, and includeactual emission monitoring. Data are publishedand fully available to the public, but emissioninventories are not conducted at least every twoyears and do not include the spatial distribution ofemission sources. This information would be veryvaluable for assessing the success of emissionabatement measures. The score for this index wasa very good 20.0.
The management capability index score forVienna was 18.5. With the exception of domesticsources, emission limits have been set and areenforced; furthermore, air quality guidelines relat-ing to acute and chronic health effects have beenadopted. During summer smog episodes, addi-tional emission restrictions may be imposed onroad traffic and/or industry if alarm levels arereached. The high frequency of O3 t h r e s h o l dexceedances reported in 1994 shows the necessityfor these measures, but they are not yet sufficientto permanently reduce O3 concentrations to accept-able levels (Chapters 5 and 6).
The overall very good air quality managementand assessment capabilities of Vienna, in combina-tion with the external impacts on air quality, resultin generally good air quality. The major difficultiesrelate to elevated O3 concentrations during hotand sunny periods. To tackle this complex prob-lem, an evaluation of impacts on a scale largerthan the city limits is necessary. Long-range trans-boundary transport of O3 precursor substancesmight significantly exacerbate the problem.
W a r s a wWarsaw scores a total of 67.0 on the overall moni-toring and management capability index and thus,like Barcelona, Rome and Belfast, falls into thelower half of the good range. However, unlike theother three, which all score poorly on the emis-sions estimate index but have at least one index inthe excellent range, Warsaw has a more even dis-tribution of scores (13.5–18.5), indicating a generaloverall capability but with some shortfall in alla r e a s .
Examining the indices in more detail, Warsawhas a good pollutant monitoring network whichhas been operating for at least five years. There isinformation on the spatial distribution of NO2, SO2
and particulate matter, but not on CO, Pb and O3.Vehicle emissions of all the major pollutants aremonitored at a roadside site/s. Quality assuranceof the data could be improved in terms of instru-ment calibration, and through independent auditsof instruments. However, inter-comparison exer-cises are conducted and guidelines for site selec-tion and network design are available. The indexscore for measurement capacity for Warsaw was1 8 . 0 .
The index score for data assessment andavailability in Warsaw was a relatively poor 13.5.This was because, although good data were col-lected, these do not seem to have been used tobest effect as no trend analysis, prediction, epi-demiological studies or exposure analyses are per-formed. The data are also neither widely availablenor distributed in the media, although informationboards are present in the city.
The indicator of emissions estimates shows asubstantial employment of this tool in Warsaw(17.0). Emission estimates are restricted to domes-tic, power generation and industry and do notinclude mobile sources, which is a major shortfall.Pollutants investigated do not include O3 or Pb.However, it is clear that the emission estimatesthat are conducted are very thorough and basedon actual measurements. The inventories are notpublished, nor are they available in full, but thepublic does have some access to the information.
Warsaw also scores in the good category formanagement capability (18.5). Limits are set and atleast partially enforced for all major emissionsources other than domestic dwellings. There arealso nationally adopted acute and chronic healthstandards for all the pollutants as appropriate.Other useful measures include the availability ofunleaded petrol and extra restrictions can beenforced if an area exceeds air quality standards.EIA has also been adopted.
Urban Air Quality Management
118
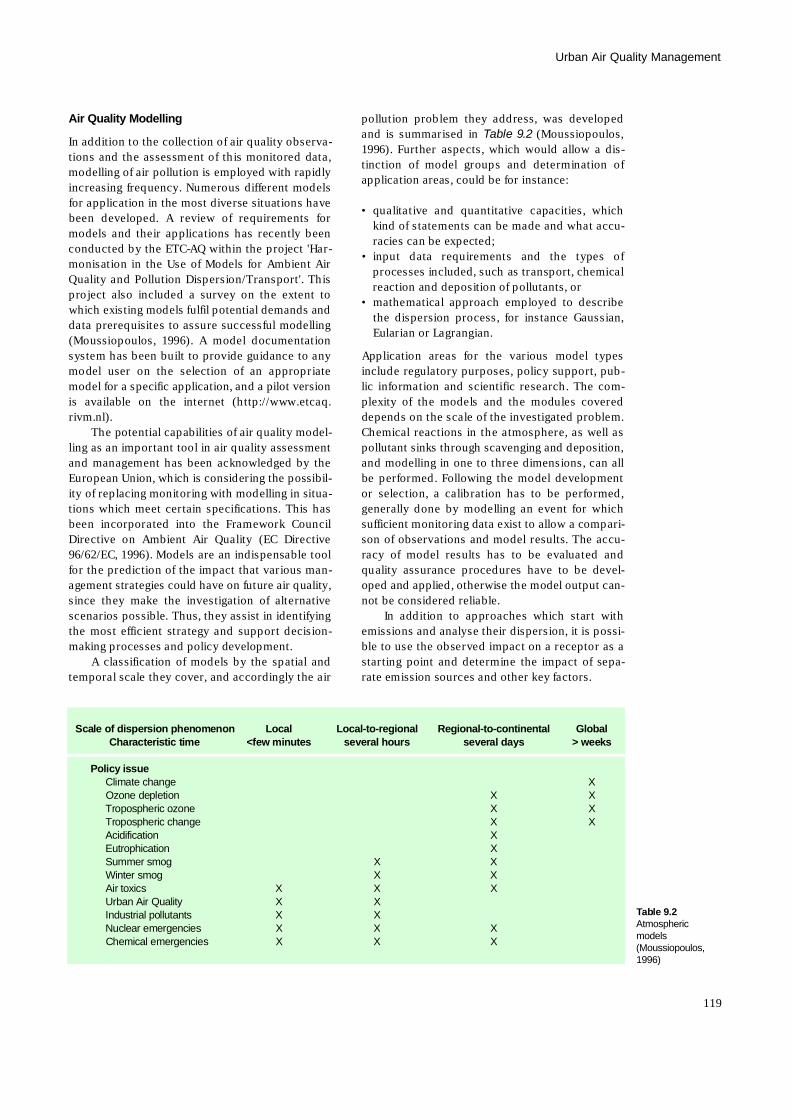
Air Quality Modelling
In addition to the collection of air quality observa-tions and the assessment of this monitored data,modelling of air pollution is employed with rapidlyincreasing frequency. Numerous different modelsfor application in the most diverse situations havebeen developed. A review of requirements formodels and their applications has recently beenconducted by the ETC-AQ within the project 'Har-monisation in the Use of Models for Ambient AirQuality and Pollution Dispersion/Transport'. Thisproject also included a survey on the extent towhich existing models fulfil potential demands anddata prerequisites to assure successful modelling(Moussiopoulos, 1996). A model documentationsystem has been built to provide guidance to anymodel user on the selection of an appropriatemodel for a specific application, and a pilot versionis available on the internet (http://www.etcaq.r i v m . n l ) .
The potential capabilities of air quality model-ling as an important tool in air quality assessmentand management has been acknowledged by theEuropean Union, which is considering the possibil-ity of replacing monitoring with modelling in situa-tions which meet certain specifications. This hasbeen incorporated into the Framework CouncilDirective on Ambient Air Quality (EC Directive96/62/EC, 1996). Models are an indispensable toolfor the prediction of the impact that various man-agement strategies could have on future air quality,since they make the investigation of alternativescenarios possible. Thus, they assist in identifyingthe most efficient strategy and support decision-making processes and policy development.
A classification of models by the spatial andtemporal scale they cover, and accordingly the air
pollution problem they address, was developedand is summarised in Table 9.2 ( M o u s s i o p o u l o s ,1996). Further aspects, which would allow a dis-tinction of model groups and determination ofapplication areas, could be for instance:
• qualitative and quantitative capacities, whichkind of statements can be made and what accu-racies can be expected;
• input data requirements and the types ofprocesses included, such as transport, chemicalreaction and deposition of pollutants, or
• mathematical approach employed to describethe dispersion process, for instance Gaussian,Eularian or Lagrangian.
Application areas for the various model typesinclude regulatory purposes, policy support, pub-lic information and scientific research. The com-plexity of the models and the modules covereddepends on the scale of the investigated problem.Chemical reactions in the atmosphere, as well aspollutant sinks through scavenging and deposition,and modelling in one to three dimensions, can allbe performed. Following the model developmentor selection, a calibration has to be performed,generally done by modelling an event for whichsufficient monitoring data exist to allow a compari-son of observations and model results. The accu-racy of model results has to be evaluated andquality assurance procedures have to be devel-oped and applied, otherwise the model output can-not be considered reliable.
In addition to approaches which start withemissions and analyse their dispersion, it is possi-ble to use the observed impact on a receptor as astarting point and determine the impact of sepa-rate emission sources and other key factors.
119
Urban Air Quality Management
Scale of dispersion phenomenon L o c a l L o c a l - t o - r e g i o n a l R e g i o n a l - t o - c o n t i n e n t a l G l o b a lCharacteristic time <few minutes several hours several days > weeks
Policy issueClimate change XOzone depletion X XTropospheric ozone X XTropospheric change X XA c i d i f i c a t i o n XE u t r o p h i c a t i o n XSummer smog X XWinter smog X XAir toxics X X XUrban Air Quality X XIndustrial pollutants X XNuclear emergencies X X XChemical emergencies X X X
Table 9.2A t m o s p h e r i cm o d e l s( M o u s s i o p o u l o s ,1 9 9 6 )
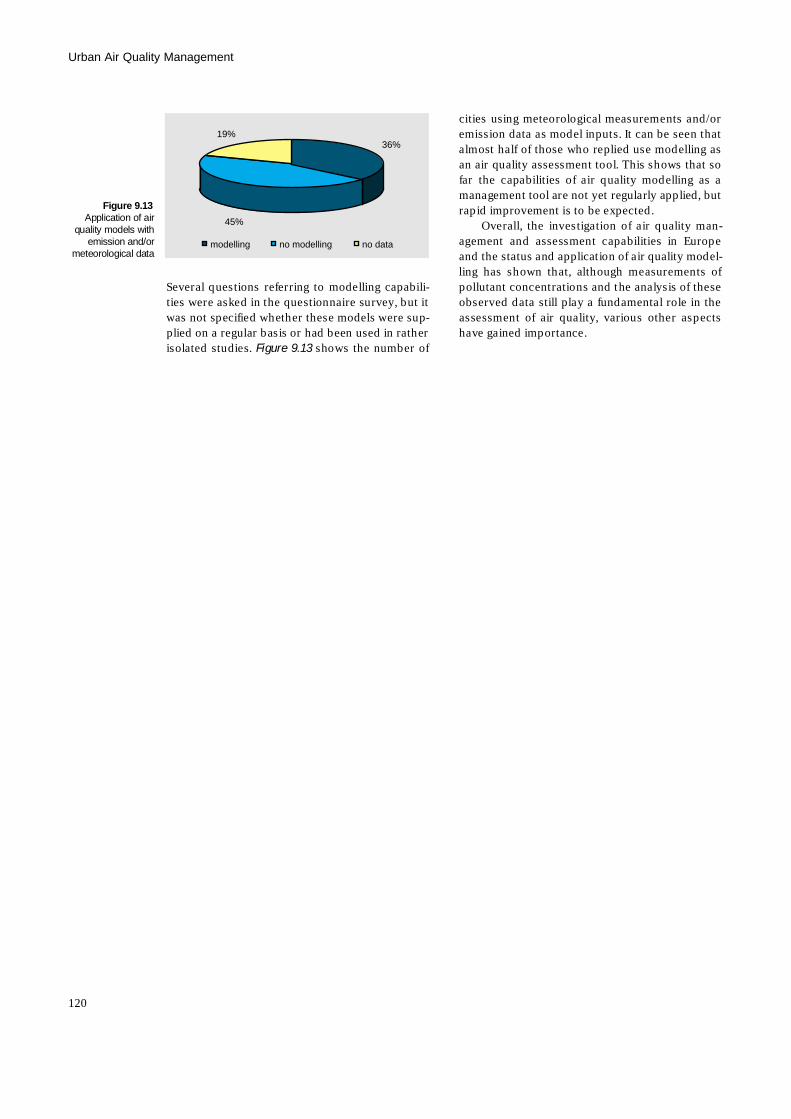
Several questions referring to modelling capabili-ties were asked in the questionnaire survey, but itwas not specified whether these models were sup-plied on a regular basis or had been used in ratherisolated studies. Figure 9.13 shows the number of
cities using meteorological measurements and/oremission data as model inputs. It can be seen thatalmost half of those who replied use modelling asan air quality assessment tool. This shows that sofar the capabilities of air quality modelling as amanagement tool are not yet regularly applied, butrapid improvement is to be expected.
Overall, the investigation of air quality man-agement and assessment capabilities in Europeand the status and application of air quality model-ling has shown that, although measurements ofpollutant concentrations and the analysis of theseobserved data still play a fundamental role in theassessment of air quality, various other aspectshave gained importance.
Urban Air Quality Management
120
19%
45%
36%
modelling no modelling no data
Figure 9.13Application of air
quality models withemission and/or
meteorological data
Air Quality Management in an Overall EuropeanPollution Control Context
In the preceding chapters a review has beenmade of urban air quality in Europe. This topic
has been addressed in the widest sense by notonly examining the data that have been collectedin 79 major European cities, but also by using vari-ous indicators to predict the occurrence of poorair quality and to test these predictions against theobserved data. In addition, 64 cities haveresponded to a questionnaire survey, which pro-vides a guide to the capacity of cities to monitor,assess and manage air quality.
This report is opportune since it appears at atime of transition in the concepts and designs ofmonitoring and assessment programmes. Forexample, the EU Framework Directive on Air Qual-ity Assessment and Management was adopted inSeptember 1996 (EC, 1996). A recurrent difficulty inthe past has been that the monitoring data col-lected have not always addressed managementneeds, and the variety of methods and approachesin use make inter-comparisons and decision-mak-ing difficult. The challenge for the future is to pro-vide a monitoring and assessment system, whichcan provide aggregated information that is suitedto management requirements. There is also theneed to develop management infrastructures,which are capable of using the information to notonly effectively manage air quality in the cities, butalso relate city management requirements tonational, regional and global needs.
Another recent trend is towards the develop-ment of integrated pollution control, which bringstogether previously separate approaches to air,
Chapter 10
The Way Forw a rd
121
water, soil, and food quality. The overview thatcan be provided by an integrated approach is theonly way in which management can obtain theinformation to set and enforce environmentallyacceptable levels of toxic chemicals in differentmedia, in order to safeguard human and ecosys-tem health. Furthermore, it is the only way inwhich priorities can be set and a real step forwardbe made towards sustainable development. How-ever, for such a goal to be realized, this prioritisa-tion will need significant development of thevarious instruments available for managementover and above those currently used. This wouldnecessarily include fines and incentives for compli-ance to mandatory standards and emission reduc-tion, as well as the application of cost-benefitanalysis in relation to the management options forpollution control scenarios.
Management Objectives
One of the problems encountered in this study hasbeen the difficulty in comparing cities in differentparts of Europe which have, for reasons of loca-tion, economic, social and environmental issues,given different priorities to air quality management,and thus to air quality monitoring and assessment.Some cities have placed emphasis on monitoringcapacity but conducted no emission inventories.Other cities have monitored only a narrow rangeof pollutants, and some monitor different pollu-tants only on a seasonal basis. It is not always pos-sible, or sufficient, to judge cities entirely on anindex score, as this can sometimes be simplistic.Why, for example, should Gothenburg, which hasgood air quality and so far few, if any, occasions onwhich current air quality guidelines have beenexceeded, maintain a city centre bulletin board towarn of non-events. On the other hand, whyshould not all cities publish their air quality andrelated emissions data in full and disseminate suchinformation to the media.
Air Quality Management – Questions and DataR e q u i r e m e n t s
Air quality managers working at city, regional andnational levels will wish to address one or more(or perhaps all) the following questions, and willthus need to carry out the associated monitoringand assessment to provide the answers:
Is there a problem, will the problem occur, and, ifpresent, is it currently getting better or worse?
• measurement of current levels of key pollutants,• determination of trends.
Where is the problem originating and are existingstandards and limits being effectively enforced?
• determination of sources and estimation of thespatial distribution of emissions of primary pol-lutants and precursor substances for secondaryp o l l u t a n t s ,
• ensuring compliance to standards and limits.
Is the public at risk now or in the future, and areappropriate measures in place to safeguard thep u b l i c ?
• monitoring to measure exceedance of limits,• predicting exceedance of standards,• warning the public,• assessing exposure of the population to poor air
q u a l i t y .
Are materials and ecosystems being affected by poorair quality?
• ambient air quality monitoring in remote, ruraland sensitive area locations,
• determination of ambient air quality impact onmaterials and structures,
• biomonitoring – effects on flora, fauna, ecosys-tems, agriculture and livestock.
How do urban air quality problems rate with respectto local and global pollution control priorities?
• assessing pollution control priorities,• assessing contribution of urban air emissions to
national, transboundary and global problems,• the use of economic instruments and cost-bene-
fit analysis.
Do the current air pollution control monitoring,assessment and management infrastructure and poli -cies meet the agreed objectives and thus provideanswers to the appropriate questions?
• quality control of the whole monitoring andassessment process,
• feedback on the effectiveness or otherwise ofcurrent policies.
In Europe as a whole all these questions are topi-cal and relevant issues, and they are addressed inChapters 4 to 9 of this report. It is, however, debat-able as to whether they are all explicitly acceptedas relevant by all air quality managers in cities. Inparticular, it is quite probable that city prioritieshave been developed in response to strictly localurban demands, for example, in order to protectcity inhabitants and artefacts. Little priority hasbeen given by cities generally to some of the press-ing national, regional and global issues which lie
The Way Forward
122
outside their constituency remit. If these broaderissues are to be addressed effectively, then themechanism for hierarchical management prioritysetting needs close integration. There are, ofcourse, national and international monitoring andassessment networks, for example, EMEP, BaP-MON and GEMS/Air, but how far individual citiesare aware of these programmes, or see how theirproblems and efforts at resolution impact on thewider environment, is by no means certain. Theevidence from the questionnaire responses indi-cates that city awareness of even EU directivesand guidelines is patchy.
Urban Air Quality Problems – Present andF u t u r e
The survey of existing data described in thisreport confirms that air quality problems are wide-spread across Europe and that much work still hasto be done to achieve the goal of healthy urban airfor all. Two previous published studies on urbanair quality, 'Urban Air Pollution in Megacities of theWorld' (WHO/UNEP, 1992) and 'Air Quality Man-agement and Assessment Capabilities in 20 MajorCities' (WHO/UNEP, 1997) have concentrated onhighly populated cities, with populations over 10million and 3 million respectively. On a globalscale, this is appropriate as the number of citieswhich will grow to these sizes in the developingworld in the next century is increasing exponen-tially. For Europe, the scenario is rather different,since population growth is no longer seen as amajor driving force and thus city growth is unlikelyto be as great. For many cities, such as Londonand Paris, the trend over the past few years hasbeen for a level of decentralisation, with decreasingpopulation numbers resident in the city centresleading to suburban sprawl. In other regions, cityboundaries have coalesced, leading to agglomera-tions of cities, such as in the industrial belt of theRuhr. Similarly, coastal cities in tourist areas mayspread along coastlines, producing laterallyextended agglomerations, such as in Monaco andthe French/Italian Riviera.
In this report, the population limit for cityinclusion was 500,000 and some 68 cities satisfiedthis criterion. Eleven smaller cities were includedto ensure that at least one city from each countryin the area investigated was included. It is evidentin this review that all the cities for which data areavailable had air quality problems of one sort oranother and at varying levels of severity. All thelarger cities, such as Rome, Paris, Berlin, Londonand Warsaw, had a very wide range of air qualityproblems whilst a few of the smaller cities withlow population densities, such as Gothenburg, had
air pollution problems well under control, so thatexceedance of air quality standards was unlikely.However, some of the smaller cities, for examplethose with high population density (Katowice)and/or other unfavourable conditions (Belfast),had quite extensive air pollution problems. WHOhas suggested that cities with over 50,000 inhabi-tants are likely to encounter air pollution problems(Chapter 5). Air quality is therefore an issue sharedby all European countries, and one which poten-tially affects all city residents; by the year 2000,these will number about 350 million in the areacovered by this report.
In addition to the great variety of city size,population density and topography, the geo-graphic spread of the cities investigated presents awide regional diversity. There is some evidencepresented in this report that climate and economicconditions can be influential in affecting air qualityproblems at a regional level. Air quality manage-ment capability has been shown to be correlatedwith the wealth of the nation (Purchasing PowerParity) of the city involved (WHO/UNEP, 1997).
It could be expected that the larger the citythe more likely people are to be at risk; but theproportion of the population exposed during pollu-tion episodes is a reflection of a mixture of factors,including levels of exceedance, population densityand pollution source distribution. However, muchof the data show a patchwork of pollution prob-lems that are not strictly regionally stratified orclassified readily on any one particular criterion;for example, Belfast is an outlier in Map 7.8 o nwinter smog occurrences. Although this mayappear disappointing or discouraging for develop-ing regional and national strategies, it does high-light the conclusion that each individual city has tobe regarded as a management entity with specifi-cally identified problems and goals.
This conclusion perhaps explains how urbanair quality monitoring and management has devel-oped in a very ‘bottom-up’ way for each city;inevitably, this is leading to difficulties in applyingthe ‘top-down’ national, EU and internationalguidelines and directives in a consistent manner.One of the needs to be addressed in the future,therefore, is the satisfactory incorporation ofnational and regional air quality needs into city airquality management strategies.
One of the specific needs in international andregional policy development is the provision ofinternationally comparable data sets of knownquality. A new EU Decision on Exchange of AirQuality Information is likely to be agreed in 1997.AIRBASE and EIONET are under development bythe EEA with the intention of building and using
123
The Way Forward
the data supplied under this and other decisionsas well as the EU Air Quality Directives. An EEAworkshop in Copenhagen (ETC-AQ, 1996b) hasproposed a number of recommendations includingthe development of a European monitoring net-work, EURO-AIRNET, based on current nationalmonitoring networks.
There is a confusing diversity of reportingperiods for many pollutants, ranging from annualmeans to 24 hours, 8 hours and 10 minutes. Itwould be very beneficial for comparisons if guide-lines could be issued to all cities suggesting a fixedset of reporting modes for each pollutant in accor-dance with the needs to address different issues.However, for data continuity, it would be desirableto overlap any changes that cities incorporate (seeChapter 4 on monitoring methods for black smoke,TSP and PM1 0 and PM2 . 5) .
All cities have at least some level of qualityassessment and quality control (QA/QC) whichthey apply to their air quality monitoring net-works, but it is not known how many reach thehighest international standards in this respect. Therecent EEA workshop recommended a four-phasedevelopment of QA/QC. If city data are to be usedfor regional and international strategic planning, orto enforce compliance to international agreementson pollution discharges, then there is a real needto encourage a commonality of quality controlmeasures across Europe.
Overall, there are changes taking place in therelative importance of different pollutants. In manyareas lead (Pb) levels have fallen to well below setstandards. For sulphur dioxide (SO2), the prob-lems within cities are now frequently under con-trol, but the transboundary movement is still anissue in several areas. The growth of road trans-port is probably the most uniform development,taking place right across Europe, but even here therate of increase varies enormously and the mea-sures in place to control the resultant pollutantsare still incomplete.
Cities traditionally monitor pollutants thatthey regard as significant in their city. Is it desir-able for a city to measure oxides of nitrogen( N Ox,), ozone (O3) and volatile organic compounds(VOCs) if the risk of summer smog is non-existent?Should SO2 be measured if power plants arenuclear, industries are fitted with flue gas desul-phurization, domestic burning of coal is banned,and if concentrations have fallen to less than 20%of levels in the 1980s and no longer exceed recom-mended guideline limits? Should Pb still be mea-sured if unleaded petrol is now the predominantlyused fuel? For the sake of international comparabil-ity and trend analysis, the simple answer to these
questions is probably ‘yes’ and the data collectionshould be continued albeit at a reduced level. How-ever, for a city with other pollution and economicpriorities the cost may not be deemed worthwhile.To optimise the use of the limited resources, theseissues need to be resolved in the future.
Less frequently monitored substances, suchas VOCs and hazardous air pollutants, need to begiven a higher priority to allow an assessment ofthe current situation. Harmonisation efforts areparticularly important in this area due to the widevariety of compounds and parameters involved.For some reported measurements it is not clearwhether VOC concentrations include methane, themost abundant species, or which compoundswere selected as representatives. Concentrationsof individual pollutants, such as benzene, as wellas specified relevant mixtures, need to be deter-mined and subsequently used for assessment.
Air Quality Monitoring and Assessment C a p a b i l i t y
One of the special features of this report is theanalysis which is provided of air quality manage-ment and assessment capability. Ultimately, it ison the capacity to achieve management targetsand goals that a city's air quality managementcapability will be judged, rather than on adherenceto particular policies. Nevertheless, the aggregatedindex and its four component parts can be used tohelp a city prioritise development of its pro-gramme. The regional distribution of returns of thequestionnaire leads to some cause for concern, ascities in the southern region gave a 55% responsecompared with a 100% return for the five cities inthe Nordic region. This may indicate that cities inthe southern region are less integrated into theinformation exchange processes within Europe.Perhaps this is due to language difficulties (thequestionnaire was only made available in English)and/or that air pollution is not seen as a problem,or that air quality management is not given a highpriority. It is recommended that the reasons forthis discrepancy should be addressed, and thatcities which have failed to respond from all regionsshould be targeted in the future. In the schemepresented, all four indices are given equal weight-ing whilst the answers to particular questions mayvary from 0.5–3.0. The weights chosen may beargued against but they represent an attemptedrationality in relation to the perceived importanceof the various factors and indices.
In many ways the first index, the measure-ment capacity, is the most fundamental in thatwithout good data, air quality management cannotbe effective. City scores for this index average 17.8,
The Way Forward
124
which is near the median of the good range, indi-cating that most cities have given priority to col-lecting sound data. Cities that fail to reach thegood category have most frequently not adopted avariety of monitoring stations to measure indus-trial, suburban, urban background and roadsidelevels, or have limited quality control measures inplace. Some only measure a limited range of pollu-tants – Bucharest, for example, does not measureozone – or only measure levels for part of the year,as in the Swedish cities. Bearing in mind local con-ditions, cities should be encouraged to achieve atleast a good standard for this index and this couldbe a future target for Europe as a whole.
The data assessment and dissemination indexclearly builds on the measurement capacity index;a poor score in measurement capacity will obvi-ously limit the range of assessments that can bemade. A similar percentage of countries, 74% formeasurement capacity and 73% for data assess-ment and availability, achieved an excellent orgood score for these two indices. In 60% of cities,the rating for the two indices was in the same classand in only two cases was the variance in scoresmore than one class. One relatively easy area forimprovement, which down-rated a number ofcities, was the failure of some cities to make datafreely available through the media to the generalpublic. Communication of air quality informationto the public should be encouraged.
The scores for the emissions estimate indexwere more patchy; 53% of cities received a goodor excellent rating but 33% were in either minimalor limited categories. Emissions estimates areundoubtedly valuable management tools for citiessince they enable prioritisation of different pollu-tion control measures to be judged, polluter-paysprinciples to be introduced and feedback to beprovided on the effectiveness of any control mea-sures. In a pan-European regulatory framework,they are essential to expose problems of trans-boundary pollution and compliance with nation-ally agreed emission limits. City management hasfailed in many cases to give this area priority,mainly because the uniform application of controlmeasures can achieve pollution abatement targetsmeasured in terms of reducing ambient air pollu-tion levels without the absolute need for emissioninventories. If future regulations require detailedemission inventories from cities, improvementsmay be achieved by providing incentives for citiesto either carry them out or organise a nationalinventories programme, linked to the CORINAIRproject, on top of the city monitoring programmes.
For the fourth index, air quality managementcapability, the distribution of scores reflects more
closely the first two indices in that the minimaland limited categories account for only 11% ofresponding cities. The average score for this indexmay be expected to be somewhat lower than forthe first two indices as it depends on them to acertain extent. One or two anomalies do arise, forexample Barcelona achieves an excellent rating formanagement capability whilst scoring lower for allthe other indices.
It is worth noting, and not only in this context,that the availability and reliability of data for thisreport was not as good and as up-to-date as onewould have wished. The EU Framework Directiveon Ambient Air Quality Assessment and Manage-ment (EC, 1996) requires all cities with over250,000 inhabitants to provide data in the futureand this will present a real challenge in achievingdata consistency and QA/QC.
Relatively few cities have sufficient data toestimate the percentage of inhabitants exposed toexceedances of different pollutants in ambient air.There has been some debate as to whether ambi-ent air monitoring is a totally adequate indicator ofthe risk of human exposure to poor air quality.Individual exposure to pollutants is a complex rela-tionship between ambient, workplace and homeconcentrations and activity patterns. In northernregions, most individuals will spend the majority oftheir time indoors in winter whilst in the southernareas, during working hours, individuals will beincreasingly exposed to an air-conditioned envi-ronment during the summer months. Further cityepidemiological studies to evaluate regional differ-ences and relative risks of exposure would add sig-nificantly to our understanding of the impacts ofpoor air quality on Europe's population.
The attitude of national government or localauthority to freight and public transport in citiesvaries considerably. In the long term, traffic restric-tion may be necessary in many cities. Emergencyrestrictions are not the whole answer, and nationaland EU encouragement of cleaner technology andenergy-efficient public transport systems is anincreasingly vital tool for vehicle emission control.
City management infrastructure has oftenbeen developed ad hoc to deal with particular airquality issues. For example, in some countriesthere is no single authorised body for air qualitymanagement. In France, for example, emissioninventories and air quality status are dealt with byseparate agencies, whilst the Bucharest monitor-ing network exists under the control of three sepa-rate government bodies. A unification of suchresponsibilities would certainly make the work ofpan-European air pollution information exchangeand pollution control much easier.
125
The Way Forward
Recommendations for the Future
1 . It is recommended that cities from all regionswhich have failed to respond to this and otherEurope-wide surveys with air quality data orair quality management data, should be encour-aged to respond in the future (Chapter 10).
2 . Explicit statements are required of manage-ment objectives for air quality at city level butlinked with national, regional and global objec-tives. An EEA workshop (ETC-AQ, 1996b)agreed that the ETC-AQ should help carry outthe Assessment of Air Quality which should:
a . present and map air quality in Europe atrelevant spatial and temporal scales,
b . provide quantitative relationships betweenair quality and the source emissionsresponsible, and
c . provide quantitative information on theexposure of people, ecosystems and mate-rials to air pollution, in order to allow riskassessment and effect evaluations to becarried out.
d . Priority issues were identified as:• urban and local air quality,• ozone and photochemical air
pollution, and• fine particulates.
3 . Harmonisation of air quality measurementmethods and quality control of the data collec-tion and dissemination processes (QA/QC)should be encouraged across Europe. If citydata are to be used for regional and interna-tional strategic planning, or to enforce compli-ance with international agreements onpollution discharges, then there is a real needto encourage a commonality of quality controlmeasures across Europe (Chapter 9 and EEAWorkshop Report (ETC-AQ, 1996b)).
4 . The procedures for reporting city pollutantlevels and exceedances should be harmonisedby the publication of pan-European guidelines(EEA Workshop Report (ETC-AQ, 1996b)).
5 . The continuity of selected data sets should beencouraged if there is an international andnational need for trend data, even if the localissues appear to have been solved (Chapter 5).
6 . Monitoring data should be available to assessthe spatial distribution of pollutants within acity and allow an assessment of exposure ofsensitive groups of people and areas (EEAWorkshop Report (ETC-AQ, 1996b)).
7 . Epidemiological studies should be encouragedand some of these should aim to provide a rel-ative risk assessment of exposure from differ-ent exposure routes, including those fromambient air, occupational and indoor sources(Chapter 8).
8 . The further development of cost-benefit analy-sis and economic instruments in the context ofprioritisation of actions to promote sustainabledevelopment should be considered (Chapter 2).
9 . Cities should be encouraged to disseminate airquality information to the public and to adopta proactive role with the population toenhance public awareness (Chapter 9).
1 0 . Cities should be encouraged to develop a uni-fied management infrastructure to deal with allaspects of air pollution measurement and pro-vide management to integrate strategies, avoidduplication of effort, and ensure compatibilityof data sets (Chapter 9).
1 1 . Cities should also be encouraged to developmanagement infrastructures which are capablenot only of using the information to effectivelymanage air quality locally, but are equally ableto tailor city management requirements tonational and international sustainable develop-ment (Chapter 9).
The Way Forward
126
Aarnio, P. (1996): Personal Communication, Emis-sion Inventory for Helsinki Metropolitan Area. -Helsinki Metropolitan Area Council, EnvironmentalO f f i c e .
AEAT (1996): http://www.aeat.co.uk/netcen/airqual/forecast/welcome.html, 28.08.1996.
AGMAAPE (1995): Health Effects of Exposure toMixtures of Air Pollutants, Fourth Report. - Advi-sory Group on the Medical Aspects of Air PollutionEpisodes, Department of Health.
AIRBASE (1996): http://www.etcaq.rivm.nl
APIS (1996): Air Pollution Information System -European Commission, DG XI-D3.- CD-ROM Database.
at-net (1996): Public Transport in Vienna -h t t p : / / w w w . a t - n e t . c o . a t / a u s t r i a / o r t e / W i e n / p u b l t r a n .h t m
Barrett, K., Seland, Ø., Foss, A., Mylona, S.,Sandnes, H., Styve, H., Tarrasón, L. (1995): Euro-pean Transboundary Acidifying Air Pollution: TenYears Calculated Fields and Budgets to the End ofthe First Sulphur Protocol. - EMEP MSC-W, Oslo.
Barrett, M., Protheroe, R. (1995): Sulphur Emissionfrom Large Point Sources in Europe. Air Pollutionand Climate Series Vol.3. - The Swedish NGO Sec-retariat on Acid Rain, Göteborg.
BCC (1995): Pollution Report for Belfast. - BelfastCity Council.
Bower, J.S., Broughton, G.F.J., Willis, P.G. andC l a r k , H. (1995): Air Pollution in the UK: 1994. –AEA Technology: National Environmental Technol-ogy Centre. AEA/RAMP/200015001/1.
Butlin, R.N., Yates, T.J.S., Murray, M., Ashall, G.(1995): The United Kingdom National MaterialExposure Programme. – Water, Air and Soil Pollu-tion, 85(4): 2655 -2660.
C30 (1996): Common Position on proposed CouncilDecision Establishing a Reciprocal Exchange ofInformation and Data from Networks and Individ-ual Stations Measuring Ambient Air Pollutionwithin the Member States. – Official Journal of theEuropean Communities of 03.02.1996.
CHMI (1995): Air Pollution in the Czech Republic1994. – Czech Hydrometeorological Institute, AirQuality Protection Department, Air Quality Infor-mation System.
COM(95) 327 final (1995): Report from the Com-mission on the State of Implementation of AmbientAir Quality Directives. – Commission of the Euro-pean Communities, 26.07.1995.
COM(95) 624 (1995): Progress Report on the Imple-mentation of the European Community Pro-gramme of Policy and Action in Relation to theEnvironment and Sustainable Development'Towards Sustainability'. – Commission of the Euro-pean Communities.
R e f e re n c e s
1 2 7
CONCAWE (1996) http://www/concawe.be/HTML/V O L U M E 5 2 /
CORINAIR'90 (1996): http://www.aeat.co.uk/cgi-b i n / w 3 - m s q l / n e t c e n / c o r i n a i r / d a t a b a s e . h t m l ,2 7 . 0 2 . 1 9 9 6 .
Costa, M., Baldasano, J.M., (1996): Development ofa Source Emission Model for Atmospheric Pollu-tants in the Barcelona Area. – Atmospheric Envi-ronment, 30(2): 309-318.
DoE (1989): The Effects of Acid Deposition onBuildings and Buildings Materials in the U.K. –Department of the Environment, London.
DoE (1995): Digest of Environmental Statistics -No.17 - Department of the Environment, London.
EC (1996): Framework Directive on Ambient AirQuality Assessment and Management. – EC Direc-tive 96/62/96.
EC/UN-ECE (1996): Forest Condition in Europe:Results of the 1995 Survey, 1996 Report. Conven-tion on Long-Range Transboundary Air Pollution -International Co-operative Programme on Assess-ment and Monitoring of Air Pollution Effects onForests. – European Commission, United NationsEconomic Commission for Europe.
EEA (1997): Air Pollution Monitoring in Europe,Problems and Trends. EEA Topic Report 26. –European Environment Agency, Copenhagen.
Eerens, H.C. (1996): Population Exposure Estimatesand Classification. – Personal Communication.
Eggleston, S. (1996): Provisional Emission Data for19 European Countries. – European Topic Centreon Air Emissions. – Personal Communication,
Elsom, D. (1996): Smog Alert, Managing Urban AirQuality. – Earthscan Publication, London.
EPAQS (1994): Benzene. – Expert Panel on AirQuality Standards, Department of the Environ-m e n t .
ETC-AE (1996a): CORINAIR '90 - Report 1 Summary.– European Topic Centre on Air Emissions, Euro-pean Environment Agency (Final Draft).
ETC-AE (1996b): CORINAIR '90 - Report 2 Summary.– European Topic Centre on Air Emissions, Euro-pean Environment Agency (Final Draft).
ETC-AQ (1995): Report on State of the Air PollutionMonitoring Situation in Europe - Problems andTrends. Project MA 1-2 (Draft). – European TopicCentre on Air Quality.
ETC-AQ (1996a): Air Quality in Europe, 1993: APilot Report. Project MA 2-4 (Draft). – EuropeanTopic Centre on Air Quality.
ETC-AQ (1996b): EEA Workshop Report. – Euro-pean Topic Centre on Air Quality, European Envi-ronment Agency, Copenhagen.
Fritsche, U., Rausch, L. (1993): KlimarelevanteEmissionen in Hannover - Datenerhebung zu Treib-hausgasen und Ozonabbauenden Substanzen. –Schriftreihe Kommunaler Umweltschutz, Heft Nr. 7,Landeshauptstadt Hannover, Der Oberstadtdirek-tor, Umweltdezernat.
Fritz, J.-S. (1991): A Suvey of Environmental Moni-toring and Information Management Programmesof International Organisations, 2nd edition. –United Nations Environment Programme-Harmo-nization of Environmental Measurement Office,M u n i c h .
Gustafsson, L.E., Steinecke, K. (1995): AirborneContaminants and their Impact on the City of Reyk-javik, Iceland. – The Science of the Total Environ-ment, 160/161: 363-372.
Haagenrud, S.E., Henriksen, J.F., Skancke, T. (1995):Mapping of Urban Degradation from AvailableData. – Water, Air and Soil Pollution, 85(4): 2667-2 6 7 2 .
Heinemann, U. (1992): Directory of Organizationsand Institutes Active in Environmental Monitoring,1st edition. – United Nations Environment Pro-gramme-Harmonization of Environmental Measure-ment Office, Munich.
IP/96/631 (1996): Commission Calls for ConcertedAction to Reduce Ground-Level Ozone. – EuropeanCommission Press Release, 11.7.1996.
IP/96/526 (1996): Commission Adopts Package toReduce Road Traffic Emissions. – European Com-mission Press Release, 19.6.1996.
Jelavic, V., Bakale, B., Stojak, V. (1995): Air Pollu-tant Emission Inventory of the Zagreb City. – Pro-ceedings of the 10th World Clean Air Congress,Emissions and Control, Espoo, Finland, 28 May-2June 1995, Vol. 1: 101-104.
R e f e r e n c e s
1 2 8
Katsouyanni, K., Zmirou, D., Spix, C., Sunyer, J.,Schouten, J.P., Pönkä, A., Anderson, H.R., Le Moullec, Y., Wojtynak, B., Vigotti, M.A.,Bacharova, L. (1995): Short-Term Effects of AirP o llution on Health: A European Approach UsingEpidemiological Time-scale Data. – European Res-piration Journal, 8: 1030 -1038.
Kristensen, P., Hansen, H.O. (eds) (1994): EuropeanRivers and Lakes: Assessment of their Environmen-tal State. EEA Environmental Monographs 1. –European Environment Agency, Copenhagen.
Kucera, V., Fitz, S. (1995): Direct and Indirect AirPollution Effects on Material Including CulturalMonuments. – Water, Air and Soil Pollution, 85(1):1 5 3 - 1 6 5 .
LIS (1992): TEMES-Jahresbericht 1991 - Kontinuier-liche Telemetrische Luftqualitätsmessungen -Berichte über Luftqualität in Nordrhein-Westfalen -Landesamt für Immissionsschutz Nordrhein-West-f a l e n .
Metallo, M.C., Poli, A.A., Diana, M., Persia, F., Cirillo,M.C. (1995): Air Pollution Loads on Historical Mon-uments: An Air Quality Model Application to theMarble Arch of Titus in Rome. – The Science of theTotal Environment, 171: 163-172.
Moussiopoulos, N. (1996): Air Pollution Modelling -presented at the EEA Workshop on Air QualityMonitoring and Modelling in Europe, Copenhagen,23-25 April 1996.
Mücke, H.-G., Turowski, E. (1995): Survey ofNational, Regional and Local Air Monitoring Net-works of the WHO European Region. Air HygieneReport 8, WHO Collaborating Centre for Air QualityManagement and Air Pollution Control at the Insti-tute for Water, Soil and Air Hygiene - Federal Envi-ronmental Agency - Berlin.
Murley, L. (ed.) (1996): NSCA Pollution Handbook1996 - The National Society for Clean Air and Envi-ronmental Protection.
Nilsson, M. (1995): To Clean the Air over Europe -Air Pollution and Climate Series, Vol. 4 - TheSwedish NGO Secretariat on Acid Rain, Göteborg.
Nord, A.G., Tronner, K. (1995): Effect of Acid Rainon Sandstone: The Royal Palace and the Rid-darholm Church Stockholm - Water Air and SoilPollution, 85 (4): 2719-2724.
OECD, (1995): Hazardous Air Pollutants - The Lon-don Workshop - OECD Documents - Organisationfor Economic Co-operation and Development.
Pape, R. (1995): The "Black" Triangle - Air Pollutionand Climate Series Vol.2 - The Swedish NGO Secre-tariat on Acid Rain, Göteborg.
Perry, R. and Gee, I.L. (1994): Vehicle Emissionsand Effect on Air Quality: Indoors and Outdoors -Indoor Environment, 3: 224-236.
QUARG (Quality of Urban Air Review Group)(1993): Urban Air Quality in the United Kingdom -First Report.
Rayfield, D., Longhurst, J.W.S., Conlan, D.E., Wat-son, A.F.R., Hewison, T., (1995): Procedures for theEstimation of Vehicle Emission in an Urban Envi-ronment - in Urban Transport and the Environ-ment for the 21st Century, Sucharov, L.J. (ed.),pp.207-214 - Computional Mechanics Publications,Southampton, Boston.
RIVM (1995a): Air Quality in Major European Cities,Part I, Scientific Background Document to Europe'sEnvironment - Sluyter, R.J. (ed.), RIVM Report no:7 2 2 4 0 1 0 0 4 .
RIVM (1995b): Air Quality in Major EuropeanCities, Part II, City Report Forms - van Zantvoort,E.D., Sluyter R.J., Larssen, S., (eds.), RIVM Reportno: 722401009.
RIVM/CEE (1995): Calculations made for the Euro-pean Environmental Agency: June 1995 - Bilthoven.
S030 (1996): Economic Evaluation of Air QualityTargets - Official Journal of the European Commu-nities, 13.2.1996.
S216 (1995): Cost-effective Control of Acidificationand Ground-level Ozone in Europe - Official Journalof the European Communities, 11.11.1995.
SCB (1995): Luftkoalitet i Tätorter 1986-1995 (AirQuality in Urban Areas 1986-1995) - Statistiska Cen-tralbyrån - Report No. 24 SM 9501.
Sluyter, R., Mol, W., Potma, C. (1996): AIRBASE:The European Air Quality Information System,Database Concept, System Contents and Data For-mats - presented at the EEA Workshop on Air Qual-ity Monitoring and Modelling in Europe,Copenhagen, 23-25 April 1996.
1 2 9
R e f e r e n c e s
Spiker, E.D., Hosker Jr., R.P., Weintraub, V.C., Sher-wood, S.I. (1995): Laboratory Study of SO2 D r yDeposition on Limestone and Marble: Effects ofHumidity and Surface Variables - Water, Air andSoil Pollution, 85: 4: 2679 - 2685.
Stanners, D., Bourdeau, P. (eds.) (1995): Europe'sEnvironment - The Dobrís̆ Assessment - EuropeanEnvironment Agency, Copenhagen. 675pp.
UBA (1996): http://aflodv.ubavie.gov.at:8001/cgi-bin/o3karte.sh, 28.08.1996
UISonline (1996): http://www.icf.de/UISonline/Bio-monitoring/bm010.htm, 09.08.1996.
UNEP (1987): The Greenhouse Gases - UNEP/GEMSEnvironment Library No. 1 - United Nations Envi-ronment Programme, Nairobi.
UNEP (1991): Urban Air Pollution - UNEP/GEMSEnvironment Library No.4 - United Nations Envi-ronment Programme, Nairobi.
UNEP (1993): United Nations Environment Pro-gramme Environmental Data Report, 1993-94 -Blackwell Publishers, Oxford.
UNEP/WHO (1994a): GEMS/AIR MethodologyReviews Vol. 1: Quality Assurance in Urban AirQuality Monitoring - WHO/EOS/94.1,UNEP/GEMS/94.A.2 - UNEP Nairobi.
UNEP/WHO (1994b): GEMS/AIR MethodologyReviews Vol. 3: Measurement of Particulate Matterin Ambient Air - WHO/EOS/94.3,UNEP/GEMS/94.A.4 - UNEP Nairobi.
UNEP/WHO (1994c): GEMS/AIR MethodologyReviews Vol. 4: Passive and Active SamplingMethodologies for Measurement of Air Quality-WHO/EOS/94.4, UNEP/GEMS/94.A.5 - UNEP Nairobi.
VIEPC (1996): Air Quality Monitoring - VoivodshipInspectorate for Environmental Protection inC r a c o w .
Wellburn, A. (1994): Air Pollution and ClimateChange - The Biological Impact, 2nd edition - Long-man Scientific & Technical.
WHO/UNEP (1992) Urban Air Pollution in Megaci-ties of the World, World Health Organization,United Nations Environment Programme, Black-wells, Oxford.
WHO/UNEP (1997): Air Quality Management andAssessment Capabilities in 20 Major EuropeanCities - World Health Organisation, United NationsEnvironment Programme - Monitoring and Assess-ment Research Centre, London.
WHO (1987): Air Quality Guidelines for Europe -WHO Regional Publications, European Series No.23- World Health Organization Regional Office forEurope, Copenhagen.
WHO (1995a): Concern for Europe's Tomorrow:Health and the Environment in the WHO EuropeanRegion - World Health Organization European Cen-tre for Environment and Health - WissenschaftlicheVerlagsgesellschaft mbH, Stuttgart.
WHO (1995b): Updating and Revision of the AirQuality Guideline for Europe - Report on the WHOWorking Group on Ecotoxic Effects - World HealthOrganization Regional Office for Europe -EUR/ICP/CEH 230/B.
WHO (1995c): Updating and Revision of the AirQuality Guideline for Europe - Meeting of the Work-ing Group 'Classical' Air Pollutants - World HealthOrganisation Regional Office for Europe -EUR/ICP/EHAZ 94 05/PB01.
WHO (1995d): Updating and Revision of the AirQuality Guideline for Europe - Report on the WHOWorking Group on Inorganic Air Pollutants - WorldHealth Organisation Regional Office for Europe -EUR/ICP/EHAZ 94 05/MT04.
Wieringa, K. (ed) (1995): Environment in the Euro-pean Union 1995, Report for the Review of the FifthEnvironmental Action Programme - European Envi-ronment Agency (EEA), Copenhagen.
R e f e r e n c e s
1 3 0

Air Quality Monitoring Capability Index
As part of an earlier study on air quality monitoring and assessment capabilities of 20 major cities aroundthe world carried out by MARC, conducted for the GEMS/AIR programme, an index score was developed(WHO/UNEP, 1996). The application of this index intends to assess the capabilities of different cities andidentify the extent to which the components required for the application of effective air quality managementare utilised. The purpose of this exercise is to identify the extent and means by which key information gen-erated through air quality monitoring and the production of emissions inventories is collected and appliedto develop effective air quality management strategies. Through determining the capabilities of cities in thedifferent components of an integrated air pollution control strategy it is easier to identify those areas inwhich resources could be most effectively used.
The index will be calculated from questionnaire responses, which use specific indicators intended to iden-tify the air quality management capabilities of the cities. The greater the number of the indicators a city isable to meet, the greater the air quality management capacity of the city. There are four sets of indicatorsassessing the different components of air quality management:
1 . Indicators of measurement capacity – the ability to measure the levels of air pollution in the city.2 . Indicators of data assessment and availability – the extent to which data are used, the confidence
with which these can be considered, and accessibility of the data in the public domain.3 . Indicators of emissions estimates – the extent of emissions knowledge about the city.4 . Indicators of air quality management – the ways in which the different components of air quality
monitoring are applied to develop management strategies.
These sets of indicators can then be combined to give an overall appraisal of the air quality monitoringcapability of the city in a manner which is objective and therefore more free of bias and less likely to mis-represent the capabilities of the city. In this assessment, each of the four components of air quality moni-toring capability has been given equal weight toward the overall assessment.
This innovative method to assess the air quality monitoring capability of a large number of cities has beensuccessfully tested and will provide decision-relevant information for policy makers, to help targetresources most efficiently to help improve capacities.
The following pages contain the indicator questions, which have been developed for the air quality moni-toring capabilities index. All the questions require a simple yes/no response.
131
Appendix 1
The questionnaire for the Air Quality Assessment andManagement Capability Surv e y

Indicators of Measurement Capacity
The following questions are indicators of the extent to which objectives of air quality monitoring networksare met for different pollutants. Only monitoring which is currently taking place regularly (at least once aweek) should be included:
1 . For which of the following pollutants does your city have at least one site monitoring central urbanbackground concentrations, which has been operating for at least one year (and therefore providesdata from which evaluation of possible chronic health effects is possible)?
2 . For which of the following pollutants does your city have at least one site monitoring central urbanbackground concentrations, which has been operating for at least one year and provides daily orhourly mean values (and therefore provides data from which evaluation of possible acute health effectsis possible)?
3 . For which of the following pollutants does your city have at least one site monitoring central urbanbackground concentrations, which has been operating for at least five years (and therefore providesdata from which evaluation of trends is possible)?
132
N O2 Yes / No
S O2 Yes / No
Particulate matter Yes / No
P b Yes / No
N O2 Yes / No
S O2 Yes / No
Particulate matter Yes / No
C O Yes / No
O3 Yes / No
N O2 Yes / No
S O2 Yes / No
Particulate matter Yes / No
C O Yes / No
P b Yes / No
O3 Yes / No
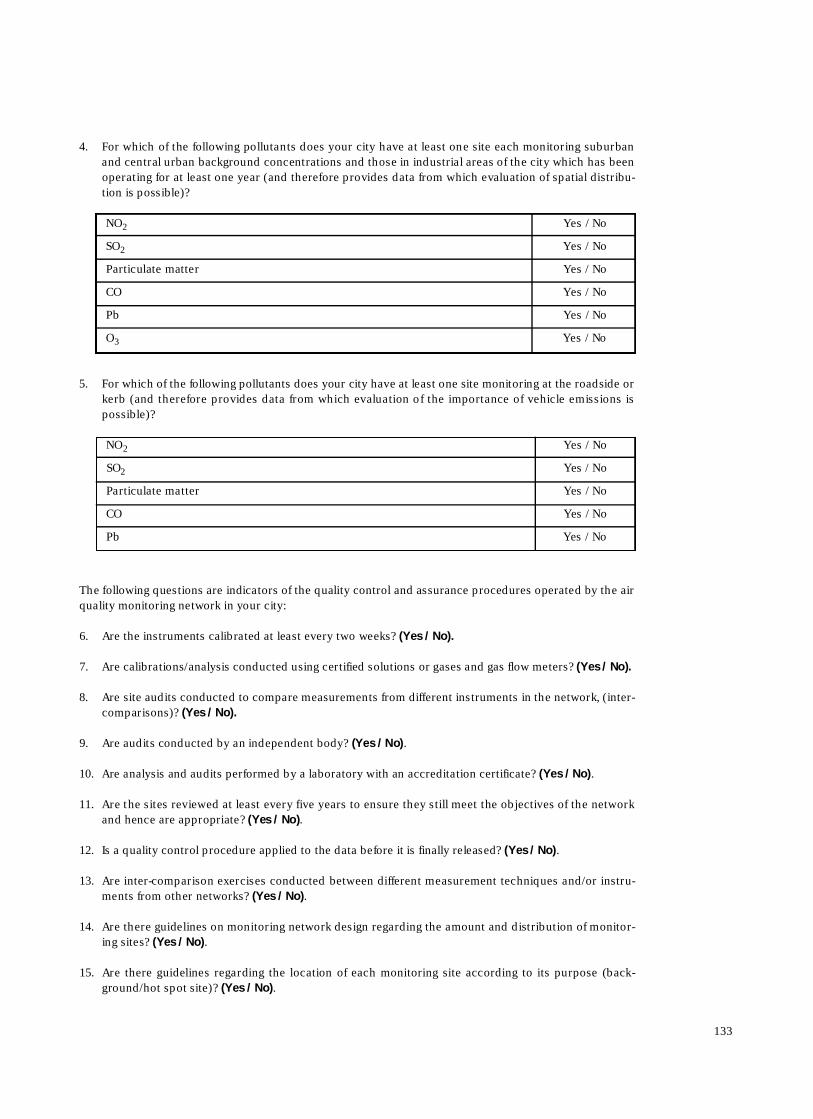
4 . For which of the following pollutants does your city have at least one site each monitoring suburbanand central urban background concentrations and those in industrial areas of the city which has beenoperating for at least one year (and therefore provides data from which evaluation of spatial distribu-tion is possible)?
5 . For which of the following pollutants does your city have at least one site monitoring at the roadside orkerb (and therefore provides data from which evaluation of the importance of vehicle emissions isp o s s i b l e ) ?
The following questions are indicators of the quality control and assurance procedures operated by the airquality monitoring network in your city:
6 . Are the instruments calibrated at least every two weeks? (Yes / No).
7 . Are calibrations/analysis conducted using certified solutions or gases and gas flow meters? (Yes / No).
8 . Are site audits conducted to compare measurements from different instruments in the network, (inter-comparisons)? (Yes / No).
9 . Are audits conducted by an independent body? (Yes / No).
1 0 . Are analysis and audits performed by a laboratory with an accreditation certificate? (Yes / No).
1 1 . Are the sites reviewed at least every five years to ensure they still meet the objectives of the networkand hence are appropriate? (Yes / No).
1 2 . Is a quality control procedure applied to the data before it is finally released? (Yes / No).
1 3 . Are inter-comparison exercises conducted between different measurement techniques and/or instru-ments from other networks? (Yes / No).
1 4 . Are there guidelines on monitoring network design regarding the amount and distribution of monitor-ing sites? (Yes / No).
1 5 . Are there guidelines regarding the location of each monitoring site according to its purpose (back-ground/hot spot site)? (Yes / No).
133
N O2 Yes / No
S O2 Yes / No
Particulate matter Yes / No
C O Yes / No
P b Yes / No
O3 Yes / No
N O2 Yes / No
S O2 Yes / No
Particulate matter Yes / No
C O Yes / No
P b Yes / No
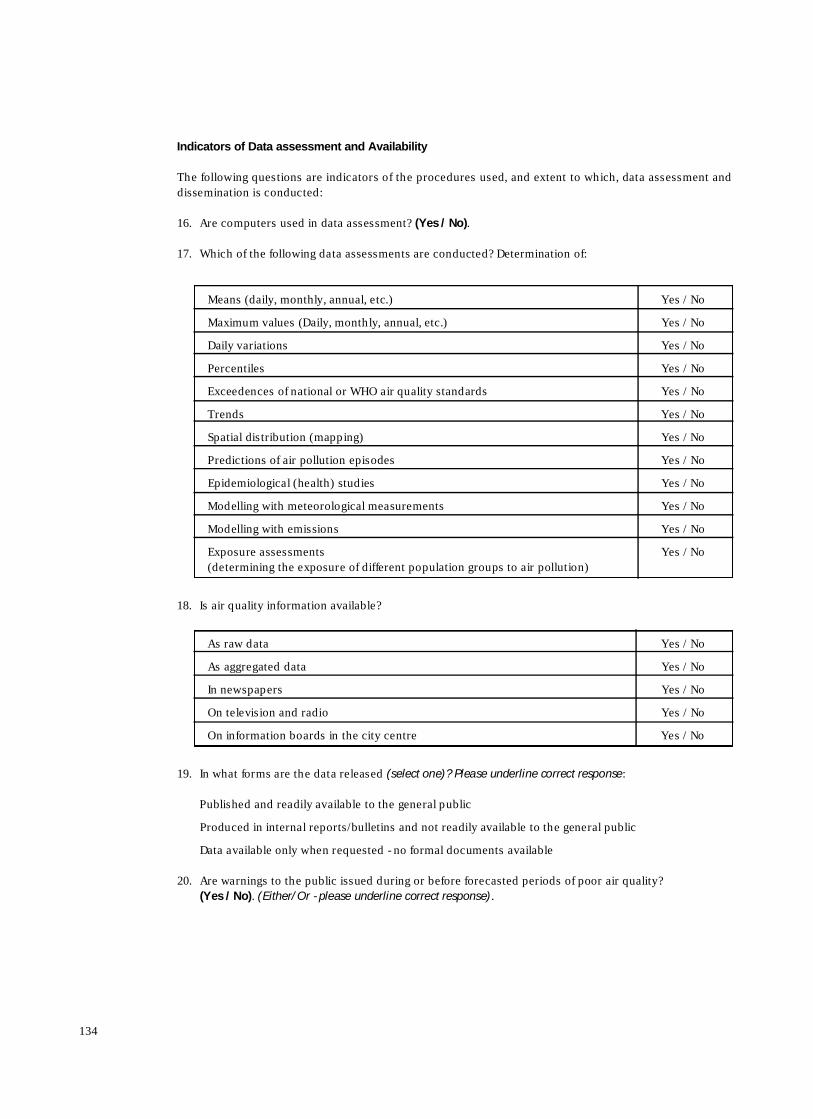
Indicators of Data assessment and Availability
The following questions are indicators of the procedures used, and extent to which, data assessment anddissemination is conducted:
1 6 . Are computers used in data assessment? (Yes / No).
1 7 . Which of the following data assessments are conducted? Determination of:
1 8 . Is air quality information available?
1 9 . In what forms are the data released (select one)? Please underline correct response:
Published and readily available to the general public
Produced in internal reports/bulletins and not readily available to the general public
Data available only when requested - no formal documents available
2 0 . Are warnings to the public issued during or before forecasted periods of poor air quality? (Yes / No). (Either/Or - please underline correct response).
134
Means (daily, monthly, annual, etc.) Yes / No
Maximum values (Daily, monthly, annual, etc.) Yes / No
Daily variations Yes / No
P e r c e n t i l e s Yes / No
Exceedences of national or WHO air quality standards Yes / No
T r e n d s Yes / No
Spatial distribution (mapping) Yes / No
Predictions of air pollution episodes Yes / No
Epidemiological (health) studies Yes / No
Modelling with meteorological measurements Yes / No
Modelling with emissions Yes / No
Exposure assessments Yes / No(determining the exposure of different population groups to air pollution)
As raw data Yes / No
As aggregated data Yes / No
In newspapers Yes / No
On television and radio Yes / No
On information boards in the city centre Yes / No
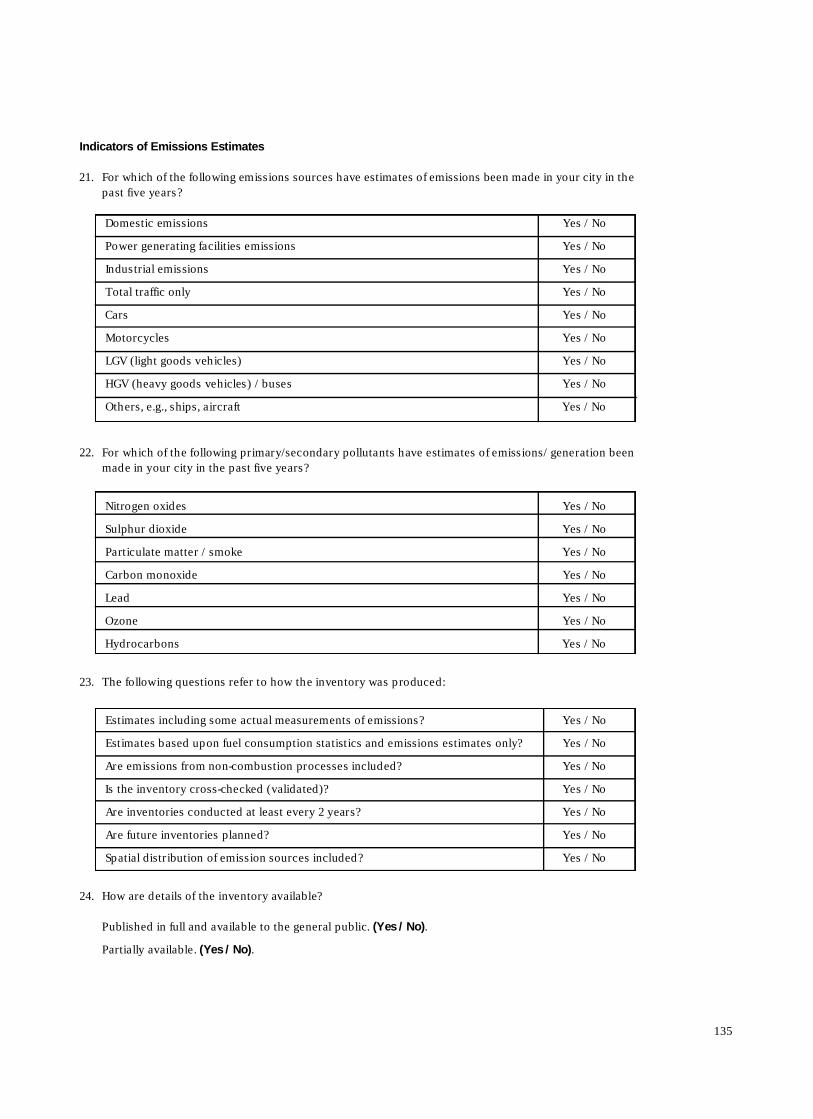
Indicators of Emissions Estimates
2 1 . For which of the following emissions sources have estimates of emissions been made in your city in thepast five years?
2 2 . For which of the following primary/secondary pollutants have estimates of emissions/ generation beenmade in your city in the past five years?
2 3 . The following questions refer to how the inventory was produced:
2 4 . How are details of the inventory available?
Published in full and available to the general public. (Yes / No).
Partially available. (Yes / No).
135
Domestic emissions Yes / No
Power generating facilities emissions Yes / No
Industrial emissions Yes / No
Total traffic only Yes / No
C a r s Yes / No
M o t o r c y c l e s Yes / No
LGV (light goods vehicles) Yes / No
HGV (heavy goods vehicles) / buses Yes / No
Others, e.g., ships, aircraft Yes / No
Nitrogen oxides Yes / No
Sulphur dioxide Yes / No
Particulate matter / smoke Yes / No
Carbon monoxide Yes / No
L e a d Yes / No
O z o n e Yes / No
H y d r o c a r b o n s Yes / No
Estimates including some actual measurements of emissions? Yes / No
Estimates based upon fuel consumption statistics and emissions estimates only? Yes / No
Are emissions from non-combustion processes included? Yes / No
Is the inventory cross-checked (validated)? Yes / No
Are inventories conducted at least every 2 years? Yes / No
Are future inventories planned? Yes / No
Spatial distribution of emission sources included? Yes / No
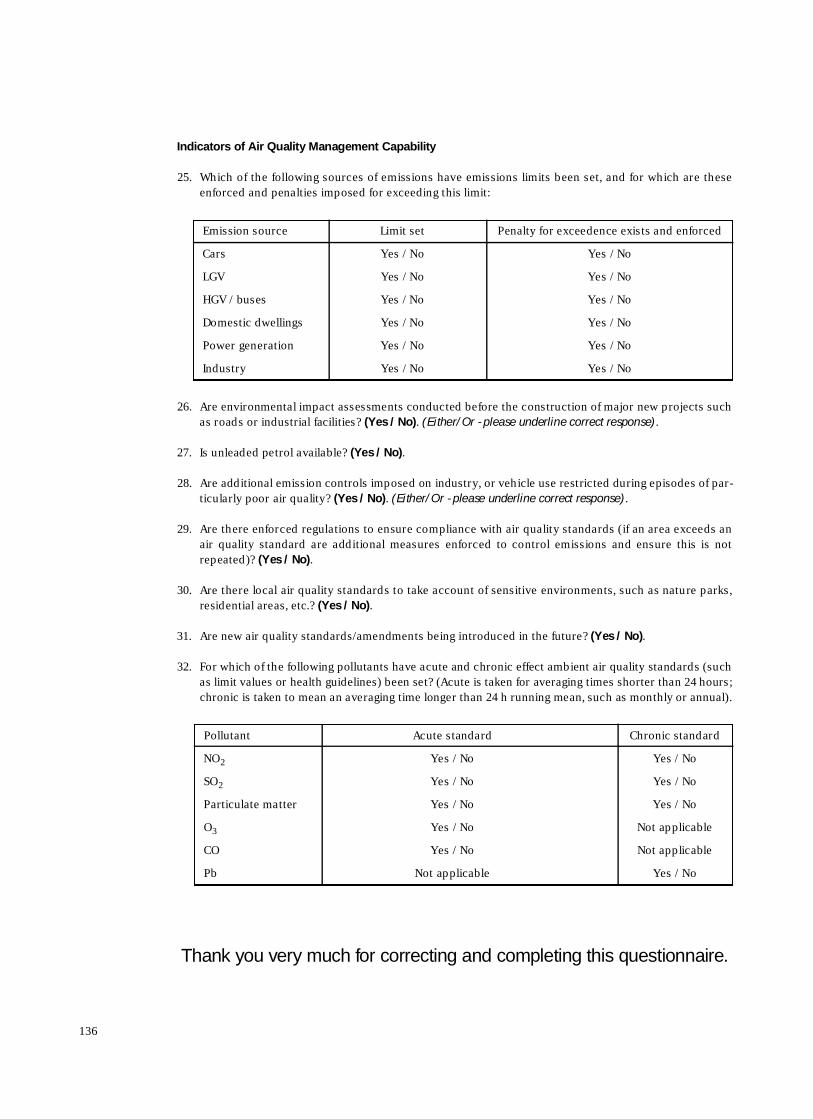
Indicators of Air Quality Management Capability
2 5 . Which of the following sources of emissions have emissions limits been set, and for which are theseenforced and penalties imposed for exceeding this limit:
2 6 . Are environmental impact assessments conducted before the construction of major new projects suchas roads or industrial facilities? (Yes / No). (Either/Or - please underline correct response).
2 7 . Is unleaded petrol available? (Yes / No).
2 8 . Are additional emission controls imposed on industry, or vehicle use restricted during episodes of par-ticularly poor air quality? (Yes / No). (Either/Or - please underline correct response).
2 9 . Are there enforced regulations to ensure compliance with air quality standards (if an area exceeds anair quality standard are additional measures enforced to control emissions and ensure this is notrepeated)? (Yes / No).
3 0 . Are there local air quality standards to take account of sensitive environments, such as nature parks,residential areas, etc.? (Yes / No).
3 1 . Are new air quality standards/amendments being introduced in the future? (Yes / No).
3 2 . For which of the following pollutants have acute and chronic effect ambient air quality standards (suchas limit values or health guidelines) been set? (Acute is taken for averaging times shorter than 24 hours;chronic is taken to mean an averaging time longer than 24 h running mean, such as monthly or annual).
Thank you ve ry much for correcting and completing this questionnaire.
136
Emission source Limit set Penalty for exceedence exists and enforced
C a r s Yes / No Yes / No
L G V Yes / No Yes / No
HGV / buses Yes / No Yes / No
Domestic dwellings Yes / No Yes / No
Power generation Yes / No Yes / No
I n d u s t r y Yes / No Yes / No
P o l l u t a n t Acute standard Chronic standard
N O2 Yes / No Yes / No
S O2 Yes / No Yes / No
Particulate matter Yes / No Yes / No
O3 Yes / No Not applicable
C O Yes / No Not applicable
P b Not applicable Yes / No
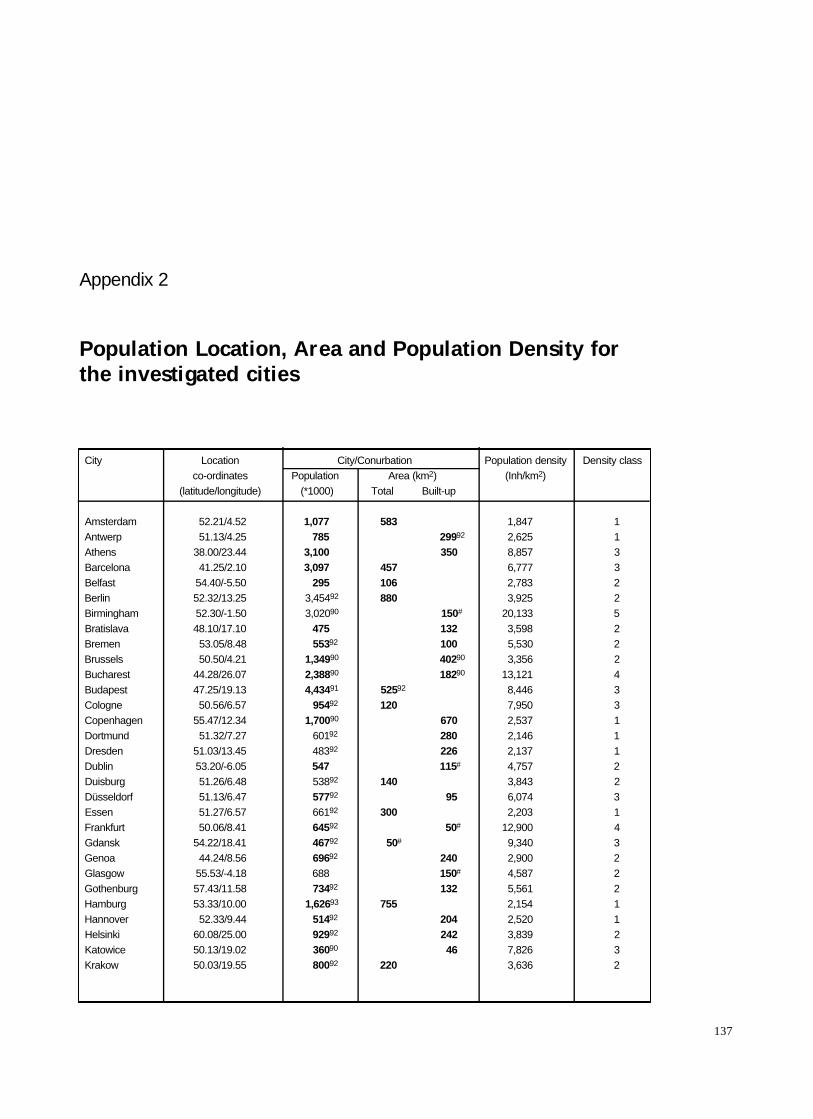
137
C i t y L o c a t i o n C i t y / C o n u r b a t i o n Population density Density classc o - o r d i n a t e s Population Area (km2) ( I n h / k m2)
( l a t i t u d e / l o n g i t u d e ) ( * 1 0 0 0 ) T o t a l B u i l t - u p
A m s t e r d a m 5 2 . 2 1 / 4 . 5 2 1 , 0 7 7 5 8 3 1 , 8 4 7 1A n t w e r p 5 1 . 1 3 / 4 . 2 5 7 8 5 2 9 99 2 2 , 6 2 5 1A t h e n s 3 8 . 0 0 / 2 3 . 4 4 3 , 1 0 0 3 5 0 8 , 8 5 7 3B a r c e l o n a 4 1 . 2 5 / 2 . 1 0 3 , 0 9 7 4 5 7 6 , 7 7 7 3B e l f a s t 5 4 . 4 0 / - 5 . 5 0 2 9 5 1 0 6 2 , 7 8 3 2B e r l i n 5 2 . 3 2 / 1 3 . 2 5 3 , 4 5 49 2 8 8 0 3 , 9 2 5 2B i r m i n g h a m 5 2 . 3 0 / - 1 . 5 0 3 , 0 2 09 0 1 5 0# 2 0 , 1 3 3 5B r a t i s l a v a 4 8 . 1 0 / 1 7 . 1 0 4 7 5 1 3 2 3 , 5 9 8 2B r e m e n 5 3 . 0 5 / 8 . 4 8 5 5 39 2 1 0 0 5 , 5 3 0 2B r u s s e l s 5 0 . 5 0 / 4 . 2 1 1 , 3 4 99 0 4 0 29 0 3 , 3 5 6 2B u c h a r e s t 4 4 . 2 8 / 2 6 . 0 7 2 , 3 8 89 0 1 8 29 0 1 3 , 1 2 1 4B u d a p e s t 4 7 . 2 5 / 1 9 . 1 3 4 , 4 3 49 1 5 2 59 2 8 , 4 4 6 3C o l o g n e 5 0 . 5 6 / 6 . 5 7 9 5 49 2 1 2 0 7 , 9 5 0 3C o p e n h a g e n 5 5 . 4 7 / 1 2 . 3 4 1 , 7 0 09 0 6 7 0 2 , 5 3 7 1D o r t m u n d 5 1 . 3 2 / 7 . 2 7 6 0 19 2 2 8 0 2 , 1 4 6 1D r e s d e n 5 1 . 0 3 / 1 3 . 4 5 4 8 39 2 2 2 6 2 , 1 3 7 1D u b l i n 5 3 . 2 0 / - 6 . 0 5 5 4 7 1 1 5# 4 , 7 5 7 2D u i s b u r g 5 1 . 2 6 / 6 . 4 8 5 3 89 2 1 4 0 3 , 8 4 3 2D ü s s e l d o r f 5 1 . 1 3 / 6 . 4 7 5 7 79 2 9 5 6 , 0 7 4 3E s s e n 5 1 . 2 7 / 6 . 5 7 6 6 19 2 3 0 0 2 , 2 0 3 1F r a n k f u r t 5 0 . 0 6 / 8 . 4 1 6 4 59 2 5 0# 1 2 , 9 0 0 4G d a n s k 5 4 . 2 2 / 1 8 . 4 1 4 6 79 2 5 0# 9 , 3 4 0 3G e n o a 4 4 . 2 4 / 8 . 5 6 6 9 69 2 2 4 0 2 , 9 0 0 2G l a s g o w 5 5 . 5 3 / - 4 . 1 8 6 8 8 1 5 0# 4 , 5 8 7 2G o t h e n b u r g 5 7 . 4 3 / 1 1 . 5 8 7 3 49 2 1 3 2 5 , 5 6 1 2H a m b u r g 5 3 . 3 3 / 1 0 . 0 0 1 , 6 2 69 3 7 5 5 2 , 1 5 4 1H a n n o v e r 5 2 . 3 3 / 9 . 4 4 5 1 49 2 2 0 4 2 , 5 2 0 1H e l s i n k i 6 0 . 0 8 / 2 5 . 0 0 9 2 99 2 2 4 2 3 , 8 3 9 2K a t o w i c e 5 0 . 1 3 / 1 9 . 0 2 3 6 09 0 4 6 7 , 8 2 6 3K r a k o w 5 0 . 0 3 / 1 9 . 5 5 8 0 09 2 2 2 0 3 , 6 3 6 2
Appendix 2
Population Location, Area and Population Density forthe investigated cities
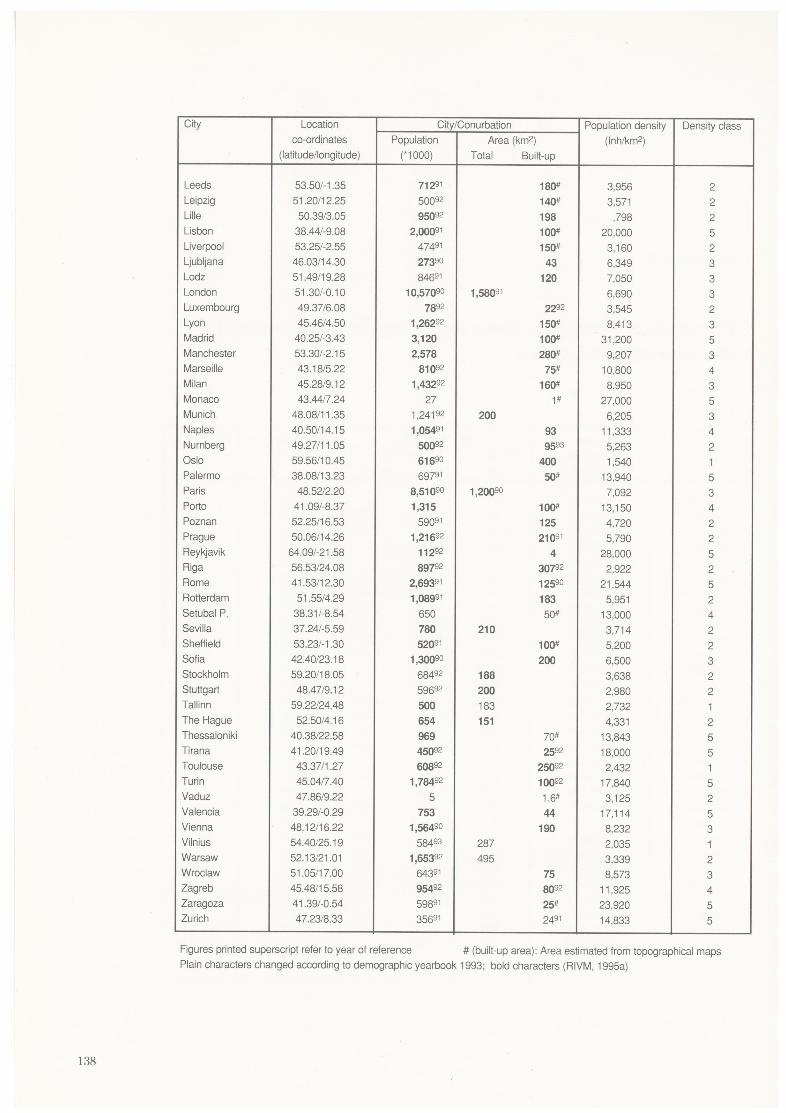
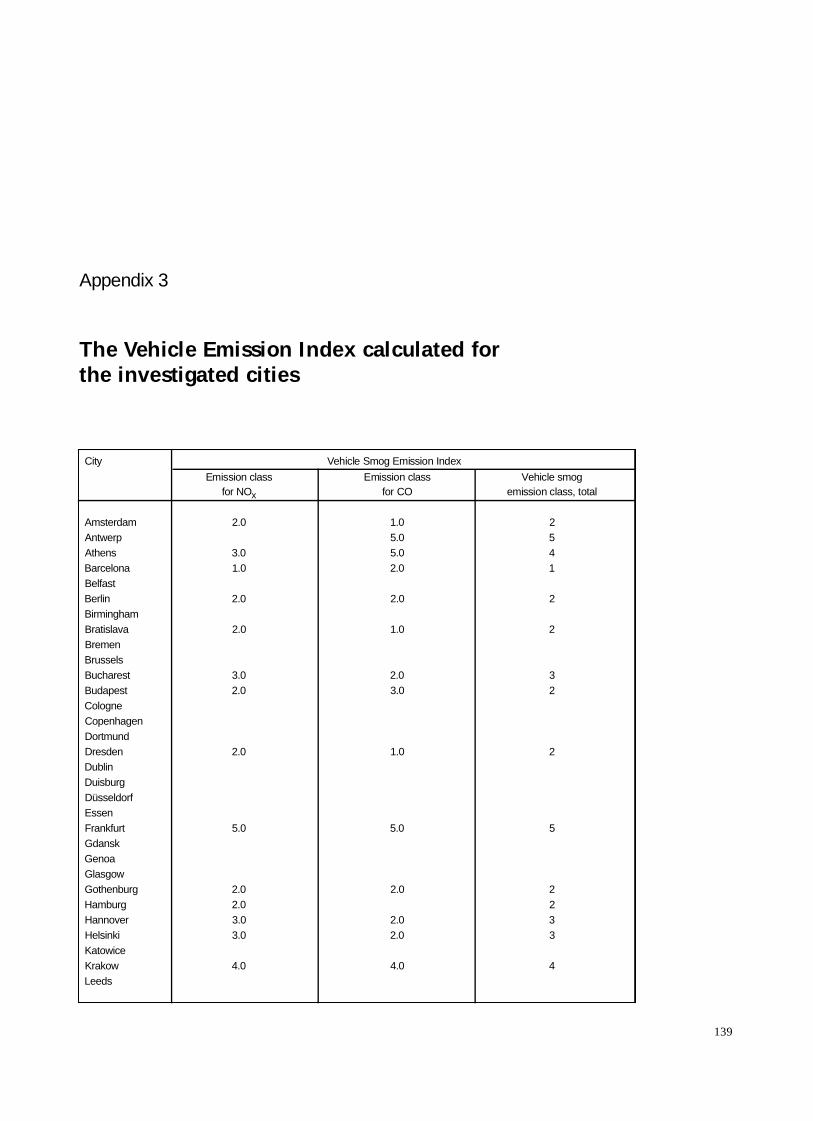
139
C i t y Vehicle Smog Emission Index
Emission class Emission class Vehicle smogfor NOx for CO emission class, total
A m s t e r d a m 2 . 0 1 . 0 2A n t w e r p 5 . 0 5A t h e n s 3 . 0 5 . 0 4B a r c e l o n a 1 . 0 2 . 0 1B e l f a s tB e r l i n 2 . 0 2 . 0 2B i r m i n g h a mB r a t i s l a v a 2 . 0 1 . 0 2B r e m e nB r u s s e l sB u c h a r e s t 3 . 0 2 . 0 3B u d a p e s t 2 . 0 3 . 0 2C o l o g n eC o p e n h a g e nD o r t m u n dD r e s d e n 2 . 0 1 . 0 2D u b l i nD u i s b u r gD ü s s e l d o r fE s s e nF r a n k f u r t 5 . 0 5 . 0 5G d a n s kG e n o aG l a s g o wG o t h e n b u r g 2 . 0 2 . 0 2H a m b u r g 2 . 0 2H a n n o v e r 3 . 0 2 . 0 3H e l s i n k i 3 . 0 2 . 0 3K a t o w i c eK r a k o w 4 . 0 4 . 0 4L e e d s
Appendix 3
The Vehicle Emission Index calculated forthe investigated cities
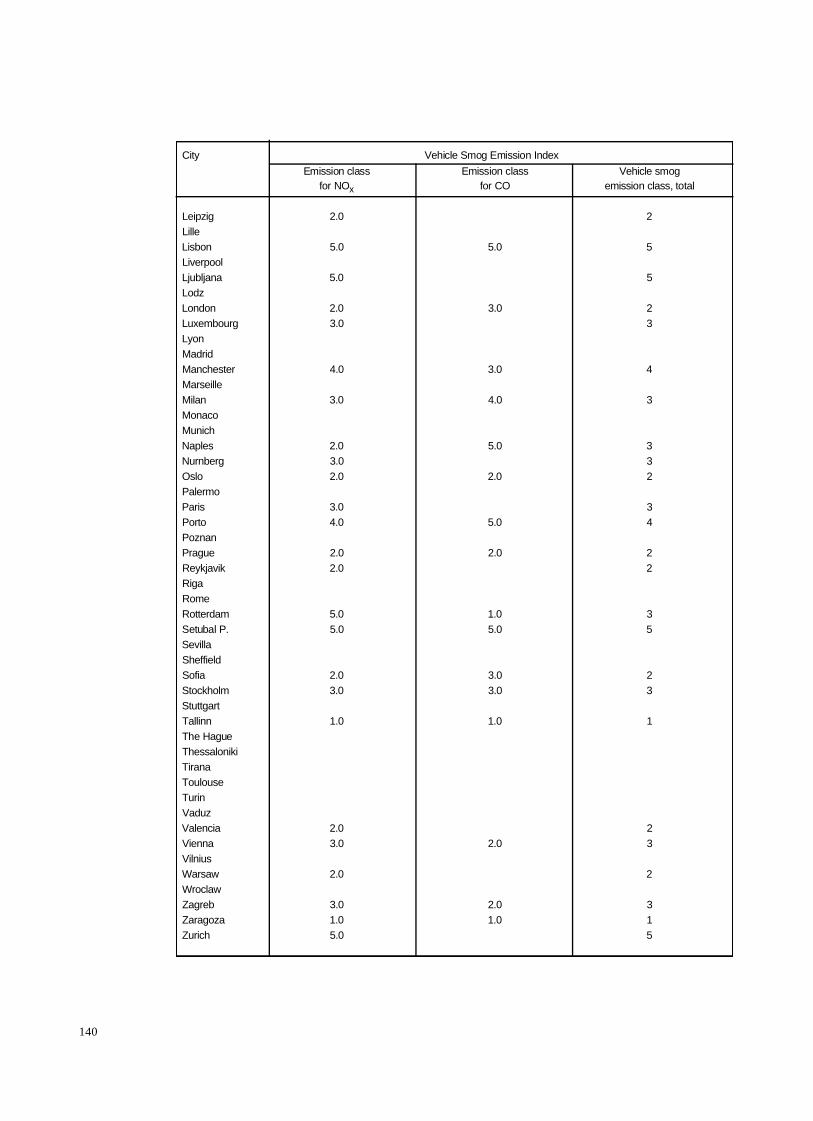
140
C i t y Vehicle Smog Emission Index
Emission class Emission class Vehicle smogfor NOx for CO emission class, total
L e i p z i g 2 . 0 2L i l l eL i s b o n 5 . 0 5 . 0 5L i v e r p o o lL j u b l j a n a 5 . 0 5L o d zL o n d o n 2 . 0 3 . 0 2L u x e m b o u r g 3 . 0 3L y o nM a d r i dM a n c h e s t e r 4 . 0 3 . 0 4M a r s e i l l eM i l a n 3 . 0 4 . 0 3M o n a c oM u n i c hN a p l e s 2 . 0 5 . 0 3N u r n b e r g 3 . 0 3O s l o 2 . 0 2 . 0 2P a l e r m oP a r i s 3 . 0 3P o r t o 4 . 0 5 . 0 4P o z n a nP r a g u e 2 . 0 2 . 0 2R e y k j a v i k 2 . 0 2R i g aR o m eR o t t e r d a m 5 . 0 1 . 0 3Setubal P. 5 . 0 5 . 0 5S e v i l l aS h e f f i e l dS o f i a 2 . 0 3 . 0 2S t o c k h o l m 3 . 0 3 . 0 3S t u t t g a r tT a l l i n n 1 . 0 1 . 0 1The HagueT h e s s a l o n i k iT i r a n aT o u l o u s eT u r i nV a d u zV a l e n c i a 2 . 0 2V i e n n a 3 . 0 2 . 0 3V i l n i u sW a r s a w 2 . 0 2W r o c l a wZ a g r e b 3 . 0 2 . 0 3Z a r a g o z a 1 . 0 1 . 0 1Z u r i c h 5 . 0 5
The management of air quality is a complex task consisting of
assessing the situation including monotoring and the appropri-
ate usage of data, existence of a legislative framwork allowing
the control of emissions and, enforcement of such legislation in
situations where air quality standards or objectives are not
being achived. The aim of the monograph is to give a compre-
hensive overview of the situation in European cities. A short
introduction into general air pollution problems is followed by a
summary of air quality guidelines and monitoring and data
assessment techniques frequently employed. The air quality
monitoring and management capability of 72 major urban
agglomerations within 32 countries is assessed on a city by city
basis. A further analysis of 10 detailed case studies into the
relative importance of key factors such as climate, economic,
topographic and demographic viewpoints is conducted and
recommendations on how to improve air quality conditions
most efficiently are suggested.