Embed Size (px)
Citation preview

Urban Accessibility in Motorcycle Dependent Cities – Case study in Ho Chi Minh City, Vietnam VAN, Nguyen Thi Cam; BOLTZE, Manfred; TUAN, Vu Anh
13th WCTR, July 15-18, 2013 – Rio de Janeiro, Brazil 1
URBAN ACCESSIBILITY IN MOTORCYCLE DEPENDENT CITIES – CASE STUDY IN
HO CHI MINH CITY, VIETNAM
Nguyen Thi Cam Van, Doctoral Candidate, Vietnamese-German Transport Research
Centre, Vietnamese-German University, Le Lai Street, Binh Duong New City, Binh Duong Province, Vietnam. Email: [email protected]
Manfred Boltze, Prof. Dr.-Ing., Technische Universitaet Darmstadt, Transport Planning
and Traffic Engineering, Petersenstr. 30, 64287 Darmstadt, Germany. Email: [email protected]
Vu Anh Tuan, Dr. Eng., Vietnamese-German Transport Research Centre,
Vietnamese-German University, Le Lai Street, Binh Duong New City, Binh Duong Province, Vietnam. Email: [email protected]
ABSTRACT
Motorcycle dependent cities have specific characteristics in terms of urban accessibility. A
rapid increase in the number of motorcycles and other private motorized modes make
transport problems more serious and cause severe capacity problems for the infrastructure
systems in these cities. Therefore, it is necessary to optimize the development of different
modes to meet travel demand and to ensure accessibility in all urban areas. This paper aims
to explore existing accessibility conditions in Ho Chi Minh City, a typical motorcycle dependent
city in Vietnam. Understanding of accessibility could be the key element for urban planning in
Ho Chi Minh City in particular and motorcycle dependent cities in general. Then, management
measures for motorcycles and competitive modes will be proposed to improve the accessibility
conditions and thus support sustainable urban transport development for motorcycle
dependent cities.
Keywords: Motorcycle dependent cities, accessibility, traffic management measures
INTRODUCTION
Motorcycle dependent cities (MDCs) have special characteristics of transport and land-use. In
many Asian cities, such as Hanoi, Ho Chi Minh City (HCMC), Bangkok, and Taipei, the urban
transport system is dominated by motorcycles that, in turn, influence land-use pattern by
allowing for the development of many areas which are only accessible by motorcycle. The
term “motorcycle city” was adopted first by Barter (1999) to address the urban transport and

Urban Accessibility in Motorcycle Dependent Cities – Case study in Ho Chi Minh City, Vietnam VAN, Nguyen Thi Cam; BOLTZE, Manfred; TUAN, Vu Anh
13th WCTR, July 15-18, 2013 – Rio de Janeiro, Brazil 2
land-use situation of Surabaya, Indonesia and HCMC, Vietnam. Khuat (2006) further defined
“motorcycle dependent city” by examining three indicators: vehicle ownership, availability of
transport alternatives, and use of motorcycle in the city. In a typical MDC, the urban traffic is
manifested by following characteristics: (1) high motorcycle ownership (more than 350
motorcycles per 1,000 inhabitants), (2) lack of public transport alternatives (less than one bus
per 1,000 inhabitants) and inadequate non-motorized trips compared with the motorcycle, (3)
very high share of motorcycles in the traffic flow (more than 50%) , and (4) high modal split of
motorcycles (more than 40%) and extremely low modal split of public transport (less than
20%) while the percentage of non-motorized trips is still significant (about 20 to 40%). The
option to use motorcycles is crucial for socioeconomic activities in MDCs. However, as cities
develop, other modes of transport such as private car and public transport also develop. The
inadequate transport infrastructure and deficiencies in urban planning are a raising problem in
terms of accessibility. The problem of accessibility is critical since it is regarded as a measure
for the integration of land-use and transport system (Pham et al., 2011). Because the unique
characteristics of MDCs (in terms of dominant motorcycle ownership and use) influence urban
and transport development, it is necessary to study the accessibility conditions. Clearly
understanding these conditions could give valuable advice on how to improve urban and
transport planning.
HCMC is known to be one of the most motorcycle dependent cities in the world. Currently,
there are about 680 motorcycles per 1,000 habitants. During the past fifteen years, HCMC
urban areas have expanded and some new urban districts have been established. The
urbanization process has happened rapidly without proper planning and thus results in
conflicts between urban and transport development. Those conflicts are becoming obstacles
for the long-term development of the city. This study attempted to investigate the existing
conditions and issues of accessibility in HCMC. Though the focus is on accessibility, mobility
is also mentioned to some extent. It is expected that the results of this study and proposed
traffic management measures could be helpful for enhancing accessibility within HCMC, and
these could be referred by other MDCs to improve their traffic conditions.
The structure of this paper consists of four parts. The second part, theoretical foundations,
presents the term of accessibility, indicators used for measuring the accessibility, and
theoretical foundations for the survey. The third part introduces initial results of the analysis of
accessibility in HCMC. The city is divided into different areas, and mobility and accessibility
conditions are comparatively analyzed for these areas. The paper also discusses future mode
choice and preferences. In the last part, conclusions and recommendations are made based
on the main findings from the survey.
THEORETICAL FOUNDATIONS
Studies on accessibility can be based on several foundations depending on the typical
characteristics of the study area and focused aspects of accessibility. In order to study and
understand accessibility conditions in a specific MDC, it is important to clarify the definitions,
methods and indicators used for the entire study. By defining the terms clearly at the
beginning, the scope of the study can be narrowed down, and the implications will be
applicable and meaningful.

Urban Accessibility in Motorcycle Dependent Cities – Case study in Ho Chi Minh City, Vietnam VAN, Nguyen Thi Cam; BOLTZE, Manfred; TUAN, Vu Anh
13th WCTR, July 15-18, 2013 – Rio de Janeiro, Brazil 3
Defining Accessibility
Beginning with Hansen (1959), the term of accessibility has been used in various forms in a
number of studies. Accessibility is defined as “the extent to which the land-use and transport
system enables (groups of) individuals or goods to reach activities or destinations by means of
a (combination of) transport mode(s)” (Geurs and Ritsema, 2001). This definition comprises a
transport component (the ease – amount of time, cost and effort – of reaching destinations), a
land-use component (spatial distribution and characteristics of potential destinations), a
temporal component (availability of activities throughout the day), and an individual component
(individual valuations of the components).
For economic activities, to be accessible or not seems to be a survival issue (Straatemeier,
2005). Adequate access to, for example, resources, labour, consumers, and suppliers are vital
conditions for the success of producers and other firms. For households, accessibility is
considered to be the ease to reach employment and urban services, and it is an important
measure of the quality of urban living. In other words, accessibility is a component of a “social
report” for a city or region (Wachs and Kumagai, 1973). Since accessibility is a function of both
land-use patterns and the performance of the transport system, it is an appropriate criterion to
evaluate the service provided by the transport system to different categories of users (Koenig,
1977; Black and Conroy, 1977).
Accessibility depends on both the transport system and the land-use pattern. The transport
system itself only provides functions for mobility and freight transport. In combination with the
land-use designation, the transport system provides access to spatially and temporally
dispersed resources. Since travelling is a mean to reach a destination, an accessibility
measure that reflects the distribution of activities within the city is a preferable measure of the
ease of traversing space via a given transport system (Hansen, 1959; Morris et al., 1979).
Morris et al. (1979) and Pirie (1981) examined the use of accessibility as a measure for
transport planning. They concluded that land-use and transport planners should aim for
creating favourable accessibility conditions for land-use, and that they need to take into
account both the quality of the transport system and the quality of the land-use system. In
some cases, improvements in accessibility may be achieved more effectively by reorganising
the distribution of activities in space and/or time.
There are two kinds of accessibility, “relative accessibility” and “integral accessibility” (Ingram,
1971). Relative accessibility describes the relation or degree of connection between any two
points, whereas integral accessibility describes the relation or degree of interconnection
between a given point and all others within a spatial set of points. Essentially, relative
accessibility is a measure of the effort involved in making a trip while integral accessibility is
some measure of total travel opportunities (Oberg, 1976). In this study, integral accessibility is
considered since it reflects the activities that people living in one place can really involve in
other places.
Measuring Accessibility
Normally, accessibility can be measured by considering how easily (i.e., in terms of travel
time, travel distance, and other physical constraints) people living in different locations can
reach certain types of activities, normally to jobs, shopping, education, and healthcare, etc., by
a particular transport mode (Halden, 2002). In order to measure integral accessibility,
indicators are selected. Accessibility indicators measure the benefit that households and firms

Urban Accessibility in Motorcycle Dependent Cities – Case study in Ho Chi Minh City, Vietnam VAN, Nguyen Thi Cam; BOLTZE, Manfred; TUAN, Vu Anh
13th WCTR, July 15-18, 2013 – Rio de Janeiro, Brazil 4
in an area enjoy from the existence and use of the transport infrastructure relevant for their
area (Wegener et al., 2002). Accessibility indicators provide possibly the most useful and
appropriate means of summarising a great deal of information on the location in relation to the
distribution of urban activities and the transport system that connects them (Wachs, 1978).
Depending on intended application, the practical value of accessibility indicators varies on the
extent to which they reflect behaviour and perception of the people. To measure integral
accessibility, basically, indicators include travel time and travel distance, travel speed, cost for
trips to reach places of employment and urban infrastructure and services (Koenig, 1977;
Black and Conroy, 1977).
Theoretical foundation of the survey in HCMC
To study mobility and accessibility of households, a household travel survey is often
conducted (Levinson, 1998 and Khuat, 2006). Questionnaires are designed for the survey in
order to collect data and information on household’s accessibility to work places, urban
infrastructure and services, which are then used to derive indicators of the integral
accessibility. The questionnaires are usually divided into 3 parts: (1) household characteristics
and current mobility, (2) household accessibility, and (3) preferences for future transport.
Questions are given to explore accessibility conditions of households to transport networks,
working places, schools, markets, hospitals, recreational places, and transit stations.
Transport modes to reach such places are also investigated. Main indicators often include the
most frequently used mode, trip cost, travel distance and time, travel speed, parking
conditions, etc. Attitudinal questions on desired transport modes and certain implemented
traffic management measures are included as well.
An indicator for measuring accessibility is selected based on the four principles: (1) the
indicator should incorporate an element of spatial separation that is responsive to changes in
the performance of the transport system, (2) the measure should have behavioural
foundations, (3) the indicator should be technically feasible and operationally simple, and (4)
the measure should be understandable and easy to interpret (Morris et al., 1979). This study
attempted to investigate mode-wise accessibility by different population groups, to transport
networks, working places, schools, markets, hospitals, and recreational places and public
transport system.
The size of the samples is normally determined with consideration to confidence interval and
the size of the population. However, applying such an approach often results in a very large
number of the samples (i.e., large-scale survey) that is definitely not affordable in this study.
Therefore, this study applied a small-scale survey based on the experience of previous studies
(Du, 2012).
ACCESSIBILITY IN HO CHI MINH CITY
Case Study Area
Located in the South of Vietnam, HCMC is the biggest city in Vietnam in terms of population
and economic contribution to the country. It is also a centre of dynamic social and cultural
activities. With an area of 2,095 km2 (equivalent to only 0.6% of the whole country’s area) and
7.4million population (or 8.5% of the national population), the city currently contributes to
21.1% of the whole country’s GDP (HCMC Statistic Office, 2011). The city also acts as the

Urban Accessibility in Motorcycle Dependent Cities – Case study in Ho Chi Minh City, Vietnam VAN, Nguyen Thi Cam; BOLTZE, Manfred; TUAN, Vu Anh
13th WCTR, July 15-18, 2013 – Rio de Janeiro, Brazil 5
hub of the Southern Focal Economic Development Zone, which includes HCMC and 8
provinces and cities (Du, 2011).
Since 1986, the Government of Vietnam initiated a series of economic and political reforms
(the so-called Doi Moi policy). The national economy was changed from a centrally planned to
a market-based economy. As a result, the economy developed dramatically and the nation
started to be integrated into the world economy. Given its favourable location, HCMC received
huge investments from domestic and international organisations, and attracted a lot of
migrants from other provinces and rural areas. Very soon, the city became crowed and there
has been increasing demand on the infrastructure, including transportation, housing, markets,
hospitals, etc. Due to land limitation, the conflicts between land allocation for industrial,
commercial, residential, and transport functions occurred and created urban problems. In
addition, the lack of integration between transportation and land-use caused accessibility
problems (Pham et al., 2011). Due to the inadequate road infrastructure and poor urban
planning, motorcycles have become the most effective mode of transport. Most people use
motorcycles because of its convenience and low expense. Motorcycles can provide
accessibility to all places in the city, even where roads are small and only alleys are available.
As explained earlier, the term “Motorcycle Dependent City” is being used to describe the
specific situation of high ownership and intensive use of motorcycles (Khuat, 2006).
HCMC is currently divided into three types of area, city centre, newly developed areas, and
rural areas as shown in Figure 1 (Vietnamese Prime Minister, 2006). City centre (Area 1 in the
study) includes 13 urban districts - 1, 3, 4, 5, 6, 8, 10, 11, Go Vap, Tan Binh, Tan Phu, Binh
Thanh, and Phu Nhuan. Being the centre area of the whole city, there are many high rise
buildings, shopping malls, big schools, major hospitals, etc. concentrated in this area. Newly
developed areas (Area 2) include 6 newly developed districts - 2, 7, 9, 12, Binh Tan, and Thu
Duc. Those districts were mostly established from rural districts in 1997. Urbanization rate in
those districts is quite high as compared to the others. Located in favourable places nearby
the city centre, these districts have received huge investment in recent years to develop new
residential areas. Besides, investments in infrastructure system have also been provided to
support urban development. Rural areas (Area 3) include 5 rural districts - Hoc Mon, Nha Be,
Can Gio, Cu Chi and Binh Chanh. They are remote districts with low population density.
Infrastructure systems in this area are still poor due to limited investment.
Source: http://khudothimoi.com/dulieu
Figure 1 – Study Areas
Area 1
Area 2
Area 3
Urban Accessibility in Motorcycle Dependent Cities – Case study in Ho Chi Minh City, Vietnam VAN, Nguyen Thi Cam; BOLTZE, Manfred; TUAN, Vu Anh
13th WCTR, July 15-18, 2013 – Rio de Janeiro, Brazil 6
The samples
To understand accessibility characteristics of HCMC, we conducted a small-scale household
survey in the three areas. In each area, one or two districts were selected. In each district, two
wards were selected. Households in each ward were chosen randomly for investigation of
their accessibility conditions. The comparison revealed differences in opportunities within
certain travel distance and time for particular population groups. In total, 410 households (with
1,248 people) participated in the survey, including 200 in Area 1, 100 in Area 2, and 110 in
Area 3. Urban planning and transport characteristics of each area are briefly described below.
In Area 1, District 1 and 3 were chosen. These districts are the centre of business, politic,
culture, and tourism. In this area, major government agencies, offices for national and
international organizations, and trade centres are located. Particularly, District 1 is the
transport hub of the whole city with a central terminal of the public transport system and the
planned Urban Rail Mass Transit system. In these districts, the road network was well planned
by the French when they occupied the country. However, due to narrow roads and high traffic
volumes, these districts are getting congested. In Area 2, Binh Tan District was selected. This
district is located in the South-West of HCMC, about 12 km away from the city centre. In the
district, there is a lot of agricultural land. However, the speed of urbanization in this district is
very high, and agricultural land will very soon be converted to industrial and residential land. In
Area 3, Cu Chi District was selected. This is a rural district with most of the area covered by
agricultural land. However, due to a good topography, this district has been selected for big
industrial zones and new urban areas in the future.
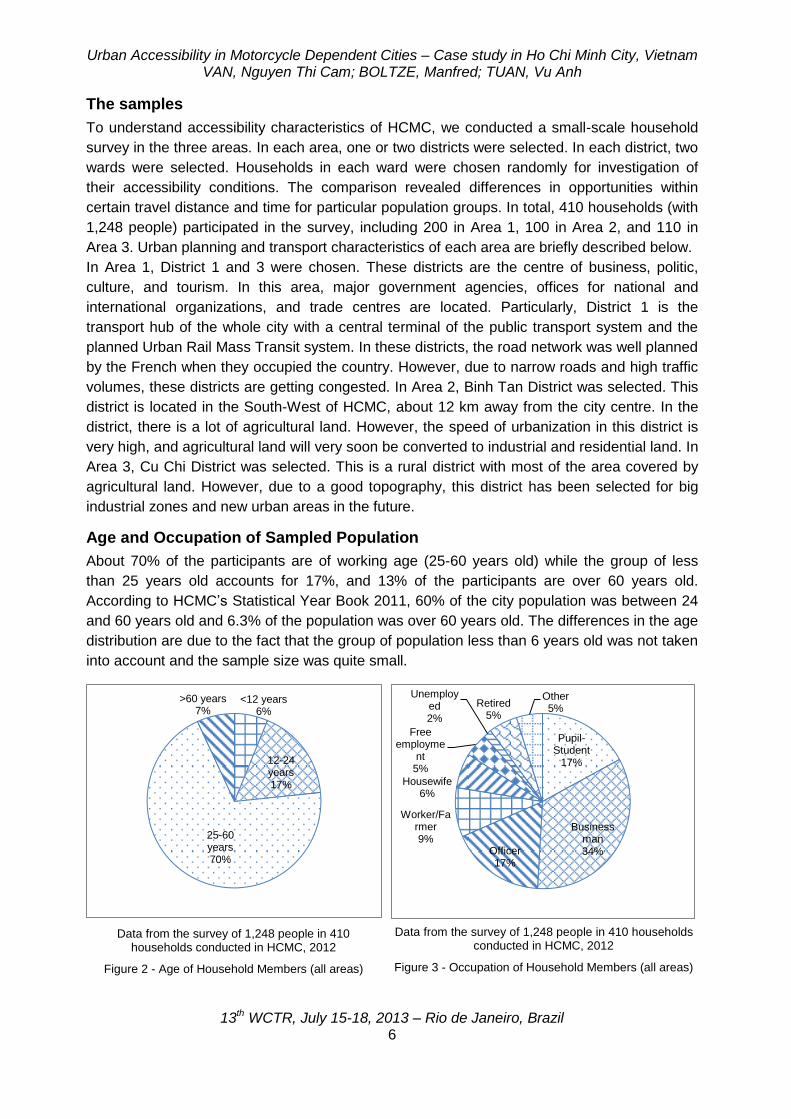
Age and Occupation of Sampled Population
About 70% of the participants are of working age (25-60 years old) while the group of less
than 25 years old accounts for 17%, and 13% of the participants are over 60 years old.
According to HCMC’s Statistical Year Book 2011, 60% of the city population was between 24
and 60 years old and 6.3% of the population was over 60 years old. The differences in the age
distribution are due to the fact that the group of population less than 6 years old was not taken
into account and the sample size was quite small.
<12 years 6%
12-24 years 17%
25-60 years 70%
>60 years 7%
Pupil-Student
17%
Business man 34% Officer
17%
Worker/Farmer 9%
Housewife 6%
Free employme
nt 5%
Unemployed 2%
Retired 5%
Other 5%
Data from the survey of 1,248 people in 410 households conducted in HCMC, 2012
Figure 2 - Age of Household Members (all areas)
Data from the survey of 1,248 people in 410 households conducted in HCMC, 2012
Figure 3 - Occupation of Household Members (all areas)

Urban Accessibility in Motorcycle Dependent Cities – Case study in Ho Chi Minh City, Vietnam VAN, Nguyen Thi Cam; BOLTZE, Manfred; TUAN, Vu Anh
13th WCTR, July 15-18, 2013 – Rio de Janeiro, Brazil 7
The sampled population is biased towards business men/women group (34%). Public/private
officers account for 17%, same as school pupil/student. The worker/farmer/fisher group
accounts for 9%, and housewife group is 6%.
Current Mobility
Trip Purposes and Most Frequently Used Mode
In terms of typical trip purposes, 46.3% of the total trips are “to work” trips, followed by
shopping/market trips (16.3%), “to school” trips 15.2%, and business trips 13.9%.
It shows that most of the household members use the motorcycle for their daily trips (75%).
The percentage of non-motorised transport, including walking and cycling, is quite low, about
14%. The percentage of public transport is extremely low for such a large city, only 4%. The
motorcycle ownership rate in HCMC is very high, about 680 motorcycles per 1,000 habitants
(HCMC Department of Transport, 2011). Although car ownership is still low, about 33 cars per
1,000 habitants, this rate is increasing sharply.
It is important to look at how the most frequently used modes changes by area. Although
motorcycles are the main mode of transport in all three areas, there is a little bit higher share
of walking and motorcycle in Area 1. In Area 2, bicycle and motorcycle play as the main
modes. In Area 3, besides motorcycle, there is a significant contribution of the bus system. A
main reason for the differences may be the different conditions of vehicle ownership and use.
In Area 1, owning a car can be affordable for many households since they normally have
higher incomes than the ones living in the other areas. However, operating a car in this area is
not easy due to the crowed and narrow road network and the limitation of parking spaces.
Besides, the close distance to essential places, such as markets, schools, hospitals, etc. in the
city centre makes private car ownership not a very urgent need for the people living here.
Meanwhile, households in Area 2 have greater availability of car parking places. They can use
the car more easily as the roads are more spacious. Therefore, high-income people in this
area prefer to own and use the car for going to the city centre. In Area 3, since the distance to
the city centre is quite far, mostly longer than 20 km, the motorcycle is not a safe and cheap
mode to go to the centre. So the bus has an important role to play in transporting people.
To entertainm
ent 5%
To work 46%
To school 15%
Shopping/ market 16%
Do business
14%
Other 4%
Walking 7%
Bicycle 7%
Motorcycle 75%
Car 4%
Taxi/Motorcycle taxi
1%
Bus 4%
Other 2%
Data from the survey of 1,248 people in 410 households conducted in HCMC, 2012
Figure 5 - Most Frequently Used Mode of Household Members (all areas)
Data from the survey of 1,248 people in 410 households conducted in HCMC, 2012
Figure 4 - Trip Purposes of Household Members (all areas)

Urban Accessibility in Motorcycle Dependent Cities – Case study in Ho Chi Minh City, Vietnam VAN, Nguyen Thi Cam; BOLTZE, Manfred; TUAN, Vu Anh
13th WCTR, July 15-18, 2013 – Rio de Janeiro, Brazil 8
Different age groups have different mode choices. Although the motorcycle is the major choice
for all groups, there are differences in the share of the most frequently used mode. In the age
of less than 12 years old, the schooling age, besides motorcycles (driven by their parents),
some pupils are carried by private cars and some can take bicycle by themselves when the
school is near their houses. For the group from 12 to 24 years old, the age of high school and
university, besides motorcycles, bicycles and buses are also frequently used. In the group
from 25 to 60 years old, the working age group, motorcycles take a dominant role. For the
group older than 60 years old, there are significant shares of the people walking and using
buses.
Average Trip Distance and Travel Time
It was found that 64% of the typical trips of the household representatives are shorter than 5
km. Within this distance, trips can be easily done by bicycle or even by walking. However, the
shares of those two modes are very limited. There are 18% of the trips with the distance
ranging from 5 to 10 km, 7% ranging from 11 to 15 km, and 11% longer than 15 km.
0%
10%
20%
30%
40%
50%
60%
70%
80%
90%
100%
<12 years 12-24 years 25-60 years >60 years
Others
Bus
Taxi/Motorcycle taxi
Car
Motorcycle
Bicycle
Walking
<5km 64%
5-10km 18%
11-15km 7%
>15km 11%
<15 minutes
49% 15-30
minutes 38%
31-60 minutes
11%
>60 minutes
2%
Data from the survey of 410 households conducted in HCMC, 2012
Figure 7 - Average Trip Distance of Household Representatives (all areas)
Data from the survey of 410 households conducted in HCMC, 2012
Figure 8 - Average Travel Time of Household Representatives (all areas)
Data from the survey of 1,248 people in 410 households conducted in HCMC, 2012
Figure 6 - Age Groups and Most Frequently Used Mode of Household Members

Urban Accessibility in Motorcycle Dependent Cities – Case study in Ho Chi Minh City, Vietnam VAN, Nguyen Thi Cam; BOLTZE, Manfred; TUAN, Vu Anh
13th WCTR, July 15-18, 2013 – Rio de Janeiro, Brazil 9
Regarding the travel speed, it can be seen that the average speed of motorcycle is about 20
km/h. This speed derived is slightly higher than the average travel speed of the whole city
measured by KOICA (2012), about 18 km/h.
The motorcycles are definitely the major mode of transport for all distances, from a short trip
(less than 5 km) to a long trip (more than 10 km). For trips longer than 10 km, buses would be
more competitive than the motorcycle because they are relatively faster and much safer.
However, since motorcycles are conveniently and highly accessible, it is dominant for all
distances, including distances longer than 10 km. The current over-utilization of motorcycles
for long trips not only decreases the current market share of the city bus service but also
threatens the development of bus service and new systems in the long-term.
For people living in Area 1, most of their typical trips have the distance of less than 5 km. For
people living in Area 2, the share of typical trips longer than 10 km is significant. People living
in Area 3 mostly have typical trips of less than 5 km. This means, the people living in Area 3
work mostly in their area while people living in Area 2 work in the city centre.
Trip cost
The survey found that 35% of the household representatives pay less than 10,000 VND (about
0.5 USD) a day for travelling, 46% pay 10,000 VND to 30,000 VND (about 0.5 USD to 1.5
USD), 14% pay 31,000 VND to 50,000 VND (about 1.5 USD to 2.6 USD), and only 5% pay
more than 50,000 VND. This expense includes only fuel cost and parking fees when going by
motorcycle or car, or ticket fees when going by bus.
0%
10%
20%
30%
40%
50%
60%
70%
80%
90%
100%
<5km 5-10km 11-15km >15km
Truck
Bus
Taxi
Car
Motorcycle
Bicyle
Walking
0%
10%
20%
30%
40%
50%
60%
70%
80%
90%
100%
Area 1 Area 2 Area 3
>15km
10-15km
5-10km
<5km
Data from the survey of 410 households conducted in HCMC, 2012
Figure 9 - Average Trip Distance and Most Frequently Used Mode of Household Representatives (all areas)
Data from the survey of 410 households conducted in HCMC, 2012
Figure 10 –Trip Distance (by area)

Urban Accessibility in Motorcycle Dependent Cities – Case study in Ho Chi Minh City, Vietnam VAN, Nguyen Thi Cam; BOLTZE, Manfred; TUAN, Vu Anh
13th WCTR, July 15-18, 2013 – Rio de Janeiro, Brazil 10
Comparing the travel expense to the income of the household representatives, it can be seen
that the group which pays less than 10,000 VND for travelling a single trip has an income of
less than 3 million VND a month. Members of this group are mostly housewives, retired or
elderly people. Groups having the income from 3 million VND to 10 million VND are paying
mostly 10,000 to 30,000VND for travelling, and the higher income groups are paying more for
their travelling.
Household Accessibility
Parking Conditions
Parking spaces in HCMC are very limited. In the daytime, most of the household
representatives answered that they park their vehicles at their offices or companies. Others
park their vehicles in priced public parking places, which are very limited in the city. In the city
centre, there are on-road parking places and these are managed and charged by local district
administrators. Although the on-road parking negatively impacts the traffic flows, in the
circumstance of HCMC, this solution can help improve the problem of lacking parking spaces
for vehicles in the city centre.
<10.000 VND 35%
10.000-30.000 VND 46%
31.000-50.000 VND 14%
>50.000 VND 5%
0%
10%
20%
30%
40%
50%
60%
70%
80%
90%
100%
<1 milVND
1-3 milVND
>3-5 milVND
>5-10 milVND
>10 milVND
>50.000 VND
>30.000-50.000 VND
10.000-30.000 VND
<10.000 VND
Data from the survey of 410 households conducted in HCMC, 2012
Figure 11 - Expense for Trips of Household Representative (all areas)
Data from the survey of 410 households conducted in HCMC, 2012
Figure 12 - Expense for a Single Typical Trips and Income of Household Representative (all areas)

Urban Accessibility in Motorcycle Dependent Cities – Case study in Ho Chi Minh City, Vietnam VAN, Nguyen Thi Cam; BOLTZE, Manfred; TUAN, Vu Anh
13th WCTR, July 15-18, 2013 – Rio de Janeiro, Brazil 11
In nighttime, almost all motorcycles are parked inside the houses. Cars are parked inside the
houses or on the grounds of the houses. In some cases, cars are parked on the streets.
However, parking spaces for cars inside the houses are very limited and parking spaces on
streets are unsafe.
Width of the Road and Sidewalk in Front of the House
The widths of the road and sidewalk in front of the house are important indicators to assess
the ability of modes to access homes. The widths of the roads are different in different areas.
In Area 1, 56% of the roads are narrower than 7m, which are difficult to be accessed by cars.
44% of the roads are wider than 7m and accessible by car. However, as previously
mentioned, off-road car parking spaces in this area are very limited. Cars often park on the
road and thus negatively influence the traffic flow. Therefore, the operation of cars in this area
is difficult because of lack of parking spaces and low accessibility conditions. Only 32% of the
roads are wider than 12 m and allow bus operations. However, with such a limited percentage
of wide roads, the capacity of public transport in this area is also limited. Public transport
vehicles, particularly buses, need to be suitably selected to function well in such small streets.
In Area 2, the majority of the roads have widths from 7 m to 12 m. As explained above, as this
area is newly developed from rural districts, there was enough land to construct spacious
roads. Therefore, accessibility by car as well as by bus is better. In Area 3, roads wider than
12 m account for a significant share (nearly 40%). This is a favourable condition to develop
public transport in this area.
The width and quality of the sidewalk influences accessibility, especially accessibility by
walking and by bus. These are different across the three areas. In Area 1, the width is mostly
less than 0.5m (38.2%). There are also 28% of the sidewalks that are from 0.5 m to 1 m wide.
This situation can be explained by the limitation of land in the city centre. However, the quality
of sidewalk in this area is the best among the three areas thanks to the investment and the
frequent maintenance of the infrastructure system in Area 1. In Area 2, the width of sidewalks
is also mostly less than 0.5 m, but there are high portions of the sidewalks with the width from
1 m to 2 m and from 0.5 m to 1 m. In Area 3, there are many sidewalks having the width from
0
5
10
15
20
25
30
35
40
45
In-house Pricedpublic
parking
Public &free ofcharge
Pricedprivateparking
On thestreet
with fee
On thestreet
withoutfee
At home0
10
20
30
40
50
60
70
80
90
100
In-house Pricedpublic
parking
Pricedprivateparking
On thestreet
without fee
At home
Data from the survey of 410 households conducted in HCMC, 2012
Figure 13 – Daytime Parking of Household
Representative
Data from the survey of 410 households conducted in HCMC, 2012
Figure 14 – Nighttime Parking of Household Representative
% %

Urban Accessibility in Motorcycle Dependent Cities – Case study in Ho Chi Minh City, Vietnam VAN, Nguyen Thi Cam; BOLTZE, Manfred; TUAN, Vu Anh
13th WCTR, July 15-18, 2013 – Rio de Janeiro, Brazil 12
1 m to 2 m. The results show that the quality of sidewalk in Area 1 is the best, followed by the
one on Area 2, and the one in Area 3 is the worst.
Distance from the House to the Nearest Bus Station
The distance from the house to the nearest bus station shows the accessibility to public
transport service. The distances are different in the three areas. In Area 1, most of the houses
can access the nearest bus station within the radius of 500 m. In Area 2, the majority of the
distances range from 500 m to 1,000 m. In Area 3, 60% of the distances are longer than 1,000
m. That means the bus routes network in Area 3 is still limited. To attract more passengers to
public transport, particularly to the bus system, the distance from the house to the nearest bus
station should be made shorter by introducing more bus stops and bus routes, including both
trunk and feeder routes. The better road infrastructure in Area 3 may allow this.
0%
10%
20%
30%
40%
50%
60%
70%
80%
90%
100%
Area 1 Area 2 Aera 3
>12m
>7-12 m
>5-7m
3-5m
<3m
0%
10%
20%
30%
40%
50%
60%
70%
80%
90%
100%
Area 1 Area 2 Area 3
>2m
1-2m
0.5-1m
<0.5m
0%
10%
20%
30%
40%
50%
60%
70%
80%
90%
100%
Area 1 Area 2 Area 3
>3000m
2000-3000m
1000-2000m
500-1000m
<500m
Data from the survey of 410 households conducted in HCMC, 2012
Figure 15 - Width of the Road in Front of the Houses (by area)
Data from the survey of 410 households conducted in HCMC, 2012
Figure 17 - Distance from the House to the Nearest Bus Station (by area)
Data from the survey of 410 households conducted in HCMC, 2012
Figure 16 - Width of the Sidewalk in Front of the House (by area)

Urban Accessibility in Motorcycle Dependent Cities – Case study in Ho Chi Minh City, Vietnam VAN, Nguyen Thi Cam; BOLTZE, Manfred; TUAN, Vu Anh
13th WCTR, July 15-18, 2013 – Rio de Janeiro, Brazil 13
Distance from House to the Nearest Market/Hospital/School/Recreational Place
Distances from house to the nearest supermarket/market, hospital, school and recreational
place are important indicators for assessing accessibility to urban services. These services are
essential for human needs. Generally, the distances are different across the three areas. Area
1 and Area 3 have better accessibilities to those services as compared to Area 2. Although
Area 2 is newly developed, there are only a few new modern residential areas with good
infrastructure systems and services.
Preferences for Future Transport
If the current conditions of accessibility in HCMC may remain, it will influence the mode choice
and reduce the opportunity for public transport development in the future. Transport
development policies and traffic management measures will help to improve accessibility
conditions for the city. In order to propose effective policies and measures, it is important to
understand people’s mode choice preferences. Based on this understanding, potential policies
and measures will be considered.
0%
10%
20%
30%
40%
50%
60%
70%
80%
90%
100%
Area 1 Area 2 Area 3
>3000m
2000-3000m
1000-2000m
500-1000m
<500m
0%
10%
20%
30%
40%
50%
60%
70%
80%
90%
100%
Area 1 Area 2 Area 3
>3000m
2000-3000m
1000-2000m
500-1000m
<500m
0%
10%
20%
30%
40%
50%
60%
70%
80%
90%
100%
Area 1 Area 2 Area 3
>3000m
2000-3000m
1000-2000m
500-1000m
<500m
0%
10%
20%
30%
40%
50%
60%
70%
80%
90%
100%
Area 1 Area 2 Area 3
>3000m
2000-3000m
1000-2000m
500-1000m
<500m
Data from the survey of 410 households conducted in HCMC, 2012
Figure 18 - Distance from House to Supermarket/Market (by area)
Data from the survey of 410 households conducted in HCMC, 2012
Figure 19 - Distance from House to Hospital (by area)
Data from the survey of 410 households conducted in HCMC, 2012
Figure 20 - Distance from House to Schools (by area)
Data from the survey of 410 households conducted in HCMC, 2012
Figure 21 -Distance from House to Recreational Places (by area)
Urban Accessibility in Motorcycle Dependent Cities – Case study in Ho Chi Minh City, Vietnam VAN, Nguyen Thi Cam; BOLTZE, Manfred; TUAN, Vu Anh
13th WCTR, July 15-18, 2013 – Rio de Janeiro, Brazil 14
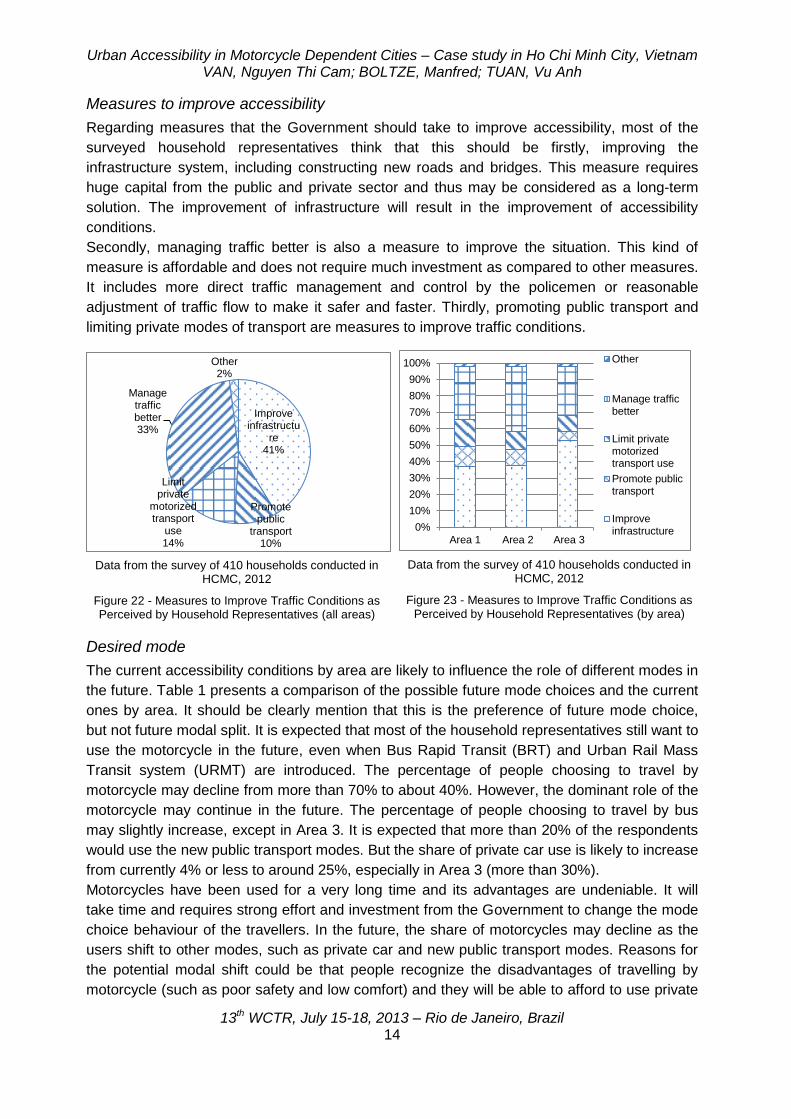
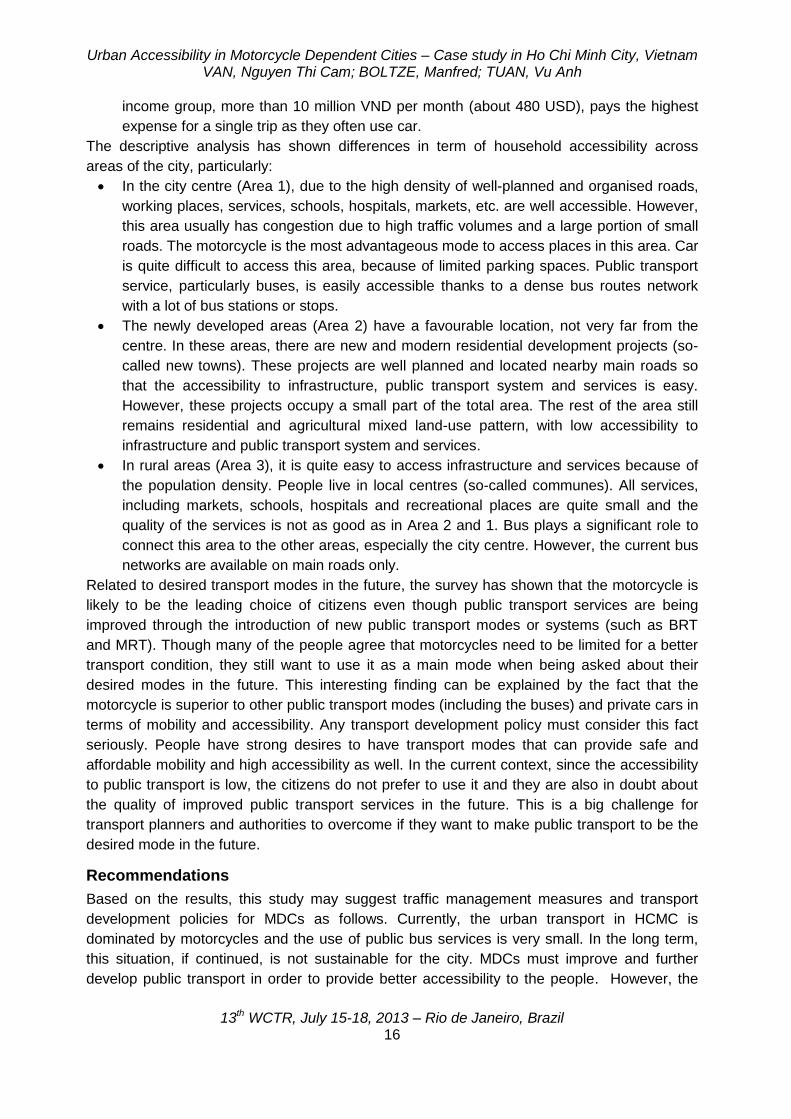
Measures to improve accessibility
Regarding measures that the Government should take to improve accessibility, most of the
surveyed household representatives think that this should be firstly, improving the
infrastructure system, including constructing new roads and bridges. This measure requires
huge capital from the public and private sector and thus may be considered as a long-term
solution. The improvement of infrastructure will result in the improvement of accessibility
conditions.
Secondly, managing traffic better is also a measure to improve the situation. This kind of
measure is affordable and does not require much investment as compared to other measures.
It includes more direct traffic management and control by the policemen or reasonable
adjustment of traffic flow to make it safer and faster. Thirdly, promoting public transport and
limiting private modes of transport are measures to improve traffic conditions.
Desired mode
The current accessibility conditions by area are likely to influence the role of different modes in
the future. Table 1 presents a comparison of the possible future mode choices and the current
ones by area. It should be clearly mention that this is the preference of future mode choice,
but not future modal split. It is expected that most of the household representatives still want to
use the motorcycle in the future, even when Bus Rapid Transit (BRT) and Urban Rail Mass
Transit system (URMT) are introduced. The percentage of people choosing to travel by
motorcycle may decline from more than 70% to about 40%. However, the dominant role of the
motorcycle may continue in the future. The percentage of people choosing to travel by bus
may slightly increase, except in Area 3. It is expected that more than 20% of the respondents
would use the new public transport modes. But the share of private car use is likely to increase
from currently 4% or less to around 25%, especially in Area 3 (more than 30%).
Motorcycles have been used for a very long time and its advantages are undeniable. It will
take time and requires strong effort and investment from the Government to change the mode
choice behaviour of the travellers. In the future, the share of motorcycles may decline as the
users shift to other modes, such as private car and new public transport modes. Reasons for
the potential modal shift could be that people recognize the disadvantages of travelling by
motorcycle (such as poor safety and low comfort) and they will be able to afford to use private
Improve infrastructu
re 41%
Promote public
transport 10%
Limit private
motorized transport
use 14%
Manage traffic better 33%
Other 2%
0%
10%
20%
30%
40%
50%
60%
70%
80%
90%
100%
Area 1 Area 2 Area 3
Other
Manage trafficbetter
Limit privatemotorizedtransport use
Promote publictransport
Improveinfrastructure
Data from the survey of 410 households conducted in HCMC, 2012
Figure 23 - Measures to Improve Traffic Conditions as Perceived by Household Representatives (by area)
Data from the survey of 410 households conducted in HCMC, 2012
Figure 22 - Measures to Improve Traffic Conditions as Perceived by Household Representatives (all areas)

Urban Accessibility in Motorcycle Dependent Cities – Case study in Ho Chi Minh City, Vietnam VAN, Nguyen Thi Cam; BOLTZE, Manfred; TUAN, Vu Anh
13th WCTR, July 15-18, 2013 – Rio de Janeiro, Brazil 15
cars as their incomes increase or willing to accept improved public transport services.
However, a significant number of the interviewed households want to use cars and the
demand for car ownership is increasing drastically. Therefore, the city needs to urgently and
continuously improve the conventional bus services and introduce mass rapid transit systems,
such as BRT and MRT, in order to attract the motorcycle users, and discouraging them from
shifting to private cars.
Table 1 – Mode Choice: Current and Future
CONCLUSIONS AND RECOMMENDATIONS
Conclusions
Main characteristics of the current mobility can be summarized as follows:
Different age groups have different mode choices. However, the motorcycle plays a
major role in carrying out daily travel for all ages. For the age of less than 12 years old,
the schooling age, besides motorcycle (driven by their parents), some pupils are
transported by private cars and some can take bicycle by themselves. Within the group
from 12 to 24 years, the age of high school and university, besides motorcycle, the
bicycle and bus are frequently used. In the age of 25 to 60 years, the working age, the
motorcycle has a dominant role, and other modes play only a minor role. Within the
group of more than 60 years, the retirement age, besides using the motorcycle, people
also are walking and using the bus.
The most frequently used modes are slightly different by trip distance. For trips shorter
than 5 km, the bicycle is used frequently. However, the use of this mode is decreasing
due to the poor road conditions. For trips ranging from 5 km to 10 km, motorcycles are
the most frequently used mode. For trips longer than 10 km, motorcycles become slightly
less preferable and buses seem to be more preferable.
The low income group, less than 3 million VND per month (about 145 USD), pays for a
single trip less than the middle income group (3-10 million VND per month). The high
Area 1 Area 2 Area 3
Mode
Existing choice Desired/Future choice
Existing choice Desired/Future choice
Existing choice Desired/Future choice
% Rank % Rank % Rank % Rank % Rank % Rank
Walking 7.9 2 2.0 4.9 4 1.0 6.8 3 0
Bicycle 6.4 3 5.4 5 7.2 2 4.0 5 8.4 2 2.0 4
Motorcycle 77.1 1 40.5 1 73.6 1 38.0 1 74.3 1 42.4 1
Private car 3.9 4 26.3 2 2.3 23.0 3 4.4 5 33.3 2
Bus 2.8 5 5.4 4 6.2 3 7.0 4 6.0 4 1.0 5
Taxi/Motorcycle taxi
0.2 0 2 0 0 0
BRT, Metro 0 20.5 3 0 27.0 2 0 21.2 3
Truck/ container 0 0 0 0 0 0
Other 1.7 0 3.9 5 0 0 0
Urban Accessibility in Motorcycle Dependent Cities – Case study in Ho Chi Minh City, Vietnam VAN, Nguyen Thi Cam; BOLTZE, Manfred; TUAN, Vu Anh
13th WCTR, July 15-18, 2013 – Rio de Janeiro, Brazil 16
income group, more than 10 million VND per month (about 480 USD), pays the highest
expense for a single trip as they often use car.
The descriptive analysis has shown differences in term of household accessibility across
areas of the city, particularly:
In the city centre (Area 1), due to the high density of well-planned and organised roads,
working places, services, schools, hospitals, markets, etc. are well accessible. However,
this area usually has congestion due to high traffic volumes and a large portion of small
roads. The motorcycle is the most advantageous mode to access places in this area. Car
is quite difficult to access this area, because of limited parking spaces. Public transport
service, particularly buses, is easily accessible thanks to a dense bus routes network
with a lot of bus stations or stops.
The newly developed areas (Area 2) have a favourable location, not very far from the
centre. In these areas, there are new and modern residential development projects (so-
called new towns). These projects are well planned and located nearby main roads so
that the accessibility to infrastructure, public transport system and services is easy.
However, these projects occupy a small part of the total area. The rest of the area still
remains residential and agricultural mixed land-use pattern, with low accessibility to
infrastructure and public transport system and services.
In rural areas (Area 3), it is quite easy to access infrastructure and services because of
the population density. People live in local centres (so-called communes). All services,
including markets, schools, hospitals and recreational places are quite small and the
quality of the services is not as good as in Area 2 and 1. Bus plays a significant role to
connect this area to the other areas, especially the city centre. However, the current bus
networks are available on main roads only.
Related to desired transport modes in the future, the survey has shown that the motorcycle is
likely to be the leading choice of citizens even though public transport services are being
improved through the introduction of new public transport modes or systems (such as BRT
and MRT). Though many of the people agree that motorcycles need to be limited for a better
transport condition, they still want to use it as a main mode when being asked about their
desired modes in the future. This interesting finding can be explained by the fact that the
motorcycle is superior to other public transport modes (including the buses) and private cars in
terms of mobility and accessibility. Any transport development policy must consider this fact
seriously. People have strong desires to have transport modes that can provide safe and
affordable mobility and high accessibility as well. In the current context, since the accessibility
to public transport is low, the citizens do not prefer to use it and they are also in doubt about
the quality of improved public transport services in the future. This is a big challenge for
transport planners and authorities to overcome if they want to make public transport to be the
desired mode in the future.
Recommendations
Based on the results, this study may suggest traffic management measures and transport
development policies for MDCs as follows. Currently, the urban transport in HCMC is
dominated by motorcycles and the use of public bus services is very small. In the long term,
this situation, if continued, is not sustainable for the city. MDCs must improve and further
develop public transport in order to provide better accessibility to the people. However, the
Urban Accessibility in Motorcycle Dependent Cities – Case study in Ho Chi Minh City, Vietnam VAN, Nguyen Thi Cam; BOLTZE, Manfred; TUAN, Vu Anh
13th WCTR, July 15-18, 2013 – Rio de Janeiro, Brazil 17
survey has shown that the motorcycle can provide good accessibility in almost all places in the
city. Any motorcycle restriction policy that is under serious debate should be very carefully
considered. If this policy is treated as a major solution to solve the problems of poor safety and
serious pollution, both the mobility and accessibility of the majority of the population will
seriously decline. Clearly, given the lack of road and parking infrastructure, private cars should
not play the role of main transport mode in the future because it cannot provide better
accessibility nor mobility for the city. However, the trend of using private car is in fact
increasing because people seek a safer and more comfortable means of transport. This trend
of traffic development is not possible for MDCs as it is obviously in conflict with transport and
urban development. Therefore, it is strongly recommended that the ownership and use of
private cars should be controlled, for example, by more strictly controlling the number of car
parking spaces and imposing higher parking charges.
In the long-term, improvement of public transport is clearly the most effective way to meet
increased travel demand and bring about safe and environmentally-friendly mobility pattern.
To promote public transport, the quality of the service needs to be improved first to make it
more attractive to motorcycle users. In the future, mass rapid transit such as rail-based mass
rapid transit and bus rapid transit will be introduced in order to increase the share of public
transport. The public transport system, including route alignments and stations, should be
designed to enhance the accessibility to urban services. It is also important to note that the
share of the new public transport systems in HCMC is expected to be still lower than in
developed cities. One of the main reasons may be that the people simply don’t know much
about the new systems and therefore they obviously don’t prefer them. Therefore, it is also
important to raise public awareness for improved public transport services.
Walking and cycling are very important to support public transport and help to decrease the
use of individual motorised transport modes. However, these non-motorized modes currently
play a very small role. The survey results have shown that there would be a decreasing trend
of non-motorized transportation use in the future. This negative trend should be reversed by
providing more comfortable and safer spaces and conditions for walking and cycling.
For the specific case study in HCMC, area-based traffic management measures are
recommended based on the survey results. These measures may include (1) public transport
measures, (2) non-motorised transport measures, (3) individual motorised vehicle measures
and (4) multimodal and intermodal transport measures (Khuat, 2006).
In Area 1, policies should focus on prioritizing motorcycle traffic against private car traffic and
on improving public transport. Car ownership and use should be controlled by higher
ownership tax and parking charge. To make the centre of this area more attractive to tourists,
non-motorised transport zones should be established.
In Area 2, traffic management measures should focus on controlling the use of private modes
from this area to the city centre. There should be tolling gates on roads leading to the city
centre to reduce individual trips by car going to the city centre. This measure helps decrease
the contribution of vehicles in Area 2 to the congested situation in the centre. As an
alternative, appropriate public transport should be organized and scheduled effectively.
In Area 3, developing public transport as the main mode of transport is necessary. Main
measures include public transport routing and scheduling improvement and information
services. It is essential to organize feeder bus systems. Besides, incentives to use public
transport should be given to the citizens living in this area. To support long term development

Urban Accessibility in Motorcycle Dependent Cities – Case study in Ho Chi Minh City, Vietnam VAN, Nguyen Thi Cam; BOLTZE, Manfred; TUAN, Vu Anh
13th WCTR, July 15-18, 2013 – Rio de Janeiro, Brazil 18
of the city, land-use management in this area needs to be seriously considered in
development projects for sustainable urban and transport development scenarios. Transit
oriented development is a promising model for this area.
In this study, since the survey was conducted on a small scale, some parts of the results may
be biased towards a certain part of the population. This might influence the accuracy of the
results. To capture the accessibility conditions for the whole city more accurately, it is
necessary to conduct a large scale survey. Besides, some aspects of accessibility that are not
sufficiently considered in this study should be taken into account comprehensively in the large
scale survey.
This study has just investigated the existing accessibility conditions of the city. To make further
recommendations and evaluate transport and land-use development scenarios, it seems to be
essential to develop an integrated accessibility index. Besides, changes in land-use patterns
and its impacts on accessibility should be also investigated. These tasks are future work.
REFERENCES
Black, J. and Conroy, M. (1977). Accessibility measures and the social evaluation of urban
structure. Environment and Planning A9, 1013-1031.
Bertolini, L. and Dijst, M.J. (2000). Mobiliteitsmilieus, Ankers voor het vluchtende stedelijke
leven. In L. Boelens (red.), Nederland Netwerkenland. Rotterdam: Nai publishers
Bertolini, L. (2004). Fostering urbanity in a mobile society: an exploration of issues
andconcepts. Grenoble: Paper presented at AESOP 2004.
Barter, R.P. (1999). An international Comparative Perspective on Urban Transport and Urban
Form in Pacific Asia: The Challenge of Rapid Motorization in Dense Cities. Doctoral
Thesis. Murdoch University.
Du, P.T. (2011). HCMC City Profile. HCMC Low Emission City Project. HCMC Institute for
Development Studies and Clean Air Initiative for Asian Cities Centre.
Du, P.T. (2012). Urban Form Characteristics in Relation with Increased Private Mode of
Transport in HCMC. HCMC Institute for Development Studies.
Geurs, K.T. and Ritsema van Eck, J.R. (2001). Accessibility measures: review and
applications. Evaluation of accessibility impacts of land-use transport scenario's, and
related social and economic impacts. RIVM - National Institute of Public Health and the
Environment, Bilthoven, the Netherlands.
Handy, S. and Niemeier, D.A. (1997). Measuring accessibility: an exploration of issues and
alternatives. Environment and planning A, Vol. 29, pp. 1175-1194.
Hansen, W. (1959). How accessibility shapes land-use. Journal of the American Institute of
Planners 25, 73-76.
Halden, D. (2002). Using accessibility measures to integrate land use and transport policy in
Edinburgh and the Lothians. Transport Policy 9,Issue 4, 313–324.
Khuat, V. H. (2006).Traffic Management in Motorcycle Dependent Cities.Doctoral Dissertation.
Technische Universitaet Darmstadt.
Hillman, M., Henderson and Whalley A. (1973) Personal Mobility and Transport Policy.
Politicaland Economic Planning, London.

Urban Accessibility in Motorcycle Dependent Cities – Case study in Ho Chi Minh City, Vietnam VAN, Nguyen Thi Cam; BOLTZE, Manfred; TUAN, Vu Anh
13th WCTR, July 15-18, 2013 – Rio de Janeiro, Brazil 19
Hillman, M., Henderson and Whalley A. (1976) Transport Realities and Planning Policy.
Political and Economic Planning, London.
HCMC Statistic Office (2011). HCMC Statistical Year Book.
HCMC Institute for Development Studies (2011). HCMC Socio-economic Master Plan up to
2025.
HCMC Department of Transport (2011). Annual report on transportation.
Ingram, D. R. (1971). The concept of accessibility: a search for an operational form. Regional
Studies 5, 101-107.
Koenig, J. G. (1977). Indicators of urban accessibility: theory and application. Transportation
9, 145-172.
Koica (2012). The feasibility study on Bus Rapid Transit system in HCMC, Vietnam. Final R
Levinson, D. M. (1998). Accessibility and the journey to work. Journal of Transport Geography
Vol. 6, No 1, pp. 11-21, 1998.
Levinson, D. (1997). Job and housing tenure and the journey to work. Annuals of Regional
Science 31, 451-471.
Morris, J. M., Dumble, P. L. and Wigan, M. R. (1979). Accessibility indicators for transport
planning. Transportation Research A 13 (4), 91-109.
Oberg S. (1976). Methods of Describing Physical Access to Supply Points. Studies in
Geography Series B. Human Geography No. 43, Department of Geography. The Royal
University of Lund, Sweden.
Pham, T.H.H., Bosch, F.V.D., Nguyen, N.Q., and Zuidgeest, M. (2011). Urban Form and
Accessibility to Jobs – A Comparison of Hanoi and Randstad Metropolitan
Areas.Environment and Urbanization ASIA, 2, 2 (2011): 265-285.
Pirie, G. H. (1981). The possibility and potential of public policy on accessibility. Transportation
Research A 15 (5), 377-381.
Staatemeier, T. (2005). Accessibility: an interesting concept to address strategic planning
issues in the Amsterdam region. Universiteit van Amsterdam, Amsterdam Institute for
Metropolitan and International Development Studies.
Schepel, S. and Zuidgeest, M.H.P. (2009). Ideas that shape urban form: And how urban form
shapes us. In C.P.T. Godefrooij and L. Sagaris (Eds), Cycling-Inclusive policy
development: A handbook (pp. 32 – 46).
Spiekermann, K. and Schumann, C. (2007). Update of selected potential accessibility
indicators. In: ESPON 2006 Programme, Final Report, S. 1-29.
Vietnamese Prime Minister (2006). HCMC Adjusted Construction Master Plan up to 2025.
Wachs M. and Kumagai T. G. (1973). Physical accessibility as a social indicator. Social-
Economic Planning Sci. 7.437-456.
Wachs M. (1978). Report on Plenary Session, Workshop H: Behavioural Modelling,
Accessibility, Mobility and Travel Need. Proc. 3rd Inter. Conf. Behavioural Travel
Modelling, Tanunda, South Australia. Croom Helm, London.
Wegener M., Eskelinnen H., Fürst F., Schürmann C. and Spiekermann K. (2002), Criteria for
the Spatial Differentiation of the EU Territory: Geographical Position, Forschungen
102.2, Bundesamt für Bauwesen und Raumordnung, Bonn.