Embed Size (px)
Citation preview
Proc. Nati. Acad. Sci. USAVol. 78, No. 4, pp. 2572-2576, April 1981Medical Sciences
Uptake and release of iron from human transferrin(human monoferric transferrins/reticulocyte uptake/competition/diferric versus monoferric transferrin/isoelectric focusing)
HELMUT HUEBERS, BETTY JOSEPHSON, EIKo HUEBERS, EVA CSIBA, AND CLEMENT FINCHDivision of Hematology, University of Washington, Seattle, Washington 98195
Contributed by Clement A. Finch, January 5, 1981
ABSTRACT Purified fractions of human apotransferrin,monoferric transferrins with iron on the acid-labile binding siteand on the acid-stable binding site, and diferric transferrin havebeen prepared. The iron loading and unloading behavior of thesepreparations has been examined by isoelectric focusing. Iron re-lease from the two monoferric transferrin preparations to humanreticulocytes was of similar magnitude. In a mixture containingequal amounts of diferric and monoferric iron, approximately 4times the amount of iron delivered by the monoferric species wasdelivered by the diferric species. Iron loading of transferrin invitro showed a random distribution between monoferric and di-ferric transferrin. Among the monoferric transferrins, loading ofthe acid-labile binding sites was greater than that ofthe acid-stablebinding sites. In vivo iron distribution in normal subjects, as eval-uated by in vitro-added 59Fe, gave similar results. Absorption ofa large dose of orally administered iron in iron-deficient subjectsresulted in a somewhat greater amount of diferric transferrin atlow saturation and a somewhat smaller amount of diferric trans-ferrin at higher saturations than would have been anticipated byrandom loading. These data would indicate that in the human, ironloading of transferrin may be considered essentially random. Un-loading from the two monoferric transferrin species is of similarmagnitude but far less than that delivered by diferric transferrin.
Internal iron exchange in man is mediated by the plasma pro-tein, transferrin. Methods for isolating and quantitating humantransferrin fractions and the behavior of the diferric form indonating iron to reticulocytes have been described (1). In thisreport, the iron loading and unloading behavior of the twomonoferric fractions along with the diferric fraction is described.
MATERIALS AND METHODS
Transferrin Preparations. Isolation of human diferric trans-ferrin and its conversion to apotransferrin was as described (2,3). In this study two independent procedures were employedfor the isolation of the two monoferric transferrins and the di-ferric form.
Method 1. The starting material was 200 mg of human apo-transferrin dissolved in 5 ml of 0.1 M Tris HCl, pH 8.0/0.01M sodium bicarbonate. To bring this solution to one-third sat-uration with iron, 94.6 ,ug of iron containing 30 ,Ci of 59Fe or90 ,Ci of 55Fe (1 Ci = 3.7 X 10'0 becquerels) as 0.2 M iron(II)ammonium sulfate in 0.01 M HC1 was added over a period of2 min. During the addition, the solution was continuously ag-itated on a Vortex shaker. After incubation for 30 min at 37°C,the pink solution was transferred into a Diaflo cone (Amicon,Lexington, MA) and concentrated to approximately 2 ml bycentrifugation (2000 rpm for 30 min). The concentrate waswashed twice with 4 ml of distilled water by repeating the cen-trifugation procedure and finally was reduced to approximately
1 ml. After being mixed with an equal volume of a saturatedaqueous sucrose solution, 1-ml aliquots were applied to thecathodic top of a 1.4 x 18 cm gel column [7.5% (wt/vol) poly-acrylamide/2% (wt/vol) Ampholine, pH 5-8]. The surface ofthe column had been previously covered by a sucrose solution(one-third saturated) containing 2% Ampholine (pH 5-8) duringa 2-hr prerun at 400 V and 4TC. Sodium hydroxide (0.25 M) andphosphoric acid (0.25 M) served as electrolytes in the cathodeand anode compartments of the electrophoretic cell (Bio-Rad,model 155). Isoelectric focusing of the transferrin sample wascarried out for 16 hr at 400 V and 4°C (3). This resulted in threedistinct, equally colored bands representing, in order of theirappearance from the acid side of the gel, diferric, monoferricacid-labile, and monoferric acid-stable transferrins (Fig. 1A).The gel was cut into slices of 2-mm thickness. The slices be-longing to the individual transferrin bands were pooled, andtheir protein was eluted by overnight shaking in a water bathafter the addition of 0.1 M Tris'HCl (pH 8.3) (3). Measurementof radioiron content has been described elsewhere (2).
Method 2. As starting material, 143 ml of plasma (with aserum iron concentration of 80 ,g/dl and an unsaturated iron-binding capacity of 270 ,g/dl) from a normal volunteer wasused. Labeling with trace amounts of radioiron was achievedby the addition of 50 ,uCi of 59FeSO4 in 2 ml of 0.01 M HC1 tothe well-stirred plasma over a period of2 min. After incubationfor 30 min at 37°C, the plasma was filtered (Whatman no. 1) anddiluted with an equal volume of 0.05 M Tris HCl (pH 8.3). Insome experiments trace amounts of human apotransferrin oracid-stable monoferric transferrin labeled with 125I were addedas markers (3). The mixture was then applied to a DEAE-Se-phacel column (5 x 55 cm, equilibrated with 0.02 M Tris HCl,pH 8.3), and elution was performed at 20°C at 40 ml/hr witha linear Tris-HCl gradient (0.17-0.24 M Tris-HCl, pH 8.3;stirred volume at the beginning of the elution, 1000 ml). Frac-tions of 6 ml were collected (Fig. 1B). Protein-containing frac-tions were identified by their absorption at 280 nm; measure-ment of their radioiron and radioiodine content was with anautogamma scintillation spectrometer (Packard, model 5330).Identification of the molecular form of the 59Fe-tagged trans-ferrin was achieved by isoelectric focusing of 0.3-ml aliquots(see above). The fractions containing the acid-stable transferrinwere further purified by using a phosphate-equilibrated Seph-adex G-50 column (1).
The isolated molecular forms of human transferrin preparedby these two methods were stable for a period of up to 4 wk at40C.
Before incubation with reticulocytes, 5-ml aliquots of thepurified transferrin preparations were buffer-exchanged againstHanks' buffer on a Sephadex G-25 column (0.8 x 25 cm).
Preparation ofIron-Free Plasma. To 25 ml ofnormal humanplasma, 1 ml of aqueous desferrioxamine B solution (50 mg/ml) was added, followed by the addition of 4 ml of 0.5 M phos-phate buffer (pH 5.1). The mixture was incubated for 30 minat 370C and subsequently applied to a Sephadex G-50 column
The publication costs ofthis article were defrayed in part by page chargepayment. This article must therefore be hereby marked "advertise-ment" in accordance with 18 U. S. C. §1734 solely to indicate this fact.
2572
Proc. Natl. Acad. Sci. USA 78 (1981) 2573
A90UI
: 60x
._
0
" 30co
0
^^ B
I I
30 60
Fraction
90 200 220 240 260
Fraction
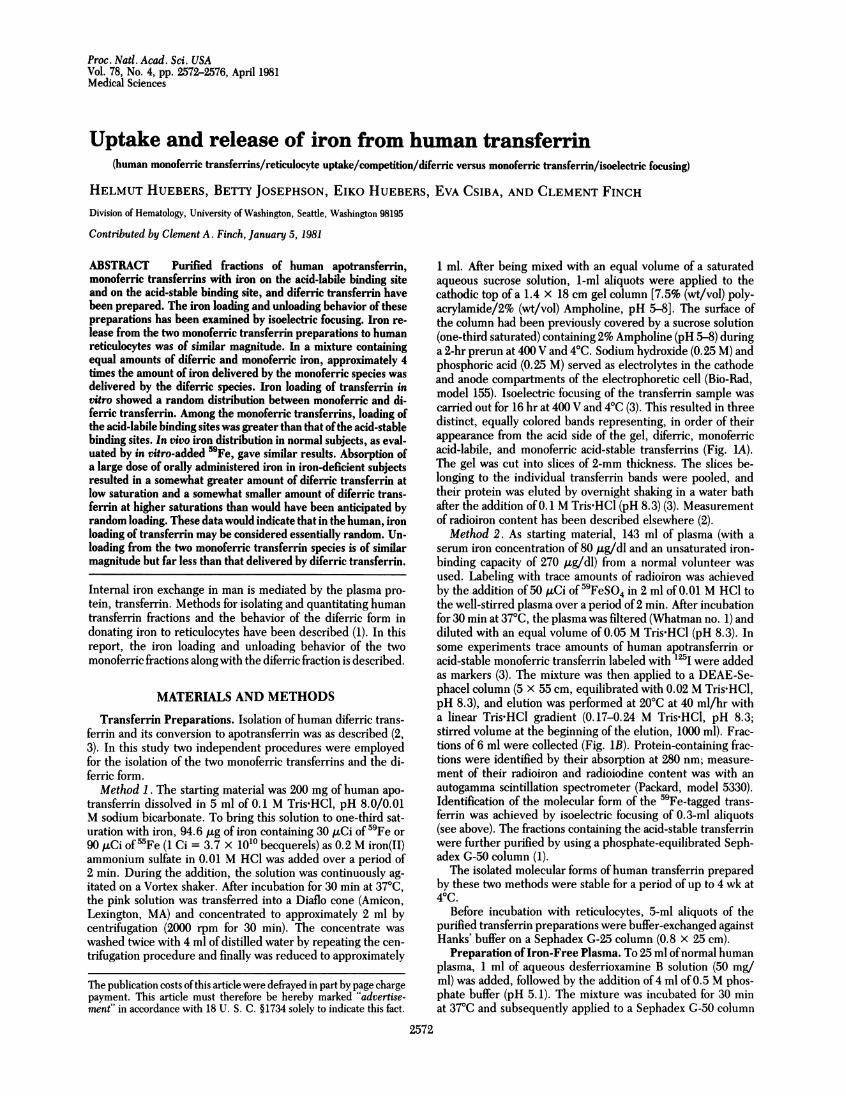
FIG. 1. Transferrin profiles. (A) Profiles obtained by preparative isoelectric focusing procedures. Approximately 90 mg of the method 1 prep-aration was applied to a polyacrylamide column and isoelectric focusing was performed. Individual slices of the gel column were measured for ra-dioactivity. The sequence ofthe transferrin peaks from left to right is diferric transferrin, acid-labile monoferric transferrin, and acid-stable monofer-ric transferrin. (B) Profiles obtained by ion-exchange chromatography. The method 2 preparation was eluted from a DEAE-Sephacel column.o-o, Activity of the various fractions: left peak, diferric transferrin; right peak, transferrin with iron at the acid-labile binding site. The chro-
matographic material was also labeled with purified 1251-labeled acid-stable monoferric transferrin and apotransferrin. *----e, Activity of thesetwo markers counted on the 125I window (shaded area): left peak, the acid-stable monoferric transferrin; right peak, apotransferrin.
(2.5 x 35 cm) previously equilibrated with 0.9% NaCl/1 mMTris HCI, pH 8.0. Elution was performed with saline at 40 ml/hr, and 5-ml fractions were collected. A volume of approxi-mately 40 ml at the void volume was identified as containingprotein by absorbance at 280 nm. Plasma iron concentration ofthe pooled fractions averaged 9 gg/dl, and unsaturated iron-binding capacity averaged 220 ,ug/dl (n = 8). The latter was
determined by a spectrophotometric titration as described (4).Iron Loading on Transferrin. Increasing amounts of 59Fe-
tagged ferrous ammonium sulfate solution (10 1xCi of59Fe addedto 100 ,ug of ferrous ammonium sulfate in 0.01 M HCI, pH 2)were added to 4-ml aliquots containing 10 mg of apotransferrintagged with 4 ,tCi of 1251. The iodination of the transferrin was
accomplished by the monochloride method (5) as described (1).After incubation for 30 min at 37'C, aliquots were subjected toisoelectric focusing, and the radioactive profiles of59Fe and "Iwere determined.
In the second loading study, increments of 59Fe-tagged fer-rous ammonium sulfate solution were added to plasma aliquotsfrom a normal volunteer. After incubation for 30 min at 37TC,the plasma aliquots were subjected to isoelectric focusing.A trace-labeling study was carried out on plasma samples
obtained from eight fasting healthy volunteers and from twoiron-deficient subjects at various intervals after the oral inges-tion of 100 mg of iron as ferrous ascorbate. The in vitro labelingwas accomplished by slowly adding 0.5 ml containing 0.5 /igof iron as a ferrous sulfate solution (pH 2) and 10 aCi of 59Feto 4 ml of plasma over a period of 2 min. During the addition,the plasma was continuously agitated on a Vortex shaker. Afterincubation for 30 min at 370C, plasma aliquots were subjectedto isoelectric focusing and their radioactive profiles were
determined.Reticulocyte Assay. Blood containing 21% ± 2% reticulo-
cytes was obtained from a patient with sickle cell anemia whowas subjected to weekly venisections. The cells were washedwith 0.15 M NaCl and incubated in Hanks' balanced salt so-
lution with the transferrin preparation labeled with 59Fe and'Fe. The methods of incubation, washing, wet ashing, irondetermination, and quantitation of radioactivity were the same
as described (1-3, 6, 7).Variations in results in multiple determinations are expressed
throughout as ±1 SD. Plasma iron and transferrin saturationwere determined by standard methods (8, 9).
RESULTSStudies of Iron Release from Transferrin to Reticulocytes.
Purified transferrin preparations obtained by isoelectric focus-ing with radioiron on the acid-labile or acid-stable binding siteswere exposed to identical reticulocyte populations (Fig. 2). Asimilar radioiron uptake was observed. Additional studies inwhich the iron concentration was varied over a range from 4 to46 tkg/dl again showed similar increases in iron uptake by thetwo monoferric preparations. In both ofthese studies, there wasa slightly greater radioiron uptake from the acid-labile bindingsite.A better comparison of relative iron uptake was provided by
tagging two purified monoferric transferrin preparations with
different isotopes of iron, mixing equal amounts of each trans-ferrin, and exposing the mixture to reticulocytes (Table 1). Up-take of the 59Fe isotope at 1 hr was 76% and at 2 hr was 93%.The ratio between the two isotopes of iron in the reticulocyteswas 1.0 and 0.97. When the iron pool was enlarged by the ad-dition ofpurified diferric transferrin, the proportion ofradioironuptake was reduced to as little as 13%, but there was littlechange in the isotope ratio, with an average at 1 hr of 1.02 +0.01 and at 2 hr of0.99 ± 0.02. When unprocessed fresh humanplasma was added to the same purified transferrin mixture inincreasing amounts, the uptake ratio again remained un-
changed, with mean ratios at 1 and 2 hr of 0.97 ± 0.01 and 0.97± 0.02. The overall ratio for all of the studies was 0.99 ± 0.03atlhrand0.97 ± 0.03at2hr.
24
eq
° 16-x
._
040
0
as 8A:
94
0
Medical Sciences: Huebers et al.
2574 Medical Sciences: Huebers et al.
B0.21
0.1
10 20 30 40 50concentration, ttg/dl
0 60Time, min
0rX4
a, 2.0-o;la0)-2 1.5-
x 1.0
~Z0;4120
0
24Fe concentration, ,ug/dl
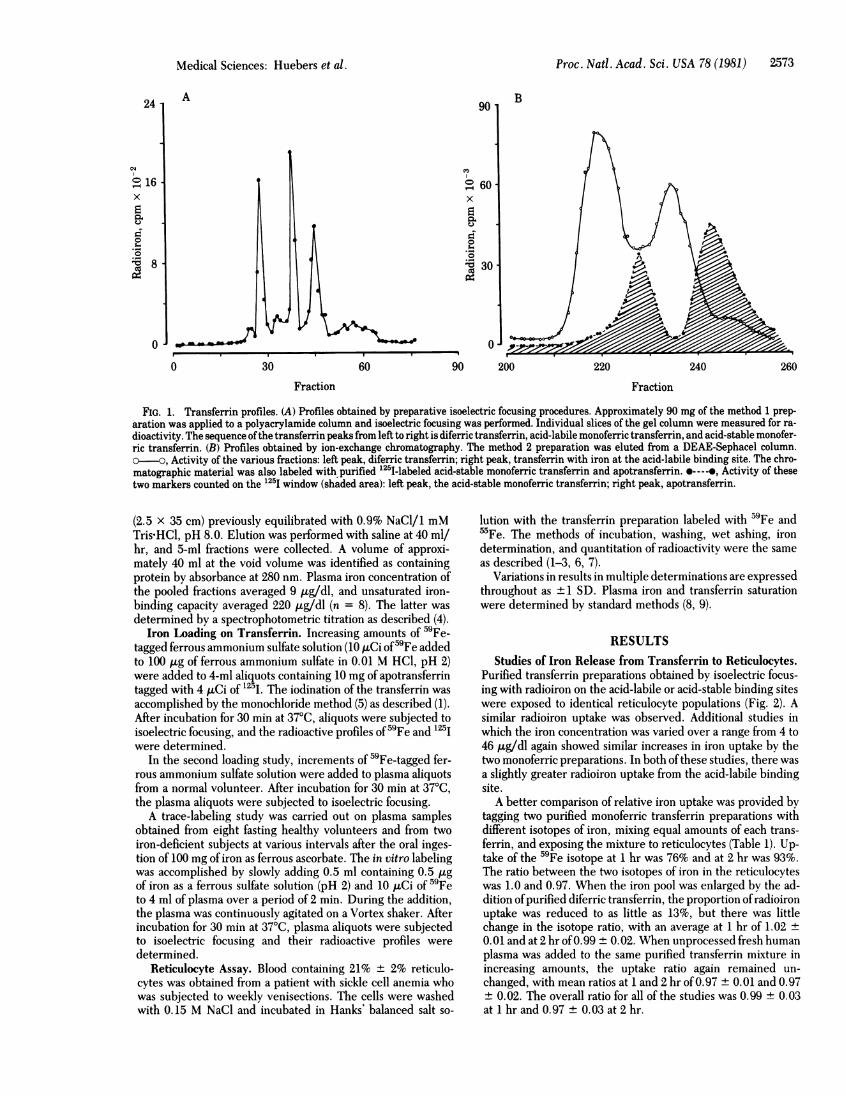
FIG. 2. Iron uptake from purified monoferric transferring by re-ticulocytes. (A) Iron uptake as a function of iron concentration. Stocksolutions ofpurified 59Fe-tagged monoferric acid-labile and acid-stablehuman transferring were diluted with Hanks' buffer and incubatedseparately with reticulocyte-rich blood cells from a sickle cell patient(reticulocyte count, 23%). The hematocrit was adjusted to 17%, andincubation was performed for 2 hr at 370C. The iron uptake was ex-pressed as micrograms of erythrocytes (RBC) per ml. Each data pointis the mean offive individual determinations. e, Acid-labile monoferrictransferrin; o, acid-stable monoferric transferrin. (B) Time dependenceof iron uptake. The individual monoferric transferring dissolved inHanks' buffer (serum iron, 20 ,ug/100 ml) were incubated with bloodobtained from a sickle cell patient (reticulocyte count, 23%). The he-matocrit in the incubation medium was 17%. Iron uptake in ,ug of ironper ml of packed erythrocytes was determined in triplicate. *, Acid-labile monoferric transferrin; a, acid-stable monoferric transferrin.
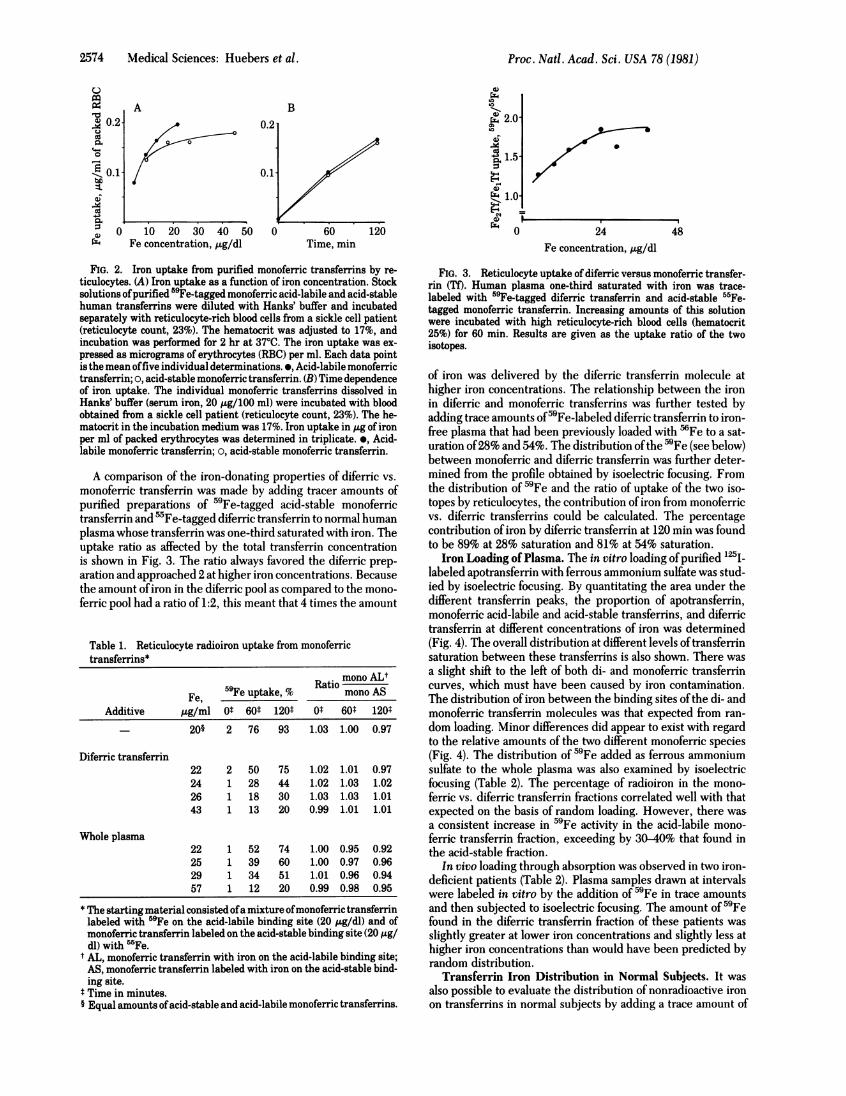
A comparison of the iron-donating properties of diferric vs.monoferric transferrin was made by adding tracer amounts ofpurified preparations of 59Fe-tagged acid-stable monoferrictransferrin and 'Fe-tagged diferric transferrin to normal humanplasma whose transferrin was one-third saturated with iron. Theuptake ratio as affected by the total transferrin concentrationis shown in Fig. 3. The ratio always favored the diferric prep-aration and approached 2 at higher iron concentrations. Becausethe amount ofiron in the diferric pool as compared to the mono-ferric pool had a ratio of 1:2, this meant that 4 times the amount
Table 1. Reticulocyte radioiron uptake from monoferrictransferring*
Ratio mono ALtFe, 59Fe uptake, % mono AS
Additive ,ug/ml Ot 60t 120t 0t 60* 120t
- 20§ 2 76 93 1.03 1.00 0.97
Diferric transferrin22 2 50 75 1.02 1.01 0.9724 1 28 44 1.02 1.03 1.0226 1 18 30 1.03 1.03 1.0143 1 13 20 0.99 1.01 1.01
Whole plasma22 1 52 74 1.00 0.95 0.9225 1 39 60 1.00 0.97 0.9629 1 34 51 1.01 0.96 0.9457 1 12 20 0.99 0.98 0.95
* The starting material consisted ofa mixture ofmonoferric transferrinlabeled with 59Fe on the acid-labile binding site (20 pg/dl) and ofmonoferric transferrin labeled on the acid-stable binding site (20 tg/dl) with 5rFe.
t AL, monoferric transferrin with iron on the acid-labile binding site;AS, monoferric transferrin labeled with iron on the acid-stable bind-ing site.
$ Time in minutes.§ Equal amounts ofacid-stable and acid-labile monoferric transferring.
FIG. 3. Reticulocyte uptake of diferric versus monoferric transfer-rin (TO. Human plasma one-third saturated with iron was trace-labeled with 59Fe-tagged diferric transferrin and acid-stable 55Fe-tagged monoferric transferrin. Increasing amounts of this solutionwere incubated with high reticulocyte-rich blood cells (hematocrit25%) for 60 min. Results are given as the uptake ratio of the twoisotopes.
of iron was delivered by the diferric transferrin molecule athigher iron concentrations. The relationship between the ironin diferric and monoferric transferrins was further tested byadding trace amounts of59Fe-labeled diferric transferrin to iron-free plasma that had been previously loaded with 'Fe to a sat-uration of28% and 54%. The distribution ofthe 59Fe (see below)between monoferric and diferric transferrin was further deter-mined from the profile obtained by isoelectric focusing. Fromthe distribution of 59Fe and the ratio of uptake of the two iso-topes by reticulocytes, the contribution of iron from monoferricvs. diferric transferrins could be calculated. The percentagecontribution ofiron by diferric transferrin at 120 min was foundto be 89% at 28% saturation and 81% at 54% saturation.
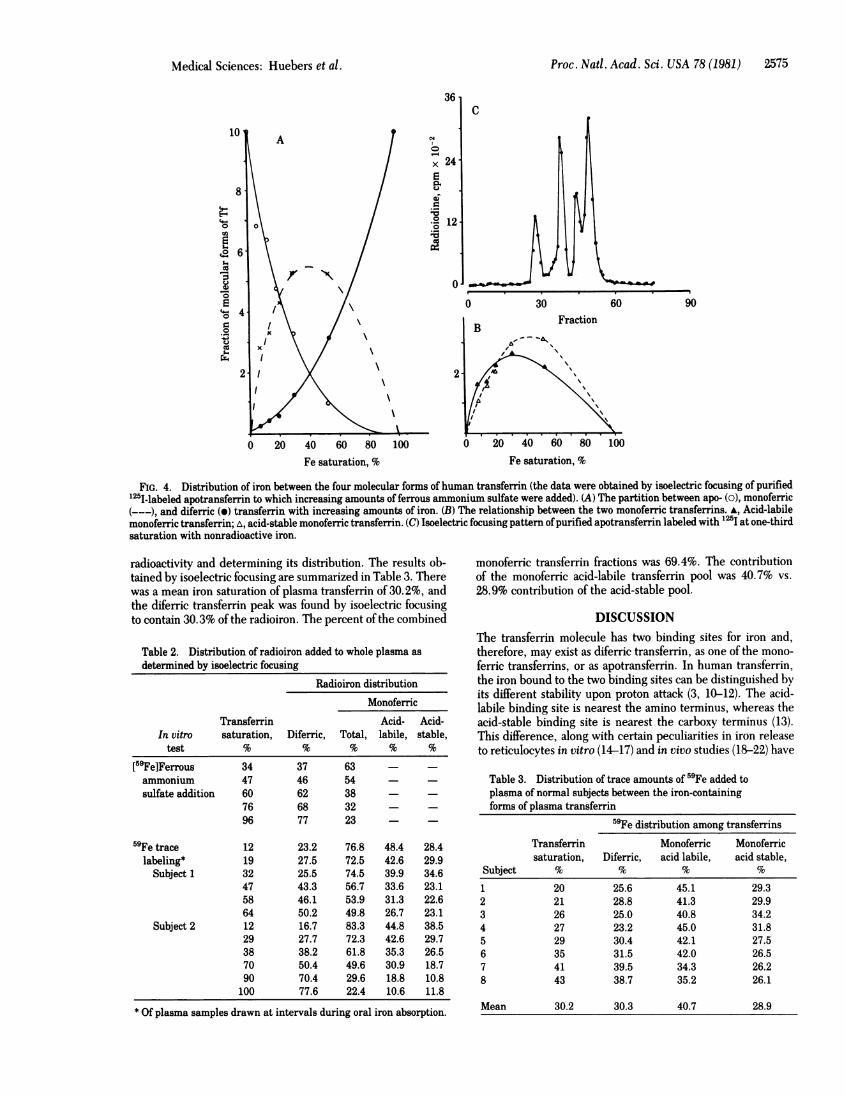
Iron Loading of Plasma. The in vitro loading ofpurified '"I-labeled apotransferrin with ferrous ammonium sulfate was stud-ied by isoelectric focusing. By quantitating the area under thedifferent transferrin peaks, the proportion of apotransferrin,monoferric acid-labile and acid-stable transferring, and diferrictransferrin at different concentrations of iron was determined(Fig. 4). The overall distribution at different levels oftransferrinsaturation between these transferrins is also shown. There was
a slight shift to the left of both di- and monoferric transferrincurves, which must have been caused by iron contamination.The distribution ofiron between the binding sites ofthe di- andmonoferric transferrin molecules was that expected from ran-
dom loading. Minor differences did appear to exist with regardto the relative amounts of the two different monoferric species(Fig. 4). The distribution of 59Fe added as ferrous ammoniumsulfate to the whole plasma was also examined by isoelectricfocusing (Table 2). The percentage of radioiron in the mono-
ferric vs. diferric transferrin fractions correlated well with thatexpected on the basis of random loading. However, there wasa consistent increase in 59Fe activity in the acid-labile mono-
ferric transferrin fraction, exceeding by 30-40% that found inthe acid-stable fraction.
In vivo loading through absorption was observed in two iron-deficient patients (Table 2). Plasma samples drawn at intervalswere labeled in vitro by the addition of 59Fe in trace amountsand then subjected to isoelectric focusing. The amount of 59Fefound in the diferric transferrin fraction of these patients was
slightly greater at lower iron concentrations and slightly less athigher iron concentrations than would have been predicted byrandom distribution.
Transferrin Iron Distribution in Normal Subjects. It was
also possible to evaluate the distribution of nonradioactive ironon transferrins in normal subjects by adding a trace amount of
p AX 0.2A
0.1 /C*40.
ca 0:.
> -Fe48
Proc. Natl. Acad. Sci. USA 78 (1981)
Proc. Natl. Acad. Sci. USA 78 (1981) 2575
36
A0
x 24-Eu
a-..c 120
10:
0
0
0 20 40 60 80
Fe saturation, %100
C
30 60
0 20 40 60 80 100Fe saturation, %
FIG. 4. Distribution of iron between the four molecular forms of human transferrin (the data were obtained by isoelectric focusing of purified'25I-labeled apotransferrin to which increasing amounts of ferrous ammonium sulfate were added). (A) The partition between apo- (o), monoferric(---), and diferric (e) transferrin with increasing amounts of iron. (B) The relationship between the two monoferric transferrins. A, Acid-labilemonoferric transferrin; A, acid-stable monoferric transferrin. (C) Isoelectric focusing pattern of purified apotransferrin labeled with "25I at one-thirdsaturation with nonradioactive iron.
radioactivity and determining its distribution. The results ob-tained by isoelectric focusing are summarized in Table 3. Therewas a mean iron saturation of plasma transferrin of 30.2%, andthe diferric transferrin peak was found by isoelectric focusingto contain 30.3% of the radioiron. The percent of the combined
Table 2. Distribution of radioiron added to whole plasma asdetermined by isoelectric focusing
Radioiron distributionMonoferric
Transferrin Acid- Acid-In vitro saturation, Diferric, Total, labile, stable,
test % % % % %
[59Fe]Ferrous 34 37 63 - -ammonium 47 46 54 - -
sulfate addition 60 62 38 - -
76 68 32 - -
96 77 23 - -
59Fe trace 12 23.2 76.8 48.4 28.4labeling* 19 27.5 72.5 42.6 29.9
Subject 1 32 25.5 74.5 39.9 34.647 43.3 56.7 33.6 23.158 46.1 53.9 31.3 22.664 50.2 49.8 26.7 23.1
Subject 2 12 16.7 83.3 44.8 38.529 27.7 72.3 42.6 29.738 38.2 61.8 35.3 26.570 50.4 49.6 30.9 18.790 70.4 29.6 18.8 10.8100 77.6 22.4 10.6 11.8
* Of plasma samples drawn at intervals during oral iron absorption.
monoferric transferrin fractions was 69.4%. The contributionof the monoferric acid-labile transferrin pool was 40.7% vs.28.9% contribution of the acid-stable pool.
DISCUSSIONThe transferrin molecule has two binding sites for iron and,therefore, may exist as diferric transferrin, as one of the mono-ferric transferrins, or as apotransferrin. In human transferrin,the iron bound to the two binding sites can be distinguished byits different stability upon proton attack (3, 10-12). The acid-labile binding site is nearest the amino terminus, whereas theacid-stable binding site is nearest the carboxy terminus (13).This difference, along with certain peculiarities in iron releaseto reticulocytes in vitro (14-17) and in vivo studies (18-22) have
Table 3. Distribution of trace amounts of 59Fe added toplasma of normal subjects between the iron-containingforms of plasma transferrin
59Fe distribution among transferrinsTransferrin Monoferric Monoferricsaturation, Diferric, acid labile, acid stable,
Subject % % % %
1 20 25.6 45.1 29.32 21 28.8 41.3 29.93 26 25.0 40.8 34.24 27 23.2 45.0 31.85 29 30.4 42.1 27.56 35 31.5 42.0 26.57 41 39.5 34.3 26.28 43 38.7 35.2 26.1
Mean 30.2 30.3 40.7 28.9
10
8
U
0
00U
2 6
s4
0
gc- 4
90
Medical Sciences: Huebers et al.
2576 Medical Sciences: Huebers et al.
suggested a difference in. biologic behavior of the two sites.More direct studies in the rat did not support this speculation(2, 23), but observations in the human have been hampered bymethodological problems. Studies examining the quantitativebehavior ofhuman transferrin are those by. Leibman and Aisen(24) and by Van Baarlen et al. (17) in which urea/polyacryla-mide gel electrophoresis. (25) in combination with immuno-electrophoresis was employed to examine the distribution oftransferrin species. The small sample size employed in this assaysystem may have caused distortion of results through iron con-tamination (26). By the use of anion-exchange column fraction-ation techniques and by isoelectric focusing (3, 27), it has beenpossible to obtain pure fractions of acid-stable. and acid-labilemonoferric human transferrin labeled with either radioiron orradioiodine. Their behavior in donating iron to reticulocytes hasbeen examined alone, in mixtures, and in plasma.
The release of iron from the two purified monoferric trans-ferrins prepared by two. different methods has been found tobe nearly identical, regardless ofwhether the purified mixturesalone were used, whether diferric iron was also present, orwhether whole plasma was used (Table 1). Similar uptake alsooccurred despite variations in the size of the iron pool. Thesestudies provide a basis for considering the two monoferric trans-ferrins as a single pool in respect to iron delivery, as was alsotrue in the rat (2, 23).A further comparison between monoferric and diferric trans-
ferrins showed that diferric transferrin released its iron morerapidly than did monoferric transferrin. Although intermediateratios between diferric and monoferric transferrin were foundat low transferrin concentrations, a molecular ratio approaching2:1 was achieved once the supply oftransferrin iron was optimal.This difference in iron-donating capacity between diferric andmonoferric transferrins suggested that interaction with tissuereceptors depends on the iron-containing sites rather than themolecule as a whole.
Studies of in vitro iron-loading of purified human apotrans-ferrin demonstrated the near random distribution betweenmonoferric and diferric transferrin. A difference in the amountof radioiron labeling the two monoferric transferrins was seenin several studies. The. reason for this preferential loading.is notexplained but could be due to the facilitation of loading on onesite by small molecular plasma compounds. Such an effectwould not alter the random distribution between diferric andmonoferric compounds.
With the demonstration (Fig. 3) that radioiron added in vitroas ferrous sulfate is nearly randomly loaded on the open sitesof transferrin, it became possible to monitor the distribution ofthe nonradioactive iron already present in plasma. Thus, thepreexisting proportion of apotransferrin and.monoferric trans-ferrin would determine the distribution of radioiron as mono-and diferric transferrin (28). In normal subjects there was closeagreement between calculations based on random distributionaccording to transferrin saturation and the results obtained byisoelectric focusing (Table 3). The distribution of iron occurringduring absorption was also measured and this did-appear to varysomewhat .from the expected random distribution. The pro-portion of diferric transferrin at low plasma iron concentrationswas greater than expected and the proportion at higher ironconcentrations was less than expected. It may be that a highconcentration of iron in the region of the intestinal mucosa atthe point of transferrin iron loading accounted for this skewing(29), but at the moment there is no direct evidence concerningthis. Additional in vivo studies will be required before the in
Iron delivery appeared to be related to the presence of theiron-loaded sites or to some special competitive advantage ofthe diferric molecule. This and the "all-or-none" release of ironfrom all transferrin -molecules gave the diferric form a furtheradvantage in unloading iron. In the normal individual, in whomthe iron supply is presumably adequate at one-third saturation,.diferric iron would constitute one-half of.the total plasma ironpool but would represent a more important source of iron thanthe combined monoferric fractions. Inasmuch as the ratio be-tween the iron in monoferric and diferric transferrins can bechanged bythe amount of iron-binding protein and the amountof iron present, significance in' iron transport is also given to thetotal iron-binding capacity of the plasma.
This research was supported in part from Research Grant HL 06242from the Institute of Heart, Lung and Blood, National Institutes ofHealth, Bethesda, MD. Computer assistance was provided fromCLINFO Grant RR-37.
1. Huebers, H., Csiba, E., Josephson, B., Huebers, E. & Finch, C.A. (1981) Proc. Natl. Acad. Sci. USA 78, 621-625.
2. Huebers, H., Huebers, E., Csiba, E. & Finch, C. A. (1978)J.Clin. Invest. 62, 944-951.
3. Morgan, E. H., 'Huebers, H.. & Finch, C. A. (1978) Blood 52,
1219-1228.4. Graham, G. & Bates, G. W. (1976) J. Lab. Clin. Med. 88,
477486.5. McFarlane, A. S. (1958) Nature (London) 182, 53.6. Christensen, A. C., Huebers, H. & Finch, C. A. (1978) Am. J.
Physiol. 235, R18-R22.7. Pootrakul, P., Christensen, A., Josephson, B. & Finch, C. A.
(1977) Blood 49, 957-966.8. International Committee for Standardization in Hematology/
Expert Panel on Iron (1971) Br. J. Haematol. 20, 451-453.9. Cook, J. D. (1970)J. Lab., Clin. Med. 76, 497-506.
10. Lestas, A. N. (1976) Br. J. Haematol. 32, 341-350.11. Zapolski, E. J. & Princiotto, J. V. (1977) Biochem. J. 166,
175-179.12. Harris, D. C. & Aisen, P. (1976) Nature (London) 257, 821-823.13. Evans, R. W. & Williams, J. (1978).Biochem.J. 173, 543-552.14. Fletcher, J. & Huehns, E. H. (1968) Nature (London) 218,
1211-1213.15. Ganzoni, A. M., Hahn, D. & Spati, B. (1972) Blut 24, 269-273.;16. Hahn, D. (1973) Eur. J. Biochem-. 34, 311-316.17. Van Baarlen, J., Brouwer, J. T., Leibman, A. & Aisen, P. (1980)
Br. J. Haematol. 46, 417426.18. Okada, S., Chipman, B. & Brown, E. B. (1977) J. Lab. Clin.
Med. 89, 51-64.19. Okada, S., Jarvis, B. & Brown, B. (1979)J. Lab. Clin. Med. 93,
189-198.20. Hahn, D. & Ganzoni, A. M. (1975) Acta. Haematol. 53, 321-328.21. Awai, M., Chipman, B. & Brown, E. B. (1975)J. Lab. Clin. Med.
85, 576-585.22. Brown, E. B., Okada, S., Awai, M. & Chipman, B. (1975)J. Lab.
Clin. Med. 86, 576-585.23. Huebers, H., Bauer, W., Huebers, E., Csiba, E. & Finch, C. A.
.(1981) Blood 57, 218-228.24. Leibman, A. & Aisen, P. (1979) Blood 53, 1058-1065.25. Makey, D. G. & Seal, U. S. (1976) Biochim. Biophys. Acta. 453,
250-255.26. Zapolski, E. J. & Princiotto, J. V. (1980) Biochemistry 19,
3599-3603.27. Van Eijk, H. G., van NoortW. L., Kroos, M. J. & vander Heul,
C. (1980)J. Clin. Chem. Clin. Biochem. 18, 563-5.28. Finch, C. A., Deubelbeiss, K., Cook, J. D., Eschbach, J. W.,
Harker, L. A., Funk, D. D., Marsaglia, G., Hillman, R. S.,Slichter, S., Adamson, J. W., Ganzoni, A. & Giblett, E. R. (1970)Medicine 49, 17-53.
vivo dynamics of transferrin iron loading can be clarified.
Proc. Natl. Acad. Sci. USA 78 (1981)
29. Morgan, E. H. (1980) Q. J. Exp.,Physiol. 65, 239-252.