Embed Size (px)
Citation preview

Upstream with
a Paddle
Water System Partnerships
Cooperative Approaches to Drinking Water Challenges
Ellen Tarquinio, U.S. [email protected]
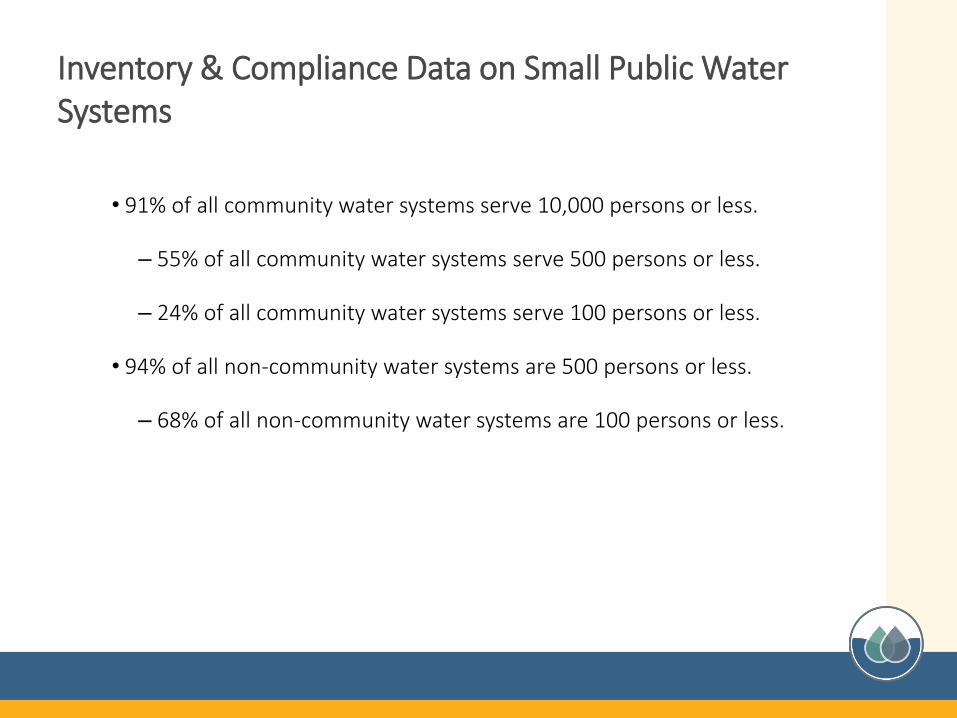
Inventory & Compliance Data on Small Public Water Systems
• 91% of all community water systems serve 10,000 persons or less.
– 55% of all community water systems serve 500 persons or less.
– 24% of all community water systems serve 100 persons or less.
• 94% of all non-community water systems are 500 persons or less.
– 68% of all non-community water systems are 100 persons or less.
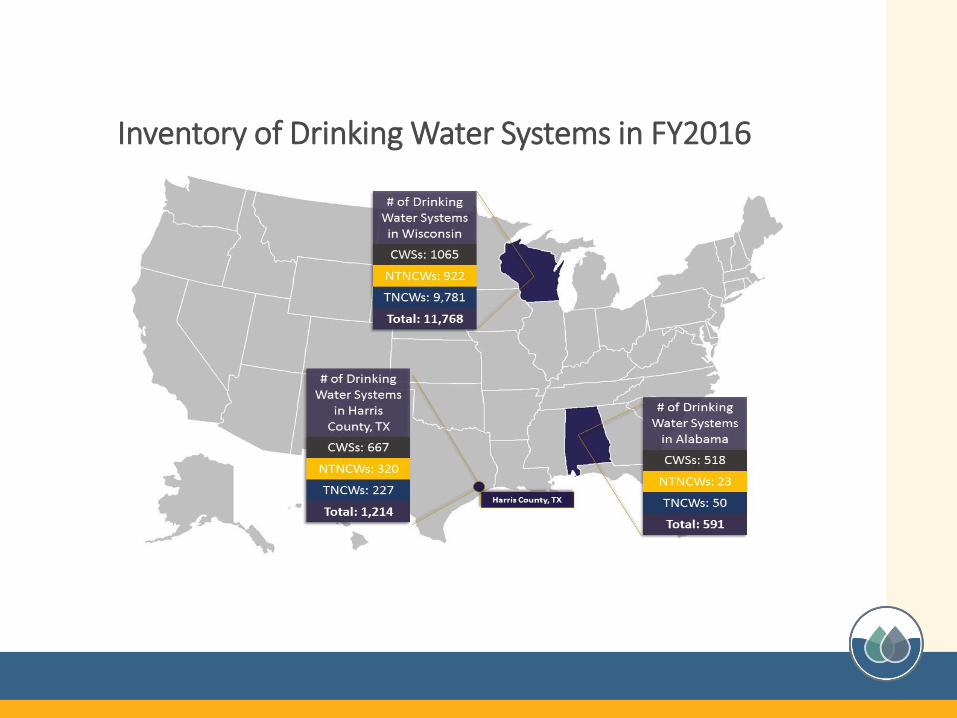
Inventory of Drinking Water Systems in FY2016
0
10
20
30
40
50
60
70
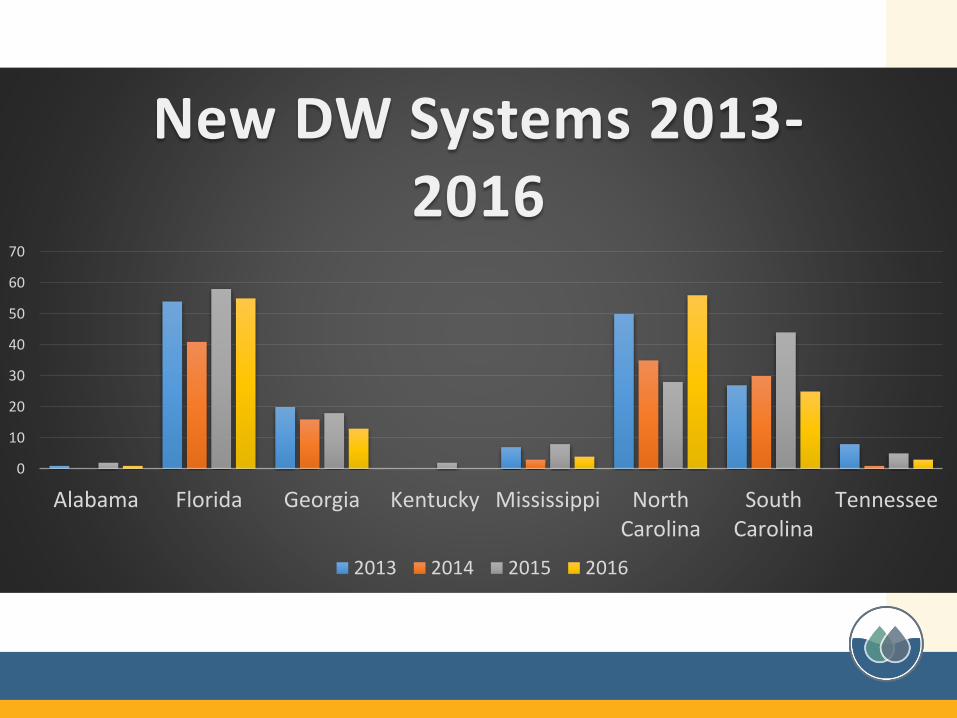
Alabama Florida Georgia Kentucky Mississippi NorthCarolina
SouthCarolina
Tennessee
New DW Systems 2013-2016
2013 2014 2015 2016
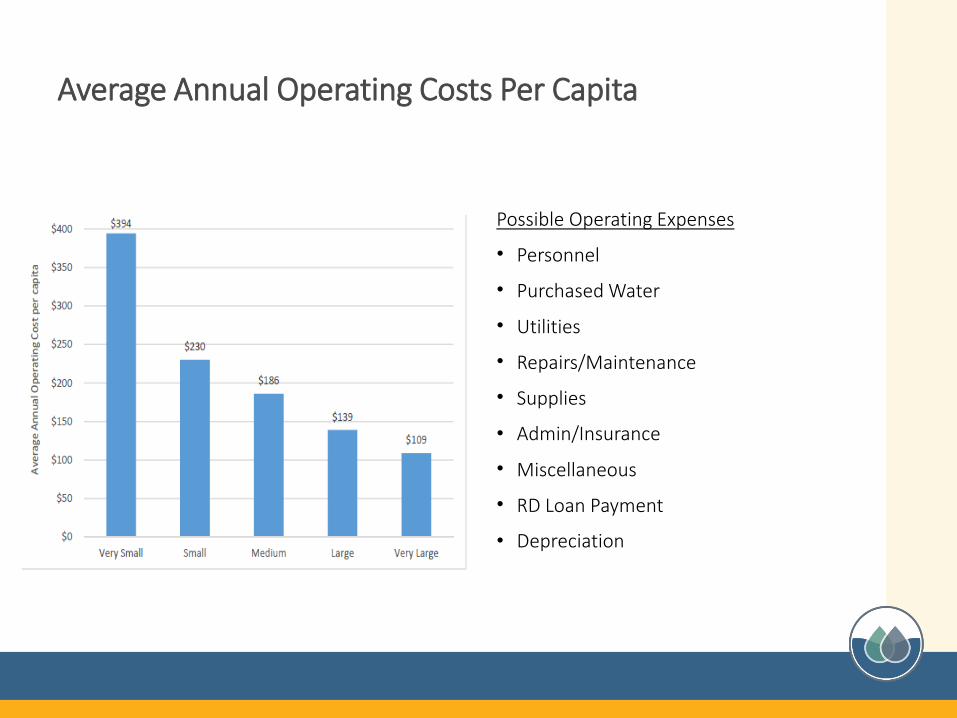
Average Annual Operating Costs Per Capita
Possible Operating Expenses
• Personnel
• Purchased Water
• Utilities
• Repairs/Maintenance
• Supplies
• Admin/Insurance
• Miscellaneous
• RD Loan Payment
• Depreciation
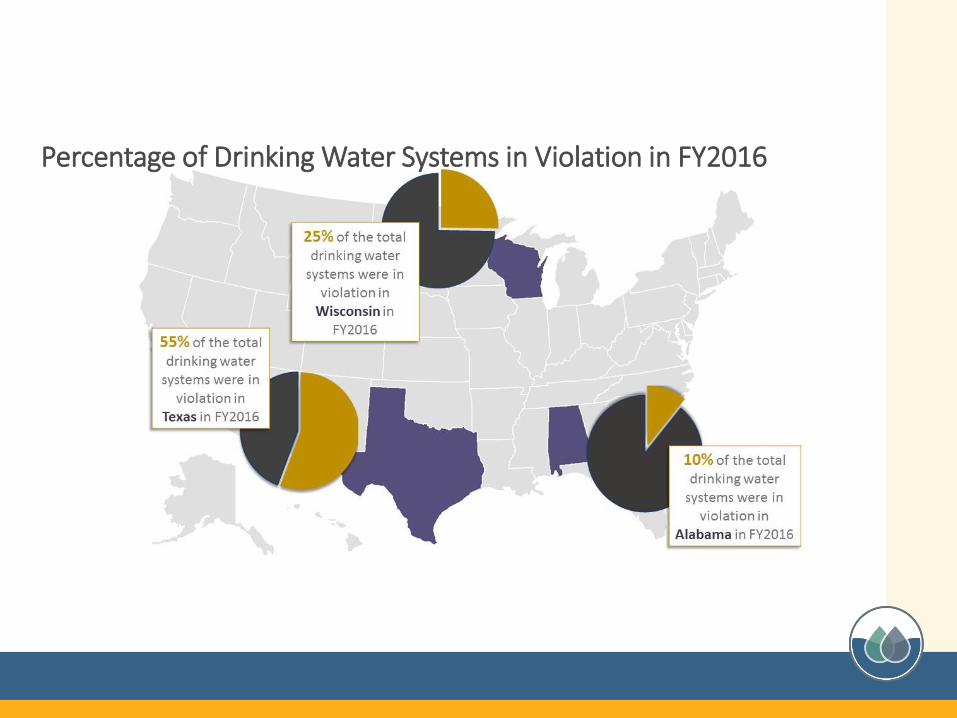
Percentage of Drinking Water Systems in Violation in FY2016
Movement Toward Partnerships
• High expectations on the part of the public for safe drinking water for everyone.
• Water systems need a high level of technical, managerial, and financial capacity to meet all of their obligations.
• Need for leveraging limited/diminishing resources.
• Technology to allow system to work in more informal partnerships and to partner with geographically remote systems.
Water System Partnerships: EPA Actions
9
Increasing awareness
Creating a space where communities can easily find support for partnerships
Identifying opportunities to address technical, managerial and financial capacity needs
Developing case studies, incentives and funding and financing tools to support water system partnerships
Revised Water System Partnerships Webpage
https://www.epa.gov/dwcapacity/water-system-partnerships
Water System Partnerships: State Programs and Policies
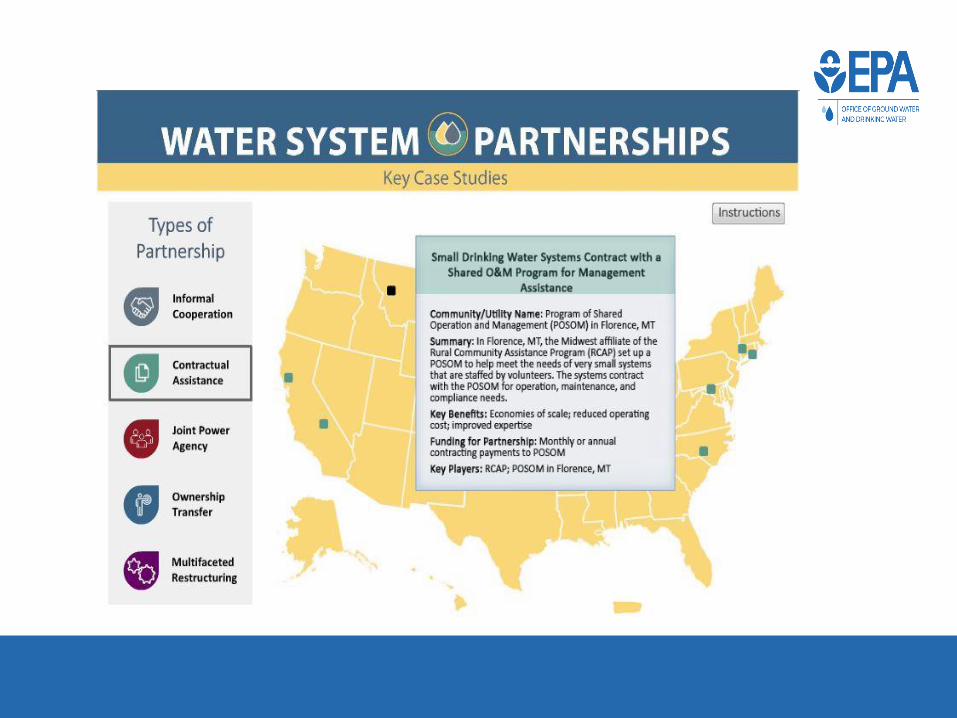
Water System Partnerships Case Studies
Water System Partnerships Resources
Upstream with
a Paddle
Policy Solutions to
Water Industry Fragmentation in the United States
Deborah Dewey
President
Indiana American Water
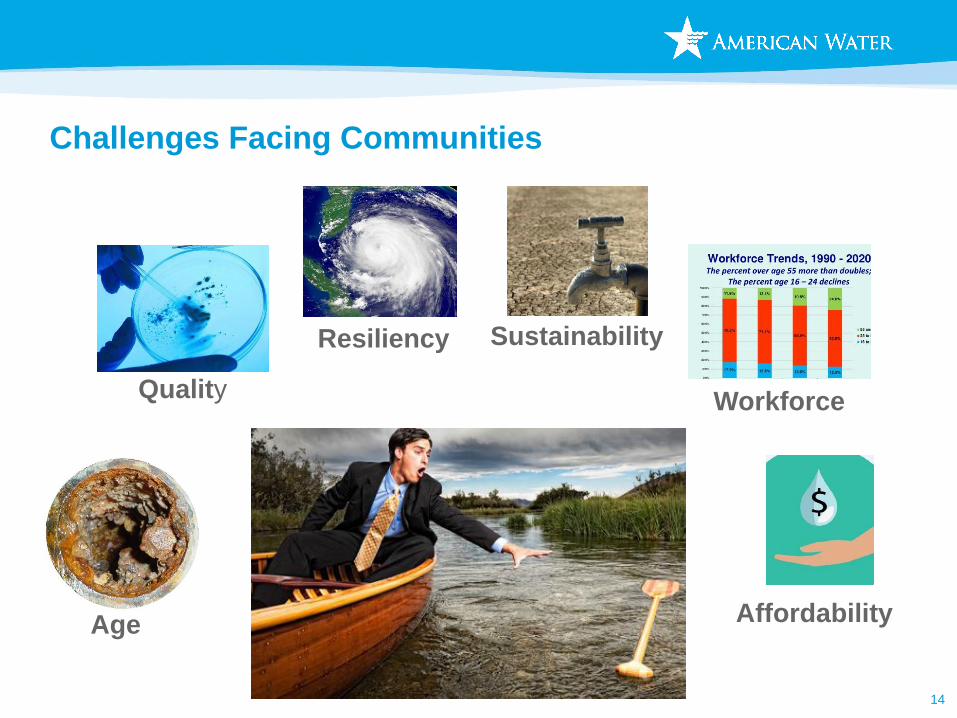
Challenges Facing Communities
14
Age
SustainabilityResiliency
Quality Workforce
Affordability
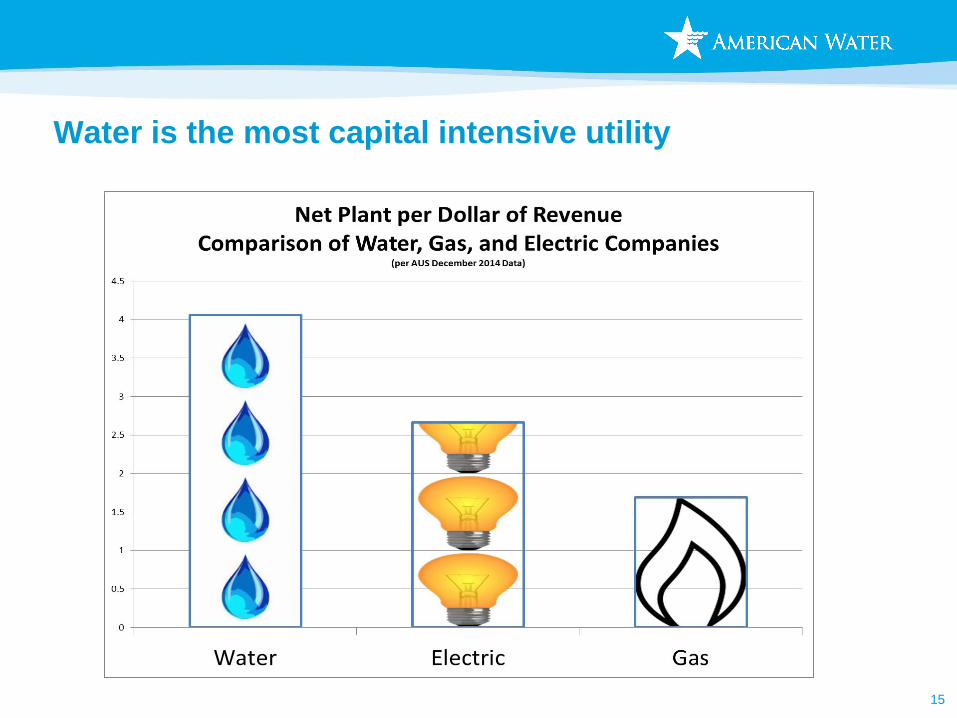
Water is the most capital intensive utility
15
16
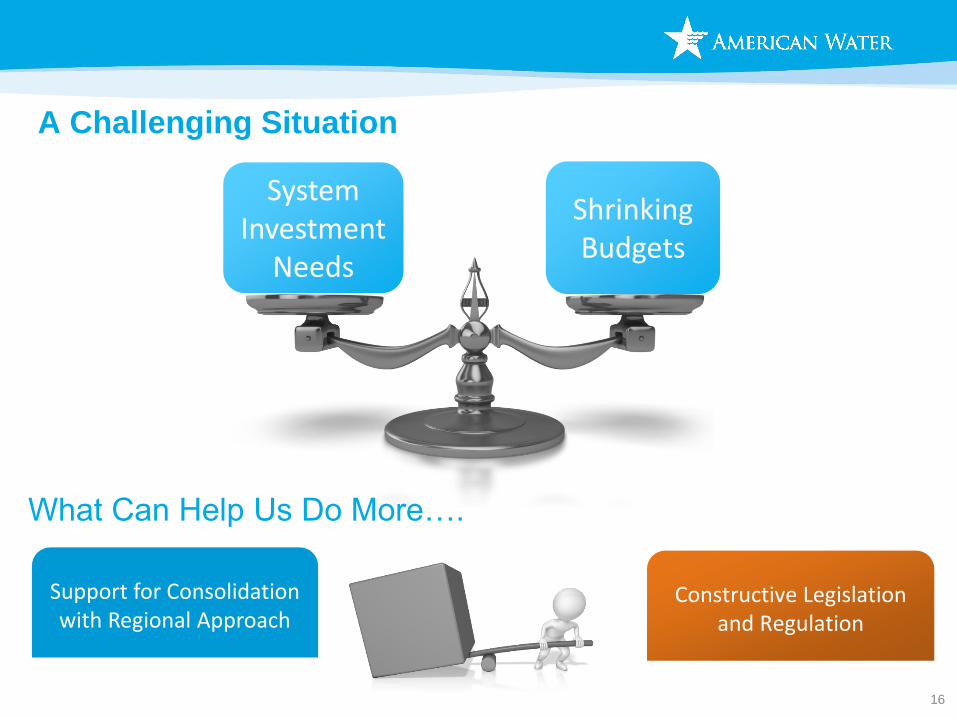
A Challenging Situation
System Investment
Needs
Shrinking Budgets
What Can Help Us Do More….
Support for Consolidationwith Regional Approach
Constructive Legislation and Regulation
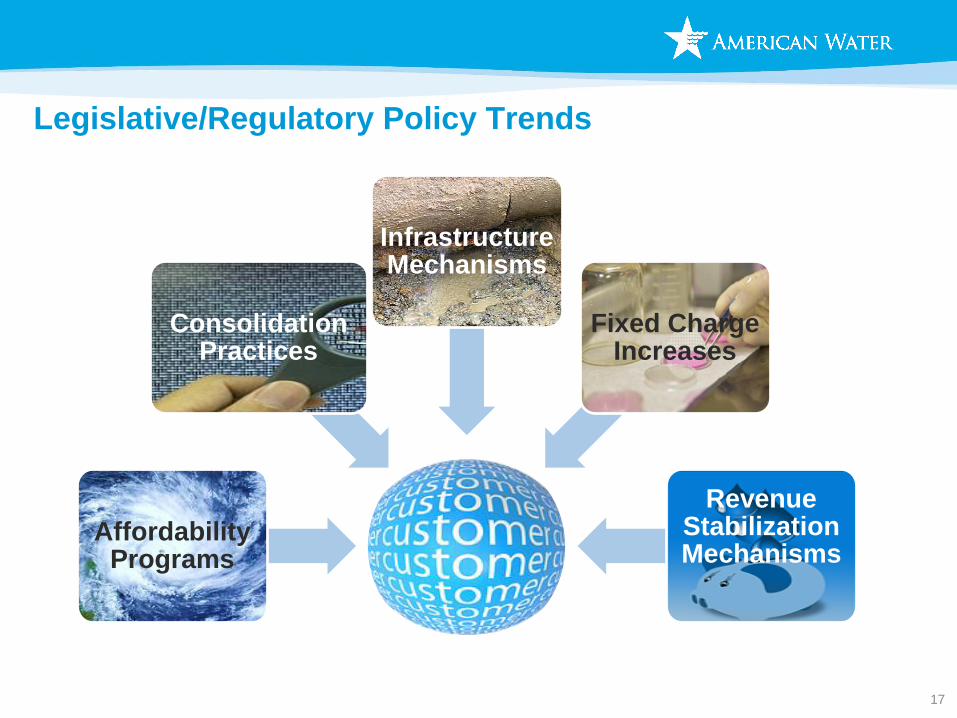
Legislative/Regulatory Policy Trends
17
Affordability Programs
Consolidation Practices
Infrastructure Mechanisms
Fixed Charge Increases
Revenue Stabilization Mechanisms
18
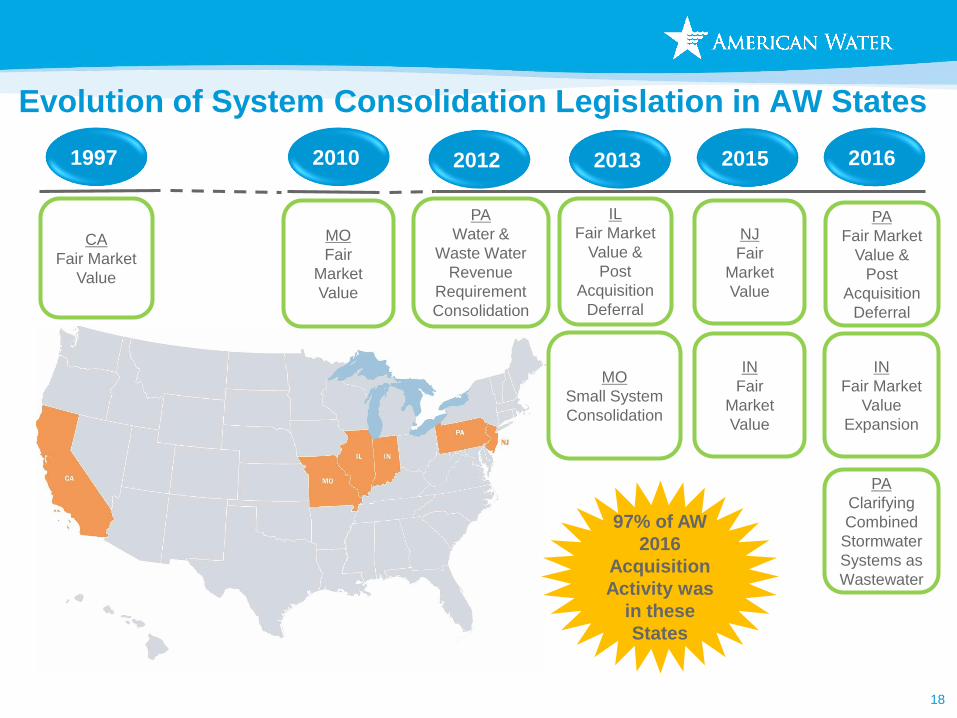
Evolution of System Consolidation Legislation in AW States
1997 2012 2013 2015 2016
CA
Fair Market
Value
PA
Water &
Waste Water
Revenue
Requirement
Consolidation
IL
Fair Market
Value &
Post
Acquisition
Deferral
MO
Small System
Consolidation
NJ
Fair
Market
Value
IN
Fair
Market
Value
PA
Fair Market
Value &
Post
Acquisition
Deferral
IN
Fair Market
Value
Expansion
PA
Clarifying
Combined
Stormwater
Systems as
Wastewater
97% of AW
2016
Acquisition
Activity was
in these
States
2010
MO
Fair
Market
Value
New Jersey
Water Quality Accountability Act
• To ensure safety and reliability of the state’s drinking water
Early detection of water quality issues
Transparent reporting
Making needed infrastructure investments
Key requirements:
Field testing of valves and hydrants
Cybersecurity program
Action plans for Notices of Violation (NOVs)
Asset management plan; minimum 150-year replacement cycle
Written certification from Corporate Officer, Executive Director or Mayor
19
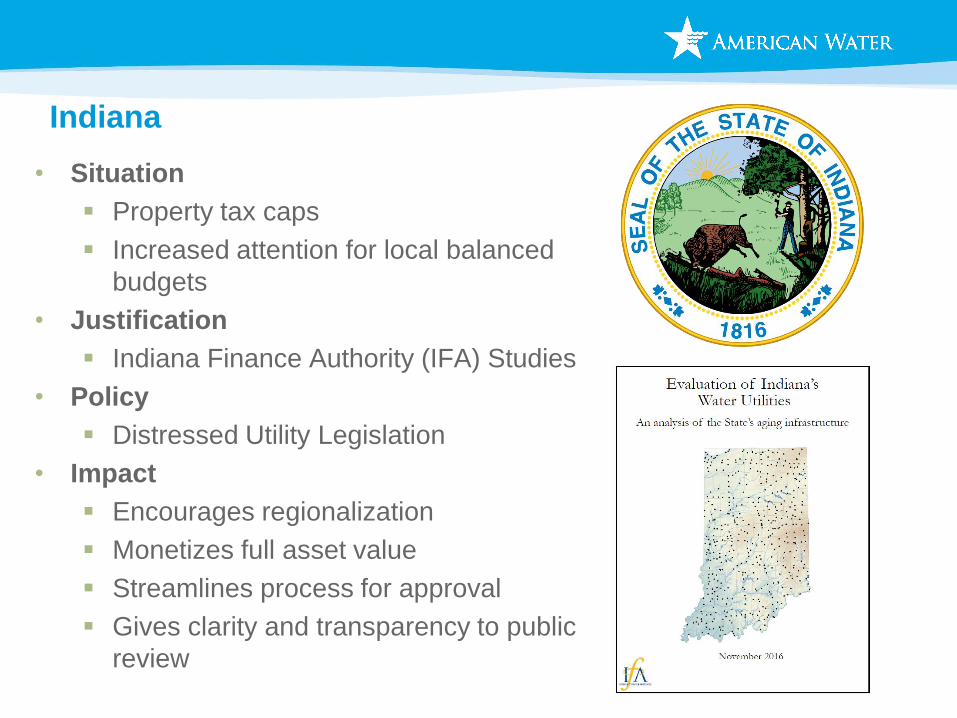
Indiana
• Situation
Property tax caps
Increased attention for local balanced
budgets
• Justification
Indiana Finance Authority (IFA) Studies
• Policy
Distressed Utility Legislation
• Impact
Encourages regionalization
Monetizes full asset value
Streamlines process for approval
Gives clarity and transparency to public
review
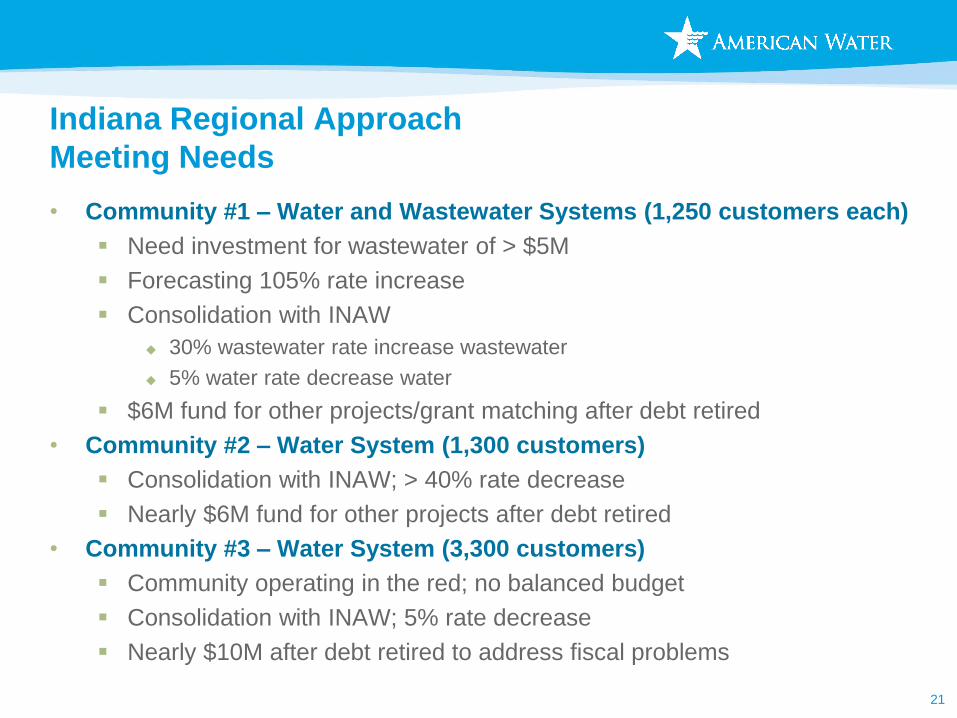
Indiana Regional Approach
Meeting Needs
• Community #1 – Water and Wastewater Systems (1,250 customers each)
Need investment for wastewater of > $5M
Forecasting 105% rate increase
Consolidation with INAW
30% wastewater rate increase wastewater
5% water rate decrease water
$6M fund for other projects/grant matching after debt retired
• Community #2 – Water System (1,300 customers)
Consolidation with INAW; > 40% rate decrease
Nearly $6M fund for other projects after debt retired
• Community #3 – Water System (3,300 customers)
Community operating in the red; no balanced budget
Consolidation with INAW; 5% rate decrease
Nearly $10M after debt retired to address fiscal problems
21
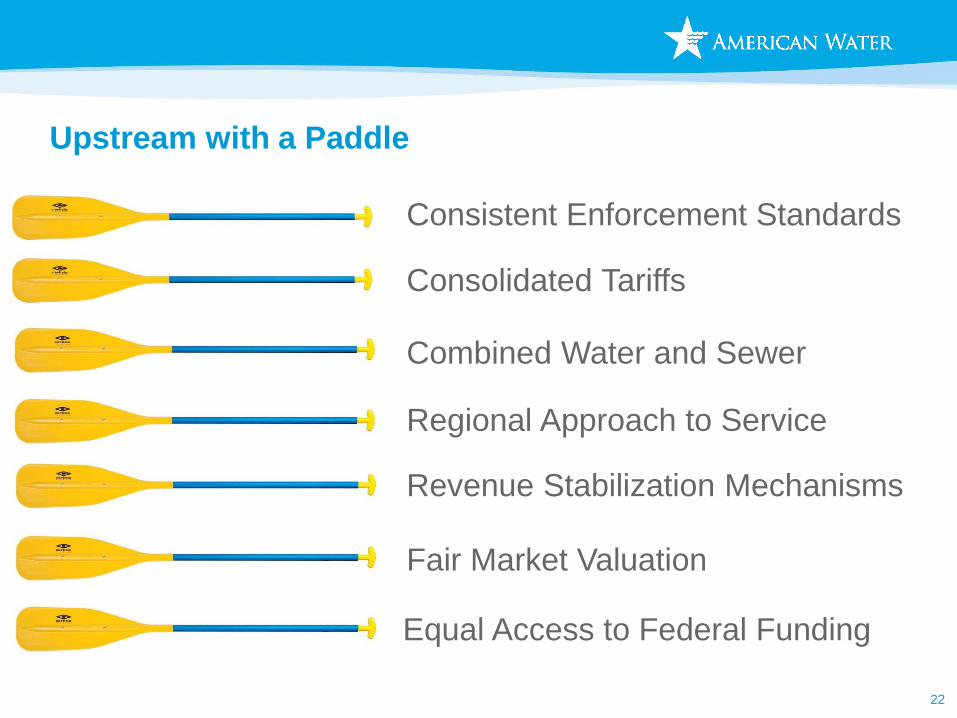
Upstream with a Paddle
22
Consolidated Tariffs
Consistent Enforcement Standards
Fair Market Valuation
Combined Water and Sewer
Equal Access to Federal Funding
Revenue Stabilization Mechanisms
Regional Approach to Service
23
Legislative / Regulatory Policy Solutions
Sustainability of Safe, Reliable, and Affordable
Water and Wastewater Systems

Upstream with
a Paddle
Atwater Thornton
The Role of Regulation in Funding Future Investment
Richard A. Verdi
646.827.9586
National Association of Regulatory Utility Commissioners
November 14, 2017
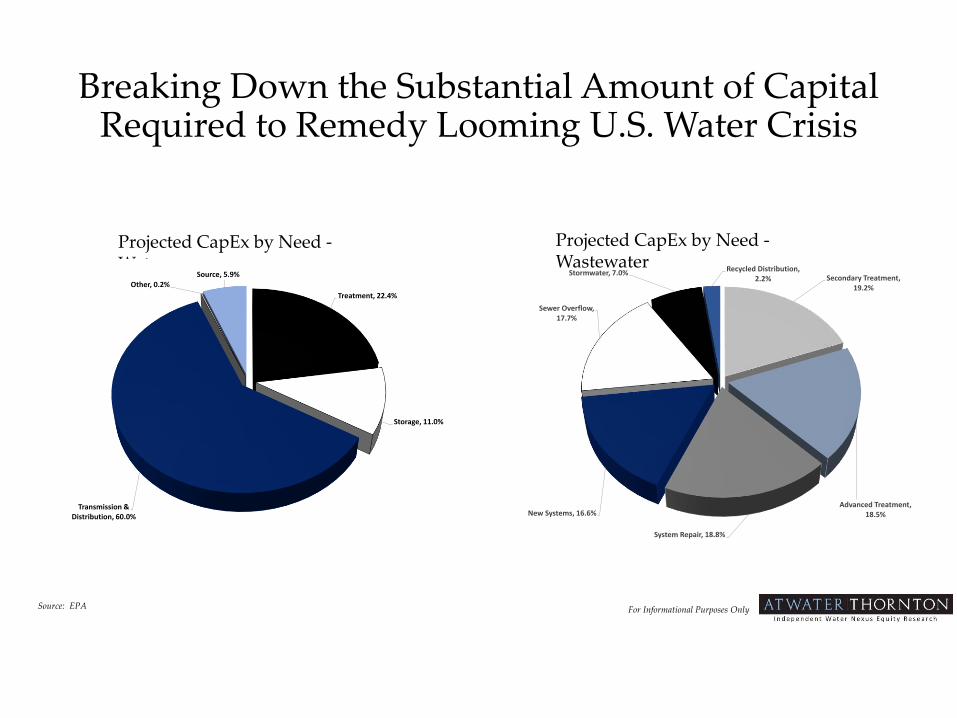
Breaking Down the Substantial Amount of Capital Required to Remedy Looming U.S. Water Crisis
Projected CapEx by Need -Water
For Informational Purposes Only Source: EPA
Treatment, 22.4%
Storage, 11.0%
Transmission & Distribution, 60.0%
Other, 0.2%
Source, 5.9% Secondary Treatment, 19.2%
Advanced Treatment, 18.5%
System Repair, 18.8%
New Systems, 16.6%
Sewer Overflow, 17.7%
Stormwater, 7.0% Recycled Distribution, 2.2%
Projected CapEx by Need -Wastewater
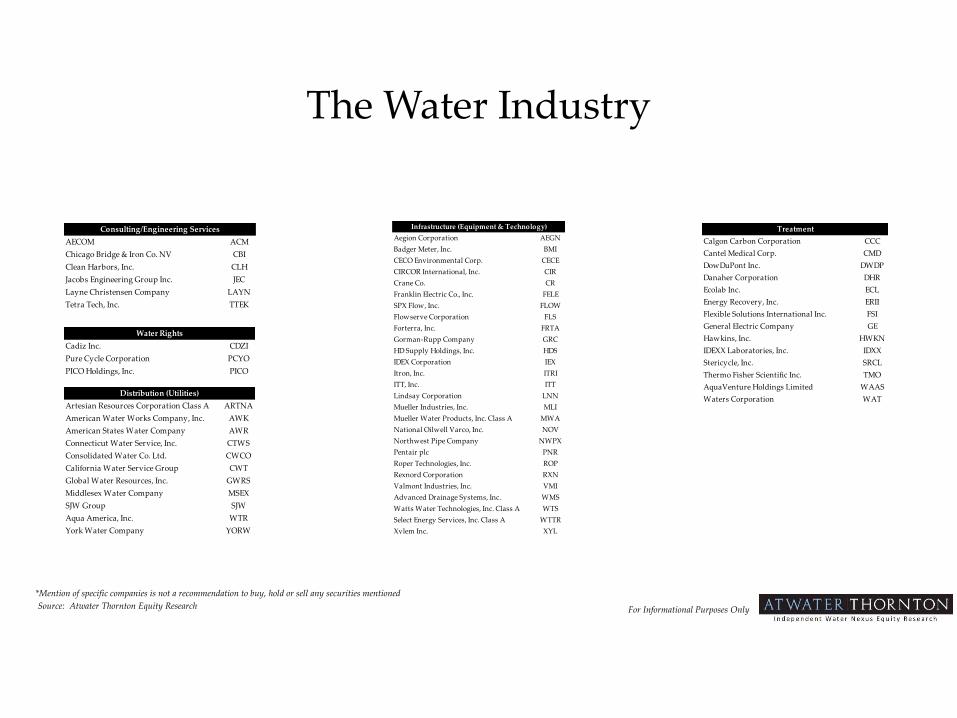
The Water Industry
For Informational Purposes Only Source: Atwater Thornton Equity Research
*Mention of specific companies is not a recommendation to buy, hold or sell any securities mentioned
AECOM ACM
Chicago Bridge & Iron Co. NV CBI
Clean Harbors, Inc. CLH
Jacobs Engineering Group Inc. JEC
Layne Christensen Company LAYN
Tetra Tech, Inc. TTEK
Consulting/Engineering Services
Cadiz Inc. CDZI
Pure Cycle Corporation PCYO
PICO Holdings, Inc. PICO
Water Rights
Artesian Resources Corporation Class A ARTNA
American Water Works Company, Inc. AWK
American States Water Company AWR
Connecticut Water Service, Inc. CTWS
Consolidated Water Co. Ltd. CWCO
California Water Service Group CWT
Global Water Resources, Inc. GWRS
Middlesex Water Company MSEX
SJW Group SJW
Aqua America, Inc. WTR
York Water Company YORW
Distribution (Utilities)
Aegion Corporation AEGN
Badger Meter, Inc. BMI
CECO Environmental Corp. CECE
CIRCOR International, Inc. CIR
Crane Co. CR
Franklin Electric Co., Inc. FELE
SPX Flow, Inc. FLOW
Flowserve Corporation FLS
Forterra, Inc. FRTA
Gorman-Rupp Company GRC
HD Supply Holdings, Inc. HDS
IDEX Corporation IEX
Itron, Inc. ITRI
ITT, Inc. ITT
Lindsay Corporation LNN
Mueller Industries, Inc. MLI
Mueller Water Products, Inc. Class A MWA
National Oilwell Varco, Inc. NOV
Northwest Pipe Company NWPX
Pentair plc PNR
Roper Technologies, Inc. ROP
Rexnord Corporation RXN
Valmont Industries, Inc. VMI
Advanced Drainage Systems, Inc. WMS
Watts Water Technologies, Inc. Class A WTS
Select Energy Services, Inc. Class A WTTR
Xylem Inc. XYL
Infrastructure (Equipment & Technology)
Calgon Carbon Corporation CCC
Cantel Medical Corp. CMD
DowDuPont Inc. DWDP
Danaher Corporation DHR
Ecolab Inc. ECL
Energy Recovery, Inc. ERII
Flexible Solutions International Inc. FSI
General Electric Company GE
Hawkins, Inc. HWKN
IDEXX Laboratories, Inc. IDXX
Stericycle, Inc. SRCL
Thermo Fisher Scientific Inc. TMO
AquaVenture Holdings Limited WAAS
Waters Corporation WAT
Treatment
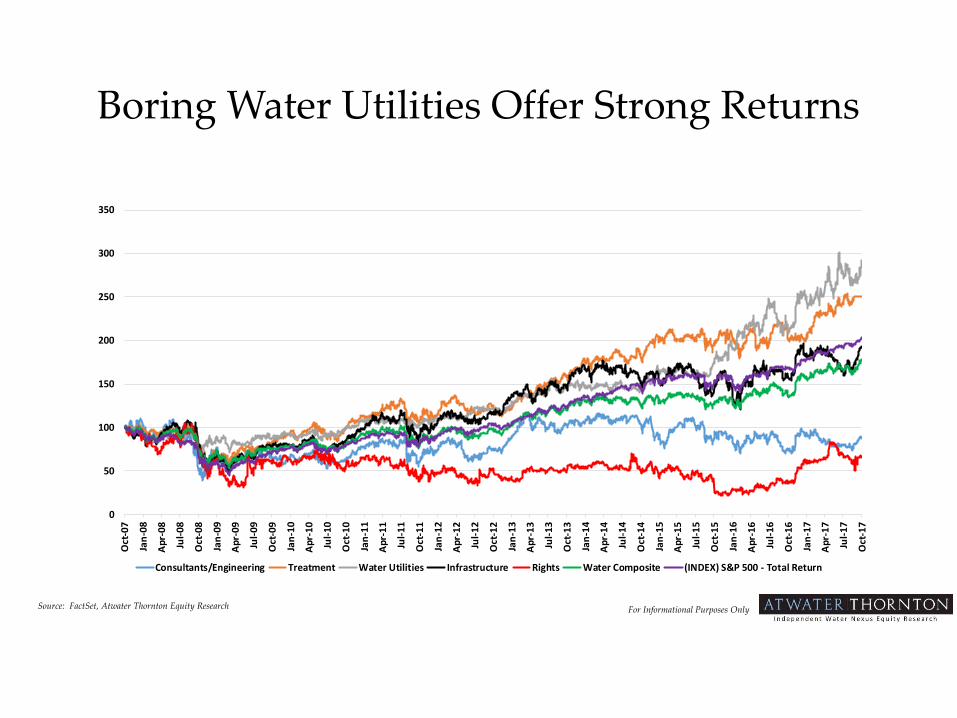
Boring Water Utilities Offer Strong Returns
For Informational Purposes Only Source: FactSet, Atwater Thornton Equity Research
0
50
100
150
200
250
300
350
Oct
-07
Jan
-08
Ap
r-0
8
Jul-
08
Oct
-08
Jan
-09
Ap
r-0
9
Jul-
09
Oct
-09
Jan
-10
Ap
r-1
0
Jul-
10
Oct
-10
Jan
-11
Ap
r-1
1
Jul-
11
Oct
-11
Jan
-12
Ap
r-1
2
Jul-
12
Oct
-12
Jan
-13
Ap
r-1
3
Jul-
13
Oct
-13
Jan
-14
Ap
r-1
4
Jul-
14
Oct
-14
Jan
-15
Ap
r-1
5
Jul-
15
Oct
-15
Jan
-16
Ap
r-1
6
Jul-
16
Oct
-16
Jan
-17
Ap
r-1
7
Jul-
17
Oct
-17
Consultants/Engineering Treatment Water Utilities Infrastructure Rights Water Composite (INDEX) S&P 500 - Total Return
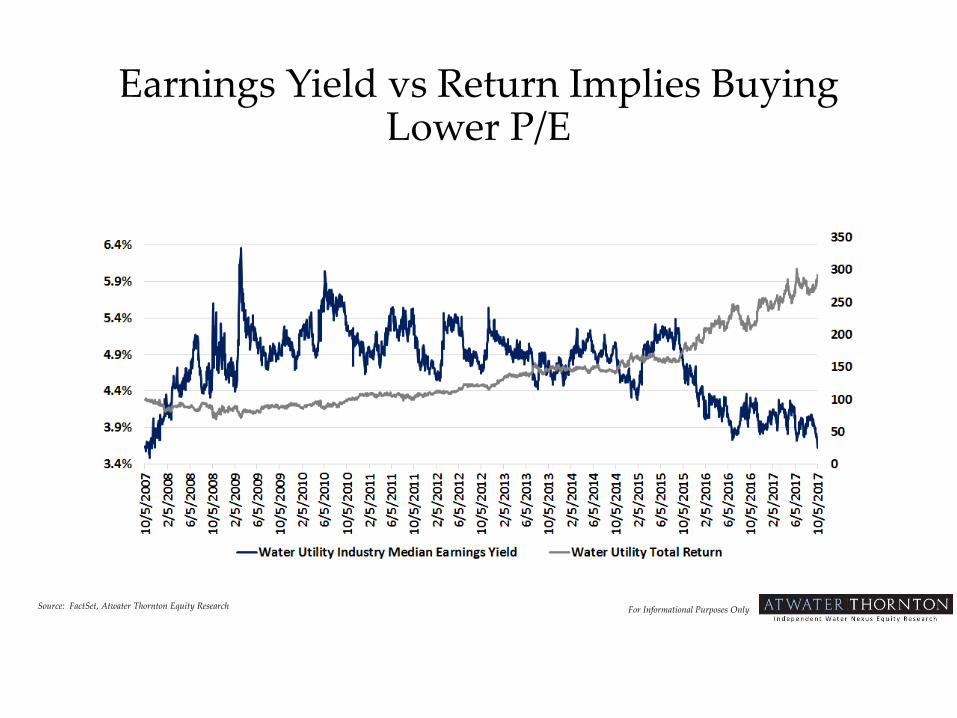
Earnings Yield vs Return Implies Buying Lower P/E
For Informational Purposes Only Source: FactSet, Atwater Thornton Equity Research
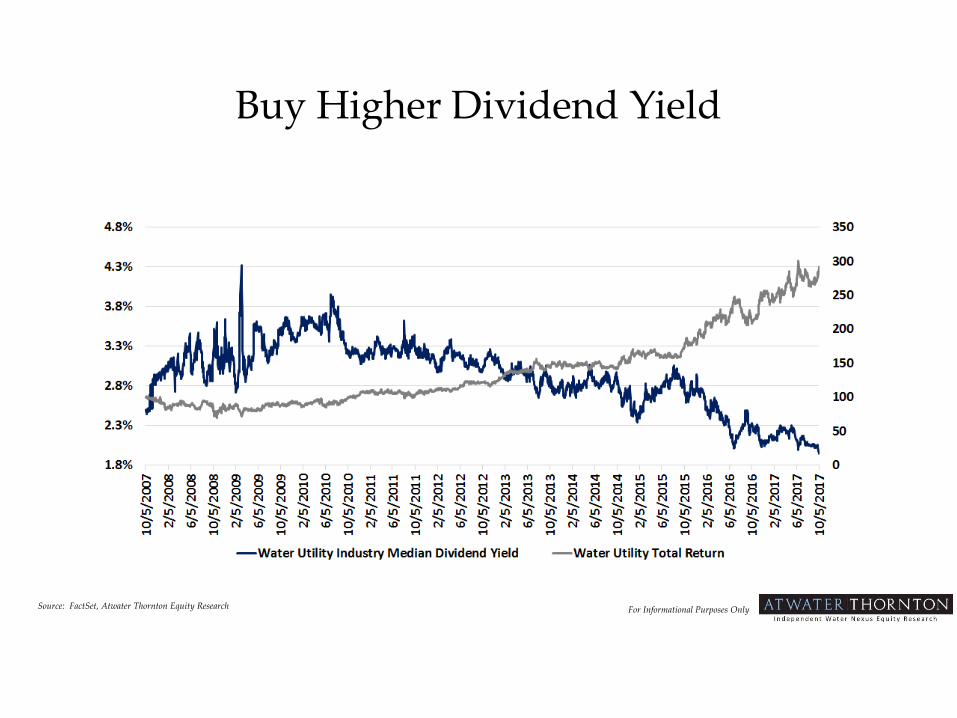
Buy Higher Dividend Yield
For Informational Purposes Only Source: FactSet, Atwater Thornton Equity Research
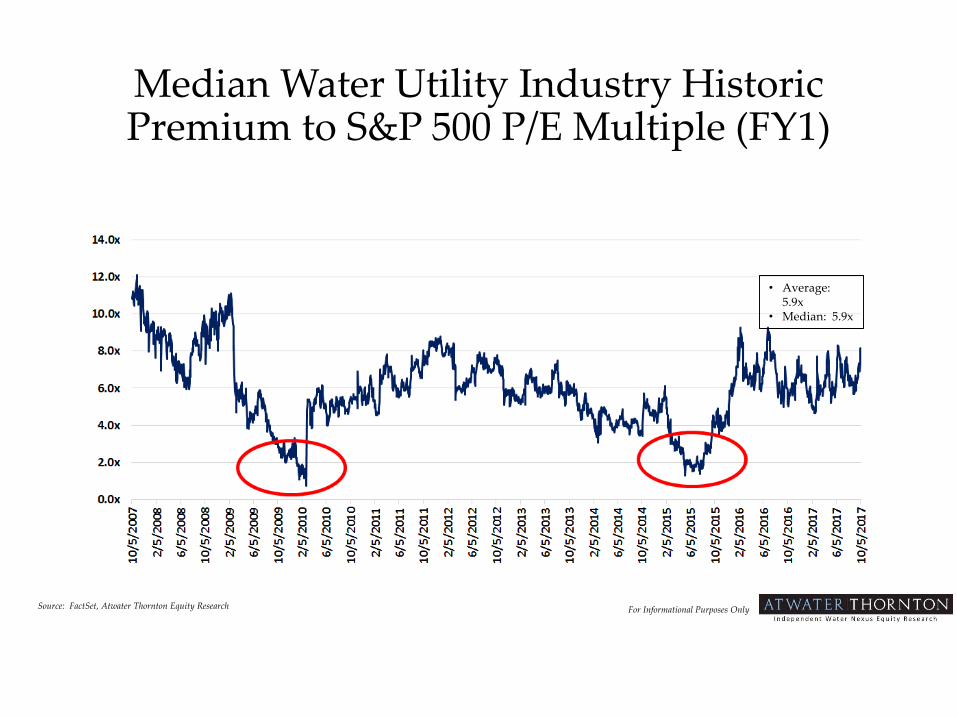
Median Water Utility Industry Historic Premium to S&P 500 P/E Multiple (FY1)
For Informational Purposes Only
• Average: 5.9x
• Median: 5.9x
Source: FactSet, Atwater Thornton Equity Research
An Abundance of Investment Opportunities Exist
• According to the World Federation of Exchanges, Bloomberg and International Monetary Fund – the global equity market capitalization is over $75.0 trillion
• The global utility sector stands at nearly $3.0 trillion
• Utility stocks appeal to certain investors – Yield, Yield + Growth
• These same investors have choices – Master Limited Partnerships, Real Estate Investment Trusts, Telecom
• Approximately 100 domestic utility stocks presently exist
• Even more debt instruments are in the marketplace
• Utility categories – Electric, Gas, Water
• The investment community neatly fits Public Utility Commissions (PUCs) into three categories – Favorable, Neutral, Unfavorable
For Informational Purposes Only
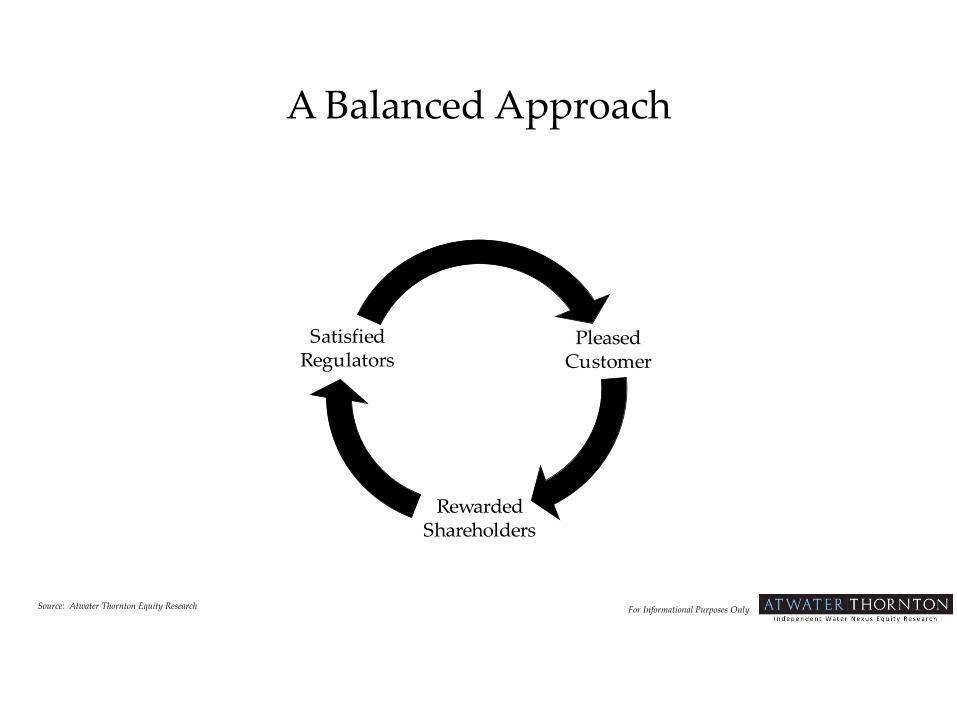
A Balanced Approach
For Informational Purposes Only
Pleased Customer
Rewarded Shareholders
Satisfied Regulators
Source: Atwater Thornton Equity Research
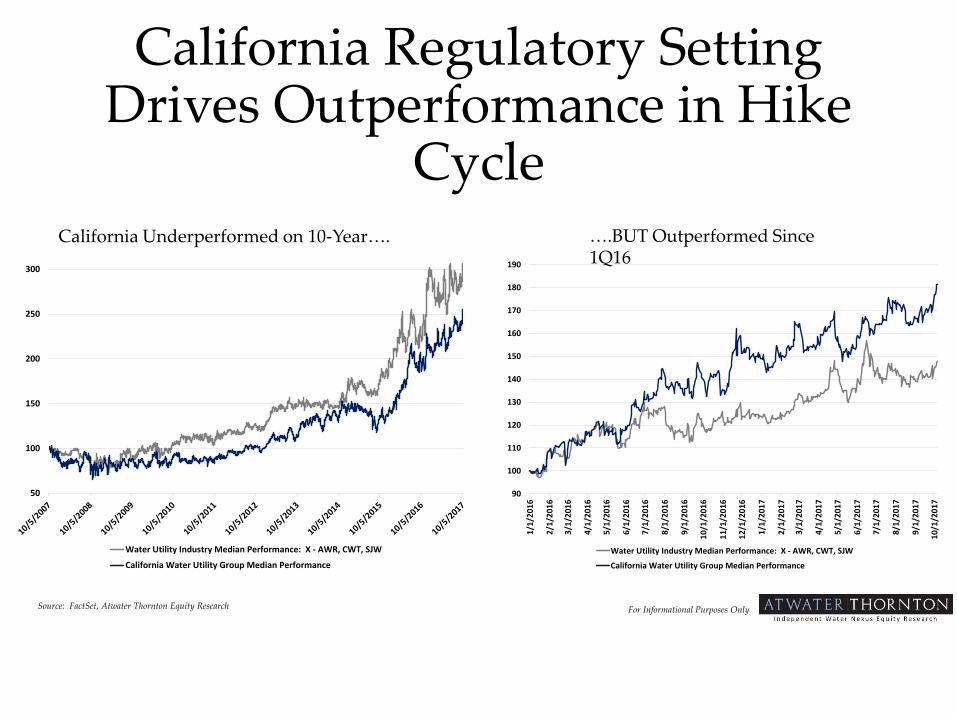
California Regulatory Setting Drives Outperformance in Hike
Cycle
For Informational Purposes Only
50
100
150
200
250
300
Water Utility Industry Median Performance: X - AWR, CWT, SJW
California Water Utility Group Median Performance
90
100
110
120
130
140
150
160
170
180
190
1/1
/20
16
2/1
/20
16
3/1
/20
16
4/1
/20
16
5/1
/20
16
6/1
/20
16
7/1
/20
16
8/1
/20
16
9/1
/20
16
10
/1/2
01
6
11
/1/2
01
6
12
/1/2
01
6
1/1
/20
17
2/1
/20
17
3/1
/20
17
4/1
/20
17
5/1
/20
17
6/1
/20
17
7/1
/20
17
8/1
/20
17
9/1
/20
17
10
/1/2
01
7
Water Utility Industry Median Performance: X - AWR, CWT, SJW
California Water Utility Group Median Performance
California Underperformed on 10-Year…. ….BUT Outperformed Since 1Q16
Source: FactSet, Atwater Thornton Equity Research
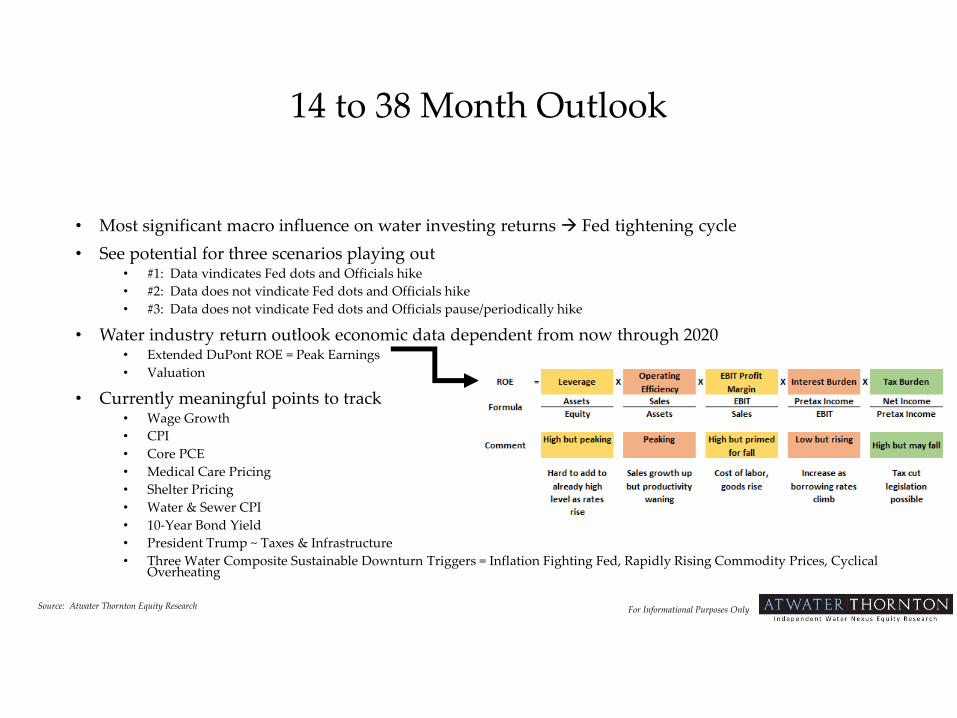
14 to 38 Month Outlook
• Most significant macro influence on water investing returns Fed tightening cycle
• See potential for three scenarios playing out• #1: Data vindicates Fed dots and Officials hike
• #2: Data does not vindicate Fed dots and Officials hike
• #3: Data does not vindicate Fed dots and Officials pause/periodically hike
• Water industry return outlook economic data dependent from now through 2020• Extended DuPont ROE = Peak Earnings
• Valuation
• Currently meaningful points to track• Wage Growth
• CPI
• Core PCE
• Medical Care Pricing
• Shelter Pricing
• Water & Sewer CPI
• 10-Year Bond Yield
• President Trump ~ Taxes & Infrastructure
• Three Water Composite Sustainable Downturn Triggers = Inflation Fighting Fed, Rapidly Rising Commodity Prices, Cyclical Overheating
For Informational Purposes Only Source: Atwater Thornton Equity Research
Water Utility Industry Risks
• In addition to normal economic and market risk factors that impact most all equities, water utilities are uniquely at risk to:
• The outcome of regulatory filings: regulated operations are subject to state and federal regulations. Changes in the regulatory environment can impact a company’s financial performance. In addition, water utilities continuously file requests with state Commissions for rate increases in order to achieve rates of return on water assets. If state Commissions deny these rate requests in whole or in part, it would likely have a negative impact on earnings.
• Product safety: Water is the only utility with a product that is ingested. Though regulated water utilities traditionally have strong track records with respect to water contaminants, a breakdown in safety procedures could have a markedly negative effect.
• Federal and state environmental laws and regulations impose substantial compliance requirements on water utility operations. A water utility’s operating costs could be significantly increased in order to comply with new or stricter regulatory standards imposed by federal and state environmental agencies.
• Water utilities are impacted by weather conditions and are subject to seasonal fluctuations which could adversely affect demand for water service and revenues.
• Drought conditions and government imposed water use restrictions may impact a water utility’s ability to serve current and future customers. This may adversely affect the water utility’s financial condition and results of operations.
Disclosures
Legal DisclaimersAtwater Thornton LLC is an independent equity research company and is neither a broker dealer nor offers investment banking services. Atwater Thornton LLC is not a market maker for any securities, does not hold any securities positions, and does not seek compensation for investment banking services. The analyst preparing this presentation does hold securities of water nexus industry companies. The analyst preparing this presentation does not receive any compensation directly or indirectly from investment banking services.
Other DisclaimersInformation contained in this presentation has been prepared from sources believed to be reliable and accurate but are not guaranteed by Atwater Thornton LLC and do not represent a complete summary or statement of all available data. Moreover, information and opinions expressed are subject to change without notice and Atwater Thornton LLC is under no obligation to inform you of such change.
This presentation has been prepared solely for informational purposes and should not be utilized for investment decisions. Information provided does not take into account the particular investment objectives, financial and/or tax situation, or needs of individual investors. Investment decisions should take into account all available information, not just that which is contained in this presentation. Furthermore, nothing contained in this presentation should be considered an offer or solicitation by Atwater Thornton LLC to buy or sell any securities or other financial instruments. Past performance is not indicative of future results and estimates of future performance contained in this presentation are based on assumptions that may not be realized. Atwater Thornton LLC accepts no liability for loss arising from use of content in this presentation.
No portion of this presentation may be reproduced, sold, or redistributed, in any form without express written consent of Atwater Thornton LLC.
PLEASE SEE ADDITIONAL DISCLOSURE INFORMATION AT https://www.atwaterthornton.com/disclosures/

Upstream with
a Paddle