Embed Size (px)
Citation preview
Upstream Oil and Gas Emission Inventories in the Inter-Mountain West
Tom MooreWRAP/WESTAR
National Tribal Forum on Air Quality Swinomish Indian Tribal Community, Anacortes, WA
May 14, 2014
• Emission inventories – background
• History of O&G emission inventory development
• WRAP Phase III inventories
• Technical methodology
• Results for an example basin
• Cross-basin comparisons
• Regulatory approach
• Emission inventory issues – improvements and new concepts
Overview
Emissions Inventories
• Emissions are what is regulated, not ambient air quality - through:
– Limits on permitted sources and tracking of actual emissions• Strategies that address group or types of sources by specifying
technology for operations (fuels, turnover of technology) or controls (specified emissions limits)
• Fees for permitted sources allow regulators to recover costs to issue, inspect, and monitor impacts
– Reporting and analysis of inventory data allows trend and compliance tracking – done for multiple purposes• A heightened effort is required to build and understand a baseline
historical period inventory for a modeling study• Modeling studies also require projections of future emissions to assess
control programs to efficient emissions reduction strategies
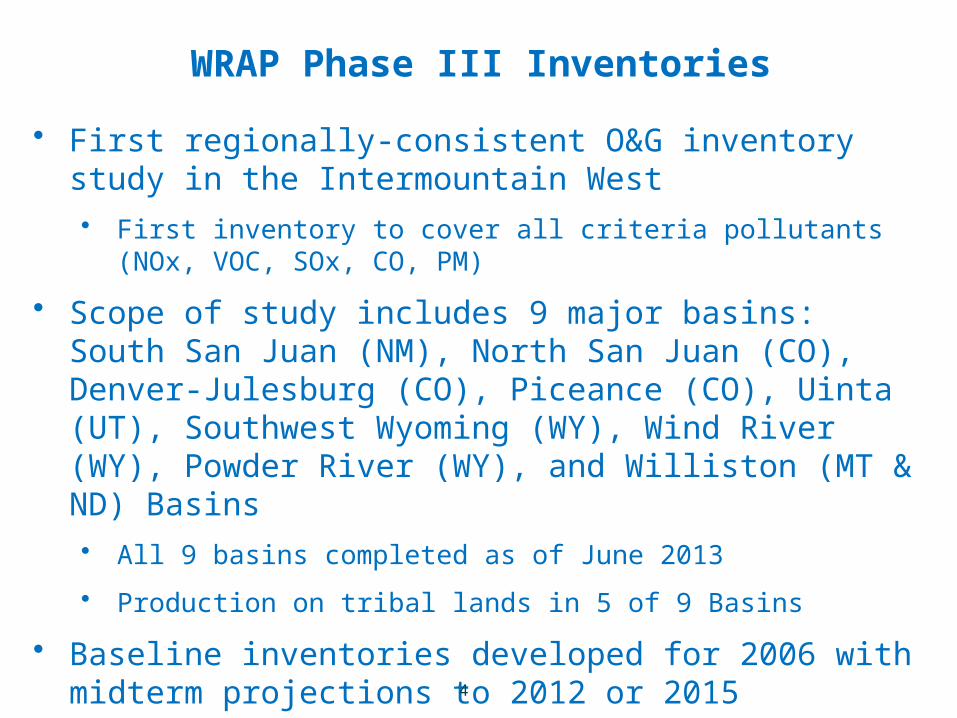
• First regionally-consistent O&G inventory study in the Intermountain West
• First inventory to cover all criteria pollutants (NOx, VOC, SOx, CO, PM)
• Scope of study includes 9 major basins: South San Juan (NM), North San Juan (CO), Denver-Julesburg (CO), Piceance (CO), Uinta (UT), Southwest Wyoming (WY), Wind River (WY), Powder River (WY), and Williston (MT & ND) Basins
• All 9 basins completed as of June 2013
• Production on tribal lands in 5 of 9 Basins
• Baseline inventories developed for 2006 with midterm projections to 2012 or 2015
• Baseline updates to 2008 for WestJump AQMS – more updates planned
WRAP Phase III Inventories
4
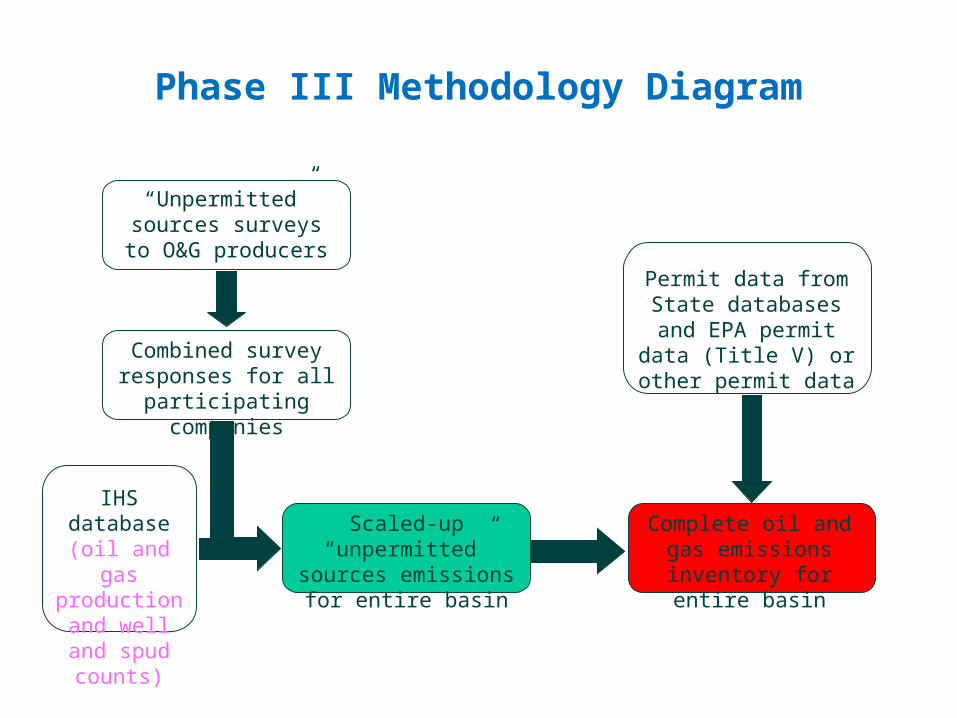
“Unpermitted” sources surveys to
O&G producers
Combined survey responses for all
participating companies
IHS database (oil and gas production
and well and spud counts)
Scaled-up “unpermitted” sources emissions for
entire basin
Permit data from State databases and EPA
permit data (Title V) or other permit data
Complete oil and gas emissions inventory for
entire basin
Phase III Methodology Diagram
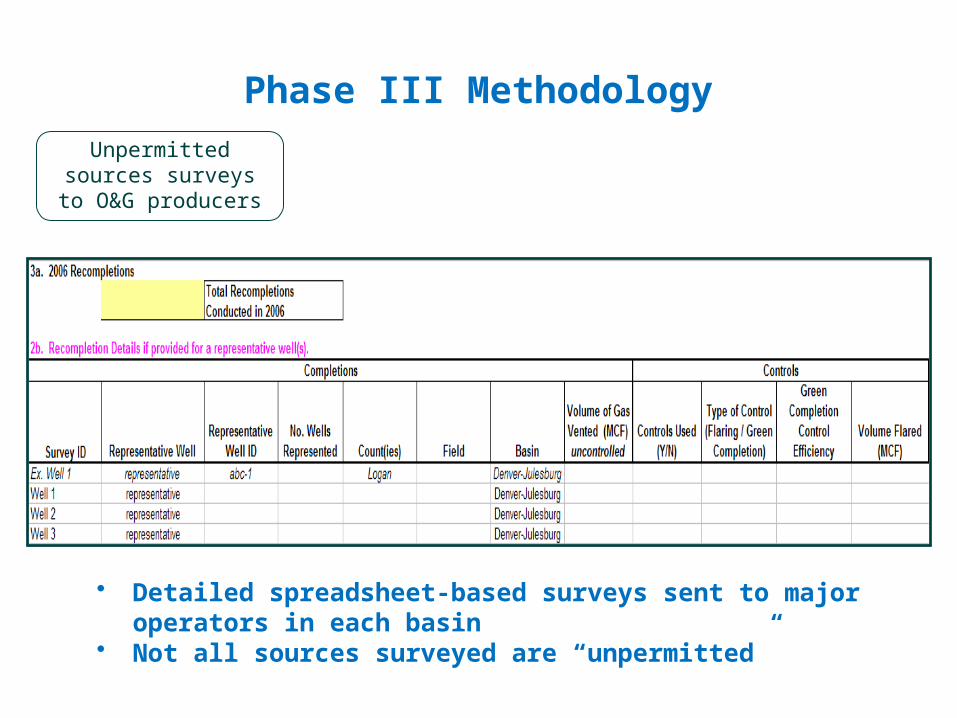
• Detailed spreadsheet-based surveys sent to major operators in each basin• Not all sources surveyed are “unpermitted”
Phase III Methodology
Unpermitted sources surveys to O&G
producers
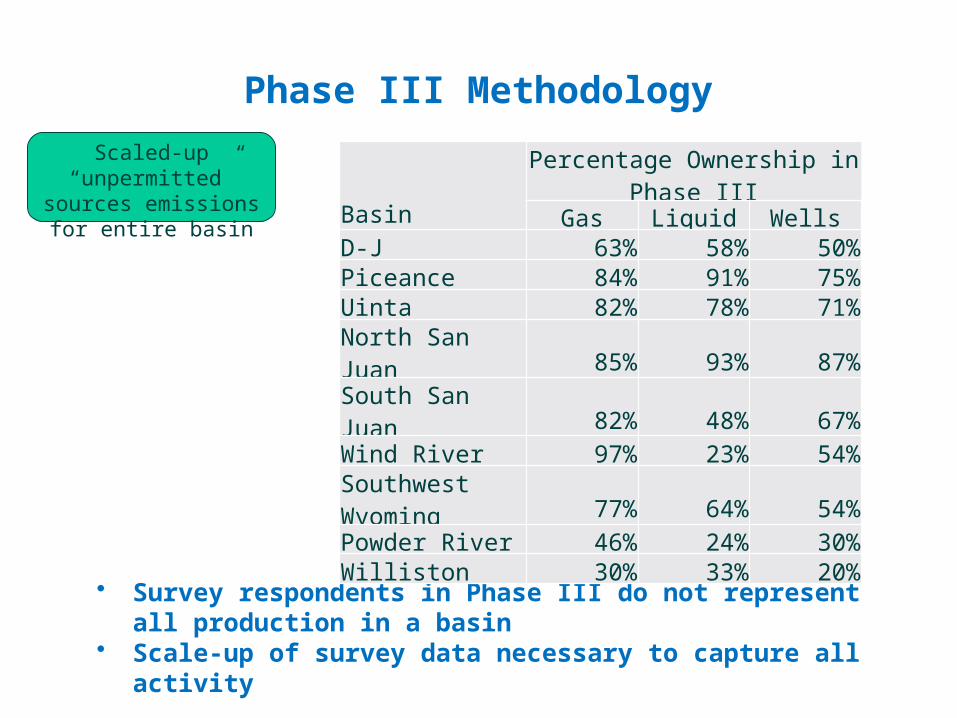
• Survey respondents in Phase III do not represent all production in a basin• Scale-up of survey data necessary to capture all activity
Phase III Methodology
Scaled-up “unpermitted” sources emissions for
entire basin BasinPercentage Ownership in Phase III
Gas Liquid WellsD-J 63% 58% 50%Piceance 84% 91% 75%Uinta 82% 78% 71%North San Juan 85% 93% 87%South San Juan 82% 48% 67%Wind River 97% 23% 54%Southwest Wyoming 77% 64% 54%Powder River 46% 24% 30%Williston 30% 33% 20%
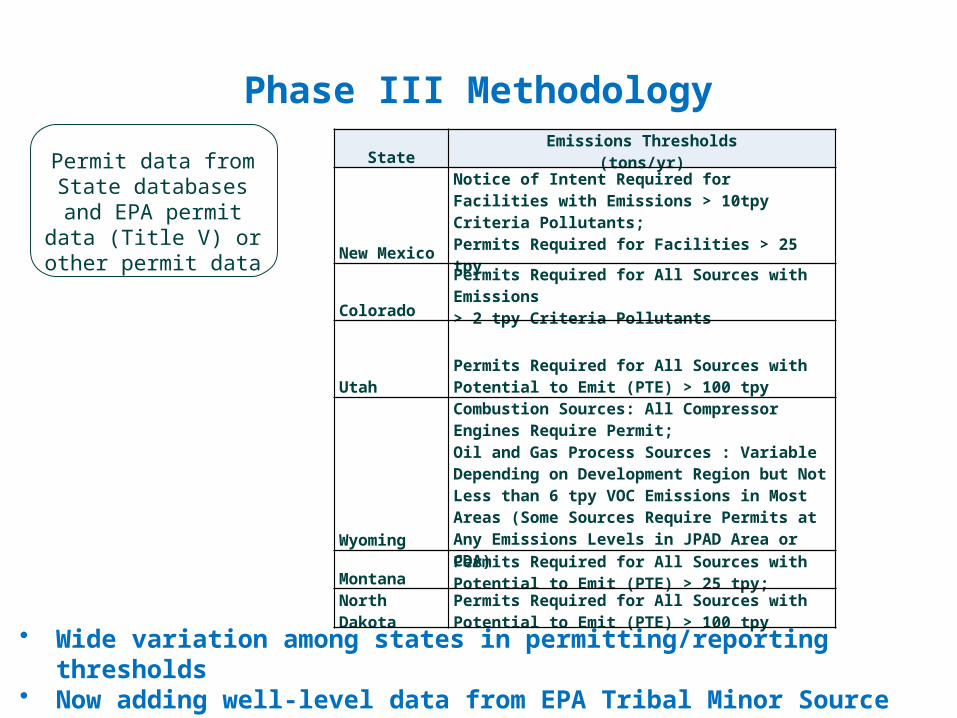
• Wide variation among states in permitting/reporting thresholds• Now adding well-level data from EPA Tribal Minor Source reporting requirements
Phase III Methodology
Permit data from State databases and EPA
permit data (Title V) or other permit data
StateEmissions Thresholds
(tons/yr)
New Mexico
Notice of Intent Required for Facilities with Emissions > 10tpy Criteria Pollutants;Permits Required for Facilities > 25 tpy
ColoradoPermits Required for All Sources with Emissions > 2 tpy Criteria Pollutants
UtahPermits Required for All Sources with Potential to Emit (PTE) > 100 tpy
Wyoming
Combustion Sources: All Compressor Engines Require Permit;Oil and Gas Process Sources : Variable Depending on Development Region but Not Less than 6 tpy VOC Emissions in Most Areas (Some Sources Require Permits at Any Emissions Levels in JPAD Area or CDA)
MontanaPermits Required for All Sources with Potential to Emit (PTE) > 25 tpy;
North DakotaPermits Required for All Sources with Potential to Emit (PTE) > 100 tpy
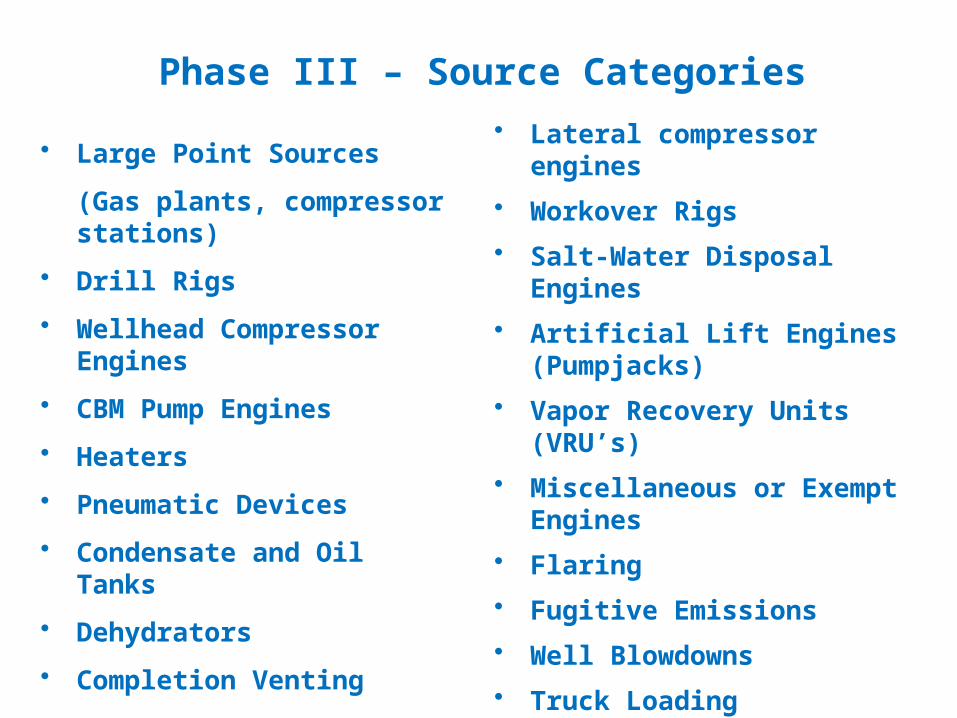
• Large Point Sources
(Gas plants, compressor stations)
• Drill Rigs
• Wellhead Compressor Engines
• CBM Pump Engines
• Heaters
• Pneumatic Devices
• Condensate and Oil Tanks
• Dehydrators
• Completion Venting
• Lateral compressor engines
• Workover Rigs
• Salt-Water Disposal Engines
• Artificial Lift Engines (Pumpjacks)
• Vapor Recovery Units (VRU’s)
• Miscellaneous or Exempt Engines
• Flaring
• Fugitive Emissions
• Well Blowdowns
• Truck Loading
• Amine Units (acid gas removal)
• Water Tanks
Phase III – Source Categories
19901992
19941996
19982000
20022004
20062008
20102012
0
1,000,000
2,000,000
3,000,000
4,000,000
5,000,000
6,000,000
7,000,000
$1.00
$2.00
$3.00
$4.00
$5.00
$6.00
$7.00
$8.00
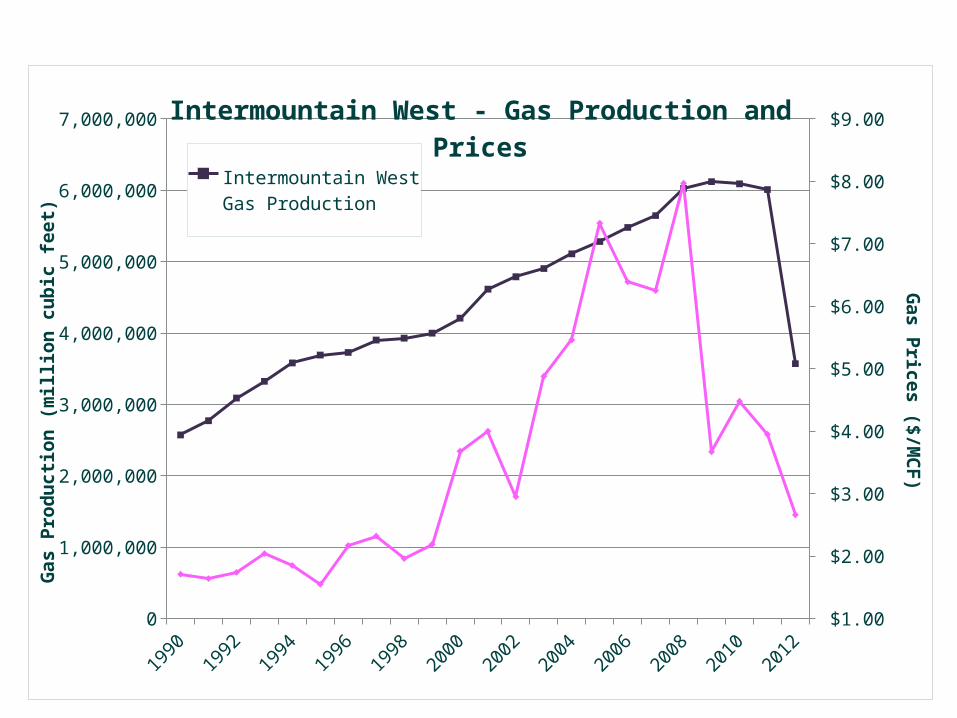
$9.00 Intermountain West - Gas Production and Prices
Intermountain West Gas Production
Wellhead Gas Prices
Gas
Pro
du
ctio
n (
mill
ion
cu
bic
fee
t)G
as Prices ($/M
CF
)
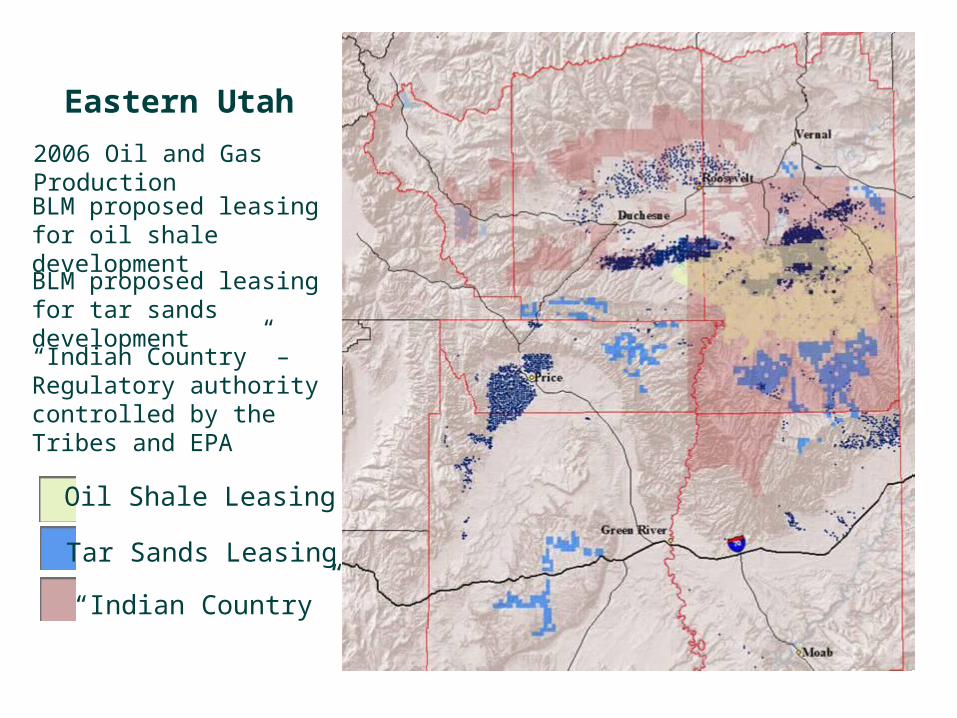
2006 Oil and Gas Production
Eastern Utah
BLM proposed leasing for oil shale development
BLM proposed leasing for tar sands development
“Indian Country” – Regulatory authority controlled by the Tribes and EPA
Oil Shale Leasing
Tar Sands Leasing
“Indian Country”
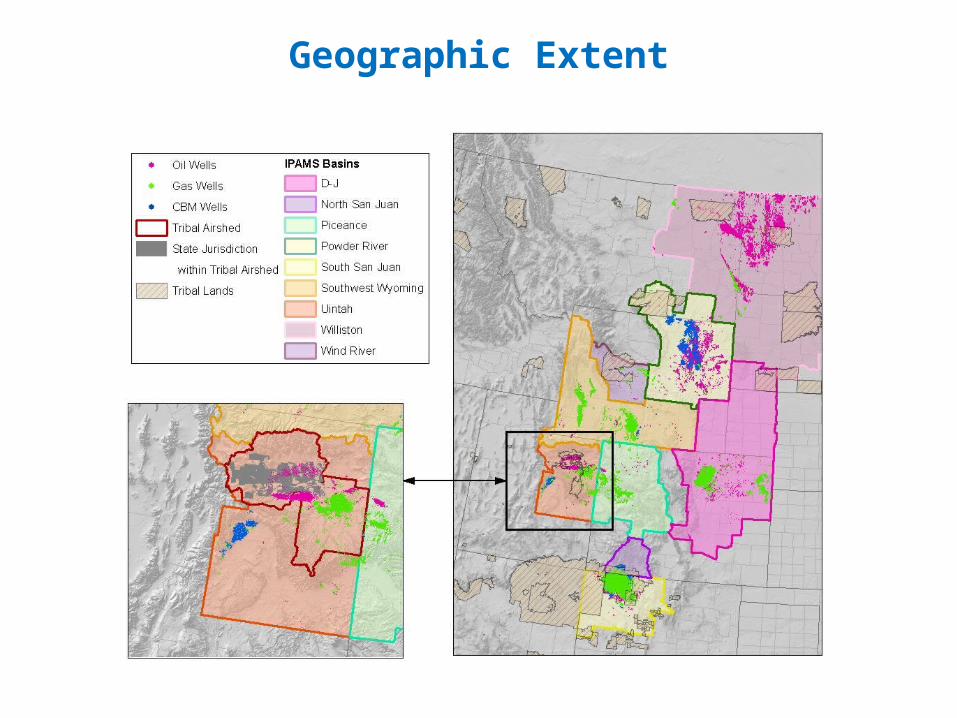
Geographic Extent
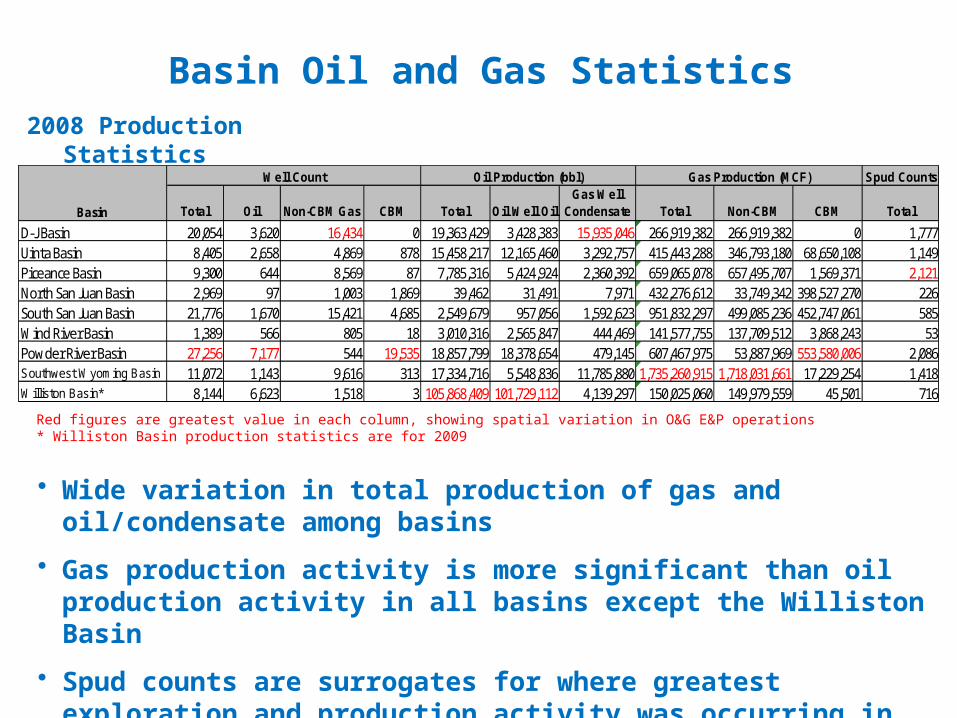
Basin Oil and Gas Statistics
• Wide variation in total production of gas and oil/condensate among basins
• Gas production activity is more significant than oil production activity in all basins except the Williston Basin
• Spud counts are surrogates for where greatest exploration and production activity was occurring in 2008
Red figures are greatest value in each column, showing spatial variation in O&G E&P operations* Williston Basin production statistics are for 2009
Spud Counts
Total Oil Non-CBM Gas CBM Total Oil Well OilGas Well
Condensate Total Non-CBM CBM Total
D-J Basin 20,054 3,620 16,434 0 19,363,429 3,428,383 15,935,046 266,919,382 266,919,382 0 1,777Uinta Basin 8,405 2,658 4,869 878 15,458,217 12,165,460 3,292,757 415,443,288 346,793,180 68,650,108 1,149Piceance Basin 9,300 644 8,569 87 7,785,316 5,424,924 2,360,392 659,065,078 657,495,707 1,569,371 2,121North San Juan Basin 2,969 97 1,003 1,869 39,462 31,491 7,971 432,276,612 33,749,342 398,527,270 226South San Juan Basin 21,776 1,670 15,421 4,685 2,549,679 957,056 1,592,623 951,832,297 499,085,236 452,747,061 585Wind River Basin 1,389 566 805 18 3,010,316 2,565,847 444,469 141,577,755 137,709,512 3,868,243 53Powder River Basin 27,256 7,177 544 19,535 18,857,799 18,378,654 479,145 607,467,975 53,887,969 553,580,006 2,086Southwest Wyoming Basin 11,072 1,143 9,616 313 17,334,716 5,548,836 11,785,880 1,735,260,915 1,718,031,661 17,229,254 1,418Williston Basin* 8,144 6,623 1,518 3 105,868,409 101,729,112 4,139,297 150,025,060 149,979,559 45,501 716
Basin
Well Count Oil Production (bbl) Gas Production (MCF)
2008 Production Statistics
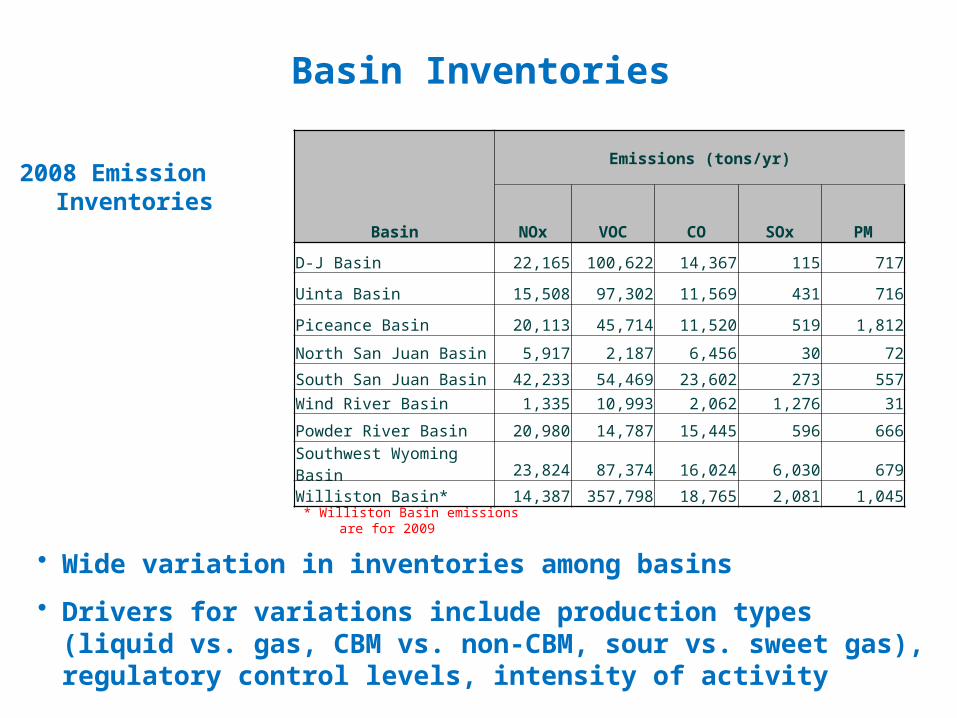
Basin Inventories
• Wide variation in inventories among basins
• Drivers for variations include production types (liquid vs. gas, CBM vs. non-CBM, sour vs. sweet gas), regulatory control levels, intensity of activity
* Williston Basin emissions are for 2009
2008 Emission Inventories
Basin
Emissions (tons/yr)
NOx VOC CO SOx PM
D-J Basin 22,165 100,622 14,367 115 717
Uinta Basin 15,508 97,302 11,569 431 716
Piceance Basin 20,113 45,714 11,520 519 1,812
North San Juan Basin 5,917 2,187 6,456 30 72
South San Juan Basin 42,233 54,469 23,602 273 557
Wind River Basin 1,335 10,993 2,062 1,276 31
Powder River Basin 20,980 14,787 15,445 596 666
Southwest Wyoming Basin 23,824 87,374 16,024 6,030 679
Williston Basin* 14,387 357,798 18,765 2,081 1,045
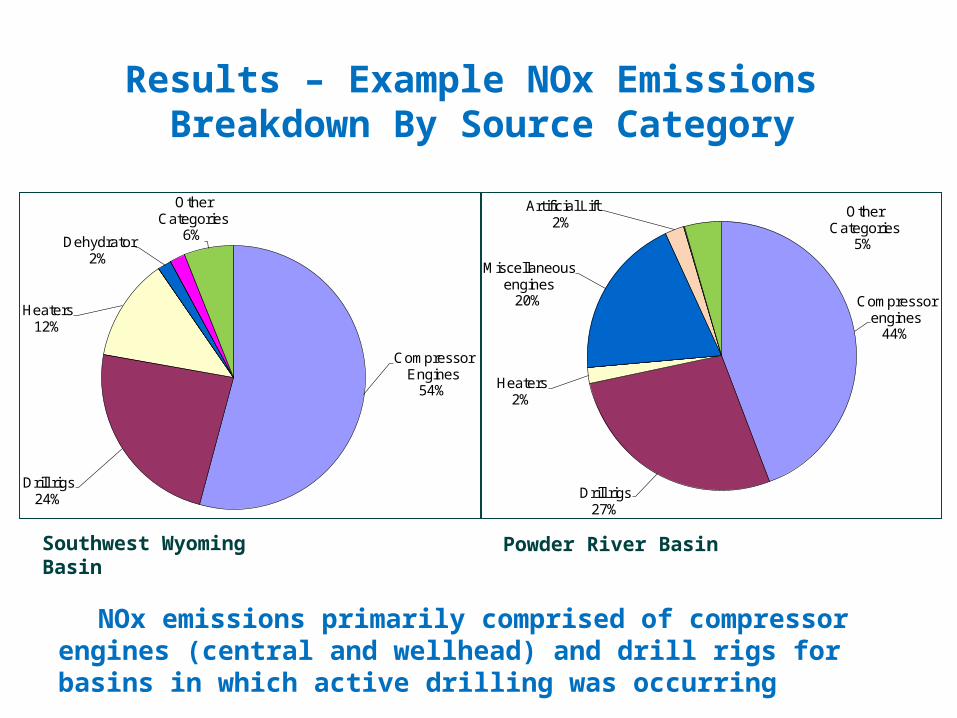
NOx emissions primarily comprised of compressor engines (central and wellhead) and drill rigs for basins in which active drilling was occurring
Results – Example NOx Emissions Breakdown By Source Category
Southwest Wyoming Basin Powder River Basin
Compressor engines
44%
Drill rigs27%
Heaters2%
Miscellaneous engines
20%
Artificial Lift2%
Other Categories
5%
Compressor Engines
54%
Drill rigs24%
Heaters12%
Dehydrator2%
Other Categories
6%
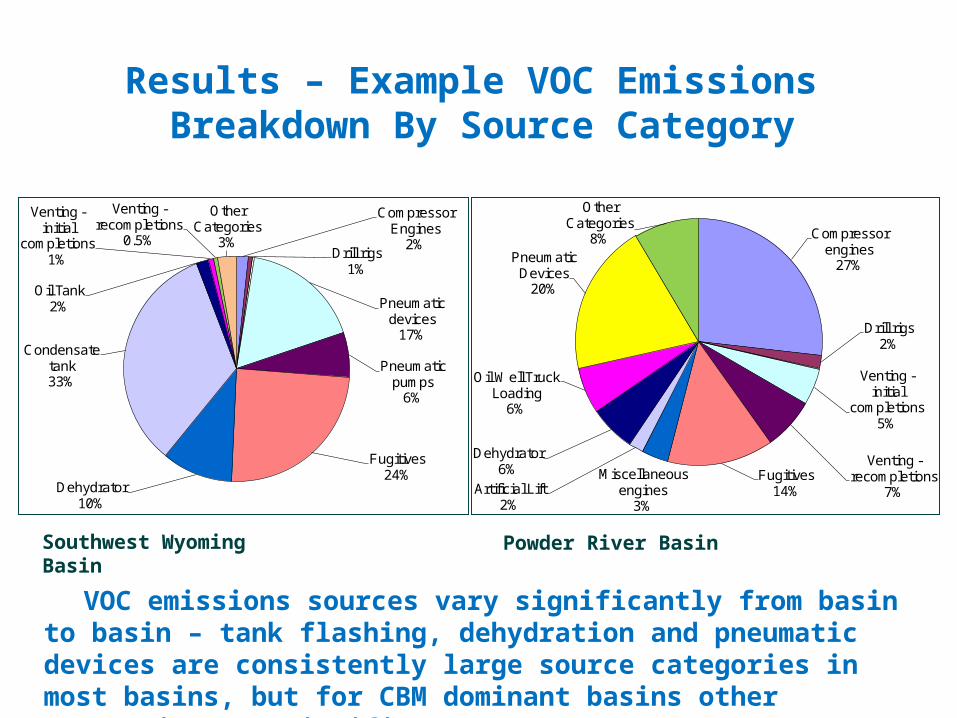
VOC emissions sources vary significantly from basin to basin – tank flashing, dehydration and pneumatic devices are consistently large source categories in most basins, but for CBM dominant basins other categories are significant
Results – Example VOC Emissions Breakdown By Source Category
Compressor Engines
2%Drill rigs
1%
Pneumatic devices
17%
Pneumatic pumps
6%
Fugitives24%
Dehydrator10%
Condensate tank 33%
Oil Tank2%
Venting -initial
completions1%
Venting -recompletions
0.5%
Other Categories
3%Compressor
engines27%
Drill rigs2%
Venting -initial
completions5%
Venting -recompletions
7%Fugitives
14%Miscellaneous
engines3%
Artificial Lift2%
Dehydrator6%
Oil Well Truck Loading
6%
Pneumatic Devices
20%
Other Categories
8%
Southwest Wyoming Basin Powder River Basin
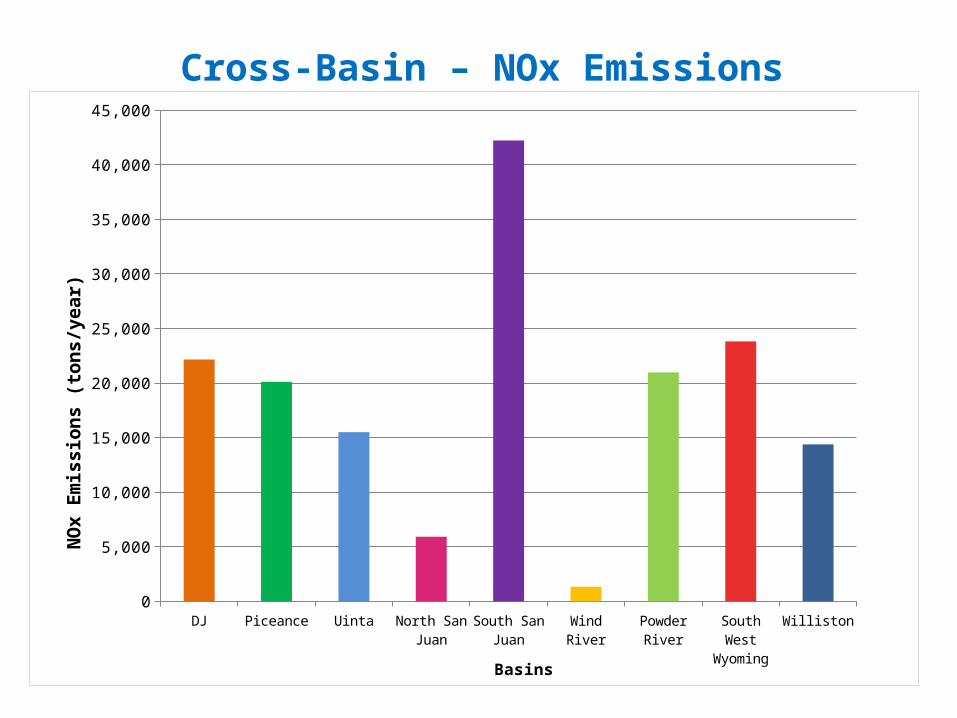
Cross-Basin – NOx Emissions
DJ Piceance Uinta North San Juan
South San Juan
Wind River Powder River
South West Wyoming
Williston0
5,000
10,000
15,000
20,000
25,000
30,000
35,000
40,000
45,000
Basins
NO
x Em
issi
ons
(ton
s/ye
ar)
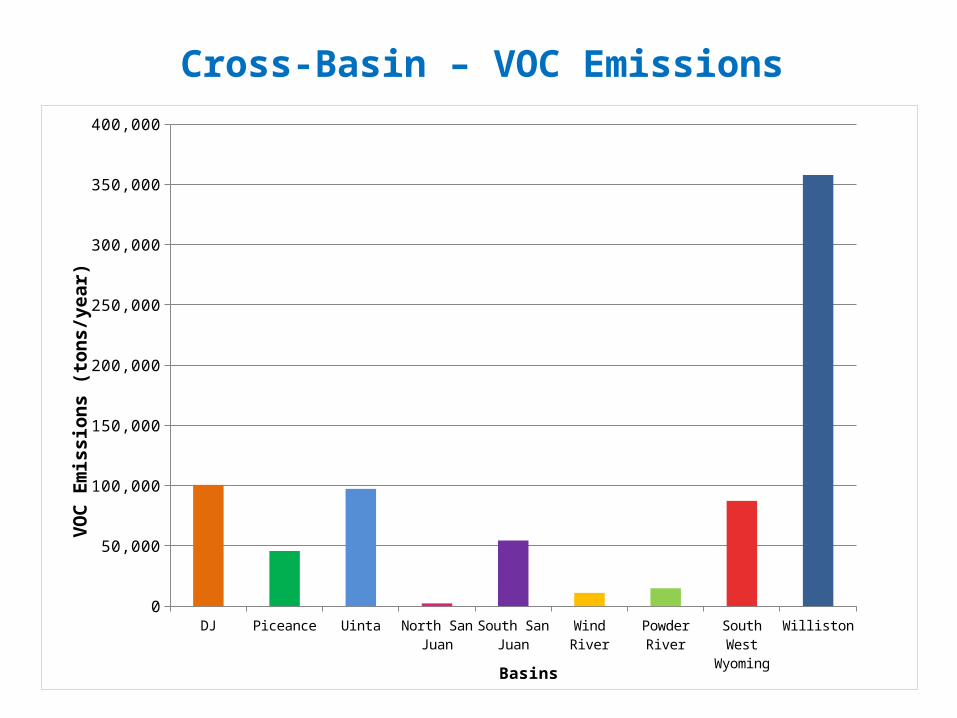
Cross-Basin – VOC Emissions
DJ Piceance Uinta North San Juan
South San Juan
Wind River Powder River
South West Wyoming
Williston0
50,000
100,000
150,000
200,000
250,000
300,000
350,000
400,000
Basins
VOC
Emis
sion
s (t
ons/
year
)
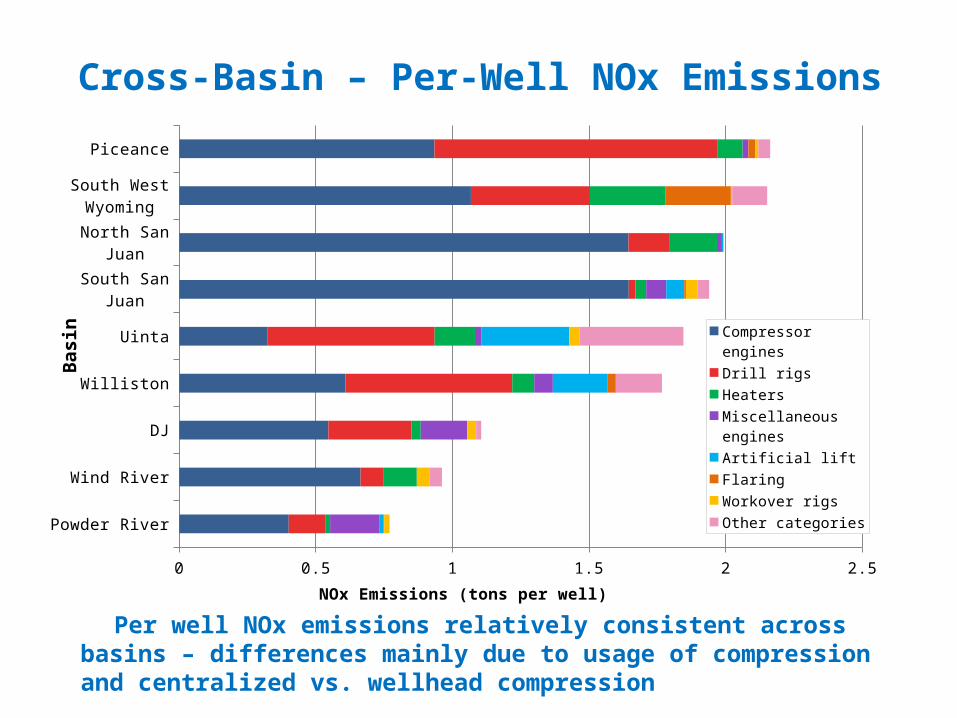
Cross-Basin – Per-Well NOx Emissions
Per well NOx emissions relatively consistent across basins – differences mainly due to usage of compression and centralized vs. wellhead compression
Powder River
Wind River
DJ
Williston
Uinta
South San Juan
North San Juan
South West Wyoming
Piceance
0 0.5 1 1.5 2 2.5
Compressor engines
Drill rigs
Heaters
Miscellaneous engines
Artificial lift
Flaring
Workover rigs
Other categories
NOx Emissions (tons per well)
Basi
n
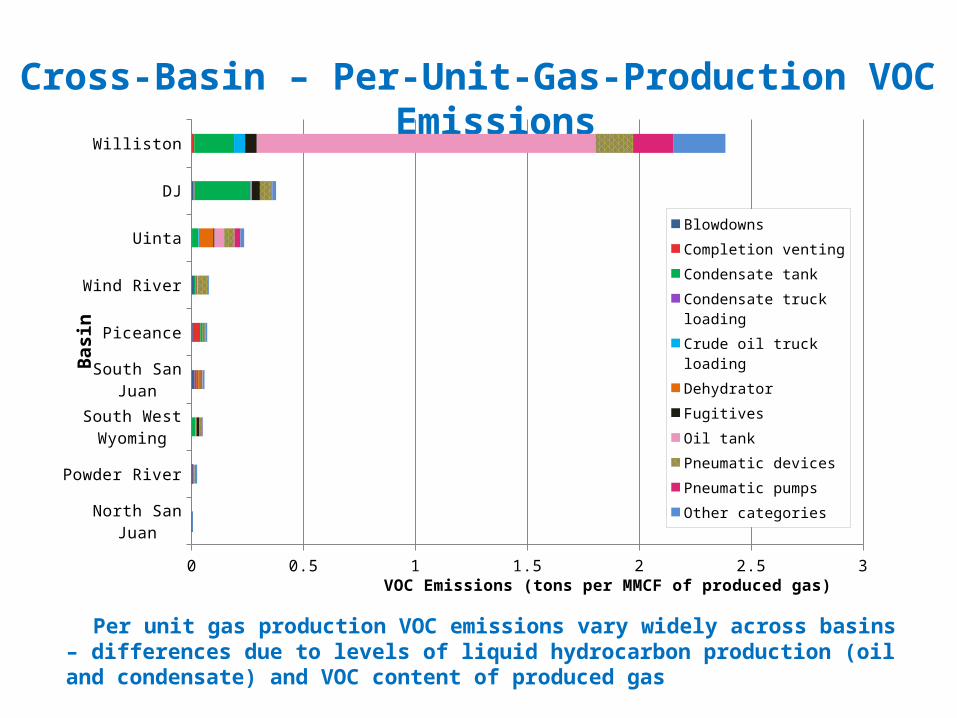
Cross-Basin – Per-Unit-Gas-Production VOC Emissions
Per unit gas production VOC emissions vary widely across basins – differences due to levels of liquid hydrocarbon production (oil and condensate) and VOC content of produced gas
North San Juan
Powder River
South West Wyoming
South San Juan
Piceance
Wind River
Uinta
DJ
Williston
0 0.5 1 1.5 2 2.5 3
Blowdowns
Completion venting
Condensate tank
Condensate truck loading
Crude oil truck loading
Dehydrator
Fugitives
Oil tank
Pneumatic devices
Pneumatic pumps
Other categories
VOC Emissions (tons per MMCF of produced gas)
Basi
n
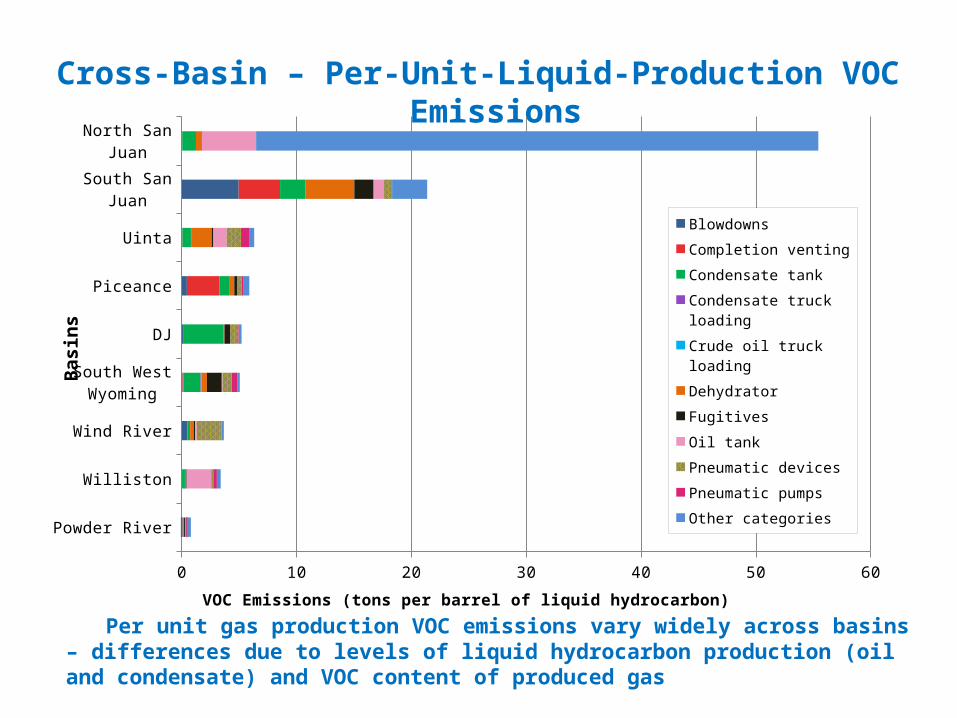
Cross-Basin – Per-Unit-Liquid-Production VOC Emissions
Per unit gas production VOC emissions vary widely across basins – differences due to levels of liquid hydrocarbon production (oil and condensate) and VOC content of produced gas
Powder River
Williston
Wind River
South West Wyoming
DJ
Piceance
Uinta
South San Juan
North San Juan
0 10 20 30 40 50 60
Blowdowns
Completion venting
Condensate tank
Condensate truck loading
Crude oil truck loading
Dehydrator
Fugitives
Oil tank
Pneumatic devices
Pneumatic pumps
Other categories
VOC Emissions (tons per barrel of liquid hydrocarbon)
Basi
ns
22
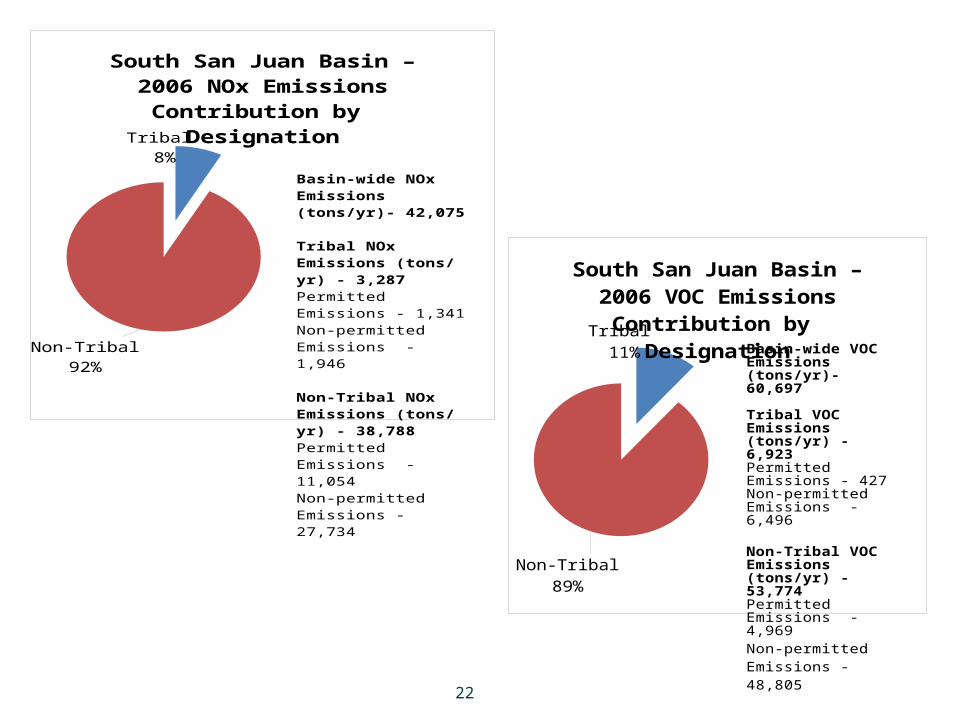
Tribal 8%
Non-Tribal92%
South San Juan Basin – 2006 NOx Emissions Contribution by Designa-
tion
Basin-wide NOx Emissions (tons/yr)- 42,075
Tribal NOx Emissions (tons/yr) - 3,287Permitted Emissions - 1,341Non-permitted Emissions - 1,946
Non-Tribal NOx Emissions (tons/yr) - 38,788Permitted Emissions - 11,054Non-permitted Emissions - 27,734
Tribal 11%
Non-Tribal89%
South San Juan Basin – 2006 VOC Emissions Contribution by Des-
ignation
Basin-wide VOC Emis-sions (tons/yr)- 60,697
Tribal VOC Emissions (tons/yr) - 6,923Permitted Emissions - 427Non-permitted Emis-sions -6,496
Non-Tribal VOC Emis-sions (tons/yr) - 53,774Permitted Emissions - 4,969Non-permitted Emis-sions - 48,805
23
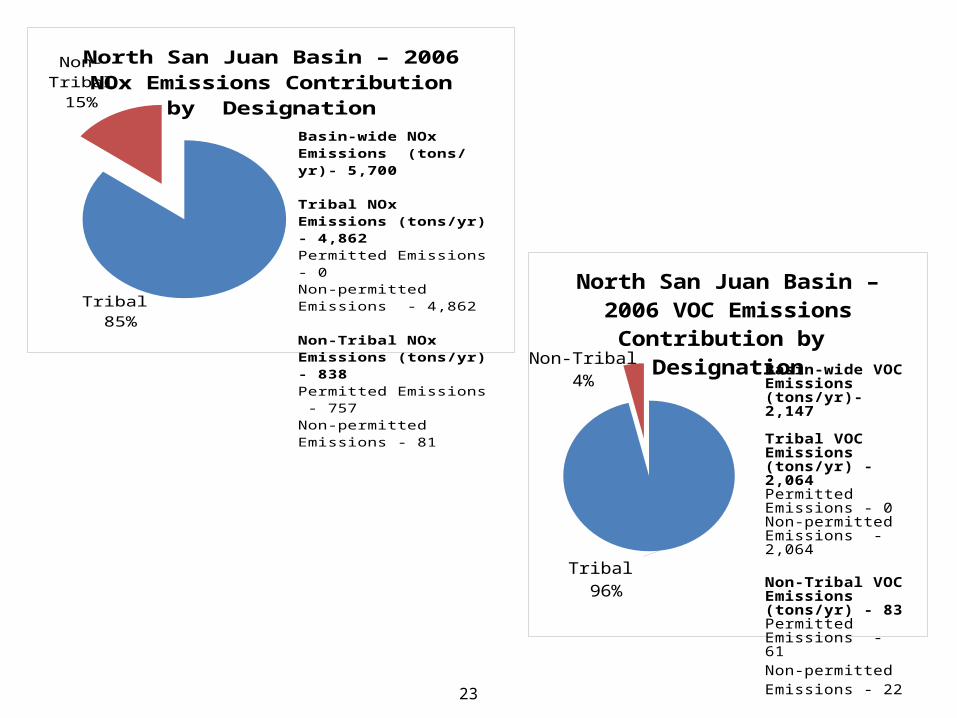
Tribal 85%
Non-Tribal15%
North San Juan Basin – 2006 NOx Emissions Contribution by Designa-
tion
Basin-wide NOx Emissions (tons/yr)- 5,700
Tribal NOx Emissions (tons/yr) - 4,862Permitted Emissions - 0Non-permitted Emissions - 4,862
Non-Tribal NOx Emissions (tons/yr) - 838Permitted Emissions - 757Non-permitted Emissions - 81
Tribal 96%
Non-Tribal4%
North San Juan Basin – 2006 VOC Emissions Contribution by
Designation
Basin-wide VOC Emissions (tons/yr)- 2,147
Tribal VOC Emissions (tons/yr) - 2,064Permitted Emissions - 0Non-permitted Emis-sions - 2,064
Non-Tribal VOC Emissions (tons/yr) - 83Permitted Emissions - 61Non-permitted Emis-sions - 22
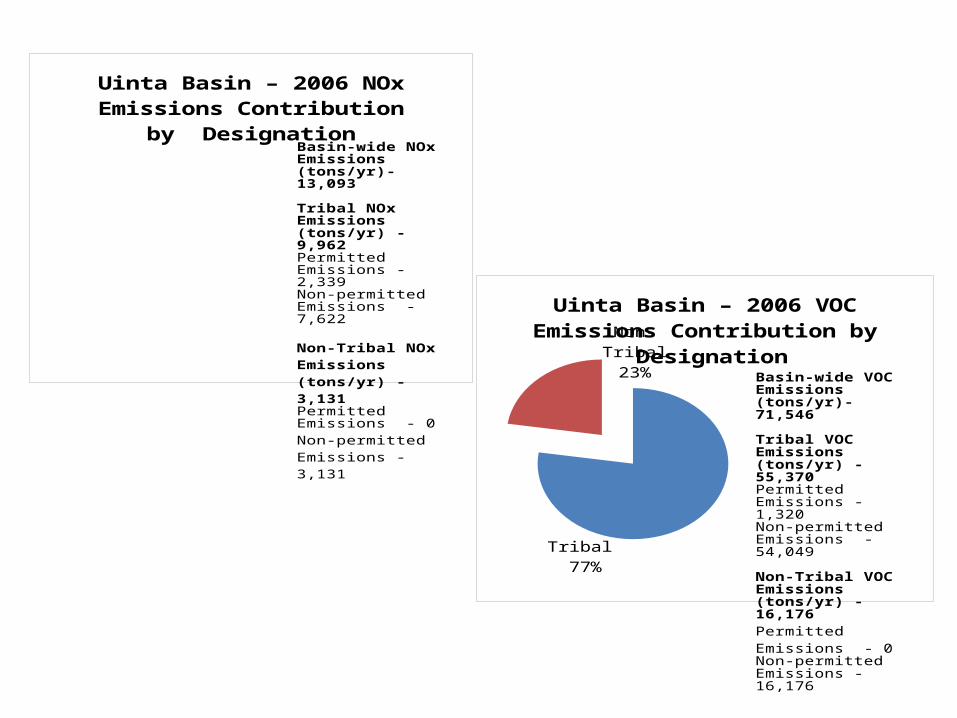
Uinta Basin – 2006 NOx Emissions Contribution by Designation
Basin-wide NOx Emis-sions (tons/yr)- 13,093
Tribal NOx Emissions (tons/yr) - 9,962Permitted Emissions - 2,339Non-permitted Emis-sions - 7,622
Non-Tribal NOx Emis-sions (tons/yr) - 3,131Permitted Emissions - 0Non-permitted Emis-sions - 3,131
Tribal 77%
Non-Tribal23%
Uinta Basin – 2006 VOC Emissions Contribution by Designation
Basin-wide VOC Emis-sions (tons/yr)- 71,546
Tribal VOC Emissions (tons/yr) - 55,370Permitted Emissions - 1,320Non-permitted Emissions - 54,049
Non-Tribal VOC Emis-sions (tons/yr) - 16,176Permitted Emissions - 0Non-permitted Emissions - 16,176
25
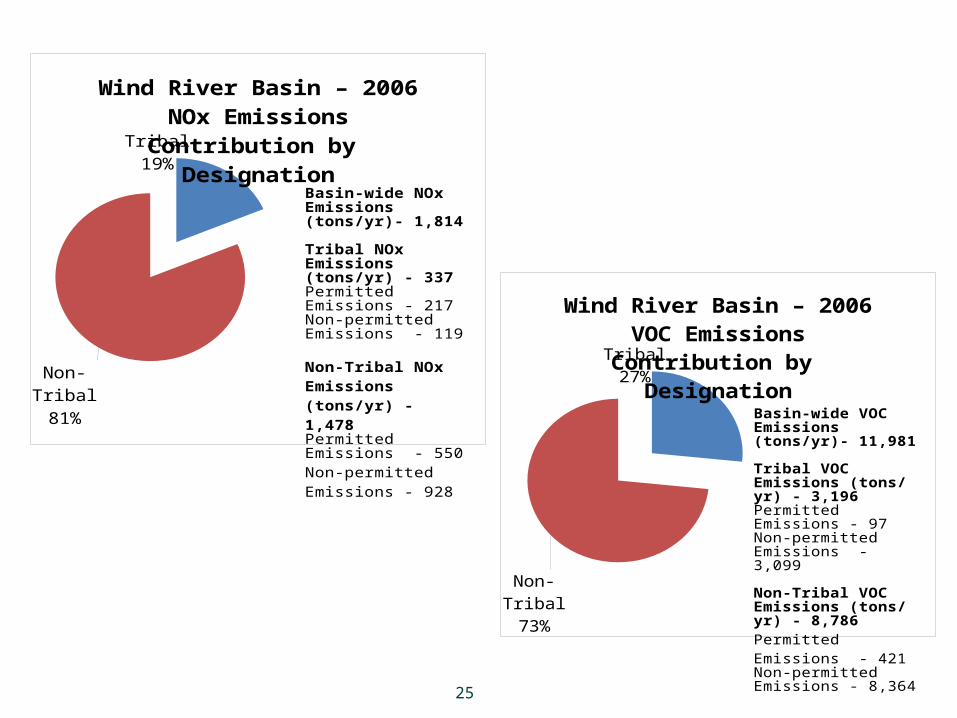
Tribal19%
Non-Tribal81%
Wind River Basin – 2006 NOx Emissions Contribution by Desig-
nation
Basin-wide NOx Emis-sions (tons/yr)- 1,814
Tribal NOx Emissions (tons/yr) - 337Permitted Emissions - 217Non-permitted Emissions - 119
Non-Tribal NOx Emis-sions (tons/yr) - 1,478Permitted Emissions - 550Non-permitted Emissions - 928
Tribal27%
Non-Tribal73%
Wind River Basin – 2006 VOC Emissions Contribution by Desig-
nation
Basin-wide VOC Emissions (tons/yr)- 11,981
Tribal VOC Emissions (tons/yr) - 3,196Permitted Emissions - 97Non-permitted Emissions - 3,099
Non-Tribal VOC Emissions (tons/yr) - 8,786Permitted Emissions - 421Non-permitted Emissions - 8,364
26
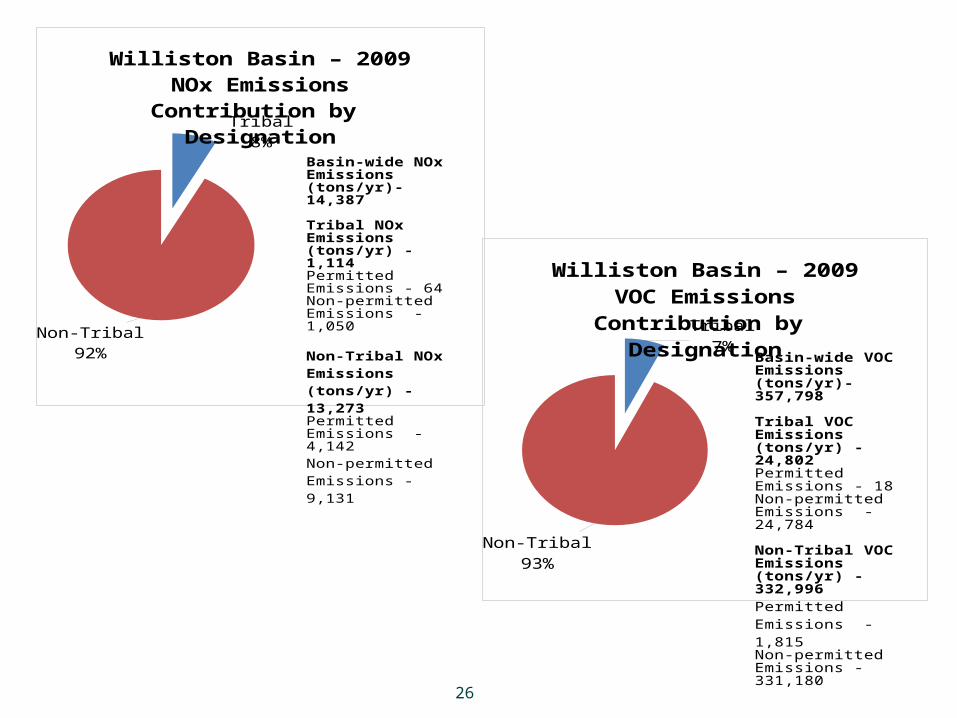
Tribal8%
Non-Tribal92%
Williston Basin – 2009 NOx Emis-sions Contribution by Designation
Basin-wide NOx Emis-sions (tons/yr)- 14,387
Tribal NOx Emissions (tons/yr) - 1,114Permitted Emissions - 64Non-permitted Emissions - 1,050
Non-Tribal NOx Emis-sions (tons/yr) - 13,273Permitted Emissions - 4,142Non-permitted Emissions - 9,131
Tribal7%
Non-Tribal93%
Williston Basin – 2009 VOC Emis-sions Contribution by Designation
Basin-wide VOC Emis-sions (tons/yr)- 357,798
Tribal VOC Emissions (tons/yr) - 24,802Permitted Emissions - 18Non-permitted Emis-sions - 24,784
Non-Tribal VOC Emis-sions (tons/yr) - 332,996Permitted Emissions - 1,815Non-permitted Emis-sions - 331,180
Projections of Future Emissions – Background• Need
• Air quality planning to correct violations of health and welfare standards• To prevent violations of standards and to reduce exposure• Account for state and federal regulations “on the books and on the way”• Effectively consider “known future” to estimate additional costs and
benefits of additional control options
• Scope• Change across all source categories from baseline actual emissions into
the future• Anthropogenic sources affected by
• Economic factors• Changes in technology• Emerging standards
• Biogenic or natural sources• Not as well understood• Affected by climate change and other factors• Usual practice is hold future projections constant
Western ozone and PM precursors - key emissions sources
• Power plants decreasing markedly• Mobile sources controlled and emission rates decreasing markedly through
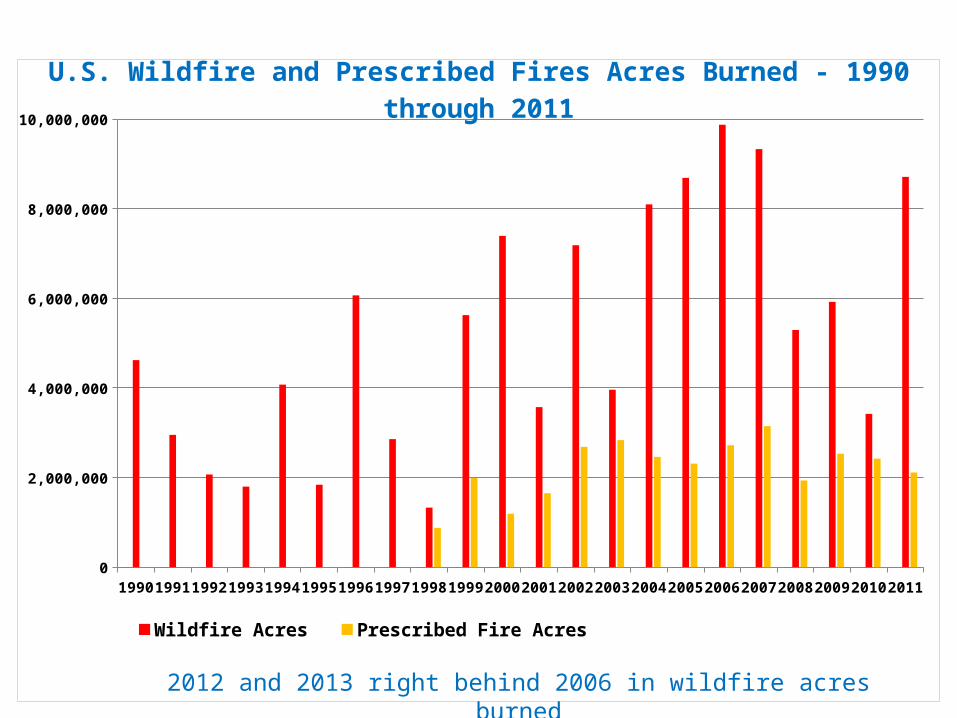
federal rules and state testing programs• Fire activity and effects are huge (among the largest air pollution sources in the
West), receiving intensive study– Deterministic & Empirical Assessment of Smoke’s Contribution to Ozone (
DEASCO3)
– Prescribed and Other Fire Emissions: Particulate Matter Deterministic & Empirical Tagging & Assessment of Impacts on Levels (PMDETAIL)
– Others….• Biogenics (natural plant sources)• Oil and gas………..
– Phase III study– Emissions Inventories for Williston and MT North Central (Great Plains) Basins
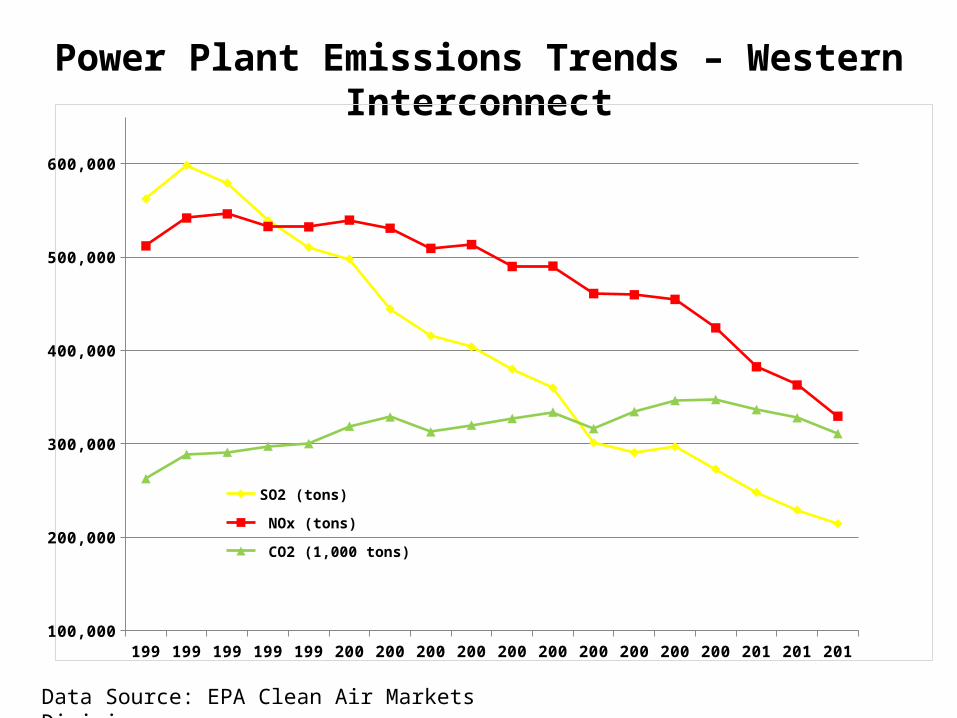
Power Plant Emissions Trends – Western Interconnect
Data Source: EPA Clean Air Markets Division
1995 1996 1997 1998 1999 2000 2001 2002 2003 2004 2005 2006 2007 2008 2009 2010 2011 2012100,000
200,000
300,000
400,000
500,000
600,000
SO2 (tons)
NOx (tons)
CO2 (1,000 tons)
1990 1991 1992 1993 1994 1995 1996 1997 1998 1999 2000 2001 2002 2003 2004 2005 2006 2007 2008 2009 2010 20110
2,000,000
4,000,000
6,000,000
8,000,000
10,000,000
Wildfire Acres Prescribed Fire Acres
U.S. Wildfire and Prescribed Fires Acres Burned - 1990 through 2011
2012 and 2013 right behind 2006 in wildfire acres burned
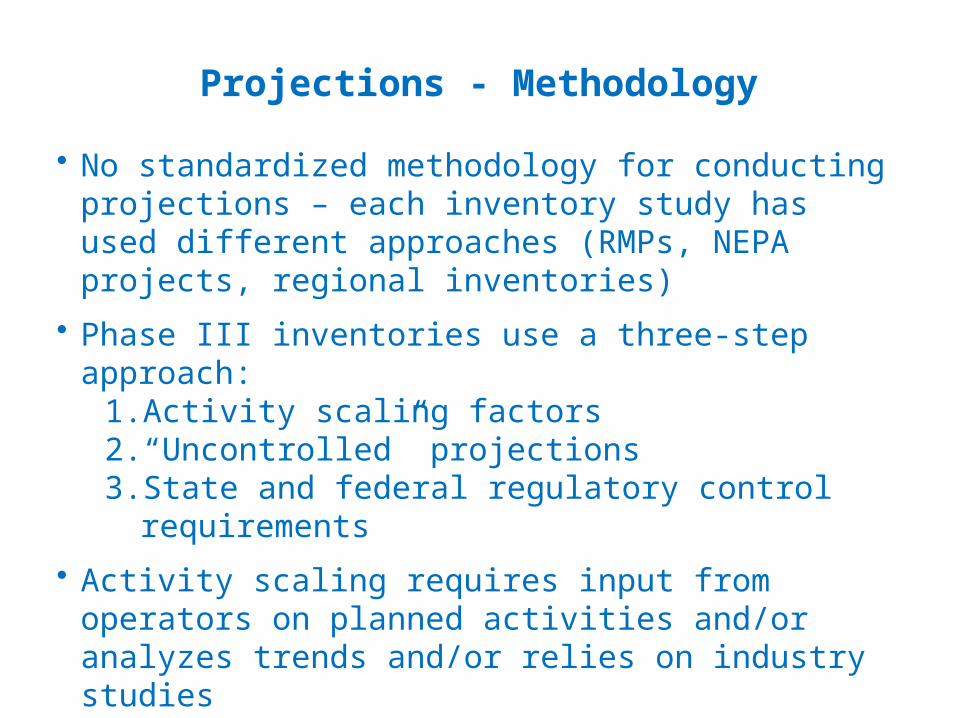
Projections - Methodology
• No standardized methodology for conducting projections – each inventory study has used different approaches (RMPs, NEPA projects, regional inventories)
• Phase III inventories use a three-step approach:1. Activity scaling factors2. “Uncontrolled” projections3. State and federal regulatory control requirements
• Activity scaling requires input from operators on planned activities and/or analyzes trends and/or relies on industry studies
• State and federal regulatory control requirements complex
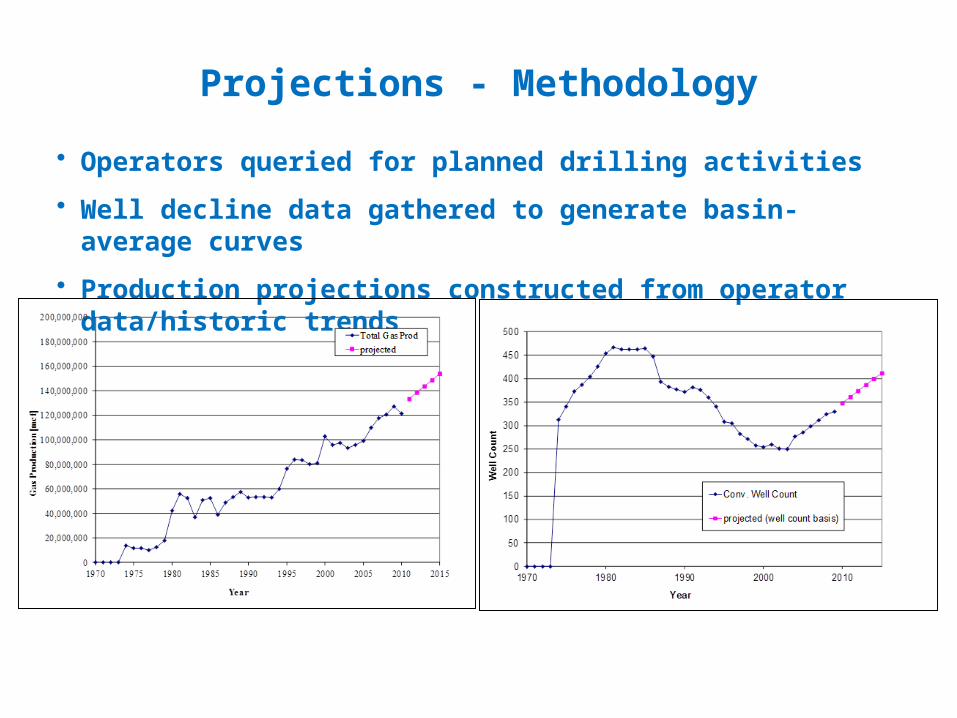
Projections - Methodology
• Operators queried for planned drilling activities
• Well decline data gathered to generate basin-average curves
• Production projections constructed from operator data/historic trends
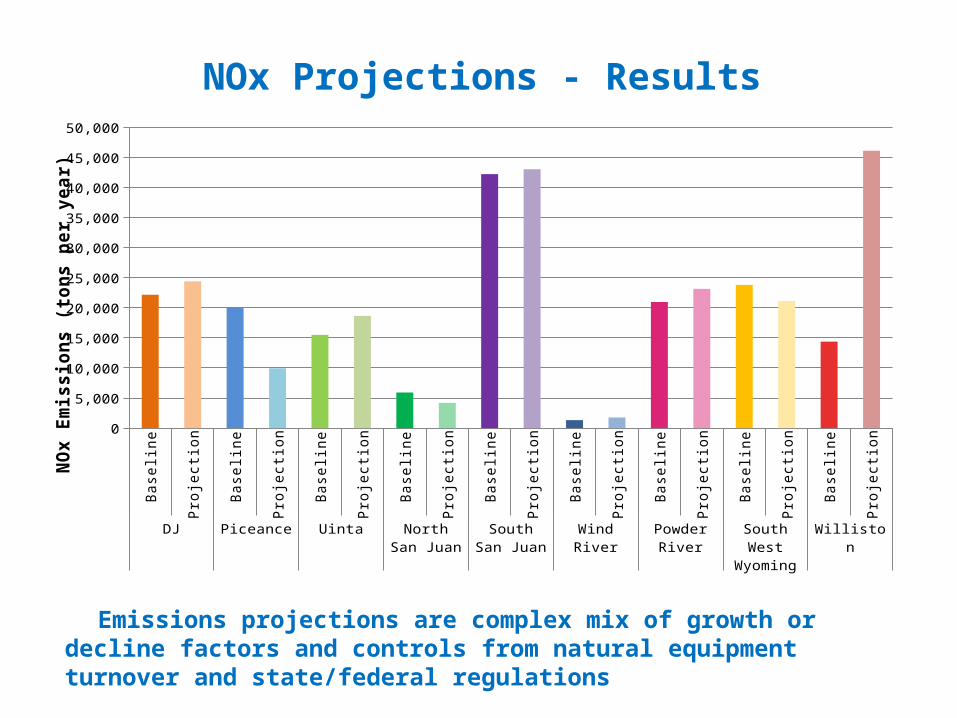
NOx Projections - Results
Emissions projections are complex mix of growth or decline factors and controls from natural equipment turnover and state/federal regulations
Base
line
Proj
ectio
n
Base
line
Proj
ectio
n
Base
line
Proj
ectio
n
Base
line
Proj
ectio
n
Base
line
Proj
ectio
n
Base
line
Proj
ectio
n
Base
line
Proj
ectio
n
Base
line
Proj
ectio
n
Base
line
Proj
ectio
n
DJ Piceance Uinta North San Juan
South San Juan
Wind River Powder River South West Wyoming
Williston
0
5,000
10,000
15,000
20,000
25,000
30,000
35,000
40,000
45,000
50,000
NO
x Em
issi
ons
(ton
s pe
r yea
r)
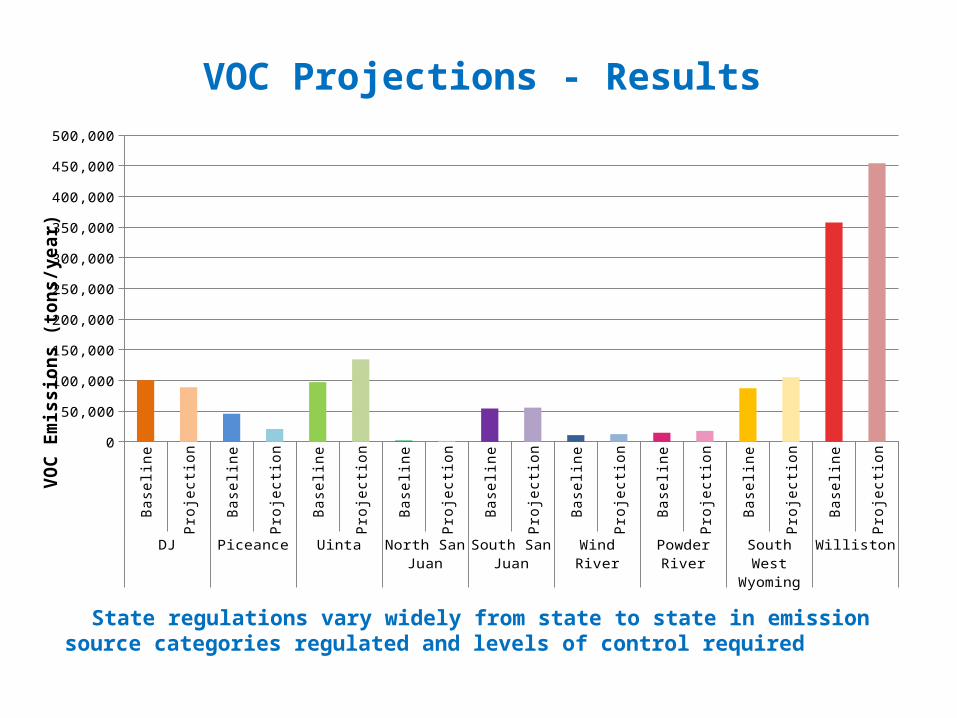
VOC Projections - Results
State regulations vary widely from state to state in emission source categories regulated and levels of control required
Base
line
Proj
ectio
n
Base
line
Proj
ectio
n
Base
line
Proj
ectio
n
Base
line
Proj
ectio
n
Base
line
Proj
ectio
n
Base
line
Proj
ectio
n
Base
line
Proj
ectio
n
Base
line
Proj
ectio
n
Base
line
Proj
ectio
n
DJ Piceance Uinta North San Juan
South San Juan
Wind River Powder River South West Wyoming
Williston
0
50,000
100,000
150,000
200,000
250,000
300,000
350,000
400,000
450,000
500,000
VOC
Emis
sion
s (t
ons/
year
)
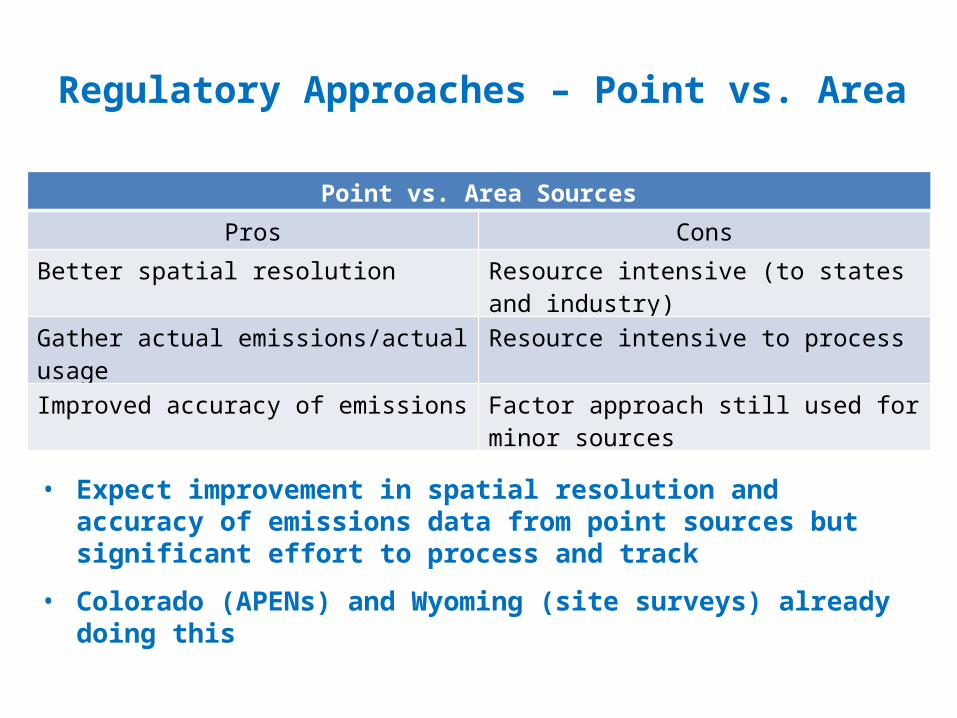
Regulatory Approaches – Point vs. Area
• Expect improvement in spatial resolution and accuracy of emissions data from point sources but significant effort to process and track
• Colorado (APENs) and Wyoming (site surveys) already doing this
Point vs. Area Sources
Pros Cons
Better spatial resolution Resource intensive (to states and industry)
Gather actual emissions/actual usage Resource intensive to process
Improved accuracy of emissions Factor approach still used for minor sources
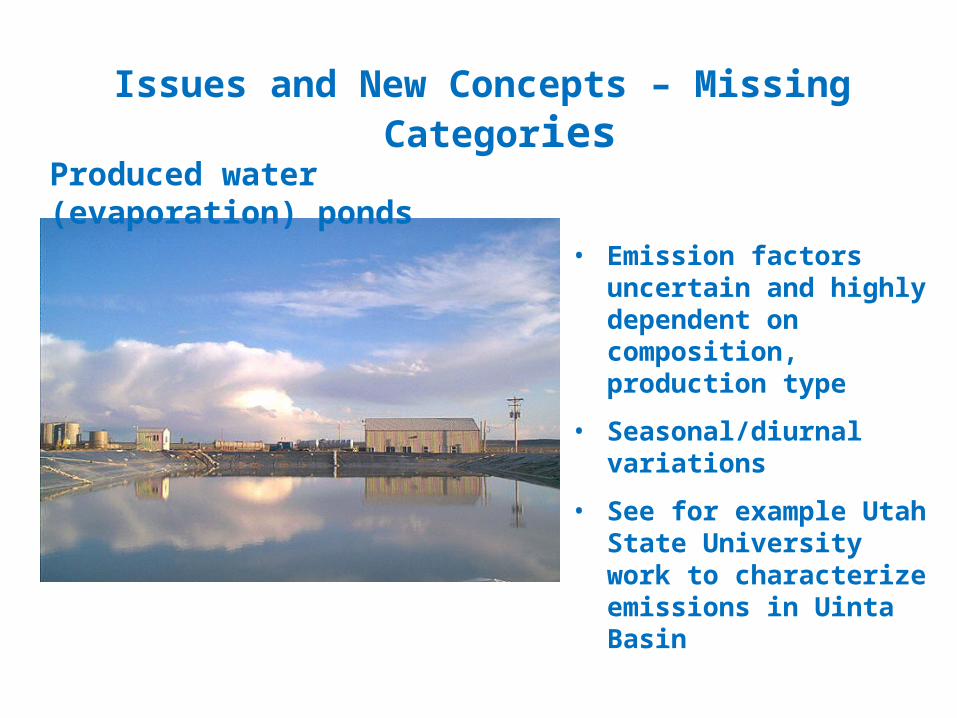
Issues and New Concepts – Missing Categories
• Emission factors uncertain and highly dependent on composition, production type
• Seasonal/diurnal variations
• See for example Utah State University work to characterize emissions in Uinta Basin
Produced water (evaporation) ponds
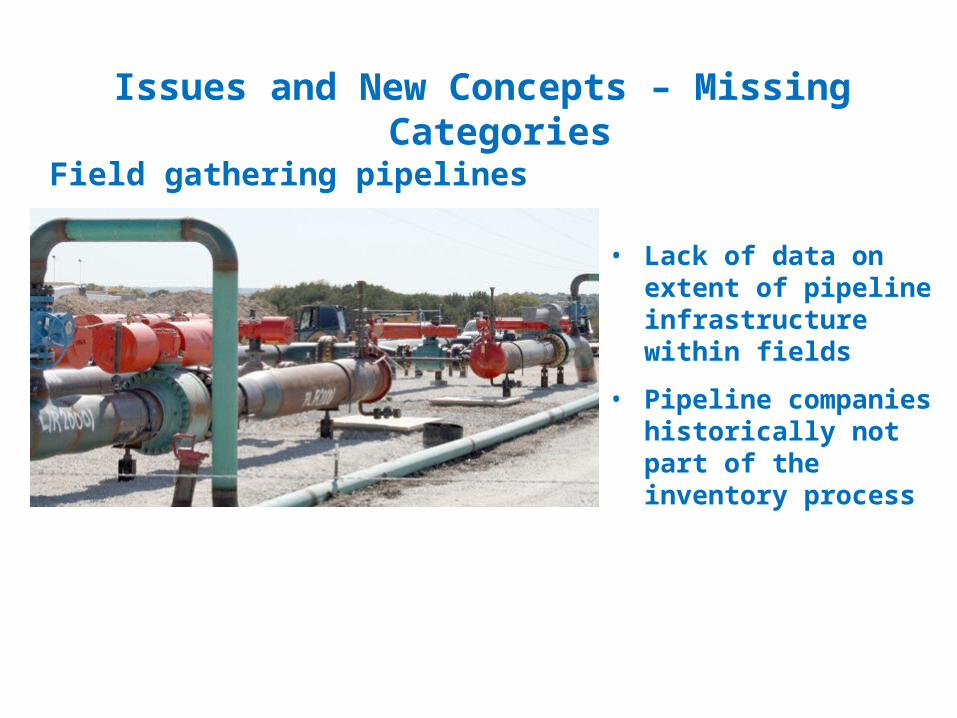
Issues and New Concepts – Missing Categories
• Lack of data on extent of pipeline infrastructure within fields
• Pipeline companies historically not part of the inventory process
Field gathering pipelines
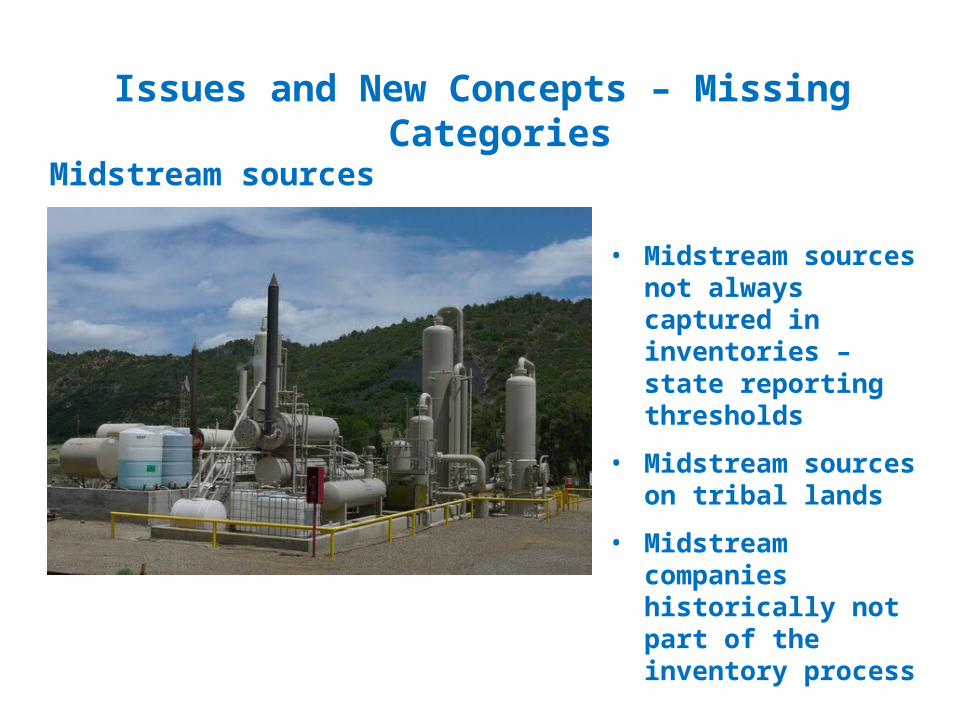
Issues and New Concepts – Missing Categories
• Midstream sources not always captured in inventories – state reporting thresholds
• Midstream sources on tribal lands
• Midstream companies historically not part of the inventory process
Midstream sources
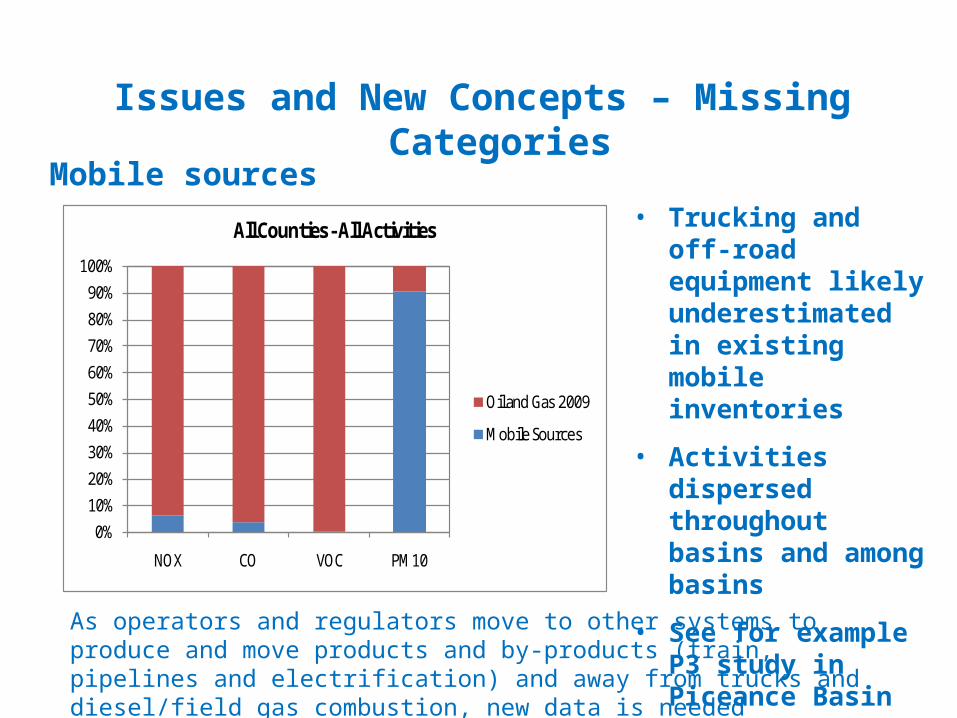
Issues and New Concepts – Missing Categories
• Trucking and off-road equipment likely underestimated in existing mobile inventories
• Activities dispersed throughout basins and among basins
• See for example P3 study in Piceance Basin
Mobile sources
0%
10%
20%
30%
40%
50%
60%
70%
80%
90%
100%
NOX CO VOC PM10
All Counties - All Activities
Oil and Gas 2009
Mobile Sources
As operators and regulators move to other systems to produce and move products and by-products (train, pipelines and electrification) and away from trucks and diesel/field gas combustion, new data is needed
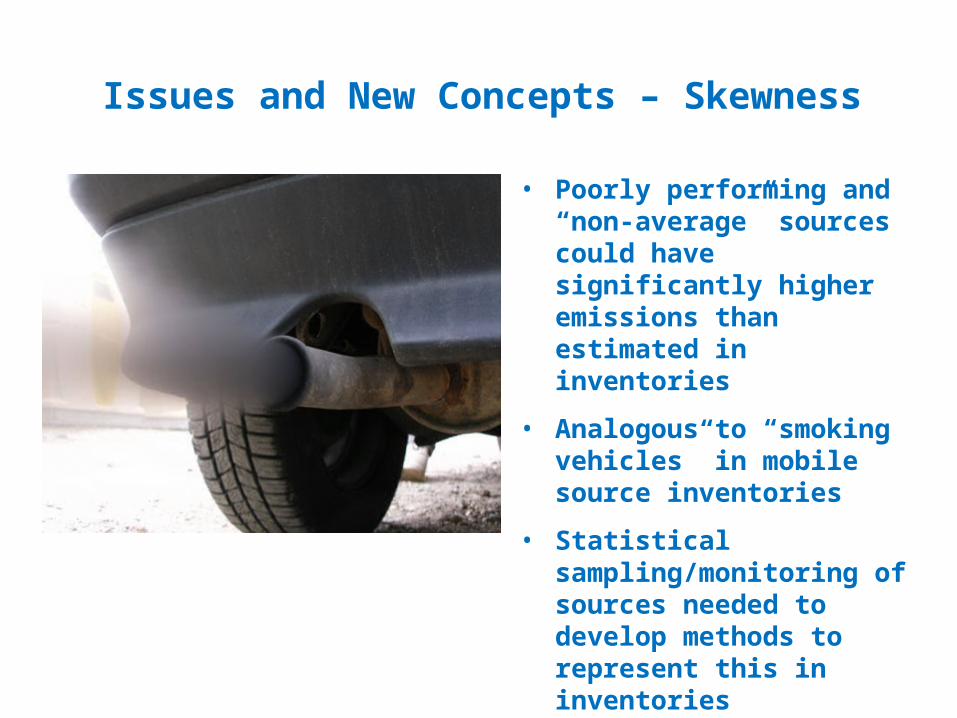
Issues and New Concepts – Skewness
• Poorly performing and “non-average” sources could have significantly higher emissions than estimated in inventories
• Analogous to “smoking vehicles” in mobile source inventories
• Statistical sampling/monitoring of sources needed to develop methods to represent this in inventories
• See for example NOAA monitoring in Uinta Basin and CDPHE capture efficiency adjustments
• Technology for exploration and production has changed
• Physical scope of production, variation in production activities
• Oil and gas cost and benefit
• Clean Air Act structure
• Existing vs. future development
• Source category efforts toward continued collaborative study
Closing
Amnon Bar-Ilan and John Grant
ENVIRON Intl. Corp.
Novato, CA
Kathleen Sgamma
Western Energy Alliance
Denver, CO
Doug Henderer
Newfield Exploration
Denver, CO
Lee Gribovicz
Airstar Consulting
Acknowledgements
Thanks –
Tom Moore, WRAP Air Quality Program ManagerWestern States Air Resources Council (WESTAR)
e: [email protected] | o: 970.491.8837
Western Regional Air Partnership | www.wrapair2.org