Embed Size (px)
Citation preview
Acta Oceanol. Sin., 2012, Vol. 31, No. 1, P. 51-58
DOI: 10.1007/s13131-012-0175-2
http://www.hyxb.org.cn
E-mail: [email protected]
Upper ocean responses to category 5 typhoon Megi in
the western north Pacific
CHEN Xiaoyan1,2, PAN Delu1,2∗, HE Xianqiang1,2, BAI Yan2, WANG Difeng2
1 Department of Earth Sciences, Zhejiang University, Hangzhou 310027, China
2 State Key Laboratory of Satellite Ocean Environment Dynamics, Second Institute ofOceanography, State Oceanic Administration, Hangzhou 310012, China
Received 27 May 2011; accepted 8 August 2011
© The Chinese Society of Oceanography and Springer-Verlag Berlin Heidelberg 2012
AbstractCategory 5 typhoon Megi was the most intense typhoon in 2010 of the world. It lingered in theSouth China Sea (SCS) for 5 d and caused a significant phytoplankton bloom detected by thesatellite image. In this study, the authors investigated the ocean biological and physical responsesto typhoon Megi by using chlorophyll-a (chl-a) concentration, sea surface temperature (SST), seasurface height anomaly (SSHA), sea surface wind measurements derived from different satellitesand in situ data. The chl-a concentration (>3 mg/m3) increased thirty times in the SCS after thetyphoon passage in comparison with the mean level of October averaged from 2002 to 2009. Withthe relationship of wind stress curl and upwelling, the authors found that the speed of upwelling wasover ten times during typhoon than pre-typhoon period. Moreover, the mixed layer deepened about20 m. These reveal that the enhancement of chl-a concentration was triggered by strong verticalmixing and upwelling. Along the track of typhoon, the maximum sea surface cooling (6–8◦C) tookplace in the SCS where the moving speed of typhoon was only 1.4–2.8 m/s and the mixed layerdepth was about 20 m in pre-typhoon period. However, the SST drop at the east of the Philippinesis only 1–2◦C where the translation speed of typhoon was 5.5–6.9 m/s and the mixed layer depthwas about 40 m in pre-typhoon period. So the extent of the SST drop was probably due to themoving speed of typhoon and the depth of the mixed layer. In addition, the region with the largestdecline of the sea surface height anomaly can indicate the location where the maximum coolingoccurs.
Key words: sea surface temperature, chlorophyll-a concentration, sea surface height anomaly,
upwelling, typhoon Megi, ocean remote sensing
1 Introduction
Upper ocean biological and physical responses to
typhoons (also known as hurricanes or tropical cy-
clones) are always one of the hottest issues on air-
sea interaction research (Price, 1981; Lin et al., 2003;
Babin et al., 2004; Yin et al., 2007; Siswanto et al.,
2008). The development of satellite remote sensing,
especially microwave remote sensing, in combination
with numerical simulation, provide powerful tools to
further understand the upper ocean changes induced
by typhoon together with corresponding mechanisms.
The passage of typhoon can induce ocean mixing and
upwelling (Price, 1981), bringing the nutrient-rich wa-
ter of bottom layer to the euphotic zone where there
is abundant light for photosynthesis but often lack of
nutrients. Therefore it will contribute to the growth
of phytoplankton and take a significant impact on the
increase of ocean primary production (Lin et al., 2003;
Siswanto et al., 2008; Siswanto et al., 2009; Zhao et
al., 2009). Lin et al. (2003) suggested that the long-
neglected contribution of typhoons to the South China
Sea’s annual new production may be as much as 20%–
30%. Therefore the amounts of carbon fixation by
typhoons can not be ignored. At the same time, sea
surface cooling is another major feature after typhoon
passage (Price, 1981; Stramma et al., 1986; Sakaida et
al., 1998; Cione and Uhlhom, 2003; Tsai et al., 2008).
From the previous studies, the SST drop is due to
a unique combination of typhoon’s intensity and
Foundation item: The National Basic Research Program “973” Program of China under contract No. 2009CB421202; the NationalNatural Science Foundation of China under contract Nos 40976110 and 40706061; the Public Science and Technology ResearchFunds Projects of Ocean under contract No. 200905012; the Zhejiang Provincial Natural Science Foundation of China undercontract No. Y5090381.
∗Corresponding author, E-mail: [email protected]
1
52 CHEN Xiaoyan et al. Acta Oceanol. Sin., 2012, Vol. 31, No. 1, P. 51-58
translation speed and oceanic conditions prior to the
typhoon’s arrival, such as the location of cold eddies
(Zheng et al., 2010), upper thermal structure and the
depth of 26◦ isotherm (Lin et al., 2008). In addition, it
may also be affected by the Kuroshio for the typhoons
which pass through the East China Sea or the Taiwan
Strait (Tsai et al., 2008).
Megi, a category 5 typhoon on the Saffir-Simpson
hurricane scale, was the most intense typhoon both in
2010 of the world and in the last 20 a of the west-
ern north Pacific. In this paper, we investigated the
changes of chl-a concentration, SST and SSHA in the
western north Pacific before and after the passage of
typhoon Megi, using MODIS ocean color data, ocean
microwave data and in situ profiles. Moreover, the
mechanisms to induce these changes were discussed,
which make us to further understand the interaction
between typhoon and ocean and provide the powerful
proofs for the previous conclusions.
2 Data and methods
2.1 Typhoon data
The typhoon track data used in this study
were downloaded from http://weather.unisys.com/
hurricane/w−pacific, which is based on the best hur-
ricane track data from the Joint Typhoon Warming
Center (JTWC). The data include typhoon center po-
sition in latitude and longitude, time (UTC), maxi-
mum sustained winds in knot and typhoon scale ev-
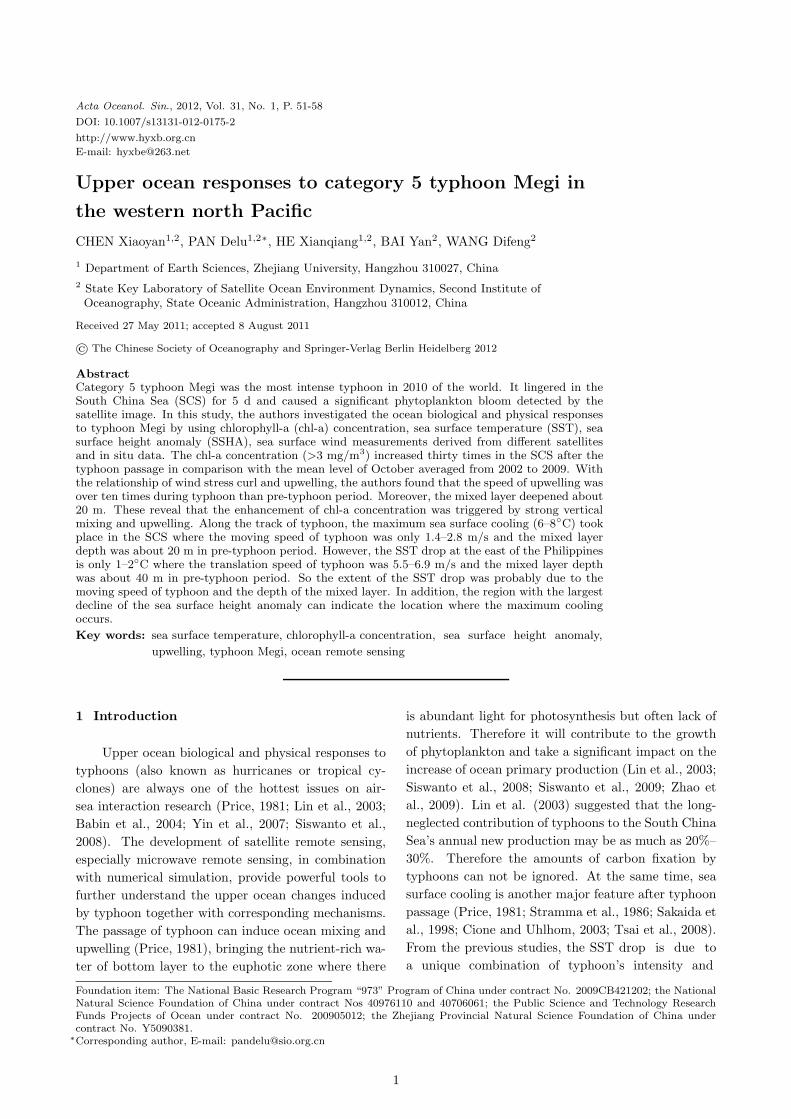
ery 6 h. The track of typhoon Megi is shown in Fig.
1, in which different color points stand for different
intensities according to the Saffir-Simpson hurricane
scale. Developed as a tropical depression in the west-
ern north Pacific on 13 October, Megi intensified in
the east of the Philippines and reached category 5 on
17 October. After dropping to a category 2 typhoon
after passing through the Philippines into the SCS on
18:00 UTC 18 October, Megi quickly regained strength
and intensified to category 4 on 18:00 UTC 19 Octo-
ber. It lingered in the SCS for 5 d with a relative slow
moving speed of 1.4–2.8 m/s and made landfall on the
southern coast of Fujian Province on 23 October.
2.2 Satellite data
Daily L3A chl-a concentration data derived from
MODIS were obtained from the Second Institute
of Oceanography, the State Oceanic Administration,
with a 0.01◦ spatial resolution. Monthly mean chl-a
products with a 4 km×4 km spatial resolution were
Fig.1. Location of study area and track of
Typhoon Megi. Megi’s 6 h positions are de-
picted with color points. Based on the Saffir-
Simpson hurricane scale, blue point stands for
tropical depression, green tropical storm, cyan
category 1, yellow category 2, pink category 3,
purple category 4, red category 5.
obtained from NASA Goddard Earth Sciences Data
and Information Services Center (GES DISC) in this
study.
Merged SST daily products with a 0.25◦ spatial
resolution retrieved from the Tropical Rainfall Mea-
suring Mission (TRMM), Microwave Imager (TMI)
and the Advanced Microwave Scanning Radiometer
for EOS (AMSR-E) are available from the Remote
Sensing Systems (http://www.remss.com/). Com-
pared with infrared sensors, the TMI and the AMSR-E
can provide continuous measurement of the SST even
when there is typhoon with heavy clouds.
Daily near-real time SSHA data with 0.25◦ spa-
tial resolution are provided by Archiving, Validation
and Interpretation of Satellite Oceanographic data
(AVISO). They were used to identify the positions
of the cold eddies (negative SSHA) and warm eddies
(positive SSHA) in this study.
As QuikSCAT stopped working on 23 November
2009, sea surface wind data are provided by the ad-
vanced scatterometer (ASCAT) in this study, which
was launched by the European Space Agency (ESA)
aboard the MetOp-A platform on 19 October 2006.
The measurement footprint is approximately 25 km.
The near-real time L2 products were interpolated to
get the daily gridded data with 0.25◦ spatial resolu-
tion.
2.3 In situ data
In situ data, which include Argo, XBT, CTD and
all other available profiles of temperature and salinity
during 13 October 2010 to 31 October 2010, were used
CHEN Xiaoyan et al. Acta Oceanol. Sin., 2012, Vol. 31, No. 1, P. 51-58 53
in this study from Coriolis Data Center. The mixed
layer depth can be defined from a threshold method,
for which the mixed layer depth is the depth at which
temperature changes more than 0.2◦C relative the sur-
face temperature.
2.4 Methods
The spatial variation of wind stress produces a
corresponding variation in the resulting Ekman trans-
port in the ocean surface layer, causing convergence in
some places and divergence in other places. This leads
to “Ekman pumping” (Enriquez and Friehe, 1995). In
this paper, Ekman pumping velocity, that is, the veloc-
ity of upwelling, is computed by the following equation
given by Enriquez and Friehe (1995):
WE =1
ρf(∇× τ), (1)
where WE is the Ekman pumping velocity; ρ, f and τ
are the seawater density, the Coriolis parameter and
wind stress, respectively.
The curl of the wind stress is given by
∇× τ =1
Rcosϕ
[∂τy
∂λ−
∂
∂ϕ(τxcosϕ)
]
, (2)
where R is the radius of the earth; ϕ and λ are ge-
ographic latitude and longitude, respectively; and τx
and τy are zonal and meridional wind stress.
In order to get the curl of wind stress for grid
(i, j), a finite-difference scheme is then applied as fol-
lows:
∇× τi,j =1
Rcosϕi,j
[
(τy)i+1,j − (τy)i−1,j
2∆λ−
(τxcosϕ)i,j+1 − (τxcosϕ)i,j−1
2∆ϕ
]
. (3)
3 Results
3.1 Chl-a concentration
Because of cloud coverage during the typhoon pe-
riod, only one image was useful to show the high chl-a
concentration which was induced by typhoon Megi in
the study area (Fig. 2a). This image was received
by MODIS on 25 October 2010, just 2 d after land-
fall of typhoon Megi. Figure 2a shows that high chl-a
concentration with value larger than 1 mg/m3 can be
observed in the large regions in the SCS west of the
Luzon Strait. Moreover, the maximum concentration
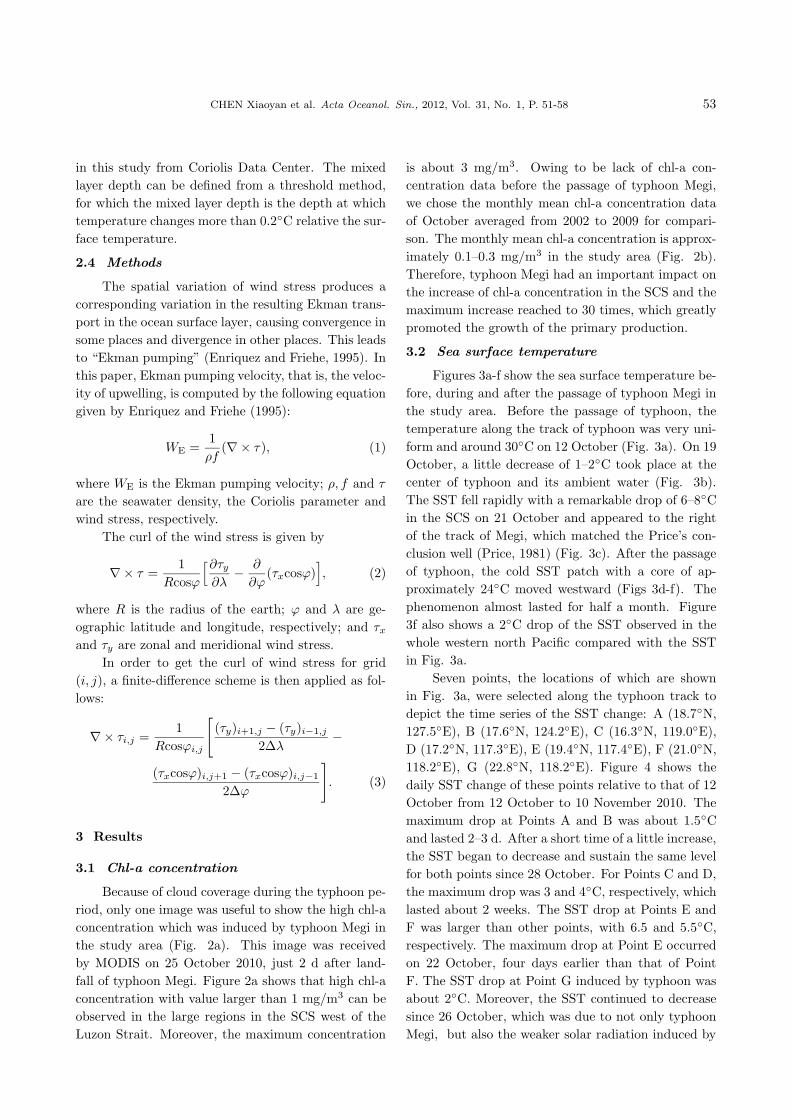
is about 3 mg/m3. Owing to be lack of chl-a con-
centration data before the passage of typhoon Megi,
we chose the monthly mean chl-a concentration data
of October averaged from 2002 to 2009 for compari-
son. The monthly mean chl-a concentration is approx-
imately 0.1–0.3 mg/m3 in the study area (Fig. 2b).
Therefore, typhoon Megi had an important impact on
the increase of chl-a concentration in the SCS and the
maximum increase reached to 30 times, which greatly
promoted the growth of the primary production.
3.2 Sea surface temperature
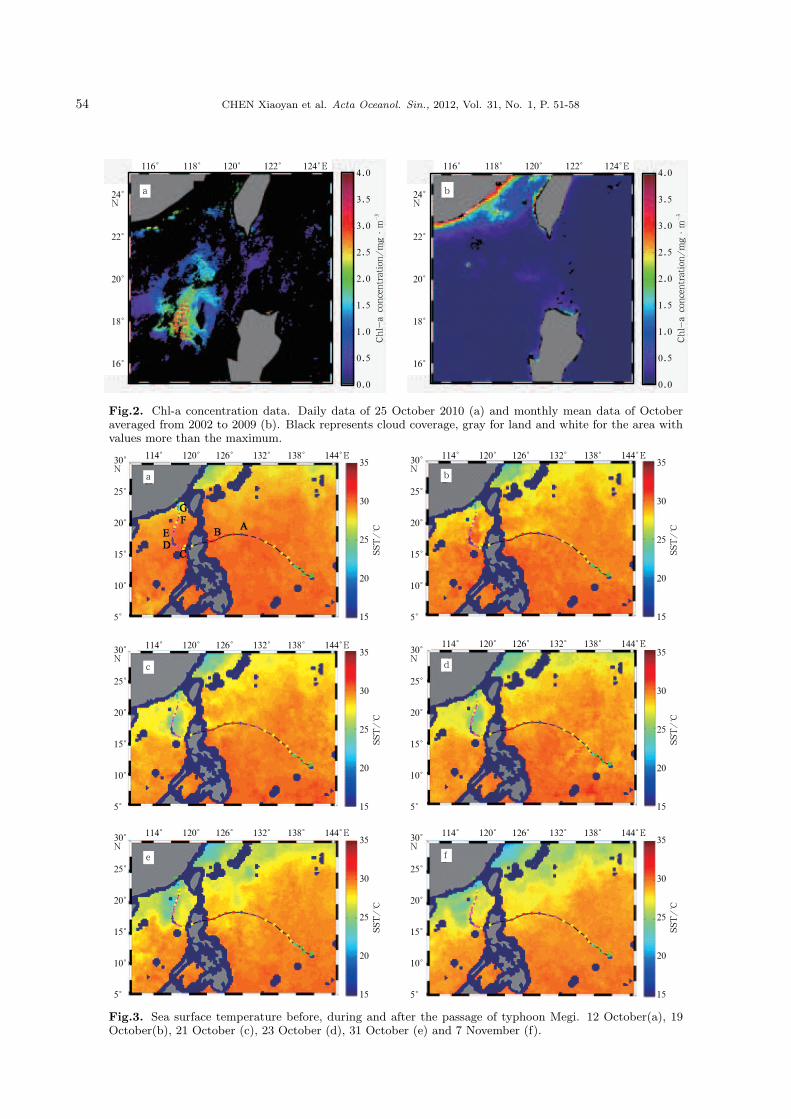
Figures 3a-f show the sea surface temperature be-
fore, during and after the passage of typhoon Megi in
the study area. Before the passage of typhoon, the
temperature along the track of typhoon was very uni-
form and around 30◦C on 12 October (Fig. 3a). On 19
October, a little decrease of 1–2◦C took place at the
center of typhoon and its ambient water (Fig. 3b).
The SST fell rapidly with a remarkable drop of 6–8◦C
in the SCS on 21 October and appeared to the right
of the track of Megi, which matched the Price’s con-
clusion well (Price, 1981) (Fig. 3c). After the passage
of typhoon, the cold SST patch with a core of ap-
proximately 24◦C moved westward (Figs 3d-f). The
phenomenon almost lasted for half a month. Figure
3f also shows a 2◦C drop of the SST observed in the
whole western north Pacific compared with the SST
in Fig. 3a.
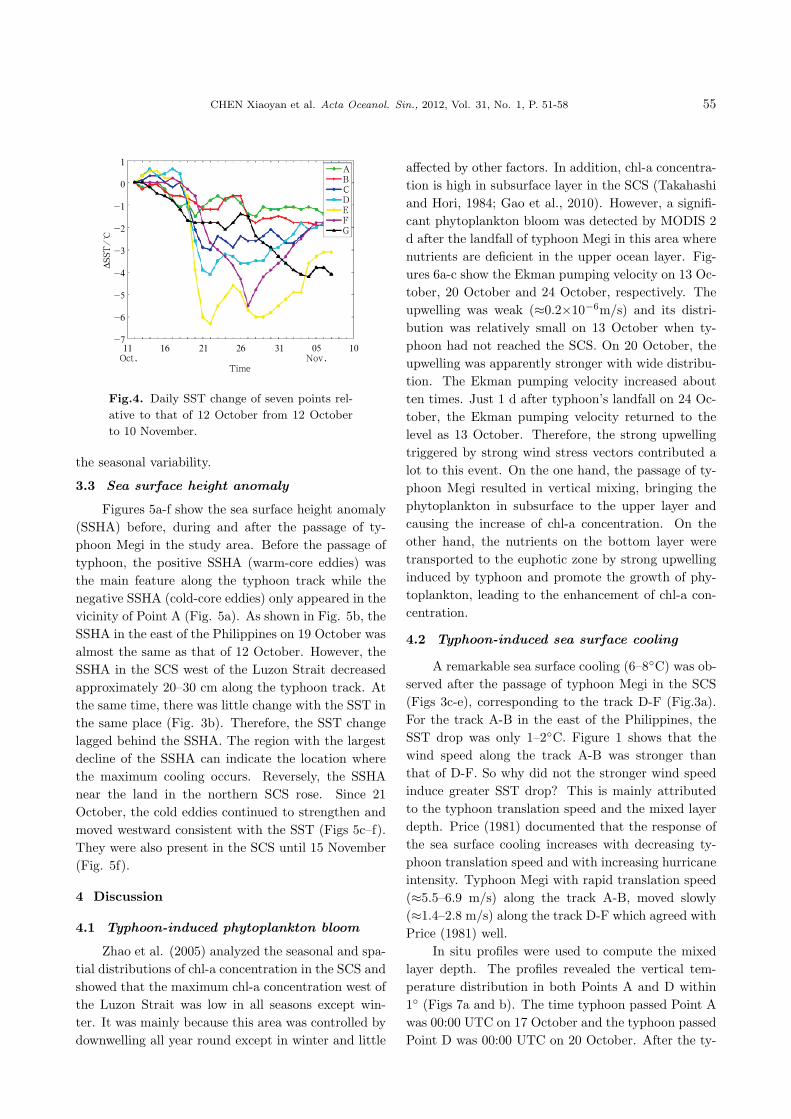
Seven points, the locations of which are shown
in Fig. 3a, were selected along the typhoon track to
depict the time series of the SST change: A (18.7◦N,
127.5◦E), B (17.6◦N, 124.2◦E), C (16.3◦N, 119.0◦E),
D (17.2◦N, 117.3◦E), E (19.4◦N, 117.4◦E), F (21.0◦N,
118.2◦E), G (22.8◦N, 118.2◦E). Figure 4 shows the
daily SST change of these points relative to that of 12
October from 12 October to 10 November 2010. The
maximum drop at Points A and B was about 1.5◦C
and lasted 2–3 d. After a short time of a little increase,
the SST began to decrease and sustain the same level
for both points since 28 October. For Points C and D,
the maximum drop was 3 and 4◦C, respectively, which
lasted about 2 weeks. The SST drop at Points E and
F was larger than other points, with 6.5 and 5.5◦C,
respectively. The maximum drop at Point E occurred
on 22 October, four days earlier than that of Point
F. The SST drop at Point G induced by typhoon was
about 2◦C. Moreover, the SST continued to decrease
since 26 October, which was due to not only typhoon
Megi, but also the weaker solar radiation induced by
54 CHEN Xiaoyan et al. Acta Oceanol. Sin., 2012, Vol. 31, No. 1, P. 51-58
Fig.2. Chl-a concentration data. Daily data of 25 October 2010 (a) and monthly mean data of Octoberaveraged from 2002 to 2009 (b). Black represents cloud coverage, gray for land and white for the area withvalues more than the maximum.
Fig.3. Sea surface temperature before, during and after the passage of typhoon Megi. 12 October(a), 19October(b), 21 October (c), 23 October (d), 31 October (e) and 7 November (f).
CHEN Xiaoyan et al. Acta Oceanol. Sin., 2012, Vol. 31, No. 1, P. 51-58 55
Fig.4. Daily SST change of seven points rel-
ative to that of 12 October from 12 October
to 10 November.
the seasonal variability.
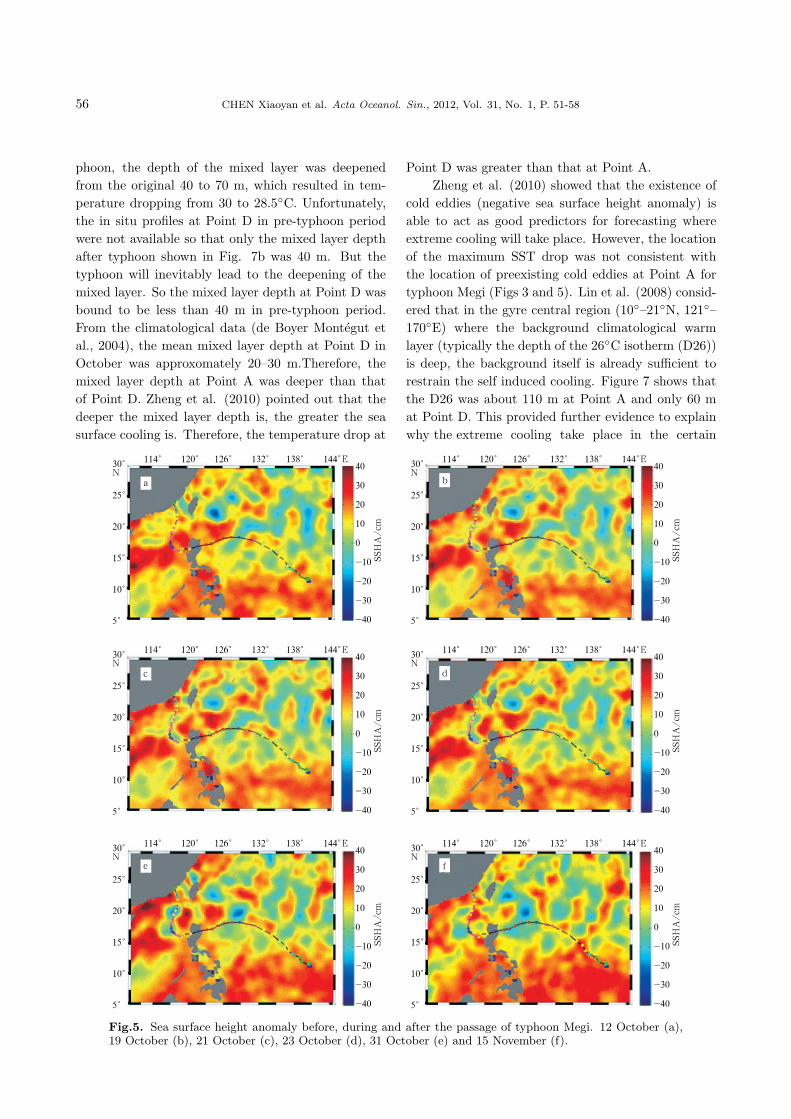
3.3 Sea surface height anomaly
Figures 5a-f show the sea surface height anomaly
(SSHA) before, during and after the passage of ty-
phoon Megi in the study area. Before the passage of
typhoon, the positive SSHA (warm-core eddies) was
the main feature along the typhoon track while the
negative SSHA (cold-core eddies) only appeared in the
vicinity of Point A (Fig. 5a). As shown in Fig. 5b, the
SSHA in the east of the Philippines on 19 October was
almost the same as that of 12 October. However, the
SSHA in the SCS west of the Luzon Strait decreased
approximately 20–30 cm along the typhoon track. At
the same time, there was little change with the SST in
the same place (Fig. 3b). Therefore, the SST change
lagged behind the SSHA. The region with the largest
decline of the SSHA can indicate the location where
the maximum cooling occurs. Reversely, the SSHA
near the land in the northern SCS rose. Since 21
October, the cold eddies continued to strengthen and
moved westward consistent with the SST (Figs 5c–f).
They were also present in the SCS until 15 November
(Fig. 5f).
4 Discussion
4.1 Typhoon-induced phytoplankton bloom
Zhao et al. (2005) analyzed the seasonal and spa-
tial distributions of chl-a concentration in the SCS and
showed that the maximum chl-a concentration west of
the Luzon Strait was low in all seasons except win-
ter. It was mainly because this area was controlled by
downwelling all year round except in winter and little
affected by other factors. In addition, chl-a concentra-
tion is high in subsurface layer in the SCS (Takahashi
and Hori, 1984; Gao et al., 2010). However, a signifi-
cant phytoplankton bloom was detected by MODIS 2
d after the landfall of typhoon Megi in this area where
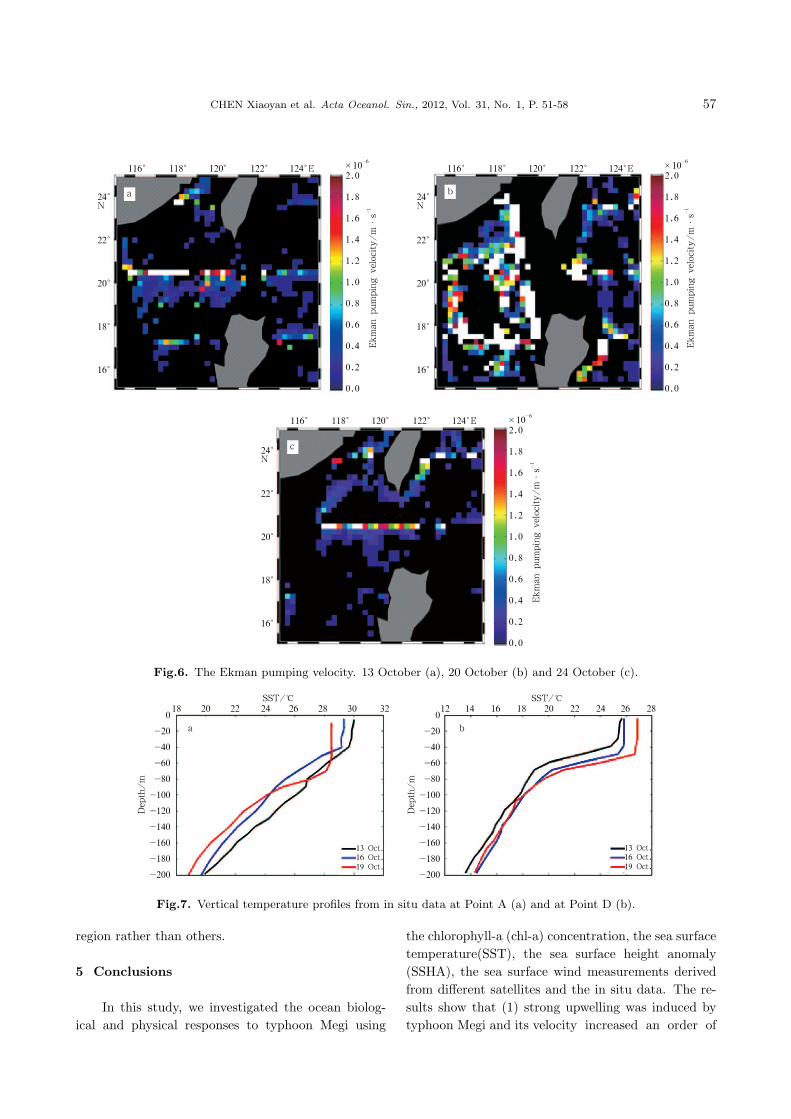
nutrients are deficient in the upper ocean layer. Fig-
ures 6a-c show the Ekman pumping velocity on 13 Oc-
tober, 20 October and 24 October, respectively. The
upwelling was weak (≈0.2×10⁻⁶m/s) and its distri-
bution was relatively small on 13 October when ty-
phoon had not reached the SCS. On 20 October, the
upwelling was apparently stronger with wide distribu-
tion. The Ekman pumping velocity increased about
ten times. Just 1 d after typhoon’s landfall on 24 Oc-
tober, the Ekman pumping velocity returned to the
level as 13 October. Therefore, the strong upwelling
triggered by strong wind stress vectors contributed a
lot to this event. On the one hand, the passage of ty-
phoon Megi resulted in vertical mixing, bringing the
phytoplankton in subsurface to the upper layer and
causing the increase of chl-a concentration. On the
other hand, the nutrients on the bottom layer were
transported to the euphotic zone by strong upwelling
induced by typhoon and promote the growth of phy-
toplankton, leading to the enhancement of chl-a con-
centration.
4.2 Typhoon-induced sea surface cooling
A remarkable sea surface cooling (6–8◦C) was ob-
served after the passage of typhoon Megi in the SCS
(Figs 3c-e), corresponding to the track D-F (Fig.3a).
For the track A-B in the east of the Philippines, the
SST drop was only 1–2◦C. Figure 1 shows that the
wind speed along the track A-B was stronger than
that of D-F. So why did not the stronger wind speed
induce greater SST drop? This is mainly attributed
to the typhoon translation speed and the mixed layer
depth. Price (1981) documented that the response of
the sea surface cooling increases with decreasing ty-
phoon translation speed and with increasing hurricane
intensity. Typhoon Megi with rapid translation speed
(≈5.5–6.9 m/s) along the track A-B, moved slowly
(≈1.4–2.8 m/s) along the track D-F which agreed with
Price (1981) well.
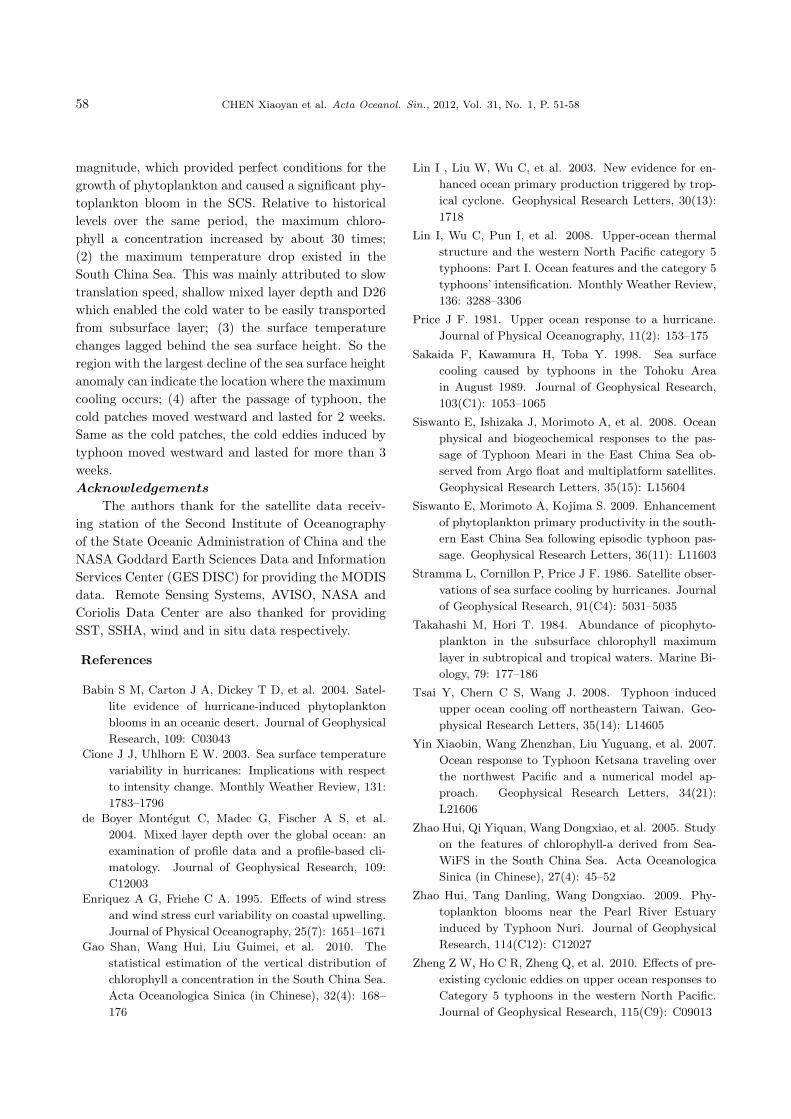
In situ profiles were used to compute the mixed
layer depth. The profiles revealed the vertical tem-
perature distribution in both Points A and D within
1◦ (Figs 7a and b). The time typhoon passed Point A
was 00:00 UTC on 17 October and the typhoon passed
Point D was 00:00 UTC on 20 October. After the ty-
56 CHEN Xiaoyan et al. Acta Oceanol. Sin., 2012, Vol. 31, No. 1, P. 51-58
phoon, the depth of the mixed layer was deepened
from the original 40 to 70 m, which resulted in tem-
perature dropping from 30 to 28.5◦C. Unfortunately,
the in situ profiles at Point D in pre-typhoon period
were not available so that only the mixed layer depth
after typhoon shown in Fig. 7b was 40 m. But the
typhoon will inevitably lead to the deepening of the
mixed layer. So the mixed layer depth at Point D was
bound to be less than 40 m in pre-typhoon period.
From the climatological data (de Boyer Montegut et
al., 2004), the mean mixed layer depth at Point D in
October was approxomately 20–30 m.Therefore, the
mixed layer depth at Point A was deeper than that
of Point D. Zheng et al. (2010) pointed out that the
deeper the mixed layer depth is, the greater the sea
surface cooling is. Therefore, the temperature drop at
Point D was greater than that at Point A.
Zheng et al. (2010) showed that the existence of
cold eddies (negative sea surface height anomaly) is
able to act as good predictors for forecasting where
extreme cooling will take place. However, the location
of the maximum SST drop was not consistent with
the location of preexisting cold eddies at Point A for
typhoon Megi (Figs 3 and 5). Lin et al. (2008) consid-
ered that in the gyre central region (10◦–21◦N, 121◦–
170◦E) where the background climatological warm
layer (typically the depth of the 26◦C isotherm (D26))
is deep, the background itself is already sufficient to
restrain the self induced cooling. Figure 7 shows that
the D26 was about 110 m at Point A and only 60 m
at Point D. This provided further evidence to explain
why the extreme cooling take place in the certain
Fig.5. Sea surface height anomaly before, during and after the passage of typhoon Megi. 12 October (a),19 October (b), 21 October (c), 23 October (d), 31 October (e) and 15 November (f).
CHEN Xiaoyan et al. Acta Oceanol. Sin., 2012, Vol. 31, No. 1, P. 51-58 57
Fig.6. The Ekman pumping velocity. 13 October (a), 20 October (b) and 24 October (c).
Fig.7. Vertical temperature profiles from in situ data at Point A (a) and at Point D (b).
region rather than others.
5 Conclusions
In this study, we investigated the ocean biolog-
ical and physical responses to typhoon Megi using
the chlorophyll-a (chl-a) concentration, the sea surface
temperature(SST), the sea surface height anomaly
(SSHA), the sea surface wind measurements derived
from different satellites and the in situ data. The re-
sults show that (1) strong upwelling was induced by
typhoon Megi and its velocity increased an order of
58 CHEN Xiaoyan et al. Acta Oceanol. Sin., 2012, Vol. 31, No. 1, P. 51-58
magnitude, which provided perfect conditions for the
growth of phytoplankton and caused a significant phy-
toplankton bloom in the SCS. Relative to historical
levels over the same period, the maximum chloro-
phyll a concentration increased by about 30 times;
(2) the maximum temperature drop existed in the
South China Sea. This was mainly attributed to slow
translation speed, shallow mixed layer depth and D26
which enabled the cold water to be easily transported
from subsurface layer; (3) the surface temperature
changes lagged behind the sea surface height. So the
region with the largest decline of the sea surface height
anomaly can indicate the location where the maximum
cooling occurs; (4) after the passage of typhoon, the
cold patches moved westward and lasted for 2 weeks.
Same as the cold patches, the cold eddies induced by
typhoon moved westward and lasted for more than 3
weeks.
Acknowledgements
The authors thank for the satellite data receiv-
ing station of the Second Institute of Oceanography
of the State Oceanic Administration of China and the
NASA Goddard Earth Sciences Data and Information
Services Center (GES DISC) for providing the MODIS
data. Remote Sensing Systems, AVISO, NASA and
Coriolis Data Center are also thanked for providing
SST, SSHA, wind and in situ data respectively.
References
Babin S M, Carton J A, Dickey T D, et al. 2004. Satel-
lite evidence of hurricane-induced phytoplankton
blooms in an oceanic desert. Journal of Geophysical
Research, 109: C03043
Cione J J, Uhlhorn E W. 2003. Sea surface temperature
variability in hurricanes: Implications with respect
to intensity change. Monthly Weather Review, 131:
1783–1796
de Boyer Montegut C, Madec G, Fischer A S, et al.
2004. Mixed layer depth over the global ocean: an
examination of profile data and a profile-based cli-
matology. Journal of Geophysical Research, 109:
C12003
Enriquez A G, Friehe C A. 1995. Effects of wind stress
and wind stress curl variability on coastal upwelling.
Journal of Physical Oceanography, 25(7): 1651–1671
Gao Shan, Wang Hui, Liu Guimei, et al. 2010. The
statistical estimation of the vertical distribution of
chlorophyll a concentration in the South China Sea.
Acta Oceanologica Sinica (in Chinese), 32(4): 168–
176
Lin I , Liu W, Wu C, et al. 2003. New evidence for en-
hanced ocean primary production triggered by trop-
ical cyclone. Geophysical Research Letters, 30(13):
1718
Lin I, Wu C, Pun I, et al. 2008. Upper-ocean thermal
structure and the western North Pacific category 5
typhoons: Part I. Ocean features and the category 5
typhoons’ intensification. Monthly Weather Review,
136: 3288–3306
Price J F. 1981. Upper ocean response to a hurricane.
Journal of Physical Oceanography, 11(2): 153–175
Sakaida F, Kawamura H, Toba Y. 1998. Sea surface
cooling caused by typhoons in the Tohoku Area
in August 1989. Journal of Geophysical Research,
103(C1): 1053–1065
Siswanto E, Ishizaka J, Morimoto A, et al. 2008. Ocean
physical and biogeochemical responses to the pas-
sage of Typhoon Meari in the East China Sea ob-
served from Argo float and multiplatform satellites.
Geophysical Research Letters, 35(15): L15604
Siswanto E, Morimoto A, Kojima S. 2009. Enhancement
of phytoplankton primary productivity in the south-
ern East China Sea following episodic typhoon pas-
sage. Geophysical Research Letters, 36(11): L11603
Stramma L, Cornillon P, Price J F. 1986. Satellite obser-
vations of sea surface cooling by hurricanes. Journal
of Geophysical Research, 91(C4): 5031–5035
Takahashi M, Hori T. 1984. Abundance of picophyto-
plankton in the subsurface chlorophyll maximum
layer in subtropical and tropical waters. Marine Bi-
ology, 79: 177–186
Tsai Y, Chern C S, Wang J. 2008. Typhoon induced
upper ocean cooling off northeastern Taiwan. Geo-
physical Research Letters, 35(14): L14605
Yin Xiaobin, Wang Zhenzhan, Liu Yuguang, et al. 2007.
Ocean response to Typhoon Ketsana traveling over
the northwest Pacific and a numerical model ap-
proach. Geophysical Research Letters, 34(21):
L21606
Zhao Hui, Qi Yiquan, Wang Dongxiao, et al. 2005. Study
on the features of chlorophyll-a derived from Sea-
WiFS in the South China Sea. Acta Oceanologica
Sinica (in Chinese), 27(4): 45–52
Zhao Hui, Tang Danling, Wang Dongxiao. 2009. Phy-
toplankton blooms near the Pearl River Estuary
induced by Typhoon Nuri. Journal of Geophysical
Research, 114(C12): C12027
Zheng Z W, Ho C R, Zheng Q, et al. 2010. Effects of pre-
existing cyclonic eddies on upper ocean responses to
Category 5 typhoons in the western North Pacific.
Journal of Geophysical Research, 115(C9): C09013