Embed Size (px)
Citation preview
University of Texas at El PasoDigitalCommons@UTEP
IPED Technical Reports Institute for Policy and Economic Development
8-1-2006
Upper Rio Grande Workforce Development BoardIndustry Cluster AnalysisMathew McElroyUniversity of Texas at El Paso, [email protected]
Carlos OlmedoUniversity of Texas at El Paso, [email protected]
Ed FeserUniversity of Illinois
Ken PooleCenter for Regional Economic Competitiveness
Follow this and additional works at: http://digitalcommons.utep.edu/iped_techrepPart of the Business Commons, and the Economics Commons
Comments:IPED Technical Report: 2006-3
This Article is brought to you for free and open access by the Institute for Policy and Economic Development at DigitalCommons@UTEP. It has beenaccepted for inclusion in IPED Technical Reports by an authorized administrator of DigitalCommons@UTEP. For more information, please [email protected].
Recommended CitationMcElroy, Mathew; Olmedo, Carlos; Feser, Ed; and Poole, Ken, "Upper Rio Grande Workforce Development Board Industry ClusterAnalysis" (2006). IPED Technical Reports. Paper 53.http://digitalcommons.utep.edu/iped_techrep/53
Upper Rio Grande Workforce Development Board Industry Cluster Analysis
Report prepared by: Mathew McElroy and Carlos Olmedo,
Institute for Policy and Economic Development, University of Texas at El Paso Ed Feser, University of Illinois
Ken Poole, Center for Regional Economic Competitiveness
IPED Technical Report 2006-03

Upper Rio Grande Workforce Development Board Industry Cluster Analysis
Executive Summary: The Upper Rio Grande Workforce Development Board Area Industry Clusters El Paso’s economic history is varied, having gone from median family income levels that were on par with the United States and above that of Texas in 1950 to trailing both by almost one third in 2000.1 The reasons for this decline range from increased migration and a changing demographic to a failed courtship with the garment industry that led El Paso to market itself as a low wage alternative to high wage U.S. economies. The latter of these was precipitated, at least in part, by research suggesting that the garment industry was El Paso’s next, best hope for economic development. Few now dispute the fact that the garment industry failed to provide the type of growth necessary for a modern urban economy to flourish. New methods are available for examining how regional economies function; and as such, these new methods provide local economic developers with insights that have been heretofore unavailable. Among the most promising and widely accepted planning tools focuses on the “clusters” that make up a regional economy. In the method selected for this study, clusters are identified as either “Benchmark Value Chain” or “Technology Based.” These clusters then serve not only as the foundations of an economy, but in varied forms (Existing, Emerging, Potential) also provide insight into areas that can be developed to promote regional economic expansion. Moreover, these clusters each have specifically defined industries that employ specific occupations. Combined, the industry and occupation data can be used to select occupations that are worthwhile candidates for workforce training.
What is a “Cluster?”
Clusters were originally conceived by Michael Porter as fuzzy groups of businesses that fell outside the bounds of rigid SIC or NAICS designations that bought from and sold to one another within geographic and economic space. To add to the current confusion, what now determines a cluster differs by methodology. Location quotients and shift-share analyses alone do not; and different actual cluster studies tell different stories. Porter, for example, focuses on clusters that are either locally oriented, resource dependent, or trade or export oriented.2 Unfortunately, detailed information on how industries are related is absent. This is overcome by Feser, who uses as his foundation the national input-output (I-O) accounts, which track in detail what industries sell to and buy from related industries. The Feser methodology adopted for this study groups industries with their strongest customers and suppliers, creating "a distinct value chain for each industry."3 This is accomplished via what is essentially a data reduction technique that provides a set of 45 “Benchmark Value Chain” clusters and 15 “technology based” clusters.
Benchmark Value Chain Clusters Identified for the Workforce Board Region Existing Clusters • Basic Health: Easily El Paso's largest cluster, employing over 42,000 people in 2942 firms. • Construction: The 20,000 troops planned for Fort Bliss will no doubt provide a huge stimulus to this
cluster, but at the some risk since the cluster must cope with a slow down once the region has absorbed the new troops.
• Hotels and Transportation: El Paso's importance as a port for goods imported and exported from and to Mexico is well known. It is in these cluster industries that wages exceed the average for El Paso, while overall cluster wages would seem to be on par with that of the rest of the county. Tourism plays a far more important role in the rural Workforce Board counties, particularly around Big Bend National Park.
• Information Services: The information services cluster is not only a major employer in the region (19,504) but is relatively well diversified (1841 firms). While the level of concentration for the cluster could be higher, positive growth over the 1991 to 2005 period is promising.
• Financial Services and Insurance: This cluster also exhibits high employment (25,355) and diversification (1443 firms), but more importantly has grown at a rate almost twice that of the cluster at the national level over the 1991 to 2005 period.
Report Prepared by the Institute for Policy and Economic Development, UTEP; Ed Feser, UIUC: and Ken Poole, CREC 1

Upper Rio Grande Workforce Development Board Industry Cluster Analysis
Emerging Clusters • Higher Education and Hospitals: This cluster employs 41,286 people in 2636 firms, but is not
particularly concentrated in the region. It has, however, posted faster growth than the United States over the 1991 to 2005 period. The development of a 4-year medical school in the county is also critical to this cluster’s long term success.
Potential Cluster • Appliances: While small in absolute employment terms compared to each of the clusters above, the
appliance cluster exhibits some of the highest concentration levels of any of the Benchmark Value Chain clusters.
Technology Based Clusters Identified for the Workforce Board Region
Existing Cluster • Engine Equipment: The only Existing Technology-based value chain cluster employed over 2,300
people in the first quarter of 2005 among 22 different firms and is the only technology cluster with any level of concentration in the region.
Emerging Cluster • Information Services: This cluster has the largest employment of any of the Technology-based
clusters, employing 3,803 employees among 138 firms, but lacks industry diversification and concentration.
Potential Clusters • Computer and Electronic Equipment: This cluster exhibits little concentration and actually saw faster
decline than its U.S. counterpart between 1991 and 2005, yet many focus group participants believe in the tie between border security and technology intensive industries in the region. There are also a variety of ongoing local effort that seek to use the El Paso ports as a laboratory for developing and testing these new technologies.
• Architectural and Engineering Services and Technical and Research Services: These clusters both exhibit a very low degree of concentration, but unlike other technology based clusters, showed positive growth and strong employment between 1991 and 2005. The lack of concentration in the region may also provide a strong targeted training opportunity.
Training for the Region and Its Clusters: An Occupation Forecast and Web-based System
The continued expansion of these clusters will rely on a variety of regional efforts—one key component of which is workforce training. Also introduced is an occupational forecast to allow regional planners and policy makers to set training priorities to develop clusters and to support region wide (“cross-cutting) industrial growth. This ensures that there will be sufficient growth in selected occupations to warrant training dollars. Targeted occupations that arise from regional growth and cluster development include registered nurses; elementary, middle, and secondary school teachers; truck drivers, electricians, and carpenters. However, the occupational forecast also shows several highly technical occupations that require training beyond what local workforce boards can typically provide. These include occupations such as accountants, operations managers, advertising managers, computer and math occupations, and architecture and engineering occupations. Specific strategies for overcoming this gap will depend on broad based partnerships and long-term planning. Both the tool and the forecast also focus on the fact that the cluster methodology, while extremely valuable, should not be the sole training guide. Overall regional growth should also be a focal point for training activities.
Report Prepared by the Institute for Policy and Economic Development, UTEP; Ed Feser, UIUC: and Ken Poole, CREC 2
Upper Rio Grande Workforce Development Board Industry Cluster Analysis
Strategic Recommendations for Regional and Cluster Development
Workforce Development Board Recommendations Given the cluster and occupations findings, a set of broad ranging and cluster specific activities are needed to spur regional growth. Some are the sole province of the Workforce Board, but many rely on a variety of local partners. The Board can act as a key stakeholder to encourage local buy in and joint priority setting.
• Increase the participation/representation from targeted clusters on the Workforce Board. • Analyze the specific jobs and related contracting opportunities being created at Fort Bliss as a
result of BRAC in an effort to encourage new business development and identify occupational skill needs associated with the expected influx of workers.
• Develop a collaborative campaign with UTEP to attract talented students from outside the region to go to school in El Paso.
• Create a proactive initiative to provide career counseling information to area middle school and high school counselors, teachers, students (and their parents) regarding entry-level occupations related to occupations in targeted clusters.
• Collaborate with existing initiatives in the region aimed at encouraging more entrepreneurial behaviors among area workers – encouraging them to consider creating their own jobs – (through supporting “how-to-create-a-business” seminars and curricula).
• Assist area school systems in their efforts to implement reforms and encourage school efforts to ensure that students have basic skills and are computer literate.
• Encourage policy makers to assist UTEP and regional universities to take a more proactive role in developing programs that support the region’s targeted industry clusters (by: supporting research in these areas; offering more incentives in the tenure-granting process to faculty who collaborate with area companies (or create their own companies based on new technologies jointly developed with university resources); encouraging entrepreneurship among the college’s faculty members; and expanding curriculum related to these industry clusters).
• Provide support for financial literacy and the importance of “asset-building” as a life skill integrated into basic education curriculum.
Cluster-specific Recommendations
• Information Services and Engineering
o Support economic development agency efforts to recruit defense contractors to service Fort Bliss and border security needs.
o Ensure that regional universities and technology specific training centers continue to expand their higher level software engineering, database management, and network administration activities.
o Review and support available training programs designed to provide introduction to computer programming.
o Develop/support career information and apprenticeship opportunities by supporting apprenticeship programs that link more El Paso companies to UTEP and regional universities’ engineering and computer sciences to small area companies (e.g., Innovation Philadelphia internship).
o Support informal networking events among area information services companies on topics related to finding and keeping employees, identifying career opportunities for talented young adults at regional universities.
o Encourage/support efforts by regional universities and trade schools to expand the exposure of engineering and computer technicians to design concepts and design-for-production tools.
• Construction Trades o Support efforts to expand apprenticeship programs in collaboration with area companies.
Report Prepared by the Institute for Policy and Economic Development, UTEP; Ed Feser, UIUC: and Ken Poole, CREC 3
o Develop a program in collaboration with SBDC to provide entrepreneurial training for sub-contracting opportunities and management training for potential sub-contractors.

Upper Rio Grande Workforce Development Board Industry Cluster Analysis
o Seed a program to offer cash bonuses to construction trades workers who complete their apprenticeship program within a time period specified by the Workforce Board.
o Support the development of construction management degree program at UTEP and of construction management certification and related credits at EPCC and regional technical schools.
o Develop a program to communicate opportunities and wages for construction trades occupations to high school students and young adults .
• Financial Services o Explore availability of existing financial services certification/licensing programs relative to
needs to support entry level financial services staff for banking and insurance. o Offer more specific educational curriculum and enhance relationships with business and
universities to expose more students to financial services careers. o Encourage community colleges to offer training in marketing and sales.
• Health care o Encourage expansion of educational programs (including Fast Track) to train teachers or
other degree holders for nursing and other technical health care occupations. o Consider marketing El Paso as a private pay health care hub for Central and South
America. The great majority of health care workers in the region are able to speak Spanish, making it an ideal location for exporting health care.
• Logistics—Hotel and Transportation Services o Expand training for truck drivers (CDLs) and truck/truck equipment maintenance. o Identify training opportunities related to occupations in logistics data management and
analysis.
Report Prepared by the Institute for Policy and Economic Development, UTEP; Ed Feser, UIUC: and Ken Poole, CREC 4
o Encourage entrepreneurship among would-be jobseekers; creation of boutique firms focused on specialty transportation.

Upper Rio Grande Workforce Development Board Industry Cluster Analysis
Upper Rio Grande Workforce Development Board Industry Cluster Analysis
Cluster Methodology: How they were intended Economic developers often forget that clusters were originally thought of by Porter as groups of businesses, which fell outside the bounds of rigid SIC or NAICS designations, that bought from and sold to one another within geographic and economic space. In fact, the cluster concept has a common theoretical base with the work of economists and planners who couched their work in far less attractive language that focused on economic geography and agglomeration—all while Porter focused on competitiveness. The latter may be the reason that economic developers ascribe so many meanings to clusters—because they were fuzzy even when Porter conceived them. Nonetheless, Porter’s characterization of clusters added an energy to his work that made it attractive. What analysts and policymakers must understand is that what determines a cluster now differs by methodology. Location quotients and shift-share analyses alone do not, as both are purely industry studies; and different actual cluster studies tell different stories. Porter, for example, focuses on clusters that are either locally oriented, resource dependent, or trade or export oriented. Detailed information on how industries are related—how they sell to and purchase from one another—is absent. Moreover, the Porter approach tends to focus on industries that are both trading and operating in common space (based on the use of state level data). Readers familiar with the El Paso economy understand that interest should focus on industries that are related far more in "economic space" than in "geographic space,"4 particularly given El Paso's relative isolation in far west Texas and the absence of data for what truly constitutes El Paso's economic region, namely Cd. Juárez. That said, the key strength of the Feser methodology adopted for this study is its reliance on the national input-output (I-O) accounts as a foundation. The national input-output accounts track in detail what industries sell to and buy from related industries, which allows for study of what industries rely upon one another in economic space to survive. Grouping these co-supportive and co- dependent industries gets at the essence of Porter's original cluster concept from the Competitive Advantage of Nations far more than other methods currently allow. Feser does this by grouping industries with their customers and suppliers, creating "a distinct value chain for each industry."5 This is accomplished via what is essentially a data reduction technique. The data reduction process is such that it takes a 437 row by 437 column matrix identifying the selling and buying patterns of 437 industries and reducing them to 45 “Benchmark Value Chain” clusters. The same is done for a 111 by 111 matrix of technology intensive industries to provide 15 additional “Technology-based” clusters. The Benchmark Value Chain and Technology-based clusters then serve as valuable tools for regional analysts. Because Feser begins with the national input-output accounts, researchers at the regional level can benchmark the performance of industries (thus the “Benchmark Value Chain clusters”) within each cluster to national performance. In other words, does the set of industries that make up a cluster at the national level perform worse than, the same as, or better than the same regional industries? A set of industries grouped into a cluster performing better at the regional level provides key insight into what may be some level of regional competitive advantage. Poor performance, conversely, may be indicative of some key industry within the cluster nationally being absent at the regional level—a useful tool in business recruitment or the development of incentive packages. The specific use of the cluster methodology will differ based on the varying goals of different research projects, but it is clear that the reduction of two huge sets of trading patterns into 60 clusters provides an invaluable tool for regional economic analysis and planning. Practical Use—Performance Benchmarking
Report Prepared by the Institute for Policy and Economic Development, UTEP; Ed Feser, UIUC: and Ken Poole, CREC 5
The specific application of the mode of inquiry provided by Feser has two goals here. First is the identification of clusters (benchmark and technology) that exist in the El Paso and Workforce Board region rural counties relative to national benchmarks. Second is the identification of targeted training

Upper Rio Grande Workforce Development Board Industry Cluster Analysis
opportunities the Workforce Board may be able to support to enhance Existing, Emerging, or Potential clusters. The performance benchmarking portion of this analysis is the most straightforward. Six digit NAICS industry employment data grouped into the 45 Benchmark Value Chain and 15 technology based clusters for the URGWDB counties are compared to the U.S. benchmarks for the same period. The periods selected for comparison in the table below (Table 11) are 1991 and 2005, with detailed results provided in Appendix A for all counties and varying time periods. Before moving on to detailed results for the region, three key terms are essential for understanding how clusters are selected. While the actual number of clusters can be "fuzzed” to be greater than or less than 45 or 15 (respectively, for Benchmark Value Chain or Technology-based clusters), clusters are further defined for practical use as either Existing, Emerging, or Potential. Unlike the statistical methods and normative rules used to build the 60 clusters, there is less available guidance that clearly delineates where an Existing cluster begins and an Emerging cluster ends. The cutoffs are made quantitatively and qualitatively in that they rely on expert examination of the data and focus group follow-up to the statistical cluster results. The selection criteria for each type of cluster are defined as: • Existing: These clusters tend to have a large, diversified number of firms operating in the region (in
terms of industry and absolute number), a large number of employees, and a high level of concentration (as measured by location quotient). Existing clusters typically represent a region’s productive core and also have strong wage performance and stability. The Textiles and Apparel cluster, for example, exhibits several of these characteristics, but shows rapid decline and very low wages relative to the U.S. and the region, making it a poor candidate as a focus for economic development planning.
• Emerging: These clusters, while potentially large, may lack key industries or be dominated by a small number of firms. A cluster might be made up of 15 industries. An Emerging cluster would show firms and employment in only about two thirds—or show employment only at the low end of industry association with the cluster.
• Potential: Employment in these clusters may be high, but may be dominated by one or a very small number of firms across very few industries that define a cluster. Potential clusters have a core set of establishments but may lack the strength to attract related firms in necessary industries.
A few additional instructions for the analysis below are warranted. First is a brief overview of location quotients (LQ), which are simply a measure of an industry or cluster’s concentration in an area. A key tool in economic base theory, levels below 1 suggest that a region does not meet local demand for a certain good. Levels above 1 suggest not only concentration but specialization that allows the region to export a portion of the industry / cluster’s output. The compound quarterly growth rate is a “smoothed” growth rate. The remaining tables measures are straight forward, although the bubble charts do warrant one note. Ideally, each of the bubbles (cluster employment plotted in two space) would be above the regional wage average (bold horizontal line) and to the right of 1 on the x axis (bold vertical line). Very few industries in El Paso or the Workforce Board Area counties exhibit both, making identifying Existing clusters somewhat more difficult. There are several clusters with high wage rates and high employment levels that could develop a greater degree of concentration and move to the right along the x axis—such as Higher Education and Hospitals should Texas Tech Medical School open a four-year branch in El Paso. Cluster Results: El Paso, the North Interstate 10 corridor, and the South Interstate 10 corridor
El Paso Benchmark Value Chain Cluster Results
Report Prepared by the Institute for Policy and Economic Development, UTEP; Ed Feser, UIUC: and Ken Poole, CREC 6
The El Paso economy has a variety of strengths—its military presence and strong service sector built in part around serving visitors from Mexico. Unfortunately, these industries are not necessarily productive; they are not involved in the production of some tangible good or service (that is not exclusively local6). But this was in part the reason that the Feser clusters were selected to study the regional economy. The Feser clusters allow researchers to focus on mapping El Paso’s productive activities, not activities suited

Upper Rio Grande Workforce Development Board Industry Cluster Analysis
to purely local serving production that typically have low wages. Because of El Paso’s service and Military base, the economy did not fare particularly well when fitted at the six digit NAICS level to either the 45 Benchmark Value Chain clusters or the 15 Technology-based clusters. El Paso simply lacks activity in many productive industries—grouped by Feser or not. This is evident from examination of the location quotient column of the El Paso results below (Table 11), where upwards of 75 percent of the Benchmark Value Chain clusters fail to employ a sufficient number of individuals to meet local demand (LQ<1). Of the remaining clusters, many, such as textiles and apparel, have a very low wages relative to both the U.S. for the same cluster and for El Paso across all clusters. The nature of these results limits the ability of the researchers to define large sets of Existing, Emerging, and Potential clusters for both the Benchmark Value Chain and Technology-based industry groupings. Readers familiar with other regional studies that use a similar cluster methodology may note the selection of fewer Benchmark Value Chain and technology based clusters overall.
Figure 22: El Paso, Texas Existing, Emerging, and Potential Benchmark Value Chain Clusters
Basic health services
Construction
Financial services & insurance
Information services
Hotels & transportation services
Higher education & hospitals
Appliances
15,000
20,000
25,000
30,000
35,000
0.70 0.80 0.90 1.00 1.10 1.20 1.30 1.40 1.50 1.60 1.70 1.80 1.90
Location Quotient
Ave
rage
Wag
e
Average Wage, all El Paso Industries: $25,173
Existing Clusters • Basic Health: This is easily El Paso's largest cluster, employing over 42,000 people across 2,942
firms. Population growth, the exporting of health services to Mexico, and BRAC all suggest that the cluster will remain at the core of the greater El Paso economy. The location quotient for this cluster is among the very few that is above one (1.11). Focus group comments suggest this is due in part to increased employment associated with lower wage levels relative to those of the United States. It is also highly likely that the high employment levels come from serving both paying and nonpaying customers from Mexico who demand health services.
Report Prepared by the Institute for Policy and Economic Development, UTEP; Ed Feser, UIUC: and Ken Poole, CREC 7
• Construction: The construction cluster saw growth equal to that of the nation between 1991 and 2005, although this growth tapered off between 2002 and 2005. The 20,000 troops planned for Fort Bliss will no doubt provide a huge stimulus to this cluster and enhance local employment opportunity, helping push its location quotient over one. There is some risk in any construction employment build up associated with troop movements. Eventually the construction slows significantly or stops as the new demand has been met. The key to development in this cluster will be creating more highly skilled workers within the industry once the regional BRAC adjustment is made.

Upper Rio Grande Workforce Development Board Industry Cluster Analysis
• Hotels and Transportation: This sector is included here not because of the focus on hotels or tourism,
but because of El Paso's importance as a port for goods imported and exported from and to Mexico. It is in these cluster industries that wages exceed the average for El Paso, while overall cluster wages would seem to be on par with that of the rest of the county. Maquila employment is also improving as producers relocate to Mexico because of the difficulty of moving some finished goods from China to final market in the U.S quickly.
• Information Services: The information services cluster is not only a major employer in the region
(19,504) but is relatively well diversified (1841 firms). While the level of concentration for the cluster could be higher (LQ=.81), positive growth over the 1991 to 2005 period is promising. These results are bolstered by focus group comments which suggest that local firms are beginning to outsource information technology functions at a higher rate than over the past decade. It should also be noted that several information services member industries have very low employment, and the level of concentration for the cluster in the region actually dropped slightly between 1991 and 2005. However, over the 2002 to 2005 period, Information Services growth has been positive, while at the national level, employment declined, which bolsters focus group comments.
• Financial Services and Insurance: This cluster also exhibits high employment (25,355) and
diversification (1443 firms), but more importantly has grown at a rate almost twice that of the cluster at the national level over the 1991 to 2005 period. Increasing remittances to Mexico and an increased focus on cross-border banking have also helped to solidify this cluster within the region.
Emerging Cluster • Higher Education and Hospitals: This cluster employs 41,286 people in 2636 firms, but is not
particularly concentrated in the region. It has, however, posted faster growth than the U.S. over the 1991 to 2005 period. This cluster suffers from very low employment in several specific industries, which is likely an outgrowth of low educational attainment levels in the region. It will no doubt be helped should Texas Tech open a 4-year medical school in the county.
Potential Cluster • Appliances: While small in absolute employment terms compared to each of the other clusters above,
the appliance cluster exhibits some of the highest concentration levels of any of the Benchmark Value Chain clusters. Its growth was also well above that of the U.S. over the 1991 to 2005 period. Unfortunately, the appliance cluster pays low wages not only compared to the U.S. but only slightly above the El Paso average. The key to cluster development here is shifting production to more technology oriented products that can build upon an established production base both in El Paso and across the border.
Report Prepared by the Institute for Policy and Economic Development, UTEP; Ed Feser, UIUC: and Ken Poole, CREC 8
Upper Rio Grande Workforce Development Board Industry Cluster Analysis
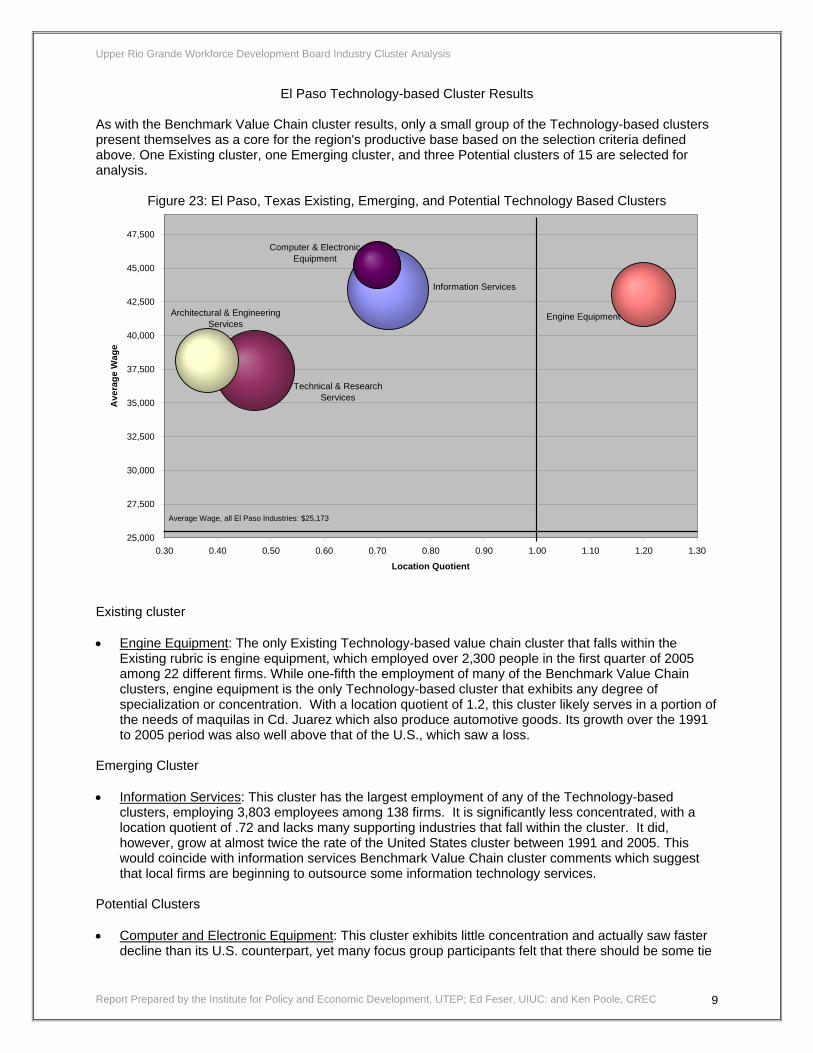
El Paso Technology-based Cluster Results As with the Benchmark Value Chain cluster results, only a small group of the Technology-based clusters present themselves as a core for the region's productive base based on the selection criteria defined above. One Existing cluster, one Emerging cluster, and three Potential clusters of 15 are selected for analysis.
Figure 23: El Paso, Texas Existing, Emerging, and Potential Technology Based Clusters
Information Services
Technical & Research Services
Architectural & Engineering Services
Computer & Electronic Equipment
Engine Equipment
25,000
27,500
30,000
32,500
35,000
37,500
40,000
42,500
45,000
47,500
0.30 0.40 0.50 0.60 0.70 0.80 0.90 1.00 1.10 1.20 1.30
Location Quotient
Ave
rage
Wag
e
Average Wage, all El Paso Industries: $25,173
Existing cluster • Engine Equipment: The only Existing Technology-based value chain cluster that falls within the
Existing rubric is engine equipment, which employed over 2,300 people in the first quarter of 2005 among 22 different firms. While one-fifth the employment of many of the Benchmark Value Chain clusters, engine equipment is the only Technology-based cluster that exhibits any degree of specialization or concentration. With a location quotient of 1.2, this cluster likely serves in a portion of the needs of maquilas in Cd. Juarez which also produce automotive goods. Its growth over the 1991 to 2005 period was also well above that of the U.S., which saw a loss.
Emerging Cluster • Information Services: This cluster has the largest employment of any of the Technology-based
clusters, employing 3,803 employees among 138 firms. It is significantly less concentrated, with a location quotient of .72 and lacks many supporting industries that fall within the cluster. It did, however, grow at almost twice the rate of the United States cluster between 1991 and 2005. This would coincide with information services Benchmark Value Chain cluster comments which suggest that local firms are beginning to outsource some information technology services.
Potential Clusters
Report Prepared by the Institute for Policy and Economic Development, UTEP; Ed Feser, UIUC: and Ken Poole, CREC 9
• Computer and Electronic Equipment: This cluster exhibits little concentration and actually saw faster decline than its U.S. counterpart, yet many focus group participants felt that there should be some tie

Upper Rio Grande Workforce Development Board Industry Cluster Analysis
between border security and technology intensive industries in the region. Since many of the solutions to keeping the borders open will rely not only on software but hardware and computer solutions, this cluster is included here.
• Architectural and Engineering Services and Technical and Research Services: These clusters both
exhibit a very low degree of concentration, but unlike other technology based clusters, showed positive growth and strong employment between 1991 and 2005. While the low levels of diversification and missing industries within the cluster may eventually prove to be obstacles that cannot be overcome, their strong employment should not be overlooked. The low location quotient also suggests that the cluster is not meeting local demand, a possible opportunity for increased training.
Report Prepared by the Institute for Policy and Economic Development, UTEP; Ed Feser, UIUC: and Ken Poole, CREC 10

Upper Rio Grande Workforce Development Board Industry Cluster Analysis
Table 11: Detailed Results Benchmark Value Chain and Technology Based Clusters Summary trends, benchmark value chain clusters, 1991-2005El Paso County
% all
Per estab- sectors El Paso US Change IQ 2005
Clusters IQ 2005 IQ 2005 lishment IQ 2005 '91-'05 '91-'05 IQ 2005 '91-'05 mil $ 3Q 1991 IQ 2005
Textiles & apparel 60 3,229 53.8 1.7 -3.2 -1.5 2.19 -3.3 20.4 13,861 0.79 25,330 0.80 0.02Packaged food products 62 1,445 23.3 0.8 -1.7 -0.1 0.64 -0.8 8.4 14,583 0.65 23,229 0.70 0.05Plastics & rubber manufacturing 12 636 53.0 0.3 -1.1 -0.6 0.57 -0.1 12.2 31,256 0.82 76,649 1.10 0.28Aluminum & aluminum products 16 995 62.2 0.5 -0.2 -0.5 0.88 0.1 8.9 23,136 0.74 35,809 0.75 0.00Basic health services 2,942 42,664 14.5 22.2 1.0 0.7 1.11 0.2 292.5 22,018 0.76 27,428 0.62 -0.15Mining 9 50 5.6 0.0 0.3 -0.3 0.08 0.0 0.4 36,839 1.07 32,616 0.57 -0.50Farming 80 621 7.8 0.3 -0.9 -0.5 0.60 -0.1 2.7 12,653 0.93 17,662 0.81 -0.13Construction 978 11,445 11.7 5.9 0.6 0.6 0.95 0.0 75.1 16,705 0.63 26,233 0.67 0.04Financial services & insurance 1,443 25,355 17.6 13.2 1.2 0.7 0.94 0.2 172.1 21,767 0.75 27,146 0.45 -0.30Chemical-based products n/a n/a n/a n/a n/a n/a n/a n/a n/a n/a n/a n/a n/a n/aMachine tools 77 1,442 18.7 0.7 1.5 -0.1 0.76 0.4 15.6 19,907 0.71 43,211 1.03 0.32Precision instruments 11 648 58.9 0.3 -1.0 -0.6 0.91 -0.2 6.1 20,089 0.64 37,672 0.63 -0.01Printing & publishing 243 2,538 10.4 1.3 0.0 0.2 0.57 -0.1 20.4 19,151 0.66 32,079 0.59 -0.07Metalworking & fabr metal products 39 1,216 31.2 0.6 0.6 0.1 1.03 0.3 7.1 17,023 0.64 23,517 0.60 -0.04Dairy products 23 442 19.2 0.2 -0.9 -0.1 0.68 -0.4 3.2 18,917 0.80 28,589 0.83 0.03Nondurable industry machinery 62 2,160 34.8 1.1 0.2 -0.1 0.75 0.1 17.4 17,821 0.58 32,272 0.64 0.06Computer & electronic equipment 51 1,559 30.6 0.8 -1.4 -0.5 0.63 -0.4 15.9 24,024 0.65 40,815 0.54 -0.12Wood products & furniture 48 814 17.0 0.4 -0.9 -0.1 0.73 -0.4 3.7 13,903 0.69 18,115 0.58 -0.12Const machinery & distribution equip 12 595 49.6 0.3 3.1 -0.3 0.54 0.4 4.2 22,495 0.72 27,954 0.53 -0.20Wood processing 62 753 12.1 0.4 -0.1 0.0 0.51 0.0 3.3 13,169 0.66 17,452 0.56 -0.10Paper 23 938 40.8 0.5 -0.3 -0.4 0.96 0.1 7.8 19,760 0.68 33,064 0.73 0.05Concrete, brick building products 53 2,108 39.8 1.1 0.7 0.3 1.36 0.3 16.3 20,352 0.84 30,849 0.85 0.00Motor vehicles 20 1,787 89.4 0.9 -0.4 0.1 0.80 -0.2 16.7 23,830 0.72 37,453 0.72 0.00Wood building products 65 2,744 42.2 1.4 0.6 0.2 1.65 0.4 19.5 18,710 0.79 28,391 0.79 0.01Plastics products 30 1,689 56.3 0.9 0.3 0.0 1.20 0.2 11.6 17,736 0.63 27,435 0.64 0.01Feed products 91 747 8.2 0.4 -1.4 -0.2 0.54 -0.4 3.3 12,287 0.72 17,507 0.62 -0.10Arts and media 1,506 16,255 10.8 8.4 0.0 0.3 0.83 -0.1 131.1 19,423 0.71 32,254 0.67 -0.05Higher education & hospitals 2,636 41,286 15.7 21.4 0.6 0.5 0.81 0.1 328.8 20,730 0.79 31,857 0.68 -0.11Information services 1,841 19,504 10.6 10.1 0.2 0.4 0.87 -0.1 176.8 22,467 0.71 36,262 0.64 -0.07Petroleum & gas 60 2,087 34.8 1.1 -1.0 -0.4 0.87 -0.3 35.9 37,004 0.92 68,740 0.86 -0.06Business services 2,650 39,611 14.9 20.6 0.6 0.6 0.93 0.0 279.1 19,413 0.72 28,180 0.53 -0.19Grain milling n/a n/a n/a n/a n/a n/a n/a n/a n/a n/a n/a n/a n/a n/aRubber products 16 473 29.6 0.2 0.1 -0.4 0.52 0.1 3.4 16,998 0.59 28,640 0.65 0.06Glass products 14 388 27.7 0.2 0.9 -0.2 0.63 0.3 2.4 18,679 0.72 24,455 0.59 -0.13Pharmaceuticals 6 276 46.0 0.1 3.8 0.0 0.29 0.3 2.7 20,519 0.57 39,628 0.51 -0.06Steel milling 7 552 78.9 0.3 0.0 -0.6 1.61 0.5 4.1 19,791 0.56 29,629 0.51 -0.05Nonresidential building products 204 3,968 19.5 2.1 0.4 0.3 0.99 0.0 31.5 21,483 0.69 31,750 0.63 -0.06Tobacco products n/a n/a n/a n/a n/a n/a n/a n/a n/a n/a n/a n/a n/a n/aOptical equipment & instruments 11 158 14.4 0.1 -2.9 -0.4 0.20 -0.5 1.4 16,783 0.59 36,166 0.68 0.09Appliances 60 3,365 56.1 1.7 0.8 0.2 1.79 0.5 24.9 19,322 0.79 29,571 0.79 0.00Copper & copper products 33 1,038 31.5 0.5 -0.9 -0.5 2.69 -0.4 14.5 31,226 1.12 55,686 1.28 0.16Hotels & transportation services 2,187 40,260 18.4 20.9 1.1 0.6 1.15 0.3 261.6 17,882 0.77 25,992 0.64 -0.13Aerospace n/a n/a n/a n/a n/a n/a n/a n/a n/a n/a n/a n/a n/a n/aBreweries & distilleries 7 548 78.3 0.3 -2.6 -0.5 0.94 -1.9 3.4 13,741 0.50 24,750 0.55 0.05Leather products 37 1,094 29.6 0.6 -1.6 -1.1 4.14 -1.1 7.9 15,007 0.79 29,067 0.82 0.04
Total, establishments in VC sectors 7,177 125,215 17.4 65.0 0.2 0.3 n/a n/a 950.0 19,253 0.71 30,347 0.63 -0.08
Total, all establishments 10,786 192,584 17.9 100.0 0.3 0.3 n/a n/a 1,218.1 17,029 0.72 25,301 0.63 -0.10
Ratio chng
Note: El Paso data are from the Texas Workforce Commission (ES-202 file, confidential release). El Paso region is defined as the six county Upper Rio Grande region (El Paso, Hudspeth, Culberson, Jeff Davis, Presidio, and Brewster counties). US data are from the US Bureau of Labor Statistics, Quarterly Census of Employment and Wages. Clusters are not mutually exclusive. Data are only for businesses "covered" under unemployment insurance law and include only private sector establishments. CQGR: Compound quarterly growth rate. Sectors not assigned to any cluster include federal, state and local government; the US Postal Service; retail trade; basic consumer services; social services and religious organizations; and household employees.
Establishments
Employment
Location QuotientCQGR
2nd Quarter Payroll
Average Wage
Ratio to US
Ratio to US
Summary trends, benchmark technology-based value chain clusters, 1991-2005El Paso County
% all
Per estab- sectors El Paso US Change IQ 2005
Clusters IQ 2005 IQ 2005 lishment IQ 2005 '91-'05 '91-'05 IQ 2005 '91-'05 mil $ 3Q 1991 IQ 2005
Chemicals 9 49 5.4 0.0 3.5 -0.6 0.09 0.1 0.5 35,560 0.91 38,485 0.54 -0.37Precision instruments 7 178 25.4 0.1 -1.4 -0.5 0.36 -0.2 1.0 13,965 0.43 23,329 0.37 -0.06Engine equipment 22 2,375 108.0 1.2 0.7 -0.2 1.20 0.5 25.5 17,982 0.57 43,028 0.84 0.27Computer & electronic equipment 20 1,295 64.8 0.7 -1.6 -0.6 0.70 -0.4 14.6 24,767 0.65 45,208 0.55 -0.10Information services 138 3,803 27.6 2.0 1.3 0.8 0.72 0.2 41.3 26,453 0.70 43,444 0.58 -0.13Pharmaceuticals n/a n/a n/a n/a n/a n/a n/a n/a n/a n/a n/a n/a n/a n/aFertilizer & chemical products n/a n/a n/a n/a n/a n/a n/a n/a n/a n/a n/a n/a n/a n/aIndustrial machinery & distribution equip n/a n/a n/a n/a n/a n/a n/a n/a n/a n/a n/a n/a n/a n/aAerospace n/a n/a n/a n/a n/a n/a n/a n/a n/a n/a n/a n/a n/a n/aMedical instruments and optics 10 194 19.4 0.1 -2.4 -0.5 0.27 -0.5 2.0 17,115 0.56 40,865 0.74 0.18Motor vehicles 16 1,663 103.9 0.9 -0.6 0.0 0.96 -0.3 14.4 23,447 0.68 34,626 0.62 -0.05Wiring devices & switches 151 1,295 8.6 0.7 -0.2 0.4 0.51 -0.2 12.4 26,334 0.76 38,250 0.66 -0.09Technical & research services 385 3,629 9.4 1.9 0.5 0.9 0.47 -0.1 33.9 25,191 0.71 37,401 0.59 -0.12Cable manufacturing 6 147 24.5 0.1 -1.5 -0.5 0.55 -0.4 1.2 21,941 0.75 31,850 0.64 -0.11Architectural & engineering services 321 2,352 7.3 1.2 0.3 0.9 0.38 -0.1 22.4 25,978 0.70 38,141 0.55 -0.14
Total, all Tech VC establishments 579 11,970 20.7 6.2 0.1 0.2 n/a n/a 123.9 24,690 0.69 41,395 0.62 -0.07
Total, all establishments 10,786 192,584 17.9 100.0 0.3 0.3 n/a n/a 1,218.1 17,029 0.72 25,301 0.63 -0.10
Employment
Location QuotientCQGR
2nd Quarter Payroll
Average Wage Establishments
Note: El Paso data are from the Texas Workforce Commission (ES-202 file, confidential release). El Paso region is defined as the six county Upper Rio Grande region (El Paso, Hudspeth, Culberson, Jeff Davis, Presidio, and Brewster counties). US data are from the US Bureau of Labor Statistics, Quarterly Census of Employment and Wages. Clusters are not mutually exclusive. Data are only for businesses "covered" under unemployment insurance law and include only private sector establishments. CQGR: Compound quarterly growth rate. Sectors not assigned to any cluster include federal, state and local government; the US Postal Service; retail trade; basic consumer services; social services and religious organizations; and household employees.
Ratio to US
Ratio to US
Ratio chng
Report Prepared by the Institute for Policy and Economic Development, UTEP; Ed Feser, UIUC: and Ken Poole, CREC 11
Upper Rio Grande Workforce Development Board Industry Cluster Analysis
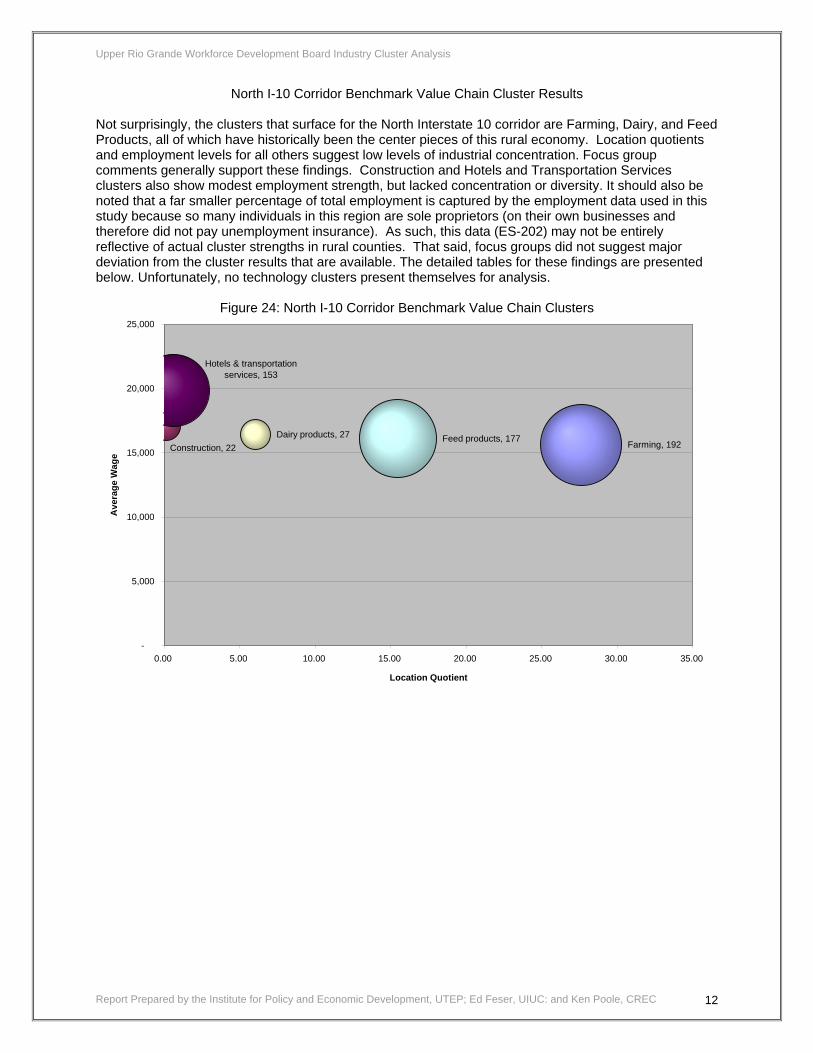
North I-10 Corridor Benchmark Value Chain Cluster Results Not surprisingly, the clusters that surface for the North Interstate 10 corridor are Farming, Dairy, and Feed Products, all of which have historically been the center pieces of this rural economy. Location quotients and employment levels for all others suggest low levels of industrial concentration. Focus group comments generally support these findings. Construction and Hotels and Transportation Services clusters also show modest employment strength, but lacked concentration or diversity. It should also be noted that a far smaller percentage of total employment is captured by the employment data used in this study because so many individuals in this region are sole proprietors (on their own businesses and therefore did not pay unemployment insurance). As such, this data (ES-202) may not be entirely reflective of actual cluster strengths in rural counties. That said, focus groups did not suggest major deviation from the cluster results that are available. The detailed tables for these findings are presented below. Unfortunately, no technology clusters present themselves for analysis.
Figure 24: North I-10 Corridor Benchmark Value Chain Clusters
Report Prepared by the Institute for Policy and Economic Development, UTEP; Ed Feser, UIUC: and Ken Poole, CREC 12
Farming, 192 Dairy products, 27 Feed products, 177
Construction, 22
Hotels & transportation services, 153
-
5,000
10,000
15,000
20,000
25,000
0.00 5.00 10.00 15.00 20.00 25.00 30.00 35.00
Location Quotient
Ave
rage
Wag
e

Upper Rio Grande Workforce Development Board Industry Cluster Analysis
Table 12: Detailed Results North I-10 Benchmark Value Chain and Technology Based Clusters Summary trends, benchmark value chain clusters, 1991-2005North I10 Corridor (Hudspeth and Culberson Counties)
% all
Per estab- sectors N I-10 US Change IQ 2005
Clusters IQ 2005 IQ 2005 lishment IQ 2005 '91-'05 '91-'05 IQ 2005 '91-'05 mil $ 3Q 1991 IQ 2005
Textiles & apparel n/a n/a n/a n/a n/a n/a n/a n/a n/a n/a n/a n/a n/a n/aPackaged food products n/a n/a n/a n/a n/a n/a n/a n/a n/a n/a n/a n/a n/a n/aPlastics & rubber manufacturing n/a n/a n/a n/a n/a n/a n/a n/a n/a n/a n/a n/a n/a n/aAluminum & aluminum products n/a n/a n/a n/a n/a n/a n/a n/a n/a n/a n/a n/a n/a n/aBasic health services 12 35 2.9 3.5 -1.6 0.6 0.13 -0.1 0.2 13,580 0.46 25,120 0.53 0.08Mining 8 81 10.1 8.1 -3.4 -0.4 21.74 -47.9 0.5 36,290 1.07 25,884 0.47 -0.61Farming 26 192 7.4 19.1 0.0 -0.5 27.61 14.1 0.8 11,158 0.82 15,627 0.71 -0.11Construction 6 22 3.7 2.2 1.2 0.6 0.18 0.1 0.1 30,326 1.15 17,051 0.44 -0.71Financial services & insurance 6 36 6.0 3.6 0.5 0.6 0.20 0.1 0.2 14,030 0.48 26,569 0.44 -0.04Chemical-based products n/a n/a n/a n/a n/a n/a n/a n/a n/a n/a n/a n/a n/a n/aMachine tools n/a n/a n/a n/a n/a n/a n/a n/a n/a n/a n/a n/a n/a n/aPrecision instruments n/a n/a n/a n/a n/a n/a n/a n/a n/a n/a n/a n/a n/a n/aPrinting & publishing n/a n/a n/a n/a n/a n/a n/a n/a n/a n/a n/a n/a n/a n/aMetalworking & fabr metal products n/a n/a n/a n/a n/a n/a n/a n/a n/a n/a n/a n/a n/a n/aDairy products 7 27 3.9 2.7 -0.9 0.1 6.05 -0.4 0.1 11,439 0.51 16,417 0.52 0.00Nondurable industry machinery n/a n/a n/a n/a n/a n/a n/a n/a n/a n/a n/a n/a n/a n/aComputer & electronic equipment n/a n/a n/a n/a n/a n/a n/a n/a n/a n/a n/a n/a n/a n/aWood products & furniture n/a n/a n/a n/a n/a n/a n/a n/a n/a n/a n/a n/a n/a n/aConst machinery & distribution equip n/a n/a n/a n/a n/a n/a n/a n/a n/a n/a n/a n/a n/a n/aWood processing n/a n/a n/a n/a n/a n/a n/a n/a n/a n/a n/a n/a n/a n/aPaper n/a n/a n/a n/a n/a n/a n/a n/a n/a n/a n/a n/a n/a n/aConcrete, brick building products n/a n/a n/a n/a n/a n/a n/a n/a n/a n/a n/a n/a n/a n/aMotor vehicles n/a n/a n/a n/a n/a n/a n/a n/a n/a n/a n/a n/a n/a n/aWood building products n/a n/a n/a n/a n/a n/a n/a n/a n/a n/a n/a n/a n/a n/aPlastics products n/a n/a n/a n/a n/a n/a n/a n/a n/a n/a n/a n/a n/a n/aFeed products 28 177 6.3 17.6 -0.5 -0.2 15.46 4.5 0.7 10,272 0.67 16,100 0.63 -0.04Arts and media 6 22 3.7 2.2 -2.7 0.2 0.14 -0.3 0.1 10,783 0.39 19,325 0.39 0.01Higher education & hospitals 20 162 8.1 16.2 -0.3 0.4 0.46 0.0 0.6 9,647 0.36 16,042 0.34 -0.02Information services 8 47 5.9 4.7 -1.3 0.3 0.25 -0.1 0.4 14,781 0.46 34,395 0.60 0.14Petroleum & gas n/a n/a n/a n/a n/a n/a n/a n/a n/a n/a n/a n/a n/a n/aBusiness services 19 146 7.7 14.6 -0.7 0.4 0.45 -0.1 0.6 10,266 0.38 15,429 0.30 -0.08Grain milling n/a n/a n/a n/a n/a n/a n/a n/a n/a n/a n/a n/a n/a n/aRubber products n/a n/a n/a n/a n/a n/a n/a n/a n/a n/a n/a n/a n/a n/aGlass products n/a n/a n/a n/a n/a n/a n/a n/a n/a n/a n/a n/a n/a n/aPharmaceuticals n/a n/a n/a n/a n/a n/a n/a n/a n/a n/a n/a n/a n/a n/aSteel milling n/a n/a n/a n/a n/a n/a n/a n/a n/a n/a n/a n/a n/a n/aNonresidential building products n/a n/a n/a n/a n/a n/a n/a n/a n/a n/a n/a n/a n/a n/aTobacco products n/a n/a n/a n/a n/a n/a n/a n/a n/a n/a n/a n/a n/a n/aOptical equipment & instruments n/a n/a n/a n/a n/a n/a n/a n/a n/a n/a n/a n/a n/a n/aAppliances n/a n/a n/a n/a n/a n/a n/a n/a n/a n/a n/a n/a n/a n/aCopper & copper products n/a n/a n/a n/a n/a n/a n/a n/a n/a n/a n/a n/a n/a n/aHotels & transportation services 21 153 7.3 15.3 -0.2 0.5 0.59 0.1 0.8 11,436 0.48 19,863 0.47 -0.01Aerospace n/a n/a n/a n/a n/a n/a n/a n/a n/a n/a n/a n/a n/a n/aBreweries & distilleries n/a n/a n/a n/a n/a n/a n/a n/a n/a n/a n/a n/a n/a n/aLeather products n/a n/a n/a n/a n/a n/a n/a n/a n/a n/a n/a n/a n/a n/a
Total, establishments in VC sectors 82 556 6.8 55.4 -1.2 0.3 n/a n/a 2.9 23,852 0.88 20,560 0.43 -0.45
Total, all establishments 128 1,003 7.8 100.0 -0.6 0.3 n/a n/a 4.2 20,209 0.86 16,877 0.42 -0.44
Ratio chng
Note: El Paso data are from the Texas Workforce Commission (ES-202 file, confidential release). El Paso region is defined as the six county Upper Rio Grande region (El Paso, Hudspeth, Culberson, Jeff Davis, Presidio, and Brewster counties). US data are from the US Bureau of Labor Statistics, Quarterly Census of Employment and Wages. Clusters are not mutually exclusive. Data are only for businesses "covered" under unemployment insurance law and include only private sector establishments. CQGR: Compound quarterly growth rate. Sectors not assigned to any cluster include federal, state and local government; the US Postal Service; retail trade; basic consumer services; social services and religious organizations; and household employees.
Establishments
Employment
Location QuotientCQGR
2nd Quarter Payroll
Average Wage
Ratio to US
Ratio to US
Report Prepared by the Institute for Policy and Economic Development, UTEP; Ed Feser, UIUC: and Ken Poole, CREC 13
Summary trends, benchmark technology-based value chain clusters, 1991-2005North I10 Corridor (Hudspeth and Culberson Counties)
% all
Per estab- sectors N I-10 US Change IQ 2005
Clusters IQ 2005 IQ 2005 lishment IQ 2005 '91-'05 '91-'05 IQ 2005 '91-'05 mil $ 3Q 1991 IQ 2005
Chemicals n/a n/a n/a n/a n/a n/a n/a n/a n/a n/a n/a n/a n/a n/aPrecision instruments n/a n/a n/a n/a n/a n/a n/a n/a n/a n/a n/a n/a n/a n/aEngine equipment n/a n/a n/a n/a n/a n/a n/a n/a n/a n/a n/a n/a n/a n/aComputer & electronic equipment n/a n/a n/a n/a n/a n/a n/a n/a n/a n/a n/a n/a n/a n/aInformation services n/a n/a n/a n/a n/a n/a n/a n/a n/a n/a n/a n/a n/a n/aPharmaceuticals n/a n/a n/a n/a n/a n/a n/a n/a n/a n/a n/a n/a n/a n/aFertilizer & chemical products n/a n/a n/a n/a n/a n/a n/a n/a n/a n/a n/a n/a n/a n/aIndustrial machinery & distribution equip n/a n/a n/a n/a n/a n/a n/a n/a n/a n/a n/a n/a n/a n/aAerospace n/a n/a n/a n/a n/a n/a n/a n/a n/a n/a n/a n/a n/a n/aMedical instruments and optics n/a n/a n/a n/a n/a n/a n/a n/a n/a n/a n/a n/a n/a n/aMotor vehicles n/a n/a n/a n/a n/a n/a n/a n/a n/a n/a n/a n/a n/a n/aWiring devices & switches n/a n/a n/a n/a n/a n/a n/a n/a n/a n/a n/a n/a n/a n/aTechnical & research services n/a n/a n/a n/a n/a n/a n/a n/a n/a n/a n/a n/a n/a n/aCable manufacturing n/a n/a n/a n/a n/a n/a n/a n/a n/a n/a n/a n/a n/a n/aArchitectural & engineering services n/a n/a n/a n/a n/a n/a n/a n/a n/a n/a n/a n/a n/a n/a
Total, all Tech VC establishments n/a n/a n/a n/a n/a n/a n/a n/a n/a n/a n/a n/a n/a n/a
Total, all establishments 128 1,003 7.8 100.0 -0.6 0.3 n/a n/a 4.2 20,209 0.86 16,877 0.42 -0.44
Employment
Location QuotientCQGR
2nd Quarter Payroll
Average Wage Establishments
Note: El Paso data are from the Texas Workforce Commission (ES-202 file, confidential release). El Paso region is defined as the six county Upper Rio Grande region (El Paso, Hudspeth, Culberson, Jeff Davis, Presidio, and Brewster counties). US data are from the US Bureau of Labor Statistics, Quarterly Census of Employment and Wages. Clusters are not mutually exclusive. Data are only for businesses "covered" under unemployment insurance law and include only private sector establishments. CQGR: Compound quarterly growth rate. Sectors not assigned to any cluster include federal, state and local government; the US Postal Service; retail trade; basic consumer services; social services and religious organizations; and household employees.
Ratio to US
Ratio to US
Ratio chng

Upper Rio Grande Workforce Development Board Industry Cluster Analysis
South I-10 Corridor Benchmark Value Chain Cluster Results South of Interstate 10, Farming, Dairy, and Feed Products are still viable rural clusters, although Hotels and Transportation Services is the third largest employment cluster (1,163) in the region. This is due to Big Bend National Park and a myriad of ecotourism firms in the region. It should be noted that the same data limitations mentioned above apply to the South Interstate 10 corridor as well. The wood products cluster also shows some strength as a potential cluster in that its small number of firms had some concentration (LQ=.69) and showed growth well above that of the US 1991-2005. The rapid percentage growth, however, may be due to small overall employment totals.
Figure 25: South I-10 Corridor Benchmark Value Chain Clusters
Report Prepared by the Institute for Policy and Economic Development, UTEP; Ed Feser, UIUC: and Ken Poole, CREC 14
Farming, 738 Dairy products, 167 Feed products, 204
Construction, 184
Hotels & transportation services, 1,163
Wood products & furniture
-
5,000
10,000
15,000
20,000
25,000
30,000
35,000
0.00 2.00 4.00 6.00 8.00 10.00 12.00 14.00 16.00
Location Quotient
Ave
rage
Wag
e

Upper Rio Grande Workforce Development Board Industry Cluster Analysis
Table 13: Detailed Results South I-10 Benchmark Value Chain and Technology Based Clusters Summary trends, benchmark value chain clusters, 1991-2005South I10 Corridor (Jeff Davis, Presidio & Brewster Counties)
% all
Per estab- sectors S I-10 US Change IQ 2005
Clusters IQ 2005 IQ 2005 lishment IQ 2005 '91-'05 '91-'05 IQ 2005 '91-'05 mil $ 3Q 1991 IQ 2005
Textiles & apparel n/a n/a n/a n/a n/a n/a n/a n/a n/a n/a n/a n/a n/a n/aPackaged food products n/a n/a n/a n/a n/a n/a n/a n/a n/a n/a n/a n/a n/a n/aPlastics & rubber manufacturing n/a n/a n/a n/a n/a n/a n/a n/a n/a n/a n/a n/a n/a n/aAluminum & aluminum products n/a n/a n/a n/a n/a n/a n/a n/a n/a n/a n/a n/a n/a n/aBasic health services 97 581 6.0 11.6 1.8 0.6 0.24 0.1 5.1 16,955 0.57 34,894 0.76 0.19Mining n/a n/a n/a n/a n/a n/a n/a n/a n/a n/a n/a n/a n/a n/aFarming 43 738 17.2 14.7 1.0 -0.2 12.79 3.3 3.5 9,973 0.71 18,786 0.86 0.15Construction 48 184 3.8 3.7 0.7 0.6 0.20 -0.1 1.0 16,629 0.63 22,716 0.58 -0.05Financial services & insurance 57 352 6.2 7.0 1.1 0.5 0.24 0.0 2.6 19,867 0.66 29,676 0.47 -0.19Chemical-based products n/a n/a n/a n/a n/a n/a n/a n/a n/a n/a n/a n/a n/a n/aMachine tools n/a n/a n/a n/a n/a n/a n/a n/a n/a n/a n/a n/a n/a n/aPrecision instruments n/a n/a n/a n/a n/a n/a n/a n/a n/a n/a n/a n/a n/a n/aPrinting & publishing 12 43 3.6 0.9 1.2 0.1 0.23 0.0 0.4 14,940 0.53 37,906 0.73 0.20Metalworking & fabr metal products n/a n/a n/a n/a n/a n/a n/a n/a n/a n/a n/a n/a n/a n/aDairy products 36 167 4.6 3.3 -0.1 0.2 6.05 -4.4 0.8 10,092 0.47 19,190 0.64 0.16Nondurable industry machinery n/a n/a n/a n/a n/a n/a n/a n/a n/a n/a n/a n/a n/a n/aComputer & electronic equipment n/a n/a n/a n/a n/a n/a n/a n/a n/a n/a n/a n/a n/a n/aWood products & furniture n/a n/a n/a n/a n/a n/a n/a n/a n/a n/a n/a n/a n/a n/aConst machinery & distribution equip n/a n/a n/a n/a n/a n/a n/a n/a n/a n/a n/a n/a n/a n/aWood processing n/a n/a n/a n/a n/a n/a n/a n/a n/a n/a n/a n/a n/a n/aPaper n/a n/a n/a n/a n/a n/a n/a n/a n/a n/a n/a n/a n/a n/aConcrete, brick building products n/a n/a n/a n/a n/a n/a n/a n/a n/a n/a n/a n/a n/a n/aMotor vehicles n/a n/a n/a n/a n/a n/a n/a n/a n/a n/a n/a n/a n/a n/aWood building products n/a n/a n/a n/a n/a n/a n/a n/a n/a n/a n/a n/a n/a n/aPlastics products n/a n/a n/a n/a n/a n/a n/a n/a n/a n/a n/a n/a n/a n/aFeed products 45 204 4.5 4.1 -0.3 -0.1 2.59 -1.6 0.9 9,362 0.64 17,895 0.73 0.09Arts and media 77 431 5.6 8.6 1.3 0.3 0.32 0.0 3.4 12,758 0.46 31,115 0.65 0.19Higher education & hospitals 133 1,527 11.5 30.5 1.7 0.4 0.54 0.1 9.7 12,485 0.49 25,360 0.57 0.08Information services 83 400 4.8 8.0 1.3 0.4 0.27 0.0 4.6 25,634 0.80 46,293 0.82 0.02Petroleum & gas 11 120 10.9 2.4 0.7 -0.5 1.12 0.2 1.5 31,312 0.76 48,667 0.57 -0.18Business services 128 1,217 9.5 24.3 1.5 0.4 0.48 0.1 8.2 13,911 0.50 26,900 0.50 -0.01Grain milling n/a n/a n/a n/a n/a n/a n/a n/a n/a n/a n/a n/a n/a n/aRubber products n/a n/a n/a n/a n/a n/a n/a n/a n/a n/a n/a n/a n/a n/aGlass products n/a n/a n/a n/a n/a n/a n/a n/a n/a n/a n/a n/a n/a n/aPharmaceuticals n/a n/a n/a n/a n/a n/a n/a n/a n/a n/a n/a n/a n/a n/aSteel milling n/a n/a n/a n/a n/a n/a n/a n/a n/a n/a n/a n/a n/a n/aNonresidential building products n/a n/a n/a n/a n/a n/a n/a n/a n/a n/a n/a n/a n/a n/aTobacco products n/a n/a n/a n/a n/a n/a n/a n/a n/a n/a n/a n/a n/a n/aOptical equipment & instruments n/a n/a n/a n/a n/a n/a n/a n/a n/a n/a n/a n/a n/a n/aAppliances n/a n/a n/a n/a n/a n/a n/a n/a n/a n/a n/a n/a n/a n/aCopper & copper products n/a n/a n/a n/a n/a n/a n/a n/a n/a n/a n/a n/a n/a n/aHotels & transportation services 112 1,163 10.4 23.2 1.1 0.5 0.57 0.0 7.6 16,413 0.70 25,975 0.63 -0.08Aerospace n/a n/a n/a n/a n/a n/a n/a n/a n/a n/a n/a n/a n/a n/aBreweries & distilleries n/a n/a n/a n/a n/a n/a n/a n/a n/a n/a n/a n/a n/a n/aLeather products n/a n/a n/a n/a n/a n/a n/a n/a n/a n/a n/a n/a n/a n/a
Total, establishments in VC sectors 371 3,402 9.2 67.9 1.1 0.4 n/a n/a 21.9 14,404 0.54 25,710 0.55 0.01
Total, all establishments 567 5,007 8.8 100.0 1.0 0.3 n/a n/a 27.5 12,771 0.54 21,937 0.54 0.00
Ratio chng
Note: El Paso data are from the Texas Workforce Commission (ES-202 file, confidential release). El Paso region is defined as the six county Upper Rio Grande region (El Paso, Hudspeth, Culberson, Jeff Davis, Presidio, and Brewster counties). US data are from the US Bureau of Labor Statistics, Quarterly Census of Employment and Wages. Clusters are not mutually exclusive. Data are only for businesses "covered" under unemployment insurance law and include only private sector establishments. CQGR: Compound quarterly growth rate. Sectors not assigned to any cluster include federal, state and local government; the US Postal Service; retail trade; basic consumer services; social services and religious organizations; and household employees.
Establishments
Employment
Location QuotientCQGR
2nd Quarter Payroll
Average Wage
Ratio to US
Ratio to US
Summary trends, benchmark technology-based value chain clusters, 1991-2005South I10 Corridor (Jeff Davis, Presidio & Brewster Counties)
% all
Per estab- sectors S I-10 US Change IQ 2005
Clusters IQ 2005 IQ 2005 lishment IQ 2005 '91-'05 '91-'05 IQ 2005 '91-'05 mil $ 3Q 1991 IQ 2005
Chemicals n/a n/a n/a n/a n/a n/a n/a n/a n/a n/a n/a n/a n/a n/aPrecision instruments n/a n/a n/a n/a n/a n/a n/a n/a n/a n/a n/a n/a n/a n/aEngine equipment n/a n/a n/a n/a n/a n/a n/a n/a n/a n/a n/a n/a n/a n/aComputer & electronic equipment n/a n/a n/a n/a n/a n/a n/a n/a n/a n/a n/a n/a n/a n/aInformation services 16 119 7.4 2.4 0.8 0.7 0.52 -0.2 1.5 38,583 1.04 49,303 0.67 -0.37Pharmaceuticals n/a n/a n/a n/a n/a n/a n/a n/a n/a n/a n/a n/a n/a n/aFertilizer & chemical products n/a n/a n/a n/a n/a n/a n/a n/a n/a n/a n/a n/a n/a n/aIndustrial machinery & distribution equip n/a n/a n/a n/a n/a n/a n/a n/a n/a n/a n/a n/a n/a n/aAerospace n/a n/a n/a n/a n/a n/a n/a n/a n/a n/a n/a n/a n/a n/aMedical instruments and optics n/a n/a n/a n/a n/a n/a n/a n/a n/a n/a n/a n/a n/a n/aMotor vehicles n/a n/a n/a n/a n/a n/a n/a n/a n/a n/a n/a n/a n/a n/aWiring devices & switches n/a n/a n/a n/a n/a n/a n/a n/a n/a n/a n/a n/a n/a n/aTechnical & research services 18 103 5.7 2.1 2.8 0.8 0.31 0.1 1.3 15,509 0.44 50,614 0.82 0.38Cable manufacturing n/a n/a n/a n/a n/a n/a n/a n/a n/a n/a n/a n/a n/a n/aArchitectural & engineering services 16 35 2.2 0.7 1.0 0.8 0.14 0.0 0.4 15,267 0.41 45,134 0.66 0.25
Total, all Tech VC establishments 30 212 7.1 4.2 1.4 0.3 n/a n/a 2.7 34,142 0.96 50,670 0.77 -0.19
Total, all establishments 567 5,007 8.8 100.0 1.0 0.3 n/a n/a 27.5 12,771 0.54 21,937 0.54 0.00
Employment
Location QuotientCQGR
2nd Quarter Payroll
Average Wage Establishments
Note: El Paso data are from the Texas Workforce Commission (ES-202 file, confidential release). El Paso region is defined as the six county Upper Rio Grande region (El Paso, Hudspeth, Culberson, Jeff Davis, Presidio, and Brewster counties). US data are from the US Bureau of Labor Statistics, Quarterly Census of Employment and Wages. Clusters are not mutually exclusive. Data are only for businesses "covered" under unemployment insurance law and include only private sector establishments. CQGR: Compound quarterly growth rate. Sectors not assigned to any cluster include federal, state and local government; the US Postal Service; retail trade; basic consumer services; social services and religious organizations; and household employees.
Ratio to US
Ratio to US
Ratio chng
Report Prepared by the Institute for Policy and Economic Development, UTEP; Ed Feser, UIUC: and Ken Poole, CREC 15
Upper Rio Grande Workforce Development Board Industry Cluster Analysis
Strategic Recommendations to Support Cluster and Regional Growth Based on the findings from the cluster analysis as well as input from a series of seven industry cluster focus groups, a number of potential strategies were identified to address the training and educational needs of the region’s workforce. In the following pages, the proposed recommendations that might be implemented are divided into two major categories: strategic cross-cutting (region wide) recommendations and cluster-specific actions. The cross-cutting recommendations are aimed at improving the quality of the region’s overall workforce and would assist growing companies in almost any cluster (as does the occupation approach below). The cluster-specific suggestions are aimed at addressing specific gaps identified by industry leaders to reinforce economic and workforce development efforts targeted to that cluster.
Strategic Cross-cutting Recommendations The cross-cutting recommendations are aimed at reinforcing the creative leadership guiding regional workforce investments as Board-related training initiatives, many are targeted to broader efforts aimed at broader educational needs and strategies to respond to industry demand that includes talent attraction as well as development efforts. Increase the participation/representation from targeted clusters on the Workforce Board:
• The Upper Rio Grande Workforce Development Board (WDB) should engage representatives from several targeted clusters including information services, financial services, construction trades, healthcare, logistics/border security, and tourism industries to participate in board activities. While some of these industries may be/are already involved with the Board, it is crucial that the Board engage CEOs of companies in these industries to participate in Board planning and program implementation issues. An important way to engage these stakeholders is to focus certain WDB meetings on broad topics specific to one or more of these industries while minimizing the WDB time spent on managing specific program activities. The WDB will want to delegate program management activities as much as possible to its staff and retain an oversight role, reviewing program performance toward addressing the needs of its targeted clusters.
Develop a collaborative campaign with UTEP to attract talented students from outside the region to go to school in El Paso
• Almost every cluster representative noted the severe talent shortage available as El Paso loses its best and brightest to other areas of the country (especially Phoenix, Dallas, and Houston). UTEP is well-known as a commuter school with a reported 95 percent of students from the greater El Paso region. While some of the region’s best students go away to college, the El Paso region does not have a reputation for attracting students from other parts of the country. The region has a number of advantages that might appeal to students, especially those interested in developing an international education. The WDB should work with UTEP to develop a proactive student recruitment campaign aimed at attracting and retaining outside students to the region.
Expand existing efforts to increase access to “career-oriented” internships for students of regional universities
Report Prepared by the Institute for Policy and Economic Development, UTEP; Ed Feser, UIUC: and Ken Poole, CREC 16
• Any campaign to attract students to the region should be supplemented with a retention strategy. The best way to retain the region’s brightest graduates is to help them become “connected” while they are in school. This is a particular challenge for students who are not from the El Paso region. The WDB should explore collaborative efforts with UTEP to expand the number of students with access to part-time “career-oriented” jobs. Frequently, smaller companies are willing to take on one or two interns, but the companies need guidance in identifying appropriate linkages to the university and possibly even filtering potential candidates. This is time that small companies without a human resources office rarely have so possible internship opportunities are never offered. By creating a formal system targeted to the area’s smallest companies in the

Upper Rio Grande Workforce Development Board Industry Cluster Analysis
WDB’s targeted clusters, El Paso may be able to provide immediate job opportunities and help retain students who might otherwise seek jobs outside the region.
Create pro-active initiative to provide career counseling information to area middle school and high school counselors, teachers, students (and their parents) regarding entry-level occupations in targeted clusters
• The WDB should develop a formalized effort to work with area schools to enhance the information provided to young adults about career opportunities – especially in the targeted clusters. A number of approaches might be used to accomplish this goal, including providing access to web-based tools designed to provide students with information about careers of interest as well as creating a network of adults who might serve as mentors for students seeking information about careers of interest. Several models of these types of initiatives exist across the country. One example is Future4Kids (www.f4k.org), a nonprofit based in North Carolina that works with school systems in building just such technology-driven career counseling support.
Collaborate with existing initiatives in the region aimed at encouraging more entrepreneurial behaviors among area workers – encouraging them to consider creating their own jobs
• For many rural and smaller metropolitan areas, the key to economic prosperity is related to the region’s ability to foster innovation and new business formation. In many of the targeted clusters, workers with experience can become successful entrepreneurs. The WDB should support “how-to-create-a-business” seminars and curricula in all of their education and training initiatives. The Board should collaborate with the area small business development center to offer information about creating a business for those who may be interested in taking that route to employment.
Assist area school systems in their efforts to implement reforms and encourage school efforts to ensure that students have basic skills and are computer literate
• Almost every business person interviewed agreed that area schools are not adequately preparing students for the workplace. This opinion is being expressed in every community across the nation. Businesses indicate that they are not expecting fully trained workers, but they do expect to hire high school graduates who can read instructions, perform basic computational tasks, work in teams, and solve problems creatively. Others noted that schools no longer provide basic vocational skills for students that are not going on to college and this limits students’ exposure to many potentially lucrative career opportunities. If the schools were successful in addressing these challenges, the training job facing the WDB would be a bit less daunting. The WDB must actively participate in school reform discussions and offer their perspectives on potential solutions.
Analyze the specific jobs and related contracting opportunities being created at Fort Bliss to identify occupational skill needs associated with the expected influx of new workers and new jobs
• Fort Bliss is expected to receive about 20,000 new military and civilian personnel in the next few years. If it has not already done so, the WDB should sponsor research to determine the specific skills of the new jobs being brought to El Paso and determine which ones will likely need to be filled by local workers. Likewise, the Board should examine the skills of incoming spouses to determine what types of jobs they will require and provide that information to economic developers to help guide job creation efforts. The Board may also wish to use the information about in-migrating spouses to develop specialized training programs aimed at targeted clusters that represent the greatest opportunity for new job creation, including financial services, health care, and information technology.
Advocate to academic leadership and Austin policy makers on behalf of area universities to expand their support for targeted clusters
Report Prepared by the Institute for Policy and Economic Development, UTEP; Ed Feser, UIUC: and Ken Poole, CREC 17
Upper Rio Grande Workforce Development Board Industry Cluster Analysis
• The WDB should take an advocacy role in encouraging UTEP, EPCC and Sul Ross as the universities expand to fill the ever increasing education and research needs of the El Paso region. Among the advocacy positions that the Board could take would include: o supporting research in related cluster areas at UTEP and regional universities; o offering more incentives in the tenure-granting process to faculty who collaborate with area
companies; o encouraging entrepreneurship among the college’s faculty members; and o expanding curriculum related to the WDB’s targeted industry clusters.
Provide support for financial literacy and information about the importance of “asset-building” as a life skill for all residents that is integrated into basic education curriculum
• The Workforce Board should work closely with area social service agencies to support programs aimed at improving the economic position of low and moderate income individuals in the region. Financial literacy is a critical building-block on which to help workers succeed of all income categories. Building on programs offered by the military for its young recruits as well as other existing programs, the Workforce Board can expand the availability of this curriculum to all area high school, college, and entry level workers. The Board may need to identify incentives (such as successful program completers would be eligible to receive a $100 Certificate of Deposit or some similar “bonus”) to encourage broad participation in the program.
Cluster-specific Recommendations
Not only should the WDB support broad initiatives, it should also design its training and program activities to respond to the specific needs among the Existing, Emerging, and Potential clusters. The targeted clusters of particular interest to the WDB include: (a) information services and engineering; (b) construction trades; (c) financial services, (d) health care; and for rural counties in particular (e) tourism. The clusters were determined through a combination of quantitative analysis and qualitative research. Based on focus group discussions with local experts as well as our understanding of the efforts underway in other areas of the country, we propose the following a potential actions to help in enhancing the competitiveness of the labor force for each of these industry clusters. The actions are all designed to support job creation and workforce preparation efforts.
Information Services and Engineering Support economic development agency efforts to recruit defense contractors to service Fort Bliss, border security needs
• This task might be accomplished by collaborating with economic developers in designing a recruitment strategy that includes proactive identification of workforce training options to support likely defense contractors.
Support UTEP and the and technology specific initiatives to expand software engineering, database management, and network administration educational programs
• A number of local companies noted a need for added computer software engineers and analysts. They also noted that UTEP and other technology trainers as a critical resource. The Workforce Board should collaborate with these institutions to ensure the programs continue to expand.
Review and support available training programs designed to provide introduction to computer programming
• Many companies noted that they sought access to semi-skilled workers who had some exposure to basic principles of computer programming. The primary benefit of this exposure is to provide an introduction to the field for young adults and potential entry level workers. These programs might be offered through vocational high school or community college programs.
Report Prepared by the Institute for Policy and Economic Development, UTEP; Ed Feser, UIUC: and Ken Poole, CREC 18
Upper Rio Grande Workforce Development Board Industry Cluster Analysis
Develop/support career information and internship opportunities in computing careers
• By supporting an internship program, the Workforce Board will expand links between existing El Paso companies and education/training options such as UTEP’s engineering and computer sciences as well as area trade schools. The focus of the internship program should be on helping small area companies access 1 or 2 interns at a time and to encourage those companies to use these internships as a technique for finding possible new workers.
Collaborate with economic developers to support informal networking events among area information services companies
• The focus of these networking events would be on any topics of interest to the companies, but one area of particular interest will be on strategies designed to recruit and retain employees. The events might also include topics related to identifying career opportunities for talented young adults at regional universities or similar topics.
Encourage/support efforts by UTEP, EPCC and Sul Ross and technical schools to expand the educational curriculum for engineering and computer technicians to include design and design-for-production concepts
• Some experts report that existing higher educational curriculum is too oriented to traditional engineering and computer science theory. To respond more effectively to the knowledge-driven economy, educational programs should integrate computer-aided design into all aspects of the region’s engineering programs.
Construction Trades
Support efforts to expand apprenticeship programs in collaboration with area companies
• The Workforce Board should focus its limited resources on efforts aimed at expanding the capacity of local training and educational institutions to meet critical shortages expected in carpentry, electrical, painting, first-line supervising, and flexible construction laborers region-wide. Many apprenticeship programs are reactive, allowing open enrollment for anyone who expresses an interest. Few of these applicants are motivated by gaining a career opportunity. Instead, many are interested in apprenticeships primarily as a short-term avenue for gaining access to a job. Since the apprenticeship program represents a significant investment for the company, the public sector, and the individual, it is incumbent that apprenticeship slots be reserved for those most motivated to complete the program.
• Given the general public policy interest in offering opportunities for minorities and women and the
willingness of minorities and women to participate in apprenticeships, continued efforts should be targeted to encouraging women and minority apprentices. The images associated with these advertisements should demonstrate the participation of minorities currently working in the trades or participating in apprenticeships. The increased number of women and minorities in the construction trade also provide additional stream of laborers that can help reduce the pressure of the labor shortages in the construction industry.
• To support expansion of the apprenticeships, the WDB might also provide more funding for
“apprenticeship financial aid” (to supplement tuition or wages) to allow the apprentice to attend full-time training courses. This will help apprentices to learn the required skills in a shorter period of time and allow them to work full-time for the industry without as much of a classroom commitment during work days.
Develop a program in collaboration with regional SBDC to provide entrepreneurial training for sub-contracting opportunities and management training for potential sub-contractors
Report Prepared by the Institute for Policy and Economic Development, UTEP; Ed Feser, UIUC: and Ken Poole, CREC 19

Upper Rio Grande Workforce Development Board Industry Cluster Analysis
One of the most important ways to increase workforce participation in the trades may well be to help motivated workers understand potential opportunities for owning their own business. This is an invaluable approach in expanding the availability of sub-contractors in the region. Several ideas could help in expanding the number of trades-related entrepreneurs including:
• Incorporate more management training into the apprenticeship program, especially for occupations in which the technician may be managing apprentices, laborers, or helpers. Effective management may reduce the drop-out rate by apprentices and help to reduce the high turnover rate that burdens many contractors.
• Provide entrepreneurial training that helps technicians and first-line supervisors understand the elements of running a business, including how to estimate jobs, administer payrolls, manage cash flow, make investment decisions, and choose good employees.
• Provide a “construction trades extension service” program to provide on-going support to firm managers. The purpose of the service is to increase awareness about and use of the latest in building materials technologies or methods for improving efficiency and quality in construction.
• Support efforts to expand the availability of skilled managers with technical experience in construction-related fields.
Many construction trades firms reported that skilled managers are in short supply. Three strategies might be employed to expand the number of managers available to support the industry:
• Support the development/expansion of construction management degree program at UTEP and of construction management certification and related credits at community college/technical schools.
• Create a “management” apprenticeship in which technicians are put into “assistant management training” aimed at developing competent and respected first-line supervisors, both from a technical perspective (as in the supervisor learns about trades not within his or her area of expertise) as well as providing management experience.
• Develop an initiative to encourage high school students, entry-level workers, and apprentices to move into these target occupations.The WDB might also develop a proactive program to communicate opportunities and wages for construction trades occupations to high school students and young adults. The program should include a career pathway map that demonstrates how continuously improving skills can enhance their earning power.
Financial Services Explore the availability of existing financial services certification/licensing programs relative to needs to support entry level financial services staff for banking and insurance
• Many financial services firms are currently hiring, but they are increasingly requiring staff to obtain training and certification in order to maintain their jobs. The WDB should conduct an analysis of the demand for additional workers in this field, an assessment of available training programs, and identify gaps that might help guide its investment in appropriate initiatives.
Offer more specific educational curriculum and enhance relationships with business and universities to expose students to financial services careers
• The Workforce Development Board should develop a network of financial services firm representatives and related educational program managers to help in framing the educational needs and responses for the financial services cluster. The network would meet to review existing challenges, identify appropriate program models, and design plans for implementing those plans. If appropriate, the network might serve as a specialized ad hoc committee of the WDB.
Encourage community colleges to offer training in marketing and sales
Report Prepared by the Institute for Policy and Economic Development, UTEP; Ed Feser, UIUC: and Ken Poole, CREC 20

Upper Rio Grande Workforce Development Board Industry Cluster Analysis
• Several financial service firms noted that marketing and sales skills are critical for workers in the field. The Workforce Board should collaborate with regional universities to develop and implement a marketing and sales program targeted for financial services workers.
Health care
Encourage expansion of educational programs (including Fast Track) to train teachers for nursing and other technical health care occupations
• One of the fastest growing industries is health care, and El Paso is an important center for basic health care services. The area needs to meet a shortage of skilled nurses, medical technicians, and medical administrative workers. The shortage is due in part to a lack of training slots available. The Workforce Development Board should continue to expand its efforts to increase the number of teachers for health care-related occupational training.
Logistics and Border Security
Expand training for truck drivers (CDLs) and trucking maintenance
• El Paso is an important location for the North American trucking industry and logistics firms are in need of more drivers and maintenance workers. The WDB should work with the community college to expand the availability of these programs.
Identify training opportunities related to occupations in logistics management and data analysis
• Increasingly logistics firms manage a substantial amount of data. The Workforce Board should assess how many more administrative workers will be required to serve the field and support efforts to expand training available for logistics managers and data analysts. These jobs will be particularly important as border security initiatives are implemented during the coming years.
Work in collaboration with local economic development partners to foster the development of specialty transportation firms
• The WDB should encourage would-be jobseekers with experience to consider alternatives in entrepreneurship in logistics management, transportation, and security fields. Career counseling efforts should include information about new business development opportunities.
Tourism Provide access to customer service and sales training to support the hospitality industry
• The hospitality industry is an important job creator in rural regions and El Paso. The local universities (Sul Ross) should examine the availability of programs that they offer to ensure that they are providing appropriate sales and service support training.
Provide continued support to the “master’s guides program”
• The rural communities, especially in the Big Bend area of the state, rely on outdoor tourism activities. The WDB should collaborate closely with area colleges and training institutes to expand on existing “master guides programs” and other initiatives to support the workforce needs of area tourism operators.
Encourage proprietor start-ups of tourism- and agricultural-related businesses
Report Prepared by the Institute for Policy and Economic Development, UTEP; Ed Feser, UIUC: and Ken Poole, CREC 21
• Working in collaboration with the local SBDC and area universities, the WDB should support counseling in entrepreneurship and training in business management for area job-seekers

Upper Rio Grande Workforce Development Board Industry Cluster Analysis
interested in creating tour operator firms, eco-tourism enterprises, or similar small business operations.
Explore opportunities for creating hospitality management and entrepreneurial business management programs at Sul Ross State University
Report Prepared by the Institute for Policy and Economic Development, UTEP; Ed Feser, UIUC: and Ken Poole, CREC 22
• The WDB should examine the availability of and support the development of new programs in related hospitality and business management programs at area universities, especially in the WDB’s rural region.

Upper Rio Grande Workforce Development Board Industry Cluster Analysis
Targeted Occupations: Industry Forecast and Application of Occupational Matrix Having identified cluster strengths in the region, it is possible to perform industry level forecasts to help select industries that would benefit from training assistance. Industries, however, are composed of individuals from a variety of different occupations—as even the construction industry, for example, employs accountants. Provided below is an overview of a web based system (temporarily http://tools.utep.edu/iped) that will allow Workforce Board planners and policy makers to target training based on forecast industry growth. The system allows users to track clusters, individual industries, and the region as a whole (all industries at a detailed level). The latter is provided because overall job growth in some occupations—while vital to a cluster—may not be sufficiently large to attract or warrant training dollars. This has been the case in the past, but policy makers might consider programs which train for high skill occupations in large groups—such as tuition assistance for engineers or architects—to provide highly skilled labor to the region in addition to intermediate skill training.
The System: Employment Correspondence Estimates Between NAICS (4-digit) – SOC (6-digit) The IPED NAICS-SOC Estimates web interface is a query system that allows users to link industry employment with occupational employment. Since industries employ a multitude of occupations, the program allows users to query all occupations and their employment and wage information. These data are employed by individual or several 2-, 3-, or 4-digit NAICS industry groups or by the pre-defined value-chain or technology cluster groups indicated in this report. The occupations information is the output, which the program provides, while the industry information is the input, which the user enters. Furthermore, the occupations output is provided as a baseline and forecast. The baseline tells the user current employment and wages per occupation from the designated industry or industries while the forecast tells the user expected future employment in the same occupations. Forecasts are based on the IPED Border Model. Wages are current wages based on latest available data and include average, entry and median wages. To obtain a regional occupation-industry employment mix, one key assumption is made – the program assumes that the regional occupation-industry mix is identical to the United States mix. The program calculates a set of ratios of occupational employment at the national level and maps these ratios to a designated regional industry employment number to obtain the regional mix. The employment number can be entered manually or calculated automatically from internal databases (a manual entry can act as a baseline or forecast, allowing the analyst to control for a specific employment number and answer “what if?” questions). The rationale for assuming that the regional employment mix is similar to the national mix is two-fold. First, detailed occupational-industry estimates are only provided at the national level. This approach is the best alternative given missing data at both the state (TWC) and regional levels. Second, assuming that the regional mix is similar to the national mix provides valuable insight about the regional economy. Analysts can identify gaps and opportunities by triangulating regional mix results based on national ratios with other available regional information. For example, analysis of Basic Health Services shows that the occupation 319091 Dental Assistants has significant employment and growth potential and currently pays an entry wage of $10.39. Most current occupations data from the TWC for the region also show that dental assistants comprise about 0.14 percent of all occupations in the URG region, versus 0.21 percent at the national level. The TWC also projects the occupation to add roughly 150 new jobs by the year 2012, while IPED estimates provided as part of the economy-wide projections show this occupation adding roughly 180 new jobs by 2014. In this occupation example, the analyst can see that dental assistants earn a relatively high entry wage and an even better median wage. The analyst can also identify a potential gap and growth opportunity since relative to the nation the region employs less of its labor supply in this occupation and is expected to add a substantial number of jobs. Clearly, using the national mix as a proxy identifies potential regional occupational employment opportunities and their wages which can be easily verified with current regional data.
Report Prepared by the Institute for Policy and Economic Development, UTEP; Ed Feser, UIUC: and Ken Poole, CREC 23
Upper Rio Grande Workforce Development Board Industry Cluster Analysis
The IPED NAICS-SOC Estimates web interface also provides economy-wide baseline and forecast information on occupations for the region (versus occupations per subsets of the economy such as clusters or various industry groups as discussed above). This part of the program provides two sets of estimates. The first set of estimates uses current TWC occupations data for the region and, hence, does not assume parity with the national mix. The second set of estimates does assume similarity between the regional and national industry-occupational mix. Similar to the above discussion, these latter estimates are provided to identify potential gaps and opportunities in occupations taking the nation as reference.
Region Wide and Cluster Specific Applications Targeted occupations can be drawn from any of the clusters above—whether they are applied as Existing, Emerging, or potential. This does not, however, guarantee that there will be sufficient job growth by specific occupation in each of the clusters to support the allocation of training dollars. This is because several hundred occupations might be necessary for any given six digit industry to function properly. Instead, there must be sufficient job growth overall—region wide—to make training for specific occupations worthwhile (Table 14 below). The inclusion of the cluster industries in this system allows users to tie overall industry standard occupational classification needs to cluster standard occupational classification needs. The combination of the two will allow the Workforce Board to support growth in the entire region while being mindful of and tracking occupation needs for identified clusters. Overall results are presented below, while a full list of all occupations and growth for the Workforce Board region is provided in Appendix B.
Report Prepared by the Institute for Policy and Economic Development, UTEP; Ed Feser, UIUC: and Ken Poole, CREC 24

Upper Rio Grande Workforce Development Board Industry Cluster Analysis
Table 14: Upper Rio Grande Top Job Growth Occupations
2004 2014
000000 Total, All Occupations 262,850 300,565 37,715 14.35% $13.82 $6.47 $17.49 $10.30
353021 Combined Food Preparation and Serving Wo1 8,680 10,976 2,296 26.45% $6.38 $5.92 $6.61 $6.26399021 Personal and Home Care Aides 3,870 5,726 1,856 47.95% $6.06 $5.89 $6.14 $6.14291111 Registered Nurses 4,360 5,723 1,363 31.25% $24.10 $16.00 $28.15 $24.27353031 Waiters and Waitresses 4,550 5,888 1,338 29.41% $6.43 $5.90 $6.69 $6.19412031 Retail Salespersons 11,140 12,260 1,120 10.05% $8.68 $5.93 $10.05 $7.49412011 Cashiers 7,950 9,032 1,082 13.61% $7.02 $5.93 $7.56 $6.72434051 Customer Service Representatives 4,030 5,081 1,051 26.09% $11.44 $8.54 $12.89 $11.33533032 Truck Drivers, Heav
2345678 y and Tractor-Trailer 5,250 6,248 998 19.00% $14.44 $9.53 $16.90 $13.86
252021 Elementar9 y school teachers, except special e 4,750 5,669 919 19.35% $21.16 $21.46311011 Home Health Aides 1,710 2,593 883 51.61% $6.70 $5.94 $7.08 $6.38333051 Police and Sheriff's Patrol Officers 2,140 2,908 768 35.90% $20.92 $15.48 $23.64 $21.57372011 Janitors and Cleaners, Except Maids and H
101112 o 4,560 5,320 760 16.67% $7.39 $5.98 $8.10 $6.77
252031 Secondary school teachers, except special 13 a 3,200 3,923 723 22.58% $21.06 $21.28111021 General and Operations Mana14 gers 3,510 4,102 592 16.87% $36.09 $16.57 $45.85 $29.86259041 Teacher assistants 2,220 2,802 582 26.23% $25.75 $25.52339032 Security Guards 3,140 3,705 565 18.00% $8.35 $5.97 $9.54 $6.99439061 Office Clerks, General 5,620 6,169 549 9.76% $9.33 $6.43 $10.78 $8.76472061 Construction Laborers 2,240 2,787 547 24.44% $8.92 $6.94 $9.91 $8.78311012 Nursing Aides, Orderlies, and Attendants 1,680 2,211 531 31.58% $8.98 $7.13 $9.91 $8.39352014 Cooks, Restaurant 1,860 2,325 465 25.00% $7.54 $6.33 $8.15 $7.61499042 Maintenance and Repair Workers, General 2,900 3,358 458 15.79% $11.33 $7.04 $13.48 $10.18434171 Receptionists and Information Clerks 1,820 2,251 431 23.68% $8.58 $6.41 $9.66 $8.08434111 Interviewers, Except Eligibility and Loan 1,650 2,063 413 25.00% $12.52 $8.06 $14.76 $12.41351012 First-Line Supervisors/Mana
15161718192021222324 gers of Food Pre 1,910 2,281 371 19.44% $11.50 $6.88 $13.82 $10.40
319092 Medical Assistants 660 1,006 346 52.38% $9.94 $7.23 $11.29 $9.37533022 Bus Drivers, School 1,790 2,131 341 19.05% $8.08 $6.12 $9.05 $7.43252022 Middle school teachers, except special and
252627 v 2,430 2,770 340 14.00% $20.17 $19.97
533033 Truck Drivers, Li28 ght or Delivery Services 2,000 2,333 333 16.67% $12.14 $6.67 $14.88 $9.46352021 Food Preparation Workers 1,170 1,482 312 26.67% $6.97 $5.96 $7.47 $6.89411011 First-Line Supervis./Mana
2930 gers of Retail Sale 2,820 3,113 293 10.39% $16.42 $10.00 $19.63 $14.13
433011 Bill and Account Collectors 920 1,196 276 30.00% $10.80 $8.16 $12.12 $10.12132011 Accountants and Auditors 1,280 1,543 263 20.51% $24.62 $16.60 $28.63 $22.94436011 Executive Secretaries & Administrative Assi
313233 s 2,350 2,599 249 10.61% $14.41 $10.45 $16.39 $13.48
373011 Landscapin34 g and Groundskeeping Workers 1,200 1,447 247 20.59% $7.99 $5.99 $8.99 $7.68292061 Licensed Practical and Licensed Vocational 1,040 1,268 228 21.88% $16.59 $13.14 $18.32 $16.15472111 Electricians 980 1,203 223 22.73% $17.66 $12.73 $20.13 $18.10359011 Dinin
353637 g Room and Cafeteria Attendants and B 880 1,100 220 25.00% $6.15 $5.89 $6.27 $6.16
399011 Child Care Workers 1,180 1,400 220 18.64% $6.61 $5.92 $6.96 $6.38252041 Special education teachers, preschool, kind
3839 e 680 884 204 30.00% $21.48 $21.33
251194 Vocational Education Teachers, Postsecond 520 715 195 37.50% $16.10 $10.49 $18.90 $14.47412021 Counter and Rental Clerks 1,110 1,295 185 16.67% $8.39 $5.89 $9.64 $7.11431011 First-Line Supervisors/Managers of Office a
404142 n 2,820 3,005 185 6.56% $17.65 $10.80 $21.08 $16.67
333021 Detectives and Criminal Investi43 gators 640 823 183 28.57% $26.41 $18.41 $30.41 $25.46292052 Pharmac44 y Technicians 600 780 180 30.00% $11.58 $9.59 $12.58 $10.99319091 Dental Assistants 360 540 180 50.00% $11.92 $10.39 $12.68 $11.95359031 Host & Hostess, Restaurant, Loun
4546 ge & Coffe 650 827 177 27.27% $6.20 $5.92 $6.34 $6.23
211012 Educational, Vocational, and School Couns47 e 620 797 177 28.57% $22.71 $17.05 $25.54 $23.56537062 Laborers & Freight, Stock & Material Mover48 s 6,530 6,703 173 2.65% $7.83 $5.99 $8.76 $6.97472031 Carpenters 1,290 1,458 168 13.04% $10.23 $8.26 $11.22 $9.91359021 Dishwashers 950 1,118 168 17.65% $6.15 $5.90 $6.27 $6.18
Entry Experienced Median
2004 Hourly Wages
Avg.
Rank SOC SOC TitleURG Emp. Estimates Emp. Jobs
Growth 2004-2014
Emp. Rate Growth 2004-
2014
4950
An example of total growth is provided in the table above (Table 14), which shows URGWDB area total occupational growth to 2014 (37,715). By 25 on the absolute growth list (medical assistants), only about 35 new jobs will be created per year (in addition to replacement). While this may support Basic Health cluster, absolute growth may not warrant training dollars in the same way that growth in registered nurses may (close to 100 new jobs per year). Thus, while both occupations support the Basic Health cluster, only registered nurses shows substantial absolute growth that would warrant training dollars, particularly given the higher than average entry wage. Further, an SOC such as school teachers also warrants particular attention since teachers do not fall into one of the productive industries measured by the Benchmark Value Chain or technology based clusters. Teachers not only earn higher than average wages, but help the region overcome low levels of educational attainment, a benefit to all clusters, Existing, Emerging, or Potential. Provided as an example of cluster SOC cluster growth are the Basic Health and Construction (Tables 15-18). These tables demonstrate that beyond the top few occupations, very few occupations exhibit the growth that may be the necessary catalyst for training dollars—a key reason to group higher skill occupations and develop a strategy to expand high skill training. The tables also demonstrate how system output can be used to select cluster occupations by wage level. Those that do may not meet entry wage thresholds established by the Board over time.
Report Prepared by the Institute for Policy and Economic Development, UTEP; Ed Feser, UIUC: and Ken Poole, CREC 25

Upper Rio Grande Workforce Development Board Industry Cluster Analysis
Table 15: Upper Rio Grande Basic Health Services Cluster Top Job Growth Occupations
2005 2015
Total Basic Health Services Cluster 42,385 58,065 15,680 $6.47 $10.30
537062 Laborers & freight, stock & material movers 1,843 2,524 682 $5.99 $6.97414012 Sales reps, wholesale & manufacturing, ex
12 c 1,685 2,308 623 $10.26 $18.58
372011 Janitors & cleaners, except maids & house3 k 1,585 2,171 586 $5.98 $6.77439061 Office clerks, general 1,460 2,000 540 $6.43 $8.76291111 Registered nurses 957 1,311 354 $16.00 $24.27434051 Customer service representatives 931 1,276 345 $8.54 $11.33434171 Receptionists and information clerks 902 1,236 334 $6.41 $8.08373011 Landscapin
45678 g and groundskeeping workers 899 1,232 333 $5.99 $7.68
433031 Bookkeepin9 g, accounting and auditing clerk 867 1,187 321 $7.83 $11.29436014 Secretaries, except le10 gal, medical and exec 788 1,080 292 $6.63 $9.54132011 Accountants and auditors 717 983 265 $16.60 $22.94231011 Law
1112 yers 696 953 257 $25.69 $44.69
111021 General and operations mana13 gers 673 922 249 $16.57 $29.86436011 Executive secretaries and administrative as14 s 654 896 242 $10.45 $13.48431011 First-line supervisors/managers of office an15 d 621 851 230 $10.80 $16.67512092 Team assemblers 573 785 212 $5.98 $6.82319092 Medical assistants 570 781 211 $7.23 $9.37319091 Dental assistants 497 681 184 $10.39 $11.95533032 Truck drivers; heavy and tractor-traile
16171819 r 490 671 181 $9.53 $13.86
436013 Medical secretaries 474 649 175 $7.20 $9.14311011 Home health aides 469 643 174 $5.94 $6.38414011 Sales representatives; wholesale and manu 465 637 172 $18.00 $29.49433021 Billing and posting clerks and machine ope
20212223 r 463 634 171 $7.53 $10.06
537064 Packers and packagers; hand 458 628 170 $5.95 $6.54435081 Stock clerks and order fillers 450 617 167 $5.96 $7.73533033 Truck drivers; light or delivery services 444 608 164 $6.67 $9.46436012 Legal secretaries 442 605 164 $11.29 $14.48433011 Bill and account collectors 428 586 158 $8.16 $10.12435071 Shipping; receiving; and traffic clerks 428 586 158 $7.07 $9.63419041 Telemarketers 426 583 157 $7.30 $9.94
* Highlighted - Occupations that pay entry wages between $7 and $9.
SOC TitleSOCEmp. Rank
URG Emp. Estimates from U.S. NAICS-SOC
EstimatesEmp. Growth
2005-2015URG Hourly Entry Wage
URG Hourly Median Wage
24252627282930
Report Prepared by the Institute for Policy and Economic Development, UTEP; Ed Feser, UIUC: and Ken Poole, CREC 26

Upper Rio Grande Workforce Development Board Industry Cluster Analysis
Table 16: Upper Rio Grande Basic Health Services Cluster Top Job Growth Occupations between $9.50 and $11.00
2002 2012 2005 2015
Total Basic Health Services Cluster 98.13% 42,385 58,065 15,680 $6.47 $10.30
c499012 Control and valve installers and repairers; ex137 0.01% 4 6 2 $10.99 $13.99194091 Environmental science and protection technic138 i 0.06% 24 33 9 $10.93 $14.63431011 First-line supervisors/managers of office and 139 a 1.47% 621 851 230 $10.80 $16.67499052 Telecommunications line installers and repair140 e 0.01% 6 8 2 $10.80 $19.87472152 Plumbers; pipefitters; and steamfitters 0.04% 16 22 6 $10.74 $14.79211091 Health educators 0.03% 13 18 5 $10.63 $14.25119031 Education administrators; preschool and child 0.00% 0 0 0 $10.61 $13.09433061 Procurement clerks 0.06% 24 33 9 $10.55 $13.66251194 Vocational education teachers; postsecondar
141142143144145 y 0.00% 1 1 0 $10.49 $14.47
434061 Eli146 gibility interviewers; government programs 0.00% 1 2 0 $10.49 $15.11436011 Executive secretaries and administrative assi147 s 1.54% 654 896 242 $10.45 $13.48472161 Plasterers and stucco masons 0.00% 1 1 0 $10.44 $12.59173019 Drafters; all othe
148149 r 0.02% 10 14 4 $10.41 $16.45
319091 Dental assistants 1.17% 497 681 184 $10.39 $11.95434141 New accounts clerks 0.00% 0 1 0 $10.30 $12.25435011 Car
150151152 go and freight agents 0.01% 6 8 2 $10.27 $13.37
414012 Sales representatives; wholesale and manufa153 c 3.97% 1,685 2,308 623 $10.26 $18.58211021 Child; family; and school social workers 0.05% 19 27 7 $10.25 $15.04492011 Computer; automated teller; and office machi
154155 n 0.27% 115 158 43 $10.23 $13.55
493031 Bus and truck mechanics and diesel engine s156 p 0.19% 82 113 30 $10.18 $13.30194099 Life; physical; and social science technicians; 0.05% 23 31 8 $10.12 $15.05472021 Brickmasons and blockmasons 0.01% 5 7 2 $10.06 $12.94131022 Wholesale and retail buyers; except farm pro
157158159 d 0.25% 108 148 40 $10.05 $17.40
411011 First-line supervisors/managers of retail sales 0.14% 60 82 22 $10.00 $14.13531021 First-line supervisors/managers of helpers; la
160161 b 0.18% 78 107 29 $9.99 $13.34
271025 Interior designers 0.05% 21 28 8 $9.97 $16.84492096 Electronic equipment installers and repairers; 0.00% 2 2 1 $9.95 $11.34271024 Graphic designers 0.11% 48 66 18 $9.85 $13.46435041 Meter readers; utilities 0.00% 1 1 0 $9.84 $10.84519071 Jewelers and precious stone and metal work
162163164165166 e 0.01% 5 7 2 $9.76 $13.74
519051 Furnace; kiln; oven; drier; and kettle operator167 s 0.00% 0 0 0 $9.68 $14.28211015 Rehabilitation counselors 0.03% 11 15 4 $9.59 $13.16292052 Pharmacy technicians 0.06% 27 36 10 $9.59 $10.99519012 Separating; filtering; clarifying; precipitating; a
168169170 n 0.03% 13 18 5 $9.56 $14.44
533032 Truck drivers; heavy and tractor-traile171 r 1.16% 490 671 181 $9.53 $13.86439022 Word processors and t172 ypists 0.17% 74 102 27 $9.52 $11.85173012 Electrical and electronics drafters 0.05% 22 30 8 $9.51 $15.34292012 Medical and clinical laboratory technicians 0.26% 112 154 41 $9.50 $11.93531011 Aircraft car
173174175 go handling supervisors 0.00% 0 0 0 $9.50 $11.97
* Highlighted - Occupations with significant employment.
URG Emp. Estimates from U.S. NAICS-SOC
EstimatesEmp. Growth
2005-2015URG Hourly Entry Wage
URG Hourly Median Wage
Entry Wage Rank
Emp. Growth 2002-2012
URG Emp. Estimates from TWC
Report Prepared by the Institute for Policy and Economic Development, UTEP; Ed Feser, UIUC: and Ken Poole, CREC 27
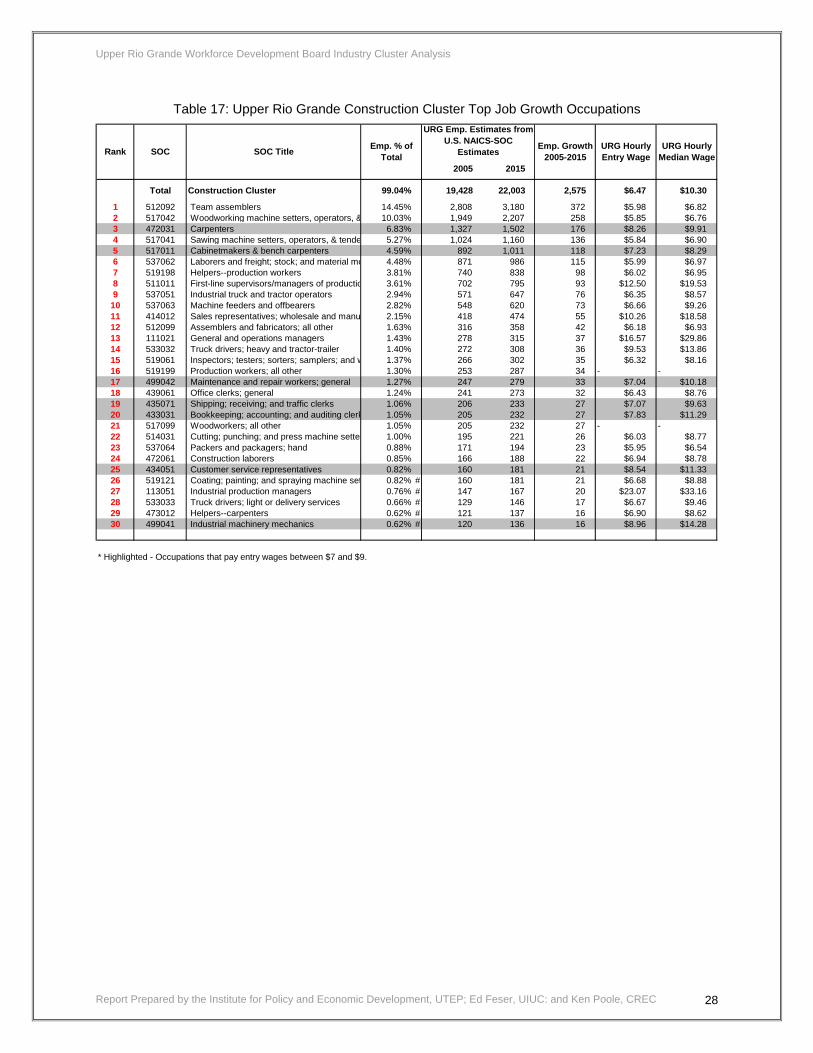
Upper Rio Grande Workforce Development Board Industry Cluster Analysis
Table 17: Upper Rio Grande Construction Cluster Top Job Growth Occupations
2005 2015
Total Construction Cluster 99.04% 19,428 22,003 2,575 $6.47 $10.30
12
512092 Team assemblers 14.45% 2,808 3,180 372 $5.98 $6.82517042 Woodworking machine setters, operators, & 10.03% 1,949 2,207 258 $5.85 $6.76472031 Carpenters 6.83% 1,327 1,502 176 $8.26 $9.91517041 Sawin
34 g machine setters, operators, & tende 5.27% 1,024 1,160 136 $5.84 $6.90
517011 Cabinetmakers & bench carpenters 4.59% 892 1,011 118 $7.23 $8.29537062 Laborers and frei
56 ght; stock; and material mo 4.48% 871 986 115 $5.99 $6.97
519198 Helpers--production workers 3.81% 740 838 98 $6.02 $6.95511011 First-line supervisors/mana
78 gers of productio 3.61% 702 795 93 $12.50 $19.53
537051 Industrial truck and tractor operators 2.94% 571 647 76 $6.35 $8.57537063 Machine feeders and offbearers 2.82% 548 620 73 $6.66 $9.26414012 Sales representatives; wholesale and manu 2.15% 418 474 55 $10.26 $18.58512099 Assemblers and fabricators; all othe
9101112 r 1.63% 316 358 42 $6.18 $6.93
111021 General and operations managers 1.43% 278 315 37 $16.57 $29.86533032 Truck drivers; heavy and tractor-trailer 1.40% 272 308 36 $9.53 $13.86519061 Inspectors; testers; sorters; samplers; and
131415 w 1.37% 266 302 35 $6.32 $8.16
519199 Production workers; all other 1.30% 253 287 34 - -499042 Maintenance and repair workers; general 1.27% 247 279 33 $7.04 $10.18439061 Office clerks; general 1.24% 241 273 32 $6.43 $8.76435071 Shipping; receiving; and traffic clerks 1.06% 206 233 27 $7.07 $9.63433031 Bookkeeping; accounting; and auditing cler
1617181920 k 1.05% 205 232 27 $7.83 $11.29
517099 Woodworkers; all other 1.05% 205 232 27 - -514031 Cutting; punching; and press machine sette 1.00% 195 221 26 $6.03 $8.77537064 Packers and packa
212223 gers; hand 0.88% 171 194 23 $5.95 $6.54
472061 Construction laborers 0.85% 166 188 22 $6.94 $8.78434051 Customer service representatives 0.82% 160 181 21 $8.54 $11.33519121 Coatin
242526 g; painting; and spraying machine set 0.82% # 160 181 21 $6.68 $8.88
113051 Industrial production mana27 gers 0.76% # 147 167 20 $23.07 $33.16533033 Truck drivers; li28 ght or delivery services 0.66% # 129 146 17 $6.67 $9.46473012 Helpers--carpenters 0.62% # 121 137 16 $6.90 $8.62499041 Industrial machiner
2930 y mechanics 0.62% # 120 136 16 $8.96 $14.28
* Highlighted - Occupations that pay entry wages between $7 and $9.
Rank SOC SOC Title Emp. % of Total
URG Emp. Estimates from U.S. NAICS-SOC
EstimatesEmp. Growth
2005-2015URG Hourly Entry Wage
URG Hourly Median Wage
Report Prepared by the Institute for Policy and Economic Development, UTEP; Ed Feser, UIUC: and Ken Poole, CREC 28

Upper Rio Grande Workforce Development Board Industry Cluster Analysis
Table 18: Upper Rio Grande Construction Cluster Top Job Growth Occupations between $9.50 and $11.00
2005 2015
Total Construction Cluster 99.04% 19,428 22,003 2,575 $6.47 $10.30
y299011 Occupational health and safet44 specialists 0.02% # 3 3 0 $11.83 $13.28492094 Electrical and electronics repairers; comme45 r 0.01% # 2 3 0 $11.72 $16.63537021 Crane and tower operators 0.02% # 4 5 1 $11.46 $14.33131071 Employment; recruitment; and placement s
4647 p 0.01% # 2 3 0 $11.20 $15.25
151041 Computer support specialists 0.10% # 20 22 3 $11.16 $15.91531031 First-line supervisors/mana
4849 gers of transport 0.14% # 27 30 4 $11.11 $18.04
413099 Sales representatives; services; all othe50 r 0.06% # 12 13 2 $11.01 $22.12431011 First-line supervisors/managers of office an51 d 0.50% # 98 111 13 $10.80 $16.67472152 Plumbers; pipefitters; and steamfitters 0.12% # 23 26 3 $10.74 $14.79433061 Procurement clerks 0.04% # 7 8 1 $10.55 $13.66436011 Executive secretaries and administrative as
525354 s 0.43% # 84 96 11 $10.45 $13.48
173019 Drafters; all other 0.10% # 20 22 3 $10.41 $16.45414012 Sales representatives; wholesale and manu 2.15% # 418 474 55 $10.26 $18.58493031 Bus and truck mechanics and diesel engine 0.03% # 5 6 1 $10.18 $13.30131022 Wholesale and retail buyers; except farm p
55565758 r 0.02% # 4 4 0 $10.05 $17.40
411011 First-line supervisors/managers of retail sal59 e 0.02% # 4 4 0 $10.00 $14.13531021 First-line supervisors/mana60 gers of helpers; l 0.30% # 58 66 8 $9.99 $13.34271025 Interior desi61 gners 0.02% # 3 3 0 $9.97 $16.84271024 Graphic desi62 gners 0.02% # 4 4 0 $9.85 $13.46519051 Furnace; kiln; oven; drier; and kettle operat63 o 0.31% # 60 68 8 $9.68 $14.28519012 Separating; filtering; clarifying; precipitating; 0.01% # 2 3 0 $9.56 $14.44533032 Truck drivers; heavy and tractor-trailer 1.40% # 272 308 36 $9.53 $13.86434161 Human resources assistants; except payrol
646566 l 0.17% # 34 38 4 $9.42 $12.81
433051 Pa67 yroll and timekeeping clerks 0.21% # 41 47 5 $9.38 $12.86514111 Tool and die makers 0.04% # 7 8 1 $9.38 $17.20499043 Maintenance workers; machiner
6869 y 0.25% # 48 54 6 $9.25 $12.87
173011 Architectural and civil drafters 0.18% # 36 41 5 $9.14 $14.21419099 Sales and related workers; all other 0.04% # 7 8 1 $9.12 $12.56
* Highlighted - Occupations with significant employment.
URG Emp. Estimates from U.S. NAICS-SOC
EstimatesEmp. Growth
2005-2015URG Hourly Entry Wage
URG Hourly Median WageRank SOC SOC Title Emp. % of
Total
7071
Report Prepared by the Institute for Policy and Economic Development, UTEP; Ed Feser, UIUC: and Ken Poole, CREC 29
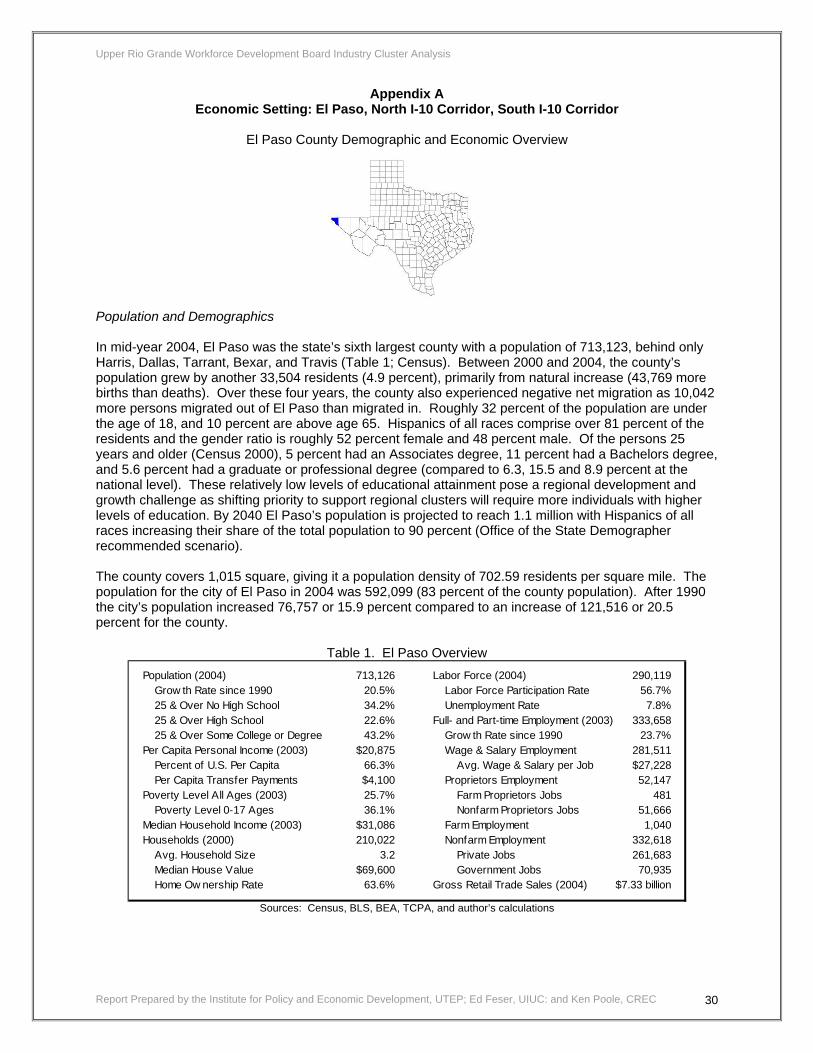
Upper Rio Grande Workforce Development Board Industry Cluster Analysis
Appendix A Economic Setting: El Paso, North I-10 Corridor, South I-10 Corridor
El Paso County Demographic and Economic Overview
Population and Demographics In mid-year 2004, El Paso was the state’s sixth largest county with a population of 713,123, behind only Harris, Dallas, Tarrant, Bexar, and Travis (Table 1; Census). Between 2000 and 2004, the county’s population grew by another 33,504 residents (4.9 percent), primarily from natural increase (43,769 more births than deaths). Over these four years, the county also experienced negative net migration as 10,042 more persons migrated out of El Paso than migrated in. Roughly 32 percent of the population are under the age of 18, and 10 percent are above age 65. Hispanics of all races comprise over 81 percent of the residents and the gender ratio is roughly 52 percent female and 48 percent male. Of the persons 25 years and older (Census 2000), 5 percent had an Associates degree, 11 percent had a Bachelors degree, and 5.6 percent had a graduate or professional degree (compared to 6.3, 15.5 and 8.9 percent at the national level). These relatively low levels of educational attainment pose a regional development and growth challenge as shifting priority to support regional clusters will require more individuals with higher levels of education. By 2040 El Paso’s population is projected to reach 1.1 million with Hispanics of all races increasing their share of the total population to 90 percent (Office of the State Demographer recommended scenario). The county covers 1,015 square, giving it a population density of 702.59 residents per square mile. The population for the city of El Paso in 2004 was 592,099 (83 percent of the county population). After 1990 the city’s population increased 76,757 or 15.9 percent compared to an increase of 121,516 or 20.5 percent for the county.
Table 1. El Paso Overview
Sources: Census, BLS, BEA, TCPA, and author’s calculations
Report Prepared by the Institute for Policy and Economic Development, UTEP; Ed Feser, UIUC: and Ken Poole, CREC 30
Population (2004) 713,126 Labor Force (2004) 290,119Grow th Rate since 1990 20.5% Labor Force Participation Rate 56.7%25 & Over No High School 34.2% Unemployment Rate 7.8%25 & Over High School 22.6% Full- and Part-time Employment (2003) 333,65825 & Over Some College or Degree 43.2% Grow th Rate since 1990 23.7%
Per Capita Personal Income (2003) $20,875 Wage & Salary Employment 281,511Percent of U.S. Per Capita 66.3% Avg. Wage & Salary per Job $27,228Per Capita Transfer Payments $4,100 Proprietors Employment 52,147
Poverty Level All Ages (2003) 25.7% Farm Proprietors Jobs 481Poverty Level 0-17 Ages 36.1% Nonfarm Proprietors Jobs 51,666
Median Household Income (2003) $31,086 Farm Employment 1,040Households (2000) 210,022 Nonfarm Employment 332,618
Avg. Household Size 3.2 Private Jobs 261,683Median House Value $69,600 Government Jobs 70,935Home Ow nership Rate 63.6% Gross Retail Trade Sales (2004) $7.33 billion

Upper Rio Grande Workforce Development Board Industry Cluster Analysis
Economy Historically, El Paso, like other large southern border cities, has developed a concentration of economic activity resulting from its geographic location – in government, manufacturing, retail trade, and transportation and distribution services. Manufacturing, retail trade, transportation, and various service industries have a strong positive correlation to economic activity in Cd. Juárez, in particular to its maquiladora export production. In this respect, El Paso functions both as a land port for transshipments and as a binational regional production network for the North American market (small border cities, such as Nogales and Laredo, function purely as land ports or intermediaries).7 Professional, business, educational, and health services will be important sectors for employment growth in El Paso as the economy transitions from primarily intermediate production and distribution to more diversified sectors driven by regional demand from population growth and personal income. Education and proper regional planning to induce higher paying industries will determine the extent of this structural change. Unemployment, Income and Government El Paso’s jobless rate has historically been well above the nation and state but has narrowed slightly over the past few years. The county’s unemployment rate of 7.8 percent in 2004 was 2.3 (Table 1; BLS) and 1.7 percentage points above the nation and Texas annual averages, respectively. Correlated to high unemployment is poverty, which afflicts 1 in 4 of the county’s population with the poverty level greater among children (17 and under) (Table 1; Census). In 2004, El Paso’s labor force participation rate which measures an economy’s ability to provide jobs, and its labor force’s willingness to seek jobs was 56.7 percent (Table 1), compared to national and Texas participation rates of 64.5 and 65.3 percent, respectively. This low participation rate may either be a function of culture or discouraged job seekers who no longer count themselves as part of the workforce.
Figure 1. Unemployment Rates (in percents)
Source: BLS
High jobless rates, poverty levels, and low labor force participation rates—as well as low per capita income levels and educational attainment—have also characterized southern border regions, including El Paso.8 Regional population growth (almost doubling since 1970), from both legal and illegal immigration and high birth rates, has fueled a threefold growth in gross regional product (from $5.5 billion in 1970 to $15.4 billion in 2000) and boosted real purchasing power by 54 percent in the last three decades.9 However, this rapid growth has outstripped any employment gains and has contributed to the area’s low per capita income. El Paso’s per capita income in 2003 of $20,875 stood at two-thirds the national level of $31,472 and 71.8 percent the state level of $29,074 (Table 1; BEA). Ten years earlier in 1993, per capita income in the county was $17,506 (in 2003 real dollars – adjusted for inflation), 64.4 percent the national level and 70.5 percent the state level. Per capita transfer payments totaled $4,100 in 2003, meaning that 19.6 percent (almost 1 out of every 5 dollars) of the county’s per capita income came from transfer payments
Report Prepared by the Institute for Policy and Economic Development, UTEP; Ed Feser, UIUC: and Ken Poole, CREC 31
0
2
4
6
8
10
2000 2001 2002 2003 2004
U.S. Texas El Paso

Upper Rio Grande Workforce Development Board Industry Cluster Analysis
(compared to the U.S.’ 14.6 percent and Texas’ 12.8 percent). Increasing per capita income growth relative to the United States and Texas and shifting to a greater share of income based on earnings and dividends, interest and rent at the expense of transfer payments are critical to narrowing the income and poverty gaps. A concentration of public programs (state and federal) attempting to address the economic and educational disadvantages, as well as the military and border enforcement, have made government at all levels an integral part of the region’s employment base. The area’s relatively young population (almost one-third is under 18 years old), The University of Texas at El Paso (UTEP), UTEP School of Nursing, Texas Tech University Health Science Center, and El Paso Community College have increased local government demand for teachers at all levels. The Immigration and Naturalization Service enforcement along the border, U.S. Customs Service enforcement at the international bridges, various other state and federal agencies that track and monitor international flows, and the large military presence at Fort Bliss10 are the other government presence in the region that also play a role in regional economic development and government. Employment Full- and part-time employment in El Paso reached 333,658 in 2003. The top six employers in El Paso are public sector entities. Healthcare and telecommunication firms dominate the top ten private sector employers (Tables 2 and 3). All but two of the top ten employers are government related. The largest nonfarm, private employment sectors in El Paso are 1) retail trade, 2) health care and social assistance, 3) manufacturing, and 4) accommodation and food services (Figure 2).
Table 2. 2003 Top Ten Public Employers Table 3. 2003 Top Ten Private Employers Rank Name of Employer Workers
1 El Paso Independent School District 8,6632 Fort Bliss (civilian employees) 6,6203 Ysleta Independent School District 6,5004 City of El Paso 6,2645 The University of Texas at El Paso 4,8716 Socorro Independent School District 3,9957 El Paso Community College 3,7288 County of El Paso 2,7009 Thomason General Hospital 1,80010 Department of Homeland Security 1,786
Rank Name of Employer Workers1 Sierra Providence Health Netw ork 3,7612 Wal-Mart 3,7063 Las Palmas & Del Sol Healthcare System 2,2444 Echostar Satellite Corp. 2,0125 MCI Services 1,7906 West Teleservices Corp. 1,5007 Sahara, Inc. (natl. center for disabled emp.) 1,3698 Big 8 Food Stores 1,2209 Providian Financial 1,01010 Yazaki North America (EWD & Elcom) 1,000
SSource: City of El Paso, Dept. of Economic Development
Figure 2. 2003 Nonfarm Employment by Industry Breakdown
Retail Trade12.5%
Health Care & Social
Asst.9.4%
Admini. & Waste
Services6.7%
Other38.0%
Local Govt.12.5%
Construction5.4%
Accom. & Food
Services7.0%
Manufacturing
8.5%
Source: BEA
Report Prepared by the Institute for Policy and Economic Development, UTEP; Ed Feser, UIUC: and Ken Poole, CREC 32
ource: City of El Paso, Dept. of Economic Development

Upper Rio Grande Workforce Development Board Industry Cluster Analysis
The economy has already witnessed a major structural change away from low-skill, low-wage manufacturing. The same cost advantages that first brought maquiladoras to Cd. Juárez as alternatives to production in Asia impacted the El Paso garment industry. Interior Mexican, Central American, and Asian regions with significant wage differentials displaced El Paso’s production of apparel. Coinciding with the passage of NAFTA, the once predominant labor-intensive garment industry started to relocate (Figure 3).11 El Paso total manufacturing also began a decline coinciding with the passage of NAFTA, but non-apparel manufacturing has provided a cushion by outpacing the job losses absorbed by apparel. Some argue that only specialized apparel manufacturing will survive in El Paso, which may likely the case given the shift that has occurred in other regions of the United States that previously focused on apparel.
Figure 3. El Paso Declining Apparel Manufacturing
* The increase in wages during a time of falling employment may be attributed to the severance packages based on years of employment received y the large number of laid off Levis Strauss workers (some worked for over 2 decades).
Source: TWC, LMI Even with the wage-driven relocations of garment-related activities, manufacturing continues to play an important role in the economy’s employment base. Manufacturing employment was at its highest point in 1994 coinciding with the peak in apparel manufacturing. By 2003, the manufacturing sector employed 28,248 (NAICS based). The current top manufacturers in El Paso include:
Table 4. 2004 El Paso Top Manufacturers
1. Electrolux Co. 2. Toro Co. 3. Delphi Packard Electric 4. Jobe Concrete Products Inc. 5. Joseph Pollack Corp. 6. VF Jeanswear 7. Autotronic Controls Corp. 8. Helen of Troy Ltd. 9. Leviton Manufacturing Co. 10. Phelps Dodge Refining Corp. 11. Stoneridge Electronics Inc.
Source: TWC According to the Texas Workforce Commission, in the fall of 2004 El Paso had approximately 4,601 establishments that employed 10 or more employees. Of these employers, 0.2 percent employed over 1000 employees, 0.8 percent employed between 500 and 999 employees, 7.9 percent employed between 100 and 499 employees, 11.6 percent employed between 50 and 99 employees, 31.8 percent employed between 20 and 49 employees, and the remaining 47.8 percent employed between 10 and 19 employees. The Commission classifies El Paso’s economic base as of average diversity, suggesting that the area has employment across a sufficient number of industrial sectors to withstand some economic decline in key sectors or from a national downturn.
Report Prepared by the Institute for Policy and Economic Development, UTEP; Ed Feser, UIUC: and Ken Poole, CREC 33
17,0
37
20,1
02
21,5
98
20,8
93
20,0
79
18,8
31
17,4
29
14,9
16
12,1
08
10,5
93
9,30
7
7,29
9
4,56
5
16,1
50
$201
$244
$304
$342 $344 $349 $331$312
$338
$259$240
$193$180
$120
0
5,000
10,000
15,000
20,000
25,000
1990 1992 1994 1996 1998 * 2000 2002
(em
ploy
men
t)
$0
$50
$100
$150
$200
$250
$300
$350
(wages in m
illions of dollars)
Employment Wages

Upper Rio Grande Workforce Development Board Industry Cluster Analysis
Retail Sales Retail sales are an interesting activity in the El Paso economy, particularly since regional self-service industries such as retail are not covered in the cluster method used in this report. In El Paso, service industries such as retail service not only El Paso but Cd. Juárez as well. While personal income is the primary determinant of the city’s retail trade sales, the sector is very much dependent on purchases from Mexican nationals and, to a lesser extent, on sales to southern New Mexico. Local and regional economists estimate that between 15 and 30 percent of El Paso retail sales are derived from Mexican nationals. This applies to many southern border towns whose downtowns are heavily reliant on cross-border purchases.12 El Paso in part fulfills Cd. Juárez and Chihuahua state residents’ demands for goods and services in everything from clothing to financial and health services, to automobiles and home furnishings. During times of peso devaluations or inflationary periods, for example, Cd. Juárez residents are known to buy expensive items in El Paso to avoid high financing costs in their own country.13
The retail trade sector has grown substantially as the regional population base (including new military) continues to expand consumption at all levels. Gross retail trade sales activity reached $7.33 billion in 2004, an all time high and an increase of $3.07 billion (72.1 percent) since 1992 (Figure 4). Not surprisingly, direct anomalies in El Paso retail sales can be attributed to specific Mexican impacts (Figure 4); the first being in 1995, the year after the massive peso devaluation that crippled the Mexican economy, and the second in 1997, the year following México instituting a $50 import limit of U.S. goods for its nationals without declaration. The latter coincided with relocations away from the city by the El Paso Natural Gas headquarters and the 3rd Armored Cavalry at Fort Bliss, both of which also weakened sales. A third impact coincided with the 2001 national recession that affected both Cd. Juárez and El Paso. Military troops and their families have a substantial impact on retail sales and employment. These military expenditures are proportional, reducing (increasing) retail trade activity as base populations are removed from (brought into) the regional economy.14 As a net troop recipient from the Base Realignment and Closure (BRAC) process Fort Bliss and the consequent contract and troop spending will have an immediate and direct impact on retail purchases. Retail trade activity in general will continue to rise as it is directly tied to population growth (via birth rates or in-migration) on both sides of the border.
Figure 4. Gross Retail Trade Sales (in billions of dollars)
Source: TCPA
Border Crossings and Trade El Paso County is located on the important east-west I-10 corridor and links vehicle and freight traffic between Texas, New Mexico, Arizona, and California. It also is one of the three primary north-south ports of entry for trade and population flows between the United States and Mexico.
Report Prepared by the Institute for Policy and Economic Development, UTEP; Ed Feser, UIUC: and Ken Poole, CREC 34
0
1
2
3
4
5
6
7
8
88 90 92 94 96 98 00 02 04
Bill
ions
1994 peso devaluation
Mexican trade restriction and El Paso relocations

Upper Rio Grande Workforce Development Board Industry Cluster Analysis
Of the 25 ports of entry along the U.S.-Mexico border, the port of El Paso in 2004 was the second largest southern port of entry in northbound pedestrian and passenger vehicle crossings, 3rd in cargo truck crossings, 4th in train crossings, and 5th in bus crossings (Table 5; El Paso is actually the 2nd largest pedestrian and vehicle crossing port nationwide including the U.S.-Canada border). El Paso plays a key role to the drayage and logistics component of the just-in-time system between the United States and Mexico. While ranking 3rd in cargo truck crossings, El Paso’s international bridges handle the second most of all southern border trade, roughly $44.67 billion of the total $231.92 billion or almost one-fifth of all trade (Figure 6; in 1994 the port recorded $18.17 billion in trade). Almost all trade and truck traffic that pass through El Paso are related to the maquiladora industry or in-bond processing. The importance of international trade along this corridor has resulted in a substantial number of jobs related to trucking, warehousing, customs brokerage, freight forwarding, and other related services. The majority of trade through this region is related to the in-bond or maquiladora industry. Cd. Juárez is Mexico’s largest maquiladora employer and has rebounded along with the nation in its activities from the 2001 recession that contracted demand for manufactured goods. Trade and cargo crossings will continue from this industry, particularly since the industry supplies for higher end electronic and automotive producers, which are not as vulnerable to wage arbitrage from Central America and Asia.
Table 5. 2003 U.S. Southern Port Rankings of Incoming Border Crossings
Source: BTS
Figure 6. 2004 Southern Border Trade
Source: Census, compiled by Texas Center for Border Economic and Enterprise Development
Report Prepared by the Institute for Policy and Economic Development, UTEP; Ed Feser, UIUC: and Ken Poole, CREC 35
2004 Exports
Laredo38,639.640.5%
Other3,346.23.5%
El Paso18,635.019.6%
Hidalgo6,660.77.0%
Del Rio1,267.41.3%
Eagle Pass3,341.93.5%
Otay Mesa-San Ysidro
9,063.59.5%
Calexico-Calexico East
4,327.84.5%
Nogales4,259.84.5%
Brownsville-Cameron5,749.96.0%
2004 Imports
Laredo52,702.638.6%
San Diego4,741.83.5%
Hidalgo10,604.2
7.8%
Brownsville-Cameron5,366.13.9%
Other5,908.84.3% Eagle Pass
3,555.62.6%
Nogales7,978.65.8%
Calexico-Calexico East
5,947.54.4%
El Paso26,030.919.1%
Otay Mesa-San Ysidro13,792.610.1%
Port Trucks Port Pedestrians Port Vehicles
Laredo, TX 1,391,850 San Ysidro, CA 9,457,600 San Ysidro, CA 17,621,030
Otay Mesa/San Ysidro, CA 726,164 El Paso, TX 8,441,671 El Paso, TX 14,817,206
El Paso, TX 719,545 Nogales, AZ 6,131,407 Brownsville, TX 7,211,401
Hidalgo, TX 454,351 Calexico, CA 4,847,096 Hidalgo, TX 7,183,674
Calexico East, CA 312,227 Laredo, TX 4,507,105 Laredo, TX 6,725,119

Upper Rio Grande Workforce Development Board Industry Cluster Analysis
North I-10: Culberson County Economic Overview
In 2004, Culberson’s had 2,727 (Table 6; Census), making it the 231st largest county in Texas. Since 2000, the county’s population has declined by 248 (-8.3 percent) and by 680 since Census 1990 (-20 percent). The entirety of the decline is due to negative net internal migration of 389, meaning that there were 389 more residents that left the area permanently than new residents that migrated into Culberson. Roughly 31 percent of the population are under the age of 18, and 12 percent are above age 65. Hispanics of all races comprise 72 percent of the residents, and the gender ratio is roughly 50-50. Of the persons 25 years and older (Census 2000) 2.6 percent had an Associates degree, 10.3 percent had a Bachelors degree, and 3.6 percent had a graduate or professional degree (compared to 6.3, 15.5 and 8.9 percent at the national level). By 2040 the Office of the State Demographer forecasts Culberson’s population to grow above 3,000, but the projections do not take into account the negative net internal migration taking place in the county. Consequently, current migration patterns make future population estimates for Culberson difficult to assess. Culberson covers 3,813 square miles, giving it a population density of 0.72 residents per square mile, down from 0.78 residents per square mile in 2000. The county seat and major city in Culberson is Van Horn, which had a 2004 population of 2,240 (82 percent of the county population). Van Horn’s population has dropped substantially, going from 2,930 in the 1990 Census to 2,435 in 2000.
Table 6. Economic Overview
Sources: Census, BLS, BEA, TCPA, and author’s calculations
Per capita personal income in Culberson in 2003 was $15,522 (Table 6; BEA). This was less than half (49.3 percent) the national per capita income level of $31,472. Ten years earlier in 1993, per capita income in the county was $13,515 (in 2003 real dollars – adjusted for inflation), 49.7 percent the national level. In ten years the gap in per capita income and consequent economic well-being of resident’s has shown no improvement relative the nation. Per capita transfer payments totaled $4,615 in 2003, meaning that 29.7 percent (almost 1 in 3 dollars) of the county’s per capita income originates from transfer payments (compared to the U.S.’ 14.6 percent and Texas’ 12.8 percent). Poverty is relatively high in
Report Prepared by the Institute for Policy and Economic Development, UTEP; Ed Feser, UIUC: and Ken Poole, CREC 36
Population (2004) 2,727 Labor Force (2004) 1,550Grow th Rate since 1990 -20.0% Labor Force Participation Rate 77.5%25 & Over No High School 43.9% Unemployment Rate 5.7%25 & Over High School 27.6% Full- and Part-time Employment (2003) 1,48025 & Over Some College or Degree 28.5% Grow th Rate since 1990 -15.1%
Per Capita Personal Income (2003) $15,522 Wage & Salary Employment 1,050Percent of U.S. Per Capita 49.3% Avg. Wage & Salary per Job $21,394Per Capita Transfer Payments $4,615 Proprietors Employment 430
Poverty Level All Ages (2003) 23.1% Farm Proprietors Jobs 120Poverty Level 0-17 Ages 33.9% Nonfarm Proprietors Jobs 310
Median Household Income (2003) $23,850 Farm Employment 176Households (2000) 1,052 Nonfarm Employment 1,304
Avg. Household Size 2.8 Private Jobs 934Median House Value $32,500 Government Jobs 370Home Ow nership Rate 70.8% Gross Retail Trade Sales (2004) $81.72 million
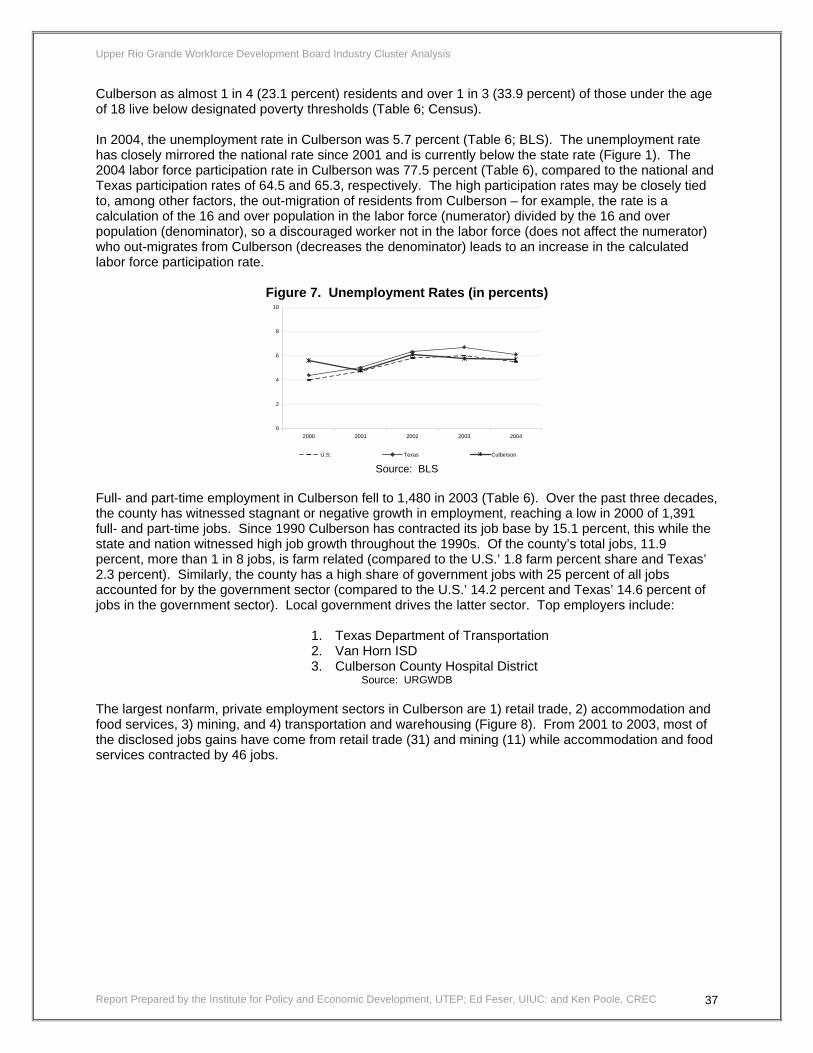
Upper Rio Grande Workforce Development Board Industry Cluster Analysis
Culberson as almost 1 in 4 (23.1 percent) residents and over 1 in 3 (33.9 percent) of those under the age of 18 live below designated poverty thresholds (Table 6; Census). In 2004, the unemployment rate in Culberson was 5.7 percent (Table 6; BLS). The unemployment rate has closely mirrored the national rate since 2001 and is currently below the state rate (Figure 1). The 2004 labor force participation rate in Culberson was 77.5 percent (Table 6), compared to the national and Texas participation rates of 64.5 and 65.3, respectively. The high participation rates may be closely tied to, among other factors, the out-migration of residents from Culberson – for example, the rate is a calculation of the 16 and over population in the labor force (numerator) divided by the 16 and over population (denominator), so a discouraged worker not in the labor force (does not affect the numerator) who out-migrates from Culberson (decreases the denominator) leads to an increase in the calculated labor force participation rate.
Figure 7. Unemployment Rates (in percents)
Source: BLS
Full- and part-time employment in Culberson fell to 1,480 in 2003 (Table 6). Over the past three decades, the county has witnessed stagnant or negative growth in employment, reaching a low in 2000 of 1,391 full- and part-time jobs. Since 1990 Culberson has contracted its job base by 15.1 percent, this while the state and nation witnessed high job growth throughout the 1990s. Of the county’s total jobs, 11.9 percent, more than 1 in 8 jobs, is farm related (compared to the U.S.’ 1.8 farm percent share and Texas’ 2.3 percent). Similarly, the county has a high share of government jobs with 25 percent of all jobs accounted for by the government sector (compared to the U.S.’ 14.2 percent and Texas’ 14.6 percent of jobs in the government sector). Local government drives the latter sector. Top employers include:
1. Texas Department of Transportation 2. Van Horn ISD 3. Culberson County Hospital District
Source: URGWDB The largest nonfarm, private employment sectors in Culberson are 1) retail trade, 2) accommodation and food services, 3) mining, and 4) transportation and warehousing (Figure 8). From 2001 to 2003, most of the disclosed jobs gains have come from retail trade (31) and mining (11) while accommodation and food services contracted by 46 jobs.
Report Prepared by the Institute for Policy and Economic Development, UTEP; Ed Feser, UIUC: and Ken Poole, CREC 37
0
2
4
6
8
10
2000 2001 2002 2003 2004
U.S. Texas Culberson

Upper Rio Grande Workforce Development Board Industry Cluster Analysis
Figure 8. 2003 Nonfarm Employment by Industry Breakdown
Source: BEA. Only includes disclosed data.
According to the Texas Workforce Commission, in the fall of 2004 Culberson had roughly 39 establishments that employed 10 or more employees. Of these employers, 2.6 percent employed between 50 and 99 employees, 28.2 percent employed between 20 and 49 employees, and 69.2 percent employed between 10 and 19 employees. The Commission reports Culberson to have an economic base of below average diversity with employment distributed and developed across few industries. With few job development strategies available, the economy is more susceptible to adverse economic activity. Manufacturing activities are limited in Culberson. The top manufacturers are related to mining – Milwhite Inc. is 1 of 7 companies that mine and process talc in the United States, and Texas Architectural Aggregates is a crushing and milling facility of architectural marble. Culberson gross retail trade sales reached $81.7 million in 2004, an increase of 175 percent or $52 million over 1992 (Figure 9).
Figure 9. Gross Retail Trade Sales (millions of dollars)
Source: TCPA
Report Prepared by the Institute for Policy and Economic Development, UTEP; Ed Feser, UIUC: and Ken Poole, CREC 38
Local Govt.20.5%
Accom. & Food
Services15.6%
Other22.5%
Transportation and
warehousing3.0%
Retail Trade23.8%
State Govt.2.6%
Federal Civilian4.8% Mining
7.2%
25
35
45
55
65
75
85
92 93 94 95 96 97 98 99 00 01 02 03 04
Mill
ions
Culberson

Upper Rio Grande Workforce Development Board Industry Cluster Analysis
North I-10 Corridor: Hudspeth County Economic Overview
In 2004 there were an estimated 3,300 residents in Hudspeth County (Table 1; Census), placing it 222nd in Texas county population rankings, ahead of only 32 other counties. Since 2000, the county’s population decreased by 44 residents (-1.3 percent). The decrease was a result of negative net internal migration of 337, meaning that there were 337 more former residents that left the area permanently than new residents that migrated into Hudspeth. Roughly 32.4 percent of the population are under the age of 18, and 10.1 percent above age 65. More than 3 out of every 4 residents (78.5) are Hispanics of all races and the gender ratio is roughly 50-50. Of the persons 25 years and older (Census 2000) 2.7 percent had an Associates degree, 6.4 percent had a Bachelors degree, and 3.3 percent had a graduate or professional degree (compared to 6.3, 15.5 and 8.9 percent at the national level). By 2040 Hudspeth’s population is projected to grow to 3,847 with Hispanics of all races increasing their share of the total population to 83 percent (Office of the State Demographer recommended scenario). However, these projections do not take into account the negative net internal migration taking place in the county, so more conservative growth patterns are likely. County covers 4,572 square miles and has a population density of 0.72 residents per square mile. The county seat in Hudspeth is Sierra Blanca, and the major city is Dell City, which have populations of 533 and 409, respectively (28 combined percent of the county population).
Table 7. Economic Overview
Sources: Census, BLS, BEA, TCPA, and author’s calculations
Per capita personal income in Hudspeth in 2003 was $16,482 (Table 7; BEA), 52.4 percent of the U.S. level ($31,472). While the per capita purchasing power for residents is very low, the county made some improvement over 1990 when the county’s per capita income of $12,891 (in 2003 real dollars) was 47.4 percent the national level. Per capita transfer payments totaled $3,889 in 2003, meaning that 23.6 percent of the county’s per capita income originated from transfer payments (compared to the U.S.’ 14.6 percent and Texas’ 12.8 percent). Poverty afflicts 28.6 percent of Hudspeth’s residents, and 2 out of every 5 (40.4 percent) under the age of 18 (Table 7; Census).
Report Prepared by the Institute for Policy and Economic Development, UTEP; Ed Feser, UIUC: and Ken Poole, CREC 39
Population (2004) 3,300 Labor Force (2004) 1,352Grow th Rate since 1990 13.2% Labor Force Participation Rate 57.6%25 & Over No High School 53.9% Unemployment Rate 7.0%25 & Over High School 20.6% Full- and Part-time Employment (2003) 1,39925 & Over Some College or Degree 25.5% Grow th Rate since 1990 18.9%
Per Capita Personal Income (2003) $16,482 Wage & Salary Employment 946Percent of U.S. Per Capita 52.4% Avg. Wage & Salary per Job $26,414Per Capita Transfer Payments $3,889 Proprietors Employment 453
Poverty Level All Ages (2003) 28.6% Farm Proprietors Jobs 179Poverty Level 0-17 Ages 40.4% Nonfarm Proprietors Jobs 274
Median Household Income (2003) $21,855 Farm Employment 357Households (2000) 1,092 Nonfarm Employment 1,042
Avg. Household Size 3.0 Private Jobs 612Median House Value $30,500 Government Jobs 430Home Ow nership Rate 81.0% Gross Retail Trade Sales (2004) $9.16 million

Upper Rio Grande Workforce Development Board Industry Cluster Analysis
In 2004, the unemployment rate in Hudspeth was 7 percent (Table 7; BLS), compared to 5.5 percent for the nation and 6.1 percent for Texas. The jobless rate managed to decline in 2004 after a continuous rise beginning in 2000. The labor force participation rate for Hudspeth is estimated at 57.6 percent, versus 64.5 and 65.3 percent for the nation and state, respectively (Table 7).
Figure 10. Unemployment Rates (in percents)
Source: BLS
Full- and part-time employment in Hudspeth was 1,399 in 2003 (Table 7; BEA) after reaching a high of 1,422 in 2001. One-quarter (25.5 percent) of the county’s job base is in farm employment while more than 30.7 percent is in government. The latter is driven by local government and a substantial federal government base. Together the farm and government sectors account for 56.2 percent of all jobs in Hudspeth. The top employers include:
1. U.S. Border Patrol, Office of Homeland Security 2. Fort Hancock ISD 3. Hudspeth County
Source: URGWDB The largest nonfarm, private employment sectors in Hudspeth are 1) retail trade, 2) accommodation and food services, and 3) real estate and retail leasing (Figure 11). With less than half of all employment accounted for by the private sector, there is little dynamic growth in the economy. From 2001 to 2003 accommodation and food services added 15 jobs while retail trade contracted by 22.
Figure 11. 2003 Nonfarm Employment by Industry Breakdown
Source: BEA. Only includes disclosed data.
According to the Texas Workforce Commission, in the fall of 2004 Hudspeth had approximately 21 establishments that employed 10 or more employees. Of these employers, 4.8 percent employed between 50 and 99 employees, 57.1 percent employed between 20 and 49 employees, and 38.1 percent employed between 10 and 19 employees. While the Commission reports Hudspeth as having an
Report Prepared by the Institute for Policy and Economic Development, UTEP; Ed Feser, UIUC: and Ken Poole, CREC 40
Federal Civilian9.6%
Other44.6%
Retail Trade7.5%
Real Estate & Rental &
Leasing1.6%
Local Govt.26.8%
Utilities1.5%
State Govt.4.1%
Accom. & Food
Services4.2%
0
2
4
6
8
10
2000 2001 2002 2003 2004
U.S. Texas Hudspeth
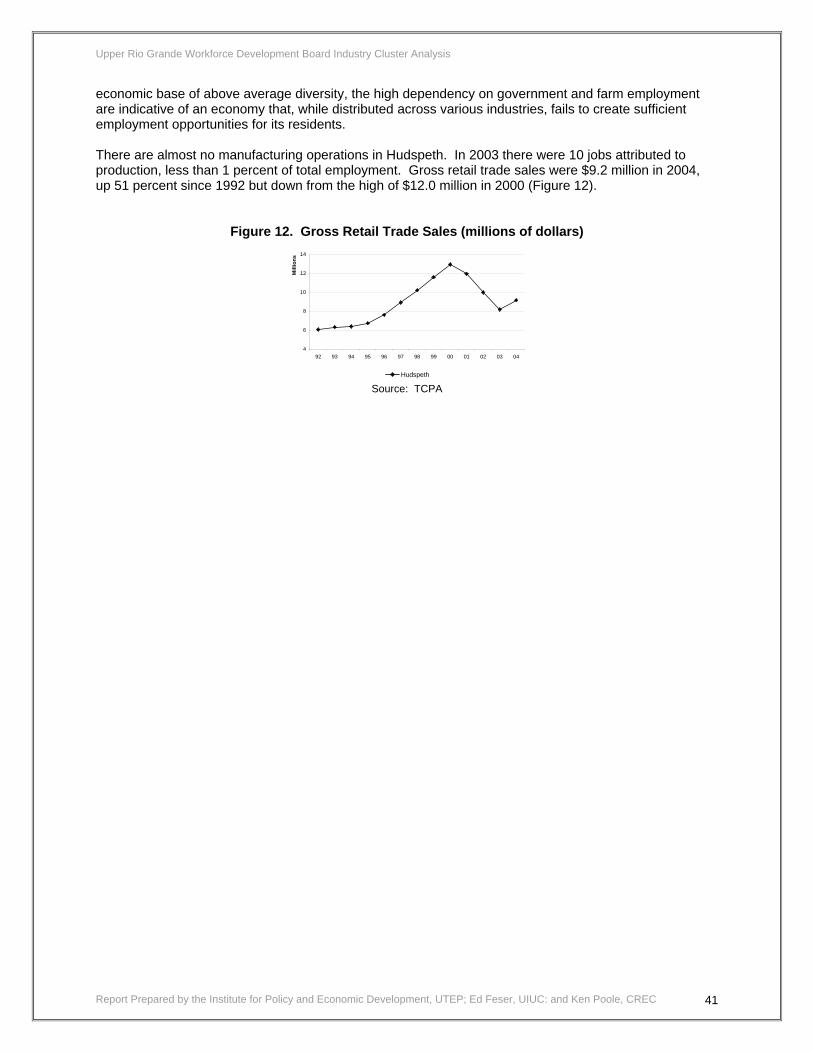
Upper Rio Grande Workforce Development Board Industry Cluster Analysis
economic base of above average diversity, the high dependency on government and farm employment are indicative of an economy that, while distributed across various industries, fails to create sufficient employment opportunities for its residents. There are almost no manufacturing operations in Hudspeth. In 2003 there were 10 jobs attributed to production, less than 1 percent of total employment. Gross retail trade sales were $9.2 million in 2004, up 51 percent since 1992 but down from the high of $12.0 million in 2000 (Figure 12).
Figure 12. Gross Retail Trade Sales (millions of dollars)
Source: TCPA
Report Prepared by the Institute for Policy and Economic Development, UTEP; Ed Feser, UIUC: and Ken Poole, CREC 41
4
6
8
10
12
14
92 93 94 95 96 97 98 99 00 01 02 03 04
Mill
ions
Hudspeth

Upper Rio Grande Workforce Development Board Industry Cluster Analysis
South I-10 Corridor: Jeff Davis County Economic Overview
In 2004, the population of Jeff Davis reached 2,253 (Table 8; Census), making it the smallest of the six Upper Rio Grande counties and placing it 234th in population rankings in Texas. After 2000 the county added 46 residents (2.1 percent growth) above the 307 resident change from 1990 (15.8 percent growth). The increase from 2000 resulted from both international migration (59 net international residents) and internal migration (25 net internal residents). Jeff Davis is one of the few counties that experienced negative natural increase as 100 deaths were recorded versus only 64 births. Roughly 23 percent of the population are under the age of 18 while 17 percent are age 65 and above. Hispanics of all races comprise 35 percent of the population, the lowest Hispanic share within the Upper Rio Grande region. The gender ratio is slightly more males than females at 50.8 percent males and 49.2 percent females. Of the persons 25 years and older (Census 2000) 4.7 percent had an Associates degree, 21.5 percent had a Bachelors degree, and 13.6 percent had a graduate or professional degree (compared to 6.3, 15.5 and 8.9 percent at the national level). By 2040 Jeff Davis’ population is projected to grow to 1,888 with Hispanics of all races increasing their share of the total population to 42 percent (Office of the State Demographer recommended scenario). Jeff Davis covers 2,259 square miles and has a population density of almost 1 resident per square mile. The county seat for Jeff Davis is Fort Davis, and the major city is Valentine, which have populations of 1,050 and 189, respectively (half the county population combined).
Table 8. Economic Overview
Sources: Census, BLS, BEA, TCPA, and author’s calculations
Per capita personal income in Jeff Davis in 2003 was $20,154 (Table 8; BEA), 64 percent the national level. Ten years earlier in 1993, per capita income in the county was $18,082, almost 67 percent the national level. Per capita transfer payments totaled $3,966 in 2003 (in 2003 real dollars), meaning that 19.7 percent (almost 1 in 5 dollars) of the county’s per capita income originated from transfer payments (compared to the U.S.’ 14.6 percent and Texas’ 12.8 percent). Even with the low levels of per capita income and high levels of transfer payments, Jeff Davis’ poverty levels are comparable to those of the state (Table 8; Census). Fourteen percent (14.6) of county residents live in poverty (versus 16.2 percent
Report Prepared by the Institute for Policy and Economic Development, UTEP; Ed Feser, UIUC: and Ken Poole, CREC 42
Population (2004) 2,253 Labor Force (2004) 1,373Grow th Rate since 1990 15.8% Labor Force Participation Rate 74.1%25 & Over No High School 25.3% Unemployment Rate 3.6%25 & Over High School 19.0% Full- and Part-time Employment (2003) 1,37125 & Over Some College or Degree 55.7% Grow th Rate since 1990 34.0%
Per Capita Personal Income (2003) $20,154 Wage & Salary Employment 916Percent of U.S. Per Capita 64.0% Avg. Wage & Salary per Job $25,881Per Capita Transfer Payments $3,966 Proprietors Employment 455
Poverty Level All Ages (2003) 14.6% Farm Proprietors Jobs 101Poverty Level 0-17 Ages 25.3% Nonfarm Proprietors Jobs 354
Median Household Income (2003) $32,248 Farm Employment 182Households (2000) 896 Nonfarm Employment 1,189
Avg. Household Size 2.4 Private Jobs 867Median House Value $59,800 Government Jobs 322Home Ow nership Rate 70.1% Gross Retail Trade Sales (2004) $8.45 million
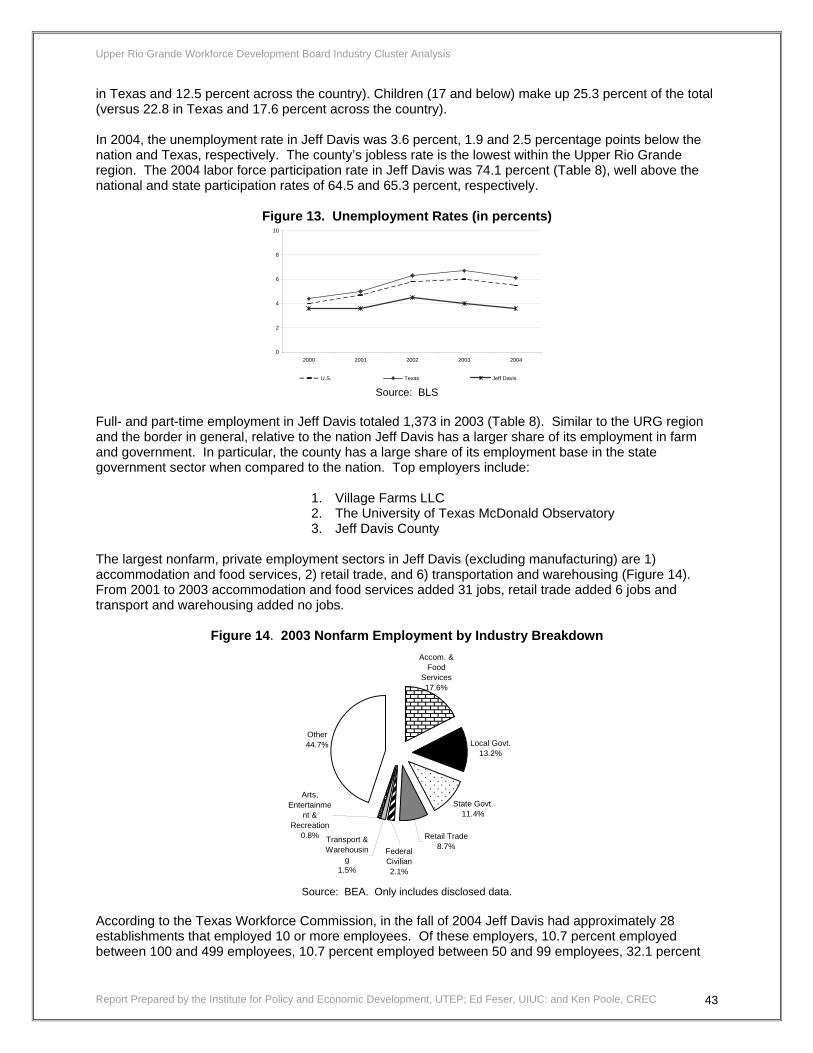
Upper Rio Grande Workforce Development Board Industry Cluster Analysis
in Texas and 12.5 percent across the country). Children (17 and below) make up 25.3 percent of the total (versus 22.8 in Texas and 17.6 percent across the country). In 2004, the unemployment rate in Jeff Davis was 3.6 percent, 1.9 and 2.5 percentage points below the nation and Texas, respectively. The county’s jobless rate is the lowest within the Upper Rio Grande region. The 2004 labor force participation rate in Jeff Davis was 74.1 percent (Table 8), well above the national and state participation rates of 64.5 and 65.3 percent, respectively.
Figure 13. Unemployment Rates (in percents)
Source: BLS
Full- and part-time employment in Jeff Davis totaled 1,373 in 2003 (Table 8). Similar to the URG region and the border in general, relative to the nation Jeff Davis has a larger share of its employment in farm and government. In particular, the county has a large share of its employment base in the state government sector when compared to the nation. Top employers include:
1. Village Farms LLC 2. The University of Texas McDonald Observatory 3. Jeff Davis County
The largest nonfarm, private employment sectors in Jeff Davis (excluding manufacturing) are 1) accommodation and food services, 2) retail trade, and 6) transportation and warehousing (Figure 14). From 2001 to 2003 accommodation and food services added 31 jobs, retail trade added 6 jobs and transport and warehousing added no jobs.
Figure 14. 2003 Nonfarm Employment by Industry Breakdown
Source: BEA. Only includes disclosed data.
According to the Texas Workforce Commission, in the fall of 2004 Jeff Davis had approximately 28 establishments that employed 10 or more employees. Of these employers, 10.7 percent employed between 100 and 499 employees, 10.7 percent employed between 50 and 99 employees, 32.1 percent
Report Prepared by the Institute for Policy and Economic Development, UTEP; Ed Feser, UIUC: and Ken Poole, CREC 43
0
2
4
6
8
10
2000 2001 2002 2003 2004
U.S. Texas Jeff Davis
Local Govt.13.2%
State Govt.11.4%
Other44.7%
Transport & Warehousin
g1.5%
Accom. & Food
Services17.6%
Arts, Entertainme
nt & Recreation
0.8%
Federal Civilian2.1%
Retail Trade8.7%
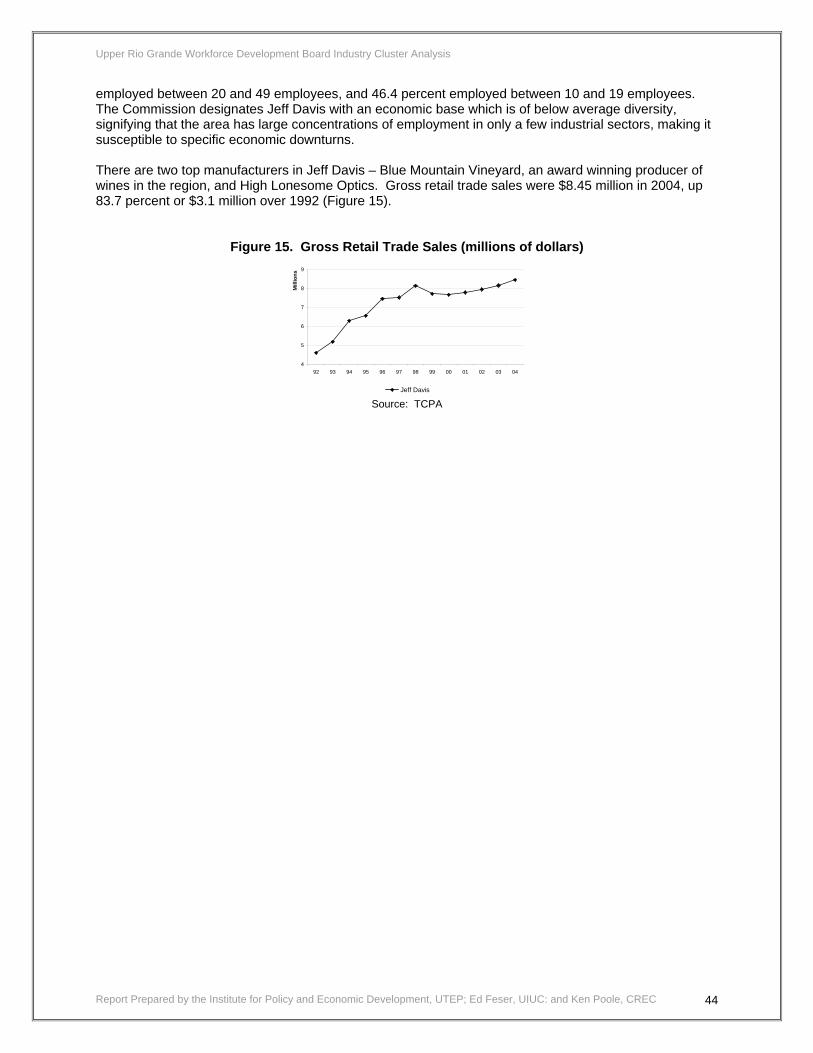
Upper Rio Grande Workforce Development Board Industry Cluster Analysis
employed between 20 and 49 employees, and 46.4 percent employed between 10 and 19 employees. The Commission designates Jeff Davis with an economic base which is of below average diversity, signifying that the area has large concentrations of employment in only a few industrial sectors, making it susceptible to specific economic downturns. There are two top manufacturers in Jeff Davis – Blue Mountain Vineyard, an award winning producer of wines in the region, and High Lonesome Optics. Gross retail trade sales were $8.45 million in 2004, up 83.7 percent or $3.1 million over 1992 (Figure 15).
Figure 15. Gross Retail Trade Sales (millions of dollars)
Source: TCPA
Report Prepared by the Institute for Policy and Economic Development, UTEP; Ed Feser, UIUC: and Ken Poole, CREC 44
4
5
6
7
8
9
92 93 94 95 96 97 98 99 00 01 02 03 04
Mill
ions
Jeff Davis

Upper Rio Grande Workforce Development Board Industry Cluster Analysis
South I-10 Corridor: Presidio County Economic Overview
In 2004, Presidio’s population was 7,639 (Table 9; Census), placing it 183rd in population rankings in Texas. After 2000 the county’s population grew by 335 persons (6.5 percent). The growth from 2000 is attributed to natural increase (530 more births than deaths) and net international migration of 446 (the county experienced a negative net internal migration of 636 during these four years). Roughly 32 percent of the population are under the age of 18 and 14 percent are age 65 and above. Hispanics of all races comprise 85 percent of the residents, making it the county in the Upper Rio Grande region with the highest concentration of Hispanics. Presidio also has the greatest difference between gender groups with 52.2 percent being female and 47.8 percent male. Of the persons 25 years and older, 3.1 percent had an Associates degree, 6.8 percent had a Bachelors degree, and 4.9 percent had a graduate or professional degree (compared to 6.3, 15.5 and 8.9 percent at the national level). By 2040 Presidio’s population is projected to grow to 13,055 with Hispanics of all races increasing their share of the total population to almost 94 percent (Office of the State Demographer recommended scenario). However, these projections do not take into account the negative net internal migration taking place in the county, so more conservative growth patterns are likely. The county covers 3,856 square miles, giving it a population density of 1.99 residents per square mile. The county seat in Presidio is Marfa, and the major city is Presidio with 2004. These had population levels of 2,005 and 4,652, respectively (87 combined percent of the county population).
Table 9. Economic Overview
Sources: Census, BLS, BEA, TCPA, and author’s calculations
Per capita personal income in Presidio in 2003 was $4,465 (Table 9; BEA). This was 46 percent the national per capita level of $31,472, the lowest of all Upper Rio Grande counties. In ten years the gap in per capita income widened – in 1993 the per capita income in the county was $13,386 (in 2003 real dollars), 49.2 percent of the national level. Per capita transfer payments totaled $4,634 in 2003, meaning that 32 percent (almost one-third) of the county’s per capita income originated from transfer payments (compared to the U.S.’ 14.6 percent and Texas’ 12.8 percent). Correlated to the high share of government transfers is poverty, which afflicts 27.7 percent of the county’s population, with the poverty level greater among those 17 years and younger (Table 9; Census).
Report Prepared by the Institute for Policy and Economic Development, UTEP; Ed Feser, UIUC: and Ken Poole, CREC 45
Population (2004) 7,639 Labor Force (2004) 3,535Grow th Rate since 1990 15.1% Labor Force Participation Rate 64.2%25 & Over No High School 55.3% Unemployment Rate 14.5%25 & Over High School 19.9% Full- and Part-time Employment (2003) 2,71625 & Over Some College or Degree 24.8% Grow th Rate since 1990 31.4%
Per Capita Personal Income (2003) $14,465 Wage & Salary Employment 1,913Percent of U.S. Per Capita 46.0% Avg. Wage & Salary per Job $24,688Per Capita Transfer Payments $4,634 Proprietors Employment 803
Poverty Level All Ages (2003) 27.7% Farm Proprietors Jobs 179Poverty Level 0-17 Ages 40.1% Nonfarm Proprietors Jobs 624
Median Household Income (2003) $24,254 Farm Employment 318Households (2000) 2,530 Nonfarm Employment 2,398
Avg. Household Size 2.9 Private Jobs 1,594Median House Value $35,500 Government Jobs 804Home Ow nership Rate 70.3% Gross Retail Trade Sales (2004) $38.52 million

Upper Rio Grande Workforce Development Board Industry Cluster Analysis
In 2004, the unemployment rate in Presidio was 14.5 percent (Table 9; BLS), highest among all Upper Rio Grande counties. The 2003 labor force participation rate in Presidio was 64.2 (Table 9), comparable to the national and state rates of 64.5 and 65.3 percent.
Figure 16. Unemployment Rates (in percents)
Source: BLS
Full- and part-time employment in Presidio reached 2,716 in 2003 (Table 9; BEA), and the job base grew 31.4 percent from 1990, adding 649 jobs. Relative to the nation and Texas the economy has a larger share of government and farm employment. Of the county’s total jobs, 29.6 percent are in the government sector (compared to the U.S.’ 14.4 government percent share and Texas’ 14.9 percent). Local government accounts for 18.2 percent, and the federal government accounts for another 7.7 percent of the total jobs. The farm share of total jobs in Presidio is 11.7 percent, compared to the national and state shares of 1.8 and 2.3 percent, respectively. The top employers include:
1. Village Farms LLC 2. U.S. Border Patrol, Office of Homeland Security 3. Presidio ISD 4. Presidio County
The largest nonfarm, private employment sectors in Presidio are 1) retail trade, 2) construction, and 3) finance and insurance (Figure 17). From 2001 to 2003, most of the disclosed jobs gains were in construction while retail trade witnessed a jobs loss.
Figure 17. 2003 Nonfarm Employment by Industry Breakdown
Source: BEA. Only includes disclosed data.
According to the Texas Workforce Commission, in the fall of 2004 Presidio had approximately 40 establishments that employed 10 or more employees. Of these employers, 2.5 percent employed between 100 and 499 employees, 12.5 percent employed between 50 and 99 employees, 40 percent
Report Prepared by the Institute for Policy and Economic Development, UTEP; Ed Feser, UIUC: and Ken Poole, CREC 46
Retail Trade13.8%
Other43.6%
Finance & Insurance
3.0%
Construction4.3%
State Govt.3.4%
Real Estate & Rental &
Leasing2.6%
Local Govt.20.6%
Federal Civilian8.8%
0
4
8
12
16
20
2000 2001 2002 2003 2004
U.S. Texas Presidio

Upper Rio Grande Workforce Development Board Industry Cluster Analysis
employed between 20 and 49 employees and the remaining 45 percent employed between 10 and 19 employees. While the Commission reports Hudspeth as having an economic base of average diversity, the high dependency on government and farm employment clearly indicate a private sector, while spread across various industries that, fails to create sufficient employment opportunities for its residents. Manufacturing activities are relatively small in Presidio, employing only 24 persons in 2003. The 24 jobs are divided among Presidio’s top manufacturers:
1. ABC Pump Inc. 2. Baeza Feeds 3. Judd Foundation 4. Rimfire Forge 5. Santa Fe Cabinet Shop
Source: TWC Presidio gross retail trade sales totaled $38.5 million in 2004, an increase of $10.1 million or 36 percent over 1992 (Figure 18).
Figure 18. Gross Retail Trade Sales (millions of dollars)
Source: TCPA
Report Prepared by the Institute for Policy and Economic Development, UTEP; Ed Feser, UIUC: and Ken Poole, CREC 47
20
25
30
35
40
92 93 94 95 96 97 98 99 00 01 02 03 04
Mill
ions
Presidio
Upper Rio Grande Workforce Development Board Industry Cluster Analysis
South I-10 Corridor: Brewster County Demographic and Economic Overview
In 2004, Brewster’s population was 9,226 (Table 1; Census), placing the county 171st in Texas. Since Census 2000, the county has grown by 4.1 percent and added 360 residents – a 180 person increase resulting from natural increase (births over deaths) and 186 from net migration (151 from international migration and 35 from internal migration). Roughly 22 percent of the population are under the age of 18, and 14 percent is older than 65 years. Hispanics of all races comprise 45 percent of the residents and the gender ratio is slightly more females than males, 50.3 versus 49.7 percent. Of the persons 25 years and older (Census 2000), 4.1 percent had an Associates degree, 17.4 percent had a Bachelors degree, and 10.3 percent had a graduate or professional degree (compared to 6.3, 15.5 and 8.9 percent at the national level). By 2040 Brewster’s population is projected to grow to 10,261 with Hispanics of all races increasing their share of the total population to 61 percent (Office of the State Demographer recommended scenario). Brewster is the largest county in the state measure in square miles (6,193) and has a population density of 1.49 residents per square mile. The college city of Alpine is both the county seat and major city in Brewster with a 2004 population of 6,079 (66 percent of the county population).
Table 10. Economic Overview
Sources: Census, BLS, BEA, TCPA, and author’s calculations
Per capita personal income in Brewster in 2003 was $23,440 (Table 10; BEA). This was 74.5 percent the national per capita level of $31,472. Ten years earlier in 1993, the per capita income in the county was $18,532 (in 2003 real dollars), 68.2 percent the national level. Per capita transfer payments totaled $4,195 in 2003, meaning that 17.9 percent of the county’s per capita income originates from transfer payments (compared to the U.S.’ 14.6 percent and Texas’ 12.8 percent). Correlated to the high share of government transfers is poverty, which afflicts 17.5 percent of the county’s population, with the poverty level greater among the youth 17 years and younger (Table 10; Census). In 2004, the unemployment rate in Brewster was 4.2 percent (Table 10; BLS), below the national and state annual averages (Figure 19). Like the national and state economies, Brewster had an unemployment rate rise as a result of the 2001 recession. The 2004 estimated labor force participation
Report Prepared by the Institute for Policy and Economic Development, UTEP; Ed Feser, UIUC: and Ken Poole, CREC 48
Population (2004) 9,226 Labor Force (2004) 5,465Grow th Rate since 1990 6.3% Labor Force Participation Rate 73.3%25 & Over No High School 21.4% Unemployment Rate 4.2%25 & Over High School 21.1% Full- and Part-time Employment (2003) 6,07325 & Over Some College or Degree 57.5% Grow th Rate since 1990 44.2%
Per Capita Personal Income (2003) $23,440 Wage & Salary Employment 4,765Percent of U.S. Per Capita 74.5% Avg. Wage & Salary per Job $24,969Per Capita Transfer Payments $4,195 Proprietors Employment 1,308
Poverty Level All Ages (2003) 17.5% Farm Proprietors Jobs 155Poverty Level 0-17 Ages 25.1% Nonfarm Proprietors Jobs 1,153
Median Household Income (2003) $29,201 Farm Employment 225Households (2000) 3,669 Nonfarm Employment 5,848
Avg. Household Size 2.3 Private Jobs 4,418Median House Value $67,000 Government Jobs 1,430Home Ow nership Rate 59.5% Gross Retail Trade Sales (2004) $81.65 million

Upper Rio Grande Workforce Development Board Industry Cluster Analysis
rate in Brewster was 73.3 percent (Table 10), compared to the national and Texas participation rates of 64.5 and 65.3 percent, respectively.
Figure 19. Unemployment Rates (in percents)
Source: BLS
Full- and part-time employment in Brewster totaled 6,073 in 2003 (Table 10; BEA). Relative to the nation and Texas, the economy has a larger share of farm and government employment. However, the county posted negative farm earnings as a result of losses by farm proprietors. The government sector is driven by the large share of state and federal civilian government jobs. Top employers include:
4. Sul Ross State University 5. Alpine ISD 6. Brewster County 7. Big Bend Hospital District
Source: URGWDB The largest nonfarm, private employment sectors in Brewster are 1) retail trade, 2) accommodation and food services, 3) wholesale trade, and 4) construction (Figure 20). From 2001 to 2003, the sector with the greatest jobs growth was retail trade, followed by wholesale trade and accommodation and food services (increases of 97, 26 and 23, respectively). Most job losses occurred in the information and construction sectors, losing 26 and 22 jobs, respectively. Big Bend National Park drives the high share of tourist accommodation and related service jobs and occupations.
Figure 20. 2003 Nonfarm Employment by Industry Breakdown
Source: BEA. Only includes disclosed data.
According to the Texas Workforce Commission, in the fall of 2004 Brewster had approximately 101 establishments that employed 10 or more employees. Of these employers, 7.9 percent employed between 100 and 499 employees, 8.9 percent employed between 50 and 99 employees, 30.7 percent employed between 20 and 49 employees. The remaining 52.5 percent employed between 10 and 19 employees. Consequently, Brewster has an economic base which is of below average diversity, meaning
Report Prepared by the Institute for Policy and Economic Development, UTEP; Ed Feser, UIUC: and Ken Poole, CREC 49
Accom. & Food
Services14.3%
State Govt.12.6%
Other37.0%
Construction4.9%
Local Govt.7.6%
Wholesale trade5.0%
Prof. & Tech.
Services4.1%
Retail Trade14.5%
0
2
4
6
8
10
2000 2001 2002 2003 2004
U.S. Texas Brewster

Upper Rio Grande Workforce Development Board Industry Cluster Analysis
that the area has significant concentrations of employment in only a few industrial sectors, making it more susceptible to widespread economic decline should a key sector suffer a significant loss. Manufacturing activities are relatively small in Brewster when compared to both the nation and state. Since 1982 manufacturing employment was at its lowest point in 1994 when it dropped to 38 (SIC based). By 2003 the manufacturing sector employed 101 persons (NAICS based), accounting for only 1.7 percent of nonfarm (private plus government) employment. The top 10 manufacturers for Brewster are:
1. Coca-Cola Bottling Co. 2. Highland Concrete Co. 3. Nurses Unlimited Inc. 4. Alpine Printing Co. 5. Badlands Bakery 6. Pimmco 7. Production Minerals Inc. 8. Covington Enterprises 9. JR Carri Co. 10. Nico’s Printing Express
Source: TWC Brewster retail sales are positively affected by the tourism industry. Gross retail trade sales reached $81.6 million in 2004, an increase of $21.4 million or 36 percent over 1992 (Figure 21).
Figure 21. Gross Retail Trade Sales (millions of dollars)
Source: TCPA
Report Prepared by the Institute for Policy and Economic Development, UTEP; Ed Feser, UIUC: and Ken Poole, CREC 50
70.7
78.0
60.2
81.6
50
60
70
80
90
92 93 94 95 96 97 98 99 00 01 02 03 04
Mill
ions
Brewster

Upper Rio Grande Workforce Development Board Industry Cluster Analysis
Report Prepared by the Institute for Policy and Economic Development, UTEP; Ed Feser, UIUC: and Ken Poole, CREC 51

Upper Rio Grande Workforce Development Board Industry Cluster Analysis
1 Brenner, C.T. (2003). “Education and the Status of Human Capital Development in Texas.” In Dígame! Policy and Politics on the Texas Border. C.T. Brenner, I. Coronado and D.L. Soden, Eds. Dubuque, IA: Kendall Hunt Publishing: 207-234. 2 Porter, Michael E. 2003. "The economic performance of regions," Regional Studies, 37, 549-78. 3 Feser, E. Benchmark value chain industry clusters for applied regional research. Latest version: October 2005. p 5. 4 Feser, E. 2005. p 5. 5 ibid.,p. 6. 6 Exclusively local services are excluded from the 437 by 437 matrix and are not covered as productive industries by the Feser clusters. 7 For more information, see G.H. Hanson, 2001. “U.S.-México Integration and Regional Economies: Evidence from Border City Pairs,” Journal of Urban Economics, v50, pp. 250-287. 8 Interestingly, while proximity to México has served to depress wages on the U.S. side of the border, the situation in Mexican border cities is the reverse. They are typically seen as areas of low unemployment, greater opportunity, access to education or training, and better wages relative to the rest of the nation. For more information on El Paso attainment, see C. Brenner, “Educational Trends and Income in El Paso: A Longitudinal Perspective,” Institute for Policy and Economic Development, Technical Report 2001-07, August, 2001. 9 Source: Texas Comptroller of Public Accounts, July 2002, “Texas Regional Outlook: The Upper Río Grande Region,” pp. 1-28. 10 Fort Bliss is home of the U.S. Army Air Defense Command responsible for air defense artillery training of U.S. soldiers and various allied nation soldiers (the latter brings thousands of soldiers from around the world into El Paso, pumping millions of dollars into the local economy). It is comprised of approximately 1.12 million acres of land in Texas and New México, making it the second largest installation in the Army (White Sands Missile Range is the largest and is adjacent to Fort Bliss). Fort Bliss also houses Biggs Army Airfield, which has more miles of runway than any other Army airfield in the world and ranks as the nation’s third largest runway, including commercial airports. It provides the largest contiguous tract of virtually unrestricted airspace in the Continental United States (1,500 square miles) and can handle any aircraft that flies, including the specially equipped Boeing 747 that carries the space shuttle. http://www.globalsecurity.org/military/facility/fort-bliss.htm. 11 At its peak in 1993, apparel accounted for approximately 47 percent of manufacturing. By 2003, it accounted for only 17 percent of manufacturing. 12 Survey instruments performed for the Sonora, Mexico-Arizona, U.S. region have been conducted since the late 1970s to assess these activities (Alberta H. Charney and Vera K. Pavlokovich, 2002. “The Economic Impacts of Mexican Visitors to Arizona: 2001,” Economic and Business Research Program, University of Arizona.). While restricted to being performed only once per decade, the Arizona exit interviews have provided insight as to what percentage Mexican visitor spending accounts for as a percent of taxable sales by county. Results showed extreme variation, from as little as 3.8 percent to as much as 47.3 percent, dependent on the port and border county under analysis. Other survey-style studies along the San Diego region have also tried to measure the extent of retail sales purchases by Mexican nationals (San Diego Dialogue, April 1994. “Who Crosses the Border: A View of the San Diego/Tijuana Metropolitan Region.”). Similarly, empirical models have tried to assess the effect and extent of retail sales activity captured by Mexican nationals along Texas’ border. Again, results differ by region and by model parameters and initial conditions. Under one Federal Reserve study, exported retail sales in Texas ranged from 6 percent to 22 percent of all retail sales along the border counties (K. R. Phillips and C. Manzanares, 2001. “Transportation Infrastructure and the Border Economy,” The Border Economy, Federal Reserve Bank of Dallas.). Another impact study on the El Paso region quantified the percent of total retail sales to Mexican nationals at 33 percent (Sergio Peña Medina, 2003. “Comercio Transfronterizo y su Impacto en la Región El Paso-Juárez: Una Propuesta de Financiamiento de la Planeación Binacional,” Frontera Norte, v14, #29.). 13 For more information, see J. Cañas, 2002. “A Decade of Change: El Paso’s Economic Transition of the 1990s,” Business Frontier, Federal Reserve Bank of Dallas, El Paso Branch, (1).
Report Prepared by the Institute for Policy and Economic Development, UTEP; Ed Feser, UIUC: and Ken Poole, CREC 52
14 For more information, see D. Schauer and D.L. Soden, “The Economic Impact of Fort Bliss Texas,” Institute for Policy and Economic Development, Technical Report 2002-08 July 2002.