Embed Size (px)
Citation preview
Upper-Ocean Thermal Structure and the Western North Pacific Category 5 Typhoons.Part II: Dependence on Translation Speed
I.-I. LIN, IAM-FEI PUN, AND CHUN-CHIEH WU
Department of Atmospheric Sciences, National Taiwan University, Taipei, Taiwan
(Manuscript received 8 July 2008, in final form 9 December 2008)
ABSTRACT
Using new in situ ocean subsurface observations from the Argo floats, best-track typhoon data from the
U.S. Joint Typhoon Warning Center, an ocean mixed layer model, and other supporting datasets, this work
systematically explores the interrelationships between translation speed, the ocean’s subsurface condition
[characterized by the depth of the 268C isotherm (D26) and upper-ocean heat content (UOHC)], a cyclone’s
self-induced ocean cooling negative feedback, and air–sea enthalpy fluxes for the intensification of the
western North Pacific category 5 typhoons. Based on a 10-yr analysis, it is found that for intensification to
category 5, in addition to the warm sea surface temperature generally around 298C, the required subsurface
D26 and UOHC depend greatly on a cyclone’s translation speed. It is observed that even over a relatively
shallow subsurface warm layer of D26 ; 60–70 m and UOHC ; 65–70 kJ cm22, it is still possible to have a
sufficient enthalpy flux to intensify the storm to category 5, provided that the storm can be fast moving
(typically Uh ; 7–8 m s21). On the contrary, a much deeper subsurface layer is needed for slow-moving
typhoons. For example at Uh ; 2–3 m s21, D26 and UOHC are typically ;115–140 m and ;115–125 kJ cm22,
respectively. A new concept named the affordable minimum translation speed Uh_min is proposed. This is the
minimum required speed a storm needs to travel for its intensification to category 5, given the observed D26
and UOHC. Using more than 3000 Argo in situ profiles, a series of mixed layer numerical experiments are
conducted to quantify the relationship between D26, UOHC, and Uh_min. Clear negative linear relationships
with correlation coefficients R 5 20.87 (20.71) are obtained as Uh_min 5 20.065 3 D26 1 11.1, and Uh_min 5
20.05 3 UOHC 1 9.4, respectively. These relationships can thus be used as a guide to predict the minimum
speed a storm has to travel at for intensification to category 5, given the observed D26 and UOHC.
1. Introduction
a. Motivation
Category 51 tropical cyclones are the most intense
and damaging cyclones on earth. Why these storms can
reach such extraordinary intensity has been an intrigu-
ing and challenging research topic because intensifica-
tion is a complex process involving multiple interactions
among the cyclone, ocean, and atmosphere (Gray 1977;
Merrill 1988; Emanuel 1995, 1997, 1999, 2005; Shay
et al. 2000; Frank and Ritchie 2001; Emanuel et al. 2004;
Lin et al. 2005, 2008, 2009; Trenberth 2005; Montgomery
et al. 2006; Houze et al. 2007; Vimont and Kossin 2007;
Black et al. 2007; Vecchi and Soden 2007; Wu et al. 2007;
Mainelli et al. 2008). To reach such high intensity, mul-
tiple conditions of both atmosphere (e.g., vertical wind
shear and high level outflow; Frank and Ritchie 2001;
Wang and Wu 2003; Emanuel et al. 2004) and ocean
all have to be favorable. Also, since ocean is the energy
source for intensification, it is a necessary condition
(Emanuel 1995, 1997, 1999; Shay et al. 2000; Emanuel
et al. 2004; Lin et al. 2005, 2008, 2009; Trenberth 2005;
Black et al. 2007). Thus, even if all other conditions are
favorable, without satisfying the ocean condition it is
not possible for the intensification to take place.
When considering the ocean condition, both sea surface
temperature (SST) and the subsurface thermal structure
are important because cyclones interact not only with
Corresponding author address: Dr. I.-I. Lin, Dept. of Atmospheric
Sciences, National Taiwan University, No. 1, Sec. 4, Roosevelt Rd.,
Taipei 106, Taiwan.
E-mail: [email protected]
1 Saffir–Simpson tropical cyclone scale based on the 1-min (10 min)
maximum sustained winds—category 1: 34–43 (30–37) m s21, cate-
gory 2: 44–50 (38–43) m s21, category 3: 51–59 (44–51) m s21, cate-
gory 4: 59–71 (52–61) m s21, and category 5: .71 (.61) m s21.
3744 M O N T H L Y W E A T H E R R E V I E W VOLUME 137
DOI: 10.1175/2009MWR2713.1
� 2009 American Meteorological Society
the ocean surface, but also with the entire upper-ocean
column (typically from surface down to 100–200 m;
Perlroth 1967; Leipper and Volgenau 1972; Gray 1979;
Holliday and Thompson 1979; Shay et al. 2000; Cione
and Uhlhorn 2003; Goni and Trinanes 2003; Lin et al.
2005, 2008, 2009; Pun et al. 2007; Wu et al. 2007). How-
ever, the lack of subsurface observations has long been
a major hindrance to understand the role the ocean’s
subsurface thermal structure plays in the intensification
of category 5 cyclones.
In recent years, because of the advancement in ocean
in situ observations (e.g., the deployment of Argo floats;
Gould et al. 2004; Roemmich et al. 2004), the situation
has improved and new observations are now available
for research (Johnson et al. 2006; Lyman et al. 2006;
Trenberth 2006; Willis et al. 2007). Therefore in Lin
et al. (2008, hereafter Part I) of this work, these new
subsurface observations are used to explore issues re-
lated to ocean features, while in this work (Part II) the
focus is on exploring issues related to cyclone’s trans-
lation speed. As in Part I, western North Pacific ty-
phoons are studied because this area is where most
category 5 cyclones occur on earth.
b. Issues on the translation speed
In the extant literature, it is generally known that if a
cyclone is to reach a high intensity such as category 5,
in addition to warm SST, a sufficiently thick layer of
warm water below the surface is required as a necessary
precondition (Leipper and Volgenau 1972; Gray 1979;
Holliday and Thompson 1979; Emanuel 1999; Shay et al.
2000; Cione and Uhlhorn 2003; Emanuel et al. 2004; Lin
et al. 2005; Part I). This is required because it will ensure
that the negative feedback from the cyclone’s self-
induced SST cooling is restrained during the intensifica-
tion. Otherwise, the self-induced cooling would be too
strong for continual intensification to category 5 since
self-induced cooling reduces the available air–sea flux
supply for intensification (Price 1981; Gallacher et al.
1989; Emanuel 1999; Cione and Uhlhorn 2003; Emanuel
et al. 2004; Lin et al. 2005, 2009; Part I; Wu et al. 2007).
As reported in Gallacher et al. 1989, Emanuel (1999),
and Emanuel et al. (2004), a mere 2.58C cooling in the
inner core is already sufficient to shut down the entire
energy production of a storm. An interesting question
one may ask is how thick the subsurface warm layer
must be to be considered thick enough? In other words,
what is the needed range for the subsurface parameters,
such as the depth of the 268C isotherm (i.e., D26, often
used to characterize the subsurface warm layer thick-
ness) or the upper-ocean heat content (UOHC or QH,
i.e., the integrated heat content excess per unit area
relative to the 268C isotherm, integrated from D26
to the surface2) (Leipper and Volgenau 1972; Shay
et al. 2000; Goni and Trinanes 2003; Pun et al. 2007;
Lin et al. 2009; Mainelli et al. 2008)? Meanwhile, since
the ocean’s negative feedback is weaker when a storm
is fast moving, will the requirements for fast- or slow-
moving storms be different? It has been hinted in
Part I that some faster-moving storms were observed
to intensify to category 5 over a relatively shallow
layer of warm water. As such, this study aims to sys-
tematically investigate and quantify the relationship
between translation speed and the required subsurface
parameters.
In section 2, we first examine the relationship be-
tween the observed translation speed and the upper-
ocean thermal structure (UOTS) in the intensification
locations of category 5 typhoons. Data from the most
recent 10 yr (1997–2006) are studied because prior to
1997, very limited in situ UOTS data are available. Each
typhoon’s translation speed, track, and intensity data
are taken from the best-track data of the Joint Typhoon
Warning Center (JTWC). The in situ UOTS data are
obtained from the National Oceanic and Atmospheric
Administration (NOAA) Global Temperature and
Salinity Profile Program (GTSPP; Keeley et al. 2003)
and the Argo3 float databases (Gould et al. 2004;
Roemmich et al. 2004; Lyman et al. 2006; Willis et al.
2007). Next, the during-storm self-induced cooling neg-
ative feedback is estimated under various translation
speeds and subsurface conditions using the Price–Weller–
Pinkel (PWP) ocean mixed layer model (Price et al.
1986). Air–sea enthalpy fluxes are also estimated ac-
cordingly (Powell et al. 2003; Black et al. 2007; Part I;
Lin et al. 2009).
In section 3, a new concept called the ‘‘affordable
minimum translation speed (Uh_min)’’ is proposed. This
is the minimum speed a storm has to travel to confine
the self-induced cooling within a certain threshold du-
ring the intensification process to category 5, given the
observed subsurface D26. Using more than 3000 Argo
2 QH
5 cpr Sn
i51 DT(x, y, zi, t)DZ, where cp is the heat capacity
of the seawater at constant pressure (4178 J kg21 8C21), r is the
average seawater density of the upper ocean (1026 kg m23),
DT(x, y, zi, t) is the temperature difference between T(zi) and 268C
at depth zi, and DZ is the depth increment (5 m). Here n is the total
layers from surface to the depth of 268C (D26). The total UOHC
is the sum of UOHC at each depth increment (DZ) through the
surface to the D26.3 In this work, all Argo profiles are prescreened to ensure data
quality. As reported by Willis et al. (2007), a small subset of floats
fabricated at the Woods Hole Oceanographic Institution was de-
tected to have a cold bias. Thus, data from this batch of floats are
screened out and not used in this study.
NOVEMBER 2009 L I N E T A L . 3745
profiles (Gould et al. 2004; Roemmich et al. 2004;
Lyman et al. 2006; Willis et al. 2007) to conduct a series
of mixed layer model experiments, the relationship
between D26 and Uh_min is established. In section 4,
similar relationships are established for UOHC and
Uh_min. In section 5, issues related to future forecasts
and ocean features (i.e., consolidating results with Part I),
and concerns of other factors (e.g., stratification) in fu-
ture research are discussed. Conclusions are given in
section 6.
2. UOTS–Uh relationship observed during1997–2006 together with the associatedself-induced cooling and enthalpy flux
a. The observed UOTS–Uh relationship
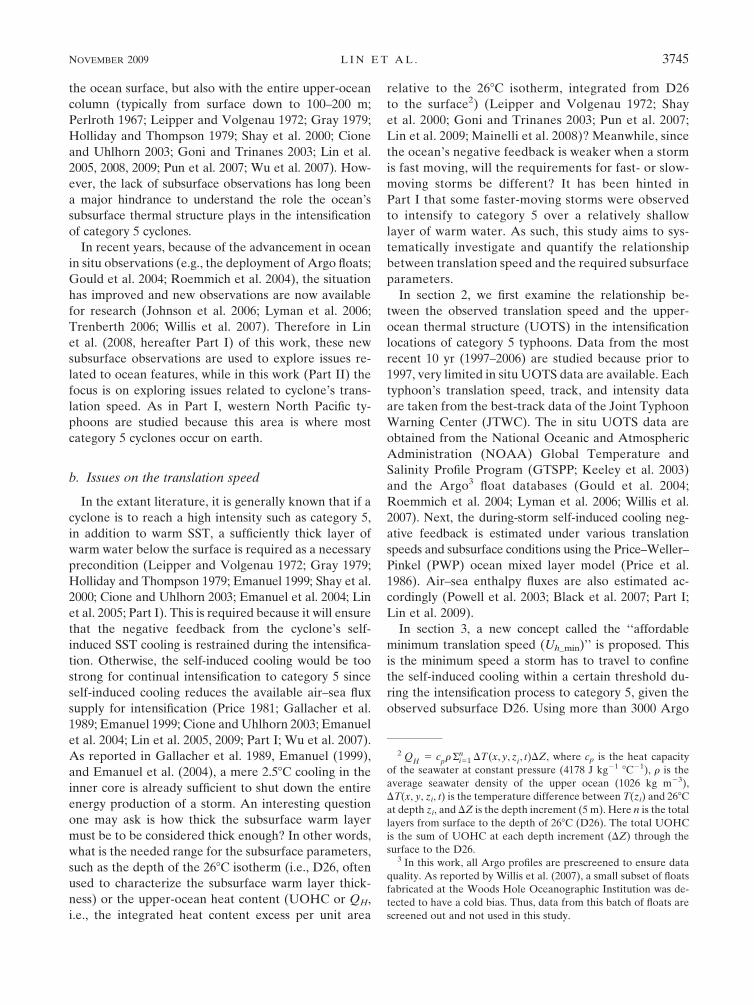
Figure 1a depicts the in situ upper-ocean thermal
structure profiles found in the intensification locations
(from category 1 to the peak in category 5) of category 5
typhoons during the May–October typhoon season in
the most recent 10 yr. Profiles are searched within 8 days
prior to the passage of each storm and within a 28 radius
from the best track. In total, 17 profiles from 134 out of
the 25 category 5 typhoons are found.
As in Fig. 1a, SST values are confined within a narrow
range between 288 and 308C while large variability is
found in the subsurface. Namely, the depth of the 268C
isotherm ranges from as shallow as 58 m to as deep as
150 m (i.e., ;200% difference). Based on the differ-
ences in D26, the in situ profiles can be categorized into
5 groups, from the shallowest, G1 (D26 5 45–65 m), to
the deepest, G5 (D26 5 125–150 m; Fig. 1a). As sum-
marized in Table 1, the average SST is similar among the
5 groups with values all near 298C. In contrast, distinct
differentiation can be seen in the 2 subsurface parameters
that the average D26 increases from 61 in G1 to 138 m in
G5 while UOHC increases from 64 to 122 kJ cm22.
Examining the observed translation speed5 for the
5 groups (Fig. 1b), one finds that shallower layers (G1
and G2) are associated with faster translation speeds
(;7.3–8.5 m s21) while over deeper waters (e.g., G4 and
G5), a wider range of translation speeds is found (i.e.,
from the slowest 2.6 to 6.4 m s21). Also in Table 1 and
Fig. 1b, one observes that with increases in D26 and
UOHC from G1 to G5, the observed minimum Uh of
each group decreases. These suggest that deeper warm
layers (e.g., G4 and G5) allow a storm to intensify to
category 5 under both slow (e.g., ;2.6 m s21) and fast
(e.g., ;6.4 m s21) translation speeds (i.e., allowing a
wider range of Uh for a storm to travel). However, over
a shallower warm layer (e.g., G1 and G2), a storm is
only allowed to travel fast (i.e., 7.3–8.5 m s21) and the
range of Uh a storm is allowed to travel is also smaller
(Fig. 1b).
FIG. 1. (a) The searched prestorm in situ depth–temperature profiles found in the intensification locations.
The profiles are sorted into five groups, according to the D26. (b) The corresponding observed translation speed for
each group.
4 These 13 category 5 typhoons are as follows: Saomai (2006),
Yagi (2006), Nabi (2005), Dianmu (2004), Chaba (2004), Maon
(2004), Maemi (2003), Hagibis (2002), Fengshen (2002), Bilis (2000),
Saomai (2000), Nestor (1997), and Joan (1997). For the cases of
Saomai (2006), Yagi (2006), Maemi (2003), and Fengshen (2002),
two profiles are found while one profile is found for the other storms.
Thus, there are 17 profiles altogether.
5 For each profile, the corresponding translation speed is cal-
culated from the nearest point in the track.
3746 M O N T H L Y W E A T H E R R E V I E W VOLUME 137
b. Estimation of self-induced SST cooling
To further confirm the observed Uh and UOTS rela-
tionship, a mixed layer model is run for each of the five
groups. As in Part I, the PWP ocean mixed layer model
(Price et al. 1986) is used. The corresponding in situ
profiles for each group (Fig. 1a) are used as initial profiles
(Fig. 1a). For each profile, the storm-induced cooling at
the inner core is estimated progressively with an increase
in wind forcing from categories 1 to 5. Thus for each pro-
file, the 10-min average maximum sustained wind, rang-
ing from 30 to 65 m s21, at an interval of every 5 m s21, is
used to drive the model. The drag coefficient used is
the cyclone-wind drag coefficient (Cd) from Powell et al.
(2003). Also, according to Uh, a model parameter called
TCtransit-time is calculated and the model is run according to
the TCtransit-time where TCtransit-time 5 D/Uh (D: inner core
diameter of the storm). More details of the model setup
can be found in Part I. Figure 2 depicts the numerical re-
sults of the group-averaged during-storm inner-core SST
due to the self-induced cooling for each of the five groups
according to the observed translation speeds (Fig. 1b).
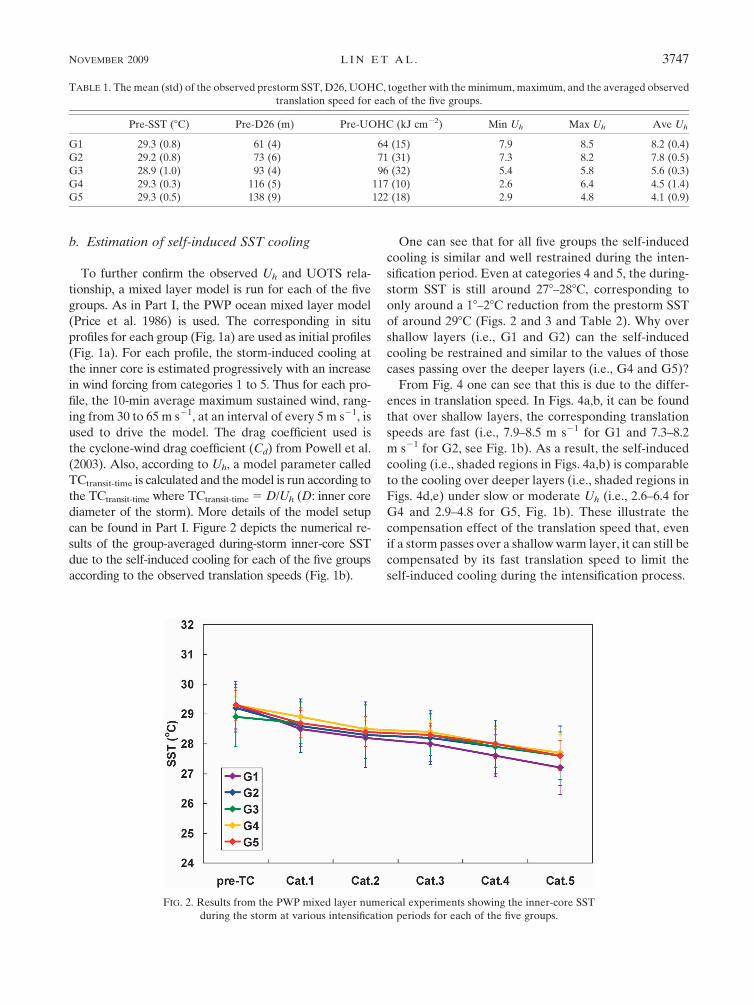
One can see that for all five groups the self-induced
cooling is similar and well restrained during the inten-
sification period. Even at categories 4 and 5, the during-
storm SST is still around 278–288C, corresponding to
only around a 18–28C reduction from the prestorm SST
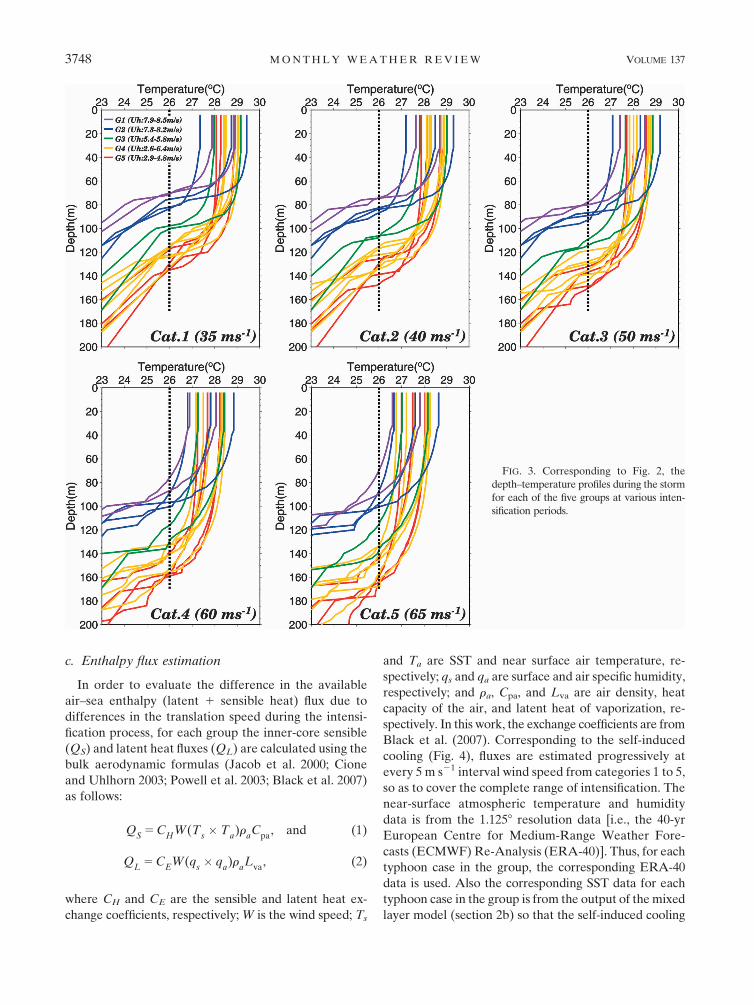
of around 298C (Figs. 2 and 3 and Table 2). Why over
shallow layers (i.e., G1 and G2) can the self-induced
cooling be restrained and similar to the values of those
cases passing over the deeper layers (i.e., G4 and G5)?
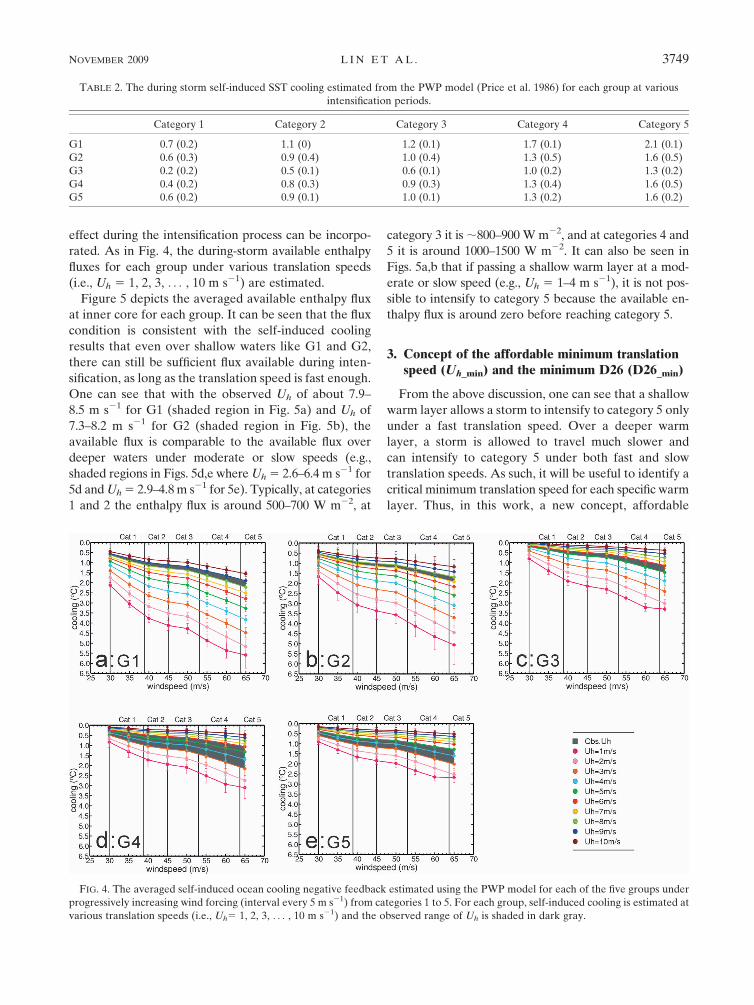
From Fig. 4 one can see that this is due to the differ-
ences in translation speed. In Figs. 4a,b, it can be found
that over shallow layers, the corresponding translation
speeds are fast (i.e., 7.9–8.5 m s21 for G1 and 7.3–8.2
m s21 for G2, see Fig. 1b). As a result, the self-induced
cooling (i.e., shaded regions in Figs. 4a,b) is comparable
to the cooling over deeper layers (i.e., shaded regions in
Figs. 4d,e) under slow or moderate Uh (i.e., 2.6–6.4 for
G4 and 2.9–4.8 for G5, Fig. 1b). These illustrate the
compensation effect of the translation speed that, even
if a storm passes over a shallow warm layer, it can still be
compensated by its fast translation speed to limit the
self-induced cooling during the intensification process.
TABLE 1. The mean (std) of the observed prestorm SST, D26, UOHC, together with the minimum, maximum, and the averaged observed
translation speed for each of the five groups.
Pre-SST (8C) Pre-D26 (m) Pre-UOHC (kJ cm22) Min Uh Max Uh Ave Uh
G1 29.3 (0.8) 61 (4) 64 (15) 7.9 8.5 8.2 (0.4)
G2 29.2 (0.8) 73 (6) 71 (31) 7.3 8.2 7.8 (0.5)
G3 28.9 (1.0) 93 (4) 96 (32) 5.4 5.8 5.6 (0.3)
G4 29.3 (0.3) 116 (5) 117 (10) 2.6 6.4 4.5 (1.4)
G5 29.3 (0.5) 138 (9) 122 (18) 2.9 4.8 4.1 (0.9)
FIG. 2. Results from the PWP mixed layer numerical experiments showing the inner-core SST
during the storm at various intensification periods for each of the five groups.
NOVEMBER 2009 L I N E T A L . 3747
c. Enthalpy flux estimation
In order to evaluate the difference in the available
air–sea enthalpy (latent 1 sensible heat) flux due to
differences in the translation speed during the intensi-
fication process, for each group the inner-core sensible
(QS) and latent heat fluxes (QL) are calculated using the
bulk aerodynamic formulas (Jacob et al. 2000; Cione
and Uhlhorn 2003; Powell et al. 2003; Black et al. 2007)
as follows:
QS
5 CH
W(Ts� T
a)r
aC
pa, and (1)
QL
5 CE
W(qs� q
a)r
aL
va, (2)
where CH and CE are the sensible and latent heat ex-
change coefficients, respectively; W is the wind speed; Ts
and Ta are SST and near surface air temperature, re-
spectively; qs and qa are surface and air specific humidity,
respectively; and ra, Cpa, and Lva are air density, heat
capacity of the air, and latent heat of vaporization, re-
spectively. In this work, the exchange coefficients are from
Black et al. (2007). Corresponding to the self-induced
cooling (Fig. 4), fluxes are estimated progressively at
every 5 m s21 interval wind speed from categories 1 to 5,
so as to cover the complete range of intensification. The
near-surface atmospheric temperature and humidity
data is from the 1.1258 resolution data [i.e., the 40-yr
European Centre for Medium-Range Weather Fore-
casts (ECMWF) Re-Analysis (ERA-40)]. Thus, for each
typhoon case in the group, the corresponding ERA-40
data is used. Also the corresponding SST data for each
typhoon case in the group is from the output of the mixed
layer model (section 2b) so that the self-induced cooling
FIG. 3. Corresponding to Fig. 2, the
depth–temperature profiles during the storm
for each of the five groups at various inten-
sification periods.
3748 M O N T H L Y W E A T H E R R E V I E W VOLUME 137
effect during the intensification process can be incorpo-
rated. As in Fig. 4, the during-storm available enthalpy
fluxes for each group under various translation speeds
(i.e., Uh 5 1, 2, 3, . . . , 10 m s21) are estimated.
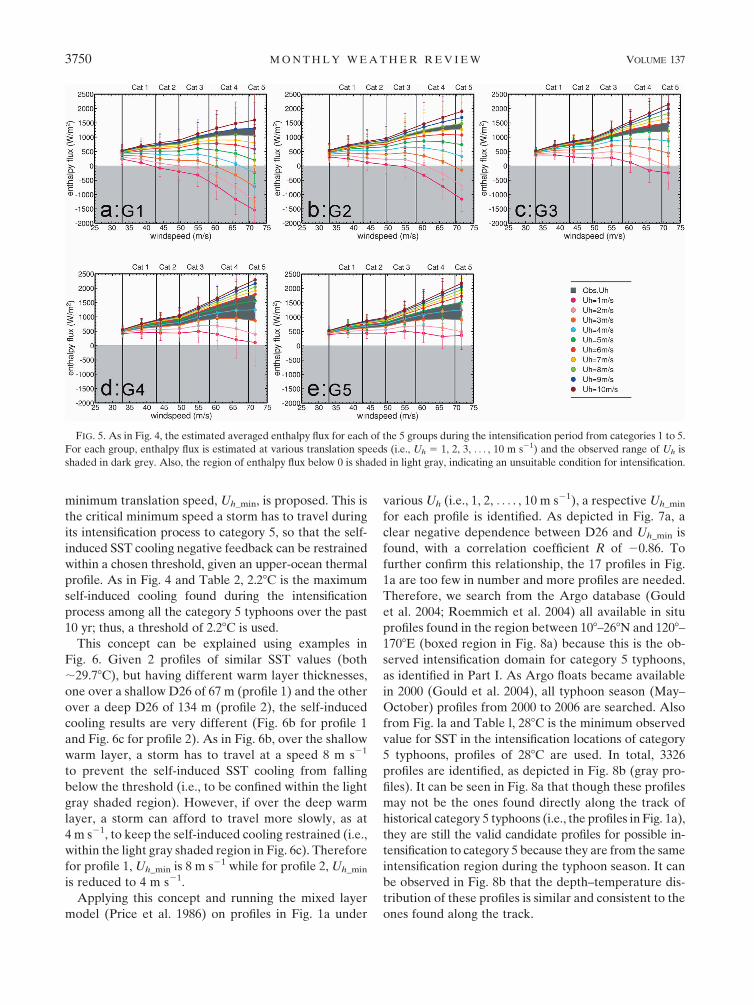
Figure 5 depicts the averaged available enthalpy flux
at inner core for each group. It can be seen that the flux
condition is consistent with the self-induced cooling
results that even over shallow waters like G1 and G2,
there can still be sufficient flux available during inten-
sification, as long as the translation speed is fast enough.
One can see that with the observed Uh of about 7.9–
8.5 m s21 for G1 (shaded region in Fig. 5a) and Uh of
7.3–8.2 m s21 for G2 (shaded region in Fig. 5b), the
available flux is comparable to the available flux over
deeper waters under moderate or slow speeds (e.g.,
shaded regions in Figs. 5d,e where Uh 5 2.6–6.4 m s21 for
5d and Uh 5 2.9–4.8 m s21 for 5e). Typically, at categories
1 and 2 the enthalpy flux is around 500–700 W m22, at
category 3 it is ;800–900 W m22, and at categories 4 and
5 it is around 1000–1500 W m22. It can also be seen in
Figs. 5a,b that if passing a shallow warm layer at a mod-
erate or slow speed (e.g., Uh 5 1–4 m s21), it is not pos-
sible to intensify to category 5 because the available en-
thalpy flux is around zero before reaching category 5.
3. Concept of the affordable minimum translationspeed (Uh_min) and the minimum D26 (D26_min)
From the above discussion, one can see that a shallow
warm layer allows a storm to intensify to category 5 only
under a fast translation speed. Over a deeper warm
layer, a storm is allowed to travel much slower and
can intensify to category 5 under both fast and slow
translation speeds. As such, it will be useful to identify a
critical minimum translation speed for each specific warm
layer. Thus, in this work, a new concept, affordable
TABLE 2. The during storm self-induced SST cooling estimated from the PWP model (Price et al. 1986) for each group at various
intensification periods.
Category 1 Category 2 Category 3 Category 4 Category 5
G1 0.7 (0.2) 1.1 (0) 1.2 (0.1) 1.7 (0.1) 2.1 (0.1)
G2 0.6 (0.3) 0.9 (0.4) 1.0 (0.4) 1.3 (0.5) 1.6 (0.5)
G3 0.2 (0.2) 0.5 (0.1) 0.6 (0.1) 1.0 (0.2) 1.3 (0.2)
G4 0.4 (0.2) 0.8 (0.3) 0.9 (0.3) 1.3 (0.4) 1.6 (0.5)
G5 0.6 (0.2) 0.9 (0.1) 1.0 (0.1) 1.3 (0.2) 1.6 (0.2)
FIG. 4. The averaged self-induced ocean cooling negative feedback estimated using the PWP model for each of the five groups under
progressively increasing wind forcing (interval every 5 m s21) from categories 1 to 5. For each group, self-induced cooling is estimated at
various translation speeds (i.e., Uh5 1, 2, 3, . . . , 10 m s21) and the observed range of Uh is shaded in dark gray.
NOVEMBER 2009 L I N E T A L . 3749
minimum translation speed, Uh_min, is proposed. This is
the critical minimum speed a storm has to travel during
its intensification process to category 5, so that the self-
induced SST cooling negative feedback can be restrained
within a chosen threshold, given an upper-ocean thermal
profile. As in Fig. 4 and Table 2, 2.28C is the maximum
self-induced cooling found during the intensification
process among all the category 5 typhoons over the past
10 yr; thus, a threshold of 2.28C is used.
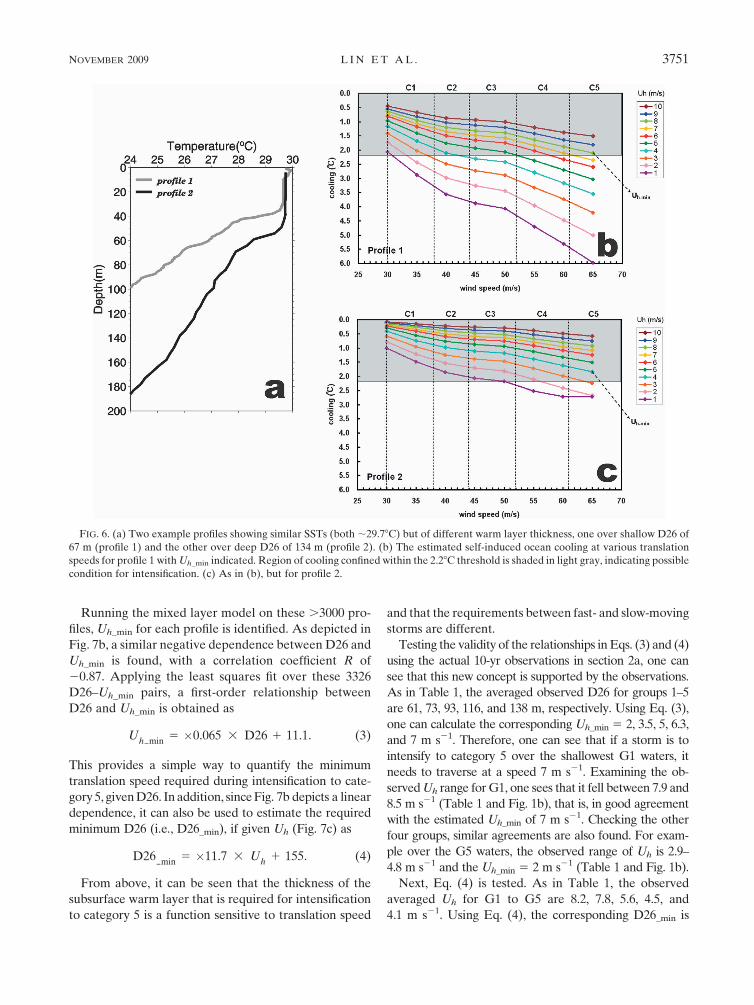
This concept can be explained using examples in
Fig. 6. Given 2 profiles of similar SST values (both
;29.78C), but having different warm layer thicknesses,
one over a shallow D26 of 67 m (profile 1) and the other
over a deep D26 of 134 m (profile 2), the self-induced
cooling results are very different (Fig. 6b for profile 1
and Fig. 6c for profile 2). As in Fig. 6b, over the shallow
warm layer, a storm has to travel at a speed 8 m s21
to prevent the self-induced SST cooling from falling
below the threshold (i.e., to be confined within the light
gray shaded region). However, if over the deep warm
layer, a storm can afford to travel more slowly, as at
4 m s21, to keep the self-induced cooling restrained (i.e.,
within the light gray shaded region in Fig. 6c). Therefore
for profile 1, Uh_min is 8 m s21 while for profile 2, Uh_min
is reduced to 4 m s21.
Applying this concept and running the mixed layer
model (Price et al. 1986) on profiles in Fig. 1a under
various Uh (i.e., 1, 2, . . . . , 10 m s21), a respective Uh_min
for each profile is identified. As depicted in Fig. 7a, a
clear negative dependence between D26 and Uh_min is
found, with a correlation coefficient R of 20.86. To
further confirm this relationship, the 17 profiles in Fig.
1a are too few in number and more profiles are needed.
Therefore, we search from the Argo database (Gould
et al. 2004; Roemmich et al. 2004) all available in situ
profiles found in the region between 108–268N and 1208–
1708E (boxed region in Fig. 8a) because this is the ob-
served intensification domain for category 5 typhoons,
as identified in Part I. As Argo floats became available
in 2000 (Gould et al. 2004), all typhoon season (May–
October) profiles from 2000 to 2006 are searched. Also
from Fig. la and Table l, 288C is the minimum observed
value for SST in the intensification locations of category
5 typhoons, profiles of 288C are used. In total, 3326
profiles are identified, as depicted in Fig. 8b (gray pro-
files). It can be seen in Fig. 8a that though these profiles
may not be the ones found directly along the track of
historical category 5 typhoons (i.e., the profiles in Fig. 1a),
they are still the valid candidate profiles for possible in-
tensification to category 5 because they are from the same
intensification region during the typhoon season. It can
be observed in Fig. 8b that the depth–temperature dis-
tribution of these profiles is similar and consistent to the
ones found along the track.
FIG. 5. As in Fig. 4, the estimated averaged enthalpy flux for each of the 5 groups during the intensification period from categories 1 to 5.
For each group, enthalpy flux is estimated at various translation speeds (i.e., Uh 5 1, 2, 3, . . . , 10 m s21) and the observed range of Uh is
shaded in dark grey. Also, the region of enthalpy flux below 0 is shaded in light gray, indicating an unsuitable condition for intensification.
3750 M O N T H L Y W E A T H E R R E V I E W VOLUME 137
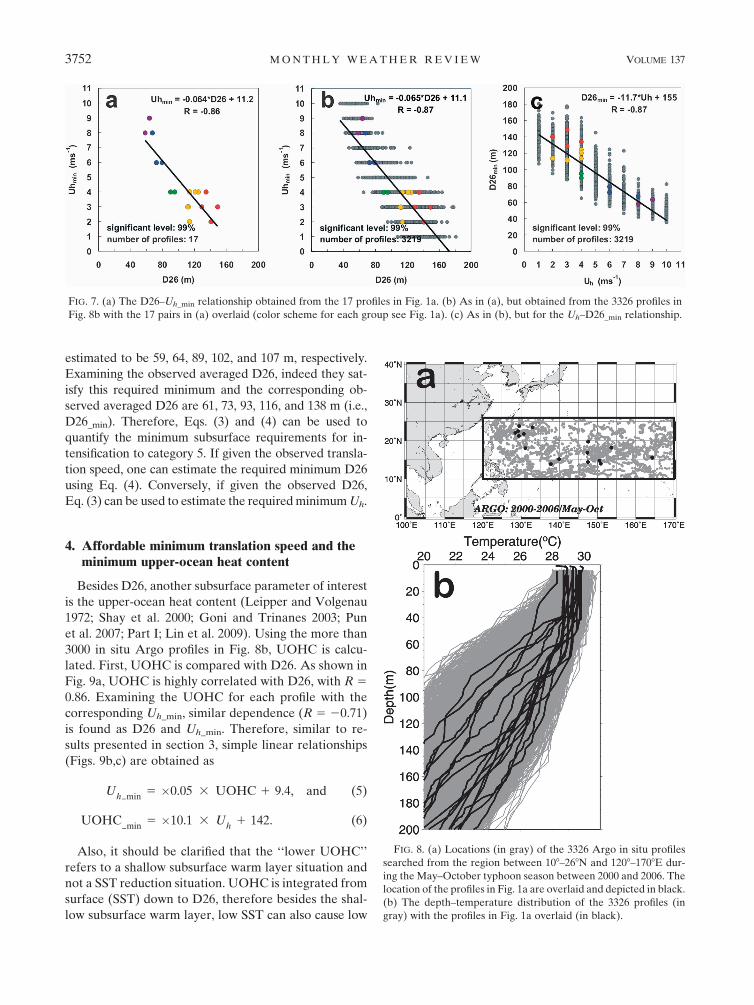
Running the mixed layer model on these .3000 pro-
files, Uh_min for each profile is identified. As depicted in
Fig. 7b, a similar negative dependence between D26 and
Uh_min is found, with a correlation coefficient R of
20.87. Applying the least squares fit over these 3326
D26–Uh_min pairs, a first-order relationship between
D26 and Uh_min is obtained as
Uh min
5 �0.065 3 D26 1 11.1. (3)
This provides a simple way to quantify the minimum
translation speed required during intensification to cate-
gory 5, given D26. In addition, since Fig. 7b depicts a linear
dependence, it can also be used to estimate the required
minimum D26 (i.e., D26_min), if given Uh (Fig. 7c) as
D26min
5 �11.7 3 Uh
1 155. (4)
From above, it can be seen that the thickness of the
subsurface warm layer that is required for intensification
to category 5 is a function sensitive to translation speed
and that the requirements between fast- and slow-moving
storms are different.
Testing the validity of the relationships in Eqs. (3) and (4)
using the actual 10-yr observations in section 2a, one can
see that this new concept is supported by the observations.
As in Table 1, the averaged observed D26 for groups 1–5
are 61, 73, 93, 116, and 138 m, respectively. Using Eq. (3),
one can calculate the corresponding Uh_min 5 2, 3.5, 5, 6.3,
and 7 m s21. Therefore, one can see that if a storm is to
intensify to category 5 over the shallowest G1 waters, it
needs to traverse at a speed 7 m s21. Examining the ob-
served Uh range for G1, one sees that it fell between 7.9 and
8.5 m s21 (Table 1 and Fig. 1b), that is, in good agreement
with the estimated Uh_min of 7 m s21. Checking the other
four groups, similar agreements are also found. For exam-
ple over the G5 waters, the observed range of Uh is 2.9–
4.8 m s21 and the Uh_min 5 2 m s21 (Table 1 and Fig. 1b).
Next, Eq. (4) is tested. As in Table 1, the observed
averaged Uh for G1 to G5 are 8.2, 7.8, 5.6, 4.5, and
4.1 m s21. Using Eq. (4), the corresponding D26_min is
FIG. 6. (a) Two example profiles showing similar SSTs (both ;29.78C) but of different warm layer thickness, one over shallow D26 of
67 m (profile 1) and the other over deep D26 of 134 m (profile 2). (b) The estimated self-induced ocean cooling at various translation
speeds for profile 1 with Uh_min indicated. Region of cooling confined within the 2.28C threshold is shaded in light gray, indicating possible
condition for intensification. (c) As in (b), but for profile 2.
NOVEMBER 2009 L I N E T A L . 3751
estimated to be 59, 64, 89, 102, and 107 m, respectively.
Examining the observed averaged D26, indeed they sat-
isfy this required minimum and the corresponding ob-
served averaged D26 are 61, 73, 93, 116, and 138 m (i.e.,
D26_min). Therefore, Eqs. (3) and (4) can be used to
quantify the minimum subsurface requirements for in-
tensification to category 5. If given the observed transla-
tion speed, one can estimate the required minimum D26
using Eq. (4). Conversely, if given the observed D26,
Eq. (3) can be used to estimate the required minimum Uh.
4. Affordable minimum translation speed and theminimum upper-ocean heat content
Besides D26, another subsurface parameter of interest
is the upper-ocean heat content (Leipper and Volgenau
1972; Shay et al. 2000; Goni and Trinanes 2003; Pun
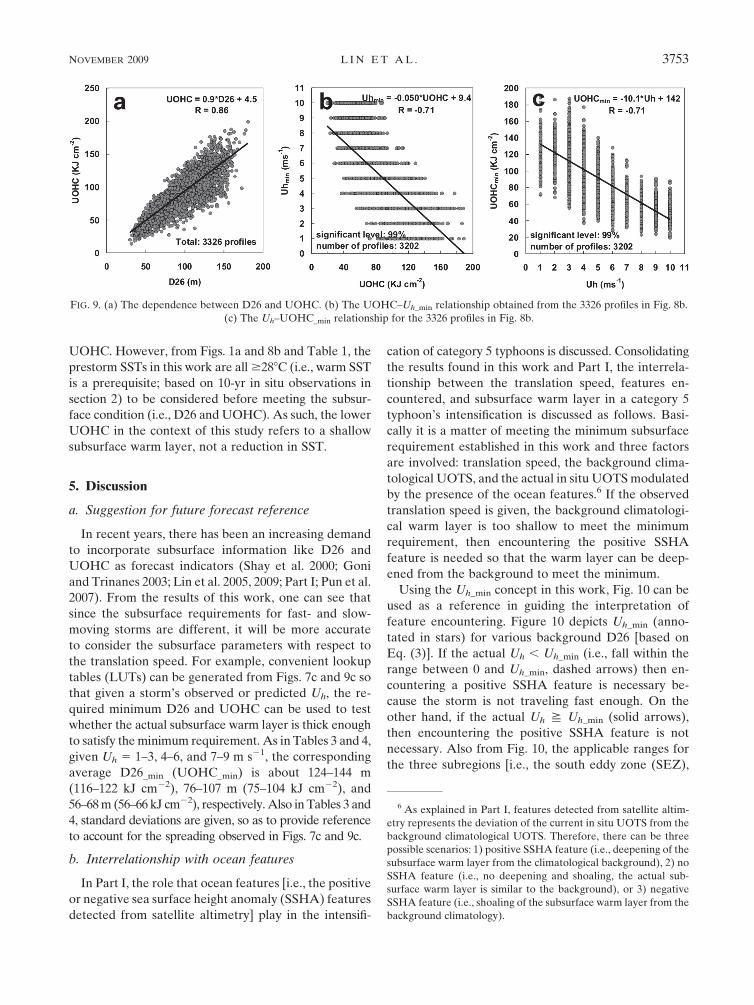
et al. 2007; Part I; Lin et al. 2009). Using the more than
3000 in situ Argo profiles in Fig. 8b, UOHC is calcu-
lated. First, UOHC is compared with D26. As shown in
Fig. 9a, UOHC is highly correlated with D26, with R 5
0.86. Examining the UOHC for each profile with the
corresponding Uh_min, similar dependence (R 5 20.71)
is found as D26 and Uh_min. Therefore, similar to re-
sults presented in section 3, simple linear relationships
(Figs. 9b,c) are obtained as
Uh min
5 �0.05 3 UOHC 1 9.4, and (5)
UOHCmin
5 �10.1 3 Uh
1 142. (6)
Also, it should be clarified that the ‘‘lower UOHC’’
refers to a shallow subsurface warm layer situation and
not a SST reduction situation. UOHC is integrated from
surface (SST) down to D26, therefore besides the shal-
low subsurface warm layer, low SST can also cause low
FIG. 7. (a) The D26–Uh_min relationship obtained from the 17 profiles in Fig. 1a. (b) As in (a), but obtained from the 3326 profiles in
Fig. 8b with the 17 pairs in (a) overlaid (color scheme for each group see Fig. 1a). (c) As in (b), but for the Uh–D26_min relationship.
FIG. 8. (a) Locations (in gray) of the 3326 Argo in situ profiles
searched from the region between 108–268N and 1208–1708E dur-
ing the May–October typhoon season between 2000 and 2006. The
location of the profiles in Fig. 1a are overlaid and depicted in black.
(b) The depth–temperature distribution of the 3326 profiles (in
gray) with the profiles in Fig. 1a overlaid (in black).
3752 M O N T H L Y W E A T H E R R E V I E W VOLUME 137
UOHC. However, from Figs. 1a and 8b and Table 1, the
prestorm SSTs in this work are all $288C (i.e., warm SST
is a prerequisite; based on 10-yr in situ observations in
section 2) to be considered before meeting the subsur-
face condition (i.e., D26 and UOHC). As such, the lower
UOHC in the context of this study refers to a shallow
subsurface warm layer, not a reduction in SST.
5. Discussion
a. Suggestion for future forecast reference
In recent years, there has been an increasing demand
to incorporate subsurface information like D26 and
UOHC as forecast indicators (Shay et al. 2000; Goni
and Trinanes 2003; Lin et al. 2005, 2009; Part I; Pun et al.
2007). From the results of this work, one can see that
since the subsurface requirements for fast- and slow-
moving storms are different, it will be more accurate
to consider the subsurface parameters with respect to
the translation speed. For example, convenient lookup
tables (LUTs) can be generated from Figs. 7c and 9c so
that given a storm’s observed or predicted Uh, the re-
quired minimum D26 and UOHC can be used to test
whether the actual subsurface warm layer is thick enough
to satisfy the minimum requirement. As in Tables 3 and 4,
given Uh 5 1–3, 4–6, and 7–9 m s21, the corresponding
average D26_min (UOHC_min) is about 124–144 m
(116–122 kJ cm22), 76–107 m (75–104 kJ cm22), and
56–68 m (56–66 kJ cm22), respectively. Also in Tables 3 and
4, standard deviations are given, so as to provide reference
to account for the spreading observed in Figs. 7c and 9c.
b. Interrelationship with ocean features
In Part I, the role that ocean features [i.e., the positive
or negative sea surface height anomaly (SSHA) features
detected from satellite altimetry] play in the intensifi-
cation of category 5 typhoons is discussed. Consolidating
the results found in this work and Part I, the interrela-
tionship between the translation speed, features en-
countered, and subsurface warm layer in a category 5
typhoon’s intensification is discussed as follows. Basi-
cally it is a matter of meeting the minimum subsurface
requirement established in this work and three factors
are involved: translation speed, the background clima-
tological UOTS, and the actual in situ UOTS modulated
by the presence of the ocean features.6 If the observed
translation speed is given, the background climatologi-
cal warm layer is too shallow to meet the minimum
requirement, then encountering the positive SSHA
feature is needed so that the warm layer can be deep-
ened from the background to meet the minimum.
Using the Uh_min concept in this work, Fig. 10 can be
used as a reference in guiding the interpretation of
feature encountering. Figure 10 depicts Uh_min (anno-
tated in stars) for various background D26 [based on
Eq. (3)]. If the actual Uh , Uh_min (i.e., fall within the
range between 0 and Uh_min, dashed arrows) then en-
countering a positive SSHA feature is necessary be-
cause the storm is not traveling fast enough. On the
other hand, if the actual Uh S Uh_min (solid arrows),
then encountering the positive SSHA feature is not
necessary. Also from Fig. 10, the applicable ranges for
the three subregions [i.e., the south eddy zone (SEZ),
FIG. 9. (a) The dependence between D26 and UOHC. (b) The UOHC–Uh_min relationship obtained from the 3326 profiles in Fig. 8b.
(c) The Uh–UOHC_min relationship for the 3326 profiles in Fig. 8b.
6 As explained in Part I, features detected from satellite altim-
etry represents the deviation of the current in situ UOTS from the
background climatological UOTS. Therefore, there can be three
possible scenarios: 1) positive SSHA feature (i.e., deepening of the
subsurface warm layer from the climatological background), 2) no
SSHA feature (i.e., no deepening and shoaling, the actual sub-
surface warm layer is similar to the background), or 3) negative
SSHA feature (i.e., shoaling of the subsurface warm layer from the
background climatology).
NOVEMBER 2009 L I N E T A L . 3753
Kuroshio, and the central gyre] in the western North
Pacific identified in Part I are depicted. It can be clearly
seen that the shallower the background (e.g., the SEZ),
the larger the corresponding Uh_min, the more encoun-
tering of positive SSHA features (i.e., over wider range
of Uh) is needed, and vice versa.
c. Issues on changing the threshold
In this study, because 2.28C is the maximum self-induced
cooling found during the intensification to category-5 in
the past 10 yr (Table 2), it is used as the threshold value
to obtain the minimum translation speed (sections 3
and 4). If one replaces the threshold using the mean self-
induced cooling value of around 1.68C (i.e., last column
in Table 2) instead of 2.28C and redoes the mixed layer
experiments, then the new D26–Uh pairs and the regres-
sion relationship would provide the mean translation
speed (Uh_mean) instead of the minimum. In other words,
given D26 or UOHC, Uh_min is the minimum speed a
storm has to travel to keep the self-induced cooling below
the maximum cooling of 2.28C while Uh_mean would be
the mean speed a storm travels to keep the cooling at the
mean value of around 1.68C. As can be seen in Fig. 11, the
new regression relationship is given as
Uh mean
5 �0.06 3 D26 1 12.1. (7)
By comparing the new regression relationship [black
solid curve in Fig. 11a, i.e., Eq. (7)] with the relationship
for the Uh_min [brown solid curve in Fig. 11a or black
curve in Fig. 7b, i.e., (3)], one can see that given the
same D26, Uh_mean . Uh_min. By overlaying the actual
observed D26 and Uh pairs for the category 5 typhoons
in the past 10 yr (i.e., from section 2a), one can see that
this mean relationship matches well the actual obser-
vations and the regression relationship derived from the
actual D26–Uh pairs [i.e., the black dash regression line
in Fig. 11a, Uh_obs 5 20.055 3 D26_obs 1 11.3, Eq. (8)]
is almost identical to Eq. (7). Similarly as in Fig. 11b, if
given Uh, the corresponding D26_mean . D26_min.
d. Issues on other factors
Though in this work the focus is on the role of the
translation speed, it does not imply that other factors
are not important. For example, issues related to ty-
phoon size, ocean’s horizontal advection, upwelling,
and stratification are also important factors consider in
the future. For example when considering the thermo-
cline stability below the ocean mixed layer, the Brunt–
Vaisala frequency N2 can be calculated from the Argo
profiles. With this extra information, one can further
subdivide the D26_min–Uh pairs (i.e., Fig. 7c) into two
groups, one under the small regular N2 condition (here
&431024s22 is used as the criterion, Fig. 12a) while the
other under the large N2 condition (Fig. 12b). Thus,
regression relationships can be obtained separately for
these two subgroups. As can be seen in Fig. 12b, under
the large N2 (i.e., more stratified) condition, it does not
need as deep the subsurface warm layer to intensify to
category 5; for example, if given Uh 5 5 m s21, the
corresponding D26_min is ;82 m under the large N2
condition (Fig. 12b) and ;99 m under the small regular
N2 condition. This is reasonable since large N2 is unfa-
vorable for mixing and thus inhibits the self-induced
cooling negative feedback. As such, if the N2 is large,
the subsurface warm layer required for intensification
to category 5 is not as deep as compared to the small
regular N2 condition.
Finally, it should also be mentioned that the ocean’s
condition (including SST and subsurface) is a necessary
but not a sufficient condition for intensification and the
focus of this work is to explore the borderline of the
ocean’s necessary subsurface condition with respect to
the translation speed for category 5 typhoons. Certainly
it is not possible to reach category 5 without meeting
all other favorable atmospheric and storm structure
TABLE 3. Lookup table of the required minimum D26 (i.e., D26_min) under various translation speeds based on Fig. 7c.
Uh (m s21) 1 2 3 4 5 6 7 8 9 10
Mean D26 (m) 144 134 124 107 90 76 68 61 56 50
Std dev 13 13 15 15 14 11 11 8 7 7
Mean 6 std dev 131–157 121–147 109–139 92–122 76–104 65–87 57–79 53–69 49–63 43–57
TABLE 4. Lookup table of the required minimum UOHC (i.e., UOHC_min) under various translation speeds based on Fig. 9c.
Uh (m s21) 1 2 3 4 5 6 7 8 9 10
Mean UOHC (kJ cm22) 122 122 116 104 89 75 66 58 56 50
Std dev 25 23 24 22 20 18 17 15 14 14
Mean 6 std dev 97–147 99–145 92–140 82–126 69–109 57–93 49–83 43–73 42–70 36–64
3754 M O N T H L Y W E A T H E R R E V I E W VOLUME 137
conditions (e.g., Merrill 1988; Frank and Ritchie 2001;
Wang and Wu 2003; Emanuel et al. 2004; Montgomery
et al. 2006; Houze et al. 2007; Mainelli et al. 2008).
6. Conclusions
Category 5 cyclones are the most intense cyclones
on earth. For a long time it has been known that in
addition to warm SST, a sufficiently thick layer of sub-
surface warm water is required as a necessary precondi-
tion for reaching such a high intensity (e.g., Leipper
and Volgenau 1972; Gray 1979). However, because
of the lack of in situ observations it has been difficult
to quantify how thick a subsurface warm layer is con-
sidered as thick enough. With the advancement in in situ
ocean observations like the deployment of Argo floats
(Roemmich et al. 2004; Trenberth 2006), it is now pos-
sible to take a fresh look at the situation using new
observations. Based on 10 yr of data, it is found that SST
is typically around 298C. However, the subsurface con-
dition depends strongly on cyclone’s translation speed.
It is observed that faster-moving typhoons of Uh ;
7–8 m s21 can afford to intensify to category 5 over a
shallow subsurface warm layer characterized by D26 ;
60–70 m and UOHC ; 65–70 kJ cm22 while slow-
moving typhoons need much deeper subsurface layers;
for example, D26 ; 115–140 m and UOHC ; 115–125
kJ cm22 are needed for traveling at Uh ; 2–3 m s21.
Ocean mixed layer numerical experiments and air–sea
enthalpy flux estimations support the above observa-
tions that though over relatively shallow layer, there is
still sufficient flux for intensification since the negative
feedback from cyclone’s self-induced cooling (Price 1981;
Emanuel 1999) can still be effectively restrained under
fast translation speed. On the contrary, as the negative
feedback is much enhanced when a storm is slow moving
(Price 1981; Lin et al. 2003a,b), a much deeper subsurface
warm layer is required for slow-moving typhoons.
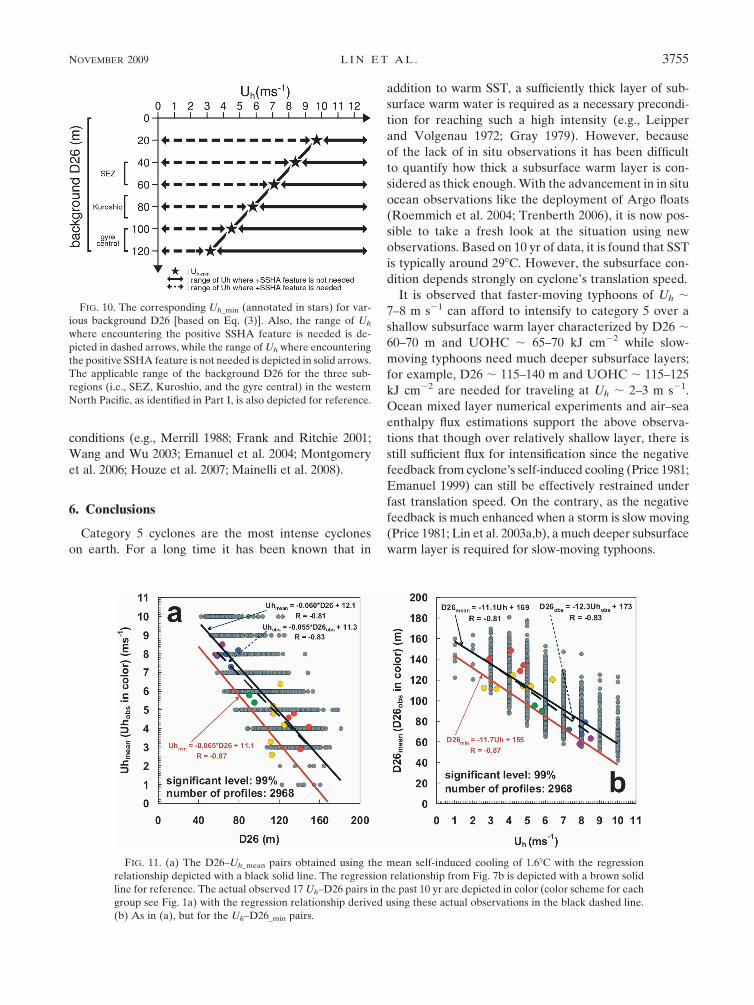
FIG. 10. The corresponding Uh_min (annotated in stars) for var-
ious background D26 [based on Eq. (3)]. Also, the range of Uh
where encountering the positive SSHA feature is needed is de-
picted in dashed arrows, while the range of Uh where encountering
the positive SSHA feature is not needed is depicted in solid arrows.
The applicable range of the background D26 for the three sub-
regions (i.e., SEZ, Kuroshio, and the gyre central) in the western
North Pacific, as identified in Part I, is also depicted for reference.
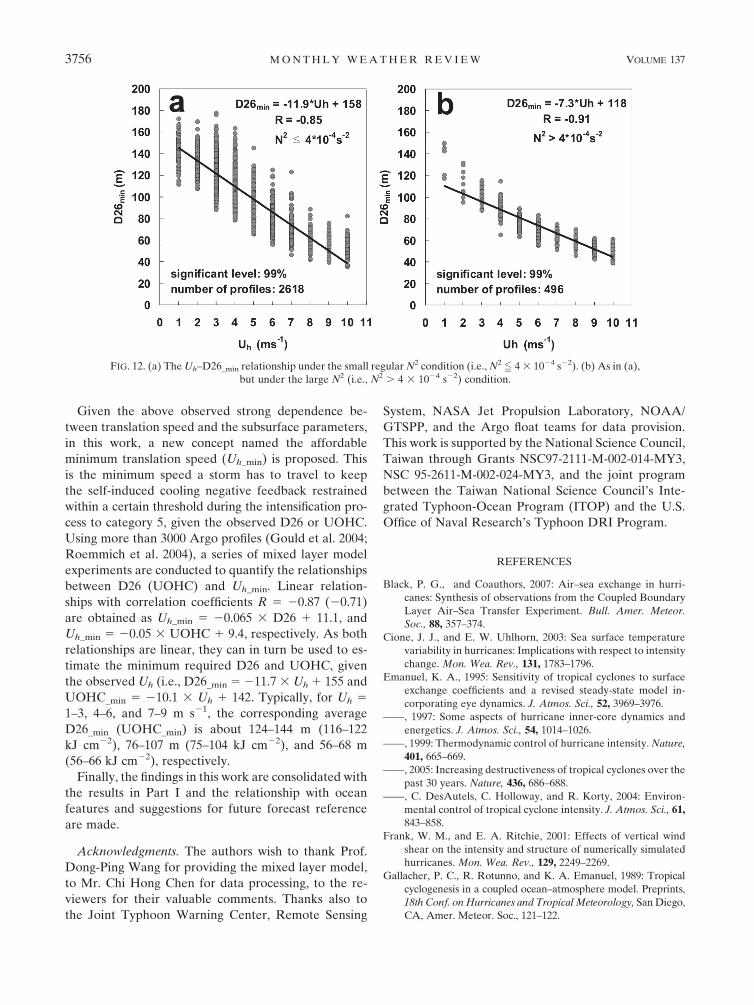
FIG. 11. (a) The D26–Uh_mean pairs obtained using the mean self-induced cooling of 1.68C with the regression
relationship depicted with a black solid line. The regression relationship from Fig. 7b is depicted with a brown solid
line for reference. The actual observed 17 Uh–D26 pairs in the past 10 yr are depicted in color (color scheme for each
group see Fig. 1a) with the regression relationship derived using these actual observations in the black dashed line.
(b) As in (a), but for the Uh–D26_min pairs.
NOVEMBER 2009 L I N E T A L . 3755
Given the above observed strong dependence be-
tween translation speed and the subsurface parameters,
in this work, a new concept named the affordable
minimum translation speed (Uh_min) is proposed. This
is the minimum speed a storm has to travel to keep
the self-induced cooling negative feedback restrained
within a certain threshold during the intensification pro-
cess to category 5, given the observed D26 or UOHC.
Using more than 3000 Argo profiles (Gould et al. 2004;
Roemmich et al. 2004), a series of mixed layer model
experiments are conducted to quantify the relationships
between D26 (UOHC) and Uh_min. Linear relation-
ships with correlation coefficients R 5 20.87 (20.71)
are obtained as Uh_min 5 20.065 3 D26 1 11.1, and
Uh_min 5 20.05 3 UOHC 1 9.4, respectively. As both
relationships are linear, they can in turn be used to es-
timate the minimum required D26 and UOHC, given
the observed Uh (i.e., D26_min 5 211.7 3 Uh 1 155 and
UOHC_min 5 210.1 3 Uh 1 142. Typically, for Uh 5
1–3, 4–6, and 7–9 m s21, the corresponding average
D26_min (UOHC_min) is about 124–144 m (116–122
kJ cm22), 76–107 m (75–104 kJ cm22), and 56–68 m
(56–66 kJ cm22), respectively.
Finally, the findings in this work are consolidated with
the results in Part I and the relationship with ocean
features and suggestions for future forecast reference
are made.
Acknowledgments. The authors wish to thank Prof.
Dong-Ping Wang for providing the mixed layer model,
to Mr. Chi Hong Chen for data processing, to the re-
viewers for their valuable comments. Thanks also to
the Joint Typhoon Warning Center, Remote Sensing
System, NASA Jet Propulsion Laboratory, NOAA/
GTSPP, and the Argo float teams for data provision.
This work is supported by the National Science Council,
Taiwan through Grants NSC97-2111-M-002-014-MY3,
NSC 95-2611-M-002-024-MY3, and the joint program
between the Taiwan National Science Council’s Inte-
grated Typhoon-Ocean Program (ITOP) and the U.S.
Office of Naval Research’s Typhoon DRI Program.
REFERENCES
Black, P. G., and Coauthors, 2007: Air–sea exchange in hurri-
canes: Synthesis of observations from the Coupled Boundary
Layer Air–Sea Transfer Experiment. Bull. Amer. Meteor.
Soc., 88, 357–374.
Cione, J. J., and E. W. Uhlhorn, 2003: Sea surface temperature
variability in hurricanes: Implications with respect to intensity
change. Mon. Wea. Rev., 131, 1783–1796.
Emanuel, K. A., 1995: Sensitivity of tropical cyclones to surface
exchange coefficients and a revised steady-state model in-
corporating eye dynamics. J. Atmos. Sci., 52, 3969–3976.
——, 1997: Some aspects of hurricane inner-core dynamics and
energetics. J. Atmos. Sci., 54, 1014–1026.
——, 1999: Thermodynamic control of hurricane intensity. Nature,
401, 665–669.
——, 2005: Increasing destructiveness of tropical cyclones over the
past 30 years. Nature, 436, 686–688.
——, C. DesAutels, C. Holloway, and R. Korty, 2004: Environ-
mental control of tropical cyclone intensity. J. Atmos. Sci., 61,843–858.
Frank, W. M., and E. A. Ritchie, 2001: Effects of vertical wind
shear on the intensity and structure of numerically simulated
hurricanes. Mon. Wea. Rev., 129, 2249–2269.
Gallacher, P. C., R. Rotunno, and K. A. Emanuel, 1989: Tropical
cyclogenesis in a coupled ocean–atmosphere model. Preprints,
18th Conf. on Hurricanes and Tropical Meteorology, San Diego,
CA, Amer. Meteor. Soc., 121–122.
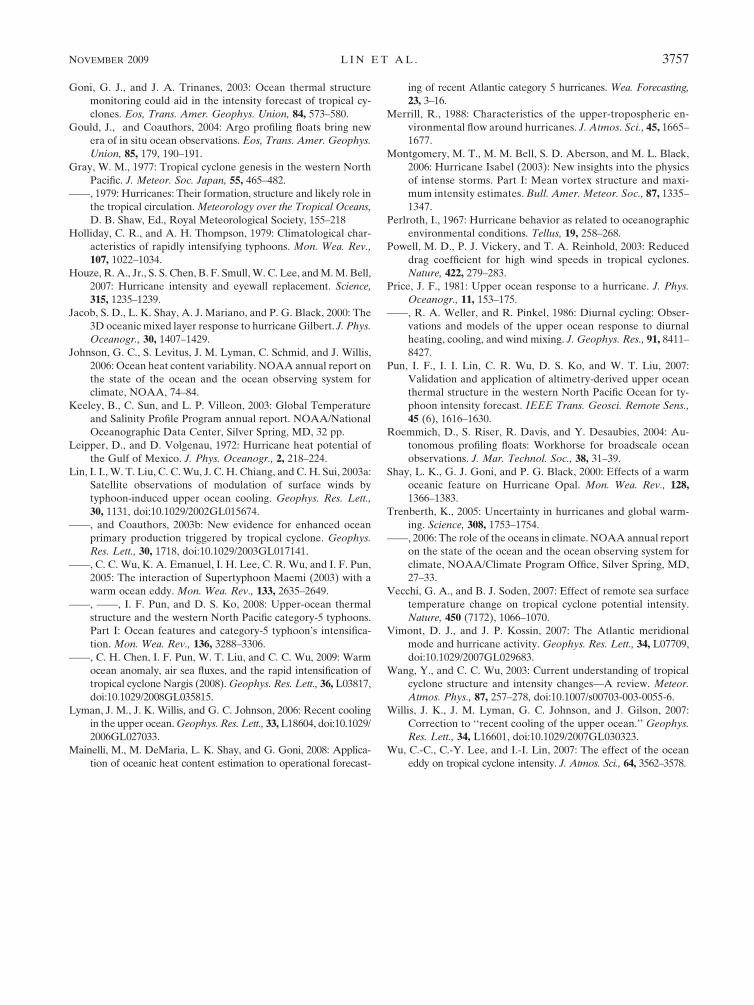
FIG. 12. (a) The Uh–D26_min relationship under the small regular N2 condition (i.e., N25 4 3 1024 s22). (b) As in (a),
but under the large N2 (i.e., N2 . 4 3 1024 s22) condition.
3756 M O N T H L Y W E A T H E R R E V I E W VOLUME 137
Goni, G. J., and J. A. Trinanes, 2003: Ocean thermal structure
monitoring could aid in the intensity forecast of tropical cy-
clones. Eos, Trans. Amer. Geophys. Union, 84, 573–580.
Gould, J., and Coauthors, 2004: Argo profiling floats bring new
era of in situ ocean observations. Eos, Trans. Amer. Geophys.
Union, 85, 179, 190–191.
Gray, W. M., 1977: Tropical cyclone genesis in the western North
Pacific. J. Meteor. Soc. Japan, 55, 465–482.
——, 1979: Hurricanes: Their formation, structure and likely role in
the tropical circulation. Meteorology over the Tropical Oceans,
D. B. Shaw, Ed., Royal Meteorological Society, 155–218
Holliday, C. R., and A. H. Thompson, 1979: Climatological char-
acteristics of rapidly intensifying typhoons. Mon. Wea. Rev.,
107, 1022–1034.
Houze, R. A., Jr., S. S. Chen, B. F. Smull, W. C. Lee, and M. M. Bell,
2007: Hurricane intensity and eyewall replacement. Science,
315, 1235–1239.
Jacob, S. D., L. K. Shay, A. J. Mariano, and P. G. Black, 2000: The
3D oceanic mixed layer response to hurricane Gilbert. J. Phys.
Oceanogr., 30, 1407–1429.
Johnson, G. C., S. Levitus, J. M. Lyman, C. Schmid, and J. Willis,
2006: Ocean heat content variability. NOAA annual report on
the state of the ocean and the ocean observing system for
climate, NOAA, 74–84.
Keeley, B., C. Sun, and L. P. Villeon, 2003: Global Temperature
and Salinity Profile Program annual report. NOAA/National
Oceanographic Data Center, Silver Spring, MD, 32 pp.
Leipper, D., and D. Volgenau, 1972: Hurricane heat potential of
the Gulf of Mexico. J. Phys. Oceanogr., 2, 218–224.
Lin, I. I., W. T. Liu, C. C. Wu, J. C. H. Chiang, and C. H. Sui, 2003a:
Satellite observations of modulation of surface winds by
typhoon-induced upper ocean cooling. Geophys. Res. Lett.,
30, 1131, doi:10.1029/2002GL015674.
——, and Coauthors, 2003b: New evidence for enhanced ocean
primary production triggered by tropical cyclone. Geophys.
Res. Lett., 30, 1718, doi:10.1029/2003GL017141.
——, C. C. Wu, K. A. Emanuel, I. H. Lee, C. R. Wu, and I. F. Pun,
2005: The interaction of Supertyphoon Maemi (2003) with a
warm ocean eddy. Mon. Wea. Rev., 133, 2635–2649.
——, ——, I. F. Pun, and D. S. Ko, 2008: Upper-ocean thermal
structure and the western North Pacific category-5 typhoons.
Part I: Ocean features and category-5 typhoon’s intensifica-
tion. Mon. Wea. Rev., 136, 3288–3306.
——, C. H. Chen, I. F. Pun, W. T. Liu, and C. C. Wu, 2009: Warm
ocean anomaly, air sea fluxes, and the rapid intensification of
tropical cyclone Nargis (2008). Geophys. Res. Lett., 36, L03817,
doi:10.1029/2008GL035815.
Lyman, J. M., J. K. Willis, and G. C. Johnson, 2006: Recent cooling
in the upper ocean. Geophys. Res. Lett., 33, L18604, doi:10.1029/
2006GL027033.
Mainelli, M., M. DeMaria, L. K. Shay, and G. Goni, 2008: Applica-
tion of oceanic heat content estimation to operational forecast-
ing of recent Atlantic category 5 hurricanes. Wea. Forecasting,
23, 3–16.
Merrill, R., 1988: Characteristics of the upper-tropospheric en-
vironmental flow around hurricanes. J. Atmos. Sci., 45, 1665–
1677.
Montgomery, M. T., M. M. Bell, S. D. Aberson, and M. L. Black,
2006: Hurricane Isabel (2003): New insights into the physics
of intense storms. Part I: Mean vortex structure and maxi-
mum intensity estimates. Bull. Amer. Meteor. Soc., 87, 1335–
1347.
Perlroth, I., 1967: Hurricane behavior as related to oceanographic
environmental conditions. Tellus, 19, 258–268.
Powell, M. D., P. J. Vickery, and T. A. Reinhold, 2003: Reduced
drag coefficient for high wind speeds in tropical cyclones.
Nature, 422, 279–283.
Price, J. F., 1981: Upper ocean response to a hurricane. J. Phys.
Oceanogr., 11, 153–175.
——, R. A. Weller, and R. Pinkel, 1986: Diurnal cycling: Obser-
vations and models of the upper ocean response to diurnal
heating, cooling, and wind mixing. J. Geophys. Res., 91, 8411–
8427.
Pun, I. F., I. I. Lin, C. R. Wu, D. S. Ko, and W. T. Liu, 2007:
Validation and application of altimetry-derived upper ocean
thermal structure in the western North Pacific Ocean for ty-
phoon intensity forecast. IEEE Trans. Geosci. Remote Sens.,
45 (6), 1616–1630.
Roemmich, D., S. Riser, R. Davis, and Y. Desaubies, 2004: Au-
tonomous profiling floats: Workhorse for broadscale ocean
observations. J. Mar. Technol. Soc., 38, 31–39.
Shay, L. K., G. J. Goni, and P. G. Black, 2000: Effects of a warm
oceanic feature on Hurricane Opal. Mon. Wea. Rev., 128,
1366–1383.
Trenberth, K., 2005: Uncertainty in hurricanes and global warm-
ing. Science, 308, 1753–1754.
——, 2006: The role of the oceans in climate. NOAA annual report
on the state of the ocean and the ocean observing system for
climate, NOAA/Climate Program Office, Silver Spring, MD,
27–33.
Vecchi, G. A., and B. J. Soden, 2007: Effect of remote sea surface
temperature change on tropical cyclone potential intensity.
Nature, 450 (7172), 1066–1070.
Vimont, D. J., and J. P. Kossin, 2007: The Atlantic meridional
mode and hurricane activity. Geophys. Res. Lett., 34, L07709,
doi:10.1029/2007GL029683.
Wang, Y., and C. C. Wu, 2003: Current understanding of tropical
cyclone structure and intensity changes—A review. Meteor.
Atmos. Phys., 87, 257–278, doi:10.1007/s00703-003-0055-6.
Willis, J. K., J. M. Lyman, G. C. Johnson, and J. Gilson, 2007:
Correction to ‘‘recent cooling of the upper ocean.’’ Geophys.
Res. Lett., 34, L16601, doi:10.1029/2007GL030323.
Wu, C.-C., C.-Y. Lee, and I.-I. Lin, 2007: The effect of the ocean
eddy on tropical cyclone intensity. J. Atmos. Sci., 64, 3562–3578.
NOVEMBER 2009 L I N E T A L . 3757


![Category-6 supertyphoon Haiyan in global warming hiatus ...homepage.ntu.edu.tw/~iilin/publication/journal_papers/2011-2015/20… · Lin et al., 2005;Cione et al., 2013]. Ocean is](https://img.pdfslide.us/doc/110x75/5ec9a332d1fd7f251930c8bf/category-6-supertyphoon-haiyan-in-global-warming-hiatus-iilinpublicationjournalpapers2011-201520.jpg)