Embed Size (px)
Citation preview
Upper North Fork Clearwater - 17060307 Idaho 8 Digit Hydrologic Unit Profile August 2006
The United States Department of Agriculture (USDA) prohibits discrimination in all its programs and activities on the basis of race, color, national origin, sex, religion, age, disability, political beliefs, sexual orientation, and marital or family status. (Not all prohibited bases apply to all programs.) Persons with disabilities who require alternative means for communication of program information (Braille, large print, audiotape, etc.) should contact USDA’s TARGET Center at 202-720-2600 (voice and TDD).
To file a complaint of discrimination, write USDA, Director, Office of Civil Rights, Room 326W, Whitten Building, 14th and Independence Avenue, SW, Washington DC 20250-9410 or call (202) 720-5964 (voice and TDD). USDA is an equal opportunity provider and employer.
Introduction
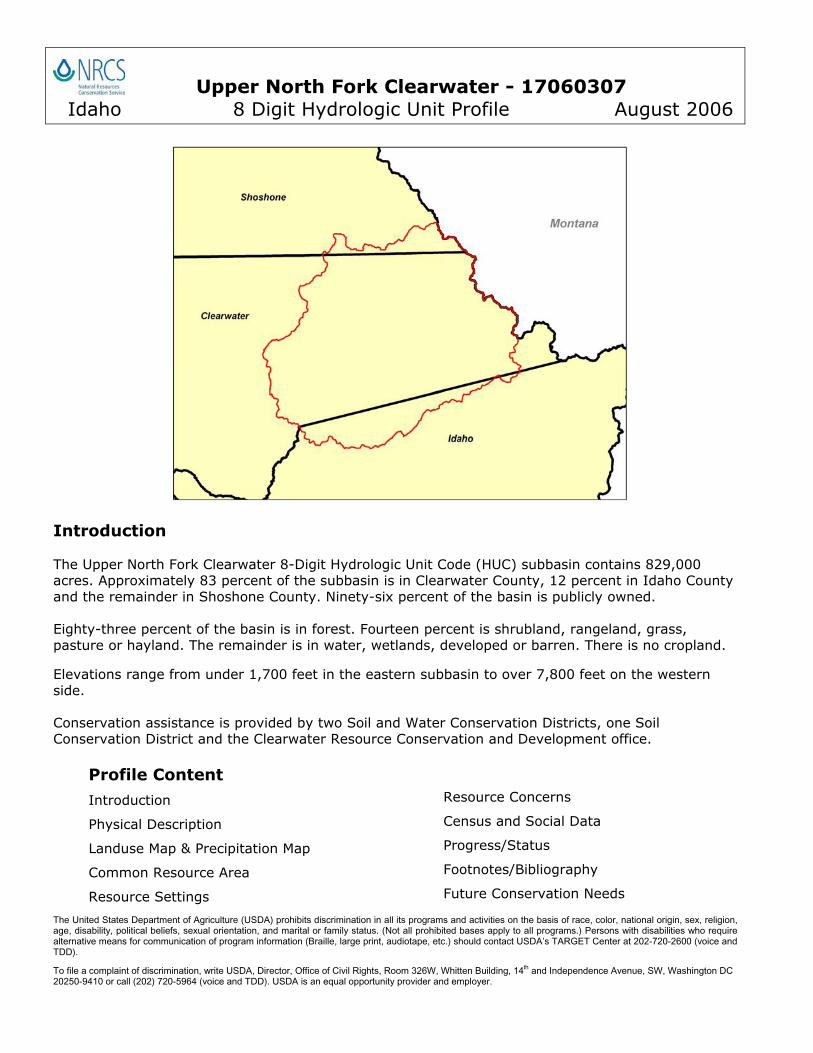
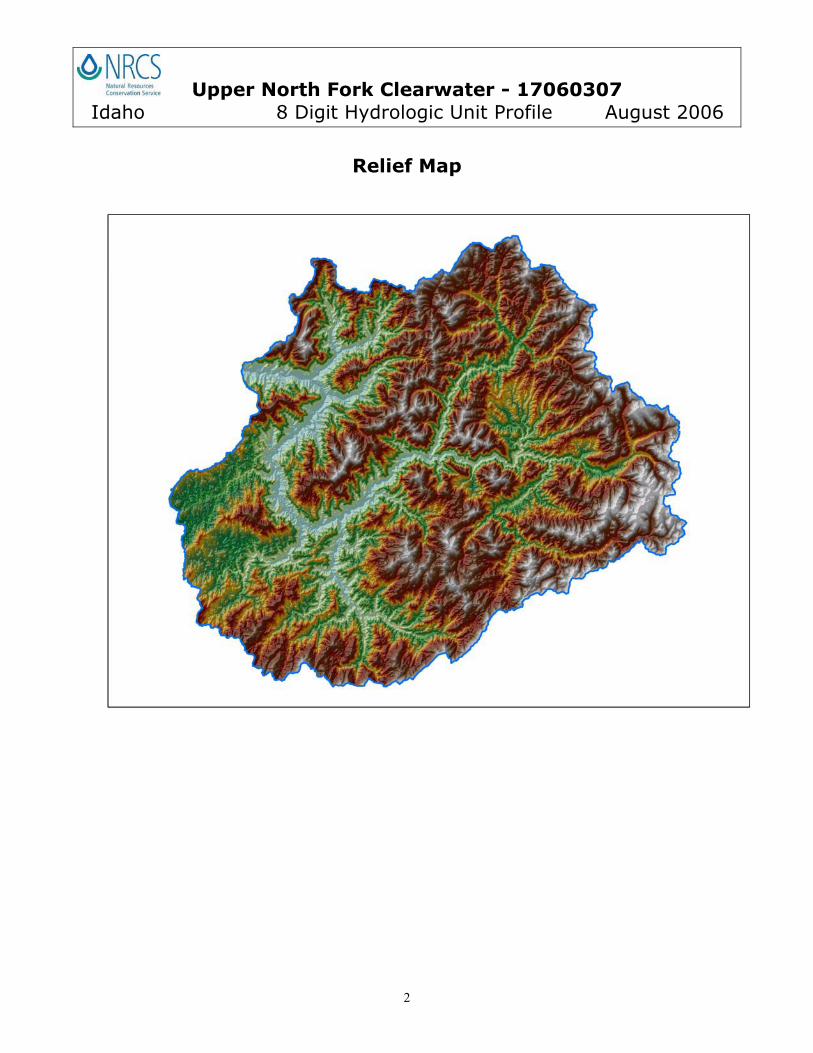
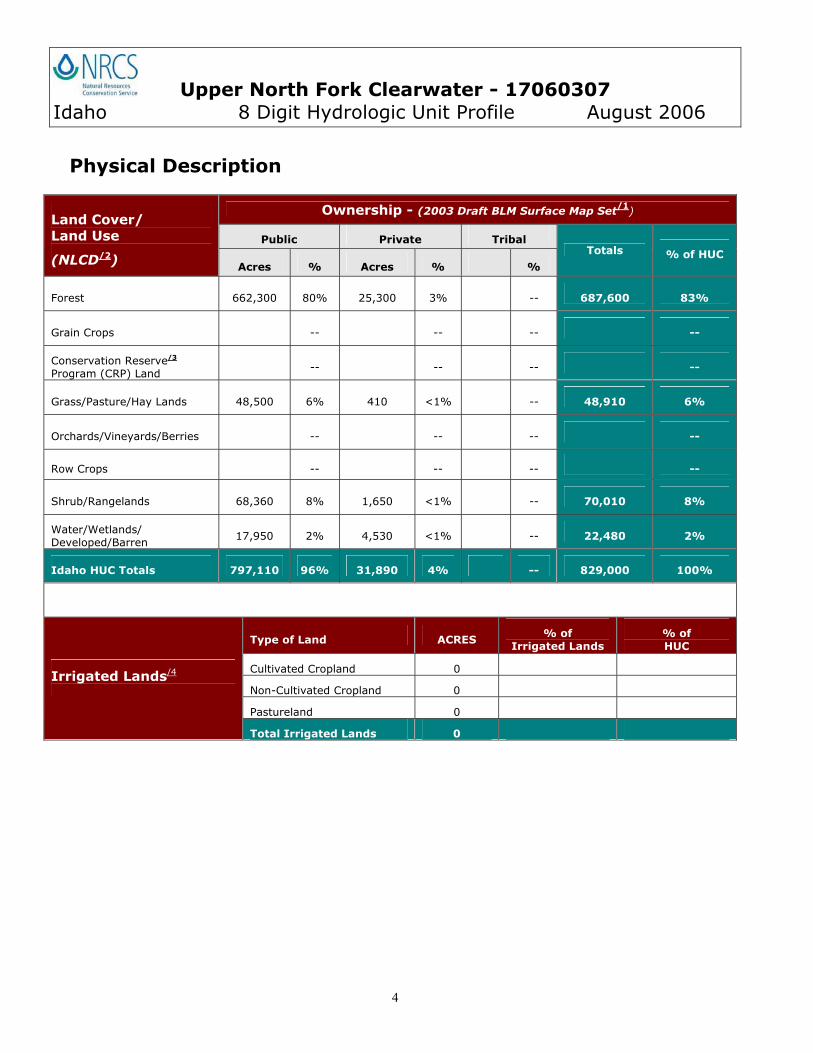
The Upper North Fork Clearwater 8-Digit Hydrologic Unit Code (HUC) subbasin contains 829,000 acres. Approximately 83 percent of the subbasin is in Clearwater County, 12 percent in Idaho County and the remainder in Shoshone County. Ninety-six percent of the basin is publicly owned.
Eighty-three percent of the basin is in forest. Fourteen percent is shrubland, rangeland, grass, pasture or hayland. The remainder is in water, wetlands, developed or barren. There is no cropland.
Elevations range from under 1,700 feet in the eastern subbasin to over 7,800 feet on the western side.
Conservation assistance is provided by two Soil and Water Conservation Districts, one Soil Conservation District and the Clearwater Resource Conservation and Development office.
Profile Content
Introduction
Physical Description
Landuse Map & Precipitation Map
Common Resource Area
Resource Settings
Resource Concerns
Census and Social Data
Progress/Status
Footnotes/Bibliography
Future Conservation Needs
Upper North Fork Clearwater - 17060307 Idaho 8 Digit Hydrologic Unit Profile August 2006
2
Relief Map
Upper North Fork Clearwater - 17060307 Idaho 8 Digit Hydrologic Unit Profile August 2006
3
General Ownership/1
Upper North Fork Clearwater - 17060307 Idaho 8 Digit Hydrologic Unit Profile August 2006
4
Physical Description
Ownership - (2003 Draft BLM Surface Map Set/1)
Public Private Tribal
Land Cover/ Land Use
(NLCD/2) Acres % Acres % %
Totals % of HUC
Forest 662,300 80% 25,300 3% -- 687,600 83%
Grain Crops -- -- -- --
Conservation Reserve/3
Program (CRP) Land -- -- -- --
Grass/Pasture/Hay Lands 48,500 6% 410 <1% -- 48,910 6%
Orchards/Vineyards/Berries -- -- -- --
Row Crops -- -- -- --
Shrub/Rangelands 68,360 8% 1,650 <1% -- 70,010 8%
Water/Wetlands/ Developed/Barren
17,950 2% 4,530 <1% -- 22,480 2%
Idaho HUC Totals 797,110 96% 31,890 4% -- 829,000 100%
Type of Land ACRES % of
Irrigated Lands % of HUC
Cultivated Cropland 0
Non-Cultivated Cropland 0
Pastureland 0
Irrigated Lands/4
Total Irrigated Lands 0

Upper North Fork Clearwater - 17060307 Idaho 8 Digit Hydrologic Unit Profile August 2006
5
Land Use/Land Cover/2
Upper North Fork Clearwater - 17060307 Idaho 8 Digit Hydrologic Unit Profile August 2006
6
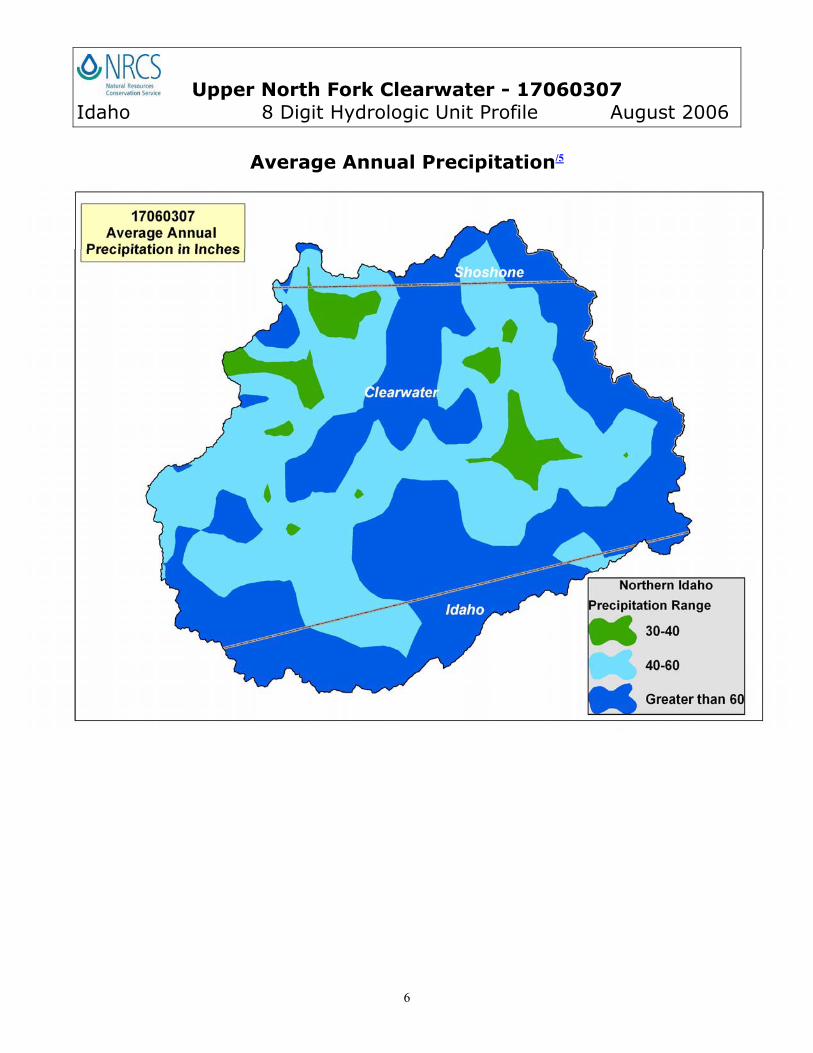
Average Annual Precipitation/5
Upper North Fork Clearwater - 17060307 Idaho 8 Digit Hydrologic Unit Profile August 2006
7
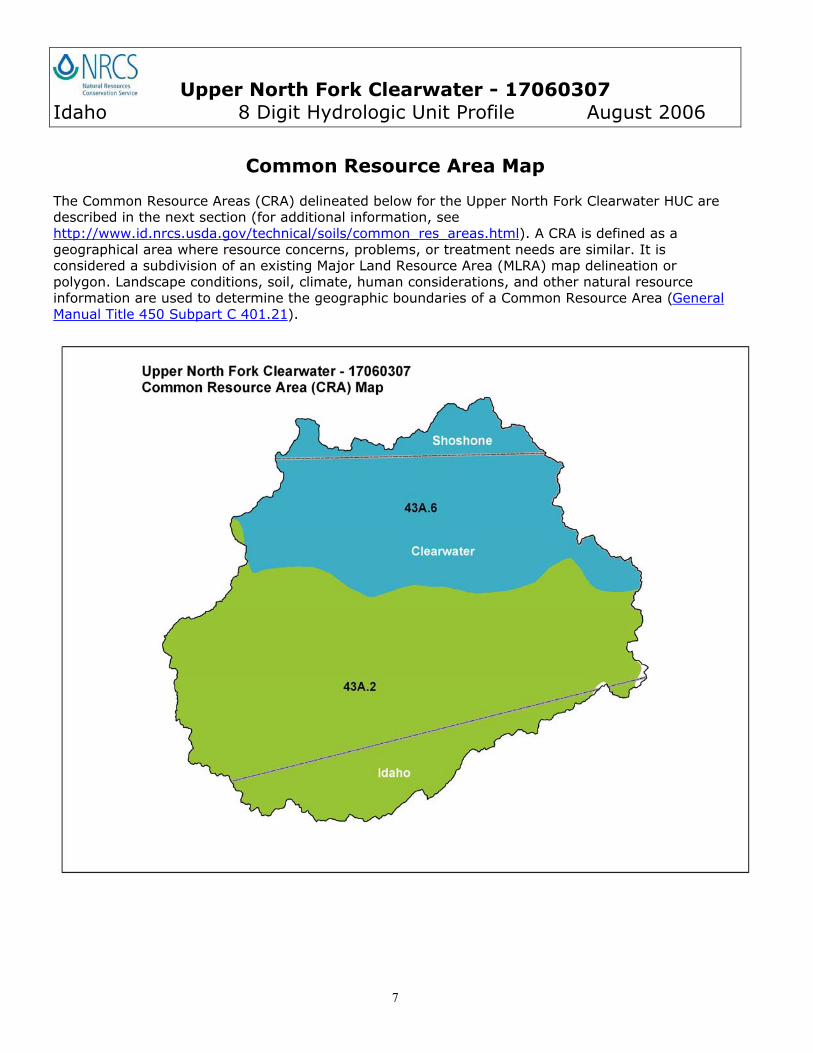
Common Resource Area Map
The Common Resource Areas (CRA) delineated below for the Upper North Fork Clearwater HUC are described in the next section (for additional information, see http://www.id.nrcs.usda.gov/technical/soils/common_res_areas.html). A CRA is defined as a geographical area where resource concerns, problems, or treatment needs are similar. It is considered a subdivision of an existing Major Land Resource Area (MLRA) map delineation or polygon. Landscape conditions, soil, climate, human considerations, and other natural resource information are used to determine the geographic boundaries of a Common Resource Area (GeneralManual Title 450 Subpart C 401.21).
Upper North Fork Clearwater - 17060307 Idaho 8 Digit Hydrologic Unit Profile August 2006
8
Common Resource Area Descriptions
The National Coordinated CRA Geographic Database provides: A consistent CRA geographic database; CRA geographic data compatible with other GIS data digitized from 1:250,000 scale maps,
such as land use/land cover, political boundaries, Digital General Soil Map of the U.S. (updated STATSGO), and ecoregion boundaries; A consistent (correlated) geographic index for Conservation System Guides
information and the eFOTG; A geographic linkage with the national MLRA framework.
43A.2 Northern Rocky Mountains - Clearwater Mountains and Breaks: The Clearwater Mountains and Breaks Ecoregion is exposed to substantial maritime influence, mantled by thick volcanic ash, and underlain by granitics. Its moist coniferous forests lack Western hemlock and are transitional between those of the Idaho Panhandle and the drier forests of the southern Idaho Batholith.
43A.6 Northern Rocky Mountains - St. Joe Schist-Gneiss Zone: The St. Joe Schist-Gneiss Zone is mountainous, mantled by volcanic ash, and prone to landslides. High gradient streams dissect the region and receive episodic sedimentation from slides. Streams were used to transport logs to mills; log drives greatly altered aquatic ecosystems and stream morphology. Pacific influence is greater than to the south. Potential natural vegetation is mapped as cedar-hemlock-pine but hemlock is absent in the south. Near tree-line, mountain hemlock, subalpine fir, Engelmann spruce and whitebark pine occur.
Upper North Fork Clearwater - 17060307 Idaho 8 Digit Hydrologic Unit Profile August 2006
9
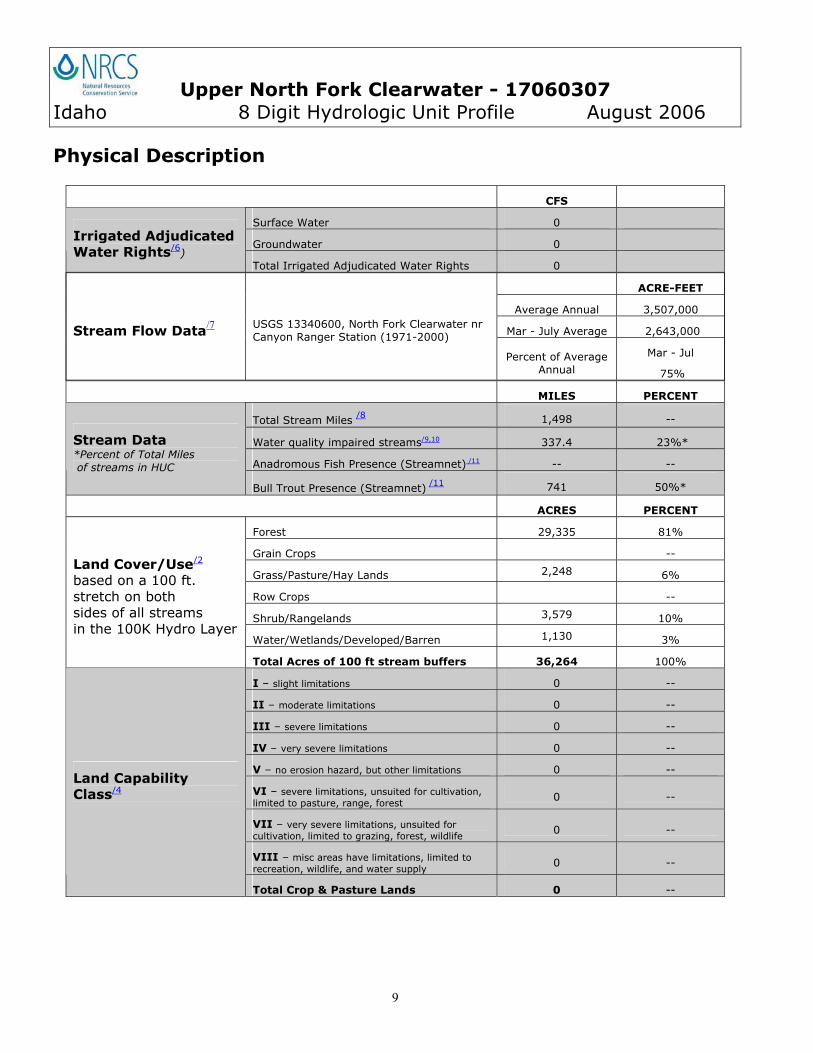
Physical Description
CFS
Surface Water 0
Groundwater 0Irrigated Adjudicated Water Rights/6)
Total Irrigated Adjudicated Water Rights 0
ACRE-FEET
Average Annual 3,507,000
Mar - July Average 2,643,000 Stream Flow Data/7 USGS 13340600, North Fork Clearwater nr Canyon Ranger Station (1971-2000)
Percent of Average Annual
Mar - Jul
75%
MILES PERCENT
Total Stream Miles /8 1,498 --
Water quality impaired streams/9,10 337.4 23%*
Anadromous Fish Presence (Streamnet) /11 -- --
Stream Data*Percent of Total Miles of streams in HUC
Bull Trout Presence (Streamnet) /11 741 50%*
ACRES PERCENT
Forest 29,335 81%
Grain Crops --
Grass/Pasture/Hay Lands 2,248 6%
Row Crops --
Shrub/Rangelands 3,579 10%
Water/Wetlands/Developed/Barren 1,130 3%
Land Cover/Use/2
based on a 100 ft. stretch on both sides of all streams in the 100K Hydro Layer
Total Acres of 100 ft stream buffers 36,264 100%
I – slight limitations 0 --
II – moderate limitations 0 --
III – severe limitations 0 --
IV – very severe limitations 0 --
V – no erosion hazard, but other limitations 0 --
VI – severe limitations, unsuited for cultivation, limited to pasture, range, forest
0 --
VII – very severe limitations, unsuited for cultivation, limited to grazing, forest, wildlife
0 --
VIII – misc areas have limitations, limited to recreation, wildlife, and water supply
0 --
Land Capability Class/4
Total Crop & Pasture Lands 0 --
Upper North Fork Clearwater - 17060307 Idaho 8 Digit Hydrologic Unit Profile August 2006
10
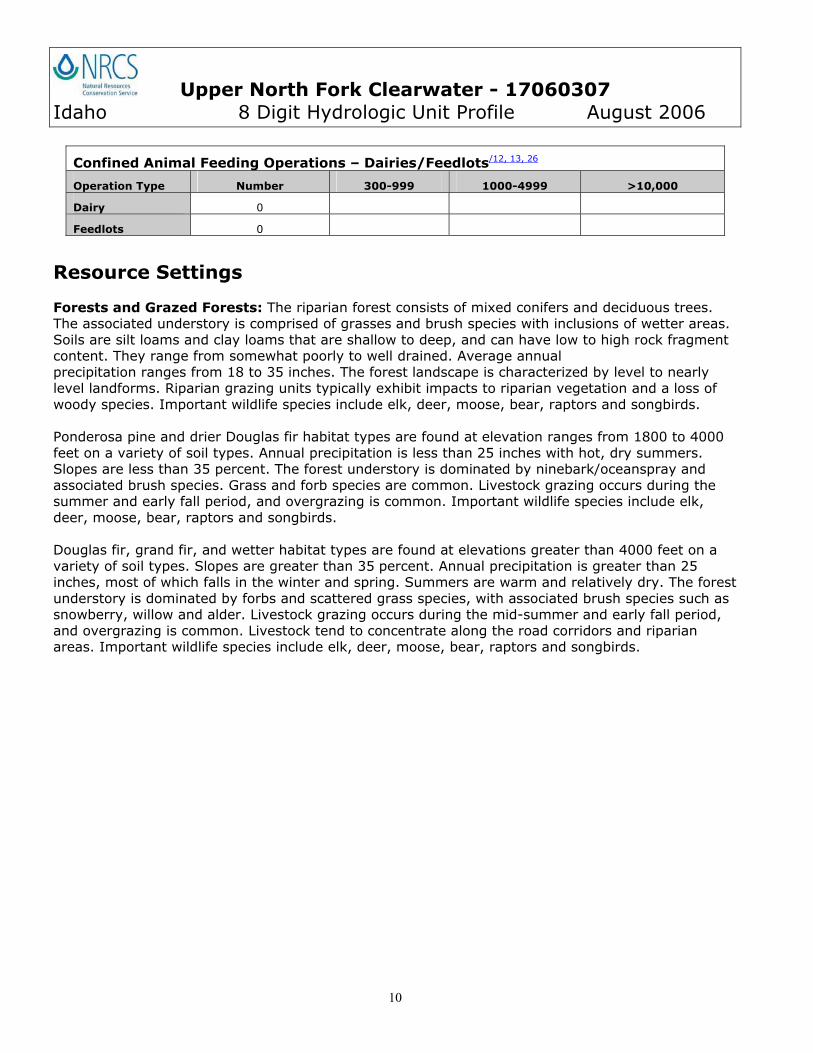
Confined Animal Feeding Operations – Dairies/Feedlots/12, 13, 26
Operation Type Number 300-999 1000-4999 >10,000
Dairy 0
Feedlots 0
Resource Settings
Forests and Grazed Forests: The riparian forest consists of mixed conifers and deciduous trees. The associated understory is comprised of grasses and brush species with inclusions of wetter areas. Soils are silt loams and clay loams that are shallow to deep, and can have low to high rock fragment content. They range from somewhat poorly to well drained. Average annual precipitation ranges from 18 to 35 inches. The forest landscape is characterized by level to nearly level landforms. Riparian grazing units typically exhibit impacts to riparian vegetation and a loss of woody species. Important wildlife species include elk, deer, moose, bear, raptors and songbirds.
Ponderosa pine and drier Douglas fir habitat types are found at elevation ranges from 1800 to 4000 feet on a variety of soil types. Annual precipitation is less than 25 inches with hot, dry summers. Slopes are less than 35 percent. The forest understory is dominated by ninebark/oceanspray and associated brush species. Grass and forb species are common. Livestock grazing occurs during the summer and early fall period, and overgrazing is common. Important wildlife species include elk, deer, moose, bear, raptors and songbirds.
Douglas fir, grand fir, and wetter habitat types are found at elevations greater than 4000 feet on a variety of soil types. Slopes are greater than 35 percent. Annual precipitation is greater than 25 inches, most of which falls in the winter and spring. Summers are warm and relatively dry. The forest understory is dominated by forbs and scattered grass species, with associated brush species such as snowberry, willow and alder. Livestock grazing occurs during the mid-summer and early fall period, and overgrazing is common. Livestock tend to concentrate along the road corridors and riparian areas. Important wildlife species include elk, deer, moose, bear, raptors and songbirds.
Upper North Fork Clearwater - 17060307 Idaho 8 Digit Hydrologic Unit Profile August 2006
11
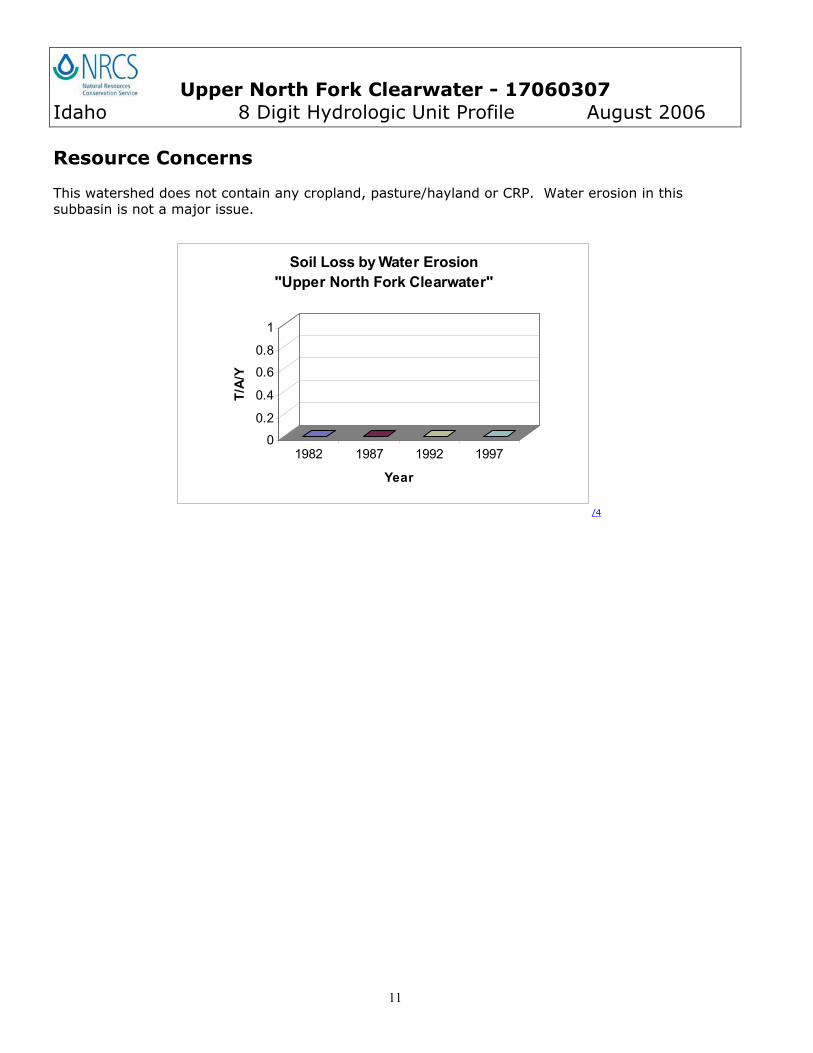
Resource Concerns
This watershed does not contain any cropland, pasture/hayland or CRP. Water erosion in this subbasin is not a major issue.
/4
0
0.2
0.4
0.6
0.8
1
T/A
/Y
1982 1987 1992 1997
Year
Soil Loss by Water Erosion"Upper North Fork Clearwater"
Upper North Fork Clearwater - 17060307 Idaho 8 Digit Hydrologic Unit Profile August 2006
12
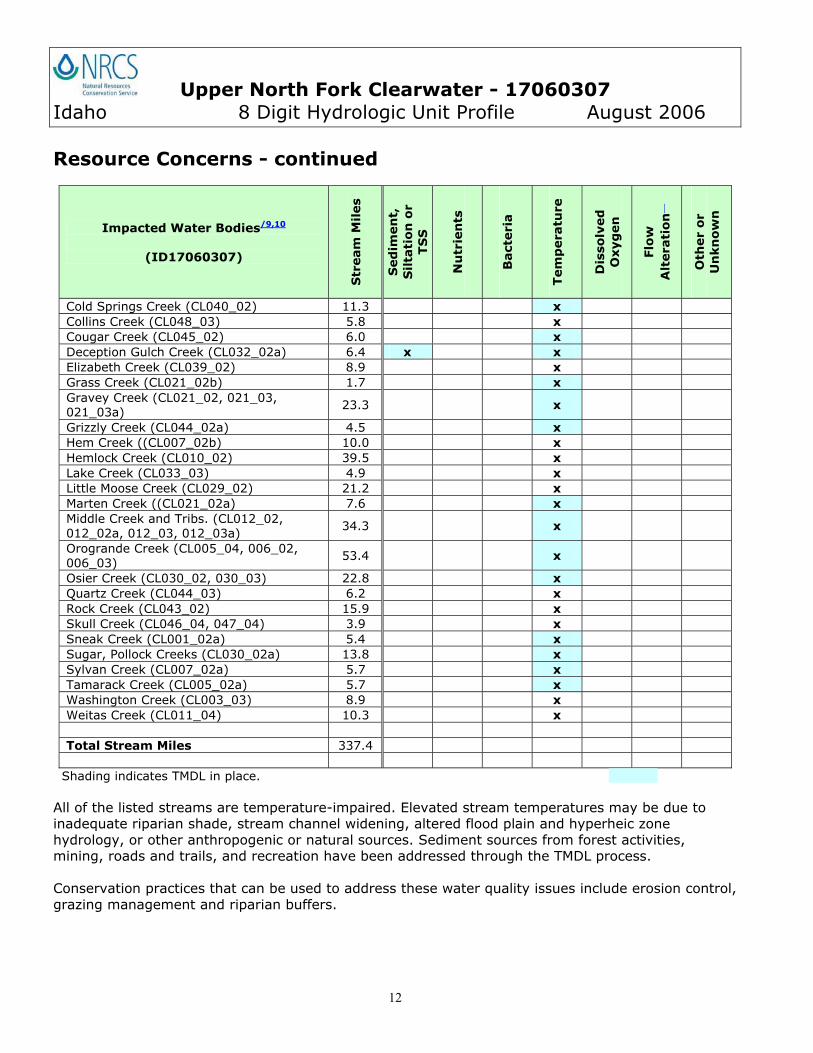
Resource Concerns - continued
Impacted Water Bodies/9,10
(ID17060307)
Str
eam
Mil
es
Sed
imen
t,
Silta
tio
n o
r TS
S
Nu
trie
nts
Bact
eri
a
Tem
pera
ture
Dis
solv
ed
Oxyg
en
Flo
wA
ltera
tio
n
Oth
er
or
Un
kn
ow
n
Cold Springs Creek (CL040_02) 11.3 xCollins Creek (CL048_03) 5.8 xCougar Creek (CL045_02) 6.0 xDeception Gulch Creek (CL032_02a) 6.4 x xElizabeth Creek (CL039_02) 8.9 xGrass Creek (CL021_02b) 1.7 xGravey Creek (CL021_02, 021_03, 021_03a)
23.3 x
Grizzly Creek (CL044_02a) 4.5 xHem Creek ((CL007_02b) 10.0 xHemlock Creek (CL010_02) 39.5 xLake Creek (CL033_03) 4.9 xLittle Moose Creek (CL029_02) 21.2 xMarten Creek ((CL021_02a) 7.6 xMiddle Creek and Tribs. (CL012_02, 012_02a, 012_03, 012_03a)
34.3 x
Orogrande Creek (CL005_04, 006_02, 006_03)
53.4 x
Osier Creek (CL030_02, 030_03) 22.8 xQuartz Creek (CL044_03) 6.2 xRock Creek (CL043_02) 15.9 xSkull Creek (CL046_04, 047_04) 3.9 xSneak Creek (CL001_02a) 5.4 xSugar, Pollock Creeks (CL030_02a) 13.8 xSylvan Creek (CL007_02a) 5.7 xTamarack Creek (CL005_02a) 5.7 xWashington Creek (CL003_03) 8.9 xWeitas Creek (CL011_04) 10.3 x Total Stream Miles 337.4
Shading indicates TMDL in place.
All of the listed streams are temperature-impaired. Elevated stream temperatures may be due to inadequate riparian shade, stream channel widening, altered flood plain and hyperheic zone hydrology, or other anthropogenic or natural sources. Sediment sources from forest activities, mining, roads and trails, and recreation have been addressed through the TMDL process.
Conservation practices that can be used to address these water quality issues include erosion control, grazing management and riparian buffers.
Upper North Fork Clearwater - 17060307 Idaho 8 Digit Hydrologic Unit Profile August 2006
13
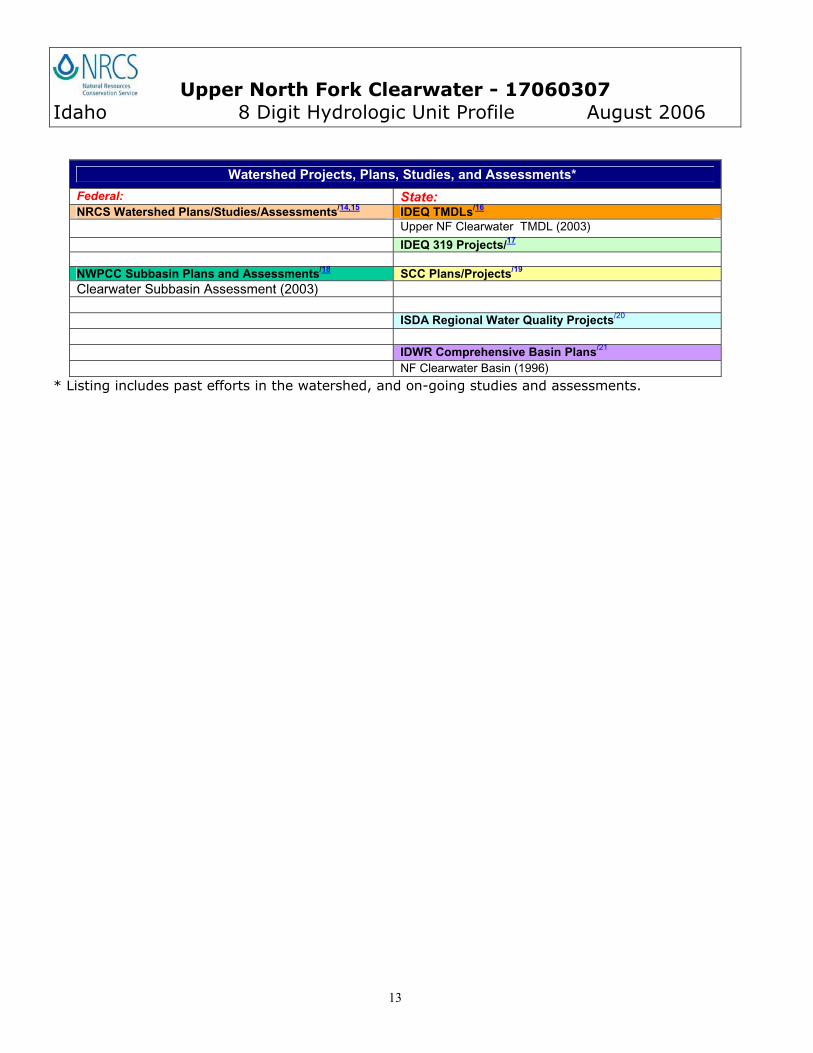
Watershed Projects, Plans, Studies, and Assessments*
Federal: State:NRCS Watershed Plans/Studies/Assessments/14,15 IDEQ TMDLs/16
Upper NF Clearwater TMDL (2003)
IDEQ 319 Projects/17
NWPCC Subbasin Plans and Assessments/18 SCC Plans/Projects/19
Clearwater Subbasin Assessment (2003)
ISDA Regional Water Quality Projects/20
IDWR Comprehensive Basin Plans/21
NF Clearwater Basin (1996)
* Listing includes past efforts in the watershed, and on-going studies and assessments.
Upper North Fork Clearwater - 17060307 Idaho 8 Digit Hydrologic Unit Profile August 2006
14
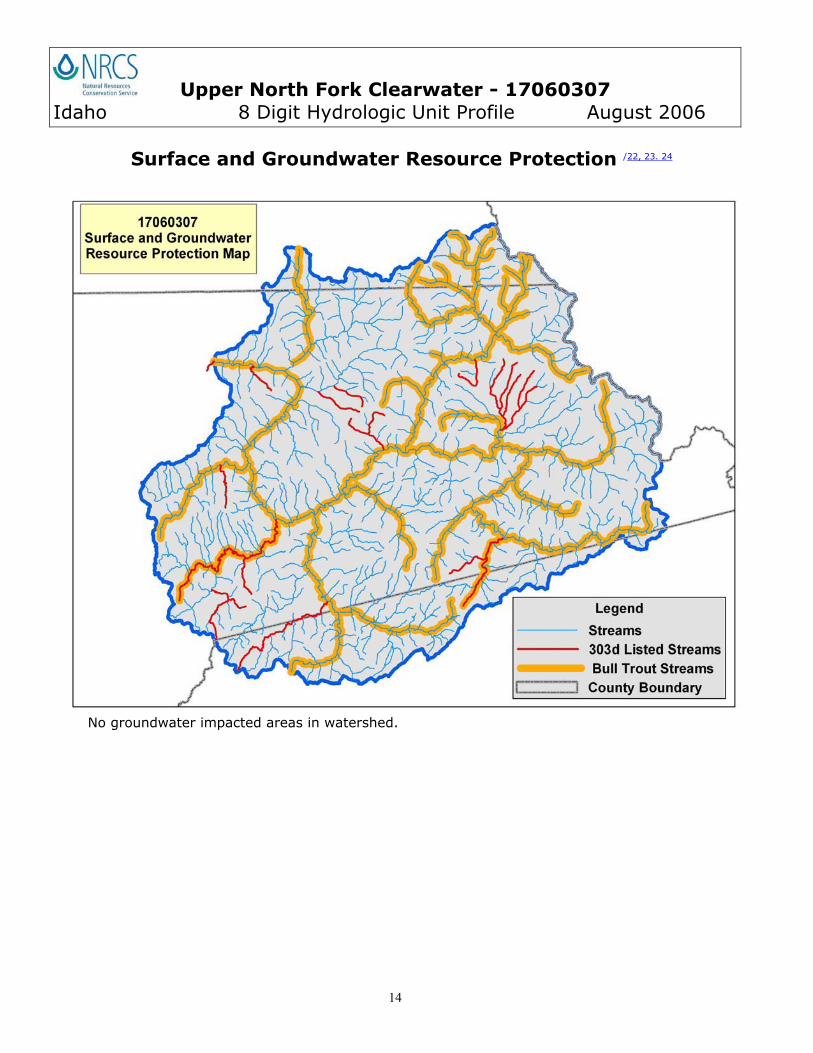
Surface and Groundwater Resource Protection /22, 23. 24
No groundwater impacted areas in watershed.
Upper North Fork Clearwater - 17060307 Idaho 8 Digit Hydrologic Unit Profile August 2006
15
Resource Concerns – continued
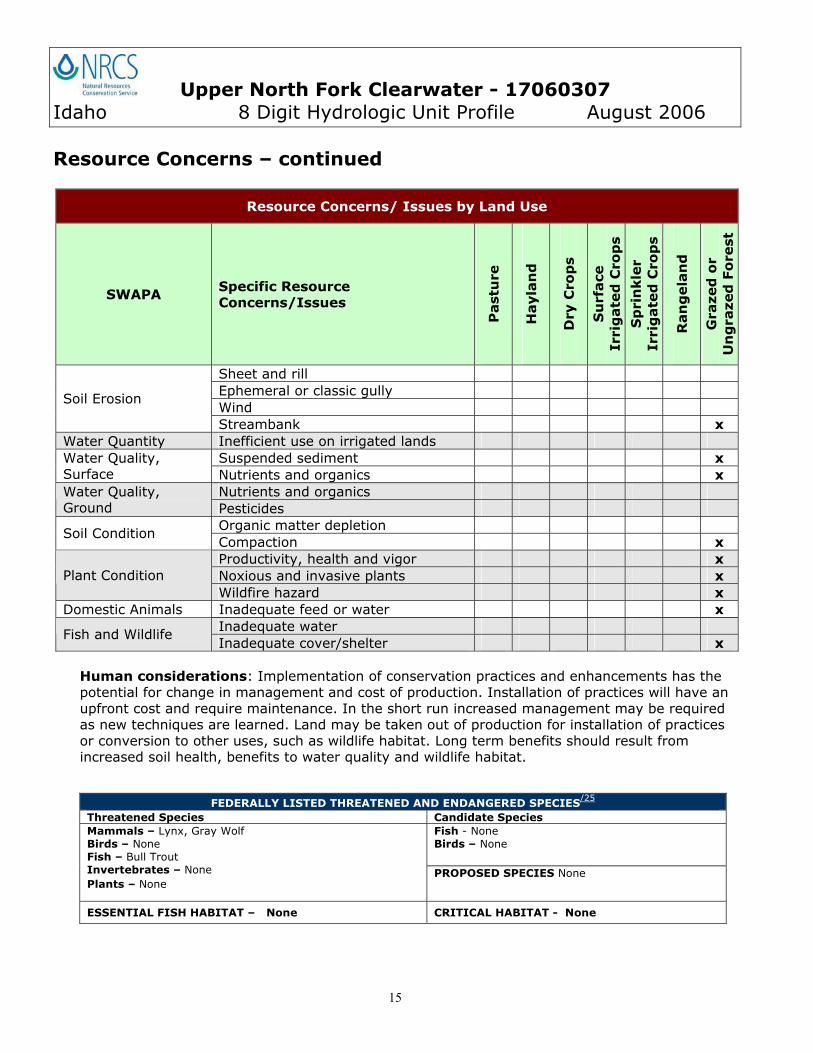
Resource Concerns/ Issues by Land Use
SWAPA Specific Resource Concerns/Issues
Past
ure
Hayla
nd
Dry
Cro
ps
Su
rface
Ir
rig
ate
d C
rop
s
Sp
rin
kle
r Ir
rig
ate
d C
rop
s
Ran
gela
nd
Gra
zed
or
Un
gra
zed
Fo
rest
Sheet and rill Ephemeral or classic gully Wind
Soil Erosion
Streambank x Water Quantity Inefficient use on irrigated lands
Suspended sediment x Water Quality, Surface Nutrients and organics x
Nutrients and organics Water Quality, Ground Pesticides
Organic matter depletion Soil Condition
Compaction x Productivity, health and vigor xNoxious and invasive plants xPlant Condition Wildfire hazard x
Domestic Animals Inadequate feed or water x Inadequate water
Fish and Wildlife Inadequate cover/shelter x
Human considerations: Implementation of conservation practices and enhancements has the potential for change in management and cost of production. Installation of practices will have an upfront cost and require maintenance. In the short run increased management may be required as new techniques are learned. Land may be taken out of production for installation of practices or conversion to other uses, such as wildlife habitat. Long term benefits should result from increased soil health, benefits to water quality and wildlife habitat.
FEDERALLY LISTED THREATENED AND ENDANGERED SPECIES/25
Threatened Species Candidate Species Fish - None Birds – None
Mammals – Lynx, Gray Wolf Birds – NoneFish – Bull Trout Invertebrates – None Plants – None
PROPOSED SPECIES None
ESSENTIAL FISH HABITAT – None CRITICAL HABITAT - None
Upper North Fork Clearwater - 17060307 Idaho 8 Digit Hydrologic Unit Profile August 2006
16
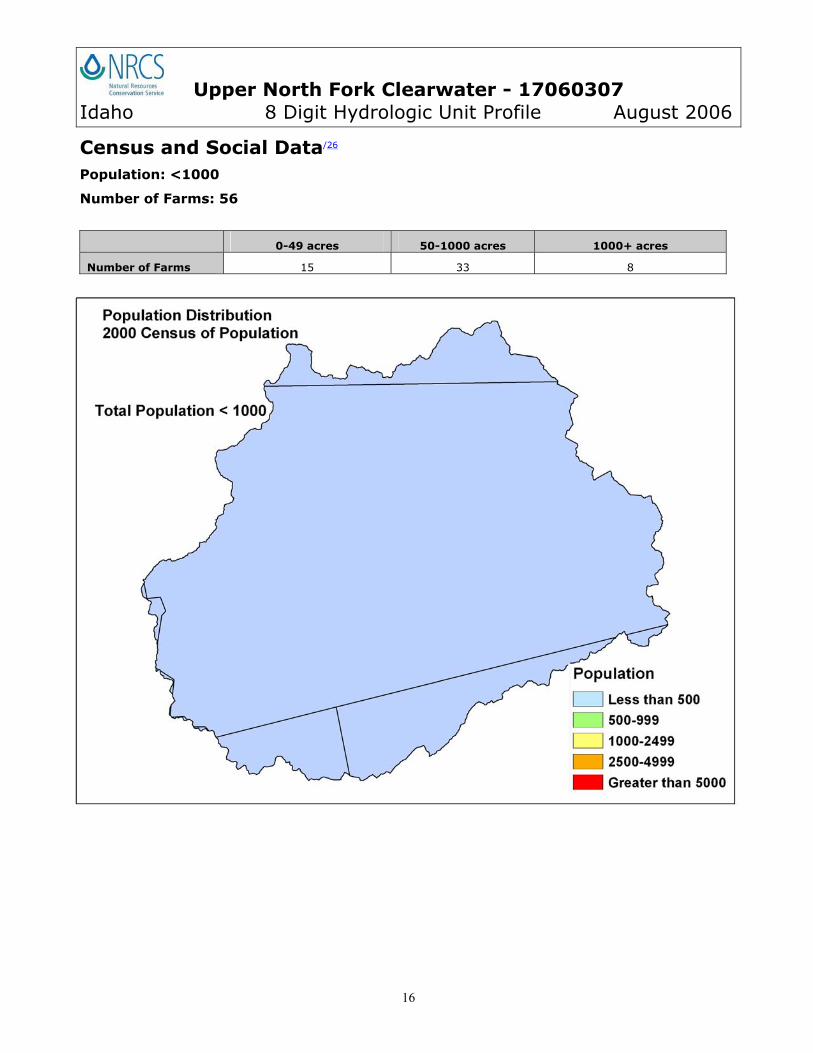
Census and Social Data/26
Population: <1000
Number of Farms: 56
0-49 acres 50-1000 acres 1000+ acres
Number of Farms 15 33 8
Upper North Fork Clearwater - 17060307 Idaho 8 Digit Hydrologic Unit Profile August 2006
17
Census and Social Data - continued
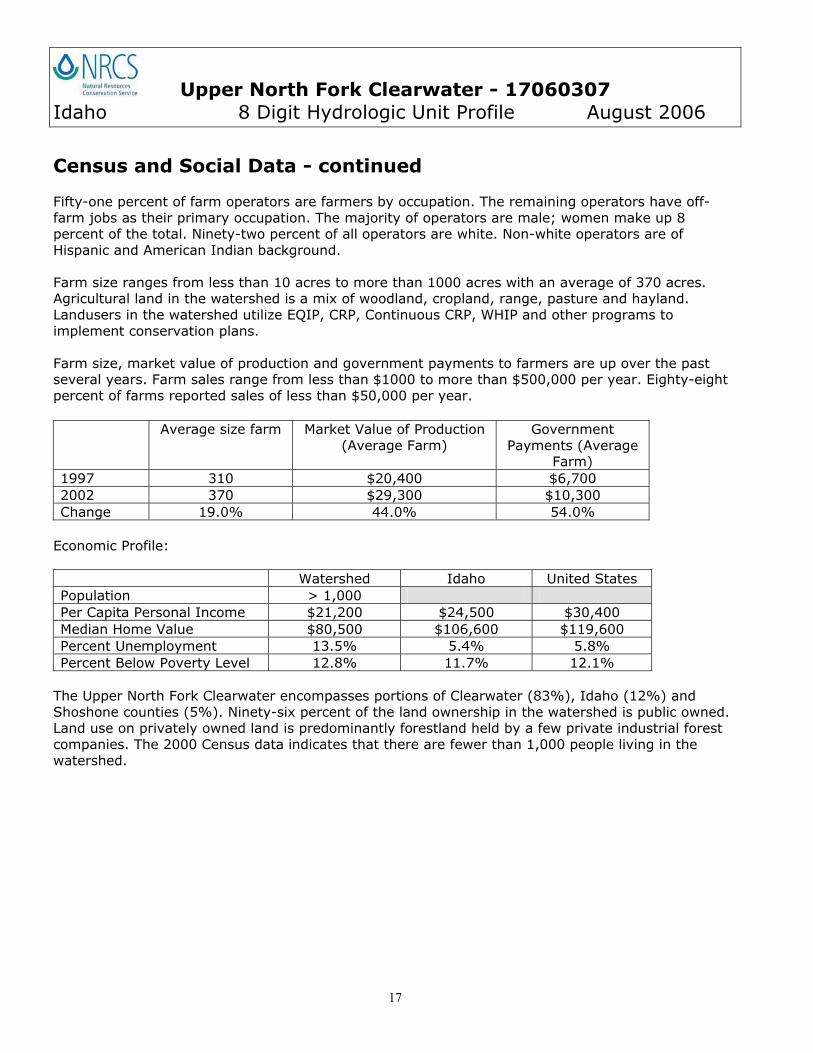
Fifty-one percent of farm operators are farmers by occupation. The remaining operators have off-farm jobs as their primary occupation. The majority of operators are male; women make up 8 percent of the total. Ninety-two percent of all operators are white. Non-white operators are of Hispanic and American Indian background.
Farm size ranges from less than 10 acres to more than 1000 acres with an average of 370 acres. Agricultural land in the watershed is a mix of woodland, cropland, range, pasture and hayland. Landusers in the watershed utilize EQIP, CRP, Continuous CRP, WHIP and other programs to implement conservation plans.
Farm size, market value of production and government payments to farmers are up over the past several years. Farm sales range from less than $1000 to more than $500,000 per year. Eighty-eight percent of farms reported sales of less than $50,000 per year.
Average size farm Market Value of Production (Average Farm)
GovernmentPayments (Average
Farm)1997 310 $20,400 $6,700 2002 370 $29,300 $10,300 Change 19.0% 44.0% 54.0%
Economic Profile:
Watershed Idaho United States Population > 1,000 Per Capita Personal Income $21,200 $24,500 $30,400 Median Home Value $80,500 $106,600 $119,600 Percent Unemployment 13.5% 5.4% 5.8% Percent Below Poverty Level 12.8% 11.7% 12.1%
The Upper North Fork Clearwater encompasses portions of Clearwater (83%), Idaho (12%) and Shoshone counties (5%). Ninety-six percent of the land ownership in the watershed is public owned. Land use on privately owned land is predominantly forestland held by a few private industrial forest companies. The 2000 Census data indicates that there are fewer than 1,000 people living in the watershed.
Upper North Fork Clearwater - 17060307 Idaho 8 Digit Hydrologic Unit Profile August 2006
18
Progress/Status
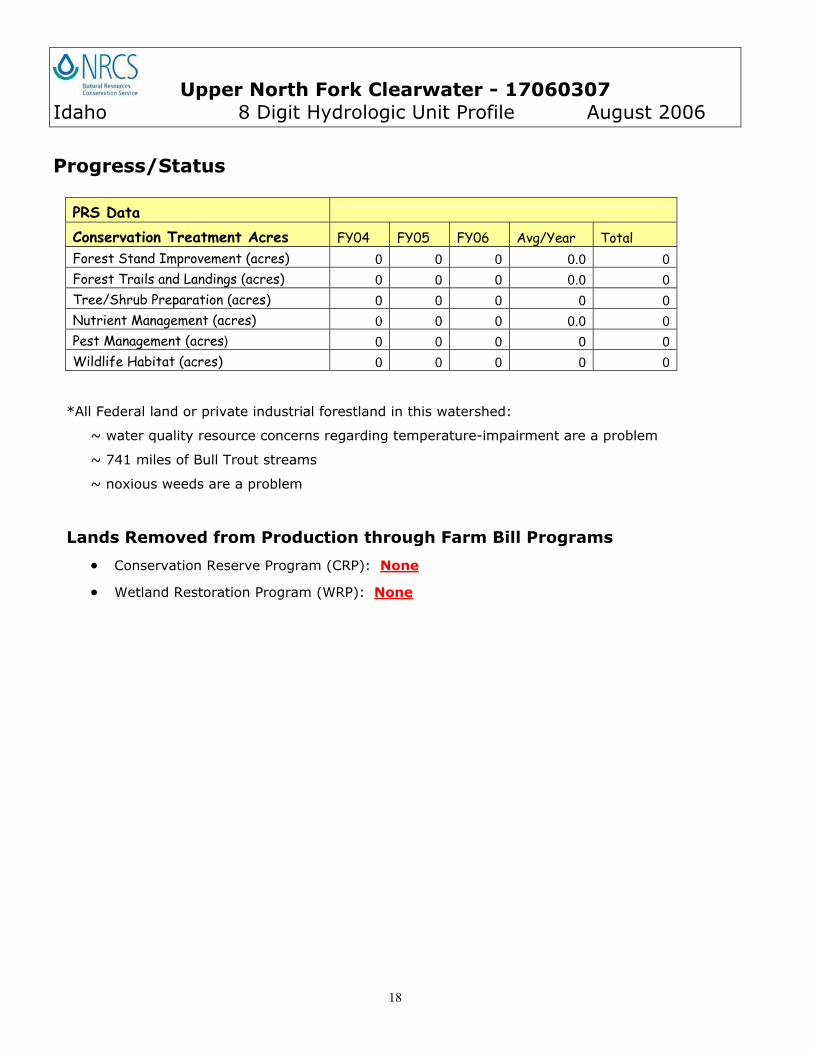
PRS Data Conservation Treatment Acres FY04 FY05 FY06 Avg/Year Total Forest Stand Improvement (acres) 0 0 0 0.0 0
Forest Trails and Landings (acres) 0 0 0 0.0 0
Tree/Shrub Preparation (acres) 0 0 0 0 0
Nutrient Management (acres) 0 0 0 0.0 0
Pest Management (acres) 0 0 0 0 0
Wildlife Habitat (acres) 0 0 0 0 0
*All Federal land or private industrial forestland in this watershed:
~ water quality resource concerns regarding temperature-impairment are a problem
~ 741 miles of Bull Trout streams
~ noxious weeds are a problem
Lands Removed from Production through Farm Bill Programs
Conservation Reserve Program (CRP): None
Wetland Restoration Program (WRP): None
Upper North Fork Clearwater - 17060307 Idaho 8 Digit Hydrologic Unit Profile August 2006
19
Footnotes/Bibliography
All data is provided “as is”. There are no warranties, express or implied, including warranty of fitness for a particular purpose, accompanying this document. Use for general planning purposes only.
1. Ownership Layer – Source: This spatial data contains surface management land status (sometimes known as "ownership") and Public Land Survey System (PLSS) information for Idaho. The Bureau of Land Management (BLM) in Idaho creates and maintains these spatial data layers. The primary source of the spatial features is the BLM Geographic Coordinate Database (GCDB), which contains official survey records and corresponding geodetic control information maintained by the BLM Cadastral program. In areas where GCDB records are unavailable, the spatial features are taken from a variety of sources including the BLM Idaho Resource Base Data collection, US Geological Survey Digital Line Graphs (DLGs), and US Forest Service Cartographic Feature Files (CFFs), among others. The source of the attribute information is the BLM Master Title Plats (MTPs) and careful cooperation with other government agencies that own or manage land parcels. The layer is available from the Inside Idaho (Interactive Numeric & Spatial Information Data Engine): http://inside.uidaho.edu For current ownership status, consult official records at appropriate federal, state or county offices. Ownership classes grouped to calculate Public Ownership vs. Private Ownership.
2. National Land Cover Dataset (NLCD): NLCD 92 (National Land Cover Data 1992) is a 21-category land cover classification scheme that has been applied consistently over the conterminous U.S. It is based primarily on the unsupervised classification of Landsat TM (Thematic Mapper) 1992 imagery. Ancillary data sources included topography, census, agricultural statistics, soil characteristics, other land cover maps, and wetlands data. The NLCD 92 classification is provided as raster data with a spatial resolution of 30 meters. The layer is available from: http://edcwww.cr.usgs.gov/products/landcover/nlcd.html Description: Abstract: These data can be used in a geographic information system (GIS) for any number of purposes such as assessing wildlife habitat, water quality, pesticide runoff, land use change, etc. The State data sets are provided with a 300 meter buffer beyond the State border to facilitate combining the State files into larger regions.
3. Farm Services Agency, USDA, 2005. CRP acres from GIS (CLU) database.
4. ESTIMATES FROM THE 1997 NRI DATABASE (REVISED DECEMBER 2000) REPLACE ALL PREVIOUS REPORTS AND ESTIMATES. Comparisons made using data published for the 1982, 1987, or 1992 NRI may produce erroneous results. This is due to changes in statistical estimation protocols, and because all data collected prior to 1997 were simultaneously reviewed (edited) as 1997 NRI data were collected. All definitions are available in the glossary. In addition, this December 2000 revision of the 1997 NRI data updates information released in December 1999 and corrects a computer error discovered in March 2000. For more information: http://www.nrcs.usda.gov/technical/NRI/
5. PRISM Climate Mapping Project. Annual precipitation data. See http://www.ocs.orst.edu/prism_new.htmlfor further information.
6. Irrigated Adjudicated Water Rights – Idaho Department of Water Resources http://www.idwr.idaho.gov/water/srba/mainpage/
7. USGS Idaho Streamflows, gaging station data (http://waterdata.usgs.gov/id/nwis/sw/ ), USDA-NRCS Centralized Forecast System (http://www.id.nrcs.usda.gov/snow/watersupply/), and estimates for ungaged streams based on statistical data ( http://streamstats.usgs.gov/html/idaho.html).
8. National Hydrology Dataset (NHD). Developed by the US Geological Survey in cooperation with U.S. Environmental Protection Agency and other state and local partners (http://nhd.usgs.gov).
9. IDEQ. 2002 Integrated Report (Formerly 303d List) (approved December 2005). http://www.deq.idaho.gov/water/data_reports/surface_water/monitoring/integrated_report.cfm.
10. IDEQ. 2003. Upper North Fork Clearwater Subbasin Assessment and TMDL. http://www.deq.state.id.us/water/data_reports/surface_water/tmdls/clearwater_river_unf/clearwater_river_unf.cfm
Upper North Fork Clearwater - 17060307 Idaho 8 Digit Hydrologic Unit Profile August 2006
20
11. StreamNet is a cooperative venture of the Pacific Northwest's fish and wildlife agencies and tribes and is administered by the Pacific States Marine Fisheries Commission. Streamnet provided data and data services in support of the region's Fish and Wildlife Program and other efforts to manage and restore the region's aquatic resources. Official Streamnet website: http://www.streamnet.org/
12. (Dairy) Idaho Department of Water Resources: http://www.idwr.state.id.us/gisdata/gis_data-new.htm
13. (Feedlot) Idaho State Department of Agriculture: http://www.agri.state.id.us/ FOIA request.
14. Natural Resource Conservation Service, Watershed Projects Planned and Authorized, http://www.nrcs.usda.gov/programs/watershed
15. Natural Resource Conservation Service, Watershed Plans, Studies and Assessments completed, http://www.nrcs.usda.gov/programs/watershed/Surveys_Plng.html#Watershed%20Surveys%20and%20Plan
16. Idaho Department of Environmental Quality (IDEQ), Surface Water Quality: Subbasin Assessments, TMDLs, and Implementation Plans. http://www.deq.state.id.us/water/data_reports/surface_water/tmdls/sba_tmdl_master_list.cfm
17. Idaho Department of Environmental Quality, Watershed protection: Nonpoint source management (319 grant), Reports and program resources. http://www.deq.state.id.us/water/data reports/surface water.nps/reports/cfm
18. Subbasin assessments and plans are developed by local groups (SWCDs, Watershed Councils, Tribes and others) as part of the Northwest Power and Conservation Council’s fish and wildlife program in the Columbia River Basin. This program is funded and implemented by the Bonneville Power Administration. http://www.nwcouncil.org/fw/subbasinplanning/Default.htm
19. Idaho Soil Conservation Commission (SCC), TMDL watershed implementation plans: agricultural com http://www.deq.state.id.us/water/data reports/surface water/nps/reports.cfmponent.http://www.scc.state.id.us/PDF/Ag%Component%20Status%20Report%20-%202004.pdf
20. Idaho State Department of Agriculture (ISDA). Groundwater water quality regional projects. http://www.agri.idaho.gov/gw/gwdatasummary.htm
21. Idaho Department of Water Resources (IDWR). State Comprehensive Water Plans. http://www.idwr.idaho.gov/waterboard/planning/Comp_Basin_Plans.htm
22. 303d Listed Streams designated by the Idaho Department of Environmental Quality (1998) and approved by the Environmental Protection Agency, Section 303d Clean Water Act
23. Groundwater Management Areas and Critical Groundwater Management Areas designated by the Idaho Department of Water Resources. http://www.idwr.idaho.gov/hydrologic/projects/gwma/
24. Nitrate Priority Areas. IDEQ has developed a list of degraded ground water areas. This list focuses on nitrate and ranks the top 25 nitrate-degraded areas (referred to as "nitrate priority areas") in the state based on the severity of the degradation, the population affected, and the trend; the rank of "1" indicates the most severely impacted area in the state. http://www.deq.state.id.us/water/prog_issues/ground_water/nitrate.cfm#ranking
25. NRCS Field Office Technical Guide, Section II, Threatened and Endangered List and the Idaho Conservation Data Center, Idaho Department of Fish and Game http://fishandgame.idaho.gov/cms/tech/CDC/
26. Data were taken from the 2002 Agricultural Census and adjusted by percent of HUC in the county or by percent of zip code area in the HUC, depending on the level of data available. Data were also taken from the U.S. Census, 2000 by zip code and adjusted by percent of zip code in the HUC. http://www.nass.usda.gov/Census_of_Agriculture/Census_by_State/Idaho/index.asp
Up
per
No
rth
Fo
rk C
learw
ate
r -
17
06
03
07
I
dah
o
8 D
igit H
ydro
logic
Unit P
rofile
A
ugust
2006
21
Fu
ture
Co
nse
rvati
on
Need
s
The
follo
win
g T
able
s ar
e an
est
imat
e of th
e fu
ture
nee
ds
of co
nse
rvat
ion p
ract
ices
in t
he
wat
ersh
ed.
Est
imat
es o
f fu
ture
nee
ds
in t
he
wat
ersh
ed a
re b
ased
on t
he
follo
win
g fac
tors
:
1.
Est
imat
es o
f to
tal co
nse
rvat
ion n
eeds
bas
ed o
n b
ench
mar
k co
nditio
ns
in t
he
wat
ersh
ed
2.
Pres
ent
leve
l of co
nse
rvat
ion inst
alla
tion
rep
orte
d in t
he
NRCS w
eb b
ased
rep
ort
ing s
yste
m
3.
Loca
l kn
ow
ledge
of th
e ar
ea,
pas
t an
d o
ngoin
g p
roje
ct a
ctiv
itie
s an
d p
rofe
ssio
nal
judgm
ent
4.
Prac
tice
s pre
viousl
y in
stal
led w
hic
h h
ave
exce
eded
thei
r ex
pec
ted life
(life
span
), a
re n
o longer
ac
com
plis
hin
g t
he
conse
rvat
ion o
bje
ctiv
e, a
nd m
ay n
eed t
o b
e re
pla
ced o
r upgra
ded
.

Up
per
No
rth
Fo
rk C
learw
ate
r -
17
06
03
07
I
dah
o
8 D
igit H
ydro
logic
Unit P
rofile
August
2006
22
Co
nse
rvati
on
Act
ivit
ies
for
Fo
rest
lan
d
*The
follo
win
g C
urr
ent
Con
ditio
ns
Tab
les
hav
e bee
n d
evel
oped
to e
stim
ate
the
pre
sent
leve
l of
conse
rvat
ion inst
alle
d w
ithin
the
HU
C,
bas
ed
on w
hat
has
bee
n r
epor
ted in t
he
PRM
S a
nd P
RS R
eport
ing s
yste
m f
or t
he
Yea
rs 2
004 t
hro
ugh 2
006
Cu
rren
t C
on
dit
ion
s
T
otal
Acr
es
Tot
al P
rivat
e F
ores
tland
27
,360
Rip
aria
n P
oten
tial
2,74
0
C
urre
nt F
arm
Bill
par
ticip
atio
n 0%
Cu
rren
t L
evel
of
Tre
atm
ent
for
Fo
rest
lan
d:
For
estla
nd
Qua
ntity
C
osts
E
ffect
s Im
plem
enta
tion
Pra
ctic
es
Uni
t Q
uant
ity
Ann
ual O
&M
an
d M
ngt.
Cos
t
Wat
er
Con
ser-
vatio
nW
ater
S
tora
geH
abita
tW
Q
EQIP
WHIP
WRP
CREP
Other
For
estla
nd (
Ung
raze
d)
Ac.
27,3
60
+/-
+/-
-2-2
A
c.
$
-
XX
X
Up
per
No
rth
Fo
rk C
learw
ate
r -
17
06
03
07
I
dah
o
8 D
igit H
ydro
logic
Unit P
rofile
August
2006
23
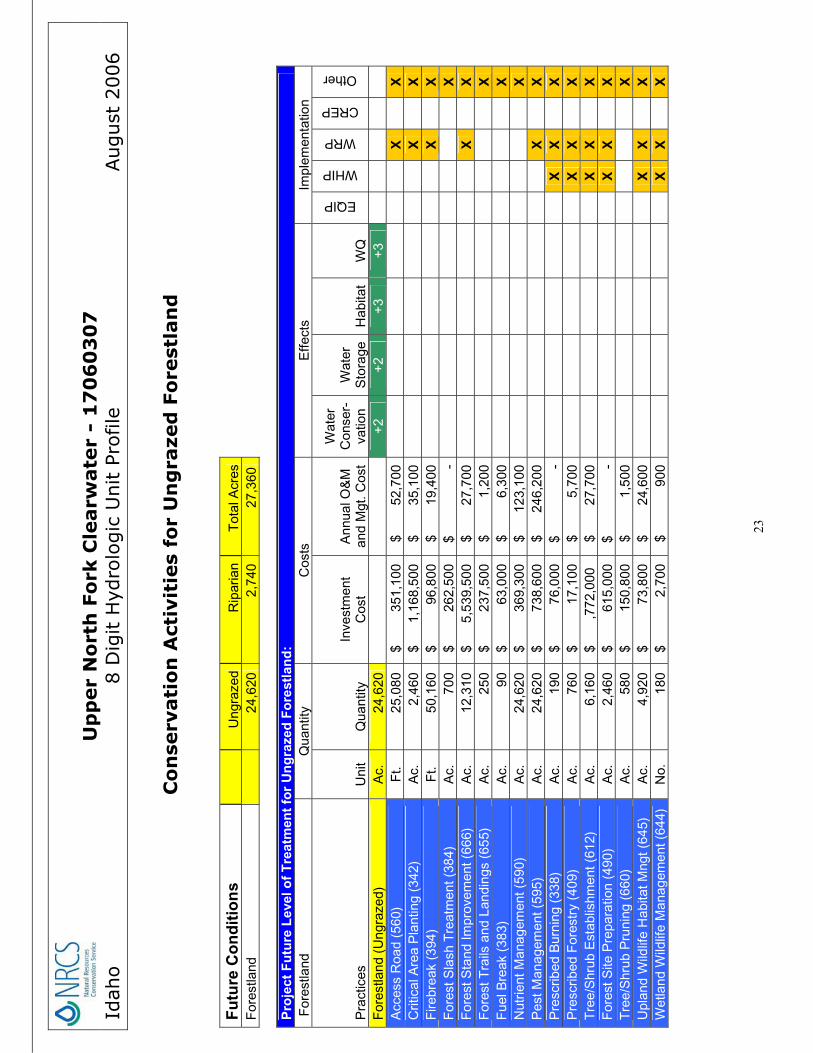
Co
nse
rvati
on
Act
ivit
ies
for
Un
gra
zed
Fo
rest
lan
d
Fu
ture
Co
nd
itio
ns
Ung
raze
dR
ipar
ian
Tot
al A
cres
F
ores
tland
2
4,62
0
2,7
40
2
7,36
0
Pro
ject
Fu
ture
Lev
el o
f T
reat
men
t fo
r U
ng
raze
d F
ore
stla
nd
: F
ores
tland
Q
uant
ity
Cos
ts
Effe
cts
Impl
emen
tatio
n
Pra
ctic
es
Uni
t Q
uant
ity
Inve
stm
ent
Cos
t A
nnua
l O&
M
and
Mgt
. Cos
t
Wat
er
Con
ser-
vatio
nW
ater
S
tora
geH
abita
tW
Q
EQIP
WHIP
WRP
CREP
Other
For
estla
nd (
Ung
raze
d)
Ac.
2
4,62
0
+2
+2+3
+3
Acc
ess
Roa
d (5
60)
Ft.
25,
080
$
351,
100
$
5
2,70
0
X
XC
ritic
al A
rea
Pla
ntin
g (3
42)
Ac.
2,4
60
$
1,
168,
500
$
3
5,10
0
X
XF
irebr
eak
(394
) F
t.
5
0,16
0 $
9
6,80
0 $
19,
400
XX
For
est S
lash
Tre
atm
ent (
384)
A
c.
700
$
26
2,50
0 $
-
X
For
est S
tand
Impr
ovem
ent (
666)
A
c.
12,
310
$
5,
539,
500
$
2
7,70
0
X
XF
ores
t Tra
ils a
nd L
andi
ngs
(655
) A
c.
250
$
23
7,50
0 $
1
,200
XF
uel B
reak
(38
3)
Ac.
90
$
63,
000
$
6,3
00
X
Nut
rient
Man
agem
ent (
590)
A
c.
24,
620
$
369,
300
$
12
3,10
0
XP
est M
anag
emen
t (59
5)
Ac.
2
4,62
0 $
73
8,60
0 $
246,
200
XX
Pre
scrib
ed B
urni
ng (
338)
A
c.
190
$
7
6,00
0 $
-
XX
XP
resc
ribed
For
estr
y (4
09)
Ac.
7
60
$
17,
100
$
5,7
00
XX
XT
ree/
Shr
ub E
stab
lishm
ent (
612)
A
c.
6
,160
$
,772
,000
$
27,
700
XX
XF
ores
t Site
Pre
para
tion
(490
) A
c.
2
,460
$
61
5,00
0 $
-
XX
XT
ree/
Shr
ub P
runi
ng (
660)
A
c.
580
$
15
0,80
0 $
1
,500
XU
plan
d W
ildlif
e H
abita
t Mng
t (64
5)
Ac.
4,9
20
$
73,
800
$
2
4,60
0
X
XX
Wet
land
Wild
life
Man
agem
ent (
644)
N
o.
180
$
2,7
00
$
9
00
XX
X
Up
per
No
rth
Fo
rk C
learw
ate
r -
17
06
03
07
I
dah
o
8 D
igit H
ydro
logic
Unit P
rofile
August
2006
24
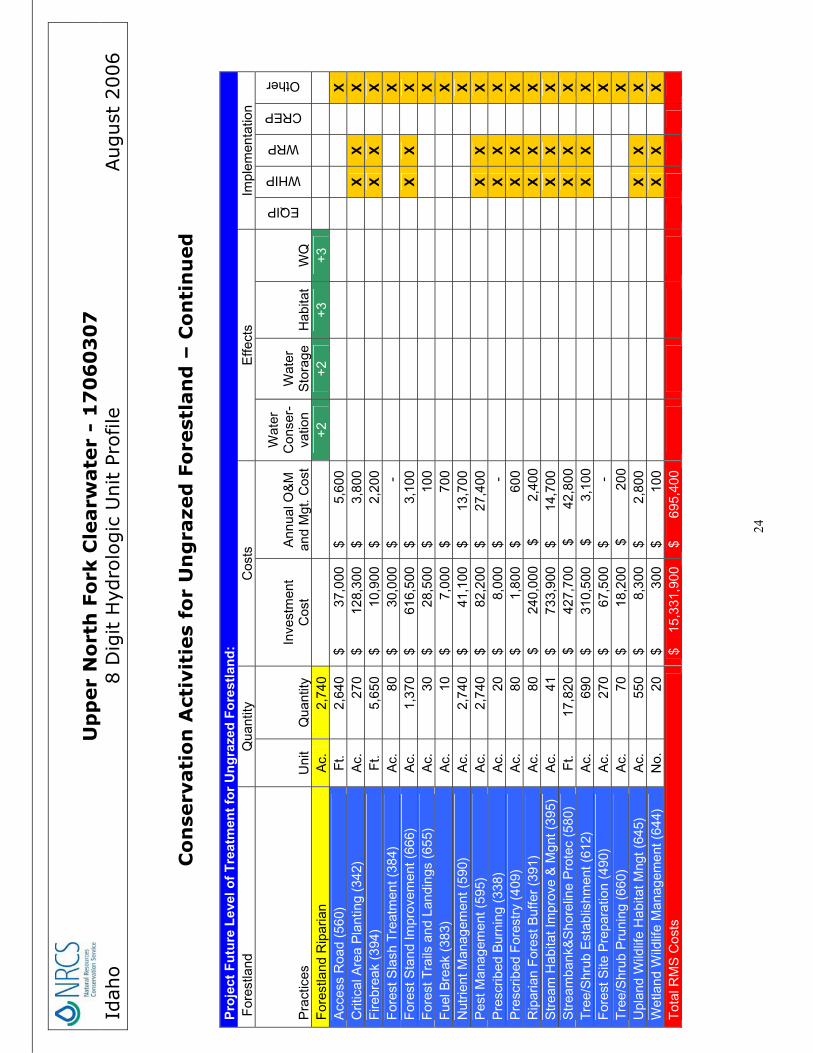
Co
nse
rvati
on
Act
ivit
ies
for
Un
gra
zed
Fo
rest
lan
d –
Co
nti
nu
ed
Pro
ject
Fu
ture
Lev
el o
f T
reat
men
t fo
r U
ng
raze
d F
ore
stla
nd
: F
ores
tland
Q
uant
ity
Cos
ts
Effe
cts
Impl
emen
tatio
n
Pra
ctic
es
Uni
t Q
uant
ity
Inve
stm
ent
Cos
t A
nnua
l O&
M
and
Mgt
. Cos
t
Wat
er
Con
ser-
vatio
nW
ater
S
tora
geH
abita
tW
Q
EQIP
WHIP
WRP
CREP
Other
For
estla
nd R
ipar
ian
A
c.
2,74
0
+2
+2+3
+3
Acc
ess
Roa
d (5
60)
Ft.
2,64
0 $
3
7,00
0 $
5
,600
XC
ritic
al A
rea
Pla
ntin
g (3
42)
Ac.
270
$
128,
300
$
3,8
00
XX
XF
irebr
eak
(394
) F
t.
5,
650
$
10,
900
$
2,2
00
XX
XF
ores
t Sla
sh T
reat
men
t (38
4)
Ac.
80
$
30,
000
$
-
X
For
est S
tand
Impr
ovem
ent (
666)
A
c.
1,37
0 $
61
6,50
0 $
3
,100
X
XX
For
est T
rails
and
Lan
ding
s (6
55)
Ac.
30
$
28,
500
$
1
00
X
Fue
l Bre
ak (
383)
A
c.
1
0 $
7,0
00
$
7
00
X
Nut
rient
Man
agem
ent (
590)
A
c.
2,74
0 $
4
1,10
0 $
13,
700
X
Pes
t Man
agem
ent (
595)
A
c.
2,74
0 $
8
2,20
0 $
27,
400
XX
XP
resc
ribed
Bur
ning
(33
8)
Ac.
20
$
8
,000
$
-
X
XX
Pre
scrib
ed F
ores
try
(409
) A
c.
8
0 $
1,8
00
$
6
00
XX
XR
ipar
ian
For
est B
uffe
r (3
91)
Ac.
80
$
240,
000
$
2,4
00
XX
XS
trea
m H
abita
t Im
prov
e &
Mgn
t (39
5)
Ac.
41
$
733,
900
$
1
4,70
0
X
XX
Str
eam
bank
&S
hore
line
Pro
tec
(580
) F
t.
17,
820
$
427,
700
$
4
2,80
0
X
XX
Tre
e/S
hrub
Est
ablis
hmen
t (61
2)
Ac.
690
$
310,
500
$
3,1
00
XX
XF
ores
t Site
Pre
para
tion
(490
) A
c.
27
0 $
6
7,50
0 $
-
XT
ree/
Shr
ub P
runi
ng (
660)
A
c.
7
0 $
1
8,20
0 $
200
XU
plan
d W
ildlif
e H
abita
t Mng
t (64
5)
Ac.
550
$
8
,300
$
2
,800
X
XX
Wet
land
Wild
life
Man
agem
ent (
644)
N
o.
2
0 $
3
00
$
1
00
XX
XT
otal
RM
S C
osts
$
1
5,33
1,90
0 $
695,
400
Up
per
No
rth
Fo
rk C
learw
ate
r -
17
06
03
07
I
dah
o
8 D
igit H
ydro
logic
Unit P
rofile
August
2006
25
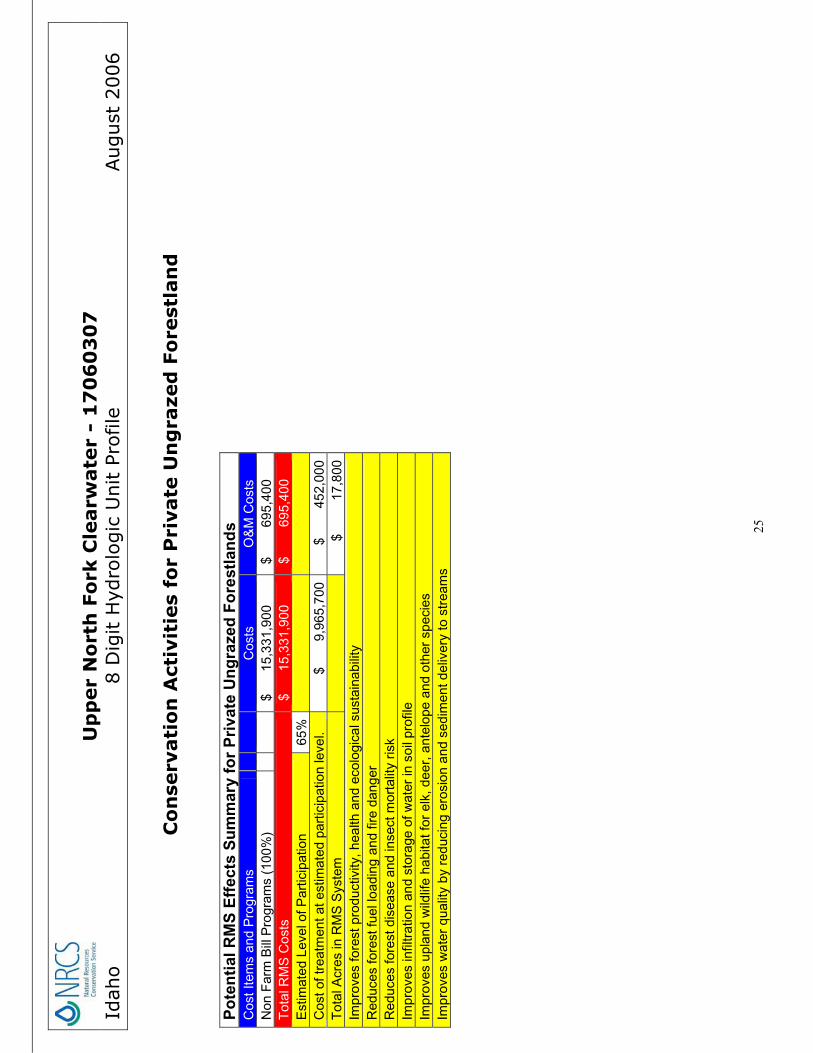
Co
nse
rvati
on
Act
ivit
ies
for
Pri
vate
Un
gra
zed
Fo
rest
lan
d
Po
ten
tial
RM
S E
ffec
ts S
um
mar
y fo
r P
riva
te U
ng
raze
d F
ore
stla
nd
s C
ost I
tem
s an
d P
rogr
ams
Cos
ts
O&
M C
osts
N
on F
arm
Bill
Pro
gram
s (1
00%
)
$
15,3
31,9
00
$
6
95,4
00
Tot
al R
MS
Cos
ts
$
15
,331
,900
$
695
,400
E
stim
ated
Lev
el o
f Par
ticip
atio
n 65
%C
ost o
f tre
atm
ent a
t est
imat
ed p
artic
ipat
ion
leve
l. $
9,9
65,7
00
$
4
52,0
00
Tot
al A
cres
in R
MS
Sys
tem
$
17,8
00
Impr
oves
fore
st p
rodu
ctiv
ity, h
ealth
and
eco
logi
cal s
usta
inab
ility
R
educ
es fo
rest
fuel
load
ing
and
fire
dang
er
Red
uces
fore
st d
isea
se a
nd in
sect
mor
talit
y ris
k Im
prov
es in
filtr
atio
n an
d st
orag
e of
wat
er in
soi
l pro
file
Impr
oves
upl
and
wild
life
habi
tat f
or e
lk, d
eer,
ant
elop
e an
d ot
her
spec
ies
Impr
oves
wat
er q
ualit
y by
red
ucin
g er
osio
n an
d se
dim
ent d
eliv
ery
to s
trea
ms