Embed Size (px)
Citation preview
Upper Fall Brook WatershedAcid Mine Drainage
and Acid Rain Impacts
Conceptual Treatment Approaches
Terry A. Rightnour
Water’s Edge Hydrology, Inc.
January 15, 2007
[email protected], http://wehydro.com
Upper Fall Brook Watershed
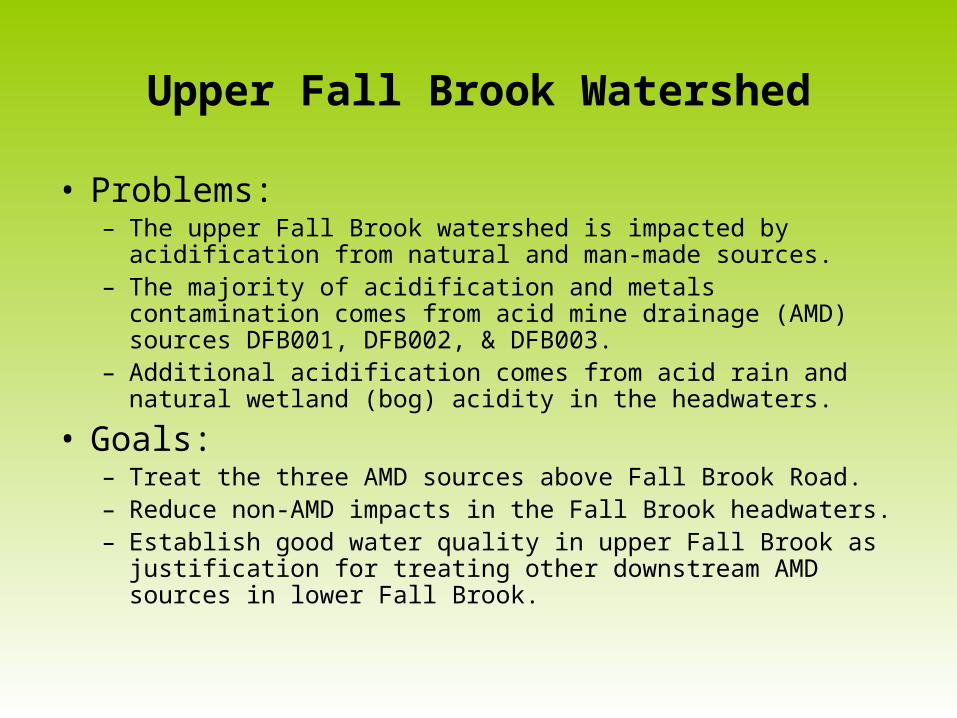
• Problems:– The upper Fall Brook watershed is impacted by acidification from
natural and man-made sources.– The majority of acidification and metals contamination comes
from acid mine drainage (AMD) sources DFB001, DFB002, & DFB003.
– Additional acidification comes from acid rain and natural wetland (bog) acidity in the headwaters.
• Goals:– Treat the three AMD sources above Fall Brook Road.– Reduce non-AMD impacts in the Fall Brook headwaters.– Establish good water quality in upper Fall Brook as justification
for treating other downstream AMD sources in lower Fall Brook.
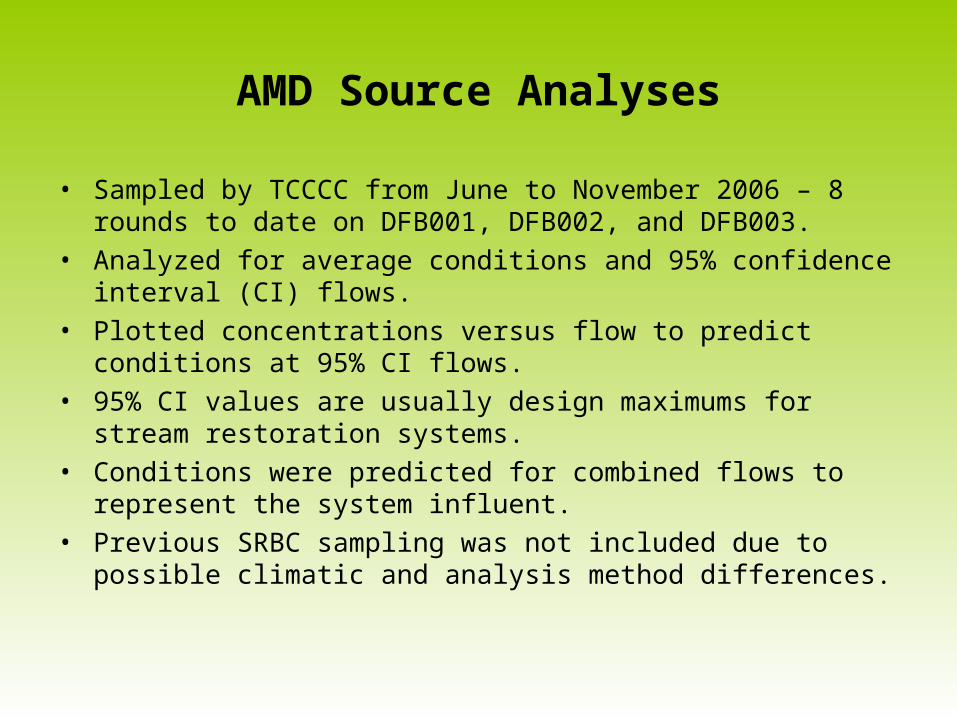
AMD Source Analyses
• Sampled by TCCCC from June to November 2006 – 8 rounds to date on DFB001, DFB002, and DFB003.
• Analyzed for average conditions and 95% confidence interval (CI) flows.
• Plotted concentrations versus flow to predict conditions at 95% CI flows.
• 95% CI values are usually design maximums for stream restoration systems.
• Conditions were predicted for combined flows to represent the system influent.
• Previous SRBC sampling was not included due to possible climatic and analysis method differences.
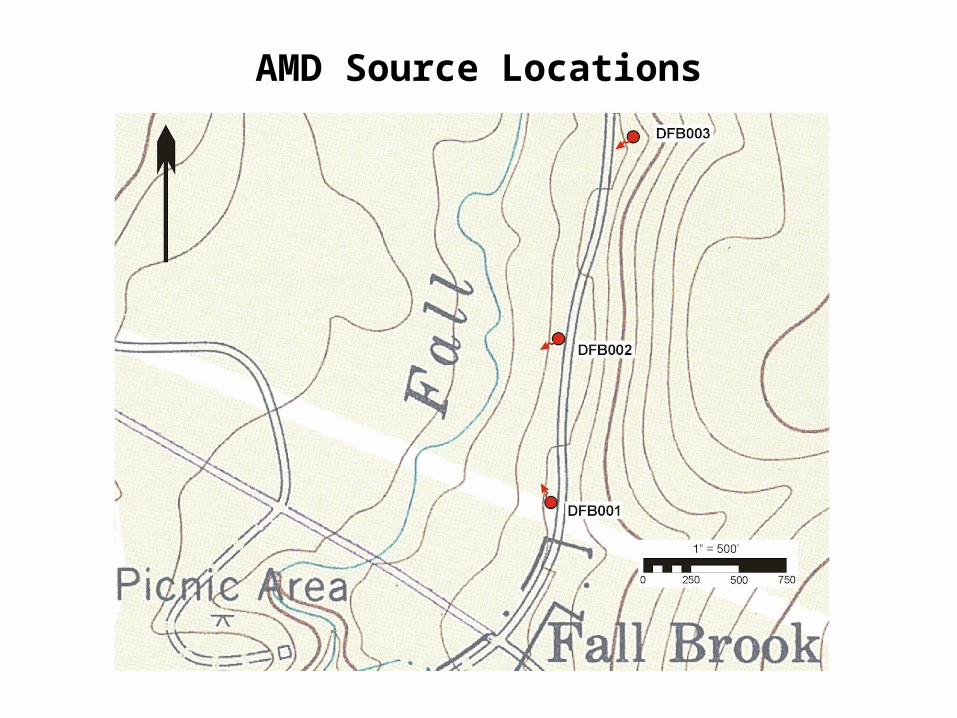
AMD Source Locations
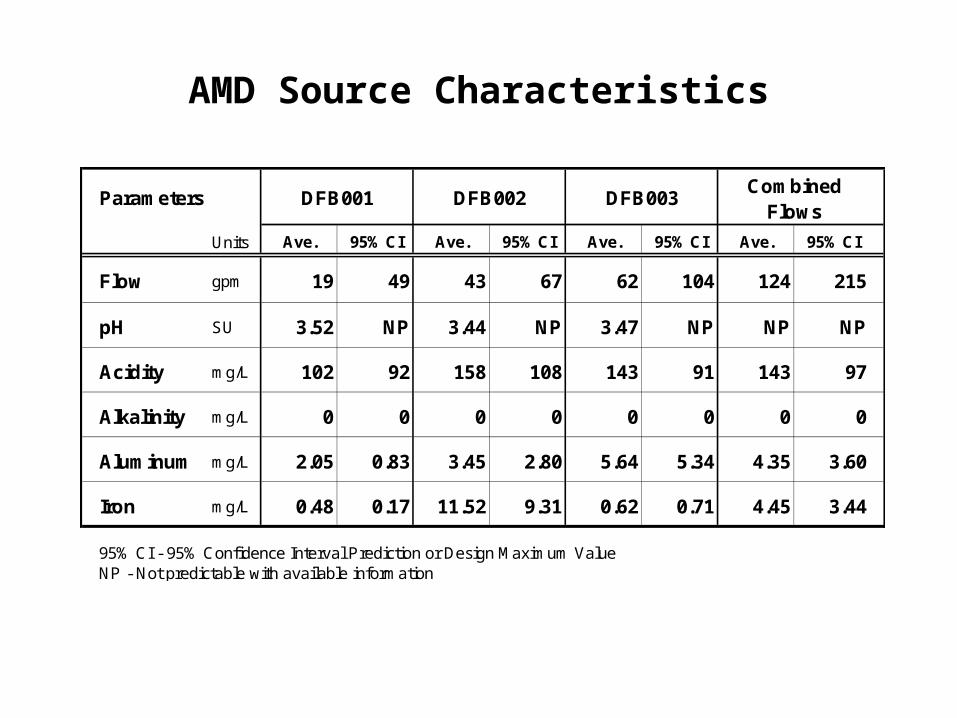
AMD Source Characteristics
Units Ave. 95% CI Ave. 95% CI Ave. 95% CI Ave. 95% CI
Flow gpm 19 49 43 67 62 104 124 215
pH SU 3.52 NP 3.44 NP 3.47 NP NP NP
Acidity mg/L 102 92 158 108 143 91 143 97
Alkalinity mg/L 0 0 0 0 0 0 0 0
Aluminum mg/L 2.05 0.83 3.45 2.80 5.64 5.34 4.35 3.60
Iron mg/L 0.48 0.17 11.52 9.31 0.62 0.71 4.45 3.44
95% CI - 95% Confidence Interval Prediction or Design Maximum ValueNP - Not predictable with available information
FlowsDFB001 DFB002 DFB003
CombinedParameters
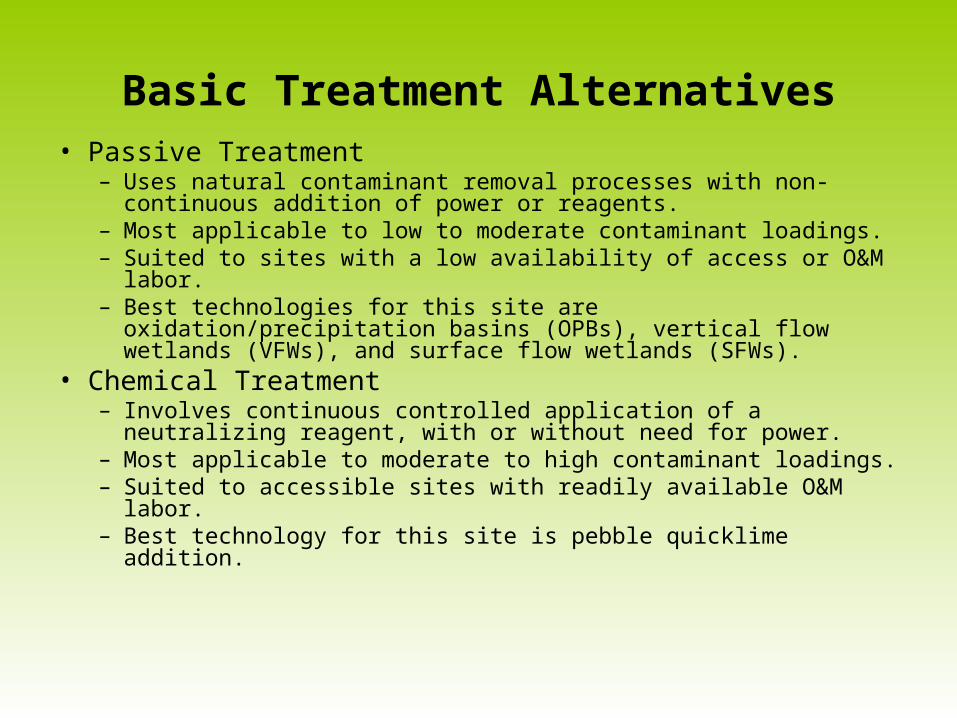
Basic Treatment Alternatives• Passive Treatment
– Uses natural contaminant removal processes with non-continuous addition of power or reagents.
– Most applicable to low to moderate contaminant loadings.– Suited to sites with a low availability of access or O&M labor.– Best technologies for this site are oxidation/precipitation basins
(OPBs), vertical flow wetlands (VFWs), and surface flow wetlands (SFWs).
• Chemical Treatment– Involves continuous controlled application of a neutralizing
reagent, with or without need for power.– Most applicable to moderate to high contaminant loadings.– Suited to accessible sites with readily available O&M labor.– Best technology for this site is pebble quicklime addition.
ConceptualPassive System Components
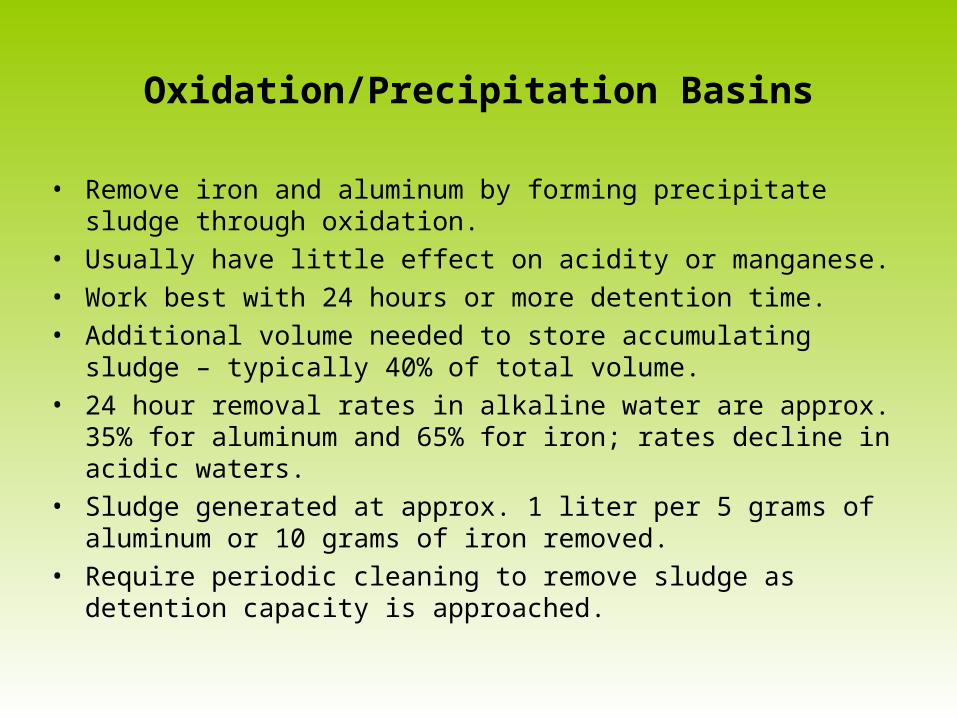
Oxidation/Precipitation Basins
• Remove iron and aluminum by forming precipitate sludge through oxidation.
• Usually have little effect on acidity or manganese.• Work best with 24 hours or more detention time.• Additional volume needed to store accumulating sludge – typically
40% of total volume.• 24 hour removal rates in alkaline water are approx. 35% for
aluminum and 65% for iron; rates decline in acidic waters.• Sludge generated at approx. 1 liter per 5 grams of aluminum or 10
grams of iron removed.• Require periodic cleaning to remove sludge as detention capacity is
approached.
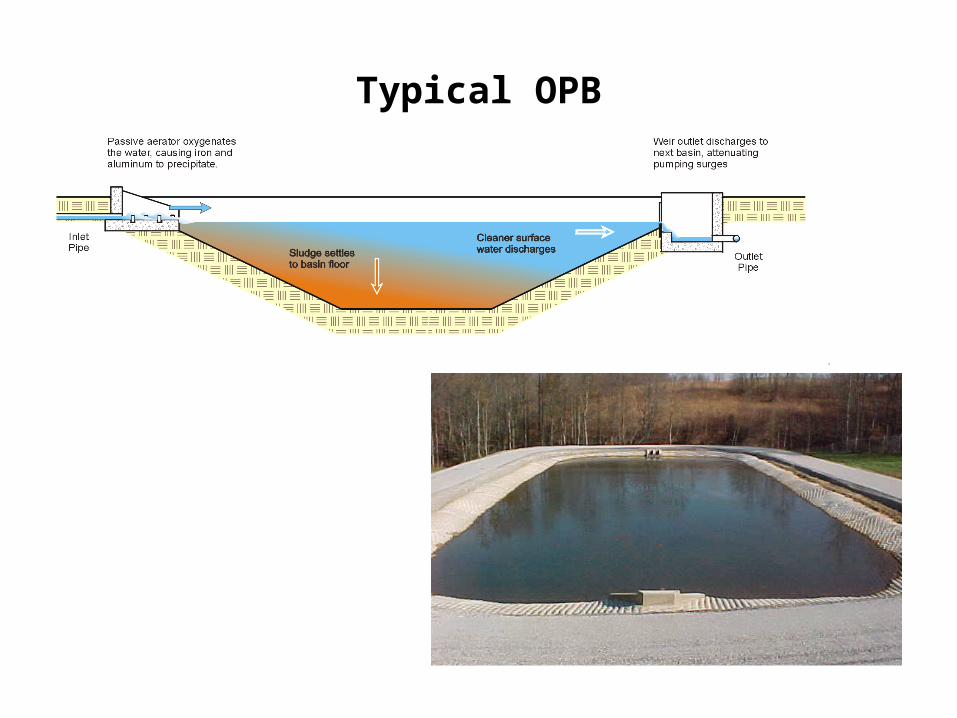
Typical OPB
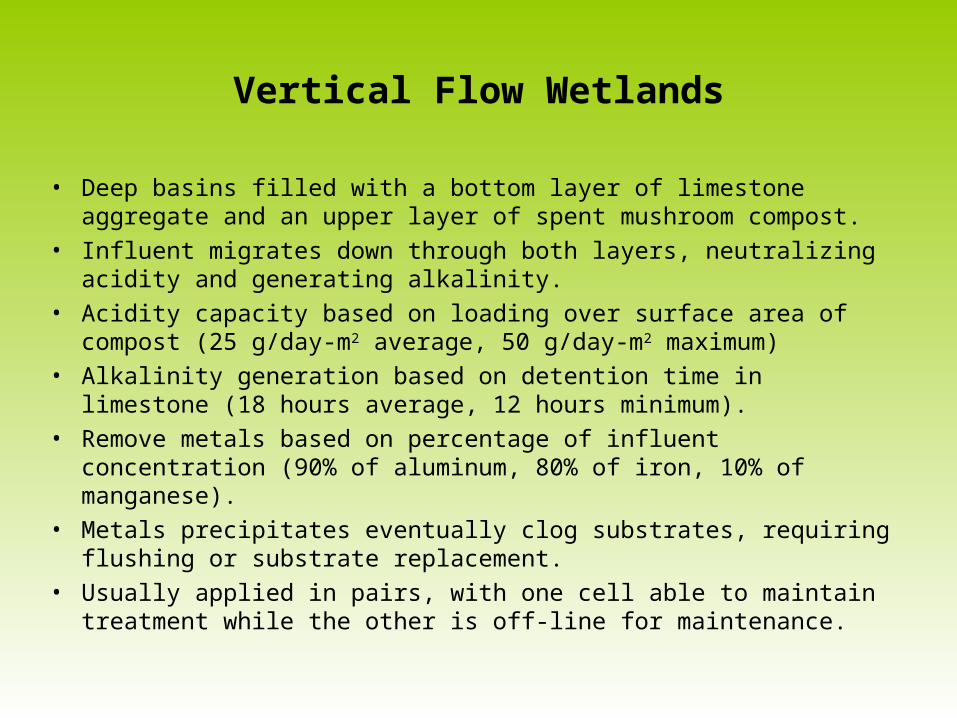
Vertical Flow Wetlands
• Deep basins filled with a bottom layer of limestone aggregate and an upper layer of spent mushroom compost.
• Influent migrates down through both layers, neutralizing acidity and generating alkalinity.
• Acidity capacity based on loading over surface area of compost (25 g/day-m2 average, 50 g/day-m2 maximum)
• Alkalinity generation based on detention time in limestone (18 hours average, 12 hours minimum).
• Remove metals based on percentage of influent concentration (90% of aluminum, 80% of iron, 10% of manganese).
• Metals precipitates eventually clog substrates, requiring flushing or substrate replacement.
• Usually applied in pairs, with one cell able to maintain treatment while the other is off-line for maintenance.
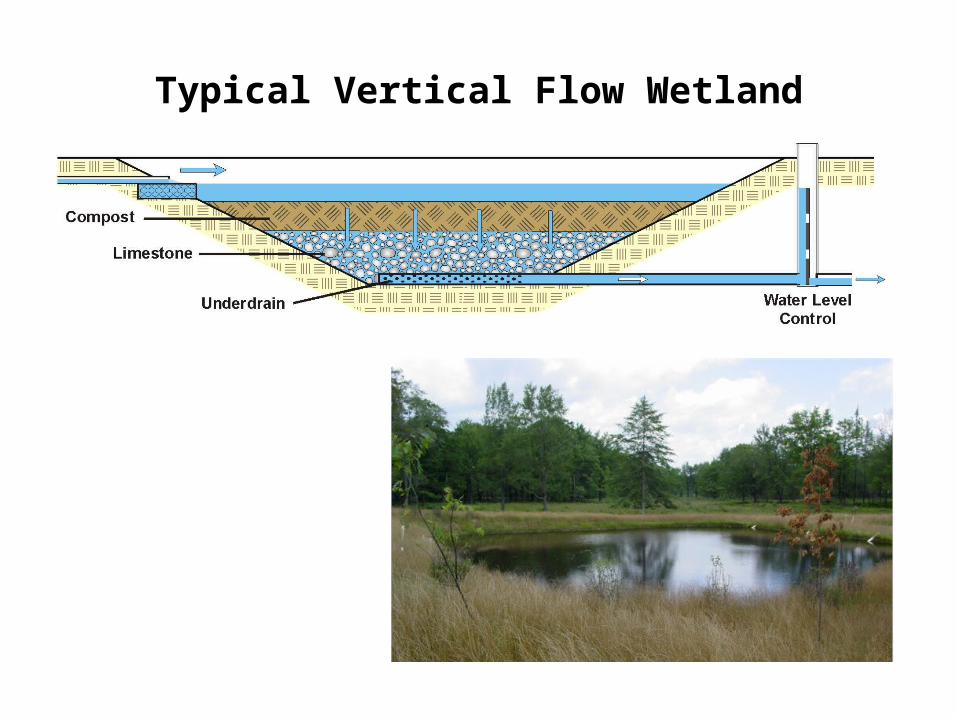
Typical Vertical Flow Wetland
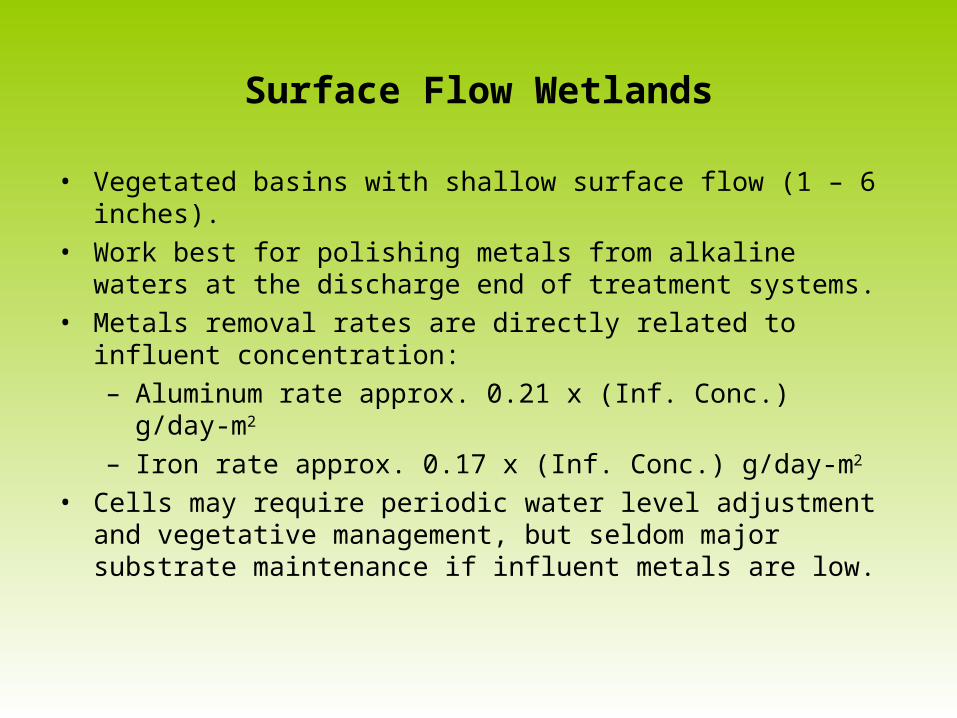
Surface Flow Wetlands
• Vegetated basins with shallow surface flow (1 – 6 inches).• Work best for polishing metals from alkaline waters at the discharge
end of treatment systems.• Metals removal rates are directly related to influent concentration:
– Aluminum rate approx. 0.21 x (Inf. Conc.) g/day-m2
– Iron rate approx. 0.17 x (Inf. Conc.) g/day-m2
• Cells may require periodic water level adjustment and vegetative management, but seldom major substrate maintenance if influent metals are low.
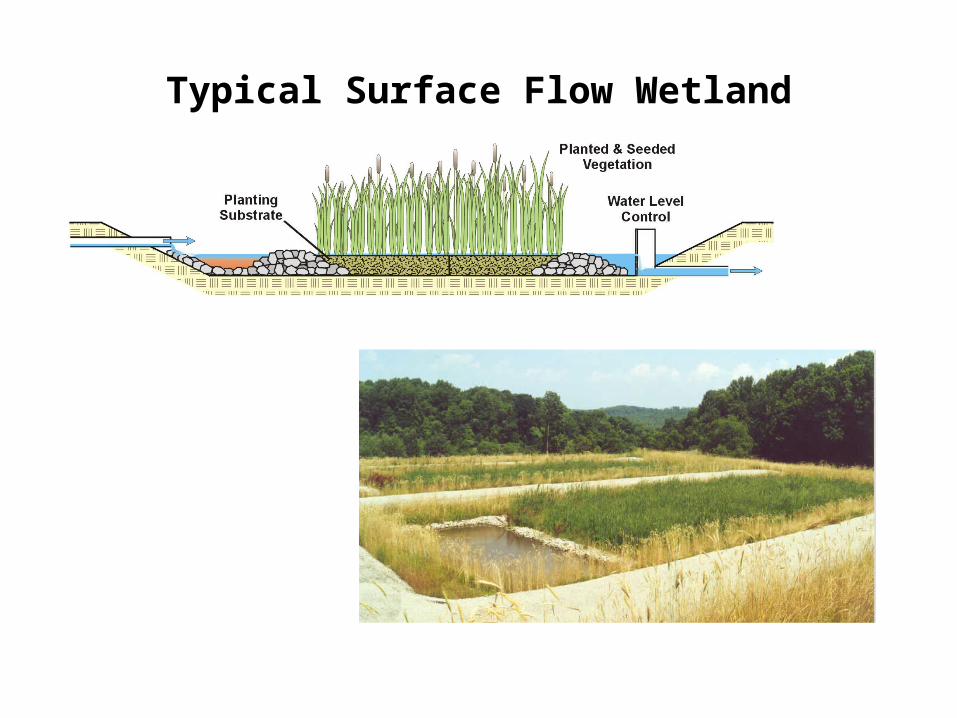
Typical Surface Flow Wetland
ConceptualPassive System Components
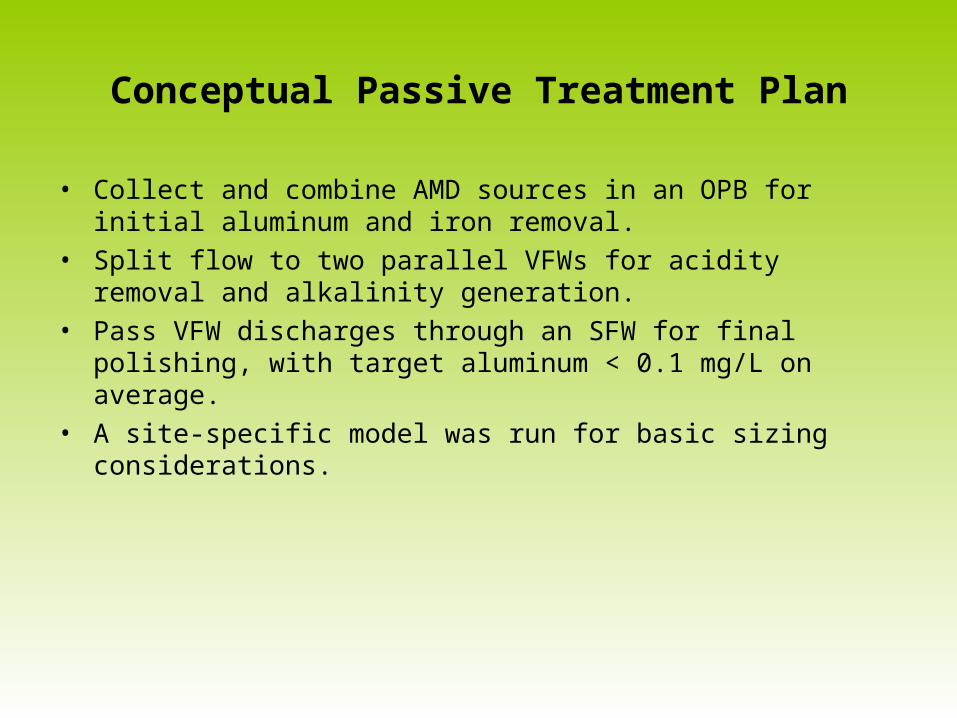
Conceptual Passive Treatment Plan
• Collect and combine AMD sources in an OPB for initial aluminum and iron removal.
• Split flow to two parallel VFWs for acidity removal and alkalinity generation.
• Pass VFW discharges through an SFW for final polishing, with target aluminum < 0.1 mg/L on average.
• A site-specific model was run for basic sizing considerations.
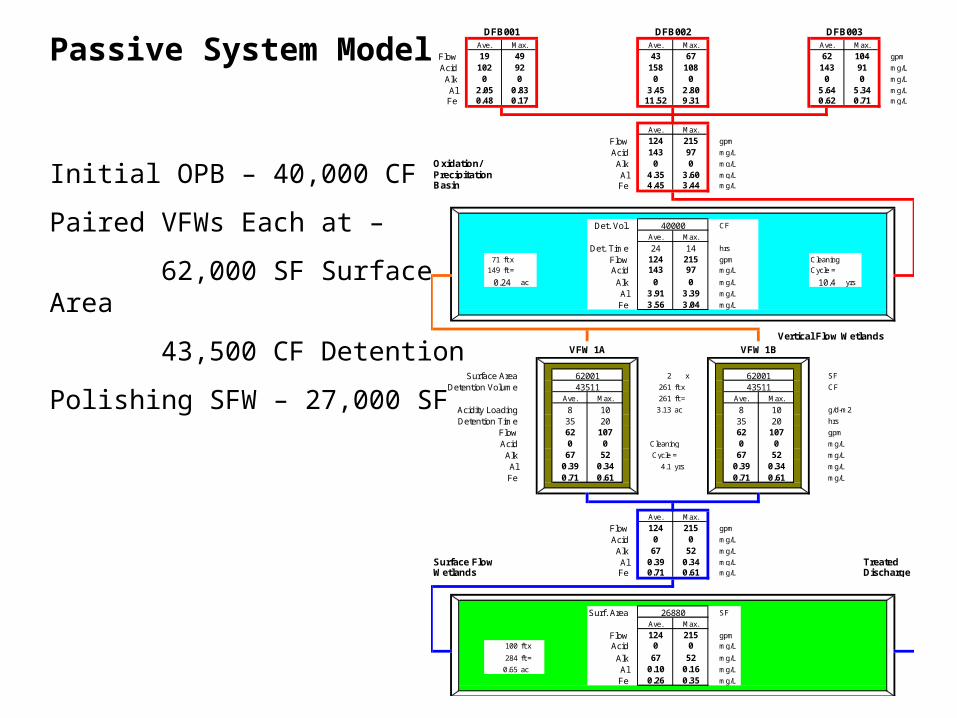
Passive System Model
Initial OPB – 40,000 CF
Paired VFWs Each at –
62,000 SF Surface Area
43,500 CF Detention
Polishing SFW – 27,000 SF
Flow gpm
Acid mg/L
Alk mg/L
Al mg/L
Fe mg/L
Flow gpm
Acid mg/L
Oxidation/ Alk mg/L
Precipitation Al mg/LBasin Fe mg/L
Det. Vol. CF
Det. Time hrs
71 ft x Flow gpm Cleaning149 ft = Acid mg/L Cycle =
ac Alk mg/L yrs
Al mg/L
Fe mg/L
Vertical Flow Wetlands
Surface Area 2 x SF
Detention Volume 261 ft x CF
261 ft =
Acidity Loading ac g/d-m2
Detention Time hrs
Flow gpm
Acid mg/L
Alk mg/L
Al yrs mg/L
Fe mg/L
Flow gpm
Acid mg/L
Alk mg/L
Surface Flow Al mg/L TreatedWetlands Fe mg/L Discharge
Surf. Area SF
Flow gpm100 ft x Acid mg/L
284 ft = Alk mg/L
ac Al mg/L
Fe mg/L
62
124
4.354.45
35
143
03.913.56
3.13
11.52
14215
Max.
0.62
124 21597
0
0.390.71
0.71
1240
10.4
40000
0.48
24
0.17
0.24
Ave.
97
0
143
1580
3.45
62
5.64
19102
02.05
62
8
0.61
Cleaning
Cycle =
4.1
35
067
0.39
49920
0.83
Ave. Max.
DFB001Ave.
9.31
DFB002Ave.Max.
67108
01430
43
Ave.
5.340.71
DFB003
Max.
Max.
104910
2.80
0.34
03.603.44
0.39
067
3.393.04
8
VFW 1A VFW 1B
Ave. Max. Ave. Max.
6200143511
1020
107052
0.340.61
6200143511
0.71
107
1020
052
Ave. Max.
0.65
052
0.340.61
215
67
0.160.35
Ave. Max.
0
670.100.26
26880
2150
52
124
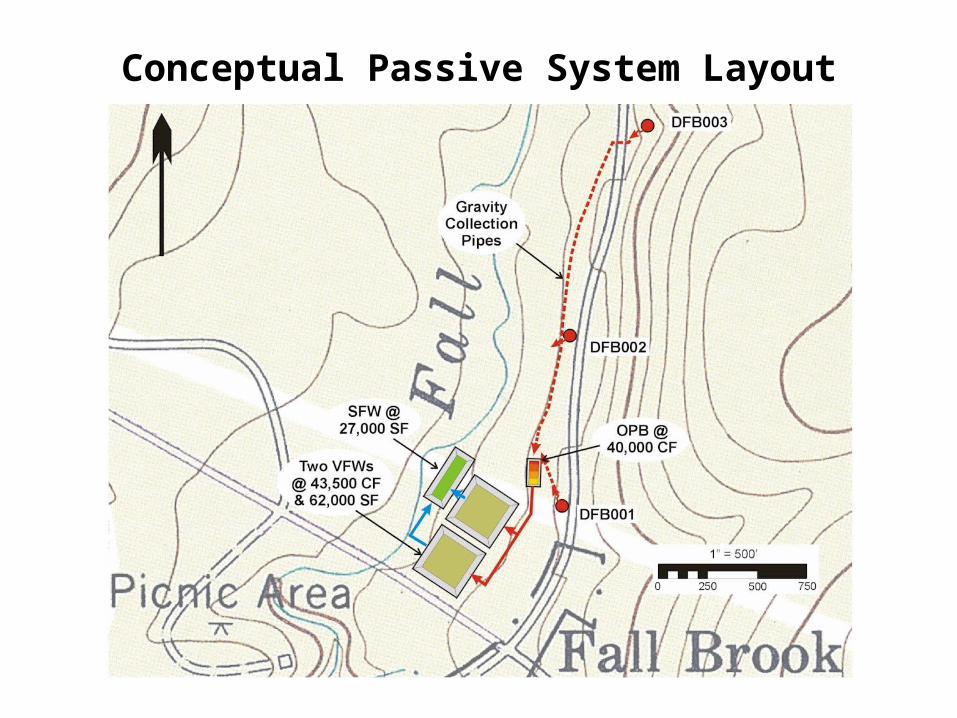
Conceptual Passive System Layout
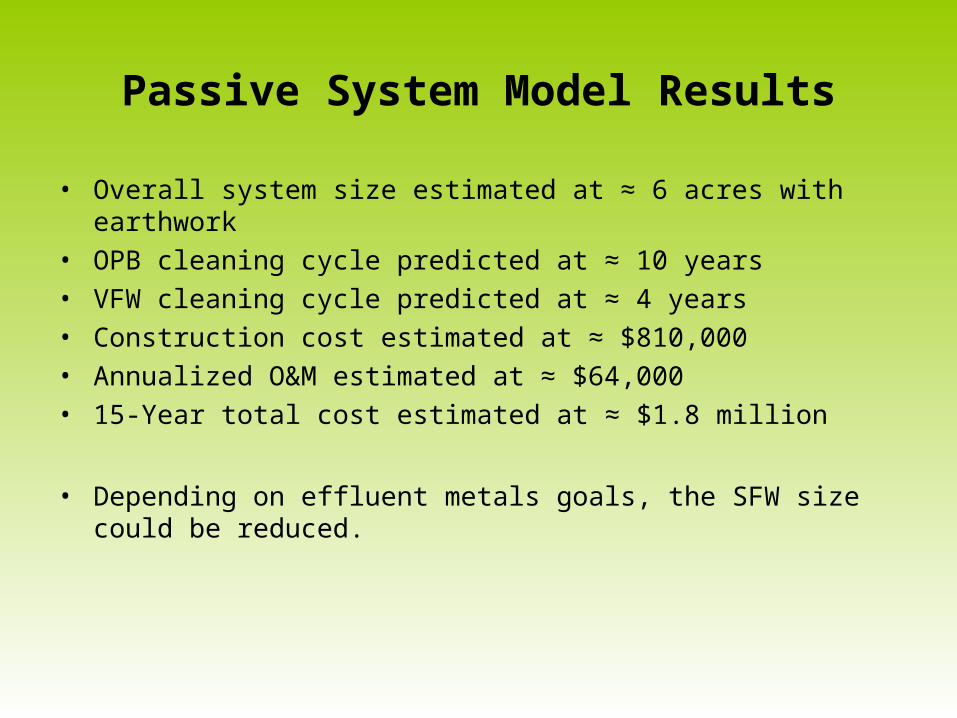
Passive System Model Results
• Overall system size estimated at ≈ 6 acres with earthwork• OPB cleaning cycle predicted at ≈ 10 years• VFW cleaning cycle predicted at ≈ 4 years• Construction cost estimated at ≈ $810,000• Annualized O&M estimated at ≈ $64,000• 15-Year total cost estimated at ≈ $1.8 million
• Depending on effluent metals goals, the SFW size could be reduced.
ConceptualChemical System Components
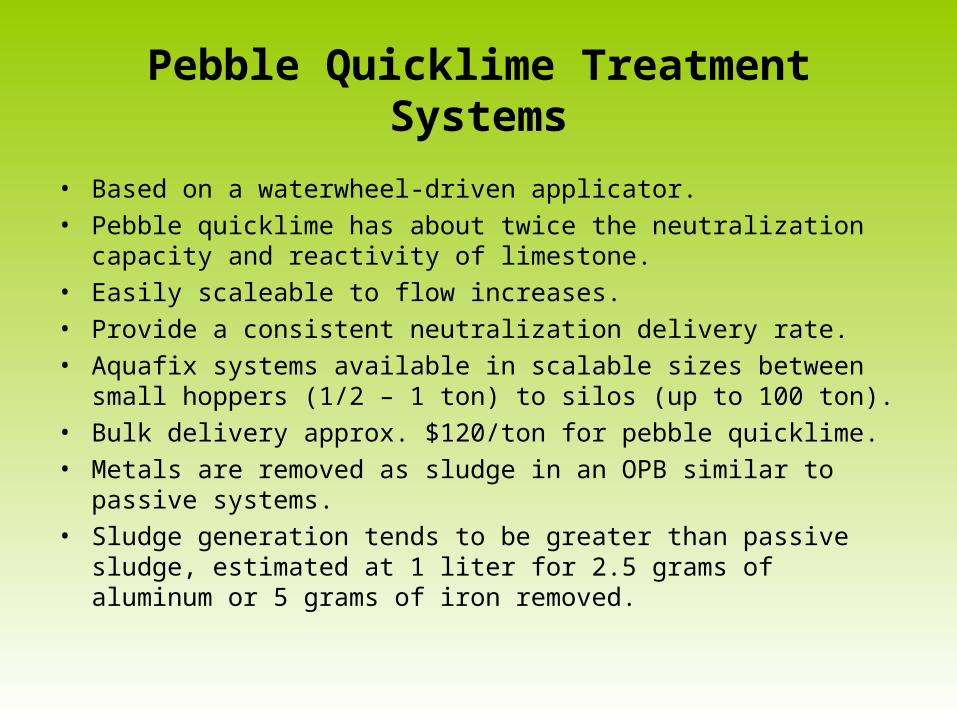
Pebble Quicklime Treatment Systems
• Based on a waterwheel-driven applicator.• Pebble quicklime has about twice the neutralization capacity and
reactivity of limestone.• Easily scaleable to flow increases.• Provide a consistent neutralization delivery rate.• Aquafix systems available in scalable sizes between small hoppers
(1/2 – 1 ton) to silos (up to 100 ton).• Bulk delivery approx. $120/ton for pebble quicklime.• Metals are removed as sludge in an OPB similar to passive
systems.• Sludge generation tends to be greater than passive sludge,
estimated at 1 liter for 2.5 grams of aluminum or 5 grams of iron removed.
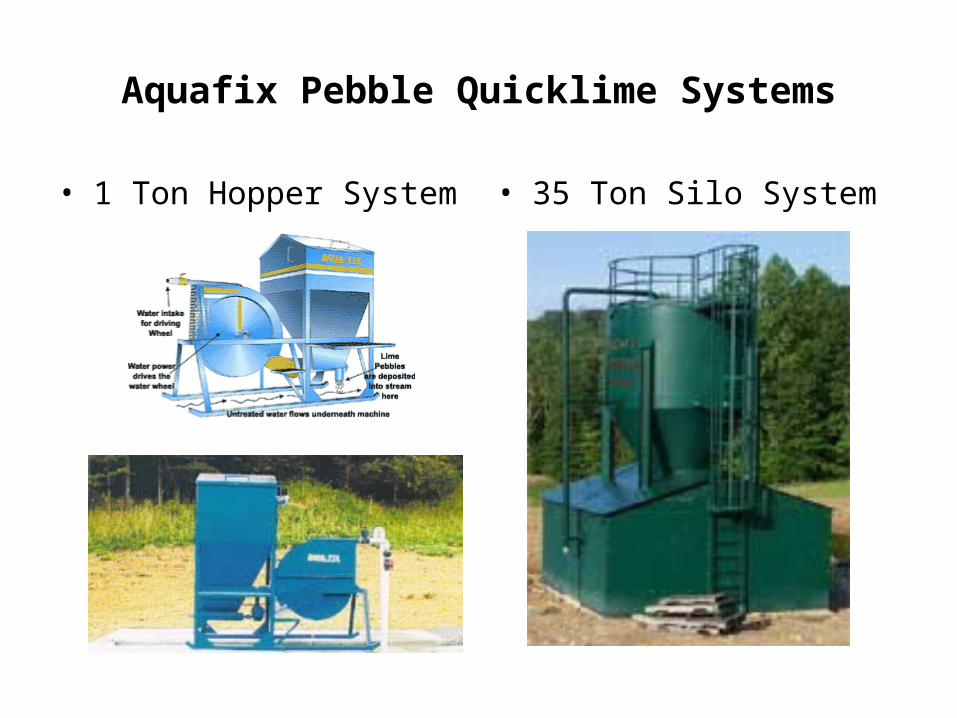
Aquafix Pebble Quicklime Systems
• 1 Ton Hopper System • 35 Ton Silo System
Conceptual Chemical Treatment Plan
• Collect and combine AMD sources in a single channel.• Apply pebble quicklime using a flow split to drive an Aquafix system.• Precipitate sludge in paired downstream OPBs, with one OPB
capable of maintaining 24 hour detention while the other is offline for cleaning.
• Site-specific model was run for basic sizing requirements using specifications of pebble quicklime and Aquafix systems.
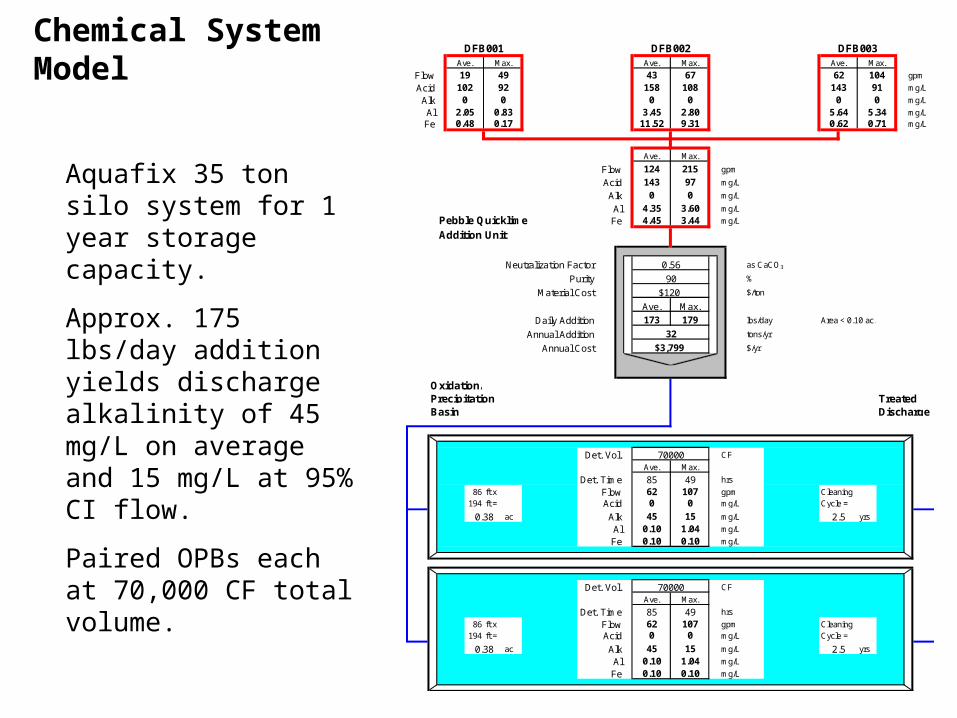
Chemical System Model
Aquafix 35 ton silo system for 1 year storage capacity.
Approx. 175 lbs/day addition yields discharge alkalinity of 45 mg/L on average and 15 mg/L at 95% CI flow.
Paired OPBs each at 70,000 CF total volume.
Flow gpm
Acid mg/L
Alk mg/L
Al mg/L
Fe mg/L
Flow gpm
Acid mg/L
Alk mg/L
Al mg/L
Pebble Quicklime Fe mg/L
Addition Unit
Neutralization Factor as CaCO3
Purity %
Material Cost $/ton
Daily Addition lbs/day Area < 0.10 ac.
Annual Addition tons/yr
Annual Cost $/yr
Oxidation/Precipitation TreatedBasin Discharge
Det. Vol. CF
Det. Time hrs
86 ft x Flow gpm Cleaning194 ft = Acid mg/L Cycle =
ac Alk mg/L yrs
Al mg/L
Fe mg/L
Det. Vol. CF
Det. Time hrs
86 ft x Flow gpm Cleaning194 ft = Acid mg/L Cycle =
ac Alk mg/L yrs
Al mg/L
Fe mg/L
0.10 1.040.10 0.10
0.38 45 15 2.5
62 1070 0
Ave. Max.
85 49
90
Ave. Max.
70000
03.603.44
173 179
$120
32
0.56
Ave.
1.040.10
Ave.
49107
Max.
0.62
215
$3,799
1080
DFB003
Max.
Max.
104910
2.809.31
1430
43Ave. Max.
00
62Max.
67
DFB001Ave.
4992
19102
DFB002
5.64
2.5
5.340.71
2.05
1580
3.450.830.48
85
0.17
0.38
Ave.
143
11.52
124
0
450.100.10
970
62
4.354.45
70000
0
15
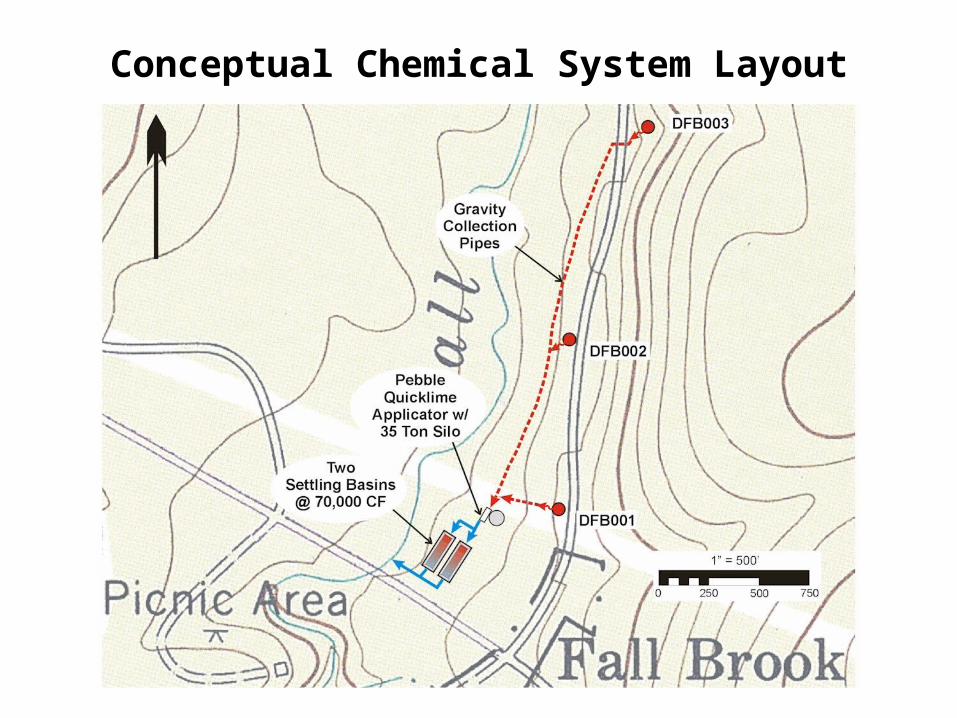
Conceptual Chemical System Layout
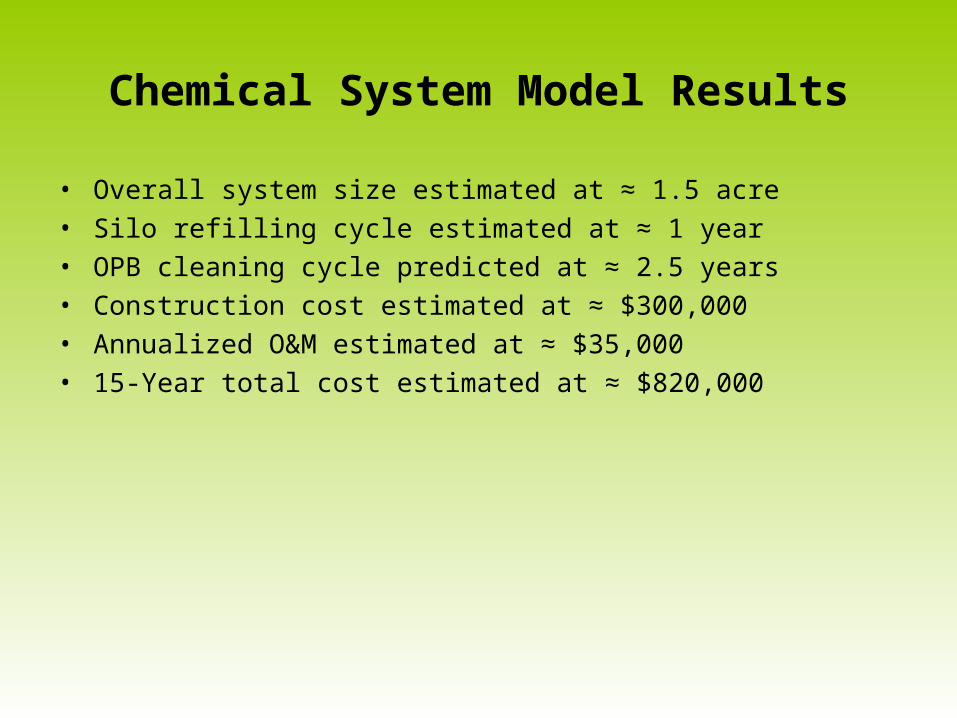
Chemical System Model Results
• Overall system size estimated at ≈ 1.5 acre• Silo refilling cycle estimated at ≈ 1 year• OPB cleaning cycle predicted at ≈ 2.5 years• Construction cost estimated at ≈ $300,000• Annualized O&M estimated at ≈ $35,000• 15-Year total cost estimated at ≈ $820,000
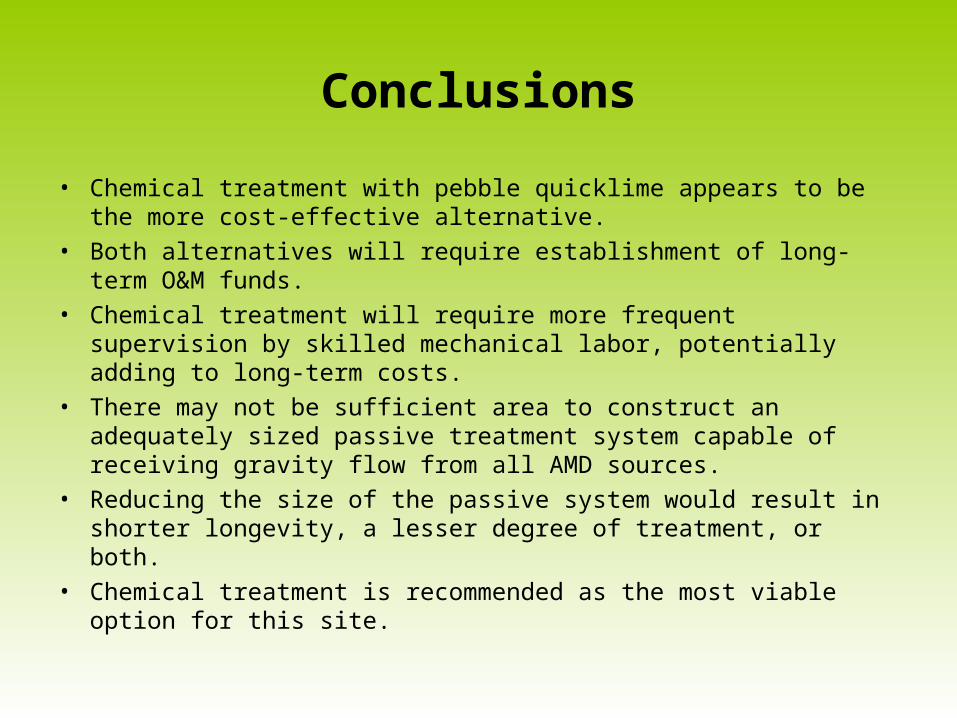
Conclusions
• Chemical treatment with pebble quicklime appears to be the more cost-effective alternative.
• Both alternatives will require establishment of long-term O&M funds.• Chemical treatment will require more frequent supervision by skilled
mechanical labor, potentially adding to long-term costs.• There may not be sufficient area to construct an adequately sized
passive treatment system capable of receiving gravity flow from all AMD sources.
• Reducing the size of the passive system would result in shorter longevity, a lesser degree of treatment, or both.
• Chemical treatment is recommended as the most viable option for this site.
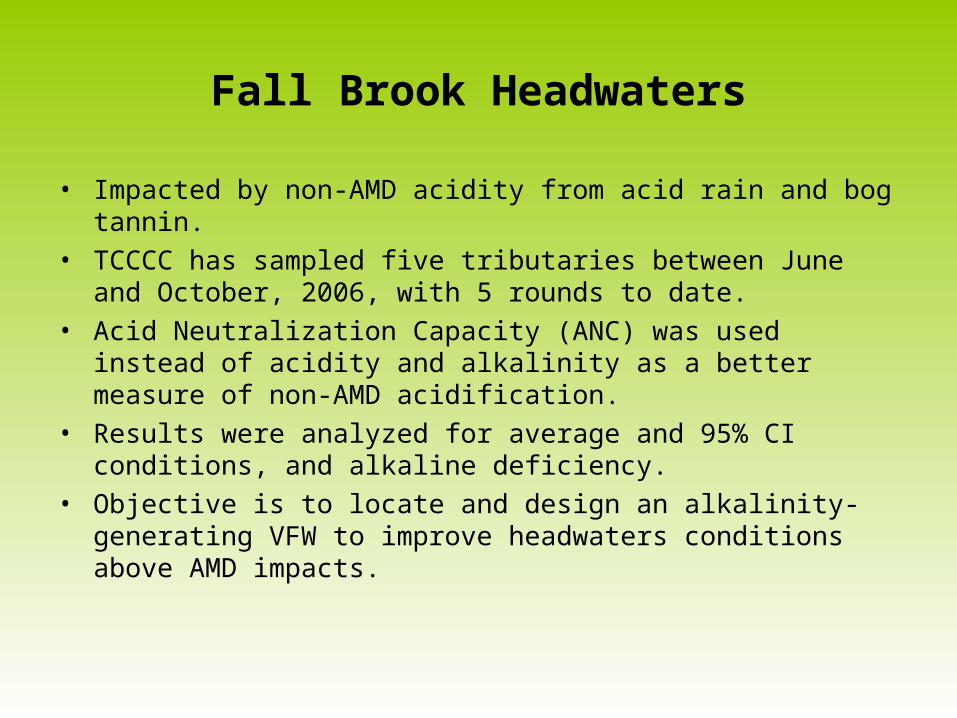
Fall Brook Headwaters
• Impacted by non-AMD acidity from acid rain and bog tannin.• TCCCC has sampled five tributaries between June and October,
2006, with 5 rounds to date.• Acid Neutralization Capacity (ANC) was used instead of acidity and
alkalinity as a better measure of non-AMD acidification.• Results were analyzed for average and 95% CI conditions, and
alkaline deficiency.• Objective is to locate and design an alkalinity-generating VFW to
improve headwaters conditions above AMD impacts.
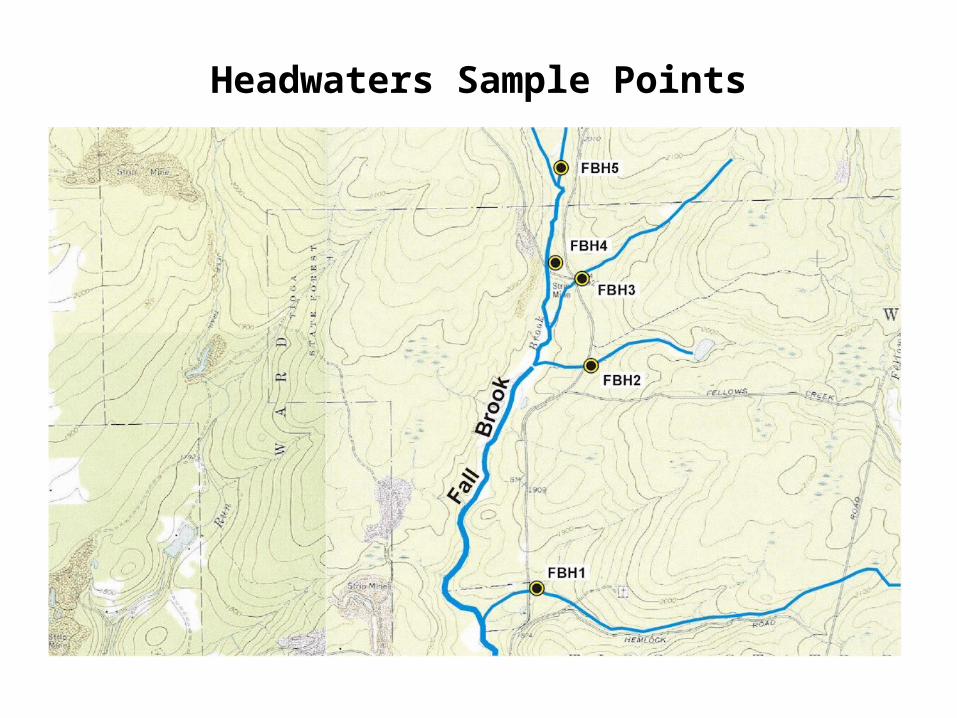
Headwaters Sample Points
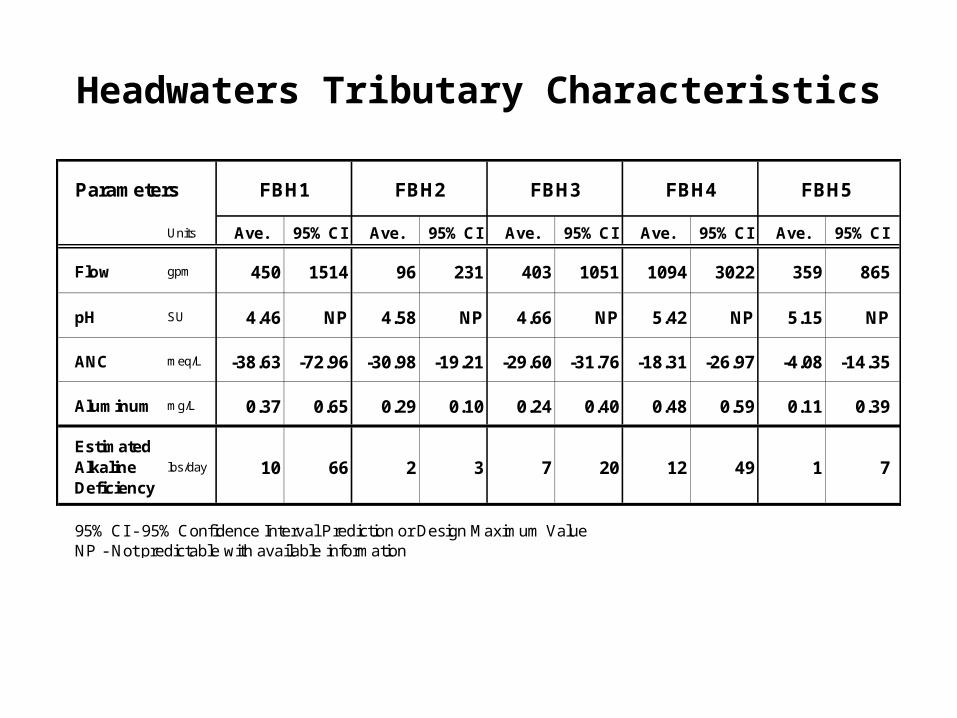
Headwaters Tributary Characteristics
Units Ave. 95% CI Ave. 95% CI Ave. 95% CI Ave. 95% CI Ave. 95% CI
Flow gpm 450 1514 96 231 403 1051 1094 3022 359 865
pH SU 4.46 NP 4.58 NP 4.66 NP 5.42 NP 5.15 NP
ANC meq/L -38.63 -72.96 -30.98 -19.21 -29.60 -31.76 -18.31 -26.97 -4.08 -14.35
Aluminum mg/L 0.37 0.65 0.29 0.10 0.24 0.40 0.48 0.59 0.11 0.39
Estimated Alkaline Deficiency
lbs/day 10 66 2 3 7 20 12 49 1 7
95% CI - 95% Confidence Interval Prediction or Design Maximum ValueNP - Not predictable with available information
FBH5FBH4Parameters FBH1 FBH2 FBH3
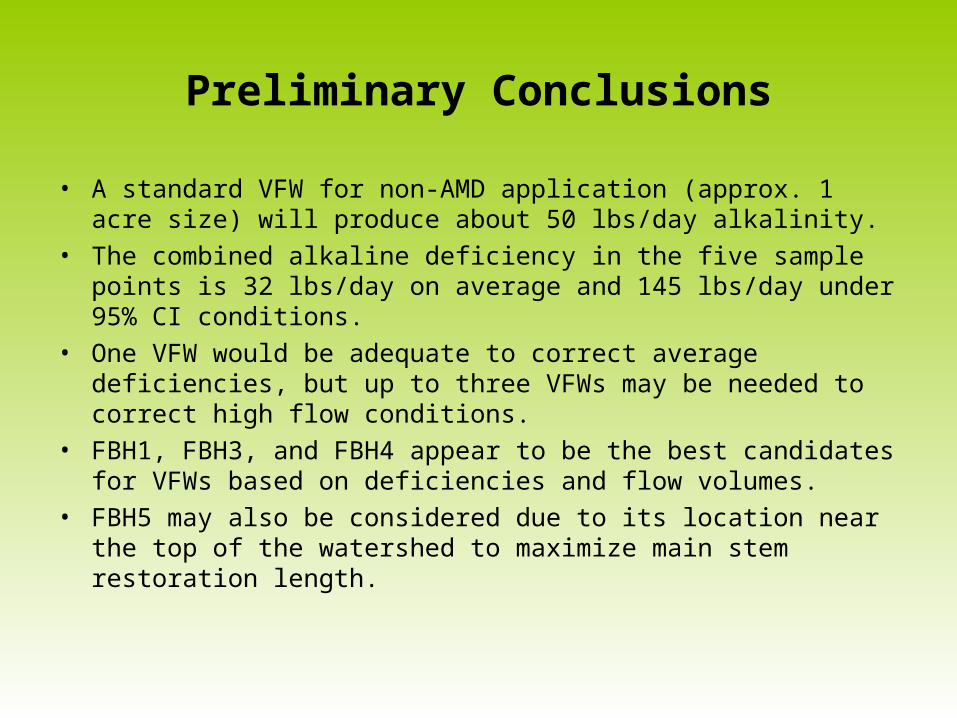
Preliminary Conclusions
• A standard VFW for non-AMD application (approx. 1 acre size) will produce about 50 lbs/day alkalinity.
• The combined alkaline deficiency in the five sample points is 32 lbs/day on average and 145 lbs/day under 95% CI conditions.
• One VFW would be adequate to correct average deficiencies, but up to three VFWs may be needed to correct high flow conditions.
• FBH1, FBH3, and FBH4 appear to be the best candidates for VFWs based on deficiencies and flow volumes.
• FBH5 may also be considered due to its location near the top of the watershed to maximize main stem restoration length.