Embed Size (px)
Citation preview

Division of Water
Upper Esopus Creek Biological Assessment
2009-2010 Survey
New York State Department of Environmental Conservation
New York State DEPARTMENT OF ENVIRONMENTAL CONSERVATION
From the digital collections of the New York State Library.
BIOLOGICAL STREAM ASSESSMENT
Upper Esopus Creek Ulster County, New York - Lower Hudson River Basin
Survey dates: August, 2009 and 2010 Report date: April, 2013
Alexander J. Smith
Stream Biomonitoring Unit Bureau of Water Assessment and Management
Division of Water NYS Department of Environmental Conservation
Albany, New York
From the digital collections of the New York State Library.
Survey and Report Participants Brian T. Duffy, Diana L. Heitzman, Lawrence E. Abele, Jeff L. Lojpersberger, Margaret A. Novak, NYS Department of Environmental Conservation, Division of Water, Stream Biomonitoring Unit, Bureau of Water Assessment and Management, Albany, New York Barry P. Baldigo, Mike R. McHale, Scott D. George, Jason Siemion United States Geological Survey, Department of Interior, Water Science Center, Troy, New York
From the digital collections of the New York State Library.
Table of Contents Background ..................................................................................................................................... 1 Results and Conclusions ................................................................................................................. 1 Introduction ..................................................................................................................................... 2 Methods........................................................................................................................................... 3
Study Area ................................................................................................................................... 3 Biological Assessment ................................................................................................................. 3
Results and Discussion ................................................................................................................... 6
Tables Table 1. Sampling locations used in the collection of benthic macroinvertebrates ........................ 6 Table 2. Summary statistics of metrics for study sites within the ≤ 40 km2 size class ................. 15 Table 3. Summary statistics of metrics for study sites within the 41 - 84 km2 size class ............. 15 Table 4. Summary statistics of metrics for study sites within the ≥ 85 km2 2 size class .............. 16 Table 5. Macroinvertebrate taxa collected during the 2009 sampling season. ............................. 17 Table 6. Macroinvertebrate taxa collected during the 2010 sampling season. ............................. 22 Table 7. Summary of basic field physicochemicalparameters ...................................................... 28
Figures
Figure 1. Map of the Upper Esopus Creek watershed .................................................................... 5 Figure 2. Non-metric multi-dimensional scaling plot of sampling locations in the Upper Esopus Creek watershed. ............................................................................................................................. 8 Figure 3. Percent contribution of dominant macroinvertebrate groups to sampling site similarity among drainage area size classes. ................................................................................................... 8 Figure 4. Combined 2009 and 2010 benthic macroinvertebrate Biological Assessment Profile (BAP) scores for main-stem Upper Esopus Creek sampling stations ............................................. 9 Figure 5. Biological Assessment Profile (BAP) scores for all main-stem Upper Esopus Creek sampling stations in 2009 and 2010 .............................................................................................. 12 Figure 6. Mean summer discharge, instantaneous temperature, and silt cover index results from main-stem Upper Esopus Creek sampling stations during 2009 and 2010. ................................. 13 Figure 7. Continuous temperature measured upstream of the Shandaken Tunnel (USOP-03A), downstream (USOP-03B), and from the Shandaken Tunnel itself (Portal) .................................. 14
From the digital collections of the New York State Library.
1
Stream: Upper Esopus Creek
River Basin: Lower Hudson River Basin Reach: Oliverea to Boiceville, NY, NY Background The New York State Department of Environmental Conservation (NYSDEC) Stream Biomonitoring Unit (SBU) and United States Geological Survey (USGS) sampled the Upper Esopus Creek and its tributaries, Ulster County, New York, on August 25-27, 2009 and August 17-18, 2010. These surveys were conducted to provide a comprehensive assessment of the biological condition (fish, invertebrates, and algae) and water quality (turbidity and nutrients) that occurs in the Upper Esopus Creek. The results and conclusions presented here cover invertebrate communities only. Reports addressing fish, algae, turbidity and nutrients are in development by the USGS, Troy Water Science Center. Major objectives of this effort were to characterize the natural variability in biological communities, their relationship with water quality, and the potential effects of point sources of turbidity and nutrients. The main goal of this project was to quantify the impact of present water quality concerns on the Upper Esopus Creek, including the influence of turbid water from the Shandaken Tunnel and Stony Clove Creek, and possible nutrient enrichment from Birch Creek and the Village of Phoenicia. To characterize water quality based on biological community condition, benthic macroinvertebrate communities were sampled from riffle habitats at each site. Methods used are described in the Standard Operating Procedure: Biological Monitoring of Surface Waters in New York State (Smith et al., 2012) and outlined in this document. Funding for this project was provided through the Safe Drinking Water Act. Results and Conclusions
1. Single site biological assessments for water quality in the Upper Esopus Creek watershed fall within the range of non- to slightly impacted conditions. These conditions reflect good to very good water quality and a macroinvertebrate community indicative of conditions with minimal or limited human impact. Most of the sites assessed as slightly impacted were located downstream of the Shandaken Tunnel and sampled during the summer of 2010.
2. Although water quality above and below the Shandaken Tunnel is assessed as non- or slightly impacted, and thus, supportive of uses, there are significant shifts in biological communities immediately downstream of the Tunnel, compared with upstream sites. These changes were documented using biological impairment criteria, and occurred consistently and in each of the years sampled. Impacts are most frequently due to loss of sensitive taxa.
3. Results suggest the primary driver affecting the magnitude of difference in biological condition downstream of the Shandaken Tunnel is variation in yearly flow condition. Impacts appear to be the result of compounding effects of low flow, warm temperatures, and the deposition of silt. The relative influence from the Shandaken Tunnel during normal flow years provides enough discharge to maintain cooler temperatures and prevent siltation of bottom habitats.
From the digital collections of the New York State Library.
2
Introduction
The Esopus Creek, located in the south central Catskill Mountain Region of southeastern New York, is part of the New York City (NYC) drinking water supply system. The stream was dammed in 1915 to form the Ashokan Reservoir, splitting the creek into Upper (upstream of the reservoir) and Lower segments. This investigation focuses on the Upper Esopus Creek which follows a 67.3 km semi-circular course from its headwaters at Lake Winnisook, to the Ashokan Reservoir near Boiceville. This portion of the stream drains approximately 497 km2 of watershed (Figure 1). The entire (upper and lower segments) watershed is within the Catskill Park, draining some of the region’s most rugged and mountainous terrain. Forested land comprises over 95% of the watershed and features glacial lacustrine clay deposits that contribute suspended sediment to the system (CCE, 2007).
The Schoharie Reservoir, located 27 miles north of the Ashokan Reservoir, supplies water to the Upper Esopus Creek through a man-made underground channel known as the Shandaken Tunnel (Figure 1). The Shandaken Tunnel joins the Upper Esopus Creek near Allaben, NY approximately 18 km upstream of the Ashokan Reservoir. The Shandaken Tunnel contributes turbid and often cool water to the Upper Esopus Creek. Impacts on biological communities in the Upper Esopus Creek from the condition of Shandaken Tunnel water quality have been a concern for many years (Bode et al., 1995; Bode et al., 2001; Duffy et al., 2011; Smith et al., 2008). However, in 2006 a State Pollution Elimination Discharge (SPDES) permit was issued for the Shandaken Tunnel. This permit set management targets for discharge and turbidity. Since the issuance of this permit there have not been any violations of the turbidity limits and citizen complaints have been drastically reduced (Kenneth Kosinski, NYSDEC, NYC Watershed Section, Personal Communication). In addition to the Shandaken Tunnel nine major tributaries (Table 1) deliver water to the Upper Esopus (Figure 1).
Possible influences on biological community condition exist in the Upper Esopus watershed, although their influence is not well known. These include effluent from the NYCDEP Pine Hill (V) Sewage Treatment Plant which enters the Upper Esopus in Big Indian, NY via Birch Creek (Bode et al., 2005; Bode et al., 2001) and concentrated areas of septic system use in close proximity to the stream, especially in the vicinity of Phoenicia, N.Y. (Duffy et al., 2011; Smith et al., 2008).
Previous studies by the NYSDEC SBU have attempted to characterize impacts from these potential sources of disturbance (Bode et al., 2005; Bode et al., 1995; Bode et al., 2001; Duffy et al., 2011; Smith et al., 2008). However, limited sample frequency and lack of quantified yearly variation in populations prevented definitive conclusions. These investigations by the NYSDEC SBU surveyed benthic macroinvertebrate and algal communities in selected tributaries and the Upper Esopus Creek beginning in the mid 1990s. Sampling typically consisted of single benthic macroinvertebrate or periphyton samples from historical, main-stem Upper Esopus Creek sites, accompanied by limited physicochemical measurements. The result was rapid, qualitative assessments, providing useful information on general biological condition. However, confidence in conclusions was weak because natural variance in community composition was never characterized.
In order to elucidate the effects of potential water quality disturbance in the Upper Esopus Creek watershed, the NYSDEC SBU and the USGS implemented a multi-year survey of biological communities and water chemistries. Specifically, the survey was designed to accurately assess potential impacts from the Shandaken Tunnel, Birch Creek, Stony Clove Creek
From the digital collections of the New York State Library.

3
and the Village of Phoenicia. In addition to the Shandaken Tunnel, the investigation aimed to identify other sources of substantial turbidity and nutrients in the watershed by sampling each of the major tributaries. Replicate sampling of biological communities accompanied by detailed physicochemical measurements helped quantify natural variability. Other concurrent investigations reported separately by the USGS include study of local trout populations, turbidity, and suspended sediment loads. Some of the information collected in these other studies is used here with permission for interpretation of results. Methods Study Area Macroinvertebrate samples were collected from 20 study sites in August of 2009 and 2010 from the Upper Esopus Creek and its major tributaries (Figure 1, Table 1). Of the 20 sites, ten are on tributaries and ten are on the main-stem of the Upper Esopus Creek. Main-stem sites were distributed above and below the Shandaken Tunnel (Figure 1, Table 1) to discriminate between the influence of naturally changing stream characteristics and the tunnel on biological communities. Sampling sites were also positioned above and below the village of Phoenicia (Figure 1, Table 1) and on Stony Clove Creek, a major tributary thought to contribute substantial suspended sediment loads (Figure 1, Table 1). Sampling stations were divided into drainage size classes of ≤ 40 km2, 41 - 84 km2, and ≥ 85 km2. These size classes were developed based on a sampling site ordination using similarity of presence and abundance of macroinvertebrate taxa from each sampling location. Macroinvertebrate abundance data were transformed using Log x+1 to create a Bray Curtis similarity matrix from which non-metric multi-dimensional scaling was applied. Clusters of sites from this ordination were then used to set the boundaries of drainage size classes. These size classes facilitated the evaluation of NYSDEC’s biological impairment criteria for flowing waters. Impairment criteria were evaluated against a control site within each of the size classes in the same sampling year (Table 1). For the ≤ 40 km2 size class the control site was the Esopus Creek at Oliverea (USOP-00), for the 41 - 84 km2 the control site was Woodland Valley Creek (WODC-01), and for the ≥ 85 km2 the control site was the Upper Esopus at Allaben (USOP-03A) which is immediately upstream of the Shandaken Tunnel. In the case of the ≥ 85 km2 class, USOP-03A provided direct comparison with sites downstream of the Shandaken Tunnel, isolating its effects on in-stream conditions. Biological Assessment Field, laboratory, and assessment methods followed the Standard Operating Procedure: Biological Monitoring of Surface Waters in New York State (NYSDEC, 2012) and Biological Impairment Criteria for Flowing Waters in New York State (Bode et al., 1990). Four replicate benthic macroinvertebrate samples were collected from each of the 20 sites in 2009 and 2010. Samples were collected from riffles with cobble and gravel or cobble and boulder substrate by kick-sampling for 2 minutes while proceeding along a diagonal transect downstream for 5 meters (Bode et al., 1990; Smith et al., 2012). A 0.5 m wide, 800 x 900 micron mesh kick net was used. Samples were preserved in 95% ethanol and shipped to a contract laboratory for processing. 100-specimen subsamples were randomly picked from each sample. Specimens were identified to lowest possible taxonomic level. New York State’s multimetric index of biological integrity was used to determine water quality at each of the sites sampled (NYSDEC, 2012). This method calculates species richness,
From the digital collections of the New York State Library.
4
Ephemeroptera–Plecoptera–Trichoptera richness (Lenat, 1988), Hilsenhoff’s biotic index score (Hilsenhoff, 1987), and percent model affinity (Novak and Bode, 1992). The result of each of these indices is placed on a common 10 scale and the mean of the adjusted values is calculated. The result, called the Biological Assessment Profile (BAP) score, is a single value for which a four-tiered scale of water quality impact (non-, slight, moderate, or severe) has been established (NYSDEC, 2012). New York State’s biological impairment criteria (Bode et al., 1990) were used to identify sites in the study where aquatic life was significantly degraded compared to control sites. Assessing exceedence of impairment criteria involved the comparison of individual biological assessment metrics and the BAP between upstream control and downstream sampling sites. This method identifies sites which have water quality metric scores that exceed the normal, expected variance between an upstream-downstream or control-test set of locations. Violation of biological impairment criteria do not necessarily mean a water body is not supportive of aquatic life use, rather there is a significant difference in condition between two locations. Individual biological community metrics were averaged from the four replicates and the mean values were used to evaluate provisional impairment levels between sites. The impairment criteria evaluated were: Hilsenhoff’s Biotic Index (HBI) +1.5; Ephemeroptera, Plecoptera, Trichoptera, Richness (EPT) -4; Species Richness (Spp) -8; Species Dominance (Dom) +15; Percent Model Affinity (PMA) -20; and Biological Assessment Profile (BAP) -1.25. The threshold for BAP is provisional as it was not part of the original impairment criteria document written by Bode et al. (1990). If provisional impairment was identified, one-way analysis of variance (ANOVA) was performed along with a multiple comparisons test (Holm-Sidak method). This method is a slight deviation from the t-test evaluation of metrics presented in Bode et al. (1990). However, the multiple comparisons test is a more conservative test and allows for identification of threshold exceedence between multiple sites at one time. These tests determined whether statistically significant differences in mean metrics scores existed between control and non-control sites. All discharge and continuous temperature data collection was conducted by the USGS using standard collection protocols (Wilde et al., 1999). Stream stage was recorded at 15-minute intervals and discharge measurements were made at 8 week intervals and during high flow. Stage-discharge relations were developed for each site to compute the unit discharge. Water temperature was measured at 15-minute intervals using Forest Technology DTS-12 turbidity sensors and Campbell Scientific 547A water conductivity and temperature sensors.
From the digital collections of the New York State Library.
5
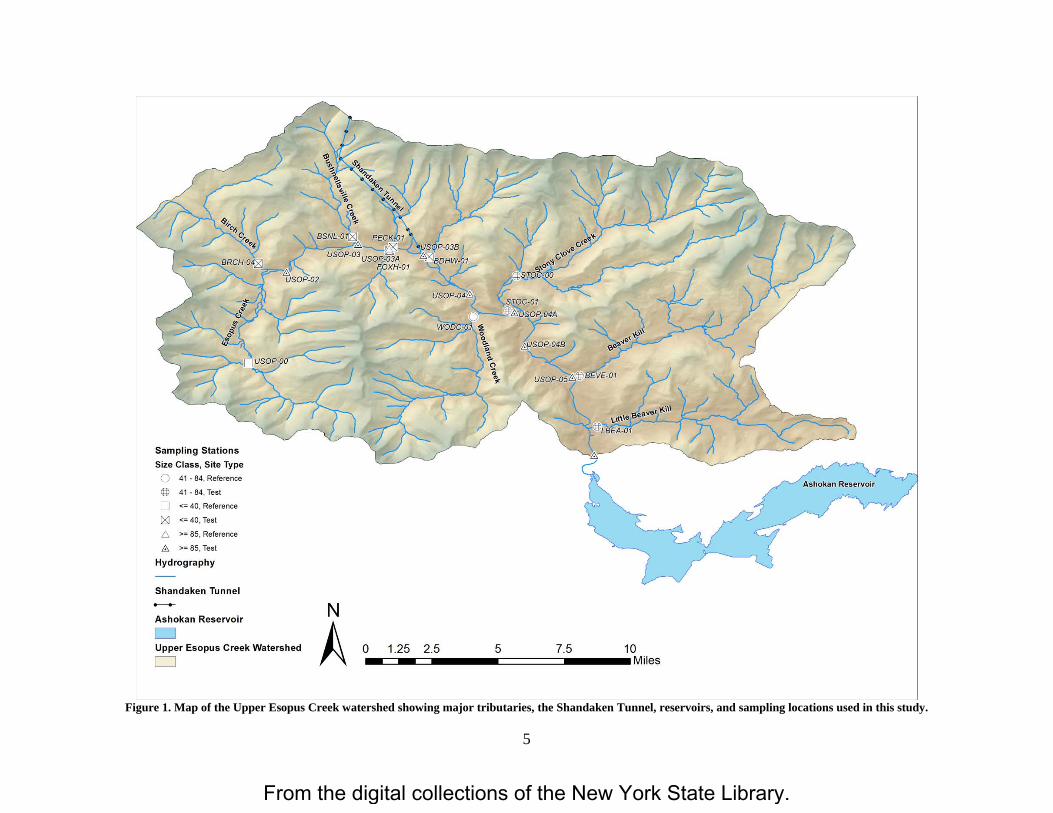
Figure 1. Map of the Upper Esopus Creek watershed showing major tributaries, the Shandaken Tunnel, reservoirs, and sampling locations used in this study.
Sampling Stations
Size Class, Site Type 0 41 - 84, R eference
@ 41 - 84, Test
0 <= 40, Reference
(8J <= 40, Test
6 >= 85, Reference
/;, >= 85, Test
Hydrography
Shandaken Tunnel
Ashokan Reservoir
D Upper Esopus Creek Watershed
D
N
A 0 1.25 2.5 - - 5 7.5 10 Miles
From the digital collections of the New York State Library.
6
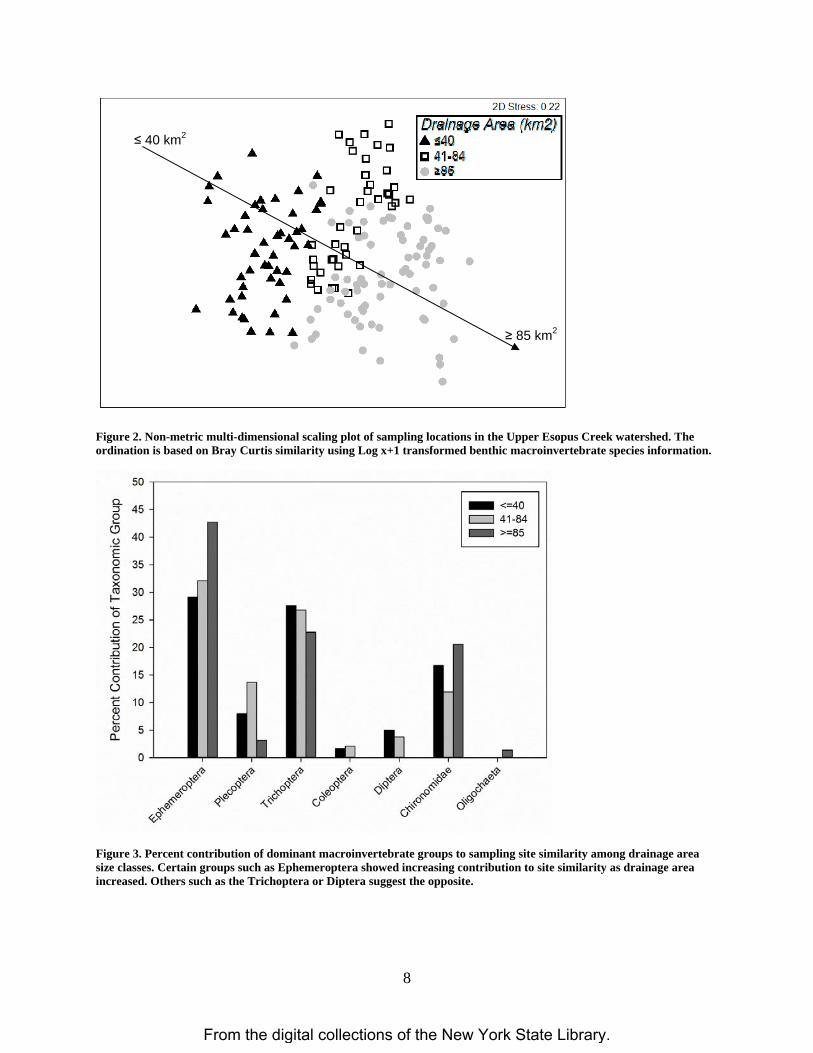
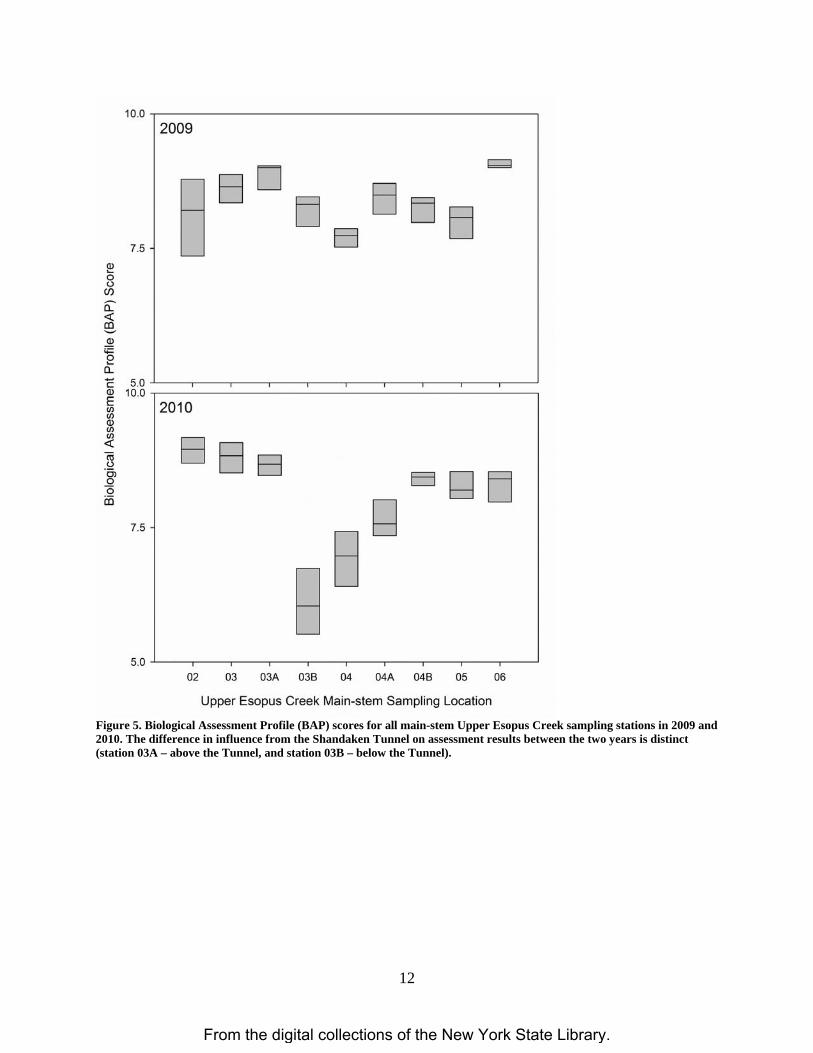
Results and Discussion In the Upper Esopus Creek watershed drainage area classification is a good indicator of change in benthic macroinvertebrate community type. Using non-metric multi-dimensional scaling we found sampling sites fell out along a gradient of drainage area based on Bray Curtis species similarity (Figure 2). Ordination results suggest average taxon similarity of 44% between sites within drainage area classes. Average dissimilarity between drainage classes was 66%. Certain groups of macroinvertebrates contributed more than others to similarity between sites within drainage classes. For example, Ephemeroptera steadily increased in percent contribution to site similarity with increased drainage area and had the greatest contribution among sites with drainage area ≥ 85km2. In contrast, Diptera decreased in percent contribution to site similarity (Figure 3). Future monitoring of biological communities in the Upper Esopus Creek watershed should make comparisons within these drainage classes. This will ensure that biological integrity will be related to the most appropriate baseline condition. The biological assessment of water quality in the Upper Esopus Creek watershed suggested non-impacted conditions. These conditions reflect very good water quality and a macroinvertebrate community indicative of natural conditions with only minimal human impacts (Smith et al., 2012). However, some sites were assessed as slightly impacted, most of which occurred in the largest drainage class (≥85km2), during the summer of 2010 (Figures 4 and 5, Tables 2, 3, and 4). Assessments of slight impact are considered reflective of a macroinvertebrate community altered from natural conditions but indicative of good water quality (Smith et al., 2012). Previous water quality assessments of the Upper Esopus Creek conducted by the NYSDEC SBU since 1995 suggest fluctuations in condition between non- and slight impact (Bode et al., 2005; Bode et al., 1995; Bode et al., 2001; Duffy et al., 2011). Most of the samples collected did not result in biological assessment exceeding expected variance thereby violating thresholds for provisional impairment. However, variance exceedence was suggested consistently and regardless of year at main-stem stations USOP-03B and USOP-04, immediately downstream of the Shandaken Tunnel (Figure 1). These exccedences occurred most frequently due to loss of sensitive EPT taxa (Table 4). Additional occurrences happened at stations USOP-04A and USOP-04B but with less consistency (Table 4). Although the data indicate a distinct impact on biological condition followed by recovery downstream of the Shandaken Tunnel, year to year variation exists in the severity of this impact. The magnitude of difference between upstream and downstream sampling stations is much greater in 2010 than in 2009. The difference is so great that assessment results span multiple impact categories (i.e. non-: BAP score 7.5-10.0 to slight: BAP score 5.0-7.5). This is different from 2009 in which effects from the Shandaken Tunnel were noticeable but assessment results remained well within the non-impacted category (Figure 5).
From the digital collections of the New York State Library.
7
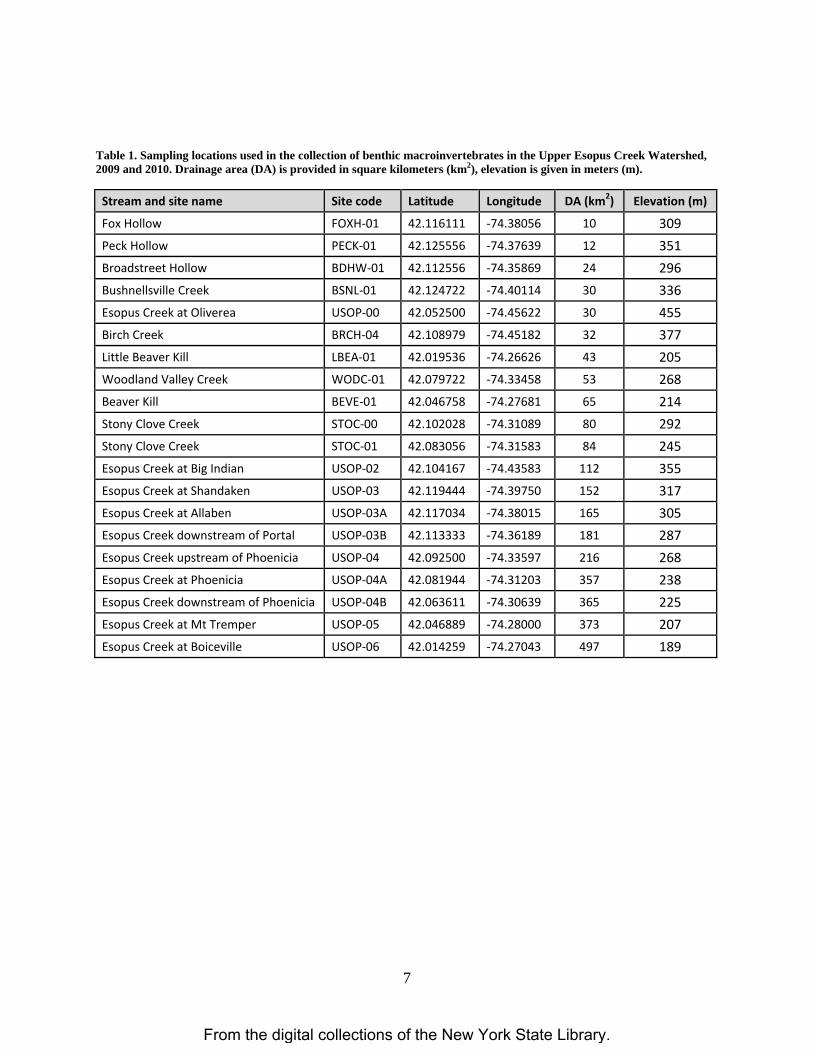
Table 1. Sampling locations used in the collection of benthic macroinvertebrates in the Upper Esopus Creek Watershed, 2009 and 2010. Drainage area (DA) is provided in square kilometers (km2), elevation is given in meters (m).
Stream and site name Site code Latitude Longitude DA (km2) Elevation (m)
Fox Hollow FOXH‐01 42.116111 ‐74.38056 10 309 Peck Hollow PECK‐01 42.125556 ‐74.37639 12 351 Broadstreet Hollow BDHW‐01 42.112556 ‐74.35869 24 296 Bushnellsville Creek BSNL‐01 42.124722 ‐74.40114 30 336 Esopus Creek at Oliverea USOP‐00 42.052500 ‐74.45622 30 455 Birch Creek BRCH‐04 42.108979 ‐74.45182 32 377 Little Beaver Kill LBEA‐01 42.019536 ‐74.26626 43 205 Woodland Valley Creek WODC‐01 42.079722 ‐74.33458 53 268 Beaver Kill BEVE‐01 42.046758 ‐74.27681 65 214 Stony Clove Creek STOC‐00 42.102028 ‐74.31089 80 292 Stony Clove Creek STOC‐01 42.083056 ‐74.31583 84 245 Esopus Creek at Big Indian USOP‐02 42.104167 ‐74.43583 112 355 Esopus Creek at Shandaken USOP‐03 42.119444 ‐74.39750 152 317 Esopus Creek at Allaben USOP‐03A 42.117034 ‐74.38015 165 305 Esopus Creek downstream of Portal USOP‐03B 42.113333 ‐74.36189 181 287 Esopus Creek upstream of Phoenicia USOP‐04 42.092500 ‐74.33597 216 268 Esopus Creek at Phoenicia USOP‐04A 42.081944 ‐74.31203 357 238 Esopus Creek downstream of Phoenicia USOP‐04B 42.063611 ‐74.30639 365 225 Esopus Creek at Mt Tremper USOP‐05 42.046889 ‐74.28000 373 207 Esopus Creek at Boiceville USOP‐06 42.014259 ‐74.27043 497 189
From the digital collections of the New York State Library.
8
Figure 2. Non-metric multi-dimensional scaling plot of sampling locations in the Upper Esopus Creek watershed. The ordination is based on Bray Curtis similarity using Log x+1 transformed benthic macroinvertebrate species information.
Figure 3. Percent contribution of dominant macroinvertebrate groups to sampling site similarity among drainage area size classes. Certain groups such as Ephemeroptera showed increasing contribution to site similarity as drainage area increased. Others such as the Trichoptera or Diptera suggest the opposite.
≤ 40 km2
≥ 85 km2
50
a. ::, e 45 -
(2) 40
-~ -
E 0 35 C
-0 X -
~ 30
0 25 C .Q :i 20 ..Cl
-·;:: c 15 0 ()
c 10 Q) u '-Q) a.. 5
0
~
-
L 111117
. ' •
-
2D Stress: 0.22
- <=40 c:J 41 -84 - >=85
-
From the digital collections of the New York State Library.
9
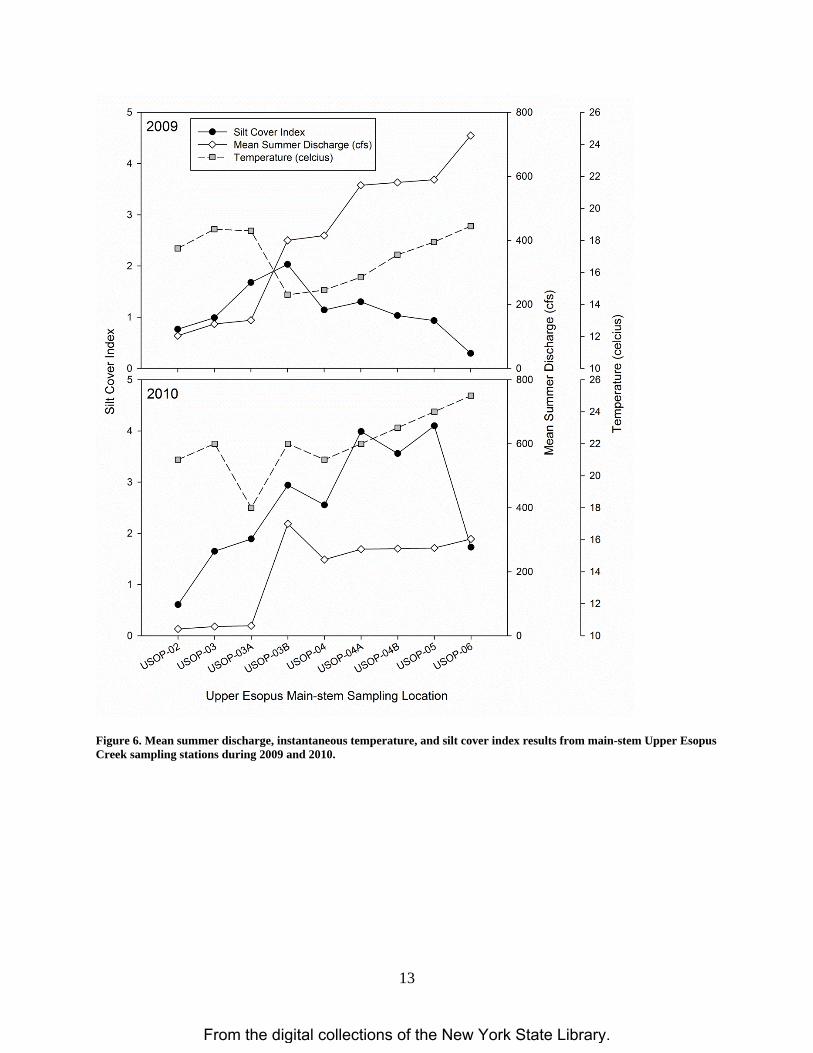
Year to year variability in stream discharge, temperature, and siltation explain some of the variability in impact from the Shandaken Tunnel on biological integrity. Both stream discharge and temperature show abrupt differences between sampling stations immediately upstream and downstream of the Shandaken Tunnel (Figure 6). These physicochemical changes are reflected in similar changes in the biological assessment data at these same sites (Figure 5). Therefore, we can infer the variability in biological impact is coupled with the annual percent contribution of flow from the Shandaken Tunnel to the Upper Esopus Creek. Subsequently, temperature and siltation reflect the yearly variability in discharge with colder, less variable temperature, and minimal siltation of substrates in normal flow years (2009). The opposite is true in lower flow years (2010). Continuous discharge data show mean summer discharge in 2009 was approximately 150 cfs at USOP-03A, upstream of the confluence with the Shandaken Tunnel. After the confluence, discharge more than doubled to 400 cfs at USOP-03B. Moving downstream, discharge continues to increase as additional tributaries enter the stream (Figure 6). During the low flow year of 2010 we see the influence of the Shandaken Tunnel is even more significant, with flow increasing from 31cfs upstream at USOP-03A to 350 cfs downstream at USOP-03B, approximately eleven times the upstream discharge (Figure 6). Unlike 2009, discharge remains nearly constant in 2010 downstream of the Shandaken Tunnel. Less water was contributed by tributaries during the summer months of that year. Variability in discharge such as this has been shown to negatively influence macroinvertebrate communities in other systems. For example, regulated peak discharge downstream of a large reservoir significantly reduced invertebrate densities and caused compositional shifts in the community (Robinson et al., 2003).
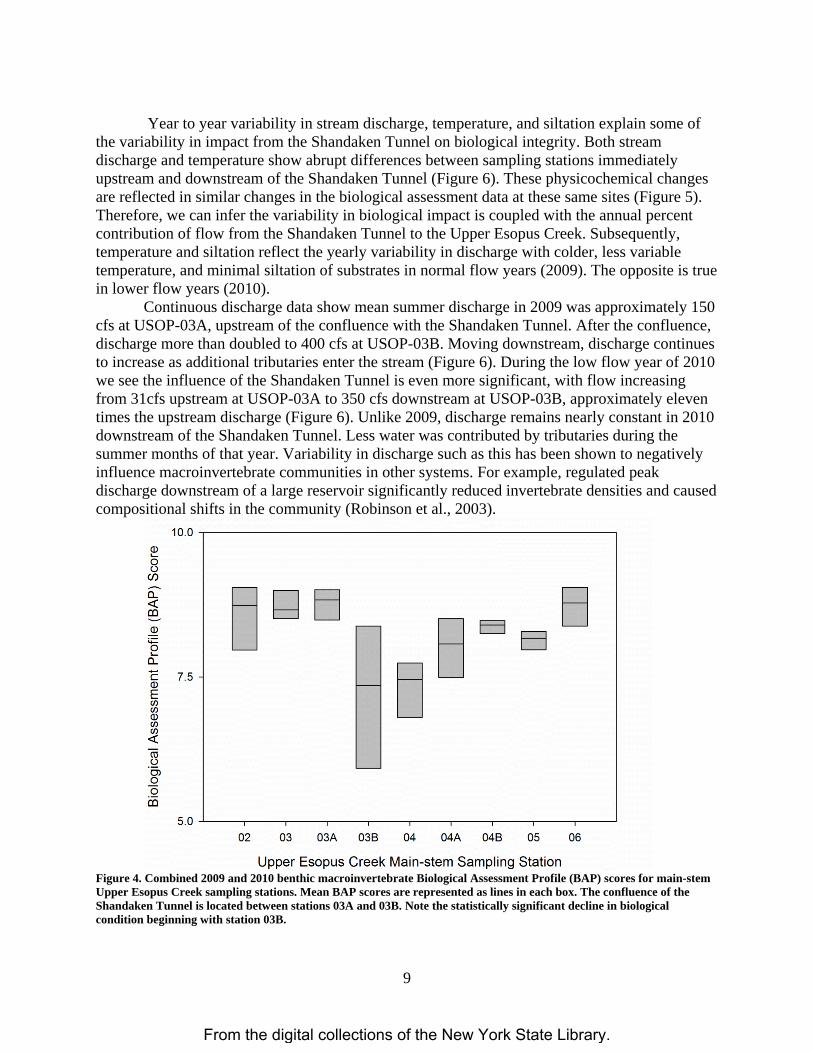
Figure 4. Combined 2009 and 2010 benthic macroinvertebrate Biological Assessment Profile (BAP) scores for main-stem Upper Esopus Creek sampling stations. Mean BAP scores are represented as lines in each box. The confluence of the Shandaken Tunnel is located between stations 03A and 03B. Note the statistically significant decline in biological condition beginning with station 03B.
10.0 Q) ,._ 0 (.)
CJ)
a..
D GJ • • <( cc
-
D E:l ~ B .;:::: 0 ,._ a..
LJ c 7.5 Q) -E Cl) Cl) Q) Cl) Cl) <(
cii (.) -Ol 0 0 cc
5.0
02 03 03A 03B 04 04A 04B 05 06
Upper Esopus Creek Main-stem Sampling Station
From the digital collections of the New York State Library.
10
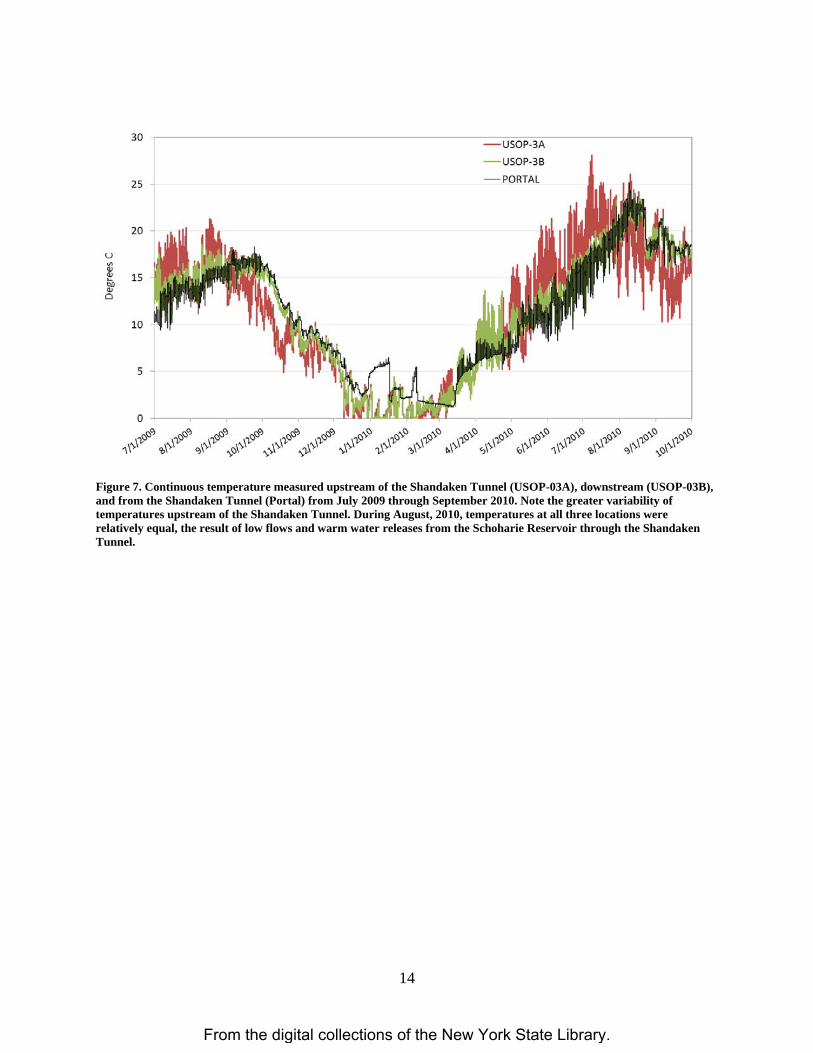
The difference in flow between years affected temperature regimes and the amount of silt settling on bottom substrates. During 2009 when annual discharge was higher, in-situ temperature measurements at each sampling location were cooler than 2010 temperatures. Both years the same trend is noticeable where temperatures increase continually downstream of the Shandaken Tunnel. However, in 2009 there was a notable decrease in temperature from immediately upstream to immediately downstream of the confluence with the Shandaken Tunnel. Conversely, in 2010 temperatures remained the same or increase slightly from upstream (Figure 6). Continuous temperature data from station immediately upstream (USOP-03A) and downstream of the portal (USOP-03B) shows the difference in temperature regimes across the two years of study (Figure 7). Temperature was consistently warmer upstream of the Shandaken Tunnel and differences were less between the two sampling locations during the normal flow year of 2009. In 2010 temperatures peaked much higher than in 2009, were more variable, and differences between stations were greater (figure 7). Therefore, temperatures in the Upper Esopus Creek downstream of the confluence of the Shandaken Tunnel generally reflect water temperatures from the Schoharie Reservoir. In normal flow years such as 2009 the Shandaken Tunnel has a cooling affect on water temperatures in the Upper Esopus (figure 7) from its deep water reservoir release. Rarely during the growing season when temperatures reach their highest, do temperatures in the Shandaken Tunnel match those from upstream of the confluence. However, in August 2010 when water levels were down throughout the watershed, temperatures in the Shandaken Tunnel and downstream of the tunnel (USOP-03B) were similar to temperatures upstream (USOP-03A). The degree of siltation to bottom substrates in the Upper Esopus Creek corresponds with discharge and likely plays a role in limiting benthic macroinvertebrate community development. Higher flows in 2009 may have prevented silt from the Shandaken Tunnel and tributaries like Stoney Clove creek from settling onto bottom substrates. During low flows (2010) data suggest siltation increases continually moving downstream, including downstream of the Shandaken Tunnel (Figure 6). The suspension of sediment such as that noted in higher flow years can cause disturbance to the macroinvertebrate community, greatly increasing macroinvertebrate drift in the water column (Brooker and Hemsworth, 1978) and reducing overall invertebrate density (Gray and Ward, 1982). However, settling of this suspended material, which is observed during lower flow years, can be even more detrimental to biological condition. For instance, sedimentation has been linked to negative effects on benthic macroinvertebrates through reduction in food availability and habitat, reducing rates of growth and reproduction (Henley et al., 2000). The results of our investigation suggest the difference in biological condition between reaches upstream and downstream of the Shandaken Tunnel is influenced by yearly flow conditions. When mean summer discharge is approximately 200cfs or higher upstream of the Shandaken Tunnel, biological integrity will be maintained. When upstream mean summer discharge is lower than 200cfs and the Shandaken Tunnel is more than 3 times the upstream discharge, the biological condition may become more impacted. The primary drivers of this impairment appear to be compounding effects of low flow, warm temperatures, and the deposition of silt. The relative influence from the Shandaken Tunnel during normal flow years provides enough discharge to maintain cooler temperatures and prevent siltation of bottom habitat.
From the digital collections of the New York State Library.

11
These findings should provide unique assistance to water and wildlife resource managers working in the Upper Esopus Creek watershed. From this study we now have reliable information on the extent and severity of effects from the Shandaken Tunnel. Additionally, we have an understanding that, of the possible sources of impact to biological communities (Birch Creek, Village of Phoenicia, or Shandaken Tunnel), the tunnel appears to have the most significant effect. Furthermore, the relationship between discharge, temperature, siltation, and biological condition provides a management endpoint with several variables to control. Using the results of this study, improved management of Shandaken Tunnel releases can minimize stress on biological communities.
From the digital collections of the New York State Library.
12
Figure 5. Biological Assessment Profile (BAP) scores for all main-stem Upper Esopus Creek sampling stations in 2009 and 2010. The difference in influence from the Shandaken Tunnel on assessment results between the two years is distinct (station 03A – above the Tunnel, and station 03B – below the Tunnel).
10.0
2009
• ~
D B
LJ El O El 0 7.5
~ 0 (.)
(/)
EL <(
fE, ~ ;;:; 0 ,_ a.. c 5.0 (l) 10.0 E 2010 !/l !/l (l) !/l !/l
8 Ba <(
ro .2 0)
B Q • 0 0 in Bg 7.5
D 5.0
02 03 03A 03B 04 04A 04B 05 06
Upper Esopus Creek Main-stem Sampling Location
From the digital collections of the New York State Library.
13
Figure 6. Mean summer discharge, instantaneous temperature, and silt cover index results from main-stem Upper Esopus Creek sampling stations during 2009 and 2010.
----+--- Silt Cover Index -0--- Mean Summer Discharge (cfs)
4 - -o- Temperature (celcius)
600
3
400
2
200 ~ Q)
X ~ Q) C1l ~ ~ C (.)
rJ)
<ii o~-~--~--~-~--~--~-~--~--~-~ o i5 ~ 5 800 aj u 2010 E ...., _... .o E 0 ~ --- ~
--- --- U) 4
3
2
_... _.q I• , , _.,,,,, D' _... \ I 'u -
\ I \ I \ I
\ I ti
_... ,tr ffi 600 OJ
::2E
400
200
o~-~--~--~-~--~--~---------~ o
Upper Esopus Main-stem Sampling Location
26
24
22
20
18
16
14
ui' ~
12 ·c:; ai _s,
10 ~ 26 ~ ro
Q) a.
24 E Q)
1-22
20
18
16
14
12
10
From the digital collections of the New York State Library.
14
Figure 7. Continuous temperature measured upstream of the Shandaken Tunnel (USOP-03A), downstream (USOP-03B), and from the Shandaken Tunnel (Portal) from July 2009 through September 2010. Note the greater variability of temperatures upstream of the Shandaken Tunnel. During August, 2010, temperatures at all three locations were relatively equal, the result of low flows and warm water releases from the Schoharie Reservoir through the Shandaken Tunnel.
30 - USOP-3A
- USOP-3B
u :G ., ~ 0
From the digital collections of the New York State Library.
15
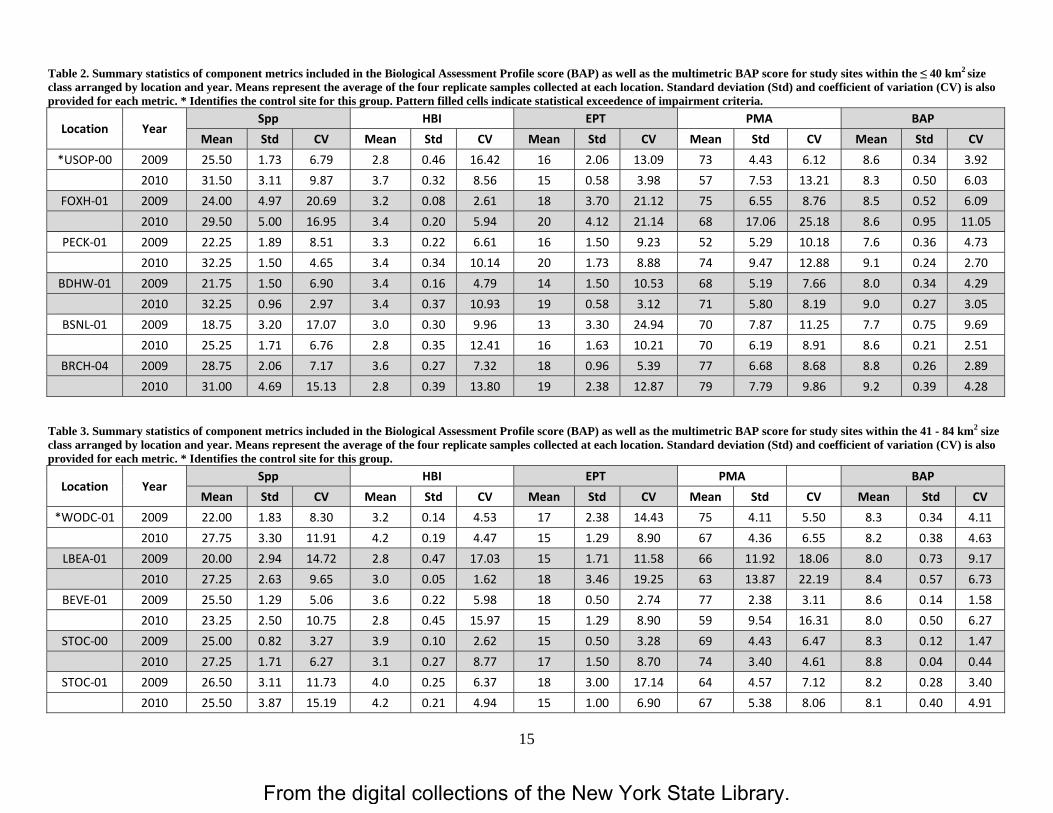
Table 2. Summary statistics of component metrics included in the Biological Assessment Profile score (BAP) as well as the multimetric BAP score for study sites within the ≤ 40 km2 size class arranged by location and year. Means represent the average of the four replicate samples collected at each location. Standard deviation (Std) and coefficient of variation (CV) is also provided for each metric. * Identifies the control site for this group. Pattern filled cells indicate statistical exceedence of impairment criteria.
Location Year Spp HBI EPT PMA BAP
Mean Std CV Mean Std CV Mean Std CV Mean Std CV Mean Std CV
*USOP‐00 2009 25.50 1.73 6.79 2.8 0.46 16.42 16 2.06 13.09 73 4.43 6.12 8.6 0.34 3.92
2010 31.50 3.11 9.87 3.7 0.32 8.56 15 0.58 3.98 57 7.53 13.21 8.3 0.50 6.03
FOXH‐01 2009 24.00 4.97 20.69 3.2 0.08 2.61 18 3.70 21.12 75 6.55 8.76 8.5 0.52 6.09
2010 29.50 5.00 16.95 3.4 0.20 5.94 20 4.12 21.14 68 17.06 25.18 8.6 0.95 11.05
PECK‐01 2009 22.25 1.89 8.51 3.3 0.22 6.61 16 1.50 9.23 52 5.29 10.18 7.6 0.36 4.73
2010 32.25 1.50 4.65 3.4 0.34 10.14 20 1.73 8.88 74 9.47 12.88 9.1 0.24 2.70
BDHW‐01 2009 21.75 1.50 6.90 3.4 0.16 4.79 14 1.50 10.53 68 5.19 7.66 8.0 0.34 4.29
2010 32.25 0.96 2.97 3.4 0.37 10.93 19 0.58 3.12 71 5.80 8.19 9.0 0.27 3.05
BSNL‐01 2009 18.75 3.20 17.07 3.0 0.30 9.96 13 3.30 24.94 70 7.87 11.25 7.7 0.75 9.69
2010 25.25 1.71 6.76 2.8 0.35 12.41 16 1.63 10.21 70 6.19 8.91 8.6 0.21 2.51
BRCH‐04 2009 28.75 2.06 7.17 3.6 0.27 7.32 18 0.96 5.39 77 6.68 8.68 8.8 0.26 2.89
2010 31.00 4.69 15.13 2.8 0.39 13.80 19 2.38 12.87 79 7.79 9.86 9.2 0.39 4.28
Table 3. Summary statistics of component metrics included in the Biological Assessment Profile score (BAP) as well as the multimetric BAP score for study sites within the 41 - 84 km2 size class arranged by location and year. Means represent the average of the four replicate samples collected at each location. Standard deviation (Std) and coefficient of variation (CV) is also provided for each metric. * Identifies the control site for this group.
Location Year Spp HBI EPT PMA BAP
Mean Std CV Mean Std CV Mean Std CV Mean Std CV Mean Std CV
*WODC‐01 2009 22.00 1.83 8.30 3.2 0.14 4.53 17 2.38 14.43 75 4.11 5.50 8.3 0.34 4.11
2010 27.75 3.30 11.91 4.2 0.19 4.47 15 1.29 8.90 67 4.36 6.55 8.2 0.38 4.63
LBEA‐01 2009 20.00 2.94 14.72 2.8 0.47 17.03 15 1.71 11.58 66 11.92 18.06 8.0 0.73 9.17
2010 27.25 2.63 9.65 3.0 0.05 1.62 18 3.46 19.25 63 13.87 22.19 8.4 0.57 6.73
BEVE‐01 2009 25.50 1.29 5.06 3.6 0.22 5.98 18 0.50 2.74 77 2.38 3.11 8.6 0.14 1.58
2010 23.25 2.50 10.75 2.8 0.45 15.97 15 1.29 8.90 59 9.54 16.31 8.0 0.50 6.27
STOC‐00 2009 25.00 0.82 3.27 3.9 0.10 2.62 15 0.50 3.28 69 4.43 6.47 8.3 0.12 1.47
2010 27.25 1.71 6.27 3.1 0.27 8.77 17 1.50 8.70 74 3.40 4.61 8.8 0.04 0.44
STOC‐01 2009 26.50 3.11 11.73 4.0 0.25 6.37 18 3.00 17.14 64 4.57 7.12 8.2 0.28 3.40
2010 25.50 3.87 15.19 4.2 0.21 4.94 15 1.00 6.90 67 5.38 8.06 8.1 0.40 4.91
From the digital collections of the New York State Library.
16
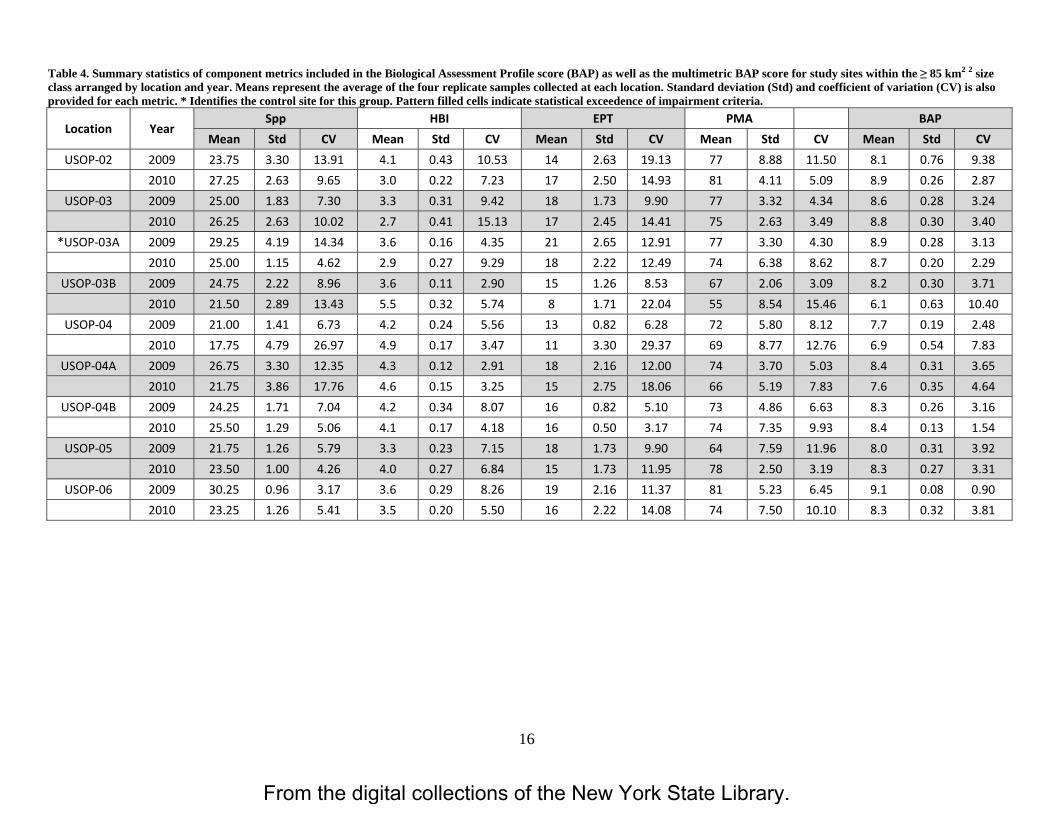
Table 4. Summary statistics of component metrics included in the Biological Assessment Profile score (BAP) as well as the multimetric BAP score for study sites within the ≥ 85 km2 2 size class arranged by location and year. Means represent the average of the four replicate samples collected at each location. Standard deviation (Std) and coefficient of variation (CV) is also provided for each metric. * Identifies the control site for this group. Pattern filled cells indicate statistical exceedence of impairment criteria.
Location Year Spp HBI EPT PMA BAP
Mean Std CV Mean Std CV Mean Std CV Mean Std CV Mean Std CV
USOP‐02 2009 23.75 3.30 13.91 4.1 0.43 10.53 14 2.63 19.13 77 8.88 11.50 8.1 0.76 9.38
2010 27.25 2.63 9.65 3.0 0.22 7.23 17 2.50 14.93 81 4.11 5.09 8.9 0.26 2.87
USOP‐03 2009 25.00 1.83 7.30 3.3 0.31 9.42 18 1.73 9.90 77 3.32 4.34 8.6 0.28 3.24
2010 26.25 2.63 10.02 2.7 0.41 15.13 17 2.45 14.41 75 2.63 3.49 8.8 0.30 3.40
*USOP‐03A 2009 29.25 4.19 14.34 3.6 0.16 4.35 21 2.65 12.91 77 3.30 4.30 8.9 0.28 3.13
2010 25.00 1.15 4.62 2.9 0.27 9.29 18 2.22 12.49 74 6.38 8.62 8.7 0.20 2.29
USOP‐03B 2009 24.75 2.22 8.96 3.6 0.11 2.90 15 1.26 8.53 67 2.06 3.09 8.2 0.30 3.71
2010 21.50 2.89 13.43 5.5 0.32 5.74 8 1.71 22.04 55 8.54 15.46 6.1 0.63 10.40
USOP‐04 2009 21.00 1.41 6.73 4.2 0.24 5.56 13 0.82 6.28 72 5.80 8.12 7.7 0.19 2.48
2010 17.75 4.79 26.97 4.9 0.17 3.47 11 3.30 29.37 69 8.77 12.76 6.9 0.54 7.83
USOP‐04A 2009 26.75 3.30 12.35 4.3 0.12 2.91 18 2.16 12.00 74 3.70 5.03 8.4 0.31 3.65
2010 21.75 3.86 17.76 4.6 0.15 3.25 15 2.75 18.06 66 5.19 7.83 7.6 0.35 4.64
USOP‐04B 2009 24.25 1.71 7.04 4.2 0.34 8.07 16 0.82 5.10 73 4.86 6.63 8.3 0.26 3.16
2010 25.50 1.29 5.06 4.1 0.17 4.18 16 0.50 3.17 74 7.35 9.93 8.4 0.13 1.54
USOP‐05 2009 21.75 1.26 5.79 3.3 0.23 7.15 18 1.73 9.90 64 7.59 11.96 8.0 0.31 3.92
2010 23.50 1.00 4.26 4.0 0.27 6.84 15 1.73 11.95 78 2.50 3.19 8.3 0.27 3.31
USOP‐06 2009 30.25 0.96 3.17 3.6 0.29 8.26 19 2.16 11.37 81 5.23 6.45 9.1 0.08 0.90
2010 23.25 1.26 5.41 3.5 0.20 5.50 16 2.22 14.08 74 7.50 10.10 8.3 0.32 3.81
From the digital collections of the New York State Library.

17
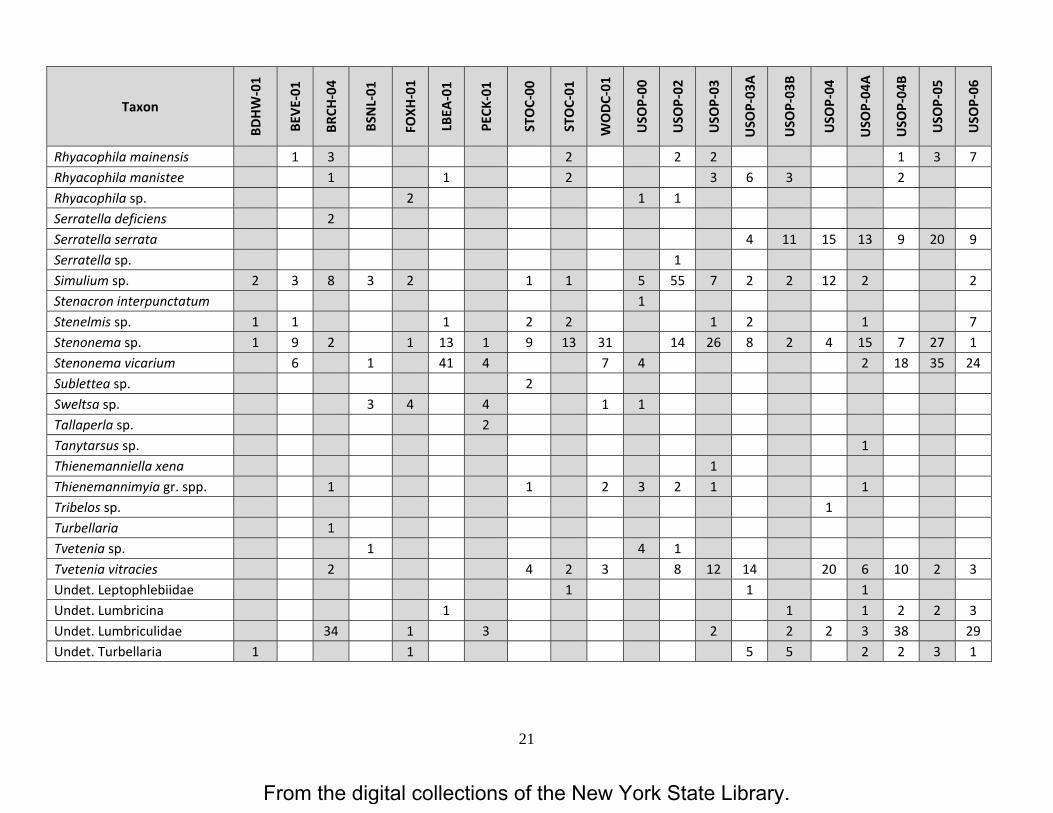
Table 5. Macroinvertebrate taxa collected from the Upper Esopus Creek watershed during the 2009 sampling season.
Taxon
BDHW‐01
BEVE‐01
BRCH
‐04
BSNL‐01
FOXH
‐01
LBEA
‐01
PECK
‐01
STOC‐00
STOC‐01
WODC‐01
USO
P‐00
USO
P‐02
USO
P‐03
USO
P‐03
A
USO
P‐03
B
USO
P‐04
USO
P‐04
A
USO
P‐04
B
USO
P‐05
USO
P‐06
Acentrella turbida 15 69 17 25 20 20 30 33 32 14 38 36 48 101 51 43 40 28 14 Acroneuria abnormis 6 3 1 15 16 6 4 2 1 1 1 1 1 4Acroneuria carolinensis 4 2 1Acroneuria sp. 1 1 1 1 2 2Agapetus sp. 1Agnetina capitata 13 9 8 2 1 23 14 27 1 4 1 9 9 3 2 2Antocha sp. 1 4 2 1 1 1 1 1 1 2 1 1 5Apatania sp. 4 49 6 3 1 2 3 2 3Atherix sp. 1 4 Baetis flavistriga 13 2 14 7 18 3 3 12 9 9 25 20 4 9 1 9 7 5 15Baetis intercalaris 21 20 1 5 2 1 4 16 40 Baetis tricaudatus 12 26 48 16 21 1 34 6 6 33 48 19 26 37 21 25 9 1 9Blepharicera sp. 1 Brachycentrus americanus 4 19 45 4 1Brachycentrus appalachia 1 40 2 1Caenis sp. 1 1Cambarus sp. 1 1 1Cardiocladius obscurus 1 1 1 2 1 1 1 1 2 1 3Chaetocladius sp. 1Cheumatopsyche sp. 14 10 1 2 27 14 25 5 16 6 13 2 3 5 1 1 6 7 5 11 Chimarra aterrima? 5 Undet. Chloroperlidae 1 1 3 Corydalus cornutus 2Cricotopus bicinctus 1 8Cricotopus sp. 1 3 5 3 2Demicryptochironomus sp. 1
From the digital collections of the New York State Library.

18
Taxon
BDHW‐01
BEVE‐01
BRCH
‐04
BSNL‐01
FOXH
‐01
LBEA
‐01
PECK
‐01
STOC‐00
STOC‐01
WODC‐01
USO
P‐00
USO
P‐02
USO
P‐03
USO
P‐03
A
USO
P‐03
B
USO
P‐04
USO
P‐04
A
USO
P‐04
B
USO
P‐05
USO
P‐06
Diamesa sp. 2 1 2 1 1 1Dicranota sp. 11 6 1 1Diphetor hageni 2 1 1 1Diplectrona sp. 2 1 Dolophilodes sp. 10 15 13 16 19 10 26 2 19 8 2 35 15 2 18 7 8 2 19 Drunella cornutella 12 40 22 2 1 1 42 5 4 3 1Undet. Empididae 1 1 1Undet. Enchytraeidae 1 Epeorus sp. 3 17 1 39 2 2 1 1 1 6 1 1 4 8Ephemera sp. 2 Ephemerella sp. 17 2 11 1 5 10 11 13 7 20 26 38 92 28 25 12 15 1Eukiefferiella brevicalcar gr. 1 2 Eukiefferiella claripennis gr. 1 Eukiefferiella devonica gr. 2 2 1 1 1 1 3Eukiefferiella pseudomontana gr. 1
1 3 1 1 3 1
Eukiefferiella sp. 1 1 2 Eurylophella funeralis 1 Glossosoma sp. 7 4 1 6 2 3 1 2Undet. Gomphidae 1 1Heptagenia sp. 17 34 37 13 1 1 23 13 2 9 6 8 3 9 3 14 2Hexatoma sp. 11 9 12 16 14 1 12 8 8 8 7 2 3Hydropsyche bronta 4 1 13 25 10 2 14 11 13 10 23 12 10 2Hydropsyche morosa 12 21 1 15 31 2 14 2 23 22 24 45 33 41 20 Hydropsyche slossonae 21 18 11 2 19 3 27 16 12 9 11 4 2 7 9 2 8 1Hydropsyche sp. 2 1Hydropsyche sparna 17 22 17 4 10 17 23 11 12 10 1 8 9 11 5 21 6 10 2 4Isogenoides sp. 6 10 1 1 1 4 7 14 5 9 4 1 1 2 2 1
From the digital collections of the New York State Library.

19
Taxon
BDHW‐01
BEVE‐01
BRCH
‐04
BSNL‐01
FOXH
‐01
LBEA
‐01
PECK
‐01
STOC‐00
STOC‐01
WODC‐01
USO
P‐00
USO
P‐02
USO
P‐03
USO
P‐03
A
USO
P‐03
B
USO
P‐04
USO
P‐04
A
USO
P‐04
B
USO
P‐05
USO
P‐06
Isonychia sp. 8 8 6 8 19 13 44 4 33 24 15 2 10 20 58 47 Lepidostoma sp. 1 1 1 5 1 2 1 5 2 2 1 3 2 29 7Leucrocuta sp. 1 1 6 9 1 1 1 7 1 4 1 9 5Leuctra sp. 5 4 13 8 1 1 1Limonia sp. 1 Macronychus glabratus 1 Malirekus iroquois 1 1 2 1Micropsectra dives gr. 140 30 46 126 83 160 103 62 117 58 56 80 42 5 39 22 29 11 1Micropsectra polita 2Microtendipes pedellus gr. 1 2 1 1 1 1Microtendipes rydalensis gr. 5 1 2 1 3 3 3 2 4Microtendipes sp. 1 Neophylax sp. 2 1 1 Neoplasta sp. 1Nigronia serricornis 9 1 4 Ophiogomphus sp. 1 Optioservus ovalis 13 8 1 9 2 1 1 2 2Optioservus sp. 4 2 1 1 1 2 2 5Optioservus trivittatus 3 1Orthocladius (Symposiocladius) lignicola
1
Orthocladius dubitatus 1 1 2Orthocladius sp. 1 10 1 2 7 4 4 3 3 2 1 1Oulimnius latiusculus 1 2 1 Pagastia orthogonia 1 1 1 1 1 1 3 1Parachaetocladius sp. 1 1 1 1 1Paragnetina immarginata 18 16 1 27 5 25 13 9 3 7 1 1 2 6 4 17 Paragnetina media 4 6
From the digital collections of the New York State Library.

20
Taxon
BDHW‐01
BEVE‐01
BRCH
‐04
BSNL‐01
FOXH
‐01
LBEA
‐01
PECK
‐01
STOC‐00
STOC‐01
WODC‐01
USO
P‐00
USO
P‐02
USO
P‐03
USO
P‐03
A
USO
P‐03
B
USO
P‐04
USO
P‐04
A
USO
P‐04
B
USO
P‐05
USO
P‐06
Paragnetina sp. 1 Parakiefferiella sp. 1 Paraleptophlebia sp. 1 4 9 3 1 3 3 5 2 1 2 1 4Parametriocnemus sp. 1 1 1 2 1 1 1Undet. Perlodidae 3 2Physella sp. 1Pisidium sp. 1 Plauditus sp. 6 1 7 1 9 1 2 6 5 19 15 7 9 6Polycentropus sp. 1 Polypedilum (Tripodura) sp. 8Polypedilum aviceps 5 35 2 4 16 34 1 6 14 2 3 10 2 9 22 25 29 2 15 Polypedilum flavum 12 16 35 7 17 18 9 55 34 53 20 38 Polypedilum tritum 1 1 Potthastia gaedii gr. 2 1 1Potthastia longimana gr. 3Procladius sp. 1Promoresia tardella 2 3 Prostoma graecense 1 2 1Psephenus herricki 22 5 13 1 6 1 2 5Psilotreta sp. 2 2 14 3 2 2Pteronarcys biloba 4 7 3 1 1 1 1Pteronarcys proteus 1 Pteronarcys sp. 1 3 2 3 2 1Rheocricotopus robacki 1 1 1 1 1Rheocricotopus sp. 1 1 Rheotanytarsus sp. 2 1 1 2 19 1 2Rhyacophila carolina? 3 Rhyacophila fuscula 2 14 2 1 1 1
From the digital collections of the New York State Library.
21
Taxon
BDHW‐01
BEVE‐01
BRCH
‐04
BSNL‐01
FOXH
‐01
LBEA
‐01
PECK
‐01
STOC‐00
STOC‐01
WODC‐01
USO
P‐00
USO
P‐02
USO
P‐03
USO
P‐03
A
USO
P‐03
B
USO
P‐04
USO
P‐04
A
USO
P‐04
B
USO
P‐05
USO
P‐06
Rhyacophila mainensis 1 3 2 2 2 1 3 7Rhyacophila manistee 1 1 2 3 6 3 2Rhyacophila sp. 2 1 1Serratella deficiens 2 Serratella serrata 4 11 15 13 9 20 9Serratella sp. 1Simulium sp. 2 3 8 3 2 1 1 5 55 7 2 2 12 2 2Stenacron interpunctatum 1 Stenelmis sp. 1 1 1 2 2 1 2 1 7Stenonema sp. 1 9 2 1 13 1 9 13 31 14 26 8 2 4 15 7 27 1Stenonema vicarium 6 1 41 4 7 4 2 18 35 24 Sublettea sp. 2 Sweltsa sp. 3 4 4 1 1 Tallaperla sp. 2 Tanytarsus sp. 1Thienemanniella xena 1Thienemannimyia gr. spp. 1 1 2 3 2 1 1Tribelos sp. 1Turbellaria 1 Tvetenia sp. 1 4 1Tvetenia vitracies 2 4 2 3 8 12 14 20 6 10 2 3Undet. Leptophlebiidae 1 1 1Undet. Lumbricina 1 1 1 2 2 3Undet. Lumbriculidae 34 1 3 2 2 2 3 38 29 Undet. Turbellaria 1 1 5 5 2 2 3 1
From the digital collections of the New York State Library.
22
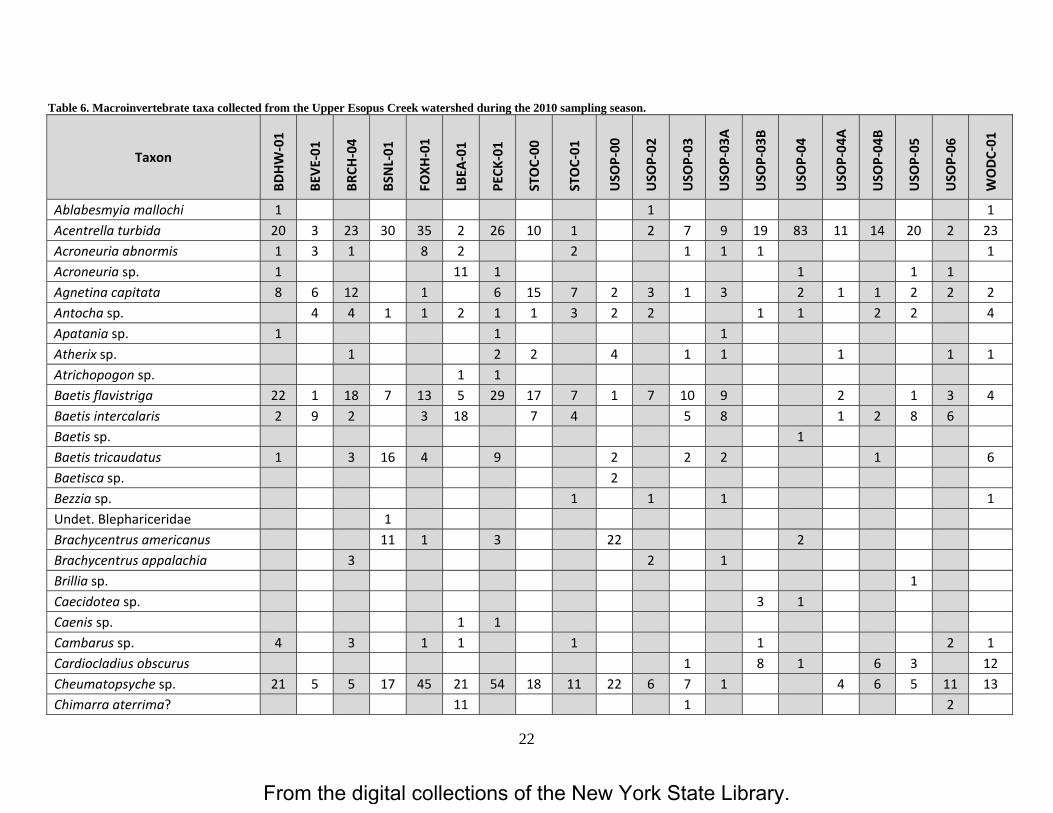
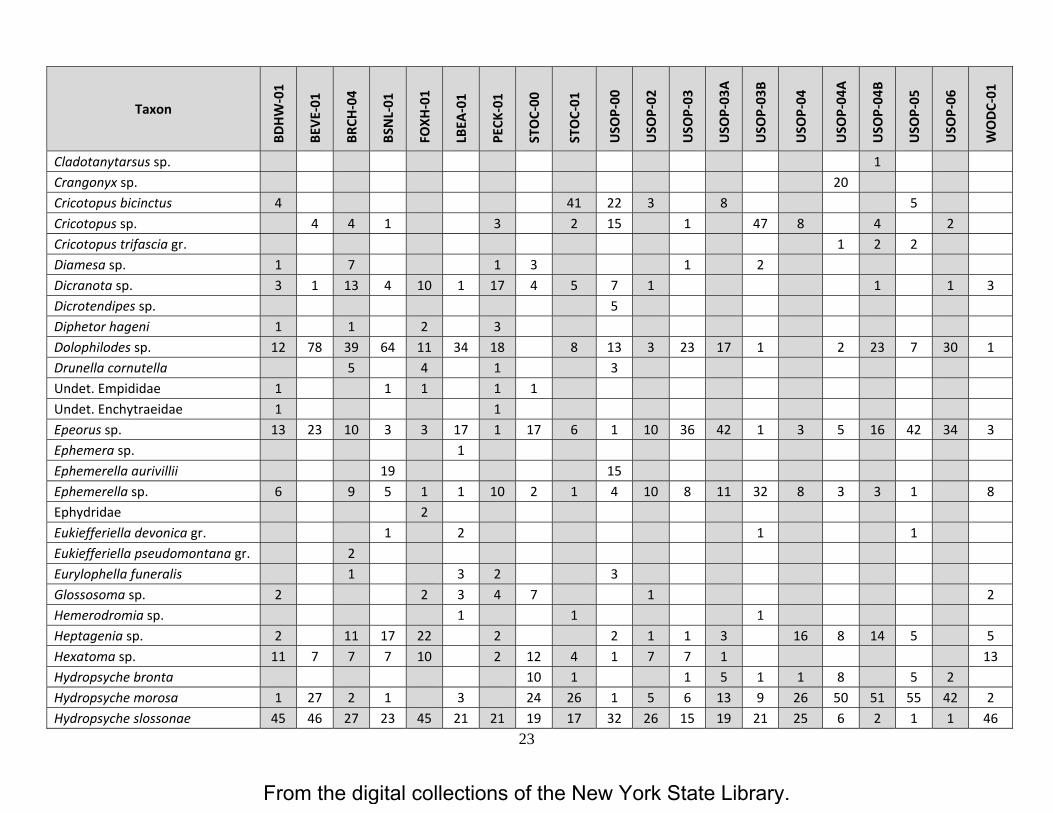
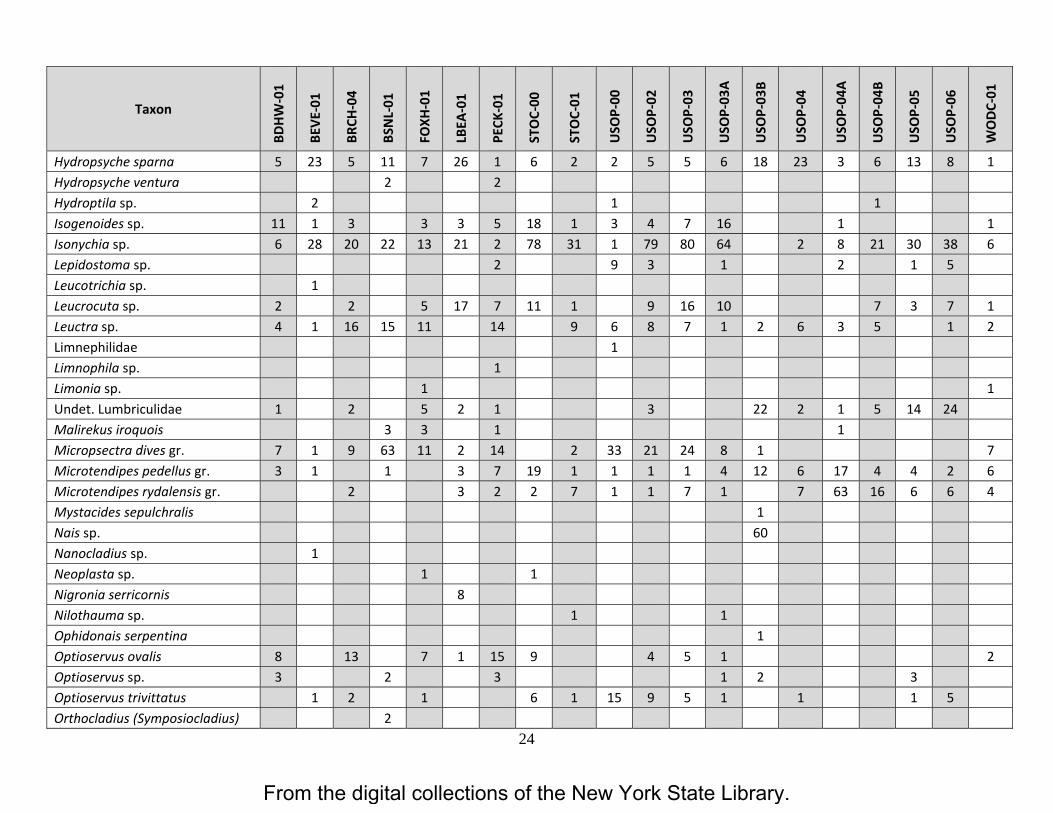
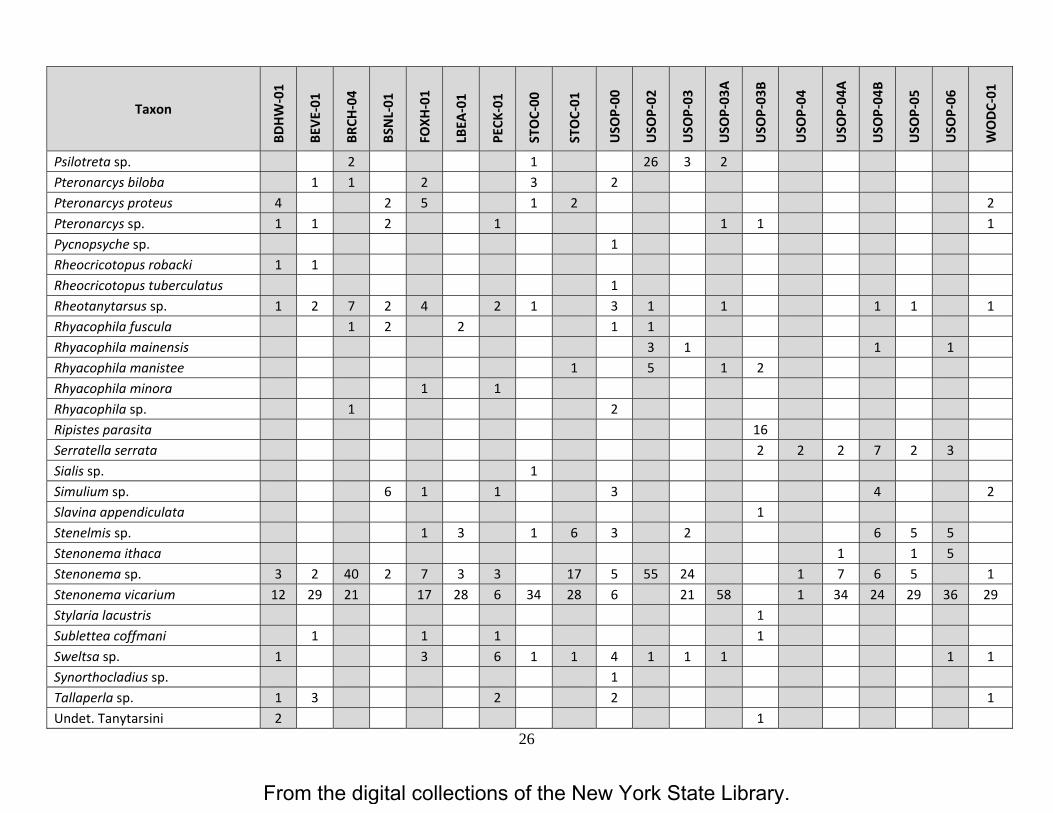
Table 6. Macroinvertebrate taxa collected from the Upper Esopus Creek watershed during the 2010 sampling season.
Taxon
BDHW‐01
BEVE‐01
BRCH
‐04
BSNL‐01
FOXH
‐01
LBEA
‐01
PECK
‐01
STOC‐00
STOC‐01
USO
P‐00
USO
P‐02
USO
P‐03
USO
P‐03
A
USO
P‐03
B
USO
P‐04
USO
P‐04
A
USO
P‐04
B
USO
P‐05
USO
P‐06
WODC‐01
Ablabesmyia mallochi 1 1 1 Acentrella turbida 20 3 23 30 35 2 26 10 1 2 7 9 19 83 11 14 20 2 23 Acroneuria abnormis 1 3 1 8 2 2 1 1 1 1 Acroneuria sp. 1 11 1 1 1 1Agnetina capitata 8 6 12 1 6 15 7 2 3 1 3 2 1 1 2 2 2 Antocha sp. 4 4 1 1 2 1 1 3 2 2 1 1 2 2 4 Apatania sp. 1 1 1Atherix sp. 1 2 2 4 1 1 1 1 1 Atrichopogon sp. 1 1Baetis flavistriga 22 1 18 7 13 5 29 17 7 1 7 10 9 2 1 3 4 Baetis intercalaris 2 9 2 3 18 7 4 5 8 1 2 8 6Baetis sp. 1Baetis tricaudatus 1 3 16 4 9 2 2 2 1 6 Baetisca sp. 2 Bezzia sp. 1 1 1 1 Undet. Blephariceridae 1Brachycentrus americanus 11 1 3 22 2Brachycentrus appalachia 3 2 1Brillia sp. 1Caecidotea sp. 3 1Caenis sp. 1 1Cambarus sp. 4 3 1 1 1 1 2 1 Cardiocladius obscurus 1 8 1 6 3 12 Cheumatopsyche sp. 21 5 5 17 45 21 54 18 11 22 6 7 1 4 6 5 11 13 Chimarra aterrima? 11 1 2
From the digital collections of the New York State Library.
23
Taxon
BDHW‐01
BEVE‐01
BRCH
‐04
BSNL‐01
FOXH
‐01
LBEA
‐01
PECK
‐01
STOC‐00
STOC‐01
USO
P‐00
USO
P‐02
USO
P‐03
USO
P‐03
A
USO
P‐03
B
USO
P‐04
USO
P‐04
A
USO
P‐04
B
USO
P‐05
USO
P‐06
WODC‐01
Cladotanytarsus sp. 1Crangonyx sp. 20Cricotopus bicinctus 4 41 22 3 8 5Cricotopus sp. 4 4 1 3 2 15 1 47 8 4 2Cricotopus trifascia gr. 1 2 2Diamesa sp. 1 7 1 3 1 2Dicranota sp. 3 1 13 4 10 1 17 4 5 7 1 1 1 3 Dicrotendipes sp. 5 Diphetor hageni 1 1 2 3Dolophilodes sp. 12 78 39 64 11 34 18 8 13 3 23 17 1 2 23 7 30 1 Drunella cornutella 5 4 1 3 Undet. Empididae 1 1 1 1 1Undet. Enchytraeidae 1 1Epeorus sp. 13 23 10 3 3 17 1 17 6 1 10 36 42 1 3 5 16 42 34 3 Ephemera sp. 1Ephemerella aurivillii 19 15 Ephemerella sp. 6 9 5 1 1 10 2 1 4 10 8 11 32 8 3 3 1 8 Ephydridae 2Eukiefferiella devonica gr. 1 2 1 1Eukiefferiella pseudomontana gr. 2Eurylophella funeralis 1 3 2 3 Glossosoma sp. 2 2 3 4 7 1 2 Hemerodromia sp. 1 1 1Heptagenia sp. 2 11 17 22 2 2 1 1 3 16 8 14 5 5 Hexatoma sp. 11 7 7 7 10 2 12 4 1 7 7 1 13 Hydropsyche bronta 10 1 1 5 1 1 8 5 2Hydropsyche morosa 1 27 2 1 3 24 26 1 5 6 13 9 26 50 51 55 42 2 Hydropsyche slossonae 45 46 27 23 45 21 21 19 17 32 26 15 19 21 25 6 2 1 1 46
From the digital collections of the New York State Library.
24
Taxon
BDHW‐01
BEVE‐01
BRCH
‐04
BSNL‐01
FOXH
‐01
LBEA
‐01
PECK
‐01
STOC‐00
STOC‐01
USO
P‐00
USO
P‐02
USO
P‐03
USO
P‐03
A
USO
P‐03
B
USO
P‐04
USO
P‐04
A
USO
P‐04
B
USO
P‐05
USO
P‐06
WODC‐01
Hydropsyche sparna 5 23 5 11 7 26 1 6 2 2 5 5 6 18 23 3 6 13 8 1 Hydropsyche ventura 2 2Hydroptila sp. 2 1 1Isogenoides sp. 11 1 3 3 3 5 18 1 3 4 7 16 1 1 Isonychia sp. 6 28 20 22 13 21 2 78 31 1 79 80 64 2 8 21 30 38 6 Lepidostoma sp. 2 9 3 1 2 1 5Leucotrichia sp. 1 Leucrocuta sp. 2 2 5 17 7 11 1 9 16 10 7 3 7 1 Leuctra sp. 4 1 16 15 11 14 9 6 8 7 1 2 6 3 5 1 2 Limnephilidae 1 Limnophila sp. 1Limonia sp. 1 1 Undet. Lumbriculidae 1 2 5 2 1 3 22 2 1 5 14 24Malirekus iroquois 3 3 1 1Micropsectra dives gr. 7 1 9 63 11 2 14 2 33 21 24 8 1 7 Microtendipes pedellus gr. 3 1 1 3 7 19 1 1 1 1 4 12 6 17 4 4 2 6 Microtendipes rydalensis gr. 2 3 2 2 7 1 1 7 1 7 63 16 6 6 4 Mystacides sepulchralis 1Nais sp. 60Nanocladius sp. 1 Neoplasta sp. 1 1Nigronia serricornis 8Nilothauma sp. 1 1Ophidonais serpentina 1Optioservus ovalis 8 13 7 1 15 9 4 5 1 2 Optioservus sp. 3 2 3 1 2 3Optioservus trivittatus 1 2 1 6 1 15 9 5 1 1 1 5Orthocladius (Symposiocladius) 2
From the digital collections of the New York State Library.

25
Taxon
BDHW‐01
BEVE‐01
BRCH
‐04
BSNL‐01
FOXH
‐01
LBEA
‐01
PECK
‐01
STOC‐00
STOC‐01
USO
P‐00
USO
P‐02
USO
P‐03
USO
P‐03
A
USO
P‐03
B
USO
P‐04
USO
P‐04
A
USO
P‐04
B
USO
P‐05
USO
P‐06
WODC‐01
lignicola Orthocladius sp. 1 1 8 21 3 1 3 1 3 Oulimnius latiusculus 2 1 Pagastia orthogonia 2 6 5 3 3 4 2 2 5 Parachaetocladius sp. 2Parachironomus sp. 1Paracladopelma sp. 1Paragnetina immarginata 39 27 1 1 30 8 14 17 1 2 1 1 3 6 10 11 8 Paragnetina media 6Paraleptophlebia sp. 7 3 4 6 2 3 2 7 1 4 2 4 Parametriocnemus sp. 1 1 1Pisidium sp. 1Plauditus sp. 7 1 7 1 7 1 5 21 22 34 31 18 3 Polycentropus sp. 1 2 1Polypedilum aviceps 15 20 21 6 7 43 7 2 9 Polypedilum flavum 22 29 2 1 2 9 100 40 30 50 63 133 96 76 61 74 129 Polypedilum illinoense 1 Polypedilum laetum 1 1Polypedilum sordens 1Polypedilum sp. 1 1 Potthastia gaedii gr. 3 1 6 2 11 1 Potthastia longimana gr. 17 2 1 1Procloeon sp. 11 2 6 1 3 1 1 Promoresia elegans 1 Promoresia tardella 3 1 21 1 1 Prostoma graecense 1 17 3 4 5 3Protoptila sp. 2Psephenus herricki 17 5 48 1 1 1 1 6
From the digital collections of the New York State Library.
26
Taxon
BDHW‐01
BEVE‐01
BRCH
‐04
BSNL‐01
FOXH
‐01
LBEA
‐01
PECK
‐01
STOC‐00
STOC‐01
USO
P‐00
USO
P‐02
USO
P‐03
USO
P‐03
A
USO
P‐03
B
USO
P‐04
USO
P‐04
A
USO
P‐04
B
USO
P‐05
USO
P‐06
WODC‐01
Psilotreta sp. 2 1 26 3 2Pteronarcys biloba 1 1 2 3 2 Pteronarcys proteus 4 2 5 1 2 2 Pteronarcys sp. 1 1 2 1 1 1 1 Pycnopsyche sp. 1 Rheocricotopus robacki 1 1 Rheocricotopus tuberculatus 1 Rheotanytarsus sp. 1 2 7 2 4 2 1 3 1 1 1 1 1 Rhyacophila fuscula 1 2 2 1 1Rhyacophila mainensis 3 1 1 1Rhyacophila manistee 1 5 1 2Rhyacophila minora 1 1Rhyacophila sp. 1 2 Ripistes parasita 16Serratella serrata 2 2 2 7 2 3Sialis sp. 1Simulium sp. 6 1 1 3 4 2 Slavina appendiculata 1Stenelmis sp. 1 3 1 6 3 2 6 5 5Stenonema ithaca 1 1 5Stenonema sp. 3 2 40 2 7 3 3 17 5 55 24 1 7 6 5 1 Stenonema vicarium 12 29 21 17 28 6 34 28 6 21 58 1 34 24 29 36 29 Stylaria lacustris 1Sublettea coffmani 1 1 1 1Sweltsa sp. 1 3 6 1 1 4 1 1 1 1 1 Synorthocladius sp. 1 Tallaperla sp. 1 3 2 2 1 Undet. Tanytarsini 2 1
From the digital collections of the New York State Library.

27
Taxon
BDHW‐01
BEVE‐01
BRCH
‐04
BSNL‐01
FOXH
‐01
LBEA
‐01
PECK
‐01
STOC‐00
STOC‐01
USO
P‐00
USO
P‐02
USO
P‐03
USO
P‐03
A
USO
P‐03
B
USO
P‐04
USO
P‐04
A
USO
P‐04
B
USO
P‐05
USO
P‐06
WODC‐01
Tanytarsus sp. 3 1 2 3 7 3 1 2Thienemanniella sp. 2 2 1Thienemannimyia gr. spp. 3 4 1 3 6 6 7 35 11 6 3 1 1 3 Tipula sp. 1 Tribelos sp. 14 1 2 1 Tvetenia sp. 2 5 1 Tvetenia vitracies 1 1 1 3 1 2 1 8 1 10 6 3 3 Undet. Lumbricina 3 4 1 1 1Undet. Turbellaria 1 1 1 1 1 1 2 2 3
From the digital collections of the New York State Library.
28
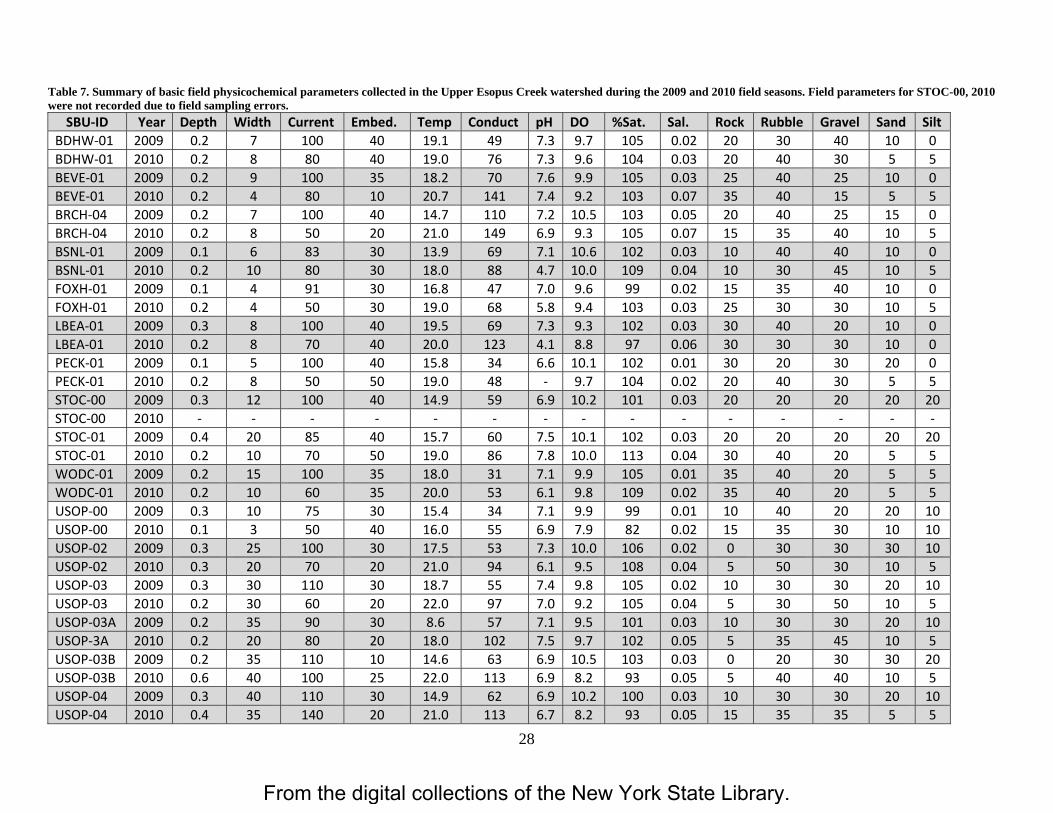
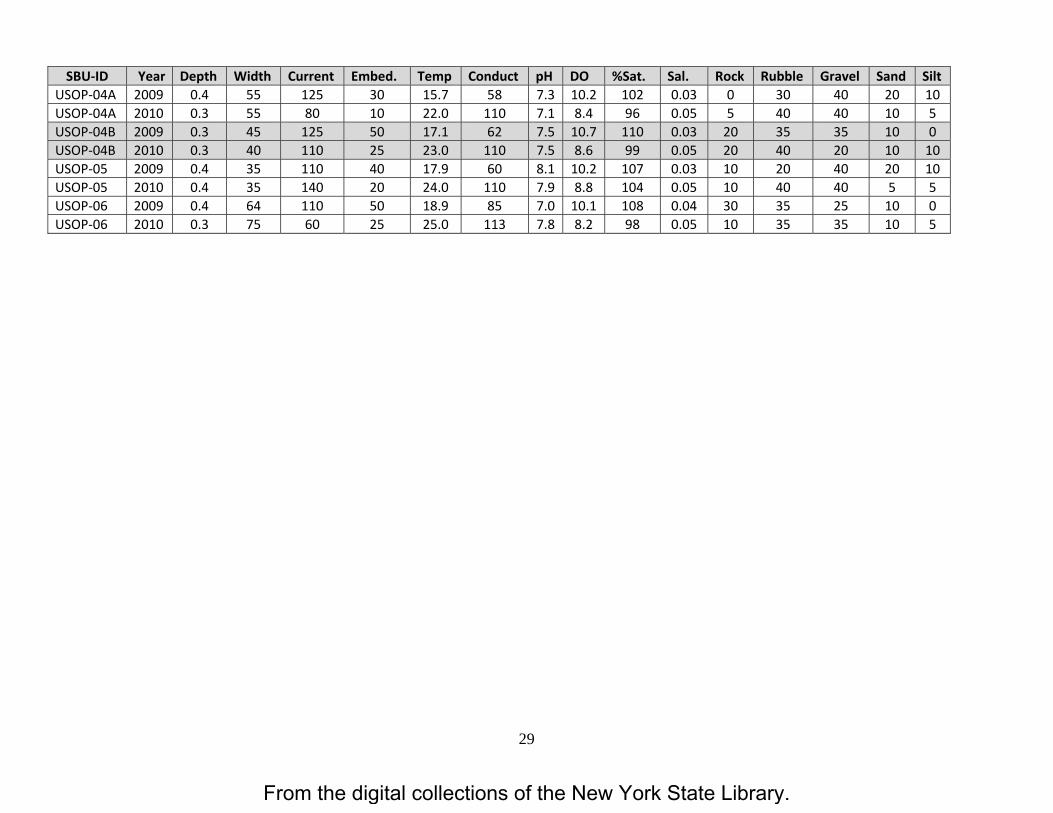
Table 7. Summary of basic field physicochemical parameters collected in the Upper Esopus Creek watershed during the 2009 and 2010 field seasons. Field parameters for STOC-00, 2010 were not recorded due to field sampling errors.
SBU‐ID Year Depth Width Current Embed. Temp Conduct pH DO %Sat. Sal. Rock Rubble Gravel Sand SiltBDHW‐01 2009 0.2 7 100 40 19.1 49 7.3 9.7 105 0.02 20 30 40 10 0BDHW‐01 2010 0.2 8 80 40 19.0 76 7.3 9.6 104 0.03 20 40 30 5 5BEVE‐01 2009 0.2 9 100 35 18.2 70 7.6 9.9 105 0.03 25 40 25 10 0BEVE‐01 2010 0.2 4 80 10 20.7 141 7.4 9.2 103 0.07 35 40 15 5 5BRCH‐04 2009 0.2 7 100 40 14.7 110 7.2 10.5 103 0.05 20 40 25 15 0BRCH‐04 2010 0.2 8 50 20 21.0 149 6.9 9.3 105 0.07 15 35 40 10 5BSNL‐01 2009 0.1 6 83 30 13.9 69 7.1 10.6 102 0.03 10 40 40 10 0BSNL‐01 2010 0.2 10 80 30 18.0 88 4.7 10.0 109 0.04 10 30 45 10 5FOXH‐01 2009 0.1 4 91 30 16.8 47 7.0 9.6 99 0.02 15 35 40 10 0FOXH‐01 2010 0.2 4 50 30 19.0 68 5.8 9.4 103 0.03 25 30 30 10 5LBEA‐01 2009 0.3 8 100 40 19.5 69 7.3 9.3 102 0.03 30 40 20 10 0LBEA‐01 2010 0.2 8 70 40 20.0 123 4.1 8.8 97 0.06 30 30 30 10 0PECK‐01 2009 0.1 5 100 40 15.8 34 6.6 10.1 102 0.01 30 20 30 20 0PECK‐01 2010 0.2 8 50 50 19.0 48 ‐ 9.7 104 0.02 20 40 30 5 5STOC‐00 2009 0.3 12 100 40 14.9 59 6.9 10.2 101 0.03 20 20 20 20 20STOC‐00 2010 ‐ ‐ ‐ ‐ ‐ ‐ ‐ ‐ ‐ ‐ ‐ ‐ ‐ ‐ ‐STOC‐01 2009 0.4 20 85 40 15.7 60 7.5 10.1 102 0.03 20 20 20 20 20STOC‐01 2010 0.2 10 70 50 19.0 86 7.8 10.0 113 0.04 30 40 20 5 5WODC‐01 2009 0.2 15 100 35 18.0 31 7.1 9.9 105 0.01 35 40 20 5 5WODC‐01 2010 0.2 10 60 35 20.0 53 6.1 9.8 109 0.02 35 40 20 5 5USOP‐00 2009 0.3 10 75 30 15.4 34 7.1 9.9 99 0.01 10 40 20 20 10USOP‐00 2010 0.1 3 50 40 16.0 55 6.9 7.9 82 0.02 15 35 30 10 10USOP‐02 2009 0.3 25 100 30 17.5 53 7.3 10.0 106 0.02 0 30 30 30 10USOP‐02 2010 0.3 20 70 20 21.0 94 6.1 9.5 108 0.04 5 50 30 10 5USOP‐03 2009 0.3 30 110 30 18.7 55 7.4 9.8 105 0.02 10 30 30 20 10USOP‐03 2010 0.2 30 60 20 22.0 97 7.0 9.2 105 0.04 5 30 50 10 5USOP‐03A 2009 0.2 35 90 30 8.6 57 7.1 9.5 101 0.03 10 30 30 20 10USOP‐3A 2010 0.2 20 80 20 18.0 102 7.5 9.7 102 0.05 5 35 45 10 5USOP‐03B 2009 0.2 35 110 10 14.6 63 6.9 10.5 103 0.03 0 20 30 30 20USOP‐03B 2010 0.6 40 100 25 22.0 113 6.9 8.2 93 0.05 5 40 40 10 5USOP‐04 2009 0.3 40 110 30 14.9 62 6.9 10.2 100 0.03 10 30 30 20 10USOP‐04 2010 0.4 35 140 20 21.0 113 6.7 8.2 93 0.05 15 35 35 5 5
From the digital collections of the New York State Library.
29
SBU‐ID Year Depth Width Current Embed. Temp Conduct pH DO %Sat. Sal. Rock Rubble Gravel Sand SiltUSOP‐04A 2009 0.4 55 125 30 15.7 58 7.3 10.2 102 0.03 0 30 40 20 10USOP‐04A 2010 0.3 55 80 10 22.0 110 7.1 8.4 96 0.05 5 40 40 10 5USOP‐04B 2009 0.3 45 125 50 17.1 62 7.5 10.7 110 0.03 20 35 35 10 0USOP‐04B 2010 0.3 40 110 25 23.0 110 7.5 8.6 99 0.05 20 40 20 10 10USOP‐05 2009 0.4 35 110 40 17.9 60 8.1 10.2 107 0.03 10 20 40 20 10USOP‐05 2010 0.4 35 140 20 24.0 110 7.9 8.8 104 0.05 10 40 40 5 5USOP‐06 2009 0.4 64 110 50 18.9 85 7.0 10.1 108 0.04 30 35 25 10 0USOP‐06 2010 0.3 75 60 25 25.0 113 7.8 8.2 98 0.05 10 35 35 10 5
From the digital collections of the New York State Library.

30
From the digital collections of the New York State Library.
31
Literature Cited Bode, R.W., Kuzia, E., Abele, L.E., Heitzman, D.L., Smith, A.J., Wright, N.D., Novak, M.A., 2005. Biological Stream Assessment: Birch Creek. New York State, Stream Biomonitoring Unit, Division of Water, New York State Department of Environmental Conservation, Albany, NY., p. 39. Bode, R.W., Novak, M.A., Abele, L.E., 1990. Biological impairment criteria for flowing waters in New York State. Stream Biomonitoring Unit, Division of Water, New York State Department of Environmental Conservation, Albany, NY., p. 110. Bode, R.W., Novak, M.A., Abele, L.E., 1995. Biological Stream Assessment: Esopus Creek. New York State. Stream Biomonitoring Unit, Division of Water, New York State Department of Environmental Conservation, Albany, NY., p. 43. Bode, R.W., Novak, M.A., Abele, L.E., Heitzman, D.L., Passy, S.I., Smith, A.J., 2001. Biological Stream Assessment: Upper Esopus Creek. New York State. Stream Biomonitoring Unit, Division of Water, New York State Department of Environmental Conservation, Albany, NY., p. 47. Brooker, M., Hemsworth, R., 1978. The effect of the release of an artificial discharge of water on invertebrate drift in the R. Wye, Wales. Hydrobiologia 59, 155-163. CCE, 2007. Upper Esopus Creek Management Plan Volume I Draft Summary of Findings and Recommendations. Cornell Cooperative Extension of Ulster County, Kingston, NY, p. 43. Duffy, B.T., Smith, A.J., Heitzman, D.L., Abele, L.E., 2011. Biological Stream Assessment: Upper Esopus Creek. New York State. Stream Biomonitoring Unit, Division of Water, New York State Department of Environmental Conservation, Albany, NY., p. 58. Gray, L.J., Ward, J.V., 1982. Effects of sediment releases from a reservoir on stream macroinvertebrates. Hydrobiologia 96, 177-184. Henley, W., Patterson, M., Neves, R., Lemly, A.D., 2000. Effects of sedimentation and turbidity on lotic food webs: a concise review for natural resource managers. Reviews in Fisheries Science 8, 125-139. Hilsenhoff, W.L., 1987. An improved biotic index of organic stream pollution. Great Lakes Entomologist 20, 31-40. Lenat, D.R., 1988. Water Quality Assessment of Streams Using a Qualitative Collection Method for Benthic Macroinvertebrates. Journal of the North American Benthological Society 7, 222-233. Novak, M.A., Bode, R.W., 1992. Percent model affinity: A new measure of macroinvertebrate community composition. Journal of the North American Benthological Society 11, 80-85.
From the digital collections of the New York State Library.
32
Robinson, C.T., Uehlinger, U., Monaghan, M.T., 2003. Effects of a multi-year experimental flood regime on macroinvertebrates downstream of a reservoir. Aquatic Sciences 65, 210-222. Smith, A.J., Bode, R.W., Novak, M.A., Abele, L.E., Heitzman, D.L., Duffy, B.T., 2008. Biological Stream Assessment: Upper Esopus Creek. New York State. Stream Biomonitoring Unit, Division of Water, New York State Department of Environmental Conservation, Albany, NY., p. 52. Smith, A.J., Heitzman, D.L., Lojpersberger, J.L., Duffy, B.T., Novak, M.A., 2012. Standard Operating Procedure: Biological Monitoring of Surface Waters in New York State. New York State. Stream Biomonitoring Unit, Division of Water, New York State Department of Environmental Conservation, Albany, NY., p. 159. Wilde, F., Radtke, D., Gibs, J., Iwatsubo, R., 1999. Collection of water samples: US Geological Survey Techniques of Water-Resources Investigations, National field manual for the collection of water-quality data. United States Geological Survey, Washington, DC.
From the digital collections of the New York State Library.