Embed Size (px)
Citation preview
")!(
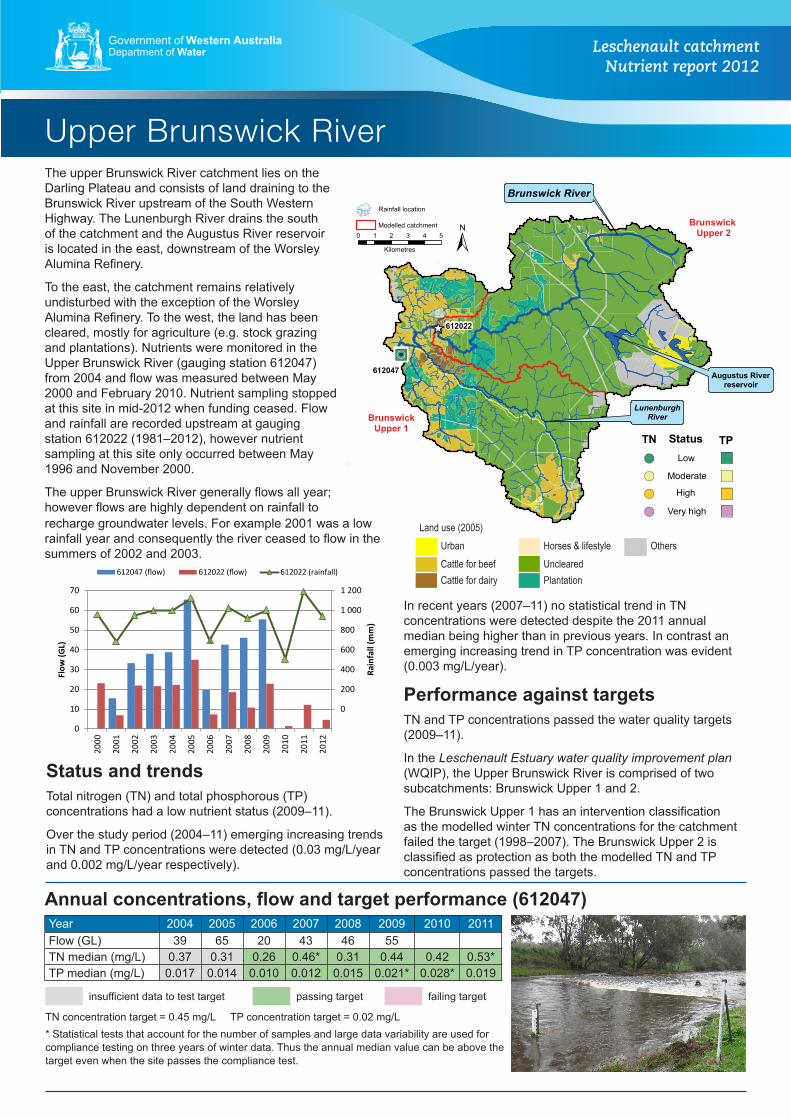
_̂612022
612047
±
Brunswick Upper 20 1 2 3 4 50.5
Kilometres
BrunswickUpper 1
LunenburghRiver
Augustus Riverreservoir
Brunswick River
Modelled catchment
Rainfall location
")
")")")
Low
Moderate
High
Very high
!(
!(
!(
!(
TN TPStatus
Annual concentrations, flow and target performance (612047)Year 2004 2005 2006 2007 2008 2009 2010 2011Flow (GL) 39 65 20 43 46 55TN median (mg/L) 0.37 0.31 0.26 0.46* 0.31 0.44 0.42 0.53*TP median (mg/L) 0.017 0.014 0.010 0.012 0.015 0.021* 0.028* 0.019
insufficient data to test target passing target failing target
TN concentration target = 0.45 mg/L TP concentration target = 0.02 mg/L * Statistical tests that account for the number of samples and large data variability are used for compliance testing on three years of winter data. Thus the annual median value can be above the target even when the site passes the compliance test.
recharge groundwater levels. For example 2001 was a low rainfall year and consequently the river ceased to flow in the summers of 2002 and 2003.
Government of Western AustraliaDepartment of Water Leschenault catchment
Nutrient report 2012
Upper Brunswick RiverThe upper Brunswick River catchment lies on the Darling Plateau and consists of land draining to the Brunswick River upstream of the South Western Highway. The Lunenburgh River drains the south of the catchment and the Augustus River reservoir is located in the east, downstream of the Worsley Alumina Refinery.
To the east, the catchment remains relatively undisturbed with the exception of the Worsley Alumina Refinery. To the west, the land has been cleared, mostly for agriculture (e.g. stock grazing and plantations). Nutrients were monitored in the Upper Brunswick River (gauging station 612047) from 2004 and flow was measured between May 2000 and February 2010. Nutrient sampling stopped at this site in mid-2012 when funding ceased. Flow and rainfall are recorded upstream at gauging station 612022 (1981–2012), however nutrient sampling at this site only occurred between May 1996 and November 2000.
The upper Brunswick River generally flows all year; however flows are highly dependent on rainfall to
Status and trendsTotal nitrogen (TN) and total phosphorous (TP) concentrations had a low nutrient status (2009–11).
Over the study period (2004–11) emerging increasing trends in TN and TP concentrations were detected (0.03 mg/L/year and 0.002 mg/L/year respectively).
Land use (2005)Urban Horses & lifestyle OthersCattle for beef UnclearedCattle for dairy Plantation
In recent years (2007–11) no statistical trend in TN concentrations were detected despite the 2011 annual median being higher than in previous years. In contrast an emerging increasing trend in TP concentration was evident (0.003 mg/L/year).
Performance against targets TN and TP concentrations passed the water quality targets (2009–11).
In the Leschenault Estuary water quality improvement plan (WQIP), the Upper Brunswick River is comprised of two subcatchments: Brunswick Upper 1 and 2.
The Brunswick Upper 1 has an intervention classification as the modelled winter TN concentrations for the catchment failed the target (1998–2007). The Brunswick Upper 2 is classified as protection as both the modelled TN and TP concentrations passed the targets.
0
200
400
600
800
1 000
1 200
0
10
20
30
40
50
60
70
2000
2001
2002
2003
2004
2005
2006
2007
2008
2009
2010
2011
2012
Rain
fall
(mm
)
Flow
(GL)
612047 (flow) 612022 (flow) 612022 (rainfall)
Upper Brunswick: Nutrient report 2012
• An emerging decreasing trend in TP (2007–11) was detected.
• TNandTPstatusclassificationswerelow.
• The Brunswick River was passing the TN and TP targets.
Key messages
ISBN 978-1-922248-27-5 (online)www.water.wa.gov.au For further information please contact the South West region, Department of Water [email protected]
The Leschenault Estuary water quality improvement plan (WQIP)The WQIP outlines a range of management actions which have the potential to improve water quality and prevent further decline. These fall under the following categories:
• Nutrient and contaminant reduction.• Environmental water management.• Assess condition and measure progress.
Nutrient reduction strategiesThe top three best management practices (BMPs) that will result in improved water quality in the upper Brunswick Catchment in descending order of effectiveness for N and P are as follows:Nitrogen reduction:
1. Riparian zone restoration and creation of buffers (includes removal of stock from waterways).
2. Better fertiliser management.3. Perennial pastures.
Phosphorus reduction: 1. Riparian zone restoration and creation of buffers
(includes removal of stock from waterways).2. Better fertiliser management.3. Slow release fertiliser (once available).
• Riverbank erosion is an issue in the catchment.
• Fencing stock from waterways and revegetating the riparian zone are the best methods for reducing nitrogen and phosphorus concentrations and improving water quality.
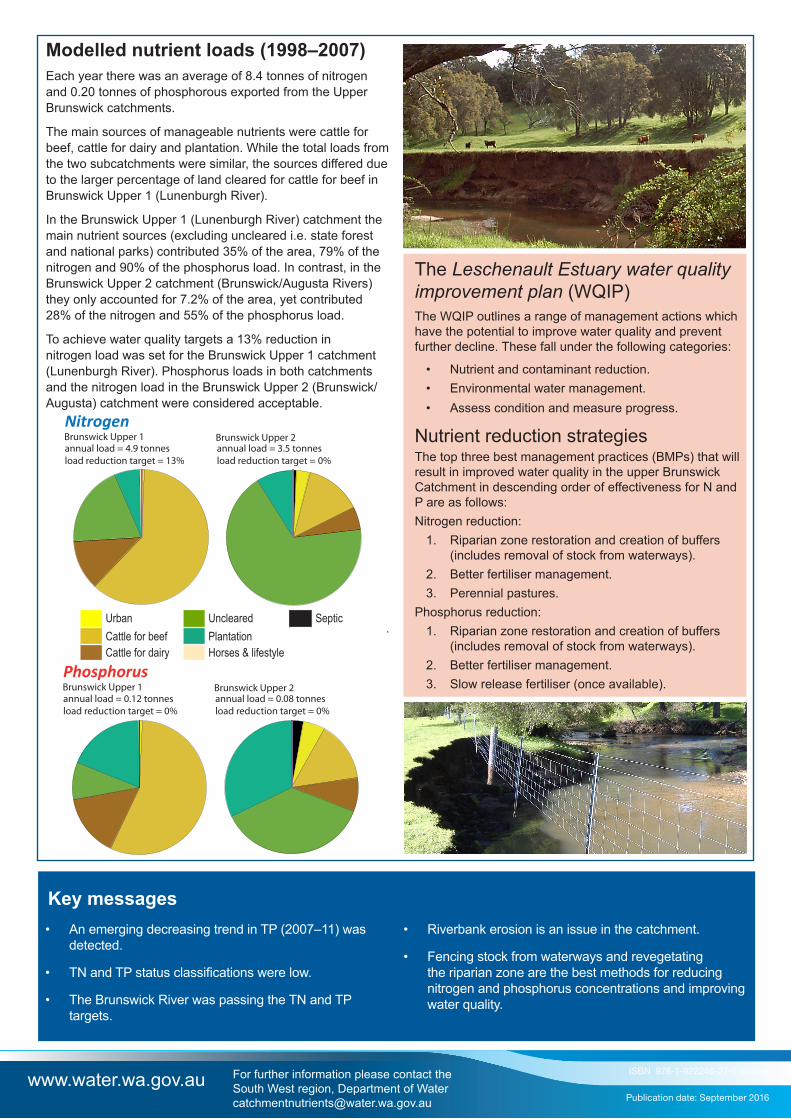
Modelled nutrient loads (1998–2007)Each year there was an average of 8.4 tonnes of nitrogen and 0.20 tonnes of phosphorous exported from the Upper Brunswick catchments.
The main sources of manageable nutrients were cattle for beef, cattle for dairy and plantation. While the total loads from the two subcatchments were similar, the sources differed due to the larger percentage of land cleared for cattle for beef in Brunswick Upper 1 (Lunenburgh River).
In the Brunswick Upper 1 (Lunenburgh River) catchment the main nutrient sources (excluding uncleared i.e. state forest and national parks) contributed 35% of the area, 79% of the nitrogen and 90% of the phosphorus load. In contrast, in the Brunswick Upper 2 catchment (Brunswick/Augusta Rivers) they only accounted for 7.2% of the area, yet contributed 28% of the nitrogen and 55% of the phosphorus load.
To achieve water quality targets a 13% reduction in nitrogen load was set for the Brunswick Upper 1 catchment (Lunenburgh River). Phosphorus loads in both catchments and the nitrogen load in the Brunswick Upper 2 (Brunswick/Augusta) catchment were considered acceptable.
Urban Uncleared SepticCattle for beef PlantationCattle for dairy Horses & lifestyle
Publication date: September 2016
annual load = 4.9 tonnesload reduction target = 13%
Nitrogenannual load = 3.5 tonnesload reduction target = 0%
Brunswick Upper 1 Brunswick Upper 2
annual load = 0.12 tonnesload reduction target = 0%
Phosphorusannual load = 0.08 tonnesload reduction target = 0%
Brunswick Upper 1 Brunswick Upper 2