Embed Size (px)
Citation preview


2 Uponor Financial Review 2019
Contents Uponor Financial Review 2019
Investor Relations at Uponor .......................................................................................................... 2
Why invest in Uponor ..................................................................................................................... 3
Information for shareholders........................................................................................................... 4
Shareholder value development ..................................................................................................... 5
Board of Directors........................................................................................................................... 6
Executive Committee...................................................................................................................... 7
Review by the Board of Directors ................................................................................................... 8
Group key financial figures ...................................................................................................... 16
Items affecting comparability and reconciliations to IFRS ....................................................... 17
Share-specific key figures ...................................................................................................... 18
Definitions of key ratios ........................................................................................................... 19
Shares and shareholders ........................................................................................................ 20
Consolidated financial statements (IFRS) ................................................................................... 21
Consolidated statement of comprehensive income ................................................................. 21
Consolidated balance sheet .................................................................................................... 22
Consolidated cash flow statement ........................................................................................... 24
Statement of changes in shareholders’ equity ......................................................................... 25
Notes to the consolidated financial statements ....................................................................... 26
Parent company financial statements (FAS) ................................................................................ 63
Income statement .................................................................................................................... 63
Balance sheet .......................................................................................................................... 64
Cash flow statement ................................................................................................................ 65
Notes to the parent company financial statements .................................................................. 66
Proposal of the Board of Directors ............................................................................................... 72
Auditor’s report ............................................................................................................................. 73
Uponor’s Annual Report 2019 consists of an Annual Review and a Financial Review, which are published as separate PDF documents and can be found on our website at investors.uponor.com.
You are now reading the Financial Review 2019, which covers the Report by the Board of Directors, Financial Statements for 2019 and Auditor’s report. The Financial Review also includes information for investors. Corporate Governance Statement and Remuneration Statement are published as separate PDF documents on our website. The Annual Review consists of the key topics of Uponor’s business and sustainability in 2019.
Meeting requestsPäivi Dahlqvist, Executive AssistantTel. +358 (0)20 129 [email protected]
Other IR contactsMinna Yrjönmäki, CFOTel. +358 (0)20 129 [email protected]
Susanna Inkinen, VP, Communications and Corporate ResponsibilityTel. +358 (0)20 129 [email protected]
Shareholder [email protected]
Reetta Härkki, General CounselTel. +358 (0)20 129 [email protected]
Change of addressShareholders are requested to notify their custodian bank, their brokerage firm, or any other financial institution responsible for maintaining their book-entry securities account of any changes in their mailing address.
Disclosure policyInformation on Uponor’s disclosure policy is available on our investor website at investors.uponor.com > Governance > Disclosure Policy.
Group CommunicationsUponor Corporation, Group CommunicationsP.O. Box 37, Äyritie 20FI-01511 Vantaa, FinlandTel. +358 (0)20 129 [email protected]
Investor Relations at UponorInvestor Relations at Uponor

3Uponor Financial Review 2019
Why invest in UponorThe business: sustainable building and infrastructure solutions• Safe drinking water delivery and energy-efficient heating and cooling continue to be essential
needs in built environments • Uponor mitigates the cyclicality of construction industry by operating in European and North
American markets and serving both new construction and renovation projects
The company: an industry innovator building on a century of experience• A leading supplier for residential and commercial construction for drinking water delivery and
radiant heating and cooling systems; and a strong position in infrastructure piping systems in northern Europe
• Established brand with a broad and loyal customer base• Well maintained manufacturing network with capacity to grow• Continuous material and production technology development to support operational efficiency• Committed long-term key ownership with a clear understanding of the industry’s dynamics
Read more at investors.uponor.com
LONG-TERM FINANCIAL TARGETS (UPDATED ON 13 FEB 2019) Target 2019 2018 2017 2016 2015Organic net sales growth* 2019E: 4.8% -0.4 4.9 6.5 2.0 5.2Comparable EBIT margin >10% 8.4 8.3 8.3 8.2 7.2Return on investment (ROI) >20% 14.4 17.2 16.3 14.1 15.5Gearing (annual average of quarters) 40-80% 57.5 53.0 58.4 56.7 40.4Dividend payout > 50% of earnings 73.6** 70.8 59.0 79.3 86.3
SHARE-SPECIFIC KEY FIGURES 2019 2018 2017 2016 2015Market value of share capital at year-end, M€ 852.9 631.0 1,228.4 1,208.6 995.6Earnings per share (fully diluted), € 0.72 0.72 0.83 0.58 0.51Dividend, total, M€ 38.7(1 37.2 35.8 33.6 32.2Dividend per share, € 0.53(1 0.51 0.49 0.46 0.44Effective share yield, % 4.5(1 5.9 2.9 2.8 3.2Issue-adjusted share prices- highest, € 12.37 17.62 17.79 17.35 17.30- lowest, € 8.52 8.13 13.3 11.13 10.42Number of shareholders 18,907 20,341 19,191 16,113 14,539
* > GDP +3ppts (GDP growth based on a weighted average growth in the top 10 countries)** proposal by the Board of Directors
1) proposal of the Board of Directors
The definitions of key ratios are presented in the financial statements.

4 Uponor Financial Review 2019
Information for shareholdersAnnual General Meeting
Uponor Corporation’s Annual General Meeting will be held on 16 March 2020 at 15:00 EET at Finlandia Hall, Mannerheimintie 13e, Helsinki, Finland.
A shareholder who is registered in the shareholders’ register of the company and who wants to participate in the general meeting, shall register for the meeting no later than Wednesday 11 March 2020 at 10:00 EET (Finnish time), by which time the registration shall arrive at the company. The Registration can be done: • via our IR website at investors.uponor.com or• by telephone +358 20 770 6883 on week days from 09:00 to 16:00 EET (Finnish time) or• by email to [email protected] or• by mail addressed to Uponor Corporation, Legal Services, P.O. Box 37, FI-01511 Vantaa, Finland.
Payment of dividends
The Board of Directors proposes to the Annual General Meeting that a dividend of €0.53 per share be distributed for the financial period 2019. The dividend shall be paid in two instalments. The first instal-ment of €0.26 per share shall be paid to a shareholder registered as a shareholder in the shareholder register maintained by Euroclear Finland Ltd on the record date of the dividend payment on 18 March 2020. The payment date proposed by the Board for this instalment is 25 March 2020.
The second instalment of €0.27 per share shall be paid in September 2020. The second instalment shall be paid to a shareholder registered as a shareholder in the shareholders register maintained by Euroclear Finland Ltd on the dividend record date, which, together with the payment date, shall be decided by the Board of Directors in its meeting scheduled for 15 September 2020. The dividend record date for the second instalment would be 17 September 2020 and the dividend payment date 24 September 2020.
Analysts covering Uponor
According to the information available to us, at least the following analysts made investment analyses of Uponor in 2019. These parties follow Uponor on their own initiative, and the company is not responsible for their statements. Up-to-date analyst contact information available at investors.uponor.com.
Financial statements bulletin for 2019 12 February 08:00 EETAnnual report 2019 Week 8Annual General Meeting 16 March 15:00 EETRecord date for dividend payment 1st instalment: 18 March*
2nd instalment: 17 September*Date for dividend payment 1st instalment: 25 March*
2nd instalment: 24 September*Interim report: January–March 29 April 12:30 EETInterim report: January–June 24 July 08:00 EETInterim report: January–September 28 October 08:00 EET
Important dates in 2020
Carnegie Investment Bank AB Tommy Ilmoni
Danske Bank Plc Ari Järvinen
HandelsbankenMika Karppinen
Nordea Bank Finland PlcSvante Krokfors
Pohjola Bank Plc Matias Rautionmaa
SEB Equities Anssi Kiviniemi
* Proposal of the Board of Directors
EPS AND DPS
Dividend per share (rhs)Earnings per share
2010 2013 20162011 2014 20172012 2015 2018 20190
0.25
0.50
0.75
1.00
€
*
* proposal by the Board of Directors

5Uponor Financial Review 2019
Shareholder value development
SHAREHOLDER VALUE DEVELOPMENT 2000-2019 FINANCIAL IMPACT ON STAKEHOLDERS 2019
Market Cap*FAS Dividends Total Shareholder Return (rhs)
0 -60%
800 0%
1,200 30%
400 -30%
1,600 60%
2,000 90%
2,400 120%
2002
2012
2001
2011
2000
*
2010
2005
2015
2008
2018
2003
2013
2006
2016
2009
2019
2004
2014
2007
2017
M€Customers
Net sales € 1,103.1 million
InvestorsDividends
paid €37.2 million
SocietyTaxes and social
costs paid €57.5 million
PersonnelSalaries and
remunerations €210.2 million
Product and service suppliersPurchases
€751.2 million
SHARE PERFORMANCE AND VOLUMES 2019 Uponor OMXHCPI rebased Volume (rhs)
01 2 3 4 5 6 7 8 9 10 11 12
2
4
6
8
10
12
14€ Millions
0
0.8
1.6
2.4
3.2
4

6 Uponor Financial Review 2019
Board of Directors31 December 2019
Annika Paasikivib. 1975, Finnish citizen, B.A., M.Sc. (Global Politics), President and CEO, Oras Invest Ltd and CEO, Finow Ltd• Chair of the Board, Uponor Corporation, 13 March 2018–• Member of the Board, Uponor Corporation,
19 March 2014–• Chair of the Personnel and Remuneration Committee• Uponor shareholdings: 45,540
Johan Falkb. 1971, Swedish citizen, M.Sc. (Eng.), MBA, CEO, OneMed Group• Member of the Board, Uponor Corporation,
13 March 2018–• Member of the Audit Committee• Uponor shareholdings: 3,150
Casimir Lindholmb. 1971, Finnish citizen, M.Sc. (Econ.), MBA, President and CEO, Eltel AB• Member of the Board, Uponor Corporation,
13 March 2018–• Member of the Personnel and Remuneration Committee• Uponor shareholdings: 3,150
Eva Nygrenb.1955, Swedish citizen, Architect• Member of the Board, Uponor Corporation,
15 March 2011–• Uponor shareholdings: 12,534
Markus Lengauerb. 1965, Austrian citizen, M.Sc. (Eng.), Doctorate in Mechanical Engineering• Deputy chair of the Board, Uponor Corporation,
13 March 2018–• Member of the Board, Uponor Corporation, 17 March 2015–• Member of the Audit Committee• Uponor shareholdings: 6,905
Pia Aaltonen-Forsellb. 1974, Finnish citizen, M.Soc.Sc. (Econ.), MBA, CFO, Outokumpu• Member of the Board, Uponor Corporation,
20 March 2017–• Chair of the Audit Committee• Uponor shareholdings: 4,553
Further up to date details at investors.uponor.com

7Uponor Financial Review 2019
Executive Committee31 December 2019
Jyri Luomakoskib. 1967, Finnish citizen, MBA• President and CEO, Uponor Corporation,
since 27 October 2008 • Employed by Uponor since 1996• Member of the Executive Committee
since 1 October 1999• Uponor shareholdings: 43,699
Karsten Hoppeb. 1971, German citizen, M.Sc. (Industrial Engineering), MBA, Ph.D. (Business)• President, Building Solutions – Europe• Employed by Uponor since 2019• Member of the Executive Committee
since 1 February 2019• Uponor shareholdings: 0
Minna Yrjönmäkib.1967, Finnish citizen, M.Sc. (Business Administration and Financial Accounting)• CFO• Employed by Uponor since 2019• Member of the Executive Committee
since 3 August 2019• Uponor shareholdings: 0
Sebastian Bondestamb. 1962, Finnish citizen, M.Sc. (Eng.)• President, Uponor Infra • Employed by Uponor since 2007• Member of the Executive Committee
since 1 April 2007• Uponor shareholdings: 20,557
Bill Grayb. 1965, U.S., Canadian and British citizen, B.Com. (Finance and Marketing), B.A.• President, Building Solutions – North America• Employed by Uponor since 2008• Member of the Executive Committee
since 15 February 2012 • Uponor shareholdings: 24,744
Further up to date details at investors.uponor.com

8 Uponor Financial Review 2019
Review by the Board of Directors
Markets
In the face of continued uncertainty surrounding global trade, buoyant consumer spending drove growth in the economies of Uponor’s key markets, albeit at slower rates than in 2018. Against the backdrop of these supportive macroeconomic tailwinds, activity within the construction industry remained at a good level overall, but with significant differences in market dynamics between countries.
In Uponor’s largest Central European market, Germany, construction activity was sustained at healthy levels despite the significant downturn in export-oriented sectors of the economy. In the new build segments, residential projects continued to drive growth, especially in multi-family buildings, while non-residential spending was on par with the previous year. Within the signifi-cantly larger renovation segments, residential and non-residential spending was principally flat overall. In the Netherlands, the construction growth witnessed in recent years continued, but at a slower rate.
In Southwest Europe, both the Spanish and Italian construction markets grew at solid rates, but construction spend on a per capita basis still lagged well behind the rest of Europe. In the United Kingdom, construction was on the previous year’s level, with increased investments in new residential projects countered by reduced spending on non-residential projects.
In the Nordic region, new residential building in Finland and Sweden moderated as anticipated following a number of years of elevated production levels. In Denmark and Norway, new resi-dential building was steady, while the residential renovation segments in all four countries grew somewhat. On the non-residential side, construction spending grew throughout the region, with notable growth in Norway and Sweden. Spending on civil engineering projects, an important seg-ment for Uponor Infra, was flat in Denmark and down in Finland, while government expenditures in areas such as transportation and water works increased substantially in Norway and Sweden.
In North America, residential building activity in the USA slowed in the first half of the year, but stabilised during the summer and appeared to gain some momentum during the final months of the year as confidence returned to the market. However, builders continue to be challenged by
an ongoing lack of skilled labour and land. The non-residential segment grew slightly overall, with growth in lodging and offices offset by a fall in commercial projects. In Canada, the residential market was flat, with growth in multi-family offsetting a decline in single-family homes, while non-residential construction was steady.
Net sales Uponor’s net sales were €1,103.1 (1,196.3) million, a decline of 7.8% year-over-year. The positive currency impact totalled €15.1 million, bringing the 2019 full-year organic growth to -1.2% in constant currency terms. The positive net currency effect was mainly due to the USD. Net sales for the comparison period without divested Uponor Infra’s North American business and Zent-Frenger would have been €1,101.7 million.
Building Solutions – Europe’s net sales were €489.3 (524.2) million, a decline of 6.7% year-on-year. The decline was due to Asia and Zent-Frenger, whose net sales are included in the comparison period. In addition, net sales declined in Finland, Norway and Sweden.
Building Solutions – North America’s net sales were €375.4 (340.5) million, a growth of 10.3%. In U.S. dollar terms, the growth was 4.7%. The positive development was driven by growth in plumbing sales in both the U.S. and Canadian markets.
Uponor Infra’s net sales were €243.9 (337.3) million, a decline of 27.7%. The comparison period includes Uponor Infra’s North American business, which was divested in August 2018. In 2019, net sales declined in Finland and Sweden, due to the execution of segment’s profitability improvement strategy. Designed solutions sales developed positively.
Within the business groups, the share of plumbing solutions represented 55% (49), indoor climate solutions 23% (23), and infrastructure solutions 22% (28) of Group net sales.
Measured in terms of reported net sales, and their respective share of Group net sales, the 10 largest countries were as follows: the U.S. 29.9% (26.9), Germany 11.8% (12.5), Finland 11.2% (11.0), Sweden 9.1% (9.6), Denmark 4.3% (4.3), Canada 4.2% (7.2), the Netherlands 4.2% (3.5), Spain 3.7% (3.3), Norway 3.0% (2.8), and Poland 2.9% (2.6).

9Uponor Financial Review 2019
M€ 1–12/ 2019 1–12/ 2018 Change 1–12/ 2018*Building Solutions – Europe 489.3 524.2 -6.7% 502.6
Building Solutions – North America 375.4 340.5 10.3% 340.5
(Building Solutions – North America, (M$)) 420.2 401.5 4.7%
Uponor Infra 243.9 337.3 -27.7% 270.3
Eliminations -5.5 -5.7
Total 1,103.1 1,196.3 -7.8% 1,107.7
M€ 1–12/ 2019 1–12/ 2018 ChangeBuilding Solutions – Europe 31.6 31.1 1.5%
Building Solutions – North America 57.1 46.6 22.7%
(Building Solutions – North America, (M$)) 63.9 54.9 16.4%
Uponor Infra 10.8 35.1 -69.1%
Others -8.0 -5.2
Eliminations -0.2 -0.9
Total 91.3 106.7 -14.5%
Net sales by segment for 1 January–31 December 2019:
Operating profit by segment for 1 January–31 December 2019:
*) Illustrative figures without divested Uponor Infra’s North American business and Zent-Frenger.
Results and profitability Driven by the strategic decisions to divest Uponor Infra’s North American business and Zent-Frenger as well as to cease operations in Asia, Uponor’s full-year gross profit was €381.9 (400.8) million, a decline of €18.9 million. The gross profit margin improved and was 34.6% (33.5). Comparable gross profit was €382.0 (400.8) million, with a margin of 34.6% (33.5). The items affecting comparability were related to operational excellence programme.
Comparable operating profit, i.e. excluding any items affecting comparability, was €92.7 (99.3) million, a decline of 6.7%. Comparable operating profit margin was 8.4% (8.3). The total net amount of items affecting comparability was €1.4 (-7.4) million. The items were mostly related to Uponor’s operational excellence programme. During the comparison period, the most material items affecting comparability were disposal gains from Uponor Infra’s North American business and Zent-Frenger together with restructuring costs and ramp down costs from Asian operations. Comparable operating profit improved 11.0% from the comparison period without the divested Uponor Infra’s North American business and Zent-Frenger.
Operating profit was €91.3 (106.7) million. The comparison period includes the above mentioned items affecting comparability. The operating profit margin was 8.3% (8.9).
Building Solutions – Europe’s operating profit was €31.6 (31.1) million. Comparable operating profit was €32.3 (35.4) million. The items affecting comparability were related to operational excellence programme. The comparison period included following items affecting comparability: disposal gain from divestment of Zent-Frenger, restructuring costs and ramp down costs from Asian operations. The decline in profitability was due to decline in net sales, sales mix and unfavourable development of freight costs together with the costs associated with the scaling up of the production of S-Press PLUS.
Building Solutions – North America’s operating profit was €57.1 (46.6) million. The favourable development was driven by price development, stabilised freight environment, sales mix and tight cost control.
Uponor Infra’s operating profit was €10.8 (35.1) million. The comparison period included the disposal gain from the divestment of Uponor Infra’s North American business. Comparable operating profit was €10.8 (23.4) million. The decline was due to the divested North American business. In 2019, the profitability of the current portfolio improved year-on-year, in Finland and Sweden, in particular.

10 Uponor Financial Review 2019
Uponor’s net financial expenses were €11.6 (8.5) million. The adoption of IFRS 16 increased interest expenses. Net currency exchange differences in 2019 totalled €-6.4 (-4.9) million.
The share of the result in associated companies and joint ventures, €-4.0 (-4.7) million, is mainly related to Uponor’s 50% share in the joint venture company, Phyn, established in 2016.
Profit before taxes was €75.6 (93.5) million. The effective tax rate was 26.8% (32.4). In the comparison period, the effective tax rate was higher due to one-time impacts of the divestments of Uponor Infra’s North American business and Zent-Frenger together with closing down Asian operations and Australian sales office. Income taxes totalled €20.3 (30.3) million.
Profit for the period totalled €55.3 (63.2) million. Return on equity was 15.3% (18.0). Return on investment was 14.4% (17.2). Without the adoption of IFRS 16, return on invest-
ment would have been 14.8%. Return on investment, adjusted for items affecting comparability, was 14.7% (15.9).
Earnings per share were €0.72 (0.72). Equity per share was €4.27 (4.08). For other share-specific information, please see the attached tables.
Cash flow from operations increased and was €109.2 (79.9) million. This was due to a change in net working capital. Cash flow before financing was €88.4 (72.7) million.
Investment, research and development, and financing In recent years, Uponor has invested in selected productivity improvements, maintenance and the modernisation of technology in the company’s manufacturing facilities. In 2019, gross investment in fixed assets totalled €26.1 (54.0) million. Net investments totalled €23.2 (53.3) million. During the comparison period, Uponor completed its expansion investment in a new manufacturing facility in Hutchinson, Minnesota, USA.
Research and development costs decreased slightly to €21.9 (22.5) million, or 2.0% (1.9) of net sales. The main research and development activities were related to the new S-Press PLUS
M€ 1–12/ 2019 1–12/ 2018 Change 1–12/ 2018*Building Solutions – Europe 32.3 35.4 -8.7% 34.6
Building Solutions – North America 57.1 46.6 22.7% 46.6
(Building Solutions – North America, (M$)) 63.9 54.9 16.4%
Uponor Infra 10.8 23.4 -53.7% 8.3
Others -7.3 -5.2
Eliminations -0.2 -0.9
Total 92.7 99.3 -6.7% 83.5
Comparable operating profit by segment for 1 January–31 December 2019:
*) Illustrative figures without divested Uponor Infra’s North American business and Zent-Frenger.
fitting family, smart offering and legionella controls. In addition, the development of new pipe extrusion technologies and processes continued.
The main existing long-term funding programme on 31 December 2019 was the five-year bilateral loan agreement of €100 million, which will mature in July 2022.
In addition to the above-mentioned funding arrangement, Uponor has outstanding, bilateral long-term loans of €50 million and €20 million, both of which will mature in the summer of 2021.
As back-up funding arrangements, Uponor has four €50 million committed bilateral revolving credit facilities in force, totalling €200 million and maturing in 2021–2023; none of these were used during the reporting period.
For short-term funding needs, Uponor’s main source of funding is its domestic commercial paper programme, totalling €150 million, none of which was outstanding on the balance sheet date. Available cash-pools limits granted by Uponor’s key banks amounted to €35.1 million, none of which was in use on the balance sheet date. At the end of the year, Uponor had €76.1 (38.1) million in cash and cash equivalents.
Most of Uponor’s accounts receivable are secured by credit insurance.Net interest-bearing liabilities were €139.1 (139.2) million. The solvency ratio was 44.6%
(45.1) and gearing declined to 37.6% (39.4), with a four-quarter rolling gearing of 57.5% (53.0), in line with the range of 40–80% set in the company’s financial targets. The impact of IFRS 16 adoption on Uponor’s liabilities as of 1 January 2019 was €44.3 million, increasing the amount of lease liabilities. Without the impact of IFRS 16, gearing would have been 26.5% at the end of the period.
Events during the period In March, Uponor launched new products for European markets at ISH, the world’s leading trade fair in the field of sanitary and heating: smart water monitoring system, Phyn Plus; new genera-tion press fitting solution, S-Press PLUS; fully electronic heat interface unit Combi Port E; and cloud-based smart home control system Smatrix Pulse.
On 29 April, Uponor Infra divested its Czech subsidiary, Fintherm. The buyer was EP Indus-tries a.s. In 2018, Fintherm’s net sales were approximately €8 million and it employed 60 persons.
On 9 May, Uponor announced that Uponor and Belkin have decided to invest an additional USD6 million each, in total USD12 million, in their joint venture Phyn during the year 2019. At the end of the year, Uponor had invested USD1.5 million of the announced amount.
In September, Building Solutions – North America and Pestan North America signed an agreement naming Uponor the exclusive distributor of Pestan North America’s proprietary PP-RCT (polypropylene, random copolymer, with modified crystallinity and temperature resistance) products throughout the U.S. and Canada. The sales will start at the beginning of 2020.
On 25 October, Uponor announced that is has reviewed it strategy: the direction for profitable growth through further expansion into the commercial markets remains valid. In addition, the

11Uponor Financial Review 2019
company will start an operational excellence programme to improve processes and increase efficiencies. The aim is to deliver annual cost improvements of around €20 million with the full effects being realised by the end of 2021. The estimated costs of the programme are expected to be around €20 million, the majority of which is expected to realise during 2020 and will be recorded as items affecting comparability.
Resolutions of the Annual General Meeting 2019 Uponor’s Annual General Meeting, was held in Helsinki, Finland, on 18 March 2019. The AGM adopted the financial statements and the consolidated financial statements for 2018, and released the Board members and the President and CEO from liability. The AGM approved the proposed dividend of €0.51 per share for 2018. The dividend was paid in two instalments, in March and September. Existing Board members Annika Paasikivi (chair), Pia Aaltonen-Forsell, Johan Falk, Markus Lengauer, Casimir Lindholm and Eva Nygren were re-elected. The AGM elected Annika Paasikivi as Chair of the Board. Audit firm Deloitte Oy was re-elected as the auditor of the corporation.
The Board of Directors was authorised to resolve on the repurchase of no more than 3,500,000 of the company’s own shares amounting in total to approximately 4.8 per cent of the total number of the shares of the company at the date of the general meeting. These shares will be bought back using distributable earnings from unrestricted equity. The authorisation is valid until the end of the next annual general meeting, however, no longer than 18 months from the date of the general meeting.
The Board of Directors was authorised to resolve on issuing a maximum of 7,200,000 new shares or transferring the company’s own shares, amounting in total to approximately 9.8 per cent of the total number of the shares of the company. The Board of Directors is authorised to resolve on all the conditions of the issuance of shares. This authorisation is valid until the end of the next annual general meeting, however, no longer than 18 months from the date of the general meeting.
Further details regarding the Annual General Meeting are available at investors.uponor.com/governance/annual-general-meeting/annual-general-meeting-2019.
Governance
Uponor prepares a separate corporate governance statement and a remuneration statement, which are available online, on Uponor’s IR website at investors.uponor.com/governance/corporate-governance.
Uponor complies with the Finnish Corporate Governance Code 2015 issued by the Securities Market Association, with the exception of recommendation 15. According to recommendation 15, the Board of Directors’ committees should have at least three members each. The Personnel and Remu-
neration Committee, however, has two members instead of the three stated in the recommendation. Uponor considers sufficient expertise to have been secured for the Personnel and Remuneration Committee on the basis of two members, and the Committee may also obtain views from outside the Committee. The Committee acts as a preparatory and assisting body for the Board of Directors, and all essential matters relating to remuneration shall be dealt with by the Board of Directors.
Changes in Uponor’s Executive Committee Richard Windischhofer started as EVP, Corporate Development and Technology and member of the Executive Committee at Uponor Corporation on 1 January 2019.
Karsten Hoppe started as President, Building Solutions – Europe and a member of the Executive Committee at Uponor Corporation on 1 February 2019.
Maija Strandberg, CFO and member of Uponor Corporation’s Executive Committee, left her position in the Executive Committee as of 15 February 2019 and in the company in March.
On 3 May 2019, Uponor announced the appointment of Minna Yrjönmäki as CFO and a member of the Executive Committee at Uponor Corporation as of 3 August 2019.
On 15 November 2019, Minna Blomqvist, EVP HR and a member of the Executive Committee, and Richard Windischhofer, EVP Corporate Development and Technology and a member of the Executive Committee, left their positions in the Executive Committee and in the company in November.
Personnel At the end of the year, the Uponor Group had 3,708 (3,928) employees, in full-time-equivalent (FTE) terms. This is 220 less than at the end of 2018. The average number of employees (FTE) for the year was 3,801 (4,074). The decline was mainly due to Uponor’s decision to cease the operations in Asia during 2019 and the divestment of Fintherm. The comparison period includes the divestment of Uponor Infra’s North American business.
The geographical breakdown of the Group’s personnel (FTE) was as follows: Germany 23% (22), the U.S. 23% (23), Finland 16% (15), Sweden 15% (14), Poland 7% (6), Spain 3% (3), Denmark 3% (3), Russia 2% (2), Canada 1% (1), France 1% (1) and other countries 6% (8).
A total of €247.5 (259.5) million was recorded in salaries, other remunerations and employee benefits during the financial period.
Non-financial information
This section describes Uponor’s sustainability activities as required in Chapter 3a of the Finnish Accounting Act on non-financial information. More information on sustainability and the value crea-tion model can be found in the Annual Review 2019 (which will be published during week 8/2020).

12 Uponor Financial Review 2019
Uponor’s business model and value creationOperating in an industry with a strong influence on sustainable living, Uponor’s vision is to become a recognised leader in sustainable building and infrastructure solutions.
Uponor’s materiality analysis together with the UN’s Sustainable Development Goals forms the framework for Uponor’s sustainability approach. Uponor is currently creating long-term sustainability targets, based on four focus areas: clean water and sanitation, responsible produc-tion and consumption, climate action as well as decent work and economic growth. The selected focus areas are those that have the greatest impact potential on the business, including major opportunities, and are aligned with Uponor’s business scope.
Uponor is organised into three segments (Building Solutions – Europe, Building Solutions – North America and Uponor Infra) according to business responsibility and proximity to customers. Common people, brand, sustainability and technology topics are managed at Group level in order to benefit from global presence and maximise the return from long-term R&D projects.
Operating principles and due diligence processes Uponor complies with local laws and regulations, and the company’s Code of Conduct and other Group policies form the foundation for its operating principles. Uponor is also a signatory of the UN Global Compact.
EnvironmentUponor considers the environmental aspects of its product offering and continuously aims to reduce the overall impact of its business operations. Uponor has 16 manufacturing facilities in Europe and North America and their key environmental impacts are greenhouse gas emissions, waste and water usage. Uponor’s target is to reduce scope 1 and scope 2 greenhouse gas emissions by 20% per net sales by 2020, from 2015 levels. Based on the progress so far, Uponor expects that this target will be achieved in 2020.
Uponor pursues an environmental management system according to the standard ISO 14001, and an energy-management system compliant with the standard ISO 50001 in order to reach its environmental and energy targets systematically. In 2019, 14 manufacturing facilities were ISO 14001 certified and 9 ISO 50001 certified. Uponor’s environmental topics are covered by its Quality Environmental Management Policy. Internal and external audits are conducted on a yearly basis to ensure enforcement of the Quality Environmental Management Policy.
In addition, Uponor is developing innovations related to recyclable packaging systems and alternative resins, among others, to reduce its environmental impacts.
Personnel and social mattersUponor emphasises equal treatment, and promotes the safety and well-being of its employees. The health and safety of employees is a management priority and Uponor is striving towards
zero accidents. Employee health and safety topics are covered by the Quality Environmental Management Policy.
Uponor’s people strategy is based on three main themes: leadership, talent and culture. With the people strategy, the company aims to ensure that it attracts and retains the right talent to support Uponor’s business goals under good leadership and a high performance culture.
Uponor conducts personnel surveys regularly to get feedback from its employees on employee-related matters.
Human rightsUponor respects human rights as defined, for example, in the United Nations’ Universal Declara-tion of Human Rights. Uponor is a responsible employer and supports equal opportunities for its employees. No discrimination is allowed. Uponor does not allow child or forced labour or any other activities that are against basic labour rights across its value chain.
Uponor has a Supplier Policy, which aims to ensure that suppliers also meet Uponor’s ethical, social, environmental and quality standards as well as comply with all local laws and regulations.
Through Uponor’s whistle-blower channel, its employees have an opportunity to report non-compliant behaviour anonymously if they wish.
Anti-corruption and bribery Uponor has zero tolerance for corruption and bribery. Uponor’s Fraud Prevention Policy sets out the company’s attitude towards fraud and its intention to prevent it, as well as the responsibilities of all Uponor employees regarding fraud prevention.
Results of compliance with the operating principles
Environmental matters Uponor aims to develop products and solutions that help its customers to reduce their environ-mental impacts. In 2019, Uponor introduced a smart water monitoring system with shut-off ability, Phyn Plus, to the European markets. Other products, such as Uponor Combi Port E, increase the energy-efficiency of the end-users.
Uponor continues to strive to reduce its greenhouse gas emissions and waste. In 2019, the overall change in volumes and product mixes resulted in lower energy consumption, which also lowered Uponor’s scope 1 and 2 GHG emissions. The total amount of waste reduced slightly and at the same time the share of recycled waste increased slightly. The water consumption returned back to its normal level in 2019. The comparison period included leak in the Hutchinson manufacturing facility and increased use of water in Virsbo due to a hot summer.

13Uponor Financial Review 2019
Social and employee related matters Safety is Uponor’s top priority. In 2019, Uponor’s lost time injury frequency reduced to 11.9 (12.7). Uponor continues to develop its internal ways of working and advancing processes that improves safety. Sharing the best practices and near miss learnings are important tools in enhancing the safety culture.
Uponor invests in the personal development of its employees. In 2019, the company continued to run its internal supervisor training programme. All Uponor’s supervisors participate in the training. In addition, Uponor organised three targeted training courses to employees in different stages of their career, from young professionals to senior-level managers.
Uponor has been conducting Group-wide personnel survey every other year. The company is in the process of renewing its personnel survey concept.
Human rightsNo incidents related to human rights violations were detected in daily management processes, internal audit investigations or through the whistle-blower channel in Uponor’s operations.
Anti-corruption and bribery No incidents related to corruption and bribery were detected by daily management processes, internal audit investigations or through the whistle-blower channel in Uponor’s operations.
Main risks related to non-financial themes
Environmental mattersNon-compliance with local legislation and regulations may lead to fines as well as reputational and business risk to Uponor.
Uponor mitigates environmental risks by means of training and implementing ISO 14001, ISO 9001 and ISO 50001 processes and certifications in its manufacturing facilities.
Social and employee related mattersHealth- and safety-related issues may cause risks to Uponor. Uponor may also have difficulties in attracting and retaining talent in the organisation.
Uponor mitigates health- and safety-related risks by means of internal training, near-miss reporting and continuous improvement of internal processes. In addition, Uponor invests in build-ing an attractive corporate culture and employer brand as well as enabling diverse career paths.
Human rightsPossible violation of human rights and employee rights may impact Uponor’s reputation and business opportunities.
Uponor mitigates risks by developing internal training and processes as well as supply chain audits. In addition, an internal anonymous whistle-blowing channel is in use.
Anti-corruption and bribery Unethical behaviour by Uponor’s employees or partners may negatively impact Uponor’s reputa-tion and business opportunities.
Uponor mitigates these risks by a careful recruitment process, internal training and monitoring partners. In addition, the company has an internal anonymous whistle-blowing channel in use.
Measure Unit 2019 2018 2017 2016 2015
Total energy consumption 1,000 MWh 218.0 226.0 200.0 199.0 185.0
Raw material used 1,000 tonnes 146.2 151.2 140.9 132.7 127.1
Water consumption 1,000 m3 154.1 206.2 155.2 168.4 190.9Total GHG emissions (Scope 1) 1,000 tonnes 8.4 8.5 7.5 8.7 8.5Total GHG emissions (Scope 2) 1,000 tonnes 27.0 30.8 32.1 32.2 33.5
Total waste 1,000 tonnes 18.1 20.2 18.8 16.4 16.4Incident rate (LTIF) per million
work hours 11.9 12.7 8.9 7.8 13.1Share of white-collar employees participating in Code of Conduct e-learning % 90.9 - - - -
Key non-financial performance indicators
The current waste recycling % calculations include waste to energy and waste recycled as materials. Some figures for previous years have
changed due to improved accuracy in the data collection and reporting. Uponor is reporting its scope 2 emissions using location-based
methodology, factors were updated and used from “GHG Protocol/IEA (11/2019) - IEA2019”. For the countries, where Uponor purchases green
electricity, market-based factors are in use. All 16 manufacturing facilities are included in the figures. The total working hours are calculated
based on the combined FTE of all active employees and the average yearly working hours of Uponor’s biggest operating countries.

14 Uponor Financial Review 2019
Key risks associated with business
Uponor’s financial performance could be affected by a range of strategic, operational, financial and hazard risks.
Strategic risksUncertainty in the global economy and financial markets may have negative impact on Uponor’s operations, performance, financial position and source of capitals.
Uponor’s key operating areas are Europe and North America, where exposure to political risks is considered to be relatively low in general. The Ukraine crisis continues, thus the sanctions imposed by the USA and EU against Russia, and Russia’s counter sanctions, are affecting business conditions in and with Russia. Russia’s share of Uponor’s net sales was around 2.1% in 2019.
Demand for Uponor’s products depends on business cycles in the construction sector. Uponor mitigates this risk by distributing its business to two main geographical areas: Europe and North America. Uponor also has three business areas: plumbing solutions, indoor climate solutions and infrastructure solutions. Uponor’s products are used both in new construction projects and renovation projects, and in the latter the demand is usually more stable than in more cyclical new construction.
Increasing competitive pressure through e.g. private labelling creates a risk to Uponor. The company mitigates this with constant R&D investments and increasing its capabilities to expand in commercial segment.
Since Uponor’s net sales are divided among a large number of customers, most of which are distributors (wholesalers); end-market demand for the company’s products is distributed across a wide customer base. The five largest customer groups, whose sales are distributed between over 20 countries, generate roughly one third of Uponor’s net sales.
Digitalisation, emerging technologies and capabilities related to those areas are needed to build new business opportunities for Uponor. Uponor’s ability to attract and retain talents to drive change are key to Uponor’s future success. Uponor manages this risk by building its employer brand and developing and training its current employees, e.g. in their leadership skills. Uponor also aims to build networks that complements its own knowhow.
In many countries, Uponor’s operations are regulated by local legislation. For example, Uponor seeks national product approval for a large proportion of the products it sells. Therefore the company closely monitors any laws and regulations related to its products and raw materials under preparation, in order to anticipate their impact on Uponor and its customers. Uponor also participates actively in different trade organisations’ work and aims to influence local and national decision makers in questions related to energy, health and water usage.
Operational risks The prices of raw materials used in the manufacture of plastic pipe systems are susceptible to change, driven by several factors including petrochemical and metal product price fluctuations, supply capacity, market demand among others. In recent years, Uponor has been able to pass most of the effects of such fluctuations onto its selling prices with a reasonable delay. Whenever feasible, Uponor manages the risk of fluctuations in the price of metals and plastics raw materi-als through supply agreements with fixed prices, and by means of financial products. Uponor continuously and systematically uses financial instruments to manage price risks associated with electricity prices at Nordic level.
With respect to component, raw material or services sourcing, Uponor aims to use supplies and raw materials available from several suppliers who are also expected to follow all aspects of Uponor’s Code of Conduct and framework contracts. Wherever only one raw material supplier is used, Uponor seeks to ensure that the supplier has at least two production plants, which manufacture the goods used by Uponor. The company implements systems for material and raw material quality control and supplier accreditation.
Digitalisation and smart solutions expose Uponor to cyber risks. Therefore Uponor is monitoring cyber, data and information threats. Uponor’s business processes are managed by using several IT applications, the most important of which are the ERP systems. A system criticality review and contingency planning are included in the implementation and lifecycle management of major IT systems.
Uponor has adopted a stance of zero tolerance with respect to health & safety, compliance & laws, and environment risks. Uponor applies an ISO 9001 quality management system and an ISO 14001 environmental management system, which ensure consistent quality as well as enhance production safety, environmental law compliance and productivity while reducing the environmental impact and risks of Uponor’s operations.
In its project business operations, Uponor is seeking to manage risks related to issues such as project-specific timing and costs. As far as possible, such risks are covered in project and supplier agreements. In addition, Uponor actively enhances its employees’ project management skills.
Uponor can be exposed to different judicial proceedings. In 2019, such proceedings had no material impact on Uponor’s result.
Financial risksUponor aims to ensure the availability, flexibility and affordability of financing by maintaining sufficient committed credit limit reserves and a well-balanced maturity distribution of loans, as well as by using several reputable and well-rated counterparties and various forms of financing.
The company manages its liquidity through efficient cash management solutions and by applying a risk-averse investment policy, investing solely in low-risk instruments that can be liquidated rapidly and at a clear market price.
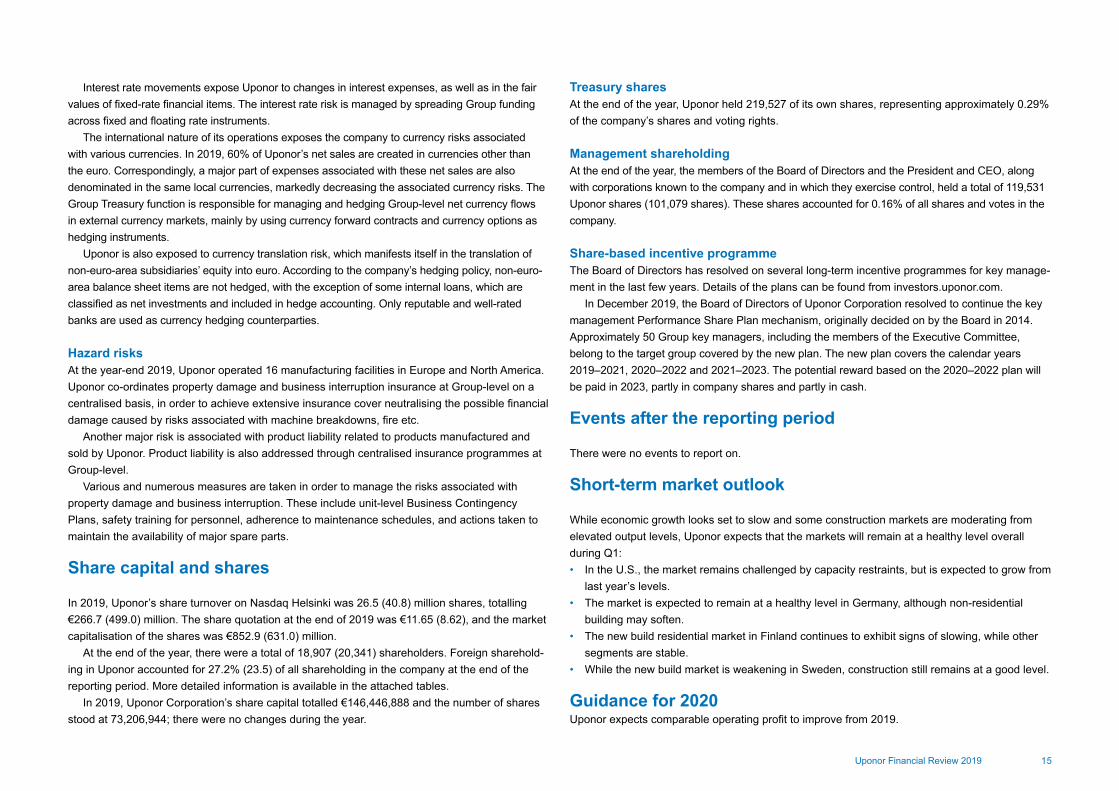
15Uponor Financial Review 2019
Interest rate movements expose Uponor to changes in interest expenses, as well as in the fair values of fixed-rate financial items. The interest rate risk is managed by spreading Group funding across fixed and floating rate instruments.
The international nature of its operations exposes the company to currency risks associated with various currencies. In 2019, 60% of Uponor’s net sales are created in currencies other than the euro. Correspondingly, a major part of expenses associated with these net sales are also denominated in the same local currencies, markedly decreasing the associated currency risks. The Group Treasury function is responsible for managing and hedging Group-level net currency flows in external currency markets, mainly by using currency forward contracts and currency options as hedging instruments.
Uponor is also exposed to currency translation risk, which manifests itself in the translation of non-euro-area subsidiaries’ equity into euro. According to the company’s hedging policy, non-euro-area balance sheet items are not hedged, with the exception of some internal loans, which are classified as net investments and included in hedge accounting. Only reputable and well-rated banks are used as currency hedging counterparties.
Hazard risksAt the year-end 2019, Uponor operated 16 manufacturing facilities in Europe and North America. Uponor co-ordinates property damage and business interruption insurance at Group-level on a centralised basis, in order to achieve extensive insurance cover neutralising the possible financial damage caused by risks associated with machine breakdowns, fire etc.
Another major risk is associated with product liability related to products manufactured and sold by Uponor. Product liability is also addressed through centralised insurance programmes at Group-level.
Various and numerous measures are taken in order to manage the risks associated with property damage and business interruption. These include unit-level Business Contingency Plans, safety training for personnel, adherence to maintenance schedules, and actions taken to maintain the availability of major spare parts.
Share capital and shares
In 2019, Uponor’s share turnover on Nasdaq Helsinki was 26.5 (40.8) million shares, totalling €266.7 (499.0) million. The share quotation at the end of 2019 was €11.65 (8.62), and the market capitalisation of the shares was €852.9 (631.0) million.
At the end of the year, there were a total of 18,907 (20,341) shareholders. Foreign sharehold-ing in Uponor accounted for 27.2% (23.5) of all shareholding in the company at the end of the reporting period. More detailed information is available in the attached tables.
In 2019, Uponor Corporation’s share capital totalled €146,446,888 and the number of shares stood at 73,206,944; there were no changes during the year.
Treasury sharesAt the end of the year, Uponor held 219,527 of its own shares, representing approximately 0.29% of the company’s shares and voting rights.
Management shareholding At the end of the year, the members of the Board of Directors and the President and CEO, along with corporations known to the company and in which they exercise control, held a total of 119,531 Uponor shares (101,079 shares). These shares accounted for 0.16% of all shares and votes in the company.
Share-based incentive programmeThe Board of Directors has resolved on several long-term incentive programmes for key manage-ment in the last few years. Details of the plans can be found from investors.uponor.com.
In December 2019, the Board of Directors of Uponor Corporation resolved to continue the key management Performance Share Plan mechanism, originally decided on by the Board in 2014. Approximately 50 Group key managers, including the members of the Executive Committee, belong to the target group covered by the new plan. The new plan covers the calendar years 2019–2021, 2020–2022 and 2021–2023. The potential reward based on the 2020–2022 plan will be paid in 2023, partly in company shares and partly in cash.
Events after the reporting period There were no events to report on.
Short-term market outlook
While economic growth looks set to slow and some construction markets are moderating from elevated output levels, Uponor expects that the markets will remain at a healthy level overall during Q1:• In the U.S., the market remains challenged by capacity restraints, but is expected to grow from
last year’s levels.• The market is expected to remain at a healthy level in Germany, although non-residential
building may soften.• The new build residential market in Finland continues to exhibit signs of slowing, while other
segments are stable.• While the new build market is weakening in Sweden, construction still remains at a good level.
Guidance for 2020Uponor expects comparable operating profit to improve from 2019.
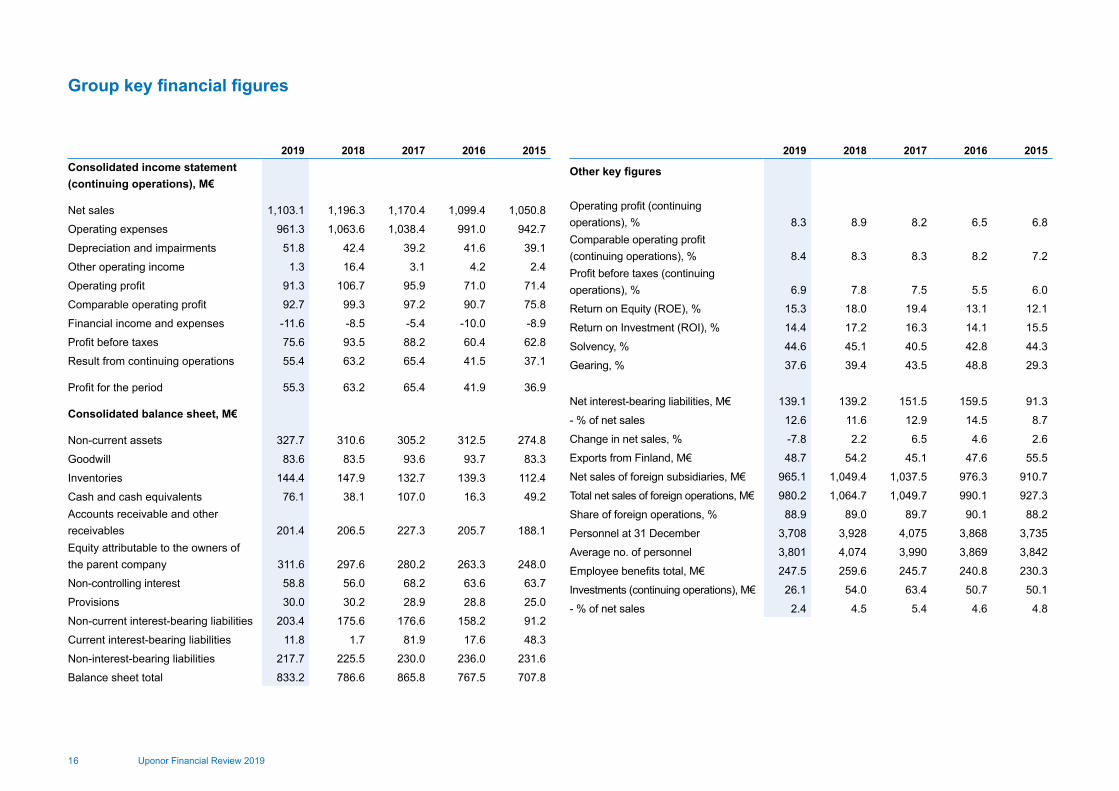
16 Uponor Financial Review 2019
2019 2018 2017 2016 2015Consolidated income statement (continuing operations), M€
Net sales 1,103.1 1,196.3 1,170.4 1,099.4 1,050.8
Operating expenses 961.3 1,063.6 1,038.4 991.0 942.7
Depreciation and impairments 51.8 42.4 39.2 41.6 39.1
Other operating income 1.3 16.4 3.1 4.2 2.4
Operating profit 91.3 106.7 95.9 71.0 71.4
Comparable operating profit 92.7 99.3 97.2 90.7 75.8
Financial income and expenses -11.6 -8.5 -5.4 -10.0 -8.9
Profit before taxes 75.6 93.5 88.2 60.4 62.8
Result from continuing operations 55.4 63.2 65.4 41.5 37.1
Profit for the period 55.3 63.2 65.4 41.9 36.9
Consolidated balance sheet, M€
Non-current assets 327.7 310.6 305.2 312.5 274.8
Goodwill 83.6 83.5 93.6 93.7 83.3
Inventories 144.4 147.9 132.7 139.3 112.4
Cash and cash equivalents 76.1 38.1 107.0 16.3 49.2Accounts receivable and other receivables 201.4 206.5 227.3 205.7 188.1Equity attributable to the owners of the parent company 311.6 297.6 280.2 263.3 248.0
Non-controlling interest 58.8 56.0 68.2 63.6 63.7
Provisions 30.0 30.2 28.9 28.8 25.0
Non-current interest-bearing liabilities 203.4 175.6 176.6 158.2 91.2
Current interest-bearing liabilities 11.8 1.7 81.9 17.6 48.3
Non-interest-bearing liabilities 217.7 225.5 230.0 236.0 231.6
Balance sheet total 833.2 786.6 865.8 767.5 707.8
Group key financial figures
2019 2018 2017 2016 2015
Other key figures
Operating profit (continuing operations), % 8.3 8.9 8.2 6.5 6.8Comparable operating profit (continuing operations), % 8.4 8.3 8.3 8.2 7.2Profit before taxes (continuing operations), % 6.9 7.8 7.5 5.5 6.0
Return on Equity (ROE), % 15.3 18.0 19.4 13.1 12.1
Return on Investment (ROI), % 14.4 17.2 16.3 14.1 15.5
Solvency, % 44.6 45.1 40.5 42.8 44.3
Gearing, % 37.6 39.4 43.5 48.8 29.3
Net interest-bearing liabilities, M€ 139.1 139.2 151.5 159.5 91.3
- % of net sales 12.6 11.6 12.9 14.5 8.7
Change in net sales, % -7.8 2.2 6.5 4.6 2.6
Exports from Finland, M€ 48.7 54.2 45.1 47.6 55.5
Net sales of foreign subsidiaries, M€ 965.1 1,049.4 1,037.5 976.3 910.7
Total net sales of foreign operations, M€ 980.2 1,064.7 1,049.7 990.1 927.3
Share of foreign operations, % 88.9 89.0 89.7 90.1 88.2
Personnel at 31 December 3,708 3,928 4,075 3,868 3,735
Average no. of personnel 3,801 4,074 3,990 3,869 3,842
Employee benefits total, M€ 247.5 259.6 245.7 240.8 230.3
Investments (continuing operations), M€ 26.1 54.0 63.4 50.7 50.1
- % of net sales 2.4 4.5 5.4 4.6 4.8

17Uponor Financial Review 2019
M€ 2019 2018 2017 2016 2015
Items affecting comparability
- restructuring charges -1.4 -8.2 -3.4 -19.7 -6.2
- capital gains and losses on sale of non-current assets - 15.7 2.1 - 1.9
- total items affecting comparability in operating profit -1.4 7.4 -1.3 -19.7 -4.3
Items affecting comparability, total -1.4 7.4 -1.3 -19.7 -4.3
Comparable gross profit
- Gross profit 381.9 400.8 394.1 376.0 370.2
- Less: Items affecting comparability in gross profit -0.1 - -1.0 -7.9 -0.8
Comparable gross profit 382.0 400.8 395.1 383.9 371.0
% of sales 34.6 33.5 33.7 34.9 35.3
Comparable operating profit
- Operating profit 91.3 106.7 95.9 71.0 71.4
- Less: Items affecting comparability in operating profit -1.4 7.4 -1.3 -19.7 -4.3
Comparable operating profit 92.7 99.3 97.2 90.7 75.8
% of sales 8.4 8.3 8.3 8.2 7.2
Items affecting comparability and reconciliations to IFRS

18 Uponor Financial Review 2019
The definitions of key ratios are shown on page 19.
1) Proposal of the Board of Directors
The average number of shares is adjusted with treasury shares.
2019 2018 2017 2016 2015
Share capital, M€ 146.4 146.4 146.4 146.4 146.4
Number of shares at 31 December, in thousands 73,207 73,207 73,207 73,207 73,207
Number of shares outstanding, in thousands
- at end of year 72,987 72,962 73,148 73,138 73,109
- average 72,983 73,123 73,130 73,133 73,106
Total equity attributable to the owners of the parent company, M€ 311.6 297.6 280.2 263.3 248.1
Share trading, M€ 266.7 499.0 545.5 297.7 384.1
Share trading, in thousands 26,537 40,763 35,077 20,339 27,590
- of average number of shares, % 36.4 55.7 48.0 27.8 37.7
Market value of share capital, M€ 852.9 631.0 1,228.4 1,208.6 995.6
Earnings per share (diluted), € 0.72 0.72 0.83 0.58 0.51
Equity per share, € 4.26 4.07 3.83 3.60 3.39
Dividend, M€ 38.71) 37.2 35.8 33.6 32.2
Dividend per share, € 0.531) 0.51 0.49 0.5 0.4
Effective share yield, % 4.5 5.9 2.9 2.8 3.2
Dividend per earnings, % 73.6 70.8 59.0 79.3 86.3
P/E ratio 16.2 12.0 20.2 28.5 26.7
Issue-adjusted share prices, €
- highest 12.37 17.62 17.79 17.35 17.30
- lowest 8.52 8.13 13.30 11.13 10.42
- average 10.05 12.24 15.55 14.64 13.92
Share-specific key figures

19Uponor Financial Review 2019
Definitions of key ratios
Return on Equity (ROE), % =Profit before taxes – taxes
x 100Total equity, average
Return on Investment (ROI), % =
Profit before taxes + interest and other financing costs
x 100Balance sheet total – non-interest-bearing liabilities, average
Solvency, % =Total equity
x 100Balance sheet total – advance payments received
Gearing, % =Net interest-bearing liabilities
x 100Total equity
Net interest-bearing liabilities =Interest-bearing liabilities – cash, bank receivables and financial assets excluding restricted cash
Earnings per share (EPS) =Profit for the period attributable to equity holders of parent companyAverage number of shares adjusted for share issue in financial period excluding treasury shares
Equity per share ratio =
Equity attributable to the owners of the parent company Number of shares adjusted for share issue at end of year
Dividend per share ratio =Dividend per share
x 100Earnings per share
Effective dividend yield =Dividend per share
x 100Share price at the end of financial period
Price – Earnings ratio (P/E) =Share price at the end of financial periodEarnings per share
Market value of shares =Number of shares at the end of financial period x last trading price
Average share price =Total value of shares traded (€) Total number of shares traded
Gross profit margin , % =Gross profit
x 100Net sales
Operating profit margin, % =Operating profit
x 100Net sales
Comparable gross profit = Gross profit – items affecting comparability*
Comparable gross profit margin, % =Gross profit – items affecting comparability*
x 100Net sales
Comparable operating profit = Operating profit – items affecting comparability*
Comparable operating profit margin, %
=Operating profit – items affecting comparability*
x 100Net sales
*) Items affecting comparability are exceptional transactions that are not related to normal business operations. The most common items
affecting comparability are capital gains and losses, inefficiencies in production related to manufacturing facility closures, additional
write-downs, or reversals of write-downs, expenses due to accidents and disasters, provisions for planned restructurings, environmental
matters, penalties, and changes in legislation and legal proceedings. The Group’s management exercises its discretion when taking
decisions regarding the classification of items affecting comparability.

20 Uponor Financial Review 2019
Shareholder No. of shares% of
shares% of
votesOras Invest Ltd 18,030,780 24.6 24.7Varma Mutual Pension Insurance Company 3,862,072 5.3 5.3Investment Fund Nordea Nordic Small Cap 3,182,639 4.3 4.4Mandatum Life Insurance Company Limited 2,074,033 2.8 2.8Ilmarinen Mutual Pension Insurance Company 2,009,000 2.7 2.8Sigrid Jusélius Foundation 926,286 1.3 1.3Paasikivi Pekka 846,500 1.2 1.2The State Pension Fund 655,000 0.9 0.9Paasikivi Jukka 588,173 0.8 0.8Paasikivi Pertti 558,888 0.8 0.8Elo Mutual Pension Insurance Company 409,450 0.6 0.6Nordea Pro Finland Fund 382,992 0.5 0.5Others 39,461,604 53.9 53.8Total 72,987,417 99.7 100.0
Own shares held by the company 219,527 0.3 -Grand total 73,206,944 100.0 100.0
Nominee registered shares on 31 December 2019Nordea Bank AB (publ.), Finnish Branch 10,731,922 14.7 14.7Skandinaviska Enskilda Banken Ab (publ.) Helsinki Branch 7,142,921 9.8 9.8Svenska Handelsbanken AB (publ.), Branch Operation in Finland 853,804 1.2 1.2Others 993,428 1.4 1.4Total 19,722,075 26.9 27.0
Category No. of shares % of shares
Private non-financial corporations 20,611,925 28.2
Public non-financial corporations 5,419 0.0
Financial and insurance corporations 8,968,385 12.3
General government 7,458,326 10.2
Non-profit institutions 2,546,632 3.5
Households 13,685,322 18.7
Foreign (including nominee registrations) 19,930,935 27.2
Other (joint account) 0 0.0
Total 73,206,944 100.0
Shares per shareholderNo. of shares,
total% of share
capitalNo. of
shareholders% of
shareholders
1–100 336,047 0.5 5,863 31.0
101–1,000 4,197,247 5.7 10,380 54.9
1,001–10,000 6,544,327 8.9 2,448 12.9
10,001–100,000 4,900,918 6.7 177 0.9
100 001–1,000,000 10,195,038 13.9 32 0.2
1,000,001– 47,033,367 64.2 7 0.0
Total 73,206,944 100.0 18,907 100.0
Date Reason Change, € Share capital,€Number of
shares
2019 31 Dec 146,446,888 73,206,944
2018 31 Dec 146,446,888 73,206,944
2017 31 Dec 146,446,888 73,206,944
2016 31 Dec 146,446,888 73,206,944
2015 31 Dec 146,446,888 73,206,944
Shares and shareholdersThe volume of Uponor shares traded on the NASDAQ OMX Helsinki Exchange in 2019 totalled 26,536,803, valued at €266.7 million.
The share closed at € 11.65 and the market capitalisation came to €852.9 million. The year-end number of shareholders totalled 18,907
of which foreign shareholders accounted for 27.2 (23.5) per cent.
The maximum number of votes which may be cast at the Annual General Meeting is 72,987,417 (status on 31 December 2019).
At the end of the financial period the company held a total of 219,527 own shares corresponding to the same number of votes. These
shares do not entitle to vote in the Annual General Meeting.
The Paasikivi family has shareholdings directly and through Oras Invest Ltd totalling 27.8 (26.9) per cent.
Major shareholders on 31 December 2019
Shareholders by category on 31 December 2019
Shareholders by size of holding on 31 December 2019
Share capital development 2015–2019

21Uponor Financial Review 2019
M€ Note 2019 % 2018 %
Net sales 2 1,103.1 100.0 1,196.3 100.0
Cost of goods sold 721.2 65.4 795.5 66.5
Gross profit 381.9 34.6 400.8 33.5
Other operating income 4 1.3 0.1 16.4 1.4
Dispatching and warehousing expenses 32.2 2.9 33.7 2.8
Sales and marketing expenses 180.0 16.3 191.3 16.0
Administration expenses 58.3 5.3 60.0 5.0
Other operating expenses 4 21.4 1.9 25.5 2.1
Expenses 291.9 26.5 310.5 26.0
Operating profit 2 91.3 8.3 106.7 8.9
Financial income 7 8.5 0.8 14.4 1.2
Financial expenses 7 20.2 1.8 22.9 1.9Share of result in associated companies and joint ventures -4.0 -0.4 -4.7 -0.4
Profit before taxes 75.6 6.9 93.5 7.8
Income taxes 8 20.3 1.8 30.3 2.5
Profit for the period 55.3 5.0 63.2 5.3
Consolidated statement of comprehensive income M€ Note 2019 % 2018 %
Other comprehensive incomeItems that will not be reclassified subsequently to profit or loss:Re-measurements on defined benefit pensions, net of taxes -1.9 -1.1Items that may be reclassified subsequently to profit or loss:Translation differences 1.9 1.2
Cash flow hedges, net of taxes -1.8 1.6
Net investment hedges - -0.7Other comprehensive income for the period, net of taxes -1.8 1.0
Total comprehensive income for the period 53.5 64.2
Profit for the period attributable to
Equity holders of parent company 52.3 52.8
Non-controlling interest 3.0 10.4
Total comperensive income for the period attributable to
Equity holders of parent company 50.8 54.0
Non-controlling interest 2.8 10.2
Earnings per share, € 9 0.72 0.72
Diluted earnings per share, € 0.72 0.72
Consolidated financial statements (IFRS)

22 Uponor Financial Review 2019
Consolidated balance sheet
M€ Note 31 Dec 2019 % 31 Dec 2018 %
ASSETS
Non-current assets
Intangible assetsIntangible rights 8.3 10.5
Goodwill 83.6 83.5
Customer relationship value 1.9 3.8
Technology 0.3 0.5
Other intangible assets 2.4 2.5
Investment in progress 0.2 0.2
Total intangible assets 10 96.7 11.6 101.0 12.8
Tangible assetsLand and water areas 14.7 13.8
Buildings and structures 101.8 76.3
Machinery and equipment 121.5 122.1
Other tangible assets 24.7 16.2
Construction work in progress 23.1 29.9
Total tangible assets 11 285.8 34.3 258.3 32.8
Securities and long-term invest-mentsInvestments in associated companies and joint ventures 13 10.9 13.7
Other shares and holdings 0.7 0.2
Non-current receivables 14 8.3 11.8Total securities and long-term investments 19.8 2.4 25.7 3.3
M€ Note 31 Dec 2019 % 31 Dec 2018 %
Deferred tax assets 19 9.1 1.1 9.1 1.2
Total non-current assets 411.3 49.4 394.1 50.1
Current assets
Inventories 15 144.4 17.3 147.9 18.8
Current receivablesAccounts receivables 157.7 168.5
Current income tax receivables 10.5 8.2
Accruals 1.5 2.0
Other receivables 31.8 27.8
Total current receivables 16 201.4 24.2 206.5 26.3
Cash and cash equivalents 17 76.1 9.1 38.1 4.8
Total current assets 421.9 50.6 392.5 49.9
Total assets 833.2 100.0 786.6 100.0

23Uponor Financial Review 2019
M€ Note 31 Dec 2019 % 31 Dec 2018 %SHAREHOLDERS’ EQUITY AND LIABILITIES
Equity attributable to the owners of the parent company 18
Share capital 146.4 146.4
Share premium 50.2 50.2
Other reserves 1.5 3.3
Translation reserve -7.6 -9.7
Retained earnings 68.8 54.6
Profit for the period 52.3 52.8Total equity attributable to the owners of the parent company 311.6 37.4 297.6 37.8
Non-controlling interest 30 58.8 56.0
Total equity 370.4 44.5 353.6 45.0
Liabilities
Non-current liabilitiesInterest-bearing liabilities 22, 23 203.4 175.6
Employee benefit obligations 20 21.5 19.6
Provisions 21 4.3 5.2
Deferred tax liabilities 19 10.7 12.3
Other non-current liabilities 0.0 0.0
Total non-current liabilities 239.9 28.8 212.7 27.0
M€ Note 31 Dec 2019 % 31 Dec 2018 %
Current liabilitiesInterest bearing liabilities 22, 23 11.8 1.7
Accounts payable 65.5 72.0
Current income tax liability 1.0 6.1
Provisions 21 25.8 25.0
Other current liabilities 24 118.8 115.5
Total current liabilities 223.0 26.8 220.3 28.0
Total liabilities 462.8 55.5 433.0 55.0
Total shareholders' equity and liabilities 833.2 100.0 786.6 100.0

24 Uponor Financial Review 2019
Consolidated cash flow statement
M€ Note 1 Jan - 31 Dec 2019 1 Jan - 31 Dec 2018
Cash flow from operations
Net cash from operationsProfit for the period 55.3 63.2
Adjustments for:
Depreciation 51.8 42.4
Dividend income -0.2 0.0
Income taxes 20.3 30.3
Interest income -0.3 -0.6
Interest expense 3.4 3.4 Sales gains/losses from the sale of businesses and fixed assets -0.6 -15.9 Share of profit in associated companies and joint ventures 4.0 4.7
Other cash flow adjustments -1.1 -5.0
Net cash from operations 132.6 122.5
Change in net working capitalReceivables 11.8 -16.1
Inventories 2.8 -25.0
Non-interest-bearing liabilities -6.7 13.0
Change in net working capital 8.0 -28.1
Income taxes paid -28.4 -12.3
Interests paid -3.3 -2.8
Interests received 0.3 0.6
Cash flow from operations 109.2 79.9
M€ Note 1 Jan - 31 Dec 2019 1 Jan - 31 Dec 2018
Cash flow from investmentsProceeds from disposal of subsidiaries and businesses 3 3.2 53.8
Acquisition of joint ventures -1.3 -8.1
Acquisition of other shares -0.5 -
Purchase of fixed assets -26.1 -54.0
Proceeds from sale of fixed assets 3.1 0.9
Dividends received 0.4 0.2
Loan granted and repayments 0.4 0.0
Cash flow from investments -20.8 -7.2
Cash flow before financing 88.4 72.7
Cash flow from financingBorrowings of debt - 0.2
Repayments of debt -1.5 -80.1
Change in other short term debt 0.0 -0.4
Dividends paid -37.2 -35.8
Purchase of own shares - -1.9Repayment of capital to Infra Oy's non-controlling interest - -22.4
Payment of lease liabilities -11.8 -1.0
Cash flow from financing -50.6 -141.4
Conversion differences for cash and cash equivalents 0.2 -0.2
Change in cash and cash equivalents 38.0 -68.9
Cash and cash equivalents at 1 January 38.1 107.0
Cash and cash equivalents at 31 December 76.1 38.1
Changes according to balance sheet 17 38.0 -68.9
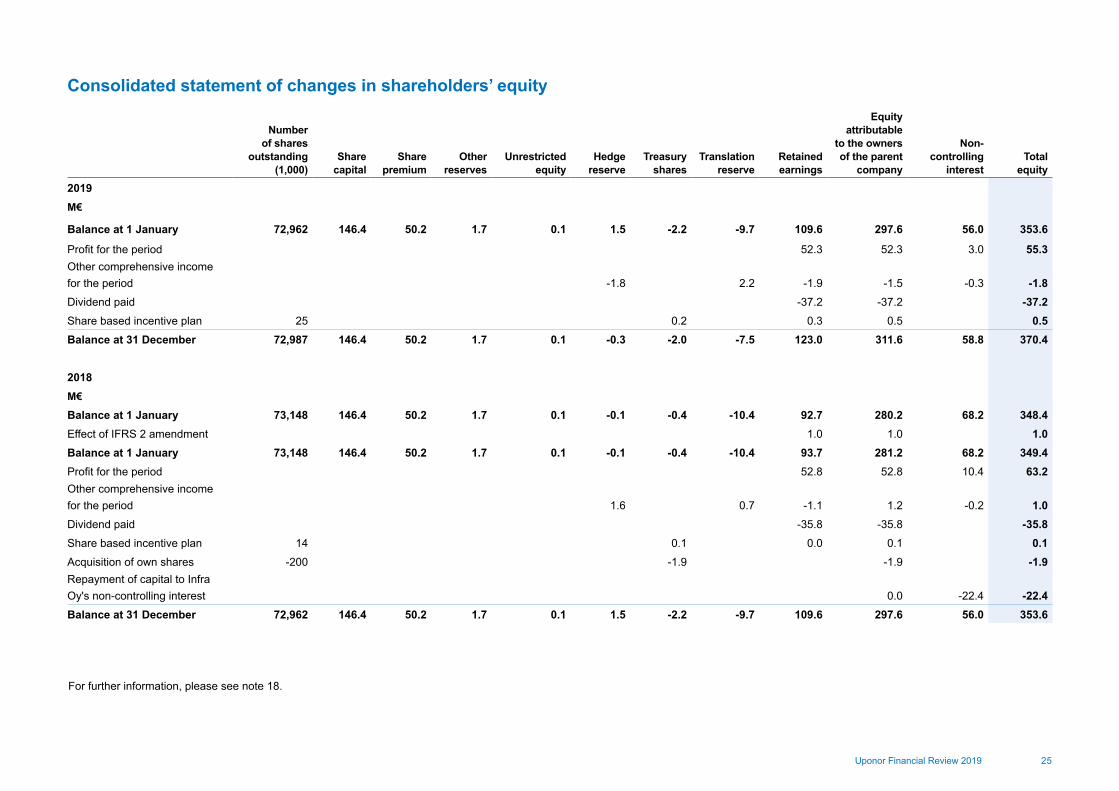
25Uponor Financial Review 2019
Number of shares
outstanding (1,000)
Share capital
Share premium
Other reserves
Unrestricted equity
Hedge reserve
Treasury shares
Translation reserve
Retained earnings
Equity attributable
to the owners of the parent
company
Non-controlling
interestTotal
equity
2019M€
Balance at 1 January 72,962 146.4 50.2 1.7 0.1 1.5 -2.2 -9.7 109.6 297.6 56.0 353.6
Profit for the period 52.3 52.3 3.0 55.3Other comprehensive income for the period -1.8 2.2 -1.9 -1.5 -0.3 -1.8Dividend paid -37.2 -37.2 -37.2Share based incentive plan 25 0.2 0.3 0.5 0.5Balance at 31 December 72,987 146.4 50.2 1.7 0.1 -0.3 -2.0 -7.5 123.0 311.6 58.8 370.4
2018M€
Balance at 1 January 73,148 146.4 50.2 1.7 0.1 -0.1 -0.4 -10.4 92.7 280.2 68.2 348.4Effect of IFRS 2 amendment 1.0 1.0 1.0Balance at 1 January 73,148 146.4 50.2 1.7 0.1 -0.1 -0.4 -10.4 93.7 281.2 68.2 349.4Profit for the period 52.8 52.8 10.4 63.2Other comprehensive income for the period 1.6 0.7 -1.1 1.2 -0.2 1.0Dividend paid -35.8 -35.8 -35.8Share based incentive plan 14 0.1 0.0 0.1 0.1Acquisition of own shares -200 -1.9 -1.9 -1.9Repayment of capital to Infra Oy's non-controlling interest 0.0 -22.4 -22.4Balance at 31 December 72,962 146.4 50.2 1.7 0.1 1.5 -2.2 -9.7 109.6 297.6 56.0 353.6
Consolidated statement of changes in shareholders’ equity
For further information, please see note 18.

26 Uponor Financial Review 2019
Notes to the consolidated financial statements
1. Accounting principles
Company profileUponor is an international industrial group providing building and municipal infrastructure solutions. Uponor Group’s segment structure consists of the following three reporting segments: Building Solutions – Europe, Building Solutions – North America and Uponor Infra. Its segment business risks and profitability factors differ from each other with respect to the market and business environment as well as offering, services and customers. Group management, control and reporting structures are organised according to the business segments.
Uponor Group’s parent company is Uponor Corporation, domiciled in Helsinki in the Republic of Finland. Its registered address is:
Uponor CorporationP.O. Box 37 (street address: Äyritie 20)FI-01511 VantaaFinlandBusiness ID: 0148731-6Tel. +358 (0)20 129 211
The Financial Statements will also be available on the company website at investors.uponor.com and can be ordered from Uponor Corporation at the above-mentioned address.
At its meeting of 12 February 2020, Uponor Corporation’s Board of Directors approved the publication of these financial statements. According to the Finnish Limited Liability Companies Act, the shareholders have the opportunity to approve or reject the financial statements at the Annual General Meeting to be held after their publication. Furthermore, the Annual General Meeting can decide on the modification of the financial statements.
Basis of preparationUponor Group’s consolidated financial statements have been prepared in compliance with the International Financial Reporting Standards (IFRS), including International Accounting Standards (IAS) and their SIC and IFRIC interpretations valid on 31 December 2019. In the Finnish Accounting Act and ordinances based on the provisions of the Act, IFRS refer to the standards and their interpretations adopted in accordance with the procedures as set in regulation (EC) No 1606/2002 of the European Parliament and of the European Council. The consolidated financial statements also include additional information required by the Finnish Accounting Act and the
Limited Liability Companies Act. The consolidated financial statements are presented in millions of euros (M€) and are based on the historical cost convention, unless otherwise specified in the accounting principles section below. All figures presented have been rounded and consequently, the sum of individual figures might differ from the presented total figure. The percentages reported have been calculated from the exact figures and not from the rounded figures published.
Use of estimatesThe preparation of consolidated financial statements under IFRS requires the use of estimates and assumptions affecting the reported amounts of assets and liabilities and the disclosure of contingent assets and liabilities on the date of the financial statements, as well as the reported amounts of income and expenses during the report period. Although these estimates are based on the management’s best view of current events and actions, the actual results may ultimately differ from these estimates. In addition, judgement is required in the application of accounting policies.
Consolidation principlesThe consolidated financial statements include the parent company, Uponor Corporation, and all companies in which the parent company holds more than half of the voting rights, either directly or through its subsidiaries. Subsidiaries include those companies in which Uponor Corporation has direct or indirect control of over 50 per cent of the voting rights or otherwise has power to govern the financial and operating policies, with the purpose of gaining financial benefit from their operations. Subsidiaries acquired or established during the year are included from the date the Group obtained control. Divested companies have been included up to their date of sale.
Intra-Group shareholdings are eliminated using the acquisition cost method. Accordingly, the assets and liabilities of an acquired company are measured at fair value on the date of acquisi-tion. The excess of the acquisition cost over the fair value of the net assets has been recorded as goodwill. Based on the First-Time-Adoption of IFRS 1, any company acquisitions made prior to the IFRS transition date (1 January 2004) are not adjusted for IFRS, but book value according to Finnish Accounting Standards (FAS) is applied to goodwill amounts. Intra-Group transactions, receivables, liabilities, unrealised gains and dividends between Group companies are eliminated in the consolidated financial statements.
Associated companies are entities over which the Group has 20–50 per cent of the voting rights, or over which the Group otherwise exercises a major influence. Joint ventures are arrangements in which the Group has a joint control with another entity. Holdings in associated companies and joint ventures over which the Group does not have over 50 per cent ownership

27Uponor Financial Review 2019
of the voting rights or over which the Group does not excise a major influence are included in the consolidated financial statements using the equity method. Accordingly, the share of post-acquisition profits and losses are recognised in the income statement to the extent of the Group’s holding in the associated companies and joint ventures. When the Group’s share of losses exceeds the carrying amount it is reduced to nil and any recognition of further losses ceases unless the Group has an obligation to fulfil the associated company’s or joint ventures’ obliga-tions. Joint ventures over which the Group has over 50 per cent ownership of the voting rights or over which the Group otherwise exercises a major influence are included in the consolidated financial statements using the acquisition cost method.
Foreign currency translations and exchange rate differencesEach company translates its foreign currency transactions into its own functional currency, using the rate of exchange prevailing on the transaction date. Outstanding monetary receivables and payables in foreign currencies are stated using the exchange rates on the balance sheet date. Exchange rate gains and losses on actual business operations are treated as sales adjustment items or adjustment items to materials and services. Exchange rate gains and losses on financial transactions are entered as exchange rate differences in financial income and expenses.
In the consolidated financial statements, the income statements of the Group’s foreign subsidiaries are converted into euros using the average exchange rates quoted for the reporting period. All balance sheet items are converted into euros using the exchange rates quoted on the reporting date. The resulting conversion difference and other conversion differences resulting from the conversion of subsidiaries’ equity are shown as a separate item under equity. In addition, in the consolidated financial statements, exchange rate differences in the loans granted by the parent company to foreign subsidiaries in replacement of their equity are treated as translation differences. Realised translation differences in relation to the divestment of subsidiaries and the redemption of material shares in subsidiaries are recognised as income or expenses in the consolidated statement of comprehensive income.
At end of period Average
2019 2018 2019 2018
USD 1.1234 1.1450 1.1195 1.1793
SEK 10.4468 10.2548 10.5824 10.2937
DKK 7.4715 7.4673 7.4660 7.4534
CAD 1.4598 1.5605 1.4822 1.5329
NOK 9.8638 9.9483 9.8444 9.6268
PLN 4.2568 4.3014 4.2990 4.2684
Key exchange rates for the euro
Non-current assets held for sale and discontinued operationsNon-current assets held for sale and assets related to discontinued operations are formed once the company, according to a single co-ordinated plan, decides to dispose of a separate significant business unit, whose net assets, liabilities and financial results can be separated operationally and for financial reporting purposes (cash generating unit). Non-current assets held for sale are shown separately in the consolidated balance sheet. Profit or loss from a discontinued operation and gains or losses on its disposal are shown separately in the consolidated statement of comprehensive income. Assets related to non-current assets held for sale and discontinued operations are assessed at book value or, if it is the lower of the two, at fair value. Depreciation from these assets has been discontinued upon the date of classifying assets as non-current assets held for sale and discontinued operations. The Group has no assets classified as non-current assets held for sale or discontinued operations at the end of the financial or a comparable period.
Revenue from contracts with customers This accounting policy highlights Group’s revenue recognition methods as well as gives the necessary information for the user of the financial statements to understand the performance obligations, timing of revenue recognition and significant judgments made by the management.
Uponor Group is in the business of providing systems and solutions for safe drinking water delivery, energy-efficient radiant heating and cooling, and reliable infrastructure. The revenue streams can be divided into two groups: sale of goods and rendering of services including project business and water monitoring services. The Group is acting as principal in all the customer contracts as the Group provides the goods and services itself to a customer and controls the specified goods and services before they are transferred to a customer.
Significant management’s judgement has been applied in the following areas:• Identifying performance obligations in project business• Assessing the right to payment for performance completed date in project business• Timing of revenue recognition (sale of goods and rendering of services)• Right of return (sale of goods)• Determination of the amount of variable consideration (sale of goods and rendering of services)These significant management’s judgements have been further elaborated in this disclosure.
Sale of goodsThe sale of goods includes products such as pipes, chambers and water tanks. Each good provided to the customer is distinct from the other products provided to the customer and therefore, each good is considered as a separate performance obligation.
The Group recognises the revenue for the goods at a point in time. When determining the timing of revenue recognition, the Group analyses the delivery terms and customer acceptance clauses in order to define the exact timing of the control being transferred. Certain products

28 Uponor Financial Review 2019
have a right of return, but the Group has assessed that the returns are unlikely and therefore, they are considered immaterial.
The invoicing frequency is linked to the delivery e.g. invoicing takes place when the goods have been delivered.
Rendering of services including project business and Water Monitoring Ser-vicesThe Group has project deliveries in which Uponor is committed to deliver a complete set of goods and services to the customer, which include e.g. planning and design, overall project management and integration services. When the product provided by Uponor includes both goods and services, the Group accounts for the goods and services in the contract as a single performance obligation.
In case a licensing agreement is needed for the good to be fully operating, the good and the license are accounted for as separate performance obligations, as the customer can benefit from the good on its own or together with other readily available resources.
The Group recognises revenue for rendering of services including project business over time, given that the Group’s performance does not create an asset with an alternative use to the Group, the Group has an enforceable right to payment for performance completed to date or the Group’s performance creates or enhances an asset that the customer controls as the asset is created or enhanced. Regarding rendering of services including project business, the Group has concluded to have an enforceable right to payment for performance completed to date. The Group applies the input method to recognise revenue for contracts in the project business. The method is used when the outcome of the project can be estimated reliably. The input method is defined as the proportion of the individual project cost incurred to date from the total estimated project costs. In rendering of services including project business, the payment frequency is linked with the milestones of the project.
Starting from 2019, Uponor has provided cloud-based Water Monitoring Services relating to monitoring of water consumption, quality and leakages for both private consumers and municipal networks. The services include a device, application and accompanied services. These services are considered to be highly interdependent and are therefore treated as one performance obligation.
The Water Monitoring Services are invoiced based on a fixed monthly fee, including all components relating to the services. The contract term is fixed for 30-36 months and continues thereafter as ongoing until further notice. The Group recognises revenue for the services over time, as the customer simultaneously receives and consumes the benefits provided by Uponor’s performance as Uponor performs.
Variable considerationThe amount of consideration that the Group is entitled to may vary due to items of variable consideration. Relevant variable consideration for the Group includes rebates, returns, refunds,
penalties and marketing fees. Sale of goods may typically include variable considerations such as bonuses, returns and
marketing support. The bonuses are fixed in nature and the Group accrues for bonuses on a monthly basis. Returns are recognised as refund liability when Uponor does not expect to be entitled to payment for the products delivered or services rendered. Regarding marketing support, when there is a clear linkage between the payments made and the marketing services received, the marketing support is expensed as marketing fees.
Rendering of services included in the project business may typically include variable consideration e.g. penalties for delay and customer claims. Customer claims and penalties are accounted for as revenue adjustments and the amount of variable consideration to be constrained is estimated regularly.
The Group estimates the amount of variable consideration at the contract inception. The amount of variable consideration is estimated by using either the expected value method or the most likely amount method depending on which method better predicts the amount of considera-tion to which the Group will be entitled. The Group selects and applies one method consistently for similar types of contracts when estimating the variable consideration amount.
When estimating the amount of variable consideration in the transaction price, the Group considers whether the amount of variable consideration is constrained. In sale of goods, the application of the constraint does not have a significant impact in terms of revenue recognition as variable considerations in the sale of goods are immaterial. In rendering services including project business, the amount of variable considerations is immaterial, and the likelihood is very minor.
Other topicsWarranties. The Group generally provides warranties for general repairs of defects that exist at the time of sale, as required by law. Warranties are thus assurance-type warranties and are accounted for under IAS 37 Provisions, Contingent Liabilities and Contingent Assets.
Cost to obtain a contract. In general, there are no costs that the Group incurs in obtaining a contract to provide goods and services to customers in sale of goods and in rendering services including project business.
Refund liabilities. A refund liability is the obligation to refund some or all the consideration received (or receivable) from the customer and it is measured at the amount that the Group ultimately expects it will have to return to the customer. At the end of each reporting period, the Group updates its assessment on the amount of refund liabilities.
Significant financing component. The Group’s contracts with customers do not include significant financing components either in sale of goods or in rendering of services including project business.
Non-cash consideration. The Group’s contracts with customers do not include non-cash consideration either in sale of goods or in rendering of services, including project business.

29Uponor Financial Review 2019
Contract balancesContract assets and trade receivables. A contract asset is the right to consideration in exchange for goods or services transferred to the customer. If the Group performs by transferring goods or services to the customer before the customer pays consideration, like in the project business or before payment is due, a contract asset is recognised for the earned consideration that is conditional. In case the Group’s right to an amount of consideration is unconditional (i.e. only the passage of time is required before payment of the consideration is due) the receivable is presented as trade receivable.
In addition, within the water monitoring services, equipment and installation costs relating to the contracts are accounted for as contract costs and thus periodised on a straight-line basis over the contract period.
Furthermore, contract assets are subject to impairment assessment. Refer to accounting policies of financial assets.
Contract liabilities. A contract liability is the obligation to transfer goods or services to a customer for which the Group has received consideration from the customer. If a customer pays consideration before the Group transfers goods or services to the customer, a contract liability is recognised when the payment is received or when the payment is due (whichever is earlier). Contract liabilities are recognised as revenue when the Group performs under the contract. Contract liabilities may arise within the project business and within the water monitoring services.
Research and developmentResearch costs are expensed as incurred and are included in the consolidated statement of comprehensive income in other operating expenses. Development costs are expensed as incurred, unless the criteria for capitalising these costs as assets are met. Product development costs are capitalised as intangible assets and are depreciated during the useful life of the asset, if future economic benefits are expected to flow to the entity and certain other criteria, such as the product’s technical feasibility and commercial usability, are confirmed. The Group does not have any capitalised development costs.
Employee benefitsThe Group’s pension schemes comply with each country’s local rules and regulations. Pensions are based on actuarial calculations or actual payments to insurance companies. The Group applies defined contribution and defined benefit pension plans.
Within the defined contribution plan, pension contributions are paid directly to insurance com-panies and, once the contributions have been paid, the Group has no further payment obligations. These contributions are recognised in the income statement for the accounting period during which such contributions are made.
For defined benefit pension plans, the liability is the present value of the defined benefit obliga-
tion on the balance sheet date less the fair value of plan assets. The pension obligation is defined using the projected unit credit method. The discount rate applied to calculating the present value of post-employment benefit obligations is determined by the market yields of long-term corporate bonds or government bonds. Costs resulting from the defined benefit pension plans are recognised as expenses for the remaining average period of employment.
Current service cost (benefit expense) and net interest cost on defined benefit obligation (net liability) are recognised in the income statement and presented under employee benefit costs. Re-measurement items on defined benefit plan obligations and plan assets, including actuarial gains and losses and return on plan assets (excluding interest income), are immediately recognised through other comprehensive income and such balances are permanently excluded from the consolidated income statement
Operating profitOperating profit is an income statement item, which is calculated by deducting expenses related to operating activities from net sales.
Borrowing costsBorrowing costs are recognised in the income statement as they incur. Direct transaction expenses due to loans, clearly linked to a specific loan, are included in the loan’s original cost on an accrual basis and recognised as interest expenses using the effective interest method. Interest costs on borrowings to finance the construction of assets are capitalised as part of the cost during the period required to prepare and complete the property for its intended use.
Income taxesIncome taxes in the consolidated statement of comprehensive income comprise taxes based on taxable income recognised for the period by each Group company on an accrual basis, accord-ing to local tax regulations, including tax adjustments from the previous periods and changes in deferred tax. Deferred tax assets or liabilities are calculated, using the liability method, on temporary differences arising between the tax bases of assets and liabilities and their carrying amounts in the financial statements, using the tax rate approved on the balance sheet date. Deferred tax assets are recognised to the extent that it appears probable that future taxable profit will be available, against which temporary differences can be utilised.
Intangible assets
GoodwillGoodwill represents future economic benefits arising from assets that are not capable of being individually identified and separately recognised by the Group. Goodwill represents the excess of the cost of an acquisition over the fair value of the net assets of the acquired company on the

30 Uponor Financial Review 2019
date of acquisition. Goodwill is allocated to the business segments. Goodwill is not amortised, but is tested for impairment annually. Gains and losses on the disposal of a Group entity include any goodwill relating to the entity sold.
Other intangible assetsOther intangible assets include trademarks, patents, copyrights, software licences, technology and customer relations. Intangible assets are recognised in the balance sheet at historical costs less accumulated depreciation, according to the expected useful life and any impairment losses.
Property, plant and equipmentGroup companies’ property, plant and equipment are stated at historical cost less accumulated depreciation, according to the expected useful life and any impairment losses. Interest costs on borrowings to finance the construction of these assets are capitalised as part of the cost during the period required to prepare and complete the property for its intended use.
Ordinary repair and maintenance costs are charged to the income statement during the financial period in which they are incurred. The cost of major renovations is included in the asset’s carrying amount when it is probable that the Group will incur future economic benefits in excess of the originally assessed standard of performance of the existing asset.
Gains or losses on the disposal, divestment or removal from use of property, plant and equipment are based on the difference between the net gains and the balance sheet value. Gains are shown within other operating income and losses under other operating expenses.
DepreciationsGroup companies’ intangible assets and property, plant and equipment are stated at historical cost less accumulated straight-line depreciation, according to their expected useful life and any impairment losses. Land is not depreciated, as it is deemed to have an indefinite life, but depreciation is otherwise based on estimated useful lives as follows:
Years
Buildings 20–40
Production machinery and equipment 8–12
Other machinery and equipment 3–15
Office and outlet furniture and fittings 5–10
Transport equipment 5–7
Intangible assets 3–10
The residual value and useful life of assets are reviewed on each balance sheet date and, if necessary, adjusted to reflect any changes in expectations of financial value.
Government grantsAny grants received for the acquisition of intangible or tangible assets are deducted from the asset’s acquisition cost and recorded on the income statement to reduce the asset’s depreciation. Other grants are recognised as income for the periods during which the related expenses are incurred. Such grants are shown as deductions from expenses related to the target of the grant.
ImpairmentThe balance sheet values of assets are assessed for impairment on a regular basis. Should any indication of an impaired asset exist, the asset’s recoverable amount will be assessed. The asset’s recoverable amount is its net selling price less any selling expenses, or its value in use, whichever is higher. The value in use is determined by reference to the discounted future net cash flow expected from the asset. Discount rates correspond to the cash generating unit’s aver-age return on investment before taxes. Impairment is measured at the level of cash generating units, which is the lowest level that is primarily independent of other units and whose cash flows can be distinguished from other cash flows.
Whenever the asset’s carrying amount exceeds its recoverable amount, it is impaired and the resulting impairment loss is recognised in the income statement. An impairment of property, plant and equipment and other intangible assets, excluding goodwill, will be reversed if, and only if, there has been a change in the estimates used to determine the asset’s recoverable amount since the last impairment loss was recognised. Impairment is not reversed over the balance sheet value that existed before the recognition of impairment losses in the previous financial periods. Any impairment loss on goodwill is not reversed.
Goodwill is assessed for impairment at least annually, or if any indication of impairment exists, more often.
LeasesIFRS 16 Leases became effective on 1 January 2019 and supersedes the IAS 17 standard and related interpretations. The standard sets out the principles for the recognition, measurement, presentation and disclosure of leases.
Uponor adopted IFRS 16 Leases using the modified retrospective method of adoption with the date of initial application of 1 January 2019. Under this method, the standard is applied retrospec-tively with the cumulative effect of initially applying the standard recognised at the date of initial application. This means that the comparatives have not been adjusted for the period ending 31 December 2018. Uponor recognised a right-of-use asset and lease liability for lease contracts previously recognised as operating leases under IAS 17. The right-of-use asset is recognised at an amount equal to the lease liability at the present value of the lease payments that are not paid on 1 January 2019.

31Uponor Financial Review 2019
In the comparison period, prior to the adoption of IFRS 16, lease agreements were classified as either finance leases or operating leases under IAS 17. A lease was classified as a finance lease if it transferred substantially all of the risks and rewards incidental to ownership of the leased asset. Otherwise it was classified as an operating lease. Finance leases were capitalized at the commencement of the lease at the inception date using fair value of the asset or if lower, at the present value of the minimum lease payments. Similarly, lease obligations, deducted by financing expenses, were recognised in interest-bearing liabilities. The finance lease assets were depreciated over their useful life or within the shorter lease term. Interest costs were expensed in the consolidated statement of profit or loss during the lease term. Leases in which the lessor retained risks and rewards incidental to ownership of the asset were classified as operating leases. The rents related to operating leases were recognised as expenses in profit or loss on a straight line basis over the lease term. The undiscounted commitments were presented in the notes to the financial statements.
IFRS 16 requires lessees to account for the majority of lease contracts under a single on-balance sheet model. Lessees recognise a right-of-use asset and a lease liability at the inception of the lease discounted to the present value of future lease payments. Previously recognised operating expenses for leases are replaced by depreciations of the right-of-use assets and interest expenses over the lease term.
Lease liabilitiesAt the commencement date of the lease, Uponor recognises lease liabilities measured at the present value of lease payments to be made over the lease term. The lease payments include fixed payments, inclusive of in-substance fixed payments, less any lease incentives receivable and variable lease payments that depend on an index or a rate, initially measured using the index or rate as at the commencement date. The lease contracts may also contain payments of penal-ties for terminating the leases. Uponor includes the termination penalty in the lease payments if it has determined that there is a reasonable certainty of terminating the lease. VAT is not included in the carrying amount of the leasing liability. Uponor has analysed the expected lease term and thereby assessed whether it is reasonably certain that any options to extend or terminate the agreements will be exercised for the lease contracts.
Uponor calculates the present value of the lease payments using the interest rate implicit in the lease if this is readily available. For contracts where the interest rate implicit in the lease is not readily available, the incremental borrowing rate is used. The incremental borrowing rate is defined in IFRS 16 as the rate of interest that a lessee would have to pay to borrow over a similar term, and with a similar security, the funds necessary to obtain an asset of a similar value to the right-of-use asset in a similar economic environment. Uponor has determined the incremental borrowing rates taking into consideration the financial environment of the contract, the maturity of the lease agreements as of 31 December 2018 and the different economic environments. Based
on these factors Uponor uses an interest rate matrix to determine the appropriate discount rate in different lease contracts where the interest rate implicit in the lease is not readily available.
Right-of-use assetsUponor recognises right-of-use assets at the commencement date of the lease which is the date when the underlying asset is available for use. Right-of-use assets are measured at cost less any accumulated depreciation and impairment losses, and adjusted for any remeasurement of lease liabilities. The cost of right-of-use assets includes the amount of lease liabilities recognised, initial direct costs incurred, and lease payments made at or before the commencement date less any lease incentives received.
Unless the Group is reasonably certain to obtain ownership of the leased asset at the end of the lease term, the recognised right-of-use assets are depreciated on a straight-line basis over the shorter of its estimated useful life and the lease term as follows:
Buildings 3–10 yearsLand and water 3–45 yearsMachinery and equipment 3–15 yearsOther tangible assets 3–10 years
Right-of-use assets are subject to impairment in future periods.
Short-term leases and leases of low-value assetsUponor applies the short-term lease recognition exemption to its short-term leases and does not recognise at 1 January 2019 leases with a lease term of 12 months or less from the commencement date. In determining whether a contract is a short-term contract Uponor takes into account reasonable certainty of exercising extension and termination options similarly as for other leases. If a lease contains a purchase option, Uponor does not consider it to be a short-term lease. Lease payments relating to short-term leases are recognised as an expense on a straight-line basis over the lease term.
Uponor also applies the recognition exemption related to leases of low-value assets and recognises leases of low-value assets as an expense on a straight-line basis over the lease term. In determining whether a lease contains a low-value asset, Uponor considers the value of the underlying asset when new and not in its current age and condition.
Significant judgment IFRS 16 requires lessees to determine the lease term as the non-cancellable period of a lease adjusted with any option to extend or terminate the lease, if the use of such option is reasonably certain. Uponor has analysed the expected lease term and thereby assessed whether it is reasonably certain that any options to extend or terminate the agreements will be exercised for the lease contracts. Uponor has lease agreements with either a fixed lease term or which are valid until further notice.
32 Uponor Financial Review 2019
Uponor evaluates the lease term on a case by case basis. For lease agreements valid until further notice, Uponor has determined the lease term using the expected termination date based on its best estimate. Uponor considers any significant leasehold improvements undertaken over the term, costs relating to the termination of the lease, such as negotiation costs, relocation costs, costs of identifying another underlying asset suitable for the lessee’s needs, costs of integrating a new asset into the lessee’s operations, or termination penalties and similar costs, including costs associated with returning the underlying asset in a contractually specified condition or to a contractually specified location. Additionally, the importance of that underlying asset to the lessee’s operations is considered, for example, whether the underlying asset is a specialised asset, the location of the underlying asset and the availability of suitable alternatives. Uponor will revise the lease term if there is a change in the non-cancellable period of a lease.
InventoriesInventories are stated at the lower of cost or net realisable value, based on the FIFO principle. The net realisable value is the estimated selling price in the ordinary course of business, less the costs of completion and sale. In addition to the cost of materials and direct labour, an appropriate proportion of production overheads is included in the inventory value of finished products and work in progress.
Provisions Provisions are recognised when the Group has a present legal or constructive obligation as a result of past events, if it is probable that an outflow of resources will be required to settle the obligation or if the settlement of an obligation will cause a legal loss and a reliable estimate of the amount of obligation can be made. Provisions can include e.g. environmental provisions, war-ranty provisions, restructuring costs and onerous contracts. Changes in provisions are included in relevant expenses on the consolidated statement of comprehensive income. The amount of provisions is reviewed on every balance sheet date and the amounts are revised to correspond to the best estimate at that moment.
Contingent assets and liabilitiesA contingent liability is a possible obligation that arises from past events and whose existence will be confirmed only by the occurrence of uncertain future events not wholly within the control of the entity. Such present obligation that probably does not require a settlement of a payment obliga-tion or the amount of which cannot be reliably measured is also considered to be a contingent liability. Contingent liabilities are disclosed in the notes to the financial statements.
Cash and cash equivalentsCash and cash equivalents include cash in hand, deposits held at bank and other short-term, highly liquid investments, whose maturity does not exceed three months. Cash and cash
equivalents are carried in the balance sheet at cost. The bank account credit limit in use is recognised under current interest-bearing liabilities.
Financial assets Financial assets are classified as follows: amortized cost, fair value through other comprehensive income and fair value through profit and loss. Sales and purchase of financial assets are recognised at their trading date.
Fair value through profit and loss include financial assets held for trading and measured at fair value. Financial assets at fair value through profit and loss have been acquired principally for the purpose of generating a profit from short-term fluctuations in market prices. Derivative instruments, for which hedge accounting is not applied, are included in financial assets at fair value through profit and loss. Interest and currency derivatives, for which no hedge accounting is applied, are recognised in the balance sheet at historical cost and valued at fair value on each balance sheet date. Fair value is determined using market prices on the balance sheet date, or the present value of estimated future cash flows. Changes in the fair value of financial assets at fair value through profit and loss, and unrealised and realised gains and losses, are included in financial income and expenses in the period in which they occur. Fair value through profit and loss are presented under the other current assets in the balance sheet.
Amortized cost items are non-derivative assets with fixed or determinable payment dates that are not quoted in the active markets or held for trading purposes. Loans and receivables are measured at amortised cost. Accounts receivable are carried at expected fair value, which is the original invoice amount less the provision made for impairment of these receivables. A provision for impairment of accounts receivable is established when there is objective evidence that the Group will not be able to collect all amounts due according to the original terms of receivables. Significant financial difficulties of the debtor, the probable bankruptcy of the debtor or default in payments are considered as probable indicators of the impairment of accounts receivable. Impairment of a loan receivable is assessed with the same criteria as an impairment of accounts receivable.
Fair value through other comprehensive income assets consist of holdings in listed and non-listed companies and investments. Fair value through other comprehensive assets are measured at fair value based on market prices on the balance sheet date, or using the net present value method of cash flows, or another revaluation model. If the fair value of a holding or investment cannot be measured reliably, it will be measured at cost. Changes in the fair value of other comprehensive income assets are recognised in the fair value reserve under shareholders’ equity, taking tax consequences into account. Changes in the fair value will be re-entered from shareholders’ equity into the consolidated statement of comprehensive income when the asset is disposed of or has lost its value to the extent that an impairment loss must be recognised.

33Uponor Financial Review 2019
Financial liabilities Financial liabilities at fair value through profit and loss are measured at their fair value. This group includes those derivatives for which hedge accounting is not applied and whose fair value is negative.
Other financial liabilities are initially measured at fair value and subsequently measured at amortised cost using the effective interest rate method. Transaction costs are included in the original book value of financial liabilities. Other financial liabilities include non-current and current interest-bearing liabilities and accounts payable.
Derivative contracts and hedge accountingFinancial derivatives are used for hedging purposes and are initially recognised in the balance sheet at fair value and are subsequently re-measured at fair value on each reporting period’s balance sheet date. At the contract date derivatives are classified as either cash flow hedges, hedges of net investments in foreign entities or hedges that hedge accounting is not applied to. For derivatives that hedge accounting is not applied to the changes in fair value are recognised under financial items in the consolidated statement of comprehensive income. The fair values of derivatives are determined on the basis of publicly quoted market prices.
Cash flow hedging is applied to electricity derivatives and interest rate derivatives. Net invest-ment hedging is applied to certain currency derivatives that hedge foreign currency risk in internal loans classified as net investments in foreign entities. Hedge programmes are documented according to the requirements of IFRS 9.
Fair value changes of derivatives, which are designated as cash flow hedges, are recognised in other comprehensive income in the hedge reserve to the extent that the hedge is effective. The spot price part of the fair value changes of currency derivatives designated as hedges of net investment in foreign entities, are recognised in other comprehensive income in the translation differences whereas the interest rate differential part of the fair value changes is recognised under financial items. Accumulated fair value changes in other comprehensive income are released into the consolidated statement of comprehensive income in the period during which the hedged cash flow affects the result, while electricity derivatives are recognised under cost of goods sold and interest rate derivatives under financial items.
The ineffective portion of the fair value change of cash flow hedges is recognised under cost of goods sold for electricity derivatives and under financial items for interest rate derivatives.
Share-based payments – Management incentive schemeThe fair value of share-based incentives have been determined at grant date and is expensed until vesting. The entire share incentive, including the cash-for-taxes portion is recognised in equity. Also the value of the cash portion is based on the grant date value to the extent not granted and expensed.
Treasury sharesTreasury shares are presented in the financial statements as a reduction in shareholders’ equity. Treasury shares are taken into account in calculating key figures and ratios according to IAS 33.
DividendsDividends proposed by the Board of Directors are not recognised in the financial statements until their proposal is approved by the shareholders in the Annual General Meeting.
Accounting policies requiring consideration by management and essential uncertainty factors associated with estimatesEstimates and assumptions regarding the future must be made during the preparation of the financial statements, and the outcome may differ from the estimates and assumptions. Further-more, the application of accounting principles requires consideration.
Group management needs to make decisions regarding the selection and application of accounting principles. These judgements are in particular required in those cases in which the IFRS in force provide the opportunity to choose between various accounting, valuation or presentation methods.
The estimates made in connection with preparing the financial statements reflect the manage-ment’s best view at the time of the closing of the accounts. These estimates are affected by historical experience and assumptions regarding future developments, which are regarded as well-founded at the time of closing the accounts. On a regular basis, the Group monitors the realisation of these estimates and assumptions through internal and external information sources. Any changes in estimates and assumptions are recognised in the financial statements for the period during which such corrections are made, and all subsequent financial periods.
Estimates have been used in determining the size of items reported in the financial state-ments, including, among other things, the realisability of certain asset items, such as deferred tax assets and other receivables, the economic useful life of property, plant and equipment, provisions, pension liabilities and impairment on goodwill.
From the Group’s perspective, the most significant uncertainty factors are related to impair-ment testing on goodwill and the defined benefit-based pension obligations. The application of the related accounting policies requires the use of estimates and assumptions that also have a large impact. Uncertainty factors in connection with impairment testing on goodwill relate to the assumptions made on future cash flows and determining the discount rate. The Group’s weighted average capital cost rate (WACC) determined by reporting segment is used as the discount rate in impairment tests. The book value of the defined benefit-based pension obligation is based on actuarial calculations, which in turn are based on the assumptions and estimates of a discount rate used for assessing plan assets and obligations at their current value, the expected rate of return on plan assets and developments in inflation, salary and wage levels.

34 Uponor Financial Review 2019
New and amended IFRS standards that are effective for the year 2019The following new or revised IFRS standards have been adopted from 1 January 2019 in these consolidated financial statements
IFRS 16 LeasesIFRS 16 Leases became effective on 1 January 2019 and supersedes the IAS 17 standard and related interpretations. The standard sets out the principles for the recognition, measurement, presentation and disclosure of leases.
Uponor adopted IFRS 16 Leases using the modified retrospective method of adoption with the date of initial application of 1 January 2019. Under this method, the standard is applied retrospec-tively with the cumulative effect of initially applying the standard recognised at the date of initial application. This means that the comparatives have not been adjusted for the period ending 31 December 2018. Uponor recognised a right-of-use asset and lease liability for lease contracts previously recognised as operating leases under IAS 17. A reconciliation of lease liabilities on the date of transition with off-statement of financial position commitments as of 31 December 2018 is presented in note 23 Lease liabilities. The right-of-use asset is recognised at an amount equal to the lease liability at the present value of the lease payments that are not paid on 1 January 2019. Consequently, the adoption of IFRS 16 does not have any impact on equity.
In the comparison period, prior to the adoption of IFRS 16, lease agreements were classified as either finance leases or operating leases under IAS 17. A lease was classified as a finance lease if it transferred substantially all of the risks and rewards incidental to ownership of the leased asset. Otherwise it was classified as an operating lease. Finance leases were capitalized at the commencement of the lease at the inception date using fair value of the asset or if lower, at the present value of the minimum lease payments. Similarly, lease obligations, deducted by financing expenses, were recognised in interest-bearing liabilities. The finance lease assets were depreciated over their useful life or within the shorter lease term. Interest costs were expensed in the consoli-dated statement of profit or loss during the lease term. Leases in which the lessor retained risks and rewards incidental to ownership of the asset were classified as operating leases. The rents related to operating leases were recognised as expenses in profit or loss on a straight line basis over the lease term. The undiscounted commitments were presented in the notes to the financial statements.
IFRS 16 requires lessees to account for the majority of lease contracts under a single on-balance sheet model. Lessees recognise a right-of-use asset and a lease liability at the inception of the lease discounted to the present value of future lease payments. Previously recognised operating expenses for leases are replaced by depreciations of the right-of-use assets and interest expenses over the lease term.
Summary of new accounting policies
Lease liabilitiesAt the commencement date of the lease, Uponor recognises lease liabilities measured at the present value of lease payments to be made over the lease term. The lease payments include fixed payments, inclusive of in-substance fixed payments, less any lease incentives receivable and variable lease payments that depend on an index or a rate, initially measured using the index or rate as at the commencement date. The lease contracts may also contain payments of penalties for terminating the leases. Uponor includes the termination penalty in the lease payments if it has determined that there is a reasonable certainty of terminating the lease. VAT is not included in the carrying amount of the leasing liability. Uponor has analysed the expected lease term and thereby assessed whether it is reasonably certain that any options to extend or terminate the agreements will be exercised for the lease contracts.
Uponor calculates the present value of the lease payments using the interest rate implicit in the lease if this is readily available. For contracts where the interest rate implicit in the lease is not readily available, the incremental borrowing rate is used. The incremental borrowing rate is defined in IFRS 16 as the rate of interest that a lessee would have to pay to borrow over a similar term, and with a similar security, the funds necessary to obtain an asset of a similar value to the right-of-use asset in a similar economic environment. Uponor has determined the incremental borrowing rates taking into consideration the financial environment of the contract, the maturity of the lease agreements as of 31 December 2018 and the different economic environments. Based on these factors Uponor uses an interest rate matrix to determine the appropriate discount rate in different lease contracts where the interest rate implicit in the lease is not readily available.
Right-of-use assetsUponor recognises right-of-use assets at the commencement date of the lease which is the date when the underlying asset is available for use. Right-of-use assets are measured at cost less any accumulated depreciation and impairment losses, and adjusted for any remeasurement of lease liabilities. The cost of right-of-use assets includes the amount of lease liabilities recognised, initial direct costs incurred, and lease payments made at or before the commencement date less any lease incentives received.
Unless the Group is reasonably certain to obtain ownership of the leased asset at the end of the lease term, the recognised right-of-use assets are depreciated on a straight-line basis over the shorter of its estimated useful life and the lease term as follows:
Buildings 3–10 yearsLand and water 3–45 yearsMachinery and equipment 3–15 yearsOther tangible assets 3–10 years
Right-of-use assets are subject to impairment in future periods.

35Uponor Financial Review 2019
Short-term leases and leases of low-value assetsUponor applies the short-term lease recognition exemption to its short-term leases and does not recognise at 1 January 2019 leases with a lease term of 12 months or less from the commence-ment date. In determining whether a contract is a short-term contract Uponor takes into account reasonable certainty of exercising extension and termination options similarly as for other leases. If a lease contains a purchase option, Uponor does not consider it to be a short-term lease. Lease payments relating to short-term leases are recognised as an expense on a straight-line basis over the lease term.
Uponor also applies the recognition exemption related to leases of low-value assets and recognises leases of low-value assets as an expense on a straight-line basis over the lease term. In determining whether a lease contains a low-value asset, Uponor considers the value of the underlying asset when new and not in its current age and condition.
Significant judgment IFRS 16 requires lessees to determine the lease term as the non-cancellable period of a lease adjusted with any option to extend or terminate the lease, if the use of such option is reasonably certain. Uponor has analysed the expected lease term and thereby assessed whether it is reasonably certain that any options to extend or terminate the agreements will be exercised for the lease contracts. Uponor has lease agreements with either a fixed lease term or which are valid until further notice.
Uponor evaluates the lease term on a case by case basis. For lease agreements valid until further notice, Uponor has determined the lease term using the expected termination date based on its best estimate.Uponor considers any significant leasehold improvements undertaken over the term, costs relating to the termination of the lease, such as negotiation costs, relocation costs, costs of identifying another underlying asset suitable for the lessee’s needs, costs of integrating a new asset into the lessee’s operations, or termination penalties and similar costs, including costs associated with returning the underlying asset in a contractually specified condition or to a contractually specified location. Additionally, the importance of that underlying asset to the lessee’s operations is considered, for example, whether the underlying asset is a specialised asset, the location of the underlying asset and the availability of suitable alternatives. Uponor will revise the lease term if there is a change in the non-cancellable period of a lease.
Amendments to IFRS 9: Prepayment Features with Negative CompensationThe amendments to IFRS 9 clarify that for the purpose of assessing whether a prepayment feature meets the ‘solely payments of principal and interest’ (SPPI) condition, the party exercising the option may pay or receive reasonable compensation for the prepayment irrespective of the reason for prepayment. In other words, financial assets with prepayment features with negative compensation do not automatically fail SPPI.
Amendments to IAS 28: Long-term Interests in Associates and Joint VenturesThe amendment clarifies that IFRS 9, including its impairment requirements, applies to other financial instruments in an associate or joint venture to which the equity method is not applied. These include long-term interests that, in substance, form part of the entity’s net investment in an associate or joint venture. The Group applies IFRS 9 to such long-term interests before it applies IAS 28. In applying IFRS 9, the Group does not take account of any adjustments to the carrying amount of long-term interests required by IAS 28 (i.e., adjustments to the carrying amount of long-term interests arising from the allocation of losses of the investee or assessment of impair-ment in accordance with IAS 28).
Annual Improvements to IFRS Standards 2015–2017: Cycle Amendments to IFRS 3 Business Combinations, IFRS 11 Joint Arrangements, IAS 12 Income Taxes and IAS 23 Borrowing CostsThe Annual Improvements include amendments to four standards:
IAS 12 Income Taxes. The amendments clarify that the Group should recognise the income tax consequences of dividends in profit or loss, other comprehensive income or equity according to where the entity originally recognised the transactions that generated the distributable profits. This is the case irrespective of whether different tax rates apply to distributed and undistributed profits.
IAS 23 Borrowing Costs. The amendments clarify that if any specific borrowing remains outstanding after the related asset is ready for its intended use or sale, that borrowing becomes part of the funds that an entity borrows generally when calculating the capitalisation rate on general borrowings.
IFRS 3 Business Combinations. The amendments clarify that when the Group obtains control of a business that is a joint operation, the Group applies the requirements for a business combination achieved in stages, including remeasuring its previously held interest (PHI) in the joint operation at fair value. The PHI to be remeasured includes any unrecognised assets, liabilities and goodwill relating to the joint operation.
IFRS 11 Joint Arrangements. The amendments clarify that when a party that participates in, but does not have joint control of, a joint operation that is a business obtains joint control of such a joint operation, the Group does not remeasure its PHI in the joint operation.
Amendments to IAS 19: Employee Benefits Plan Amendment, Curtailment or SettlementThe amendments clarify that the past service cost (or of the gain or loss on settlement) is calculated by measuring the defined benefit liability (asset) using updated assumptions and comparing benefits offered and plan assets before and after the plan amendment (or curtailment or settlement) but ignoring the effect of the asset ceiling (that may arise when the defined benefit plan is in a surplus position). IAS 19 is now clear that the change in the effect of the asset ceiling
36 Uponor Financial Review 2019
that may result from the plan amendment (or curtailment or settlement) is determined in a second step and is recognised in the normal manner in other comprehensive income.
The paragraphs that relate to measuring the current service cost and the net interest on the net defined benefit liability (asset) have also been amended. The Group will now be required to use the updated assumptions from this remeasurement to determine current service cost and net interest for the remainder of the reporting period after the change to the plan. In the case of the net interest, the amendments make it clear that for the period post plan amendment, the net interest is calculated by multiplying the net defined benefit liability (asset) as remeasured under IAS 19.99 with the discount rate used in the remeasurement (also taking into account the effect of contributions and benefit payments on the net defined benefit liability (asset)).
IFRIC 23 Uncertainty over Income Tax Treatments IFRIC 23 sets out how to determine the accounting tax position when there is uncertainty over income tax treatments. The Interpretation requires the Group to:• determine whether uncertain tax positions are assessed separately or as a group; and• assess whether it is probable that a tax authority will accept an uncertain tax treatment used,
or proposed to be used, by an entity in its income tax filings: • If yes, the Group should determine its accounting tax position consistently with the tax
treatment used or planned to be used in its income tax filings. • If no, the Group should reflect the effect of uncertainty in determining its accounting tax
position using either the most likely amount or the expected value method.
New and revised IFRS standards in issue but not yet effectiveAt the date of authorisation of these financial statements, The Group has not applied the following new and revised IFRS standards that have been issued but are not yet effective:• IFRS 17 Insurance Contracts (not yet adopted by the EU)• IFRS 10 Consolidated Financial Statements and IAS 28 (amendments):
Sale or Contribution of Assets between an Investor and its Associate or Joint Venture• Amendments to IFRS 3 Definition of a business• Amendments to IAS 1 and IAS 8 Definition of material• Amendments to IFRS 9, IAS 39 and IFRS 7: Interest Rate Benchmark Reform• Amendments to IAS 1 Classification of Liabilities as Current or Non-Current
(not yet adopted by the EU)The Group does not expect that the adoption of the Standards listed above will have a material impact on the financial statements of the Group in future periods, except as noted below:
IFRS 17 Insurance ContractsThe new Standard establishes the principles for the recognition, measurement, presentation and disclosure of insurance contracts and supersedes IFRS 4 Insurance Contracts.
The Standard outlines a General Model, which is modified for insurance contracts with direct participation features, described as the Variable Fee Approach. The General Model is simplified if certain criteria are met by measuring the liability for remaining coverage using the Premium Allocation Approach.
The General Model uses current assumptions to estimate the amount, timing and uncertainty of future cash flows and it explicitly measures the cost of that uncertainty. It takes into account market interest rates and the impact of policyholders’ options and guarantees.
The Standard is effective for annual reporting periods beginning on or after 1 January 2021, with early application permitted. It is applied retrospectively unless impracticable, in which case the modified retrospective approach or the fair value approach is applied. An exposure draft Amendments to IFRS 17 addresses concerns and implementation challenges that were identified after IFRS 17 was published. One of the main changes proposed is the deferral of the date of initial application of IFRS 17 by one year to annual periods beginning on or after 1 January 2022.
IFRS 10 and IAS 28 (amendments): Sale or Contribution of Assets between an Investor and its Associate or Joint Venture The amendments to IFRS 10 and IAS 28 deal with situations where there is a sale or contribution of assets between an investor and its associate or joint venture. Specifically, the amendments state that gains or losses resulting from the loss of control of a subsidiary that does not contain a business in a transaction with an associate or a joint venture that is accounted for using the equity method, are recognised in the parent’s profit or loss only to the extent of the unrelated investors’ interests in that associate or joint venture. Similarly, gains and losses resulting from the remeasurement of investments retained in any former subsidiary (that has become an associate or a joint venture that is accounted for using the equity method) to fair value are recognised in the former parent’s profit or loss only to the extent of the unrelated investors’ interests in the new associate or joint venture.
The effective date of the amendments has yet to be set by the IASB; however, earlier application of the amendments is permitted.
Amendments to IFRS 3: Definition of a BusinessThe amendments clarify that while businesses usually have outputs, outputs are not required for an integrated set of activities and assets to qualify as a business. To be considered a business an acquired set of activities and assets must include, at a minimum, an input and a substantive process that together significantly contribute to the ability to create outputs.
Additional guidance is provided that helps to determine whether a substantive process has been acquired.
The amendments introduce an optional concentration test that permits a simplified assess-ment of whether an acquired set of activities and assets is not a business. Under the optional concentration test, the acquired set of activities and assets is not a business if substantially all

37Uponor Financial Review 2019
of the fair value of the gross assets acquired is concentrated in a single identifiable asset or group of similar assets.
The amendments are applied prospectively to all business combinations and asset acquisi-tions for which the acquisition date is on or after the first annual reporting period beginning on or after 1 January 2020.
Amendments to IAS 1 and IAS 8: Definition of Material The amendments are intended to make the definition of material in IAS 1 easier to understand and are not intended to alter the underlying concept of materiality in IFRS standards. The concept of ‘obscuring’ material information with immaterial information has been included as part of the new definition.
The threshold for materiality influencing users has been changed from ‘could influence’ to ‘could reasonably be expected to influence’.
The definition of material in IAS 8 has been replaced by a reference to the definition of material in IAS 1. In addition, the IASB amended other Standards and the Conceptual Framework that contain a definition of material or refer to the term ‘material’ to ensure consistency.
The amendments are applied prospectively for annual periods beginning on or after 1 January 2020.
Amendments to IFRS 9, IAS 39 and IFRS 7 Interest Rate Benchmark ReformThe amendments will affect entities that apply the hedge accounting requirements of IFRS 9 or IAS 39 to hedging relationships directly affected by the interest rate benchmark reform. The amendments modify specific hedge accounting requirements, so that entities would apply those hedge accounting requirements assuming that the interest rate benchmark is not altered as a result of the reform. The changes will mandatorily apply to all hedging relationships that are directly affected by the reform. The amendments are not intended to provide relief from any other consequences arising from the reform. If a hedging relationship no longer meets the requirements for hedge accounting for reasons other than those specified by the amended Standards, then discontinuation of hedge accounting is still required. The amendments are applied retrospectively to those hedging relationships that existed at the beginning of the reporting period in which an entity first applies the amendments or were designated thereafter, and to the gain or loss recognised in other comprehensive income that existed at the beginning of the reporting period in which an entity first applies the amendments.
The amendments are effective for annual periods beginning on or after 1 January 2020.
Amendments to IAS 1: Classification of Liabilities as Current or Non-Current The amendments provide a more general approach to the classification of liabilities under IAS 1 based on the contractual arrangements in place at the reporting date. They affect only the presentation of liabilities in the statement of financial position.
The amendments clarify that the classification of liabilities as current or non-current should be based on rights that are in existence at the end of the reporting period and align the wording in all affected paragraphs to refer to the “right” to defer settlement by at least twelve months and make explicit that only rights in place “at the end of the reporting period” should affect the classification of a liability.
The classification is unaffected by expectations about whether an entity will exercise its right to defer settlement of a liability. The amendments also make clear that settlement refers to the transfer to the counterparty of cash, equity instruments, other assets or services.
The amendments are applied retrospectively for annual periods beginning on or after 1 January 2022. Earlier application is permitted.

38 Uponor Financial Review 2019
2. Segment information
Uponor’s segment structure is based on business and geographical segments in accordance with the organisational structure. The reporting segments are Building Solutions – Europe, Building Solutions – North America and Uponor Infra. The business risks and profitability factors differ from each other with respect to the market and business environments, product offering, services and customers. The Group’s management, control and reporting structures are organised by business segment. The reported segments are specified as operating segments, which have not been combined.
Building Solutions – Europe is in charge of the European markets and sales to such non-European countries in which Uponor does not have its own operations. In December 2018, Uponor announced that the company has decided to cease operations in Asia during 2019. Asian operations were reported under Building Solutions – Europe.
Building Solutions – North America is responsible for business operations in the USA and Canada. Building solutions in Uponor mainly refers to indoor climate and plumbing solutions for residential and non-residential buildings. A major part of the building solutions customers are heating, ventilation and air conditioning (HVAC) professionals, such as installers and building companies.
Uponor Infra specialises in municipal infrastructure pipe systems business in Northern Europe and it has also business in Central Europe and had business in North America until end of August 2018. Its products and services, such as sewer and storm water systems and waste water treat-ment systems and project services are sold to municipalities, utilities and pipeline construction and renovation customers.
The ‘Others’ segment includes Group functions. Financial target setting and monitoring mainly focus on figures for segment sales, operating
profit, operative costs and net working capital. Group resources are managed, for instance, by allocating investments to attractive businesses and balancing human resources and competen-cies to match the requirements of business processes.
Segment reporting is based on the Group accounting principles. All transactions between seg-ments are market-based and internal sales and margins are eliminated from consolidated figures.
The segment revenue equals to the net sales and the segment result equals to the operating profit presented in the condensed consolidated income statement. The income statement consists of continuing operations by segment, while balance sheet items match the Group structure on the closing dates.
Segment assets include items directly attributable to a segment and items which can be allocated on a reasonable basis. These are mainly non-interest-bearing items such as intangible assets, property, plant and equipment, inventories, accruals, accounts receivables and other receivables.
2019M€ B
uild
ing
So
lutio
ns –
Eu
rope
Bui
ldin
g
Solu
tions
–
Nor
th A
mer
ica
Upo
nor I
nfra
Oth
ers
Elim
inat
ions
Upo
nor G
roup
Net sales, external 486.9 375.4 240.8 - - 1,103.1
Net sales, internal 2.4 - 3.1 - -5.5 -Net sales, total 489.3 375.4 243.9 - -5.5 1,103.1
Operating profit 31.6 57.1 10.8 -8.0 -0.2 91.3Operating profit, % 6.5 15.2 4.4 8.3
Finance income 8.5
Finance expenses 20.2Share of result in associated companies and joint ventures -4.0
Income taxes 20.3
Profit for the period 55.3
Assets 366.4 298.1 172.4 397.5 -401.1 833.2
LiabilitiesTotal liabilities for reportable segments 320.7 241.7 50.6 288.4 -438.5 462.8
Equity 370.4Total shareholders' equity and liabilities 833.2
Investments 9.0 8.4 8.3 0.4 - 26.1
Depreciation and impairment 19.5 20.7 10.0 1.6 0.0 51.8
Personnel, average 1,950 898 867 86 - 3,801

39Uponor Financial Review 2019
2018M€ B
uild
ing
So
lutio
ns –
Eu
rope
Bui
ldin
g
Solu
tions
–
Nor
th A
mer
ica
Upo
nor I
nfra
Oth
ers
Elim
inat
ions
Upo
nor G
roup
Net sales, external 521.6 340.5 334.2 - - 1,196.3
Net sales, internal 2.6 - 3.1 - -5.7 -Net sales, total 524.2 340.5 337.3 - -5.7 1,196.3
Operating profit 31.1 46.6 35.1 -5.2 -0.9 106.7Operating profit, % 5.9 13.7 10.4 8.9
Finance income 14.4
Finance expenses 22.9Share of result in associated companies and joint ventures -4.7
Income taxes 30.3
Profit for the period 63.2
Assets 357.0 286.1 171.5 358.5 -386.5 786.6
LiabilitiesTotal liabilities for reportable segments 305.0 232.0 58.3 261.7 -424.1 432.9
Equity 353.7Total shareholders' equity and liabilities 786.6
Investments 16.1 27.6 9.5 0.8 - 54.0
Depreciation and impairment 16.4 15.1 9.9 1.0 0.0 42.4
Personnel, average 2,073 925 999 77 - 4,074
M€ 2019 2018
Revenue from contract with customers Sa
le o
f go
ods
Ren
derin
g of
ser
vice
s
Tota
l
Sale
of
good
s
Ren
derin
g of
ser
vice
s
Tota
l
Building Solutions - Europe 480.9 6.0 486.9 489.4 32.2 521.6
Building Solutions - North America 375.4 0.0 375.4 340.5 0.0 340.5
Uponor Infra 220.8 20.0 240.8 316.9 17.3 334.2External customer, total 1,077.1 26.0 1,103.1 1,146.8 49.5 1,196.3Internal revenue 5.5 5.5 5.7 5.7
Total 1,082.5 26.0 1,108.6 1,152.5 49.5 1,202.0Eliminations -5.5 -5.5 -5.7 -5.7Total revenue from contracts with customers 1,077.1 26.0 1,103.1 1,146.8 49.5 1,196.3
Disaggregated revenue informationThe Group disaggregates revenue recognised from contracts with customers into categories that depict how the nature, amount, timing and uncertainty of revenue and cash flows are affected by economic factors. Set out below is the disaggregation of the Group’s revenue from contract with customers, including reconciliation of the revenue:
Sale of goodsThe Group’s contracts with customers for the sale of goods generally include one performance obligation. The Group has concluded that revenue from sale of goods should be recognised at the point in time when control of the asset is transferred to the customer, generally on delivery of the goods. The exact timing of the control transfer is analysed contract by contract taking into account the delivery terms, customer acceptance clauses and customer’s ability to benefit from the goods delivered.
Rendering of services including project businessTypically the promised goods and services in the contract are not distinct from each other and therefore, in most of the cases the Group accounts for the goods and services as a single performance obligation. The Group has concluded that the rendered services including project business are satisfied over time given that the Group’s performance does not create an asset with an alternative use to the Group, the Group has an enforceable right to payment for perfor-mance completed to date or the Group’s performance creates or enhances an asset that the customer controls as the asset is created or enhanced.

40 Uponor Financial Review 2019
External net sales are presented in accordance with the geographical location of the customers. Non-current assets are presented in accordance with the geographical location of the assets. Non-current assets do not include goodwill and deferred tax asset.
M€ 2019 2018
Information about product and services
External net sales
Building Solutions 859.4 859.5
Infrastructure Solutions 243.7 336.8
Uponor Group 1,103.1 1,196.3
Information about geographical areas
External net sales
United States 329.9 322.2
Germany 129.7 150.0
Finland 123.0 131.8
Sweden 99.9 114.4
Denmark 48.0 51.3
Canada 46.5 86.1
Netherlands 46.0 41.9
Spain 41.2 39.2
Norway 32.6 33.7
Poland 31.8 30.6
Others 174.5 195.1
Uponor Group 1,103.1 1,196.3
Non-current assets
United States 143.3 144.2
Germany 46.7 37.2
Sweden 45.6 40.9
Finland 44.2 42.1
Poland 32.9 31.3
Others 5.9 5.8
Uponor Group 318.6 301.5
Entity-wide information 3. Disposal of subsidiaries and businesses
On 29 April 2019, Uponor Infra and EP Industries a.s. signed a share purchase agreement for Uponor Infra’s Czech subsidiary Fintherm. The sales price for the transaction was €3.4 million and the profit of €0.5 million has been booked to other operating income.
On 31 August 2018, Uponor announced that its subsidiary Uponor Infra Oy and Wynnchurch Capital, an American private equity firm, had signed a business purchase agreement for Uponor Infra’s North American business. Uponor Infra made a decision to withdraw from the business in accordance with its strategy to focus on markets where it has possibilities to find synergies with Uponor’s Building Solutions – Europe segment: strong brand and common distribution channels among others. The debt and cash free purchase price was CAD 62.5 million (approximately €41 million).
On 5 September 2018, Uponor and Swegon Group AB signed a share purchase agreement for the sale of all outstanding shares in Zent-Frenger GmbH. The debt and cash free purchase price was €16 million. In 2012, Uponor acquired Zent-Frenger, a leading provider of radiant ceilings in Germany, aiming to extend its product offering and find synergies in large commercial projects. The strategic fit did not materialise and due to different business models, the operational synergies were limited. Zent-Frenger was a part of Building Solutions – Europe segment. The divestment was completed at the end of October 2018.
The net sales price received from these transactions totalled to €54.6 million. The net gain, including transaction cost, totalling €15.7 million was booked to other operating income.
M€ 2019 2018
Book value of disposed assets and liabilities
Tangible assets 2.0 12.1
Intangible assets - 10.3
Inventory 1.9 10.4
Accounts receivable and other receivables 1.3 25.3
Cash and cash equivalents 0.2 0.8
Total assets 5.3 58.9
Interest-bearing non-current liabilities 0.4 0.0
Employee benefits and other liabilities 0.0 4.9
Provisions - 1.0
Deferred tax liability - 1.2
Accounts payable and other current liabilities 1.2 14.9
Total liabilities 1.7 22.0

41Uponor Financial Review 2019
4. Other operating income and expenses M€ 2019 2018
Other operating income
Gains from sales of fixed assets 0.6 0.4
Profit from disposal of subsidiaries and businesses 0.5 15.7
Other items 0.2 0.3
Total 1.3 16.4
Other operating expenses
Research and development expenses 21.9 22.5
Losses from sales of fixed assets 0.4 0.2
Impairments -0.9 2.8
Total 21.4 25.5
Auditor fees
Audit firm Deloitte
Statutory audit services 0.9 0.9
Other services 0.0 0.1
Total 1.0 1.0
M€ 2019 2018
Short-term employee benefits:
- Salaries and bonuses 197.5 212.1
- Other social costs 37.3 33.0
Post-employment benefits:
- Pension expenses - defined contribution plans 11.2 12.0
- Pension expenses - defined benefit plans 0.4 0.8
Other long-term employee benefits 0.1 0.1
Termination benefit expenses 0.2 1.2
Share based payments
- Equity settled share-based payment expenses 0.8 0.4
Total 247.5 259.6
Personnel at 31 December 3,708 3,928
Personnel, average 3,801 4,074
M€ 2019 2018
Net assets 3.7 36.9
Cash received from sales 3.4 54.6
Cash and cash equivalent disposed of 0.2 0.8
Cash flow effect 3.2 53.8
In 2019, other operating income includes a €0.5 million gain from the sale of manufacturing space in Spain and a €0.5 million profit from disposal of Uponor Infra’s Czech subsidiary Fintherm. In 2018, other operating income included €15.7 million profit from disposal of Uponor Infra’s North American business and Zent-Frenger GmbH.
In 2019, other operating expenses include a reversal of impairment in the amount of €0.9 million that was mainly booked as impairment in 2018. In 2018, other operating expenses include an impairment of €2.8 million related to ceasing the Asian operations.
5. Employee benefits
Information on the management’s employee benefits is presented in note 31 Related party transactions.

42 Uponor Financial Review 2019
6. Depreciation and impairment
In 2019, depreciation includes also depreciation of right-of-use assets in the amount of €12.0 million.
An impairment of €0.6 million was made relating to tangible assets, this is included in cost of goods sold. In addition, a reversal of impairment €0.9 million was made relating to tangible assets. By function, this is included in line Other.
In 2018, an impairment of €2.8 million was made relating to tangible and intangible assets. By function, this is included in line Other.
M€ 2019 2018
Depreciation and impairment by asset categoryIntangible rights 2.5 2.6
Other intangible assets 2.8 3.7
Land and water areas 0.2 0.1
Buildings and structures 11.6 5.0
Machinery and equipment 24.7 25.8
Other tangible assets 10.1 5.2
Total 51.8 42.4
Depreciation and impairment by functionCost of goods sold 32.9 28.9
Dispatching and warehousing 5.2 1.3
Sales and marketing 7.9 4.1
Administration 5.4 4.2
Other 0.5 3.9
Total 51.8 42.4
M€ 2019 2018
Financial incomeDividend income from other shares and holdings 0.2 0.0
Interest income from loans and other receivables 0.3 0.6
Exchange differences 7.7 13.6
Other financial income 0.4 0.2
Total 8.5 14.4
Financial expensesInterest expense for financial liabilities measured at amortised cost 3.3 2.9
Interest expense from interest rate swaps 0.1 0.5Loss from financial assets and liabilities designated at fair value through profit and loss - net foreign currency derivatives,
not under hedge accounting 9.5 9.5
Exchange differences 5.8 9.0
Other financial costs 1.5 1.0
Total 20.2 22.9
7. Financial income and expenses and currency exchange differences
In 2019, exchange rate gains and losses included in operating income and expenses total a €2.7 (2.1) million loss. Interest expenses include the interest part of lease payments of €1.6 (0.3) million.
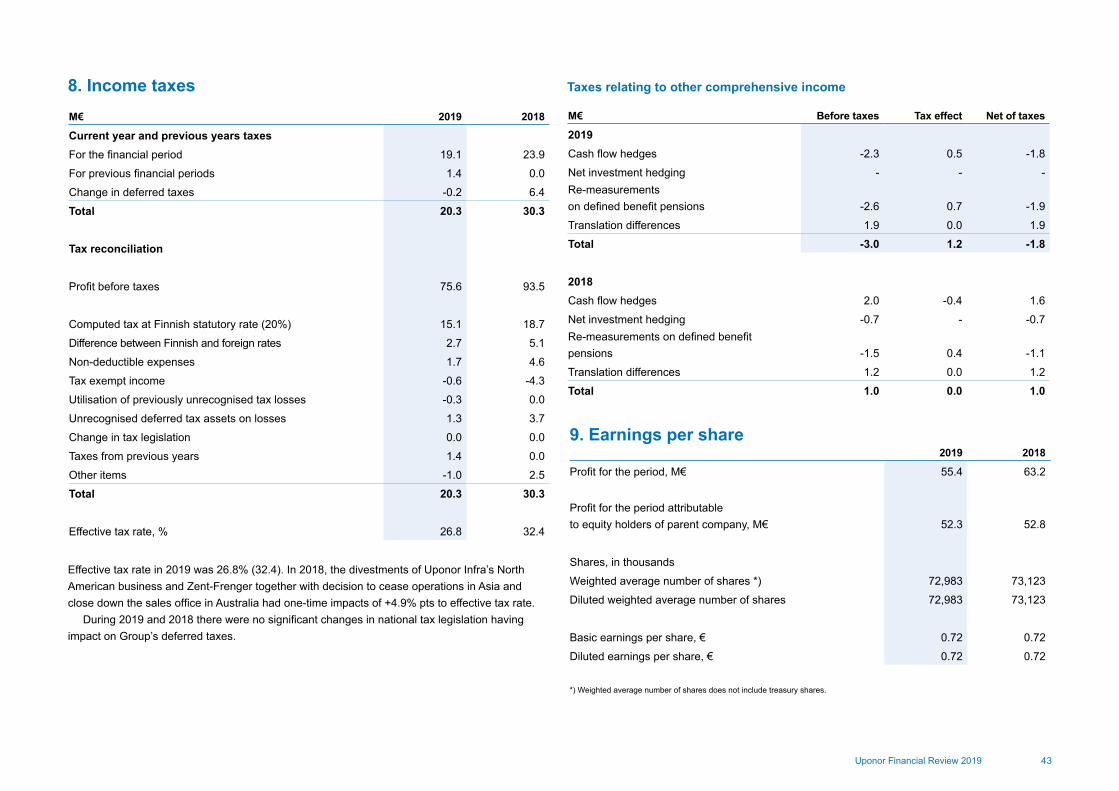
43Uponor Financial Review 2019
9. Earnings per share
M€ 2019 2018
Current year and previous years taxesFor the financial period 19.1 23.9
For previous financial periods 1.4 0.0
Change in deferred taxes -0.2 6.4
Total 20.3 30.3
Tax reconciliation
Profit before taxes 75.6 93.5
Computed tax at Finnish statutory rate (20%) 15.1 18.7
Difference between Finnish and foreign rates 2.7 5.1
Non-deductible expenses 1.7 4.6
Tax exempt income -0.6 -4.3
Utilisation of previously unrecognised tax losses -0.3 0.0
Unrecognised deferred tax assets on losses 1.3 3.7
Change in tax legislation 0.0 0.0
Taxes from previous years 1.4 0.0
Other items -1.0 2.5
Total 20.3 30.3
Effective tax rate, % 26.8 32.4
2019 2018
Profit for the period, M€ 55.4 63.2
Profit for the period attributable to equity holders of parent company, M€ 52.3 52.8
Shares, in thousands
Weighted average number of shares *) 72,983 73,123
Diluted weighted average number of shares 72,983 73,123
Basic earnings per share, € 0.72 0.72
Diluted earnings per share, € 0.72 0.72
M€ Before taxes Tax effect Net of taxes
2019Cash flow hedges -2.3 0.5 -1.8
Net investment hedging - - -Re-measurements on defined benefit pensions -2.6 0.7 -1.9
Translation differences 1.9 0.0 1.9
Total -3.0 1.2 -1.8
2018Cash flow hedges 2.0 -0.4 1.6
Net investment hedging -0.7 - -0.7Re-measurements on defined benefit pensions -1.5 0.4 -1.1
Translation differences 1.2 0.0 1.2
Total 1.0 0.0 1.0
*) Weighted average number of shares does not include treasury shares.
Taxes relating to other comprehensive income8. Income taxes
Effective tax rate in 2019 was 26.8% (32.4). In 2018, the divestments of Uponor Infra’s North American business and Zent-Frenger together with decision to cease operations in Asia and close down the sales office in Australia had one-time impacts of +4.9% pts to effective tax rate.
During 2019 and 2018 there were no significant changes in national tax legislation having impact on Group’s deferred taxes.
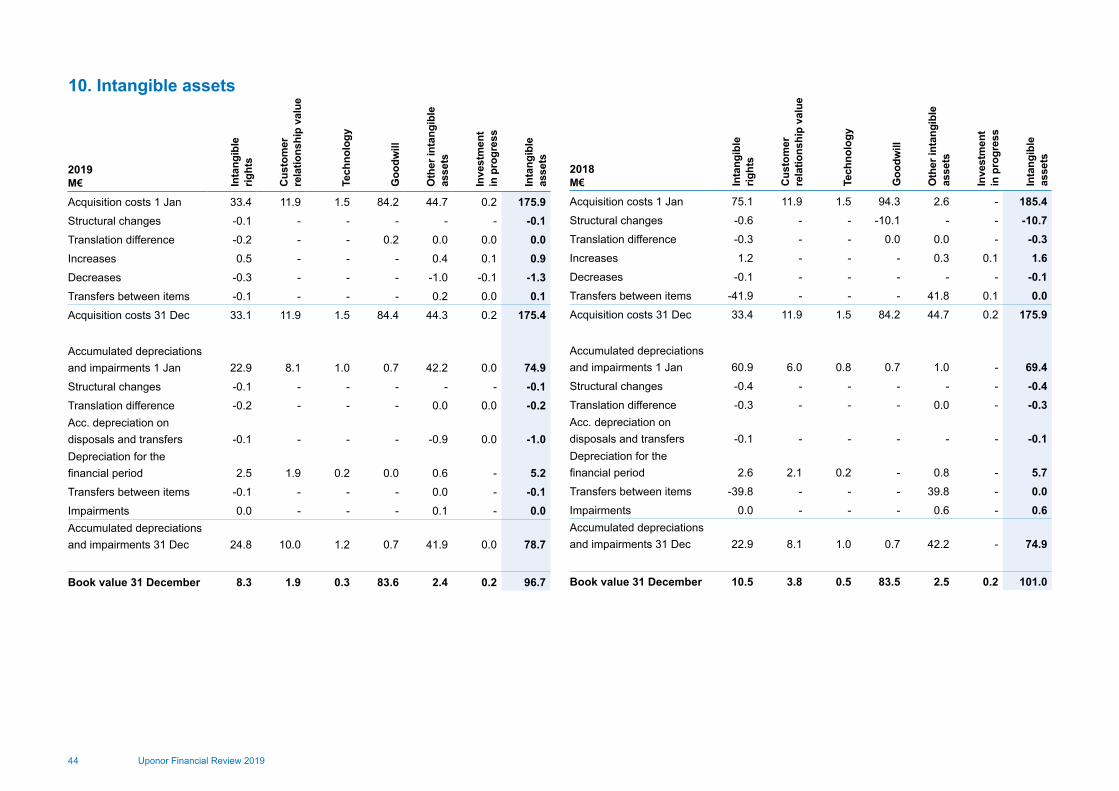
44 Uponor Financial Review 2019
2018M€ In
tang
ible
rig
hts
Cus
tom
er
rela
tions
hip
valu
e
Tech
nolo
gy
Goo
dwill
Oth
er in
tang
ible
as
sets
Inve
stm
ent
in p
rogr
ess
Inta
ngib
le
asse
ts
Acquisition costs 1 Jan 75.1 11.9 1.5 94.3 2.6 - 185.4Structural changes -0.6 - - -10.1 - - -10.7Translation difference -0.3 - - 0.0 0.0 - -0.3Increases 1.2 - - - 0.3 0.1 1.6Decreases -0.1 - - - - - -0.1Transfers between items -41.9 - - - 41.8 0.1 0.0Acquisition costs 31 Dec 33.4 11.9 1.5 84.2 44.7 0.2 175.9
Accumulated depreciations and impairments 1 Jan 60.9 6.0 0.8 0.7 1.0 - 69.4Structural changes -0.4 - - - - - -0.4Translation difference -0.3 - - - 0.0 - -0.3Acc. depreciation on disposals and transfers -0.1 - - - - - -0.1Depreciation for the financial period 2.6 2.1 0.2 - 0.8 - 5.7Transfers between items -39.8 - - - 39.8 - 0.0Impairments 0.0 - - - 0.6 - 0.6Accumulated depreciations and impairments 31 Dec 22.9 8.1 1.0 0.7 42.2 - 74.9
Book value 31 December 10.5 3.8 0.5 83.5 2.5 0.2 101.0
10. Intangible assets
2019M€ In
tang
ible
rig
hts
Cus
tom
er
rela
tions
hip
valu
e
Tech
nolo
gy
Goo
dwill
Oth
er in
tang
ible
as
sets
Inve
stm
ent
in p
rogr
ess
Inta
ngib
le
asse
ts
Acquisition costs 1 Jan 33.4 11.9 1.5 84.2 44.7 0.2 175.9Structural changes -0.1 - - - - - -0.1Translation difference -0.2 - - 0.2 0.0 0.0 0.0Increases 0.5 - - - 0.4 0.1 0.9Decreases -0.3 - - - -1.0 -0.1 -1.3Transfers between items -0.1 - - - 0.2 0.0 0.1Acquisition costs 31 Dec 33.1 11.9 1.5 84.4 44.3 0.2 175.4
Accumulated depreciations and impairments 1 Jan 22.9 8.1 1.0 0.7 42.2 0.0 74.9Structural changes -0.1 - - - - - -0.1Translation difference -0.2 - - - 0.0 0.0 -0.2Acc. depreciation on disposals and transfers -0.1 - - - -0.9 0.0 -1.0Depreciation for the financial period 2.5 1.9 0.2 0.0 0.6 - 5.2Transfers between items -0.1 - - - 0.0 - -0.1Impairments 0.0 - - - 0.1 - 0.0Accumulated depreciations and impairments 31 Dec 24.8 10.0 1.2 0.7 41.9 0.0 78.7
Book value 31 December 8.3 1.9 0.3 83.6 2.4 0.2 96.7

45Uponor Financial Review 2019
11. Tangible assets
2019M€ La
nd a
nd
wat
er a
reas
Bui
ldin
gs
and
stru
ctur
es
Mac
hine
ry
and
equi
pmen
t
Oth
er ta
ngib
le
asse
ts
Con
stru
ctio
n w
ork
in p
rogr
ess
Tang
ible
as
sets
Acquisition costs 1 Jan 17.0 161.9 416.8 63.3 29.9 688.9IFRS 16 impact 1 Jan 1.8 32.0 - 10.5 - 44.3Structural changes -0.4 -2.2 -4.8 -0.2 0.0 -7.6Translation difference 0.1 1.9 1.4 0.4 0.2 4.1Increases 0.4 3.4 12.7 7.4 8.3 32.2Decreases -0.8 -1.4 -4.6 -2.5 -0.1 -9.4Transfers between items 0.0 2.5 11.5 1.8 -15.2 0.6Acquisition costs 31 Dec 17.9 197.9 432.9 80.8 23.1 752.7
Accumulated depreciations and impairments 1 Jan 3.2 85.6 294.7 47.1 - 430.6Structural changes - -1.0 -4.4 -0.1 - -5.6Translation difference 0.0 0.5 0.6 0.3 - 1.3Acc. depreciation on disposals and transfers - -0.3 -4.0 -2.2 - -6.4Depreciation for the financial period 0.2 11.6 25.3 9.9 - 47.0Transfers between items 0.0 0.0 -0.1 0.8 - 0.7Impairments - - -0.5 0.2 - -0.4Accumulated depreciations and impairments 31 Dec 3.3 96.1 311.4 56.1 - 466.9
Book value 31 December 14.7 101.8 121.5 24.7 23.1 285.8
Book value for production plant, machinery and equipment 109.4
In 2019, increases in intangible assets were mainly investments to patents and trademarks. In 2018, increases in intangible assets mainly included the finalization of the website renewal
project from 2017 and the implementation of a MES system in Uponor’s factory in Sweden. In 2019, structural changes include the disposal of Uponor Infra Fintherm a.s. In 2018,
structural changes include the disposals of Uponor Infra’s North American business and Zent-Frenger GmbH.
According to the IFRS 3 standard, goodwill is not depreciated but is tested at least annually for any impairment. The recoverable amount of cash generating units are determined based on value in use calculation which uses cash flow projections. If a unit’s recoverable amount does not exceed the carrying amount, impairment is booked. Goodwill has been allocated between the segments as follows: Building Solutions – Europe €74.2 (74.1) million and Uponor Infra €9.5 (9.5) million. In 2018, the changes relate to the disposals of Uponor Infra’s North American business and Zent-Frenger GmbH.
Impairment tests are carried out for each separate cash-generating unit. Cash flow forecasts related to goodwill cover a period of 5 years. Terminal value is calculated from the fifth year’s cash flow. Cash flow forecasts are based on the strategic plans approved by the management. Key assumptions of the plans relate to growth and profitability development of the markets and the product and service offerings. A cash-generating unit’s useful life has been assumed to be indefinite, since these units have been estimated to impact on the accrual of cash flows for an undetermined period. The discount rate used is based on the interest rate level reflecting the average yield requirement for the cash generating unit in question. The discount rate used was 9.3 (9.4) per cent for Building Solutions – Europe and 8.1 (8.2) per cent for Uponor Infra. The 2019 goodwill impairment tests indicated that there was no need to make impairments.
A sensitivity analysis is performed for the following variables: sales, gross profit margin and discount rate. A 9.6 per cent sales reduction compared to the forecasted long-term levels would not expose the Group to any material impairment risk. A decrease of 4.2 percentage points in gross profit margin would not cause any impairment, provided that other business factors remained unchanged. A discount rate increase of 7.5 percentage points would not lead to any impairment, either. Presented sensitivities relate to the segment Uponor Infra, as its goodwill is more sensitive to the risk of impairment. It is the opinion of management that the changes in the basic assumptions in the theoretical scenarios mentioned above should not be interpreted as evidence that they are likely to occur.
The Group does not have any capitalised development costs.
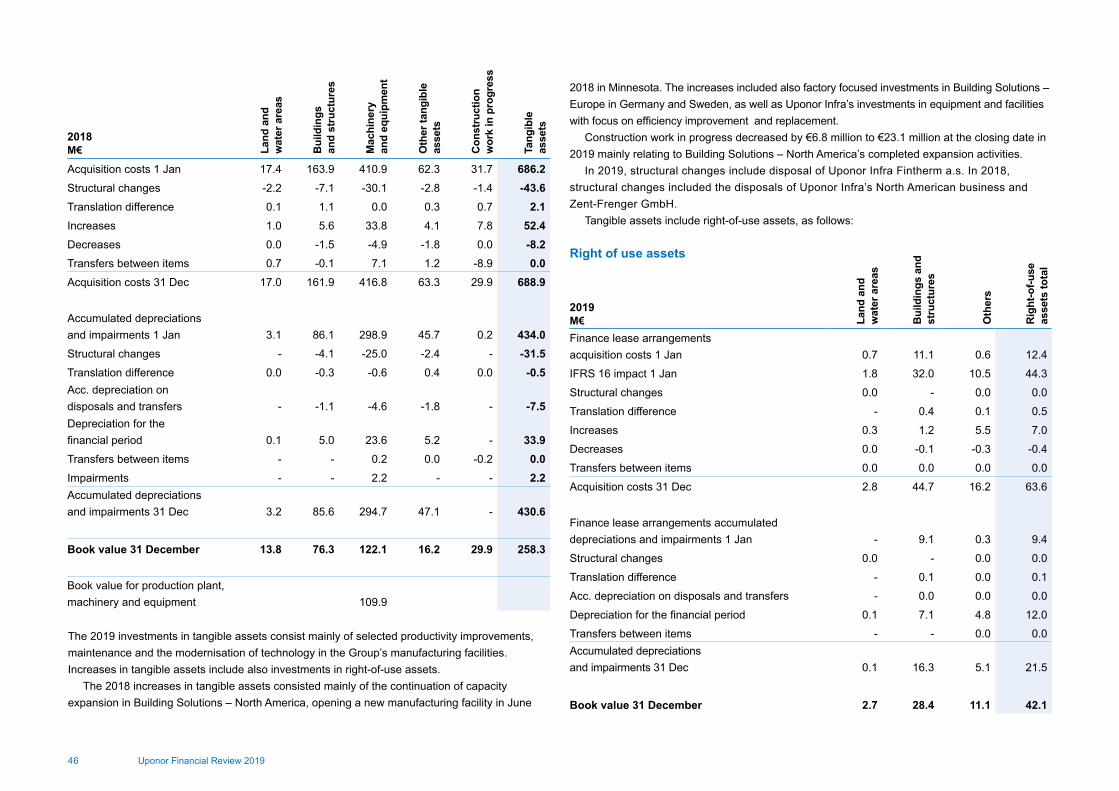
46 Uponor Financial Review 2019
The 2019 investments in tangible assets consist mainly of selected productivity improvements, maintenance and the modernisation of technology in the Group’s manufacturing facilities. Increases in tangible assets include also investments in right-of-use assets.
The 2018 increases in tangible assets consisted mainly of the continuation of capacity expansion in Building Solutions – North America, opening a new manufacturing facility in June
2019M€ La
nd a
nd
wat
er a
reas
Bui
ldin
gs a
nd
stru
ctur
es
Oth
ers
Rig
ht-o
f-use
as
sets
tota
l
Finance lease arrangements acquisition costs 1 Jan 0.7 11.1 0.6 12.4
IFRS 16 impact 1 Jan 1.8 32.0 10.5 44.3
Structural changes 0.0 - 0.0 0.0
Translation difference - 0.4 0.1 0.5
Increases 0.3 1.2 5.5 7.0
Decreases 0.0 -0.1 -0.3 -0.4
Transfers between items 0.0 0.0 0.0 0.0
Acquisition costs 31 Dec 2.8 44.7 16.2 63.6
Finance lease arrangements accumulated depreciations and impairments 1 Jan - 9.1 0.3 9.4
Structural changes 0.0 - 0.0 0.0
Translation difference - 0.1 0.0 0.1
Acc. depreciation on disposals and transfers - 0.0 0.0 0.0
Depreciation for the financial period 0.1 7.1 4.8 12.0
Transfers between items - - 0.0 0.0Accumulated depreciations and impairments 31 Dec 0.1 16.3 5.1 21.5
Book value 31 December 2.7 28.4 11.1 42.1
Right of use assets
2018 in Minnesota. The increases included also factory focused investments in Building Solutions – Europe in Germany and Sweden, as well as Uponor Infra’s investments in equipment and facilities with focus on efficiency improvement and replacement.
Construction work in progress decreased by €6.8 million to €23.1 million at the closing date in 2019 mainly relating to Building Solutions – North America’s completed expansion activities.
In 2019, structural changes include disposal of Uponor Infra Fintherm a.s. In 2018, structural changes included the disposals of Uponor Infra’s North American business and Zent-Frenger GmbH.
Tangible assets include right-of-use assets, as follows:
2018M€ La
nd a
nd
wat
er a
reas
Bui
ldin
gs
and
stru
ctur
es
Mac
hine
ry
and
equi
pmen
t
Oth
er ta
ngib
le
asse
ts
Con
stru
ctio
n w
ork
in p
rogr
ess
Tang
ible
as
sets
Acquisition costs 1 Jan 17.4 163.9 410.9 62.3 31.7 686.2Structural changes -2.2 -7.1 -30.1 -2.8 -1.4 -43.6Translation difference 0.1 1.1 0.0 0.3 0.7 2.1Increases 1.0 5.6 33.8 4.1 7.8 52.4Decreases 0.0 -1.5 -4.9 -1.8 0.0 -8.2Transfers between items 0.7 -0.1 7.1 1.2 -8.9 0.0Acquisition costs 31 Dec 17.0 161.9 416.8 63.3 29.9 688.9
Accumulated depreciations and impairments 1 Jan 3.1 86.1 298.9 45.7 0.2 434.0Structural changes - -4.1 -25.0 -2.4 - -31.5Translation difference 0.0 -0.3 -0.6 0.4 0.0 -0.5Acc. depreciation on disposals and transfers - -1.1 -4.6 -1.8 - -7.5Depreciation for the financial period 0.1 5.0 23.6 5.2 - 33.9Transfers between items - - 0.2 0.0 -0.2 0.0Impairments - - 2.2 - - 2.2Accumulated depreciations and impairments 31 Dec 3.2 85.6 294.7 47.1 - 430.6
Book value 31 December 13.8 76.3 122.1 16.2 29.9 258.3
Book value for production plant, machinery and equipment 109.9

47Uponor Financial Review 2019
2018M€ La
nd a
nd
wat
er a
reas
Bui
ldin
gs a
nd
stru
ctur
es
Oth
ers
Fina
nce
leas
e ar
rang
emen
ts
tota
l
Acquisition costs 1 Jan 0.7 11.1 0.7 12.5Structural changes - - -0.1 -0.1Translation difference - 0.0 0.0 0.0Acquisition costs 31 Dec 0.7 11.1 0.6 12.4
Accumulated depreciations and impairments 1 Jan - 8.7 0.5 9.2Structural changes - - -0.1 -0.1Translation difference - 0.1 -0.1 0.0Depreciation for the financial period - 0.3 0.1 0.4Accumulated depreciations and impairments 31 Dec - 9.1 0.4 9.5
Book value 31 December 0.7 2.0 0.2 2.9
12. Financial assets and liabilities by measurement category
The carrying value of financial assets and liabilities is considered to correspond to their fair value. Group’s financial instruments are classified according to IFRS 7 fair value hierarchies.
Uponor applies hierarchy as follows:The fair value of electricity derivatives are measured based on stock exchange prices.
(Hierarchy 1)The fair value of foreign exchange derivatives and interest rate derivatives are measured
based on price information from common markets and commonly used valuation methods. (Hierarchy 2)
13. Investment in joint ventures and associated companies
M€ NoteIFRS7 Fair value
hierarchy 2019 2018Non-current financial assetsFair value through other comprehensive incomeElectricity derivatives 14 1 0.4 1.0Amortised costOther non-current receivables 14 7.9 10.8Other shares and holdings 0.7 0.2Current financial assetsFair value through other comprehensive incomeElectricity derivatives 16 1 0.3 1.5Other derivative contracts 16 2 0.0 0.0Fair value through profit or lossOther derivative contracts 16 2 1.8 2.4Amortised costAccounts receivable and other receivables 16 187.3 192.3Cash and cash equivalents 17 76.1 38.1Financial assets total 274.5 246.3
M€ 2019 2018
Acquisition costs 1 Jan 13.7 9.5
Share of result in associated companies -4.0 -4.7
Increases 1.3 8.1
Dividends received -0.3 -0.3
Translation difference 0.2 1.1
Book value 31 Dec 10.9 13.7
M€ NoteIFRS7 Fair value
hierarchy 2019 2018
Non-current financial liabilitiesAmortised costInterest-bearing liabilities 22 203.4 175.6
Current financial liabilitiesFair value through other comprehensive incomeElectricity derivatives 24 1 0.0 0.0
Other derivative contracts 24 2 1.1 0.6
Fair value through profit or lossOther derivative contracts 24 2 0.9 0.5
Amortised costInterest-bearing liabilities 24 11.8 1.7
Accounts payable and other liabilities 24 102.0 98.2
Financial liabilities total 319.2 276.6

48 Uponor Financial Review 2019
M€ 2019 2018
Other loan receivables 0.4 0.3
Derivative contracts 0.4 1.0
Other receivables 7.6 10.5
Total 8.3 11.8
M€ 2019 2018
Raw materials and consumables 20.9 22.5
Semifinished products 21.9 20.0
Finished products / goods 101.6 105.4
Total 144.4 147.9
M€ 2019 2018
Accounts receivable 157.7 168.5
Contract assets 2.4 2.5
Current income tax receivables 10.5 8.2
Prepayments and accrued income 1.5 2.1
Derivative contracts 2.2 3.9
Other receivable 27.3 21.3
Total 201.4 206.5
14. Non-current receivables
15. Inventories
16. Current receivables
In addition, the Group has two German associated companies: Punitec GmbH and Punitec Verwaltungs GmbH, whose book value is €0.3 (0.3) million. From its 2019 result, Punitec GmbH paid a dividend of €0.3 (0.3) million to Uponor.
Other non-current receivables include €7.2 (9.7) million in funds recorded as receivables related to the court approved class action settlements in the USA in 2015. In 2019, €2.7 million of the funds were classified as current receivable.
Based on the FIFO principle, inventories are valued at the lower of cost or net realisable value. During the year, inventories were scrapped or written down by €3.2 (3.1) million.
M€ 2019 2018Phyn
Income statementNet sales 2.6 2.0
Profit for the period -9.0 -7.3
Total comprehensive income for the period -9.0 -7.3
Non-current assets 22.2 22.1
Current assets 2.2 6.7
Equity 21.0 26.9
Current liabilities 3.5 1.8
The above amounts of assets and liabilities include
Cash and cash equivalents 0.4 5.8
Carrying amount of interest in joint ventureNet assets in joint ventures 21.0 26.9
Group's ownership 50.0% 50.0%
Group’s share of interest in Phyn 10.5 13.4
Summarised financial information in respect of the joint ventures
Uponor has a 50 per cent ownership in Phyn, both in the U.S. and in Europe, a smart water technology joint venture between Uponor and Belkin International. As a joint-venture company, Phyn is consolidated into Uponor’s financial accounts using the equity method.
On 9 May 2019, Uponor announced that Uponor and Belkin have decided to invest an additional $6 million each, in total $12 million, in their joint venture Phyn during the year 2019. At the end of the year, Uponor had invested $1.5 million (€1.3 million) of the announced amount.
On 13 February 2018, Uponor invested $10 million (€8.1 million) in Phyn, bringing its total investment in the company to €21.6 million ($25 million). After this second investment, Uponor gained a 50 (37.5) per cent ownership.
According to the Group’s assessment, the carrying value of non-interest-bearing current receivables, except for commodity contracts receivable, is considered to correspond with their fair value.
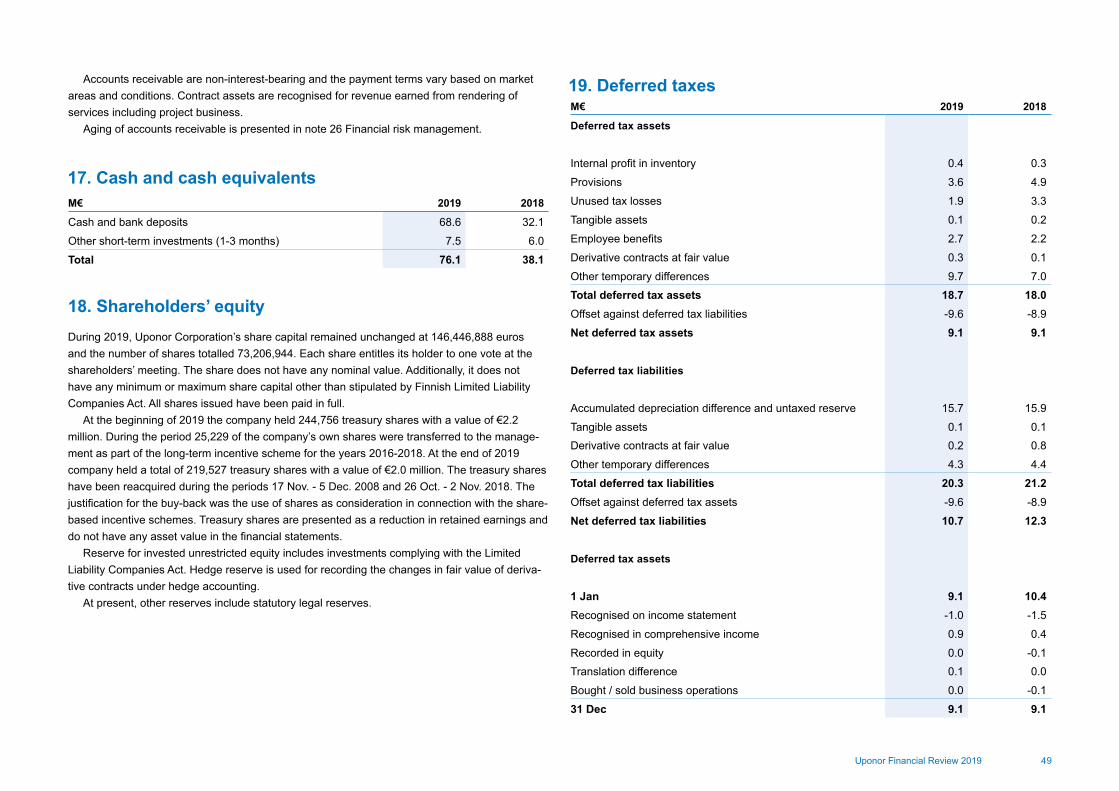
49Uponor Financial Review 2019
M€ 2019 2018
Deferred tax assets
Internal profit in inventory 0.4 0.3
Provisions 3.6 4.9
Unused tax losses 1.9 3.3
Tangible assets 0.1 0.2
Employee benefits 2.7 2.2
Derivative contracts at fair value 0.3 0.1
Other temporary differences 9.7 7.0
Total deferred tax assets 18.7 18.0Offset against deferred tax liabilities -9.6 -8.9
Net deferred tax assets 9.1 9.1
Deferred tax liabilities
Accumulated depreciation difference and untaxed reserve 15.7 15.9
Tangible assets 0.1 0.1Derivative contracts at fair value 0.2 0.8
Other temporary differences 4.3 4.4
Total deferred tax liabilities 20.3 21.2Offset against deferred tax assets -9.6 -8.9
Net deferred tax liabilities 10.7 12.3
Deferred tax assets
1 Jan 9.1 10.4Recognised on income statement -1.0 -1.5
Recognised in comprehensive income 0.9 0.4
Recorded in equity 0.0 -0.1Translation difference 0.1 0.0
Bought / sold business operations 0.0 -0.1
31 Dec 9.1 9.1
M€ 2019 2018
Cash and bank deposits 68.6 32.1
Other short-term investments (1-3 months) 7.5 6.0
Total 76.1 38.1
17. Cash and cash equivalents
18. Shareholders’ equity During 2019, Uponor Corporation’s share capital remained unchanged at 146,446,888 euros and the number of shares totalled 73,206,944. Each share entitles its holder to one vote at the shareholders’ meeting. The share does not have any nominal value. Additionally, it does not have any minimum or maximum share capital other than stipulated by Finnish Limited Liability Companies Act. All shares issued have been paid in full.
At the beginning of 2019 the company held 244,756 treasury shares with a value of €2.2 million. During the period 25,229 of the company’s own shares were transferred to the manage-ment as part of the long-term incentive scheme for the years 2016-2018. At the end of 2019 company held a total of 219,527 treasury shares with a value of €2.0 million. The treasury shares have been reacquired during the periods 17 Nov. - 5 Dec. 2008 and 26 Oct. - 2 Nov. 2018. The justification for the buy-back was the use of shares as consideration in connection with the share-based incentive schemes. Treasury shares are presented as a reduction in retained earnings and do not have any asset value in the financial statements.
Reserve for invested unrestricted equity includes investments complying with the Limited Liability Companies Act. Hedge reserve is used for recording the changes in fair value of deriva-tive contracts under hedge accounting.
At present, other reserves include statutory legal reserves.
19. Deferred taxesAccounts receivable are non-interest-bearing and the payment terms vary based on market areas and conditions. Contract assets are recognised for revenue earned from rendering of services including project business.
Aging of accounts receivable is presented in note 26 Financial risk management.
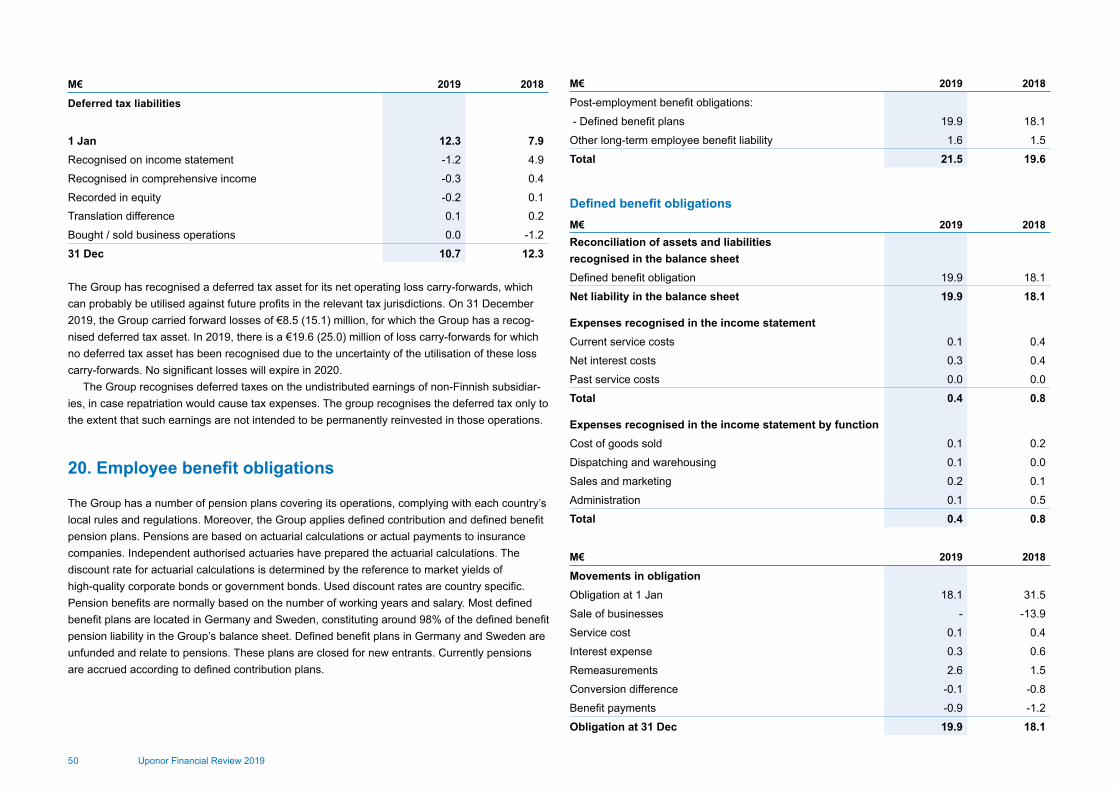
50 Uponor Financial Review 2019
The Group has recognised a deferred tax asset for its net operating loss carry-forwards, which can probably be utilised against future profits in the relevant tax jurisdictions. On 31 December 2019, the Group carried forward losses of €8.5 (15.1) million, for which the Group has a recog-nised deferred tax asset. In 2019, there is a €19.6 (25.0) million of loss carry-forwards for which no deferred tax asset has been recognised due to the uncertainty of the utilisation of these loss carry-forwards. No significant losses will expire in 2020.
The Group recognises deferred taxes on the undistributed earnings of non-Finnish subsidiar-ies, in case repatriation would cause tax expenses. The group recognises the deferred tax only to the extent that such earnings are not intended to be permanently reinvested in those operations.
20. Employee benefit obligations
The Group has a number of pension plans covering its operations, complying with each country’s local rules and regulations. Moreover, the Group applies defined contribution and defined benefit pension plans. Pensions are based on actuarial calculations or actual payments to insurance companies. Independent authorised actuaries have prepared the actuarial calculations. The discount rate for actuarial calculations is determined by the reference to market yields of high-quality corporate bonds or government bonds. Used discount rates are country specific. Pension benefits are normally based on the number of working years and salary. Most defined benefit plans are located in Germany and Sweden, constituting around 98% of the defined benefit pension liability in the Group’s balance sheet. Defined benefit plans in Germany and Sweden are unfunded and relate to pensions. These plans are closed for new entrants. Currently pensions are accrued according to defined contribution plans.
M€ 2019 2018
Post-employment benefit obligations:
- Defined benefit plans 19.9 18.1
Other long-term employee benefit liability 1.6 1.5
Total 21.5 19.6
M€ 2019 2018Reconciliation of assets and liabilities recognised in the balance sheetDefined benefit obligation 19.9 18.1
Net liability in the balance sheet 19.9 18.1
Expenses recognised in the income statementCurrent service costs 0.1 0.4
Net interest costs 0.3 0.4
Past service costs 0.0 0.0
Total 0.4 0.8
Expenses recognised in the income statement by functionCost of goods sold 0.1 0.2
Dispatching and warehousing 0.1 0.0
Sales and marketing 0.2 0.1
Administration 0.1 0.5
Total 0.4 0.8
M€ 2019 2018
Movements in obligationObligation at 1 Jan 18.1 31.5
Sale of businesses - -13.9
Service cost 0.1 0.4
Interest expense 0.3 0.6
Remeasurements 2.6 1.5
Conversion difference -0.1 -0.8
Benefit payments -0.9 -1.2
Obligation at 31 Dec 19.9 18.1
Defined benefit obligations
M€ 2019 2018
Deferred tax liabilities
1 Jan 12.3 7.9Recognised on income statement -1.2 4.9
Recognised in comprehensive income -0.3 0.4
Recorded in equity -0.2 0.1Translation difference 0.1 0.2
Bought / sold business operations 0.0 -1.2
31 Dec 10.7 12.3

51Uponor Financial Review 2019
21. Provisions
The Group expects to contribute €1.0 (0.9) million to its defined benefit pension plans in 2020.The following table shows maturity of expected benefit payments:
Germany Sweden Other countries
M€ 2019 2018 2019 2018 2019 2018
Defined benefit obligation 11.6 10.4 8.0 7.4 0.3 0.3
Net liability (asset) 11.6 10.4 8.0 7.4 0.3 0.3
Germany Sweden Other countries
2019 2018 2019 2018 2019 2018
Discount rate (%) 0.94 1.9 1.5 2.3 0.94 1.6-1.9Expected rate of salary increase (%) 3.0 3.0 n/a n/a n/a n/aExpected rate of pension increase (%) 1.7 1.7 2.0 2.0 n/a n/a-1.7
M€ 2020 2021 2022 2023 20242025-2029
Expected benefit payments 1.0 0.9 0.9 0.9 0.9 4.5
M€ Gua
rant
ee
and
war
rant
y ob
ligat
ions
Envi
ronm
enta
l ob
ligat
ions
Res
truc
turin
g
Oth
er
prov
isio
ns
Tota
l
Provisions at 1 Jan 12.8 2.2 3.6 11.5 30.2
Conversion difference 0.3 - 0.0 0.1 0.3
Additional provisions 7.7 - - 3.0 10.7
Utilised provisions -5.2 -0.1 -2.2 -3.5 -11.0
Unused amounts reversed 0.0 - 0.0 -0.1 -0.2
Provisions at 31 Dec 15.4 2.1 1.4 11.1 30.0
Current provisions 13.8 0.3 1.4 10.3 25.8
Non-current provisions 1.6 1.8 0.0 0.8 4.3
Total 15.4 2.1 1.4 11.1 30.0
Sensitivity analysis of discount rate Effect on amount of liability
Increase of 0.5% Decrease of 6% on average
Decrease of 0.5% Increase of 7% on average
Defined benefit obligation and fair value of plan assets by countries
Principal actuarial assumptions
Maturity of benefit payments
Warranty provisions amounted to €15.4 (12.8) million at the end of the period. Warranty provi-sions are based on the previous years’ experience of defective goods. The aim is to be prepared for future warranty expenses. Warranty periods vary from country to country, depending on local legislation and commercial practices. Provisions for enhanced warranty to cover potential fitting failures related to Uponor yellow brass fittings sold in the USA are included in Other provisions. This enhanced warranty relates to the court approved terms of the class action suits settled on 17 December 2015.
Decrease in restructuring provisions relate mainly to closing operations in Asia. At period end, the environmental provision relating to the divested Finnish real estate business
in 2004 was €2.1 (2.2) million.
M€ 2019 2018
Movements in fair value of plan assetsFair value of plan assets at 1 Jan - 8.7
Sale of businesses - -9.0
Interest income - 0.2
Contributions by employer 0.9 1.5
Conversion difference - -0.2
Benefit payments -0.9 -1.2
Fair value of plan assets at 31 Dec - -

52 Uponor Financial Review 2019
22. Interest-bearing liabilities
23. Lease liabilities
Uponor adopted IFRS 16 Leases using the modified retrospective method of adoption with the date of initial application of 1 January 2019, and recognised an addition of €44.3 million of right-of-use assets and €44.3 million of lease liabilities. Set out below is a reconciliation of lease liabilities on the date of transition with off-statement of financial position commitments as of 31 December 2018:
On 31 December 2019 the main existing long-term funding programme was a five-year bilateral loan agreement of €100 million, which was raised in July 2017 and will mature in July 2022. In addition, Uponor has outstanding, bilateral long-term loans of €50 million and €20 million, both of which were raised in 2016 and will mature in the summer of 2021. €70 million of the long-term loans’ capital is hedged using financial instruments.
At the end of the year, the Group did not have any issued outstanding commercial papers.
* Only lease for termination period was included into commitments for operating lease contract at 31 December 2018
M€ 2019 2018
Non-current interest-bearing liabilitiesLoans from financial institutions 171.1 171.8
Lease liabilities 32.3 3.7
Other non-current interest-bearing liabilities 0.0 0.1
Total 203.4 175.6
Current interest-bearing liabilitiesLoans from financial institutions 0.1 0.1
Lease liabilities 11.6 0.8
Other current interest-bearing liabilities 0.1 0.8
Total 11.8 1.7
M€ 2019 2018
Interest-bearing liabilities at 1 Jan 177.3 258.5
IFRS 16 impact on interest-bearing liabilities at 1 Jan 44.3 -
Increases in lease liabilities 7.0 -
Decreases in lease liabilities -0.4 -
Cash flows -13.3 -80.9
Translation difference 0.4 -0.3
Interest-bearing liabilities at 31 Dec 215.2 177.3
2019 2018
Loans from financial institutions 0.75 0.79
Other non-current interest-bearing liabilities - 0.88
A reconciliation between the opening and closing balances of liabilities arising from financing activities
The weighted average interest rates of interest-bearing liabilities, % pa
Maturity of non-current interest-bearing liabilities
M€ 2021 2022 2023 2024 2025-
Loans from financial institutions 70.1 100.1 0.1 0.4 0.5
Lease agreements 12.2 6.2 3.5 2.7 7.7
Total 82.3 106.2 3.5 3.1 8.2
M€
Commitments for operating lease contracts at 31 December 2018 50.8- Effect of short-term and low value contracts not recognised under lease liabilities at 1 January 2019 -2.8
- Effect from lease components not included in the valuation of lease liabilities -4.4
+ Effect from ongoing contracts* 6.0
- Other effects -1.8
- Effect from discounting (weighted average discount rate 3.18%) -3.5
Lease liabilities after discounting 44.3Existing finance leases 4.5
Lease liabilities at 1 January 2019 48.8
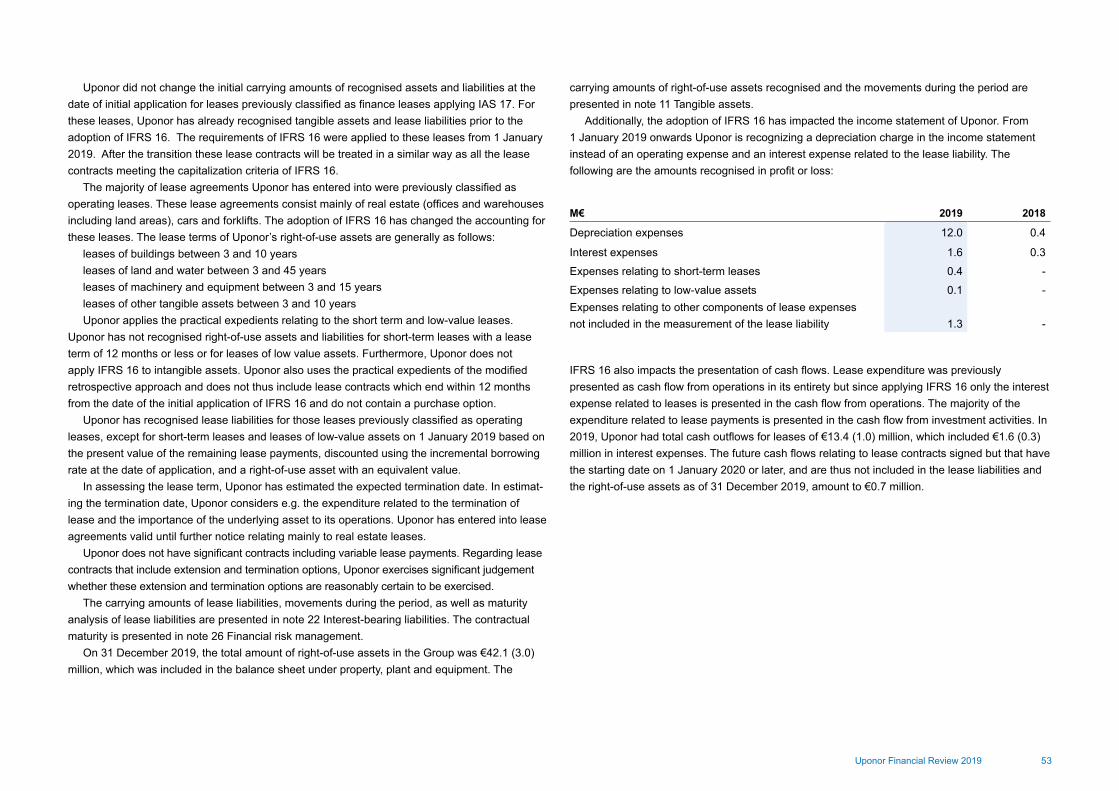
53Uponor Financial Review 2019
M€ 2019 2018
Depreciation expenses 12.0 0.4
Interest expenses 1.6 0.3
Expenses relating to short-term leases 0.4 -
Expenses relating to low-value assets 0.1 -Expenses relating to other components of lease expenses not included in the measurement of the lease liability 1.3 -
Uponor did not change the initial carrying amounts of recognised assets and liabilities at the date of initial application for leases previously classified as finance leases applying IAS 17. For these leases, Uponor has already recognised tangible assets and lease liabilities prior to the adoption of IFRS 16. The requirements of IFRS 16 were applied to these leases from 1 January 2019. After the transition these lease contracts will be treated in a similar way as all the lease contracts meeting the capitalization criteria of IFRS 16.
The majority of lease agreements Uponor has entered into were previously classified as operating leases. These lease agreements consist mainly of real estate (offices and warehouses including land areas), cars and forklifts. The adoption of IFRS 16 has changed the accounting for these leases. The lease terms of Uponor’s right-of-use assets are generally as follows:
leases of buildings between 3 and 10 yearsleases of land and water between 3 and 45 yearsleases of machinery and equipment between 3 and 15 yearsleases of other tangible assets between 3 and 10 years Uponor applies the practical expedients relating to the short term and low-value leases.
Uponor has not recognised right-of-use assets and liabilities for short-term leases with a lease term of 12 months or less or for leases of low value assets. Furthermore, Uponor does not apply IFRS 16 to intangible assets. Uponor also uses the practical expedients of the modified retrospective approach and does not thus include lease contracts which end within 12 months from the date of the initial application of IFRS 16 and do not contain a purchase option.
Uponor has recognised lease liabilities for those leases previously classified as operating leases, except for short-term leases and leases of low-value assets on 1 January 2019 based on the present value of the remaining lease payments, discounted using the incremental borrowing rate at the date of application, and a right-of-use asset with an equivalent value.
In assessing the lease term, Uponor has estimated the expected termination date. In estimat-ing the termination date, Uponor considers e.g. the expenditure related to the termination of lease and the importance of the underlying asset to its operations. Uponor has entered into lease agreements valid until further notice relating mainly to real estate leases.
Uponor does not have significant contracts including variable lease payments. Regarding lease contracts that include extension and termination options, Uponor exercises significant judgement whether these extension and termination options are reasonably certain to be exercised.
The carrying amounts of lease liabilities, movements during the period, as well as maturity analysis of lease liabilities are presented in note 22 Interest-bearing liabilities. The contractual maturity is presented in note 26 Financial risk management.
On 31 December 2019, the total amount of right-of-use assets in the Group was €42.1 (3.0) million, which was included in the balance sheet under property, plant and equipment. The
carrying amounts of right-of-use assets recognised and the movements during the period are presented in note 11 Tangible assets.
Additionally, the adoption of IFRS 16 has impacted the income statement of Uponor. From 1 January 2019 onwards Uponor is recognizing a depreciation charge in the income statement instead of an operating expense and an interest expense related to the lease liability. The following are the amounts recognised in profit or loss:
IFRS 16 also impacts the presentation of cash flows. Lease expenditure was previously presented as cash flow from operations in its entirety but since applying IFRS 16 only the interest expense related to leases is presented in the cash flow from operations. The majority of the expenditure related to lease payments is presented in the cash flow from investment activities. In 2019, Uponor had total cash outflows for leases of €13.4 (1.0) million, which included €1.6 (0.3) million in interest expenses. The future cash flows relating to lease contracts signed but that have the starting date on 1 January 2020 or later, and are thus not included in the lease liabilities and the right-of-use assets as of 31 December 2019, amount to €0.7 million.

54 Uponor Financial Review 2019
24. Current liabilities
25. Commitments, contingent assets and liabilities
M€ 2019 2018
Accounts payable 65.5 72.0
Current income tax liability 1.0 6.1
Accrued liabilities 77.7 86.5
Advances received 0.1 0.7
Contract liabilities 2.7 1.0
Derivative contracts 2.0 1.1
Other current liabilities 36.3 26.2
Total 185.4 193.6
M€ 2019 2018
Accrued liabilitiesPersonnel expenses 38.8 41.0
Bonuses 19.6 23.4
Taxes 0.7 0.5
Interest 0.5 0.5
Others 18.1 21.1
Total 77.7 86.5
M€ 2019 2018
Commitments of purchase PPE (Property, plant, equipment) 4.3 7.4
Other commitments 0.0 0.0
- on own behalf
Pledges at book value 0.0 0.1
Mortgages issued 1.1 1.9
Guarantees issued 0.5 0.6
Contract liabilities are recognised for revenue earned from rendering of services including project business, all projects are realised within one year.
Contingent liabilities are presented in accordance with the best estimate of the amount of liability. Uponor is involved in several judicial proceedings, in various countries. The Group believes
at the moment that the outcome of these disputes will not have a material effect on the Group’s result or financial position.
M€ 2019 2018
- on behalf of a subsidiary
Guarantees issued 33.9 27.3
Letter of Comfort commitments undertaken on behalf of subsidiaries are not included in the above figures.
Pledges at book value 0.0 0.1
Mortgages issued 1.1 1.9
Guarantees issued 34.4 27.9
Total 35.6 29.9
26. Financial risk management
Financial risk management aims to ensure Uponor Group’s sufficient liquidity in a cost-efficient manner and to minimise any adverse effects on the Group’s financial performance caused by uncertainties in the financial markets. The general operating principles of financial risk manage-ment are defined in the Group Treasury Finance Policy, approved by the Board.
At practical level Group’s Treasury activities are governed by Treasury Committee. Treasury Committee is chaired by the Group’s President and CEO, and its other members are the Group CFO and Vice President, Treasury and Risk Management. The Treasury Committee is respon-sible for steering and supervising practical financial risk management. For the purposes of risk management, Uponor uses only such financial instruments whose market value and risk profile can be monitored reliably and continuously, and which are tradable. Hedging transactions related to, for instance instrument, foreign currency, interest rate, liquidity and counterparty risks, are carried out in accordance with the Group Hedging Policy.
The management of financial risk is centralised into parent company and Group Treasury which also operates as the Group’s internal bank. Group Treasury’s financial risk management duties include identifying, assessing and covering the Group’s financial risks. The Treasury is also responsible for external market transactions related to financial assets and risk management. Providing Group companies with consultation and services within financing belongs to the scope of Group Treasury as well.
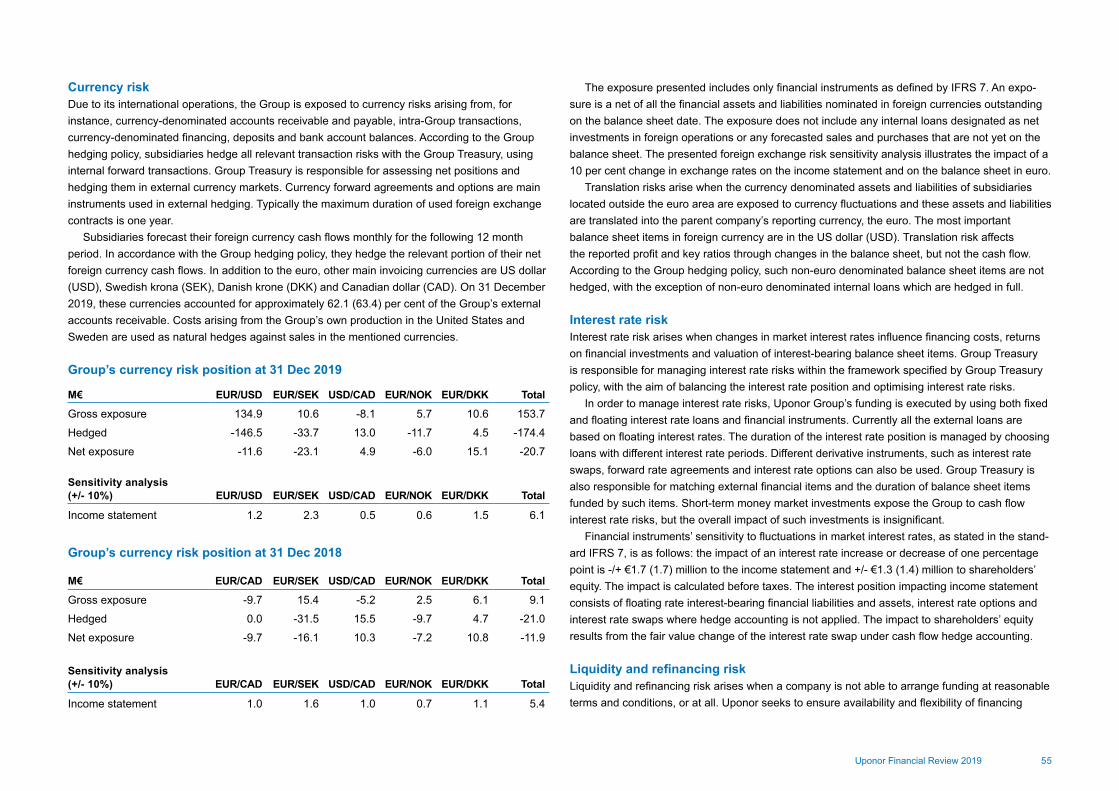
55Uponor Financial Review 2019
Currency riskDue to its international operations, the Group is exposed to currency risks arising from, for instance, currency-denominated accounts receivable and payable, intra-Group transactions, currency-denominated financing, deposits and bank account balances. According to the Group hedging policy, subsidiaries hedge all relevant transaction risks with the Group Treasury, using internal forward transactions. Group Treasury is responsible for assessing net positions and hedging them in external currency markets. Currency forward agreements and options are main instruments used in external hedging. Typically the maximum duration of used foreign exchange contracts is one year.
Subsidiaries forecast their foreign currency cash flows monthly for the following 12 month period. In accordance with the Group hedging policy, they hedge the relevant portion of their net foreign currency cash flows. In addition to the euro, other main invoicing currencies are US dollar (USD), Swedish krona (SEK), Danish krone (DKK) and Canadian dollar (CAD). On 31 December 2019, these currencies accounted for approximately 62.1 (63.4) per cent of the Group’s external accounts receivable. Costs arising from the Group’s own production in the United States and Sweden are used as natural hedges against sales in the mentioned currencies.
The exposure presented includes only financial instruments as defined by IFRS 7. An expo-sure is a net of all the financial assets and liabilities nominated in foreign currencies outstanding on the balance sheet date. The exposure does not include any internal loans designated as net investments in foreign operations or any forecasted sales and purchases that are not yet on the balance sheet. The presented foreign exchange risk sensitivity analysis illustrates the impact of a 10 per cent change in exchange rates on the income statement and on the balance sheet in euro.
Translation risks arise when the currency denominated assets and liabilities of subsidiaries located outside the euro area are exposed to currency fluctuations and these assets and liabilities are translated into the parent company’s reporting currency, the euro. The most important balance sheet items in foreign currency are in the US dollar (USD). Translation risk affects the reported profit and key ratios through changes in the balance sheet, but not the cash flow. According to the Group hedging policy, such non-euro denominated balance sheet items are not hedged, with the exception of non-euro denominated internal loans which are hedged in full.
Interest rate riskInterest rate risk arises when changes in market interest rates influence financing costs, returns on financial investments and valuation of interest-bearing balance sheet items. Group Treasury is responsible for managing interest rate risks within the framework specified by Group Treasury policy, with the aim of balancing the interest rate position and optimising interest rate risks.
In order to manage interest rate risks, Uponor Group’s funding is executed by using both fixed and floating interest rate loans and financial instruments. Currently all the external loans are based on floating interest rates. The duration of the interest rate position is managed by choosing loans with different interest rate periods. Different derivative instruments, such as interest rate swaps, forward rate agreements and interest rate options can also be used. Group Treasury is also responsible for matching external financial items and the duration of balance sheet items funded by such items. Short-term money market investments expose the Group to cash flow interest rate risks, but the overall impact of such investments is insignificant.
Financial instruments’ sensitivity to fluctuations in market interest rates, as stated in the stand-ard IFRS 7, is as follows: the impact of an interest rate increase or decrease of one percentage point is -/+ €1.7 (1.7) million to the income statement and +/- €1.3 (1.4) million to shareholders’ equity. The impact is calculated before taxes. The interest position impacting income statement consists of floating rate interest-bearing financial liabilities and assets, interest rate options and interest rate swaps where hedge accounting is not applied. The impact to shareholders’ equity results from the fair value change of the interest rate swap under cash flow hedge accounting.
Liquidity and refinancing risk Liquidity and refinancing risk arises when a company is not able to arrange funding at reasonable terms and conditions, or at all. Uponor seeks to ensure availability and flexibility of financing
Group’s currency risk position at 31 Dec 2019
Group’s currency risk position at 31 Dec 2018
M€ EUR/USD EUR/SEK USD/CAD EUR/NOK EUR/DKK Total
Gross exposure 134.9 10.6 -8.1 5.7 10.6 153.7
Hedged -146.5 -33.7 13.0 -11.7 4.5 -174.4
Net exposure -11.6 -23.1 4.9 -6.0 15.1 -20.7
M€ EUR/CAD EUR/SEK USD/CAD EUR/NOK EUR/DKK Total
Gross exposure -9.7 15.4 -5.2 2.5 6.1 9.1
Hedged 0.0 -31.5 15.5 -9.7 4.7 -21.0
Net exposure -9.7 -16.1 10.3 -7.2 10.8 -11.9
Sensitivity analysis (+/- 10%) EUR/USD EUR/SEK USD/CAD EUR/NOK EUR/DKK Total
Income statement 1.2 2.3 0.5 0.6 1.5 6.1
Sensitivity analysis (+/- 10%) EUR/CAD EUR/SEK USD/CAD EUR/NOK EUR/DKK Total
Income statement 1.0 1.6 1.0 0.7 1.1 5.4
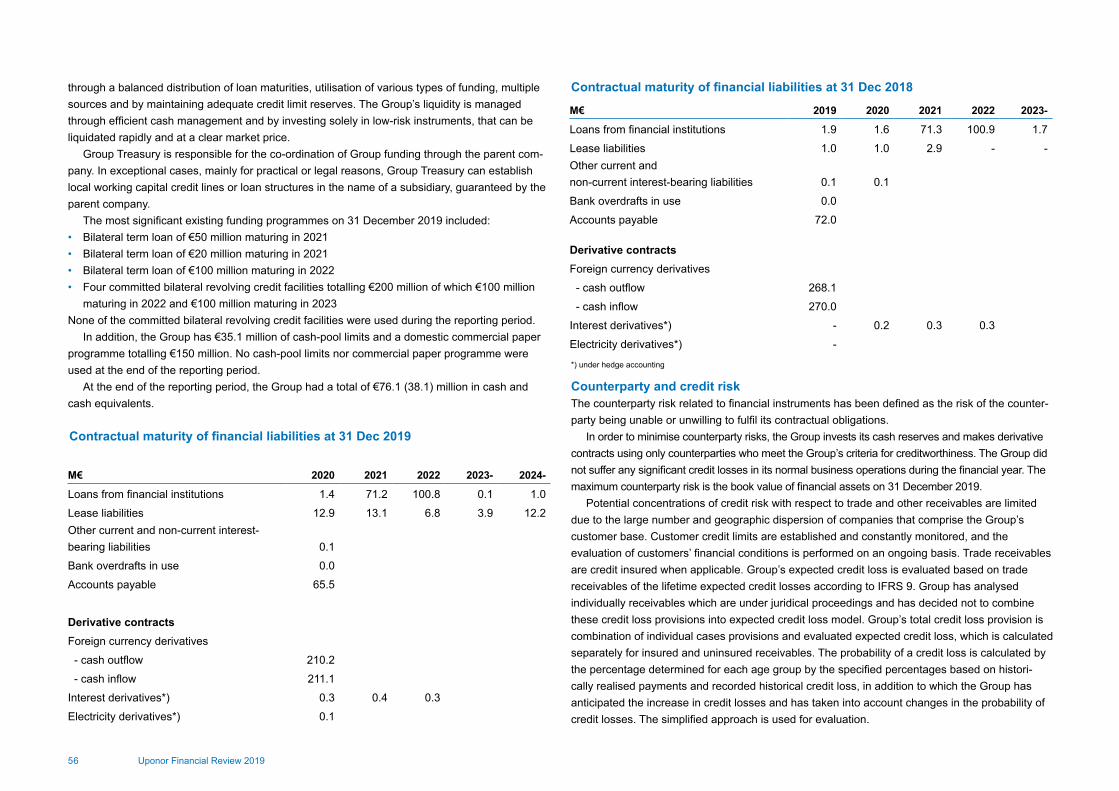
56 Uponor Financial Review 2019
through a balanced distribution of loan maturities, utilisation of various types of funding, multiple sources and by maintaining adequate credit limit reserves. The Group’s liquidity is managed through efficient cash management and by investing solely in low-risk instruments, that can be liquidated rapidly and at a clear market price.
Group Treasury is responsible for the co-ordination of Group funding through the parent com-pany. In exceptional cases, mainly for practical or legal reasons, Group Treasury can establish local working capital credit lines or loan structures in the name of a subsidiary, guaranteed by the parent company.
The most significant existing funding programmes on 31 December 2019 included:• Bilateral term loan of €50 million maturing in 2021• Bilateral term loan of €20 million maturing in 2021• Bilateral term loan of €100 million maturing in 2022• Four committed bilateral revolving credit facilities totalling €200 million of which €100 million
maturing in 2022 and €100 million maturing in 2023 None of the committed bilateral revolving credit facilities were used during the reporting period.
In addition, the Group has €35.1 million of cash-pool limits and a domestic commercial paper programme totalling €150 million. No cash-pool limits nor commercial paper programme were used at the end of the reporting period.
At the end of the reporting period, the Group had a total of €76.1 (38.1) million in cash and cash equivalents.
Counterparty and credit riskThe counterparty risk related to financial instruments has been defined as the risk of the counter-party being unable or unwilling to fulfil its contractual obligations.
In order to minimise counterparty risks, the Group invests its cash reserves and makes derivative contracts using only counterparties who meet the Group’s criteria for creditworthiness. The Group did not suffer any significant credit losses in its normal business operations during the financial year. The maximum counterparty risk is the book value of financial assets on 31 December 2019.
Potential concentrations of credit risk with respect to trade and other receivables are limited due to the large number and geographic dispersion of companies that comprise the Group’s customer base. Customer credit limits are established and constantly monitored, and the evaluation of customers’ financial conditions is performed on an ongoing basis. Trade receivables are credit insured when applicable. Group’s expected credit loss is evaluated based on trade receivables of the lifetime expected credit losses according to IFRS 9. Group has analysed individually receivables which are under juridical proceedings and has decided not to combine these credit loss provisions into expected credit loss model. Group’s total credit loss provision is combination of individual cases provisions and evaluated expected credit loss, which is calculated separately for insured and uninsured receivables. The probability of a credit loss is calculated by the percentage determined for each age group by the specified percentages based on histori-cally realised payments and recorded historical credit loss, in addition to which the Group has anticipated the increase in credit losses and has taken into account changes in the probability of credit losses. The simplified approach is used for evaluation.
Contractual maturity of financial liabilities at 31 Dec 2019
Contractual maturity of financial liabilities at 31 Dec 2018
M€ 2020 2021 2022 2023- 2024-
Loans from financial institutions 1.4 71.2 100.8 0.1 1.0
Lease liabilities 12.9 13.1 6.8 3.9 12.2Other current and non-current interest-bearing liabilities 0.1
Bank overdrafts in use 0.0
Accounts payable 65.5
Derivative contractsForeign currency derivatives
- cash outflow 210.2
- cash inflow 211.1
Interest derivatives*) 0.3 0.4 0.3
Electricity derivatives*) 0.1
M€ 2019 2020 2021 2022 2023-
Loans from financial institutions 1.9 1.6 71.3 100.9 1.7
Lease liabilities 1.0 1.0 2.9 - -Other current and non-current interest-bearing liabilities 0.1 0.1
Bank overdrafts in use 0.0
Accounts payable 72.0
Derivative contractsForeign currency derivatives
- cash outflow 268.1
- cash inflow 270.0
Interest derivatives*) - 0.2 0.3 0.3
Electricity derivatives*) -
*) under hedge accounting

57Uponor Financial Review 2019
2019 2018
M€Trade
receivablesExpected
uncollectibleTrade
receivablesExpected
uncollectible
Not yet due 137.7 0.0 148.6 0.2
Overdue 1-30 days 14.0 0.0 14.3 0.0
Overdue 31-60 days 1.8 0.0 2.0 0.0
Overdue 61-90 days 1.1 0.0 1.2 0.1
Ovedrdue over 90 days 3.1 0.2 2.4 0.3
Total 157.7 0.3 168.5 0.6
Provision for impairment based on individual analyses 1.7 2.1
Total 2.0 2.7
The aging of accounts receivable
Nominal value
Raw material price riskIn its business operations, the Group is exposed to raw material price risks including materials like plastics, aluminium, copper, zinc as well as electricity price risks. Such price risks are man-aged through long-term fixed-price supply contracts, whenever financially feasible. As far as the metals’ price risk is concerned, LME-based (London Metal Exchange) financial instruments can be used to supplement fixed-price contracts. Hedge accounting is not applied to metals hedging via financial instruments.
Group Treasury is responsible for managing electricity price risks at the Nordic level within the framework defined in the Group hedging policy. Hedging targets are achieved mainly by using financial electricity derivative contracts. The Group applies hedge accounting to the electricity derivatives.
The table below presents the sensitivity of open electricity derivatives to fluctuations in electricity prices should the market price of electricity increase or decrease by 10 per cent, while other factors are expected to remain unchanged. These figures are calculated before taxes. Electricity derivatives recorded at fair value affect the profit and loss statement. Any changes in the value of electricity derivatives that meet the criteria for hedge accounting as set forth in IFRS 9 have an impact on shareholders’ equity.
M€ 2019 2018
Change in shareholders’ equity +/- 0.4 +/- 0.7
27. Derivative contracts and hedge accounting
M€ 2019 2018
Interest rate derivatives:
Interest rate swaps
- under hedge accounting 50.0 50.0
Interest rate options
- not under hedge accounting 45.0 70.0
Foreign currency derivatives:
Forward agreements
- not under hedge accounting 229.1 277.2
Commodity derivatives:
Electricity derivatives
- under hedge accounting 3.4 4.1
Energy, MWh 127,198 162,118

58 Uponor Financial Review 2019
Changes in the fair values of electricity and interest rate derivatives designated as cash flow hedges are recognised in other comprehensive income to the extent that the hedge is effective.
From electricity derivatives a loss of €1.5 (gain of 1.7) million was booked to other comprehen-sive income during the financial period.
From interest rate derivatives a loss of €0.3 (0.1) million was entered into other comprehen-sive income during the financial period.
The tax impact has been taken into account in the amounts. No ineffectiveness has been booked.
2019 2018
M€ Posi
tive
fa
ir va
lue
Neg
ativ
e
fair
valu
e
Net
fair
valu
e
Posi
tive
fa
ir va
lue
Neg
ativ
e
fair
valu
e
Net
fair
valu
e
Interest rate derivatives:
Interest rate swaps
- under hedge accounting - -1.1 -1.1 - -0.6 -0.6
Interest rate options
- not under hedge accounting 0.0 - 0.0 0.0 - 0.0
Foreign currency derivatives:
Forward agreements
- not under hedge accounting 1.8 -0.9 0.9 2.4 -0.5 1.9
Currency options, bought 0.1 - 0.1 - - -
Currency options, sold - 0.0 0.0 - - -
Commodity derivatives:
Electricity derivatives
- under hedge accounting 0.7 -0.1 0.6 2.6 - 2.6
Fair value 28. Capital management
The purpose of the Group’s capital management is to create an efficient capital structure in order to ensure normal operational preconditions and growth opportunities and, thereby, to increase long-term shareholder return.
In addition to investment decisions, dividend distribution is a key factor affecting the capital structure. The Group’s long-term goal is to pay a basic dividend which represents at least 50 per cent of annual earnings per share.
The Group’s capital structure developments are monitored by means of gearing. Gearing is calculated by dividing net interest-bearing liabilities by total equity. Net interest-bearing liabilities include interest-bearing liabilities less cash and cash equivalents. The Group’s target is to keep its average gearing between 40 and 80 (30 and 70) per cent across quarters. In 2019, gearing average across quarters was 57.5 (53.0) per cent.
Group’s financial agreements include typical covenant clauses regarding the gearing and interest cover ratio. The realised ratio levels have clearly fulfilled the covenant clauses.
M€ 2019 2018
Interest-bearing liabilities 215.2 177.3
Cash and cash equivalent 76.1 38.1
Restricted cash - 0.0
Net interest-bearing liabilities 139.1 139.2
Total equity 370.4 353.6
Gearing, % 37.6 39.4
Gearing across quarters, % 57.5 53.0

59Uponor Financial Review 2019
Non
-con
trol
ling
inte
rest
, pro
port
ion
of o
wne
rshi
p
Profi
t for
the
pe
riod
attr
ibut
able
to
non-
cont
rolli
ng in
tere
st
Equi
ty a
ttrib
utab
le
to n
on-c
ontr
ollin
g in
tere
st
Location 2019 2018 2019 2018 2019 2018
Uponor Infra Oy Finland, Helsinki 44.7% 44.7% 3.0 10.4 58.8 56.0
Performance share plan
Valuation parameters for instruments granted during period
Effect of share-based incentives on the result and financial position during the period
29. Management incentive schemes and share-based payments During the financial year 2019 Uponor’s share-based plans had the earning periods 2016-2018, 2017-2019 and 2018-2020 and 2019-2021 in operation. In December the Board decided on a new share-based plan for the performance period 2020-2022 but no costs were recognised in 2019. In the plans Uponor shares can be earned on the basis of performance criteria set for the performance period. The purpose of the plans is to retain key management, as well as to motivate and reward the management for good performance that supports the Group’s profitability and the implementation of the Group’s strategy. The targets for the earning periods launched since 2015 are mainly based on consolidated three-year cumulative Net Sales and three-year EBITDA or EBITDA-based intrinsic value. The plans also encourage the key manage-ment to further acquire and own Uponor’s shares, which will contribute to aligning the interests of the management, the company and the shareholders. Key characteristics and terms of Uponor share-based plans are listed in the table below. The amounts include the cash portion intended for taxes arising from the reward to the participant. 30. Interests in subsidiaries and non-controlling interests
Subsidiaries are listed in the note 31 Related party transactions.Uponor Corporation’s subsidiary Uponor Infra Oy has material non-controlling interest as a
result of its ownership structure. Uponor Corporation has control in Uponor Infra Oy through the 55.3 per cent direct ownership and the voting ownership by holding the Chair position in the board of directors of Uponor Infra Oy. KWH Group Ltd has 44.7 per cent ownership in Uponor Infra Oy. Uponor Infra Oy is a parent company of a subgroup and its consolidated financials are presented below. The structure of this subgroup is presented in the list of subsidiaries.
The fair value of share based incentives have been determined at grant date and is expensed until vesting. The pricing of the share-based incentives granted during the period was determined by the following inputs and share-based incentives had the following effect:
2017-2019 2018-2020 2019-2021
Maximum amount, pcs 300,000 400,000 600,000
Launch date 12/12/2016 12/12/2017 19/12/2018
Start of the earning period 01/01/2017 01/01/2018 01/01/2019
Vesting date 30/04/2020 30/04/2021 30/04/2022
Maximum contractual life, yrs 3.3 3.3 3.3
Remaining contractual life, yrs 0.3 1.3 2.3Number of persons at the end of the reporting year 19 36 38
Payment methodShares
and cashShares
and cashShares
and cashMaximum amount outstanding at the end of the period, pcs 172,250 278,390 439,900
Share price at grant, € 9.69
Expected dividends, per year € 0.91
Fair value per share, € 8.78
M€
Expenses for the financial year, share-based payments, equity-settled 0.8
Estimated amount of taxes to be paid in the plans 31 December 2019 1.7

60 Uponor Financial Review 2019
Financial information on Uponor Infra Oy’s consolidated financial statements:
Executive Committee remuneration, T€
Executive Committee remuneration: President and CEO, T€
M€ 2019 2018
Net sales 243.9 337.3
Profit for the period 6.8 23.1
Total comprehensive income for the period 6.2 22.8
Profit for the period 6.8 23.1
- Equity holders of parent company 3.8 12.7
- Non-controlling interest 3.0 10.4
Total comprehensive income for the period 6.2 22.8
- Equity holders of parent company 3.4 12.6
- Non-controlling interest 2.8 10.2
Non-current assets 63.2 62.1
Current assets 109.7 111.7
Shareholders equity 122.0 115.8
Non-current liabilities 4.9 3.0
Current liabilities 45.9 55.0
Cash flow from operations 11.3 24.6
Cash flow from investments -5.0 29.7
Cash flow from financing -4.8 -56.8
Total cash flow 1.5 -2.5
2019 2018
Remuneration*) 3,153.8 3,351.1
Post-employment benefits
- defined contribution plans 420.8 269.6
Share based benefits 322.8 320.9
Total 3,897.4 3,941.6
2019 2018
Luomakoski Jyri, President and CEO 669.5 720.5
Shares received by the excecutive committee (number)Luomakoski Jyri, President and CEO 4,913 3,318
Other members of Excecutive Committee 7,381 7,003
Total 12,294 10,321
Uponor Infra Oy did not pay any dividends to its owners in 2019 or 2018. In 2018, Uponor Infra Oy paid €50.0 million return of capital to its owner, of which €22.4 million to non-controlling interest.
Executive Committee remuneration includes salaries, fringe benefits and short-term incentives.Post-employment benefits include expenses accrued in accordance with local legal pension
arrangements for the members of the Executive Committee and expenses related to defined contribution pension insurances taken in addition to the President and CEO. The Group does not have any other commitments related to post-employment benefits.
Share-based benefits include payments relating to management long-term incentive schemes (further details in the note 29).
Remuneration of the President and CEO is also included in the table presented above.
31. Related party transactions Uponor Group’s related parties include subsidiaries and associates as well as Board members, the President and CEO, and Executive Committee members.
The related party transactions disclosed consist of transactions carried out with related parties that are not eliminated in the consolidated financial statements.
Executive Committee and Board remuneration
*) Remuneration includes termination benefit expenses

61Uponor Financial Review 2019
Board remuneration
Transactions with associated companies
Shares and holdings
Subsidiaries
Name Country and domicile
Uponor Beteiligungs GmbH Germany, Hassfurt
Uponor GmbH Germany, Hassfurt
Uponor S.A.R.L. France, Saint-Priest
Uponor S.r.l. Italy, Vimercate
KaMo GmbH Germany, EhingenDelta Systemtechnik GmbH (95% Uponor Beteiligungs GmbH, 5% KaMo GmbH) Germany, Celle
Uponor Hispania, S.A.U. Spain, Móstoles
Uponor A/S Denmark, Brøndby
Uponor Eesti Oü Estonia, Tallinn
Uponor Suomi Oy Finland, Lahti
Uponor Hong Kong Ltd Hong Kong
Uponor (China) Plumbing Systems Co., Ltd. (*) China, TaicangUponor Kft. (Uponor Épuletgépészeti Korlátolt Felelösségu Társaság) Hungary, Budapest
SIA Uponor Latvia Latvia, Riga
UAB Uponor Lithuania, Vilnius
Uponor, s.r.o. Czech Rep., Prague
Uponor d.o.o Croatia, Zagreb
Uponor AS Norway, Vestby
M€ 2019 2018
Sales 0.7 0.0
Purchases 2.7 4.3
Balances at the end of period
Accounts payable and other liabilities 0.1 0.4
The retirement age of the President and CEO will be determined in accordance with the Employees’ Pensions Act (TyEL), however the Group and the President and CEO may agree for the President and CEO to retire at the age of 63 years. The President and CEO’s pension accrues in accordance with the Employee’s Pensions Act (TyEL). The Group has also taken a defined contribution pension insurance for the President and CEO, to which the company paid €40,000 in 2019.The Group has further concluded a pension arrangement based on a capitalisation agreement for the benefit of the President and CEO, to which the Group paid €50,000 in 2019.
The Company has taken a voluntary pension insurance for Board members. Upon retirement, this entitles them to a pension according to TyEL, the Finnish Employees’ Pensions Act.
Other related party disclosuresThe Group had not issued any loans to the persons classified as related party on 31 December 2019 or 31 December 2018.
Persons classified as related party to the company have carried out minor transactions with companies belonging to the Group.
The shareholdings of the management and Board members are presented under the Corpo-rate Governance section of the Financial Statements.
2019 2018
Gro
ss a
nnua
l fe
e (T
€)
Shar
es re
ceiv
ed
(num
ber)
Gro
ss a
nnua
l fe
e (T
€)
Shar
es re
ceiv
ed
(num
ber)
Paasikivi Annika, Chair from 13 March 2018 109.2 3,665 109.2 2,498Aaltonen-Forsell Pia, Chair of the Audit Committee from 13 March 2018 63.9 2,077 64.5 1,416
Falk Johan, from 13 March 2018 58.9 1,873 52.3 1,277
Eloranta Jorma, until 13 March 2018 - 1.8 -
Lengauer Markus 65.1 2,077 64.5 1,416
Lindholm Casimir, from 13 March 2018 54.7 1,873 52.9 1,277
Nygren Eva 55.9 1,873 54.7 1,277
Rosendal Jari, until 13 March 2018 - 1.8 -
Total 407.7 13,438 401.7 9,161

62 Uponor Financial Review 2019
Name Country and domicile
Uponor Vertriebs GmbH Austria, Wiener Neudorf
Uponor Sp. z o.o. Poland, BłonieUponor Portugal - Sistemas para Fluídos, Lda. (99.97 % Uponor Corporation, 0.03 % Uponor Hispania, S.A.U) Portugal, V.N. Gaia
Uponor AG in Liquidation (*) Switzerland, Pfungen
JSC "Uponor Rus" Russia, Moscow
Uponor Innovation AB Sweden, Borås
Uponor AB Sweden, Virsbo
Uponor Limited England, Watford
Uponor Building Energy Limited (*) England, Watford
UPONOR, s.r.o. Slovakia, Bratislava
Uponor NA Holding, Inc. USA, Delaware
Uponor NA Asset Leasing, Inc. USA, Delaware
Uponor NA Investment LLC USA, Delaware
Uponor North America, Inc. USA, Delaware
Tulsa Pipe Plant, Inc. (*) USA, Delaware
Uponor Ltd. Canada, Saskatchewan
Radiant Technology, Inc. USA, Delaware
Uponor, Inc. USA, Illinois
Uponor Innovations, LLC USA, Delaware
Uponor Romania S.R.L. Romania, Bucharest
Uponor Insurance Limited Guernsey
Uponor Pty Ltd (*) Australia, Sydney
Name Country and domicile
Uponor Infra Oy (55.3% Uponor Corporation, 44.7% KWH Group Ltd) Finland, Helsinki
Jita Oy Finland, Virrat
Uponor Infra AB Sweden, Virsbo
Uponor Infra A/S Denmark, Holbæk
Uponor Infra AS Norway, Vestby
Uponor Infra Ltd. Canada, Mississauga
Uponor Infra Limited (*) England, Milton Keynes
Uponor Infra Sp. z o.o. Poland, Warsaw
Uponor Infra Oü Estonia, Tallinn
Koy Tuusulan Pakkasraitti 12 Finland, Tuusula
KWH PIPE (INDIA) LIMITED (*) India, Mumbai
KWH Pipe Espana SA (*) Spain, Madrid
KWH Pipe (Portugal) Tubos Lda. (*) Portugal, Palmela
Name Country and domicile
Punitec GmbH & Co. KG (36%) Germany, Gochsheim
Punitec Verwaltungs GmbH (36%) Germany, Gochsheim
Phyn Oy (50%) Finland, Helsinki
Phyn LLC (50%) USA, Delaware
Associated companies and joint ventures
32. Events after the balance sheet date
There were no events to report on.
(*) Dormant company

63Uponor Financial Review 2019
Parent company income statement
Parent company financial statements (FAS)
M€ Note 2019 2018
Net turnover 2 10.9 9.5
Other operating income 3 5.0 -
Staff expenses 4 7.8 7.6
Depreciation, amortization and reduction in value 5 0.3 0.2
Other operating expenses 3 15.1 9.4
Operating loss -7.4 -7.7
Financial income and expenses 6 61.5 42.4
Profit before appropriations and taxes 54.1 34.7
Appropriations 7 3.3 2.5
Income taxes 8 0.0 -0.1
Profit for the period 57.4 37.1

64 Uponor Financial Review 2019
Parent company balance sheetM€ Note 31 Dec 2019 31 Dec 2018
ASSETS
Non-current assets
Intangible assetsIntangible rights 2.6 0.5Total intangible assets 9 2.6 0.5
Tangible assetsMachinery and equipment 0.4 0.4Total tangible assets 9 0.4 0.4
Non-current investmentsShares in subsidiaries 255.6 256.3Shares in associated companies 2.6 2.6Other shares and holdings 0.0 0.0Loan receivables 254.7 250.9Total non-current investments 10 512.9 509.8
Total non-current assets 515.9 510.7
Current assets
Non-current receivablesDeferred tax assets 0.3 0.2Total non-current receivables 11 0.3 0.2
Current receivablesAccounts receivable 1.9 1.4Loan receivables 10.2 3.7Prepayments and accrued income 1.9 2.1Deferred tax assets 0.1 0.1Other receivables 58.4 64.2Total current receivables 12 72.4 71.5
Cash and cash equivalents 61.9 27.6
Total current assets 134.6 99.3
Total assets 650.5 610.0
M€ Note 31 Dec 2019 31 Dec 2018
LIABILITIES AND SHAREHOLDERS’ EQUITY
Shareholders' equityShare capital 146.4 146.4
Share premium 50.2 50.2
Unrestricted equity 0.1 0.1
Retained earnings 111.4 111.3
Profit for the period 57.4 37.1
Total shareholders' equity 13 365.6 345.1
Accumulated appropriations
Depreciation difference 0.5 0.2
Total accumulated appropriations 0.5 0.2
Provisions 14 1.5 1.6
Liabilities
Non-current liabilities
Loans from financial institutions 170.0 170.0
Total non-current liabilities 15 170.0 170.0
Current liabilitiesAccounts payable 2.4 1.1
Accruals and deferred income 3.6 2.7
Other liabilities 106.9 89.3
Total current liabilities 16 112.9 93.1
Total liabilities 282.9 263.1
Total liabilities and shareholders’ equity 650.5 610.0

65Uponor Financial Review 2019
M€ 2019 2018
Cash flow from operations
Operating profit / loss -7.4 -7.7
Depreciation 0.3 0.2
Other non-cash items -0.1 -0.1
Income taxes paid 0.0 1.0
Merger profit / loss -4.1 -
Net cash from operations -11.2 -6.6
Receivables, increase (-) / decrease (+) 1.9 -3.9Non-interest-bearing liabilities, increase (-) / decrease (+) -0.8 -10.1
Cash pool receivables, increase (-) / decrease (+) -8.1 -3.9
Cash pool payables, increase (+) / decrease (-) 19.3 -2.9
Change in working capital 12.3 -20.8
Dividends received 58.9 59.6
Group contributions 2.5 2.3
Change in treasury shares 0.2 -1.8
Cash flow from operations 62.7 32.7
Cash flow from investmentsPurchase of fixed assets -0.2 -0.5
Other current investments 0.0 -1.0
Granted loans -43.0 -75.9
Loan repayments 45.9 66.1
Changes in investments in subsidiaries -2.6 -1.3
Repayment of equity - Group 0.0 27.7
Interests received 9.7 11.3
Dividends received 0.1 0.0
Cash flow from investments 9.9 26.4Cash flow before financing 72.7 59.1
Parent company cash flow statement M€ 2019 2018
Cash flow from financingBorrowings of debt 75.2 124.9
Repayments of debt -75.0 -204.9
Change in other short term debt 0.0 0.0
Interests paid -1.3 -1.7
Dividends paid -37.2 -35.8
Cash flow from financing -38.4 -117.5
Change in cash and cash equivalents 34.3 -58.4
Cash and cash equivalents at 1 January 27.6 86.0
Cash and cash equivalents at 31 December 61.9 27.6
Changes according to balance sheet 34.3 -58.4
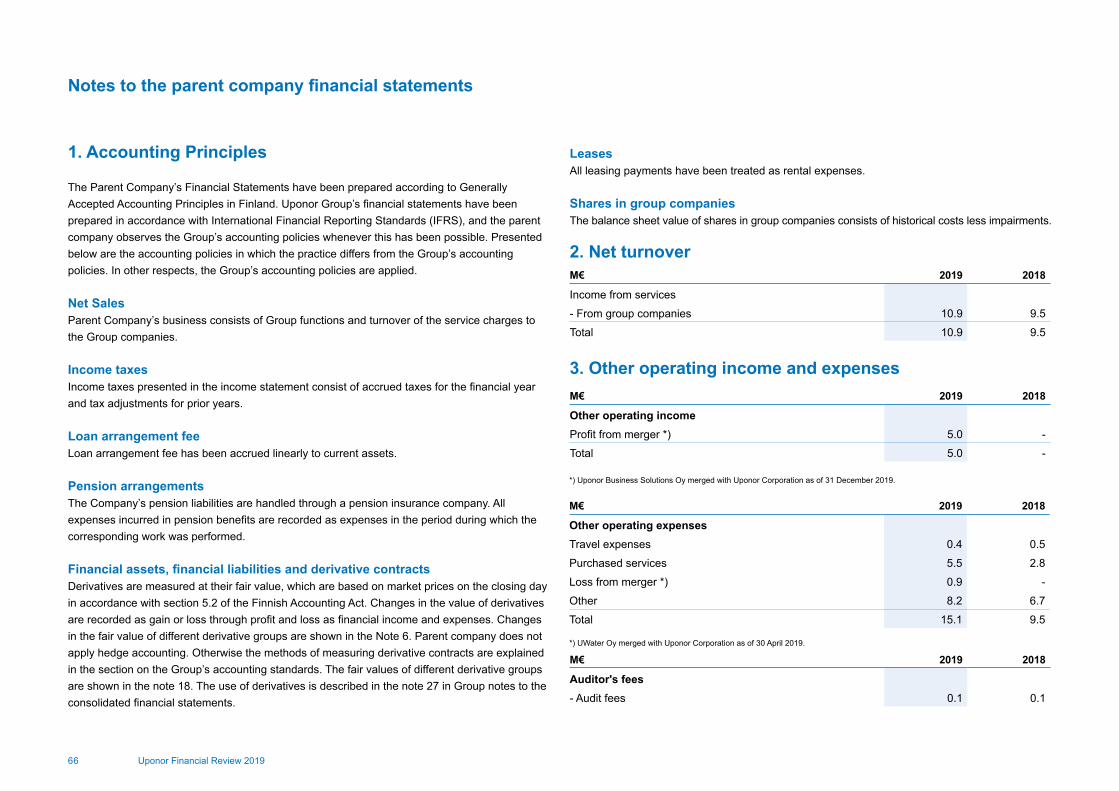
66 Uponor Financial Review 2019
Notes to the parent company financial statements
1. Accounting Principles
The Parent Company’s Financial Statements have been prepared according to Generally Accepted Accounting Principles in Finland. Uponor Group’s financial statements have been prepared in accordance with International Financial Reporting Standards (IFRS), and the parent company observes the Group’s accounting policies whenever this has been possible. Presented below are the accounting policies in which the practice differs from the Group’s accounting policies. In other respects, the Group’s accounting policies are applied.
Net SalesParent Company’s business consists of Group functions and turnover of the service charges to the Group companies.
Income taxesIncome taxes presented in the income statement consist of accrued taxes for the financial year and tax adjustments for prior years.
Loan arrangement feeLoan arrangement fee has been accrued linearly to current assets.
Pension arrangementsThe Company’s pension liabilities are handled through a pension insurance company. All expenses incurred in pension benefits are recorded as expenses in the period during which the corresponding work was performed.
Financial assets, financial liabilities and derivative contractsDerivatives are measured at their fair value, which are based on market prices on the closing day in accordance with section 5.2 of the Finnish Accounting Act. Changes in the value of derivatives are recorded as gain or loss through profit and loss as financial income and expenses. Changes in the fair value of different derivative groups are shown in the Note 6. Parent company does not apply hedge accounting. Otherwise the methods of measuring derivative contracts are explained in the section on the Group’s accounting standards. The fair values of different derivative groups are shown in the note 18. The use of derivatives is described in the note 27 in Group notes to the consolidated financial statements.
LeasesAll leasing payments have been treated as rental expenses.
Shares in group companiesThe balance sheet value of shares in group companies consists of historical costs less impairments.
2. Net turnover
3. Other operating income and expenses
M€ 2019 2018
Income from services
- From group companies 10.9 9.5
Total 10.9 9.5
M€ 2019 2018
Other operating incomeProfit from merger *) 5.0 -
Total 5.0 -
M€ 2019 2018
Auditor's fees- Audit fees 0.1 0.1
M€ 2019 2018
Other operating expensesTravel expenses 0.4 0.5
Purchased services 5.5 2.8
Loss from merger *) 0.9 -
Other 8.2 6.7
Total 15.1 9.5
*) Uponor Business Solutions Oy merged with Uponor Corporation as of 31 December 2019.
*) UWater Oy merged with Uponor Corporation as of 30 April 2019.
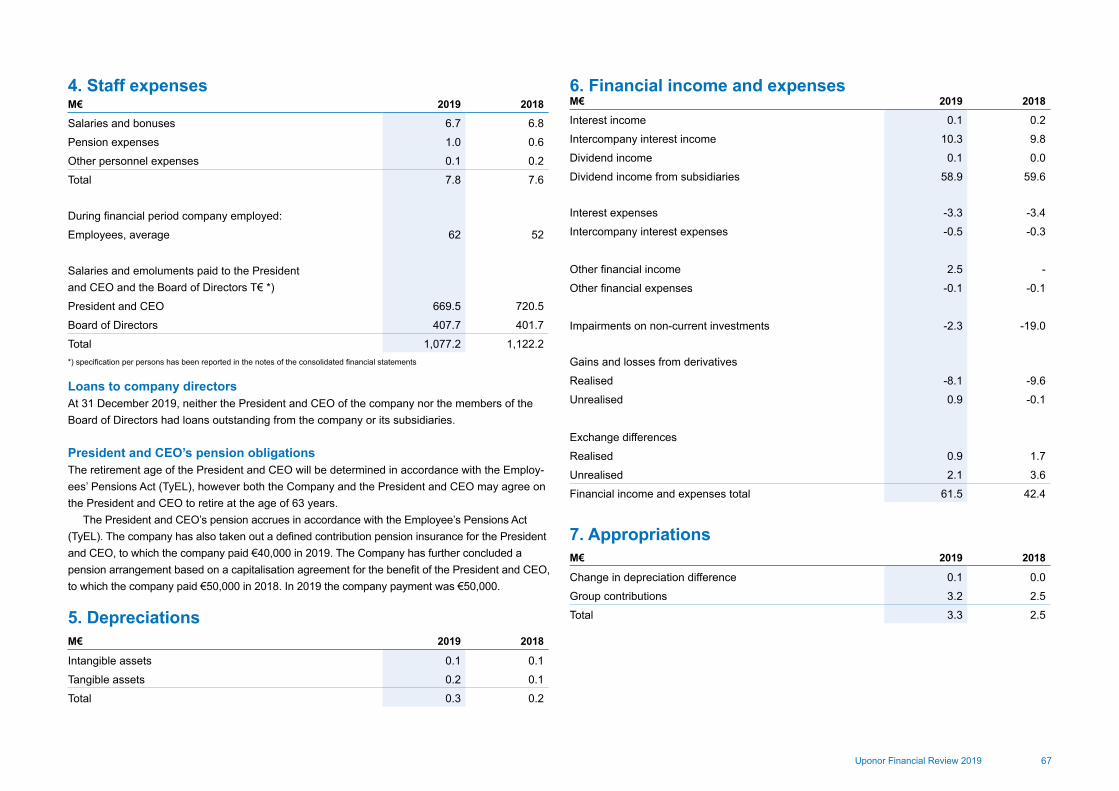
67Uponor Financial Review 2019
Loans to company directorsAt 31 December 2019, neither the President and CEO of the company nor the members of the Board of Directors had loans outstanding from the company or its subsidiaries.
President and CEO’s pension obligationsThe retirement age of the President and CEO will be determined in accordance with the Employ-ees’ Pensions Act (TyEL), however both the Company and the President and CEO may agree on the President and CEO to retire at the age of 63 years.
The President and CEO’s pension accrues in accordance with the Employee’s Pensions Act (TyEL). The company has also taken out a defined contribution pension insurance for the President and CEO, to which the company paid €40,000 in 2019. The Company has further concluded a pension arrangement based on a capitalisation agreement for the benefit of the President and CEO, to which the company paid €50,000 in 2018. In 2019 the company payment was €50,000.
4. Staff expenses 6. Financial income and expenses
5. Depreciations
7. Appropriations
M€ 2019 2018
Intangible assets 0.1 0.1
Tangible assets 0.2 0.1
Total 0.3 0.2
M€ 2019 2018
Change in depreciation difference 0.1 0.0
Group contributions 3.2 2.5
Total 3.3 2.5
M€ 2019 2018
Salaries and bonuses 6.7 6.8
Pension expenses 1.0 0.6
Other personnel expenses 0.1 0.2
Total 7.8 7.6
During financial period company employed:
Employees, average 62 52
Salaries and emoluments paid to the President and CEO and the Board of Directors T€ *)
President and CEO 669.5 720.5
Board of Directors 407.7 401.7
Total 1,077.2 1,122.2
M€ 2019 2018
Interest income 0.1 0.2
Intercompany interest income 10.3 9.8
Dividend income 0.1 0.0
Dividend income from subsidiaries 58.9 59.6
Interest expenses -3.3 -3.4
Intercompany interest expenses -0.5 -0.3
Other financial income 2.5 -
Other financial expenses -0.1 -0.1
Impairments on non-current investments -2.3 -19.0
Gains and losses from derivatives
Realised -8.1 -9.6
Unrealised 0.9 -0.1
Exchange differences
Realised 0.9 1.7
Unrealised 2.1 3.6
Financial income and expenses total 61.5 42.4
*) specification per persons has been reported in the notes of the consolidated financial statements
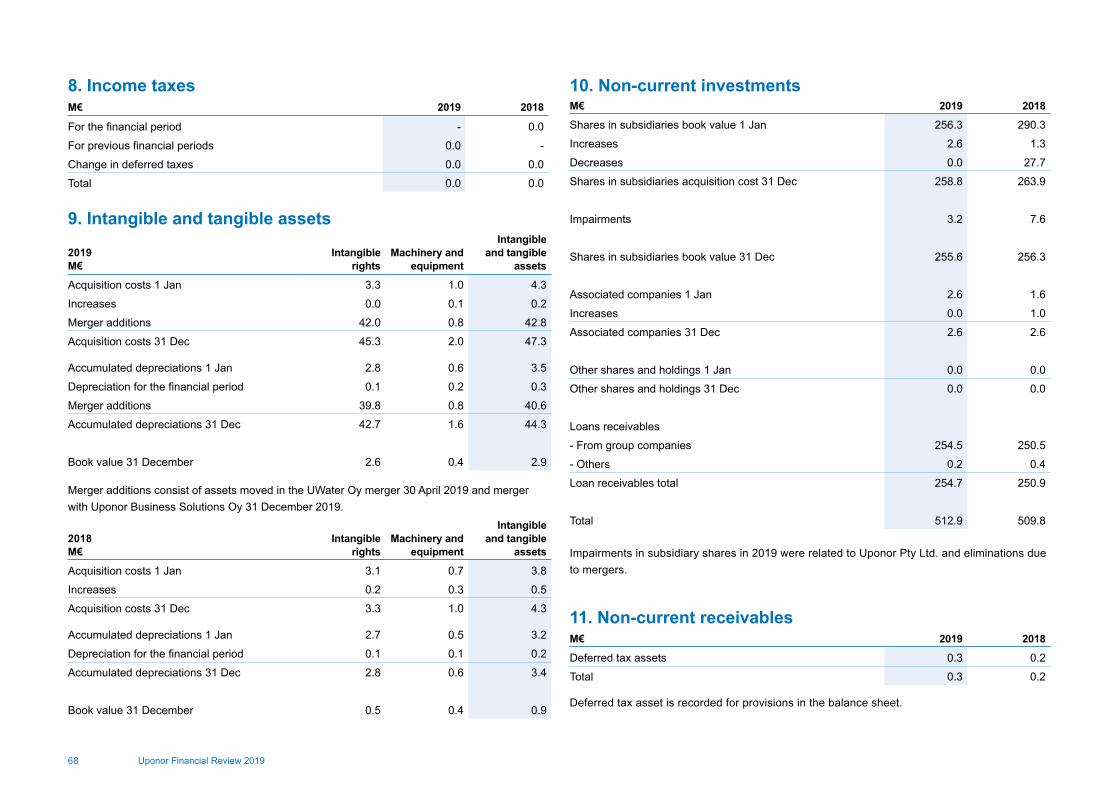
68 Uponor Financial Review 2019
8. Income taxes
11. Non-current receivables
10. Non-current investmentsM€ 2019 2018
For the financial period - 0.0
For previous financial periods 0.0 -
Change in deferred taxes 0.0 0.0
Total 0.0 0.0
M€ 2019 2018
Deferred tax assets 0.3 0.2
Total 0.3 0.2
9. Intangible and tangible assets
2019M€
Intangible rights
Machinery and equipment
Intangible and tangible
assets
Acquisition costs 1 Jan 3.3 1.0 4.3
Increases 0.0 0.1 0.2
Merger additions 42.0 0.8 42.8
Acquisition costs 31 Dec 45.3 2.0 47.3
Accumulated depreciations 1 Jan 2.8 0.6 3.5
Depreciation for the financial period 0.1 0.2 0.3
Merger additions 39.8 0.8 40.6
Accumulated depreciations 31 Dec 42.7 1.6 44.3
Book value 31 December 2.6 0.4 2.9
2018M€
Intangible rights
Machinery and equipment
Intangible and tangible
assets
Acquisition costs 1 Jan 3.1 0.7 3.8
Increases 0.2 0.3 0.5
Acquisition costs 31 Dec 3.3 1.0 4.3
Accumulated depreciations 1 Jan 2.7 0.5 3.2
Depreciation for the financial period 0.1 0.1 0.2
Accumulated depreciations 31 Dec 2.8 0.6 3.4
Book value 31 December 0.5 0.4 0.9
Merger additions consist of assets moved in the UWater Oy merger 30 April 2019 and merger with Uponor Business Solutions Oy 31 December 2019.
M€ 2019 2018
Shares in subsidiaries book value 1 Jan 256.3 290.3
Increases 2.6 1.3
Decreases 0.0 27.7
Shares in subsidiaries acquisition cost 31 Dec 258.8 263.9
Impairments 3.2 7.6
Shares in subsidiaries book value 31 Dec 255.6 256.3
Associated companies 1 Jan 2.6 1.6
Increases 0.0 1.0
Associated companies 31 Dec 2.6 2.6
Other shares and holdings 1 Jan 0.0 0.0
Other shares and holdings 31 Dec 0.0 0.0
Loans receivables
- From group companies 254.5 250.5
- Others 0.2 0.4
Loan receivables total 254.7 250.9
Total 512.9 509.8
Impairments in subsidiary shares in 2019 were related to Uponor Pty Ltd. and eliminations due to mergers.
Deferred tax asset is recorded for provisions in the balance sheet.

69Uponor Financial Review 2019
12. Current receivables 13. Changes in equityM€ 2019 2018
From Group companies
- accounts receivable 1.9 1.4
- loan receivable 10.2 13.7
- deferred tax assets 0.1 0.1
- prepayments and accrued income 0.9 1.1
- cash pool receivables 53.4 45.3
- other receivables 2.1 3.5
Total 68.6 65.1
From external parties
- accounts receivable 0.0 0.0
- prepayments and accrued income 1.0 1.0
- other receivables 2.8 5.4
Total 3.8 6.4
Total current receivables 72.4 71.4
Prepayments and accrued income
Interest income 0.9 1.1
Taxes 0.0 -
Others 1.0 1.0
Total 1.9 2.1
M€ 2019 2018
Restricted equity
Share capital on 1 January 146.4 146.4
Share capital on 31 December 146.4 146.4
Share premium on 1 January 50.2 50.2
Share premium on 31 December 50.2 50.2
Total restricted equity 196.6 196.6
Unrestricted equity
Unrestricted equity 1.1. 0.1 0.1
Unrestricted equity 31.12. 0.1 0.1
Retained earnings 1 January 148.4 148.9
Dividend payments -37.2 -35.8
Treasury shares 0.2 -1.8
Retained earnings 31 December 111.4 111.3
Profit for financial period 57.4 37.1
Total unrestricted equity 168.9 148.5
Shareholders’ equity 31 December 365.6 345.1
Distributable fundsUnrestricted equity 0.1 0.1
Retained earnings 113.4 113.6
Profit for the period 57.4 37.1
Treasury shares -2.0 -2.2
Distributable funds 31 December 168.9 148.5
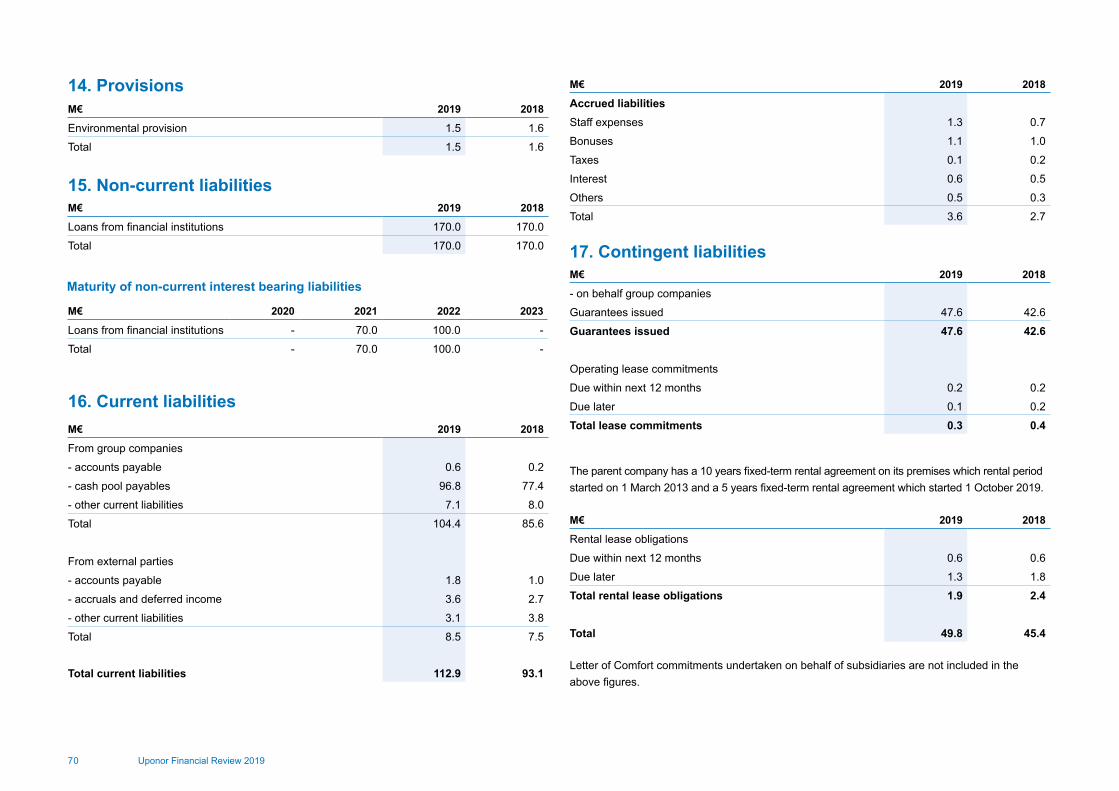
70 Uponor Financial Review 2019
14. Provisions
16. Current liabilities
17. Contingent liabilities
15. Non-current liabilities
M€ 2019 2018
Environmental provision 1.5 1.6
Total 1.5 1.6
M€ 2019 2018
From group companies
- accounts payable 0.6 0.2
- cash pool payables 96.8 77.4
- other current liabilities 7.1 8.0
Total 104.4 85.6
From external parties
- accounts payable 1.8 1.0
- accruals and deferred income 3.6 2.7
- other current liabilities 3.1 3.8
Total 8.5 7.5
Total current liabilities 112.9 93.1
M€ 2019 2018
- on behalf group companies
Guarantees issued 47.6 42.6
Guarantees issued 47.6 42.6
Operating lease commitments
Due within next 12 months 0.2 0.2
Due later 0.1 0.2
Total lease commitments 0.3 0.4
M€ 2019 2018
Rental lease obligations
Due within next 12 months 0.6 0.6
Due later 1.3 1.8
Total rental lease obligations 1.9 2.4
Total 49.8 45.4
M€ 2019 2018
Accrued liabilitiesStaff expenses 1.3 0.7
Bonuses 1.1 1.0
Taxes 0.1 0.2
Interest 0.6 0.5
Others 0.5 0.3
Total 3.6 2.7M€ 2019 2018
Loans from financial institutions 170.0 170.0
Total 170.0 170.0
M€ 2020 2021 2022 2023
Loans from financial institutions - 70.0 100.0 -
Total - 70.0 100.0 -
Maturity of non-current interest bearing liabilities
The parent company has a 10 years fixed-term rental agreement on its premises which rental period started on 1 March 2013 and a 5 years fixed-term rental agreement which started 1 October 2019.
Letter of Comfort commitments undertaken on behalf of subsidiaries are not included in the above figures.

71Uponor Financial Review 2019
18. Derivative contracts2019 2018
M€ Nominal value
Interest derivatives:Interest rate swaps 50.0 50.0
Interest rate options 45.0 70.0
2019 2018 Fair value
Interest derivatives:Interest rate swaps -1.1 -0.6
Interest rate options 0.0 0.0
2019 2018 Nominal value
Foreign currency derivatives:Forward agreements 229.1 277.2
Intragroup forward agreements 119.6 139.0
Commodity derivatives:Electricity derivatives 3.4 4.1
Energy (MWh) 127,198 162,118
2019 2018 Fair value
Foreign currency derivatives:Forward agreements 0.9 1.9
Intragroup forward agreements 1.1 -0.8
Currency options, bought 0.1 -
Currency options, sold 0.0 -
Commodity derivatives:Electricity derivatives 0.6 2.6
Maturity of derivatives is presented in Group financial statements note 26.

72 Uponor Financial Review 2019
Proposal of the Board of DirectorsThe distributable funds of the parent company, Uponor Corporation are €168,944,146.32, of which profit for the period is €57,445,870.87.
The Board of Directors proposes to the Annual General Meeting that-a dividend of €0.53 per share will be paid, at maximum €38,683,331.01-the remainder be retained in the shareholders’ equity €130,260,815.31 €168,944,146.32
The company’s financial situation has not changed materially after the closing day. The com-pany’s liquidity is good. The Board of Directors’ view is that the proposed profit distribution does not risk the company’s liquidity.
Vantaa, 12 February 2020
Annika Paasikivi Chair
Markus Lengauer Deputy Chair
Jyri LuomakoskiPresident and CEO
Johan Falk Casimir LindholmPia Aaltonen-Forsell Eva Nygren

73Uponor Financial Review 2019
Auditor’s report To the Annual General Meeting of Uponor Corporation
Report on the Audit of Financial Statements
OpinionWe have audited the financial statements of Uponor Corporation (business identity code 0148731-6) for the year ended 31 December 2019. The financial statements comprise the consolidated balance sheet, income statement, statement of comprehensive income, statement of changes in equity, statement of cash flows and notes, including a summary of significant accounting policies, as well as the parent company’s balance sheet, income statement, statement of cash flows and notes.
In our opinion• the consolidated financial statements give a true and fair view of the group’s financial position,
financial performance and cash flows in accordance with International Financial Reporting Standards (IFRS) as adopted by the EU
• the financial statements give a true and fair view of the parent company’s financial perfor-mance and financial position in accordance with the laws and regulations governing the preparation of financial statements in Finland and comply with statutory requirements.
Our opinion is consistent with the additional report submitted to the Audit Committee.
Basis for opinionWe conducted our audit in accordance with good auditing practice in Finland. Our responsibilities under good auditing practice are further described in the Auditor’s Responsibilities for the Audit of Financial Statements section of our report.
We are independent of the parent company and of the group companies in accordance with the ethical requirements that are applicable in Finland and are relevant to our audit, and we have fulfilled our other ethical responsibilities in accordance with these requirements.
In our best knowledge and understanding, the non-audit services that we have provided to the parent company and group companies are in compliance with laws and regulations applicable in Finland regarding these services, and we have not provided any prohibited non-audit services referred to in Article 5(1) of regulation (EU) 537/2014.
The non-audit services that we have provided have been disclosed in note 4 to the consoli-dated financial statements.
We believe that the audit evidence we have obtained is sufficient and appropriate to provide a basis for our opinion.
Key audit matters Key audit matters are those matters that, in our professional judgment, were of most significance in our audit of the financial statements of the current period. These matters were addressed in the context of our audit of the financial statements as a whole, and in forming our opinion thereon, and we do not provide a separate opinion on these matters.
We have also addressed the risk of management override of internal controls. This includes consideration of whether there was evidence of management bias that represented a risk of material misstatement due to fraud.
Responsibilities of the Board of Directors and the President and CEO for the financial statements The Board of Directors and the President and CEO are responsible for the preparation of consolidated financial statements that give a true and fair view in accordance with International Financial Reporting Standards (IFRS) as adopted by the EU, and of financial statements that give a true and fair view in accordance with the laws and regulations governing the preparation of financial statements in Finland and comply with statutory requirements. The Board of Directors and the President and CEO are also responsible for such internal control as they determine is necessary to enable the preparation of financial statements that are free from material misstate-ment, whether due to fraud or error.
In preparing the financial statements, the Board of Directors and the President and CEO are responsible for assessing the parent company’s and the group’s ability to continue as going concern, disclosing, as applicable, matters relating to going concern and using the going concern basis of accounting. The financial statements are prepared using the going concern basis of accounting unless there is an intention to liquidate the parent company or the group or cease operations, or there is no realistic alternative but to do so.
Auditor’s responsibilities in the audit of financial statements Our objectives are to obtain reasonable assurance on whether the financial statements as a whole are free from material misstatement, whether due to fraud or error, and to issue an auditor’s report that includes our opinion. Reasonable assurance is a high level of assurance, but is not a guarantee that an audit conducted in accordance with good auditing practice will always detect a material misstatement when it exists. Misstatements can arise from fraud or error and are considered material if, individually or in aggregate, they could reasonably be expected to influence the economic decisions of users taken on the basis of the financial statements.
As part of an audit in accordance with good auditing practice, we exercise professional judgment and maintain professional skepticism throughout the audit. We also:• Identify and assess the risks of material misstatement of the financial statements, whether due
to fraud or error, design and perform audit procedures responsive to those risks, and obtain

74 Uponor Financial Review 2019
Key audit matter How our audit addressed the key audit matter
Goodwill impairment assessments
Refer to note 10.
Consolidated financial statements includes goodwill of EUR 83.6 million.
Management has conducted annual goodwill impairment testing and as a result of the testing conducted, management assessed that no impairment was needed.
Goodwill impairment testing requires substan-tial management judgment over the projected future business performance, cash flows and applied discount rate.
Certain assumptions made by management in the impairment review are key judgments, including gross profit rate, net sales and discount rates used. As described in note 10, management concluded that goodwill related to Uponor Infra, EUR 9.5 million, is more sensitive to risk of impairment.
This matter is a significant risk of material misstatement referred to in EU Regulation No 537/2014, point (c) of Article 10(2).
As part of our audit procedures we assessed the key assumptions by each cash generat-ing unit in impairment testing performed by management by:
• assessing the growth and profitability estimates and comparing them to histori-cal performance;
• comparing the estimates with the latest approved budgets and strategic plans;
• comparing applied discount rates to independent third party sources;
• testing the accuracy and the underlying calculations.
We also assessed the adequacy of the related disclosure information.
Key audit matter How our audit addressed the key audit matter
Provisions and contingent liabilities
Refer to note 21 and 25.
The provisions in total amounted to EUR 30.0 million in the consolidated financial statements of Uponor. In addition, the Group has disclosed open legal cases and other contingent liabilities in note 25.
The assessment of the existence of the present legal or constructive obliga-tion, analysis of the probability of the related payment and analysis of a reliable estimate, requires management’s judge-ment to ensure appropriate accounting or disclosures.
Due to the level of judgement relating to recognition, valuation and presentation of provisions and contingent liabilities, this is considered to be a key audit matter.
Our audit procedures included, among others, assessing the appropriateness of the manage-ment’s judgement.
We assessed the completeness of provisions through review of minutes of the Board meet-ings and decisions. We also had discussions with the group’s legal counsel and obtained formal confirmations from the group’s external counsels where appropriate.
We have assessed the appropriateness of presentation of the provisions and contingent liabilities in the consolidated financial statements.

75Uponor Financial Review 2019
audit evidence that is sufficient and appropriate to provide a basis for our opinion. The risk of not detecting a material misstatement resulting from fraud is higher than for one resulting from error, as fraud may involve collusion, forgery, intentional omissions, misrepresentations, or the override of internal control.
• Obtain an understanding of internal control relevant to the audit in order to design audit procedures that are appropriate in the circumstances, but not for the purpose of expressing an opinion on the effectiveness of the parent company’s or the group’s internal control.
• Evaluate the appropriateness of accounting policies used and the reasonableness of accounting estimates and related disclosures made by management.
• Conclude on the appropriateness of the Board of Directors’ and the President and CEO ’s use of the going concern basis of accounting and based on the audit evidence obtained, whether a material uncertainty exists related to events or conditions that may cast significant doubt on the parent company’s or the group’s ability to continue as a going concern. If we conclude that a material uncertainty exists, we are required to draw attention in our auditor’s report to the related disclosures in the financial statements or, if such disclosures are inadequate, to modify our opinion. Our conclusions are based on the audit evidence obtained up to the date of our auditor’s report. However, future events or conditions may cause the company to cease to continue as a going concern.
• Evaluate the overall presentation, structure and content of the financial statements, including the disclosures, and whether the financial statements represent the underlying transactions and events so that the financial statements give a true and fair view.
• Obtain sufficient appropriate audit evidence regarding the financial information of the entities or business activities within the group to express an opinion on the consolidated financial statements. We are responsible for the direction, supervision and performance of the group audit. We remain solely responsible for our audit opinion.We communicate with those charged with governance regarding, among other matters, the
planned scope and timing of the audit and significant audit findings, including any significant deficiencies in internal control that we identify during our audit.
We also provide those charged with governance with a statement that we have complied with relevant ethical requirements regarding independence, and communicate with them all relationships and other matters that may reasonably be thought to bear on our independence, and where applicable, related safeguards.
From the matters communicated with those charged with governance, we determine those matters that were of most significance in the audit of the financial statements of the current period and are therefore the key audit matters. We describe these matters in our auditor’s report unless law or regulation precludes public disclosure about the matter or when, in extremely rare circumstances, we determine that a matter should not be communicated in our report because the adverse consequences of doing so would reasonably be expected to outweigh the public interest benefits of such communication.
Other reporting requirements
Information on our audit engagementWe were first appointed as auditors by the Annual General Meeting on 2010, and our appoint-ment represents a total of uninterrupted engagement of 10 years.
Other informationThe Board of Directors and the President and CEO are responsible for the other information. The other information comprises the report of the Board of Directors and the information included in the Annual Report, but does not include the financial statements and our report thereon. We have obtained the report of the Board of Directors prior to the date of the auditor’s report, and the Annual Report is expected to be made available to us after that date. Our opinion on the financial statements does not cover the other information.
In connection with our audit of the financial statements, our responsibility is to read the other information identified above and, in doing so, consider whether the other information is materially inconsistent with the financial statements or our knowledge obtained in the audit, or otherwise appears to be materially misstated. With respect to report of the Board of Directors, our responsi-bility also includes considering whether the report of the Board of Directors has been prepared in accordance with the applicable laws and regulations.
In our opinion, the information in the report of the Board of Directors is consistent with the information in the financial statements and the report of the Board of Directors has been prepared in accordance with the applicable laws and regulations.
If, based on the work we have performed on the other information that we obtained prior to the date of this auditor’s report, we conclude that there is a material misstatement of this other information, we are required to report that fact. We have nothing to report in this regard.
Other opinionsWe support that the financial statements should be adopted. The proposal by the Board of Directors regarding the treatment of distributable funds is in compliance with the Limited Liability Companies Act. We support that the Board of Directors of the parent company and the President and CEO should be discharged from liability for the financial period audited by us.
Vantaa, 12 February 2020
Deloitte OyAudit Firm
Jukka VattulainenAuthorised Public Accountant (KHT)

Uponor CorporationÄyritie 20P.O. Box 37FI-01511 VantaaFinland
Tel. +358 (0)20 129 211www.uponor.comwww.investors.uponor.com