Embed Size (px)
Citation preview
Report of Visiting Scientist mission NWP_AS18_01
Document NWPSAF-MO-VS-058
Version 1.0
18-01-19
Updating the CAMEL surface emissivity atlas for RTTOV
Eva Borbas and Michelle Feltz
Space Science and Engineering Center, University of Wisconsin, Madison, WI, USA
Updating the CAMEL surface emissivity atlas for
RTTOV
Doc ID : NWP-MO-VS-058 Version : 1.0 Date : 18/1/19
Updating the CAMEL surface emissivity atlas for RTTOV
Eva Borbas and Michelle Feltz (SSEC)
This documentation was developed within the context of the EUMETSAT Satellite Application Facility on Numerical Weather Prediction (NWP SAF), under the Cooperation Agreement dated 7 December 2016, between EUMETSAT and the Met Office, UK, by one or more partners within the NWP SAF. The partners in the NWP SAF are the Met Office, ECMWF, DWD and Météo France. Copyright 2019, EUMETSAT, All Rights Reserved.
Change record Version Date Author / changed by Remarks
0.1 20/12/18 E. Borbas/M. Feltz Draft version
0.2 23/12/18 E. Borbas/M. Feltz Incorporated comments from R. Saunders
1.0 18/1/19 E. Borbas/M. Feltz/S. Pullen Formatted for publication
1
THE RTTOV CAMEL MODULE
UPDATING THE CAMEL SURFACE EMISSIVITY ATLAS FOR RTTOV
EVA BORBAS AND MICHELLE FELTZ SPACE SCIENCE AND ENGINEERING CENTER,
UNIVERSITY OF WISCONSIN, MADISON, WI, USA
FINAL REPORT
EUMETSAT, NWP SAF AS MISSION NWP_AS18_01
Change record Version Date Author/changed by Remarks 0.1 Dec/20/2018 E. Borbas (UW/SSEC)
M. Feltz (UW/SSEC)
1.0 Jan/18/2019 E. Borbas (UW/SSEC) M. Feltz (UW/SSEC)
2
Table of Contents
1. Introduction ....................................................................................................................... 3
2. Data ....................................................................................................................................... 4 2.1 Laboratory Datasets ................................................................................................................... 5 2.2 Climatology of the CAMEL PCA Coefficients ....................................................................... 6 2.3 CAMEL Variances ......................................................................................................................... 8
3. Snow Correction ............................................................................................................ 10
4. Evaluation ........................................................................................................................ 11 4.1 Evaluation over selected case sites .................................................................................... 11 4.2 Evaluation with IASI calculated brightness temperatures ........................................ 15
5. Uncertainty of the climatological CAMEL data ................................................... 20
6. Conclusions and future plans ................................................................................... 25 Acknowledgments: .......................................................................................................................... 26
7. References ....................................................................................................................... 26
3
Scope This document describes the scientific approach to a study that was performed by Principal Investigator Eva Borbas and Michelle Feltz at the University of Wisconsin-Madison Space Science and Engineering Center (UW-SSEC) under contract to the EUMETSAT NWP-SAF between 1 May and 31 December 2018. This is a continuation of a previous NWP SAF AS mission (NWP_VS13_01) during which an RTTOV IR emissivity (RTTOV-UWiremis) module and IR global land surface emissivity atlas with a viewing angle dependence had been developed for RTTOV 10 and 11. The aim of this mission is to develop an improved global land surface infrared emissivity atlas for RTTOV-v12.3 and beyond. This will enable more accurate simulations of infrared sensors over land (both radiometers and hyperspectral sounders). The current version of the RTTOV12 CAMEL module is based on the NASA MEaSUREs CAMEL monthly mean land surface emissivity dataset’s year of 2007. This single year was chosen due to its high quality and more accurate representation of the CAMEL emissivity climatology than other years; however, it is advantageous to update the module so that it is based on the actual, full CAMEL climatology which is calculated from the time period 2000 through 2016. Additionally, in the current RTTOV CAMEL emissivity module, the error covariance matrix is still based on the UWiremis database. It would be beneficial to replace this version with the PC compressed high spectral and spatial (5km) resolution matrices based on the CAMEL data. While not done under this mission, the CAMEL climatology includes monthly mean emissivity uncertainties which could in the future be added to the CAMEL module for better emissivity estimations. This document details these datasets and updates.
1. Introduction Numerical weather prediction (NWP) models require fast radiative transfer algorithms to compute the outgoing emission spectrum at spectral resolutions and channel spacing relevant to satellite observations (Saunders et al. 1999, Saunders et al. 2018). In the infrared portion of the spectrum both the surface skin temperature and the infrared spectral emissivity is a required input to compute the upwelling surface emission. This surface emission is transmitted through the atmosphere along a slant path where gaseous absorption and emission create additional spectral features. The molecular absorption typically creates narrow line features requiring observations with relatively high spectral resolution to separate the gaseous absorption from the more slowly varying spectral features of surface minerals and vegetation (Salisbury and D’Aria 1992, 1994; Knuteson et al. 2004). Prior to the development of global land surface emissivity datasets most NWP models used a constant value of 0.98 for all infrared wavelengths. Since the launch of the NASA EOS Terra and Aqua satellites and the EUMETSAT MetOp-A satellite, a more realistic representation of the spectral dependence of infrared emissivity has been derived by several groups (Capelle et al. 2012; Péquignot et al. 2008; Wan and Li 1997; Zhou et al. 2011, 2013). In 2013, the authors started to create a unified infrared emissivity database that uses selected emissivity products as input and independent satellite observations for validation. In this work, the inputs chosen are a combination of NASA MODIS and ASTER sensor narrowband measurements. For validation, the hyperspectral infrared MetOp IASI observations are used in conjunction with infrared radiative transfer. The current approach builds upon the
4
successful UWiremis land surface dataset developed by the authors at the University of Wisconsin-Madison in 2007 (Seeman et al. 2008). MODIS monthly emissivity measurements produced at 5km spatial resolution by the NASA Goddard data processing facility using the Wan day/night algorithm (Wan and Li, 1997) have been extended to high resolution spectral infrared coverage using a principal component representation of laboratory data measurements (Seeman et al. 2008). This dataset has been extensively used in research and operational applications primarily through incorporation into the RTTOV radiative transfer model (Borbas and Ruston 2011; Saunders et al. 2018). Subsequently, an emissivity atlas derived from the NASA/JAXA ASTER sensor was incorporated to augment the spectral coverage of the MODIS sensor in critical wavelengths and to stabilize the time dependence of the operational MODIS emissivity product. The ASTER Global Emissivity Dataset (ASTER GED) was created by collaborators at the Jet Propulsion Laboratory (JPL) to provide thermal emission emissivity measurements at 100 meter resolution (Hulley and Hook 2009; Hulley et al. 2015). The dataset which combines the MODIS and ASTER emissivity products is called the Combined ASTER MODIS Emissivity over Land (CAMEL) dataset (Borbas et al. 2018; Feltz et al. 2018a; Hook 2017). The CAMEL product files were generated using funding from the NASA MEaSUREs program. The CAMEL dataset contains 16+ years of monthly mean averaged data (2000-04-01 to 2016-12-31) at 0.05 degree resolution for non-ocean grid cells. The climatology described here uses an updated version of the monthly CAMEL dataset, V002, to produce a statistical representation which can be used as an a priori in optimal estimation retrieval methods or as a background first guess in radiative transfer calculations.
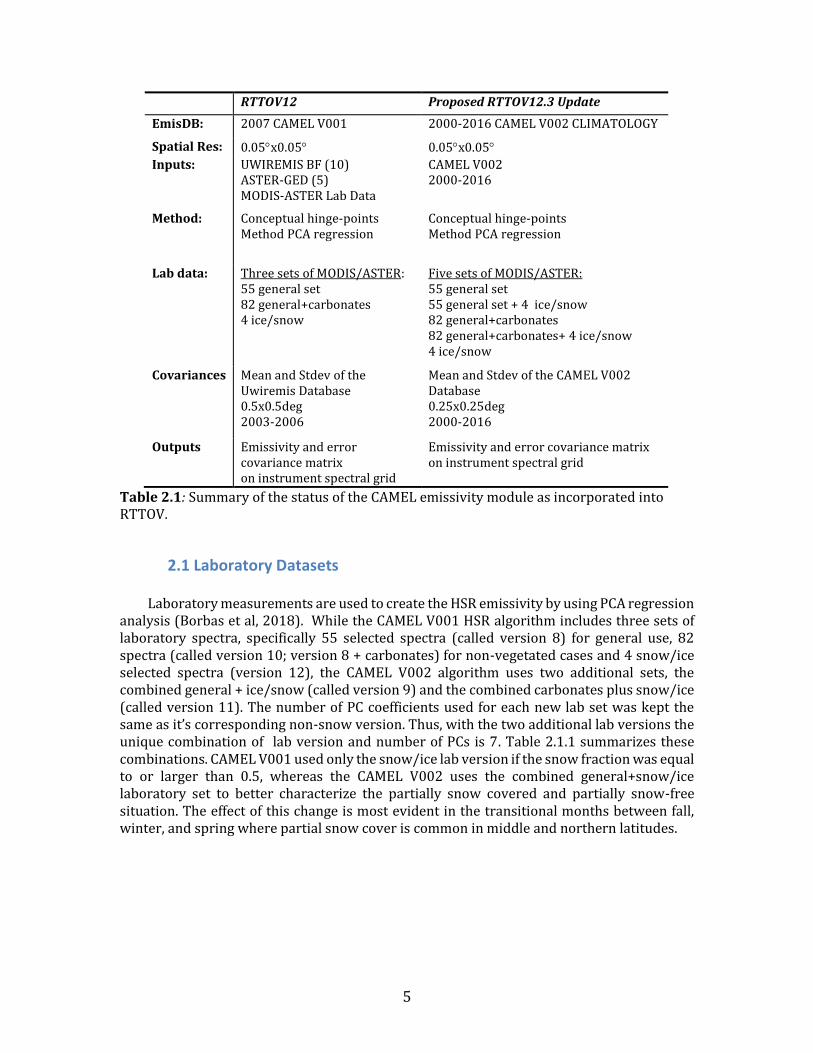
2. Data The CAMEL V001 is currently publicly available from the NASA Land Processes (LP) Distributed Active Archive Center (CDAAC) at the following link: https://lpdaac.usgs.gov/dataset_discovery/measures/measures_products_table/cam5k30em_v001 with the following DOI: 10.5067/MEaSUREs/LSTE/CAM5K30EM.001. The CAMEL data citation is also shown in the reference list (Hook 2017). The CAMEL v002 dataset used in this study is expected to be released officially in 2019. The CAMEL climatology based on V002 can be obtained prior to public release by contacting Eva Borbas ([email protected]). The initial integration of the CAMEL V001 dataset into RTTOV was accomplished for RTTOV version 12 and is currently available for download from the UK Met Office (Saunders et al. 2018). The changes in the “CAMEL V002 CLIMATOLOGY” version of the new RTTOV IR emis module are summarized in Table 1. The changes include the use of CAMEL V002 which includes an improved representation of fractional snow cover and the use of the climatological mean over the 2000-2016 time period in place of the single year 2007 used previously.
5
Table 2.1: Summary of the status of the CAMEL emissivity module as incorporated into RTTOV.
2.1 Laboratory Datasets
Laboratory measurements are used to create the HSR emissivity by using PCA regression analysis (Borbas et al, 2018). While the CAMEL V001 HSR algorithm includes three sets of laboratory spectra, specifically 55 selected spectra (called version 8) for general use, 82 spectra (called version 10; version 8 + carbonates) for non-vegetated cases and 4 snow/ice selected spectra (version 12), the CAMEL V002 algorithm uses two additional sets, the combined general + ice/snow (called version 9) and the combined carbonates plus snow/ice (called version 11). The number of PC coefficients used for each new lab set was kept the same as it’s corresponding non-snow version. Thus, with the two additional lab versions the unique combination of lab version and number of PCs is 7. Table 2.1.1 summarizes these combinations. CAMEL V001 used only the snow/ice lab version if the snow fraction was equal to or larger than 0.5, whereas the CAMEL V002 uses the combined general+snow/ice laboratory set to better characterize the partially snow covered and partially snow-free situation. The effect of this change is most evident in the transitional months between fall, winter, and spring where partial snow cover is common in middle and northern latitudes.
RTTOV12 Proposed RTTOV12.3 Update
EmisDB: 2007 CAMEL V001 2000-2016 CAMEL V002 CLIMATOLOGY
Spatial Res: 0.05x0.05 0.05x0.05
Inputs: UWIREMIS BF (10) ASTER-GED (5) MODIS-ASTER Lab Data
CAMEL V002 2000-2016
Method: Conceptual hinge-points Method PCA regression
Conceptual hinge-points Method PCA regression
Lab data: Three sets of MODIS/ASTER: 55 general set 82 general+carbonates 4 ice/snow
Five sets of MODIS/ASTER: 55 general set 55 general set + 4 ice/snow 82 general+carbonates 82 general+carbonates+ 4 ice/snow 4 ice/snow
Covariances Mean and Stdev of the Uwiremis Database 0.5x0.5deg 2003-2006
Mean and Stdev of the CAMEL V002 Database 0.25x0.25deg 2000-2016
Outputs Emissivity and error covariance matrix on instrument spectral grid
Emissivity and error covariance matrix on instrument spectral grid
6
Lab version #
Description Number of lab spectra
Number of PCs
Snow fraction
V8.3 General - bare (quartz) - all types
55 9 7
=0 =0
V9.3 General + snow/ice – bare (quartz) - all types
55+4 9 7
0< <1 0< <1
V10.3 General + carbonates 82 5 =0
V11.3 General + carbonates + snow/ice 82+4 5 0< <1
V12.3 Snow/Ice 4 2 =1
Table 2.1.1: Laboratory Datasets of CAMEL V002.
2.2 Climatology of the CAMEL PCA Coefficients The CAMEL V002 climatology is planned to be made available through NASA’s LP DAAC in 2019. The official distribution of this dataset will include a climatology of the CAMEL 13 hinge point and HSR emissivity. The 13 hinge point climatology will be provided in two separate files for each month—one containing the emissivity and one containing the corresponding uncertainty, similar to the CAMEL monthly product. The HSR emissivity climatology will be provided as separate files of compressed PC coefficients and 5 lab emissivity datasets with Matlab and Fortran software to compute the HSR emissivity using the PC coefficients and lab data. This report shows results made with the pre-distribution version of this climatology dataset. To obtain the climatological PC coefficients, the multi-year average of the CAMEL PC coefficients is computed for each calendar month (January-December). In computing the average, however, the coefficients corresponding to unique combinations of number of PCs used and lab dataset version need to be kept separate. Table 2.2.1 summarizes each of the unique combinations. For example, the snow+general catergory’s 7 PC/lab version 9 coefficients need to be averaged separately from the snow+general catergory’s 9 PC/lab version 9 coefficients, as well as separately from the snow category’s 2 PC/lab version 12 coefficients. From each unique set of coefficients an HSR emissivity spectrum can then be computed. The HSR emissivity spectra from each unique set are then combined by a weighting based on the number of years of each type to obtain the multi-year climatological mean. Table 2.2.1: The seven unique combinations of lab versions and datasets which comprise the CAMEL multi-year climatology. The version of laboratory coefficients set (labvs_of_coef_set) and number of PC coefficients (npcs_of_coef_set) used for reconstructions are listed for each.
CAMEL Clim Class 1 2 3 4 5 6 7 labvs_of_coef_set 12 10 11 8 8 9 9 npcs_of_coef_set 2 5 5 7 9 7 9
7
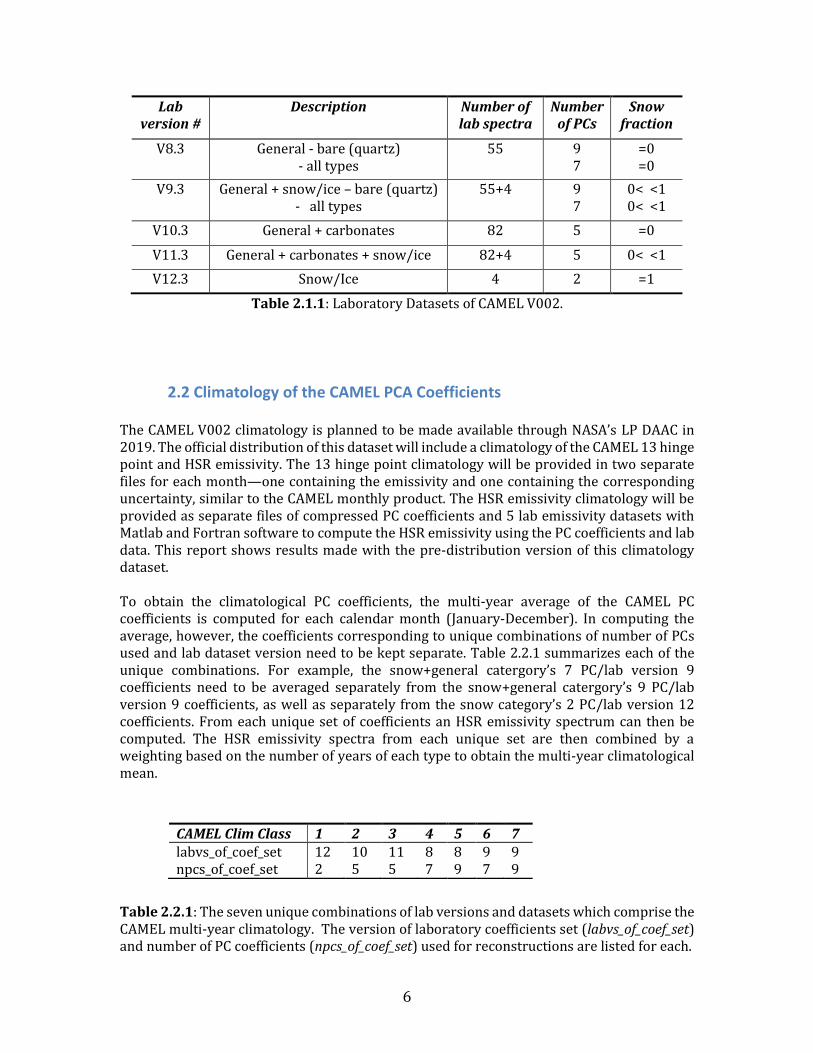
Figure 2.2.1 demonstrates how the CAMEL climatological emissivity spectra are derived for the month of March over the Park Falls, WI tall tower site. The blue star on the left top panel shows the geographical location of Park Falls in Northern Wisconsin within the sub-boreal forest zone of North America. This location is within an extensive pine forest interspersed with wetlands. At 45 N latitude it typically maintains snow cover between November and May, however the pine trees are typically not snow covered due to the action of wind thus the most common winter land cover is a mixture of vegetation and snow. A special class was developed for this partial snow situation represented by lab V9. The bottom right panels show the two types of lab versions (V12-snow/ice only and V9–combined snow/ice plus general vegetation cases) with the corresponding number of samples of each. The bottom left panel shows the average HSR spectra for each lab version and the corresponding weighting in the multi-year average (shown in legend) which occurred over the 16+ years of the CAMEL record. The weighted average of the corresponding HSR spectra is used to calculate the final climatological emissivity spectra which are shown overlaid in the bottom left panel. The top right panel of Figure 2.2.1 compares the same HSR climatological spectra computed from the climatological coefficients (dashed red line) and a HSR climatology computed directly from the individual monthly HSR emissivities (solid blue line, with faded blue lines showing the monthly spectra). The identical nature of these two resulting spectra proves that the computation methods are equivalent. However, the storage of the coefficients and the weights provides a much more efficient storage scheme and results in a smaller file size. For this reason the coefficient method was selected for the CAMEL climatology. In contrast to the HSR method, the multi-year average of the CAMEL 13 hinge point emissivity is plotted (in black) from the monthly 13 hinge points. The HSR method benefits from the multi-spectral consistency of the laboratory spectra to provide improved accuracy in the 12 and 14 micron region.
Figure 2.2.1: CAMEL climatological emissivity spectra for the month of March over Park Falls, WI site. The blue star on the left top panel shows the geographic location, and the left bottom panel illustrates HSR spectra for two types of lab versions/# of PCs (V12-snow/ice only and V9–combined snow/ice and general cases) with their weights (in legend) which occurred over the 16+ years. The black line is the climatological HSR emissivity spectra. The top right panel illustrates the same HSR climatological spectra (dashed red line) and the individual monthly emissivities (faded blue lines) and their average (solid blue line). The black line stands for the CAMEL 13 hinge point climatology. The middle panel shows the
8
standard deviation of both the HSR and 13 hinge point climatological spectra. The bottom two panels illustrate the histograms of the number of PCs (left) and the lab versions (right) which occurred over the climatology.
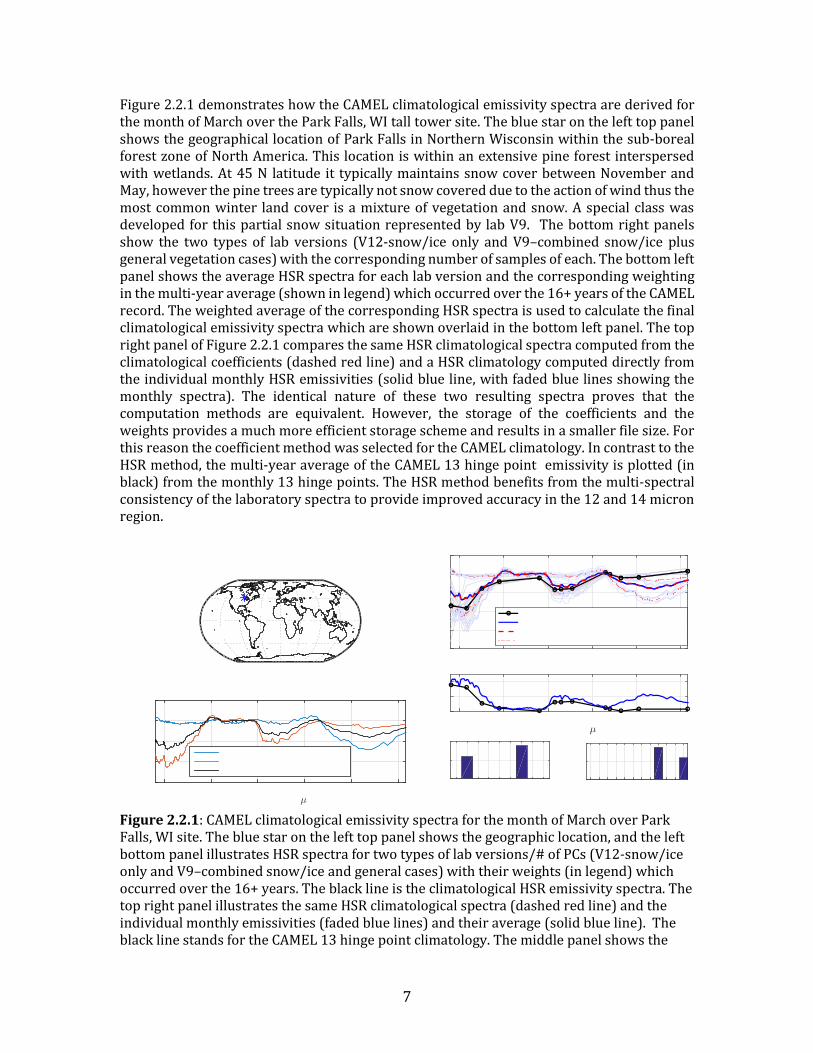
2.3 CAMEL Variances For NWP data assimilation the inter-channel correlation of the observations is important to account for the lack of independence of the spectral observations (Desroziers et al. 2005). NWP users are anticipated to compute the observation covariance for themselves using the RTTOV model with the CAMEL emissivity module. However, ease of use a spatial variance estimate of the V002 CAMEL CLIM database has been created for each month on a 0.25x0.25 degree grid on the full 417 channel set. The mean and the diagonal of the covariance matrix is computed from 25 pixels (corresponding to a 5x5 pixel set) of the original 0.05-degree resolution V002 CAMEL climatology which results in 400 emissivity spectra over 16 years for each 0.25x0.25 degree grid cell. No threshold for the number of observations was applied, but the data files include this information for user application. Figure 2.3.1 illustrates the standard deviation of the CAMEL climatology database at 4, 8.5, 10.8 and 12 m for the month of June. The highest variation occurs at 4 m. Generally the high variation at 8.5 m correlates with sparsely vegetated regions. At 10.8 and 12 m the variations are the smallest. Figure 2.3.1: Standard deviation of the CAMEL CLIM database at 4, 8.5, 10.8 and 12 m for the month of June.
9
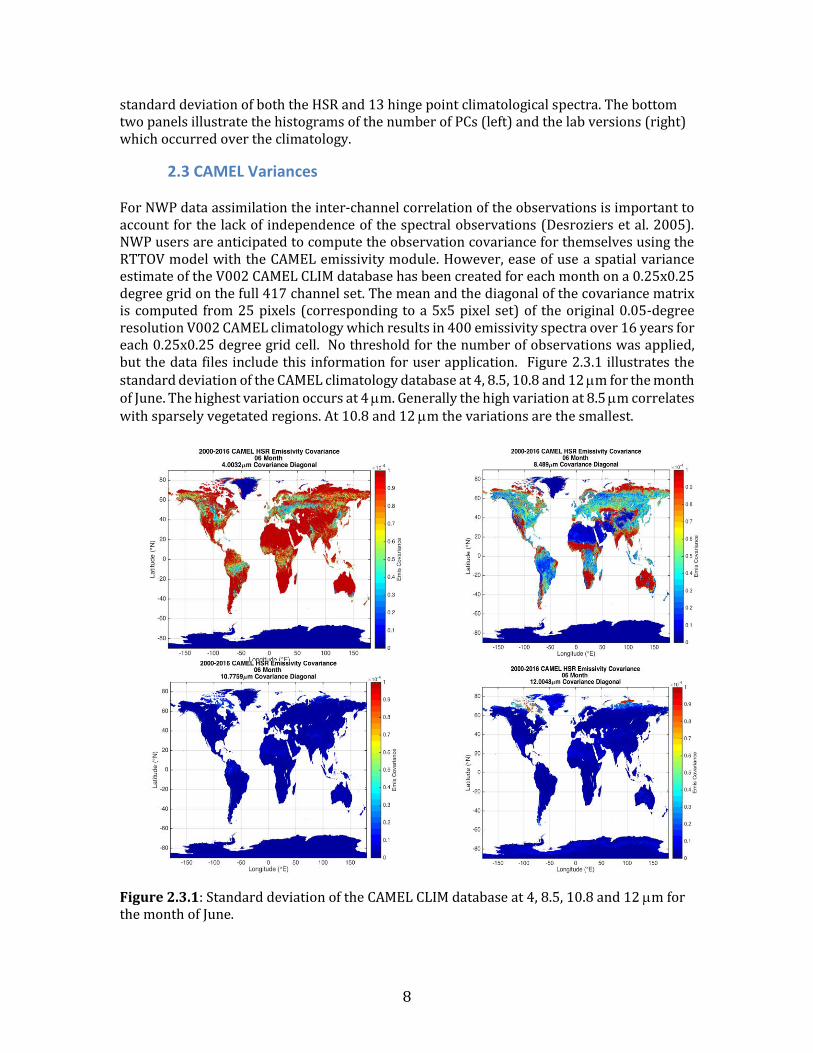
The differences between the previous RTTOV UWiremis and the new RTTOV CAMEL V002 variances for June are shown on Figure 2.3.2. Most of the differences are due to the use a longer data record in the CAMEL climatology however some of the differences reflect the improvement in the handling of partial snow fraction between 0 and 1 and the use of ASTER data at 9 microns. The same error estimation (mean and variance) of sea-ice and snow emissivity spectra that is included in the UWiremis module is also used in the RTTOV CAMEL CLIM module through the snow correction method described in Section 3. Due to the large uncertainty in the effective surface emitting temperature, standard deviations of the snow and sea-ice emissivity are conservatively set to 0.015 as a global estimate. Figure 2.3.2. Standard deviation differences between the CAMEL CLIM (0.25deg) and UWIRemis (0.5deg) databases at 4, 8.5, 10.8 and 12 m for the month of June.
10
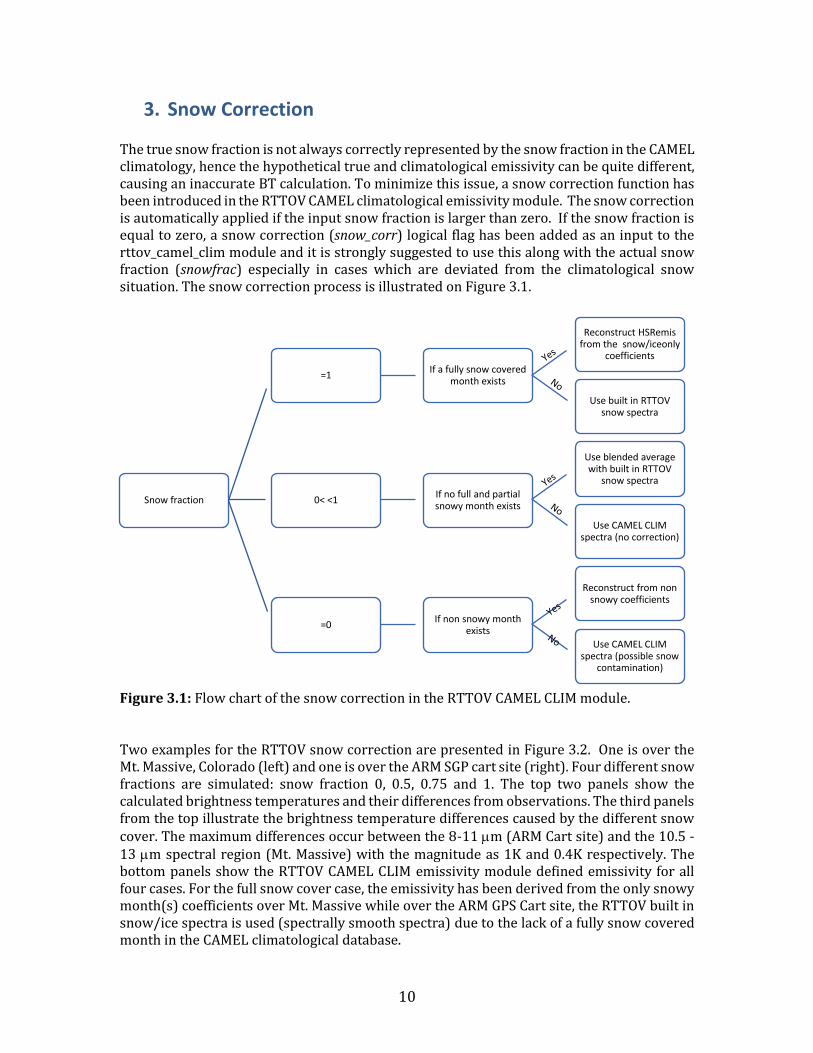
3. Snow Correction The true snow fraction is not always correctly represented by the snow fraction in the CAMEL climatology, hence the hypothetical true and climatological emissivity can be quite different, causing an inaccurate BT calculation. To minimize this issue, a snow correction function has been introduced in the RTTOV CAMEL climatological emissivity module. The snow correction is automatically applied if the input snow fraction is larger than zero. If the snow fraction is equal to zero, a snow correction (snow_corr) logical flag has been added as an input to the rttov_camel_clim module and it is strongly suggested to use this along with the actual snow fraction (snowfrac) especially in cases which are deviated from the climatological snow situation. The snow correction process is illustrated on Figure 3.1.
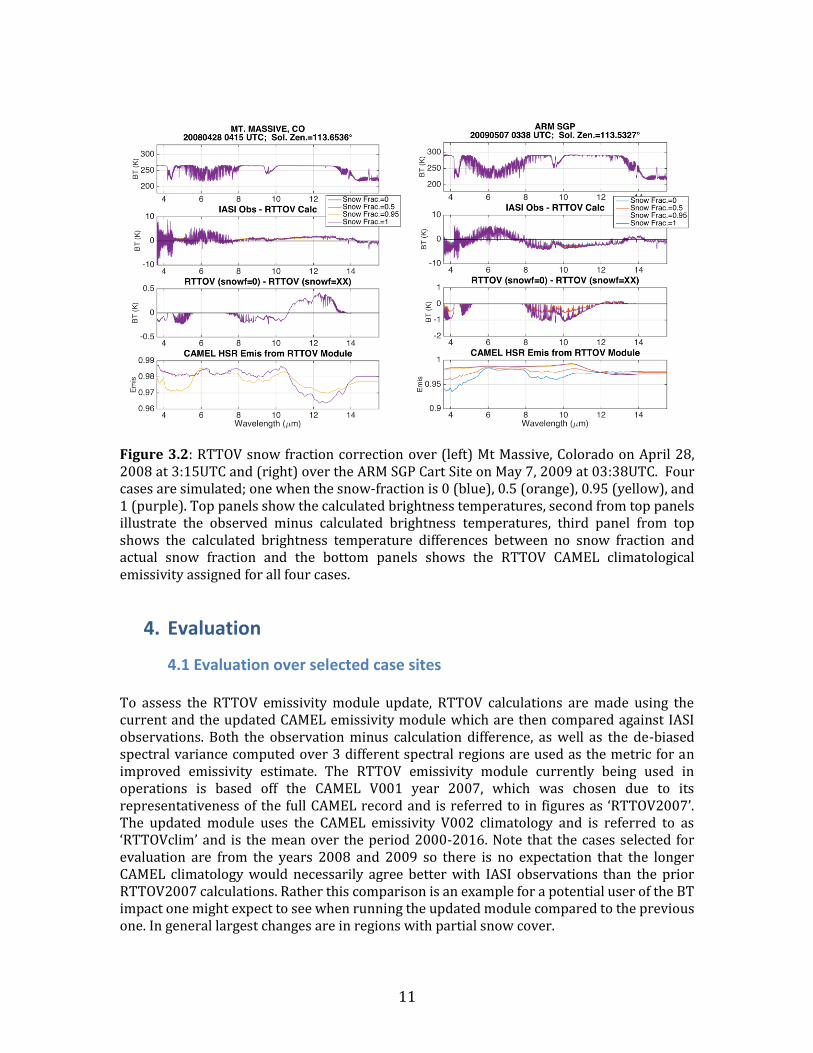
Figure 3.1: Flow chart of the snow correction in the RTTOV CAMEL CLIM module. Two examples for the RTTOV snow correction are presented in Figure 3.2. One is over the Mt. Massive, Colorado (left) and one is over the ARM SGP cart site (right). Four different snow fractions are simulated: snow fraction 0, 0.5, 0.75 and 1. The top two panels show the calculated brightness temperatures and their differences from observations. The third panels from the top illustrate the brightness temperature differences caused by the different snow cover. The maximum differences occur between the 8-11 m (ARM Cart site) and the 10.5 -13 m spectral region (Mt. Massive) with the magnitude as 1K and 0.4K respectively. The bottom panels show the RTTOV CAMEL CLIM emissivity module defined emissivity for all four cases. For the full snow cover case, the emissivity has been derived from the only snowy month(s) coefficients over Mt. Massive while over the ARM GPS Cart site, the RTTOV built in snow/ice spectra is used (spectrally smooth spectra) due to the lack of a fully snow covered month in the CAMEL climatological database.
Snow fraction
=1If a fully snow covered
month exists
Reconstruct HSRemisfrom the snow/iceonly
coefficients
Use built in RTTOV snow spectra
0< <1If no full and partial snowy month exists
Use blended average with built in RTTOV
snow spectra
Use CAMEL CLIM spectra (no correction)
=0If non snowy month
exists
Reconstruct from non snowy coefficients
Use CAMEL CLIM spectra (possible snow
contamination)
11
Figure 3.2: RTTOV snow fraction correction over (left) Mt Massive, Colorado on April 28, 2008 at 3:15UTC and (right) over the ARM SGP Cart Site on May 7, 2009 at 03:38UTC. Four cases are simulated; one when the snow-fraction is 0 (blue), 0.5 (orange), 0.95 (yellow), and 1 (purple). Top panels show the calculated brightness temperatures, second from top panels illustrate the observed minus calculated brightness temperatures, third panel from top shows the calculated brightness temperature differences between no snow fraction and actual snow fraction and the bottom panels shows the RTTOV CAMEL climatological emissivity assigned for all four cases.
4. Evaluation
4.1 Evaluation over selected case sites To assess the RTTOV emissivity module update, RTTOV calculations are made using the current and the updated CAMEL emissivity module which are then compared against IASI observations. Both the observation minus calculation difference, as well as the de-biased spectral variance computed over 3 different spectral regions are used as the metric for an improved emissivity estimate. The RTTOV emissivity module currently being used in operations is based off the CAMEL V001 year 2007, which was chosen due to its representativeness of the full CAMEL record and is referred to in figures as ‘RTTOV2007’. The updated module uses the CAMEL emissivity V002 climatology and is referred to as ‘RTTOVclim’ and is the mean over the period 2000-2016. Note that the cases selected for evaluation are from the years 2008 and 2009 so there is no expectation that the longer CAMEL climatology would necessarily agree better with IASI observations than the prior RTTOV2007 calculations. Rather this comparison is an example for a potential user of the BT impact one might expect to see when running the updated module compared to the previous one. In general largest changes are in regions with partial snow cover.
12
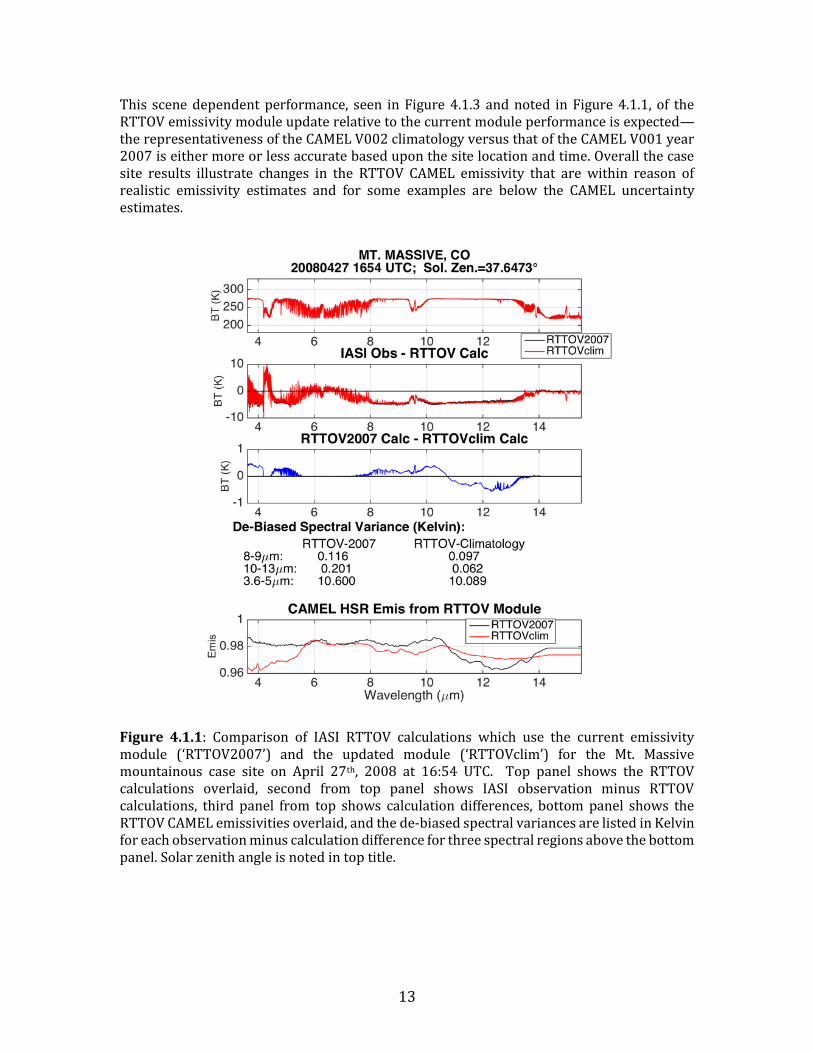
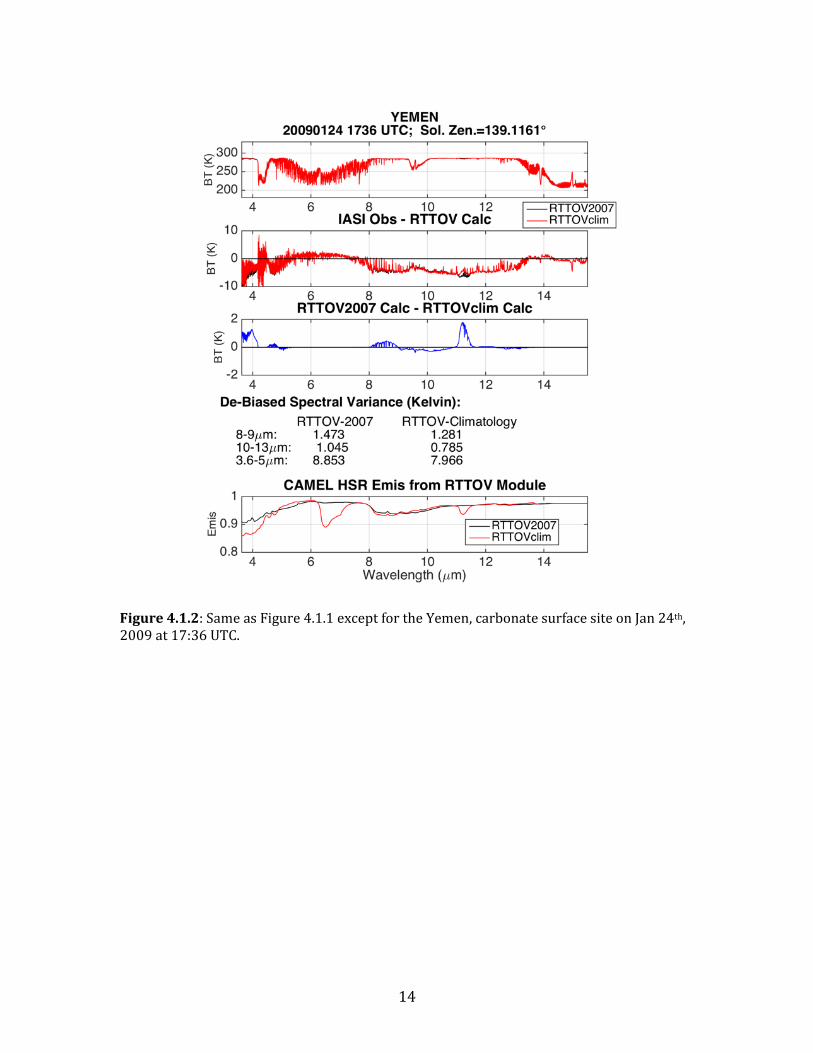
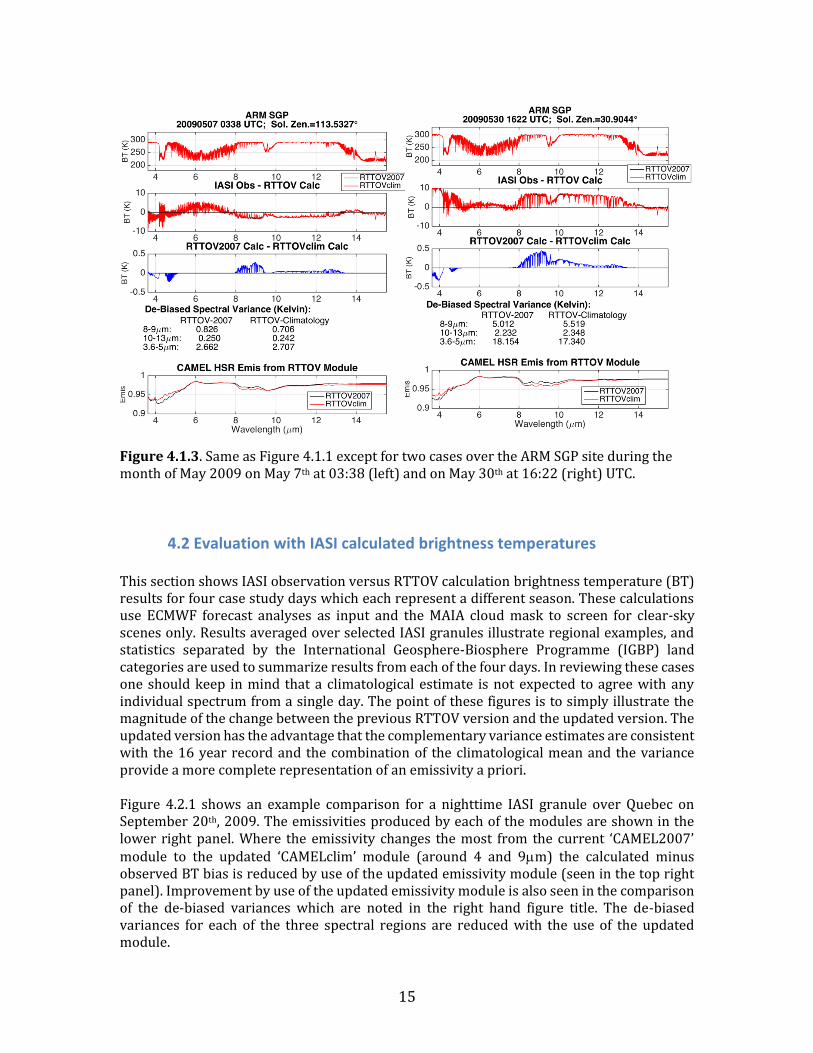
This section shows results for selected case site examples. RTTOV IASI brightness temperatures are computed at the IASI footprint location which is closest to the selected site latitude and longitude. With this method, the difference between the IASI observation and calculation is dominated by the atmospheric state error. For these calculations, the IASI solar zenith angle and ERA-Interim reanalysis is used as input, including the ERA atmospheric pressure, temperature, water vapor, ozone, skin temperature, and surface pressure. The ERA-Interim cloud fraction is also used to screen for only clear-sky cases. Figure 4.1.1 shows results for a mountainous site in April located over Mt. Massive in the Colorado Rocky Mountains at 16:54 UTC (9:54 local time). The observation minus calculation differences in the second from top panel show a small reduction in the observation-minus-calculation bias from about 3.6 to 10.8 m and a small increase from about 10.8 to 13.5 m. The large obs-cal window difference suggests a large skin temperature error in the NWP model value used in the calculation. The difference of the two RTTOV calculations shown in the third from top panel are under 0.5 K magnitude, and the corresponding CAMEL emissivities used in the RTTOV emissivity module are shown overlaid in the bottom panel. For this case, the CAMEL V001 2007 emissivity module used a pure snow/ice spectrum, while the V002 climatology module shows a very subtle quartz signature in a dominantly snow/ice spectrum. The de-biased spectral variance for the observation minus calculation difference is listed for three spectral regions, each which show the updated RTTOV emissivity module to be a slight improvement. While not shown here, other similar case site results for Mt. Massive at the same local time and for the same month of April did not show an improvement with the updated module and had de-biased variances which slightly increased for the 8-9 and 3.6-5 m regions. So, though the updated CAMEL RTTOV module does not show a positive impact across all case sites for a given month, it expected to characterize a larger majority of cases more accurately. Figure 4.1.2 shows results for Yemen, a carbonate surface site during the month of January at 17:36 UTC (20:36 local time). The updated, climatological emissivity module produces a spectrum with carbonate features around 7 and 11.4 m while the current module does not. Though the added 11.4 m carbonate feature is smaller than the 7 m feature, it has an almost 2 K larger impact on the calculated brightness temperature (see third from top panel), thereby decreasing the observation minus calculation difference in that spectral region (see second from top panel). Though the observation minus calculation difference for the current RTTOV emissivity module (‘RTTOV2007’) is equal to and in some regions (i.e. around 10m) less than the difference for the updated module, the de-biased spectral variances show the updated module to be an improvement for each of the three spectral regions. Figure 4.1.3 shows a side by side comparison of results for two case study examples – both over the Atmospheric Radiation Measurement (ARM) Southern Great Plains (SGP) grassland site in the month of May 2009. In one of the examples the RTTOV calculations are performed and compared for a daytime IASI observation (16:22 UTC or 9:22 local time, right panel of Fig. 4.1.3) and the other for a nighttime IASI observation (3:38 UTC or 22:38 local time, left panel of Fig. 4.1.3). This comparison exemplifies how the effect of the updated RTTOV emissivity module can be scene dependent, for example the de-biased spectral variances that are decreased with use of the updated emissivity module for the daytime example are increased for the nighttime and vice versa. However, the window channels are dominated by having an NWP model skin temperature that does not match the observation skin temperature and should not be considered an error in the emissivity spectrum.
13
This scene dependent performance, seen in Figure 4.1.3 and noted in Figure 4.1.1, of the RTTOV emissivity module update relative to the current module performance is expected—the representativeness of the CAMEL V002 climatology versus that of the CAMEL V001 year 2007 is either more or less accurate based upon the site location and time. Overall the case site results illustrate changes in the RTTOV CAMEL emissivity that are within reason of realistic emissivity estimates and for some examples are below the CAMEL uncertainty estimates.
Figure 4.1.1: Comparison of IASI RTTOV calculations which use the current emissivity module (‘RTTOV2007’) and the updated module (‘RTTOVclim’) for the Mt. Massive mountainous case site on April 27th, 2008 at 16:54 UTC. Top panel shows the RTTOV calculations overlaid, second from top panel shows IASI observation minus RTTOV calculations, third panel from top shows calculation differences, bottom panel shows the RTTOV CAMEL emissivities overlaid, and the de-biased spectral variances are listed in Kelvin for each observation minus calculation difference for three spectral regions above the bottom panel. Solar zenith angle is noted in top title.
14
Figure 4.1.2: Same as Figure 4.1.1 except for the Yemen, carbonate surface site on Jan 24th, 2009 at 17:36 UTC.
15
Figure 4.1.3. Same as Figure 4.1.1 except for two cases over the ARM SGP site during the month of May 2009 on May 7th at 03:38 (left) and on May 30th at 16:22 (right) UTC.
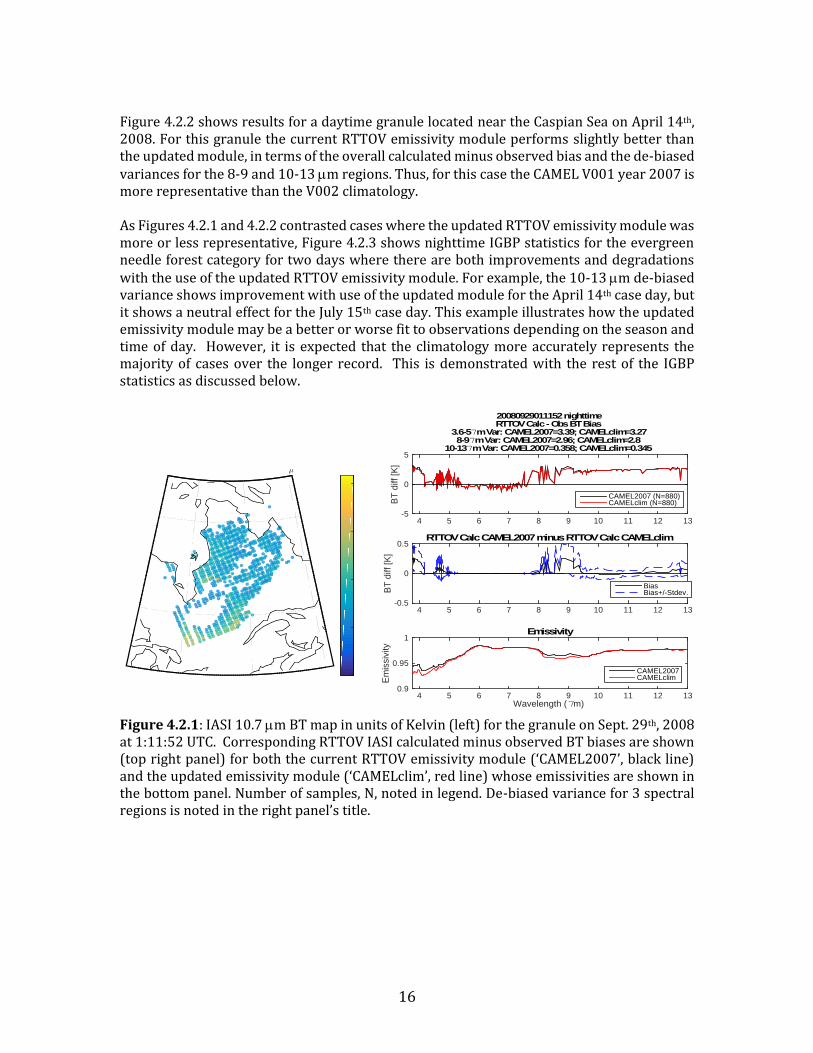
4.2 Evaluation with IASI calculated brightness temperatures This section shows IASI observation versus RTTOV calculation brightness temperature (BT) results for four case study days which each represent a different season. These calculations use ECMWF forecast analyses as input and the MAIA cloud mask to screen for clear-sky scenes only. Results averaged over selected IASI granules illustrate regional examples, and statistics separated by the International Geosphere-Biosphere Programme (IGBP) land categories are used to summarize results from each of the four days. In reviewing these cases one should keep in mind that a climatological estimate is not expected to agree with any individual spectrum from a single day. The point of these figures is to simply illustrate the magnitude of the change between the previous RTTOV version and the updated version. The updated version has the advantage that the complementary variance estimates are consistent with the 16 year record and the combination of the climatological mean and the variance provide a more complete representation of an emissivity a priori. Figure 4.2.1 shows an example comparison for a nighttime IASI granule over Quebec on September 20th, 2009. The emissivities produced by each of the modules are shown in the lower right panel. Where the emissivity changes the most from the current ‘CAMEL2007’ module to the updated ‘CAMELclim’ module (around 4 and 9m) the calculated minus observed BT bias is reduced by use of the updated emissivity module (seen in the top right panel). Improvement by use of the updated emissivity module is also seen in the comparison of the de-biased variances which are noted in the right hand figure title. The de-biased variances for each of the three spectral regions are reduced with the use of the updated module.
16
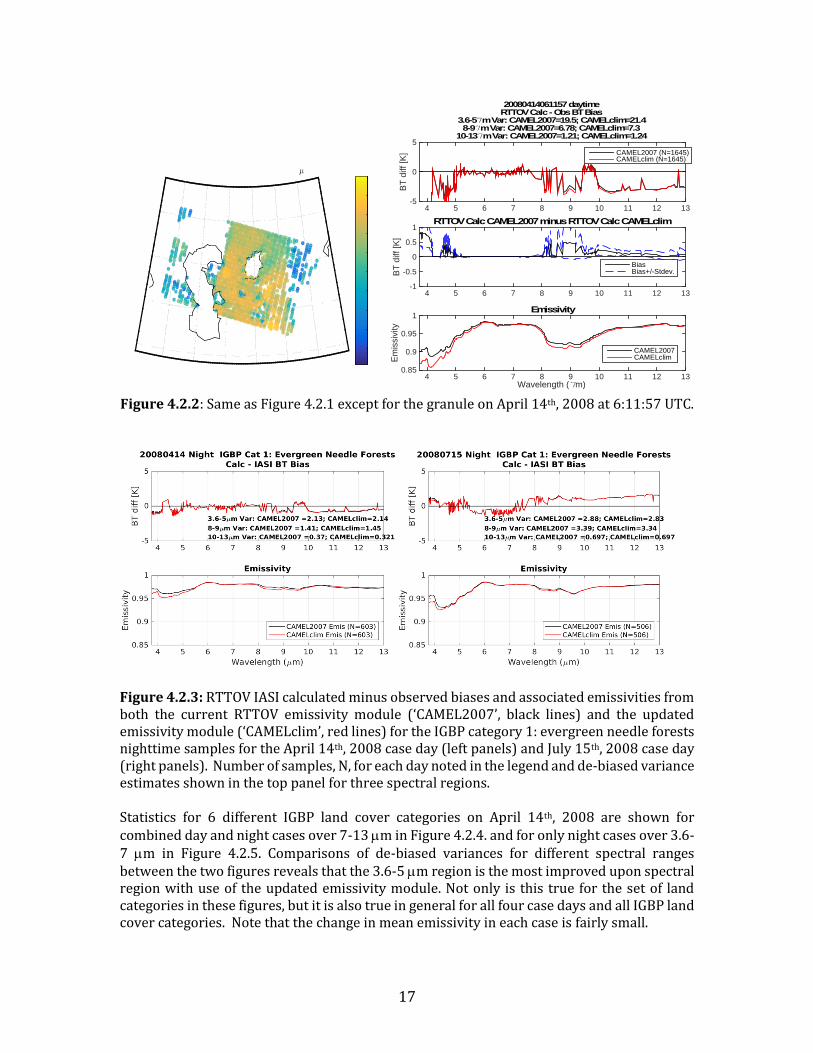
Figure 4.2.2 shows results for a daytime granule located near the Caspian Sea on April 14th, 2008. For this granule the current RTTOV emissivity module performs slightly better than the updated module, in terms of the overall calculated minus observed bias and the de-biased variances for the 8-9 and 10-13 m regions. Thus, for this case the CAMEL V001 year 2007 is more representative than the V002 climatology. As Figures 4.2.1 and 4.2.2 contrasted cases where the updated RTTOV emissivity module was more or less representative, Figure 4.2.3 shows nighttime IGBP statistics for the evergreen needle forest category for two days where there are both improvements and degradations with the use of the updated RTTOV emissivity module. For example, the 10-13 m de-biased variance shows improvement with use of the updated module for the April 14th case day, but it shows a neutral effect for the July 15th case day. This example illustrates how the updated emissivity module may be a better or worse fit to observations depending on the season and time of day. However, it is expected that the climatology more accurately represents the majority of cases over the longer record. This is demonstrated with the rest of the IGBP statistics as discussed below.
Figure 4.2.1: IASI 10.7 m BT map in units of Kelvin (left) for the granule on Sept. 29th, 2008 at 1:11:52 UTC. Corresponding RTTOV IASI calculated minus observed BT biases are shown (top right panel) for both the current RTTOV emissivity module (‘CAMEL2007’, black line) and the updated emissivity module (‘CAMELclim’, red line) whose emissivities are shown in the bottom panel. Number of samples, N, noted in legend. De-biased variance for 3 spectral regions is noted in the right panel’s title.
4 5 6 7 8 9 10 11 12 13
BT
diff [K
]
-5
0
5
20080929011152 nighttimeRTTOV Calc - Obs BT Bias
3.6-57m Var: CAMEL2007=3.39; CAMELclim=3.278-97m Var: CAMEL2007=2.96; CAMELclim=2.8
10-137m Var: CAMEL2007=0.358; CAMELclim=0.345
CAMEL2007 (N=880)CAMELclim (N=880)
4 5 6 7 8 9 10 11 12 13
BT
diff [K
]
-0.5
0
0.5RTTOV Calc CAMEL2007 minus RTTOV Calc CAMELclim
BiasBias+/-Stdev.
Wavelength (7m)4 5 6 7 8 9 10 11 12 13
Em
issiv
ity
0.9
0.95
1Emissivity
CAMEL2007CAMELclim
17
Figure 4.2.2: Same as Figure 4.2.1 except for the granule on April 14th, 2008 at 6:11:57 UTC.
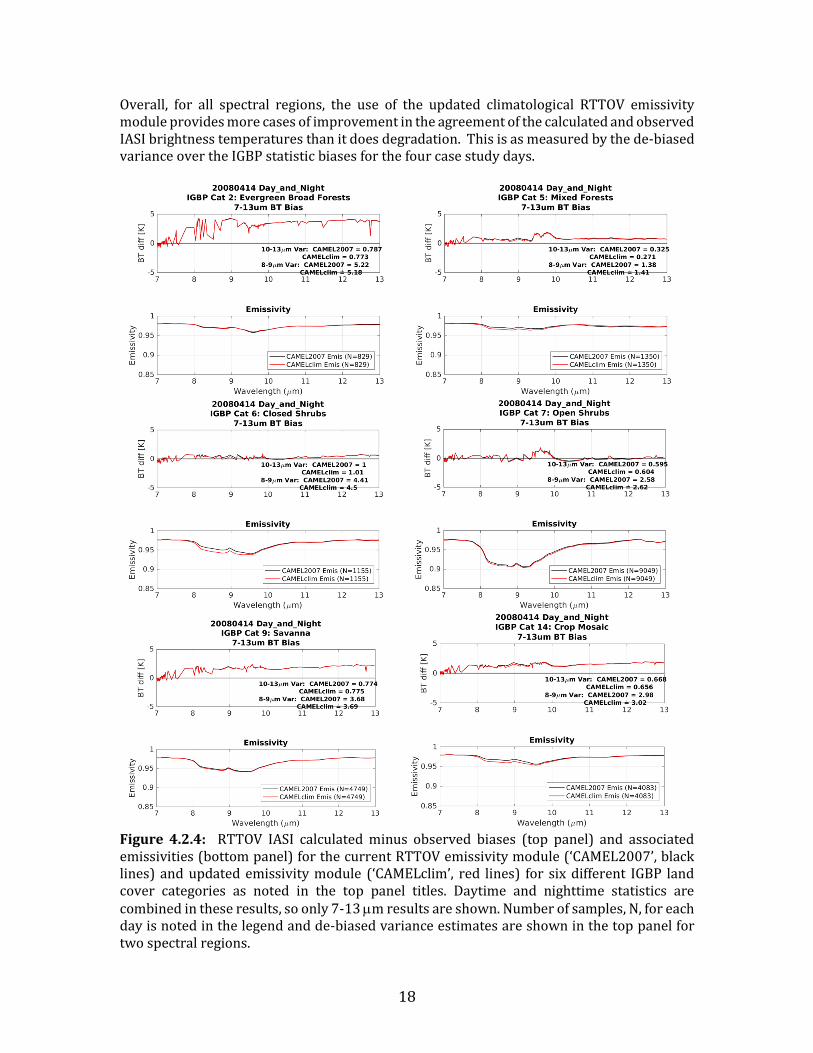
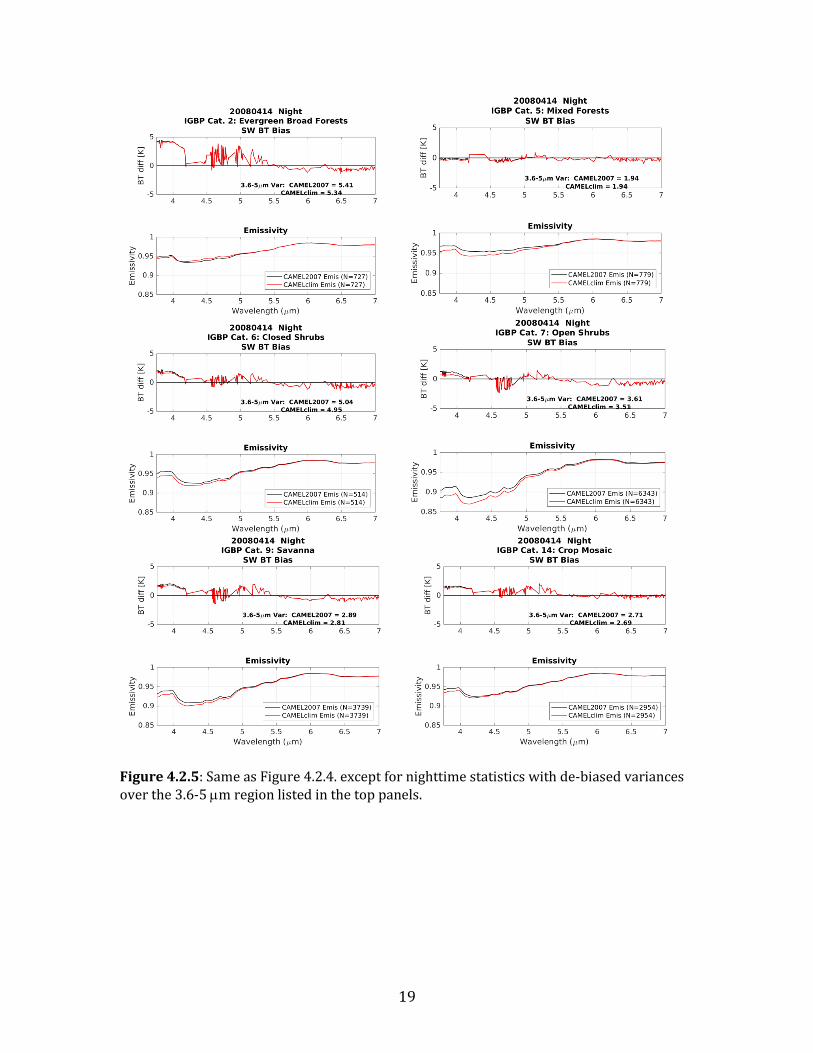
Figure 4.2.3: RTTOV IASI calculated minus observed biases and associated emissivities from both the current RTTOV emissivity module (‘CAMEL2007’, black lines) and the updated emissivity module (‘CAMELclim’, red lines) for the IGBP category 1: evergreen needle forests nighttime samples for the April 14th, 2008 case day (left panels) and July 15th, 2008 case day (right panels). Number of samples, N, for each day noted in the legend and de-biased variance estimates shown in the top panel for three spectral regions. Statistics for 6 different IGBP land cover categories on April 14th, 2008 are shown for combined day and night cases over 7-13 m in Figure 4.2.4. and for only night cases over 3.6-7 m in Figure 4.2.5. Comparisons of de-biased variances for different spectral ranges between the two figures reveals that the 3.6-5 m region is the most improved upon spectral region with use of the updated emissivity module. Not only is this true for the set of land categories in these figures, but it is also true in general for all four case days and all IGBP land cover categories. Note that the change in mean emissivity in each case is fairly small.
4 5 6 7 8 9 10 11 12 13
BT
diff [K
]
-5
0
5
20080414061157 daytimeRTTOV Calc - Obs BT Bias
3.6-57m Var: CAMEL2007=19.5; CAMELclim=21.48-97m Var: CAMEL2007=6.78; CAMELclim=7.3
10-137m Var: CAMEL2007=1.21; CAMELclim=1.24
CAMEL2007 (N=1645)CAMELclim (N=1645)
4 5 6 7 8 9 10 11 12 13
BT
diff
[K]
-1
-0.5
0
0.5
1RTTOV Calc CAMEL2007 minus RTTOV Calc CAMELclim
BiasBias+/-Stdev.
Wavelength (7m)4 5 6 7 8 9 10 11 12 13
Em
issiv
ity
0.85
0.9
0.95
1Emissivity
CAMEL2007CAMELclim
18
Overall, for all spectral regions, the use of the updated climatological RTTOV emissivity module provides more cases of improvement in the agreement of the calculated and observed IASI brightness temperatures than it does degradation. This is as measured by the de-biased variance over the IGBP statistic biases for the four case study days.
Figure 4.2.4: RTTOV IASI calculated minus observed biases (top panel) and associated emissivities (bottom panel) for the current RTTOV emissivity module (‘CAMEL2007’, black lines) and updated emissivity module (‘CAMELclim’, red lines) for six different IGBP land cover categories as noted in the top panel titles. Daytime and nighttime statistics are combined in these results, so only 7-13 m results are shown. Number of samples, N, for each day is noted in the legend and de-biased variance estimates are shown in the top panel for two spectral regions.
19
Figure 4.2.5: Same as Figure 4.2.4. except for nighttime statistics with de-biased variances over the 3.6-5 m region listed in the top panels.
20
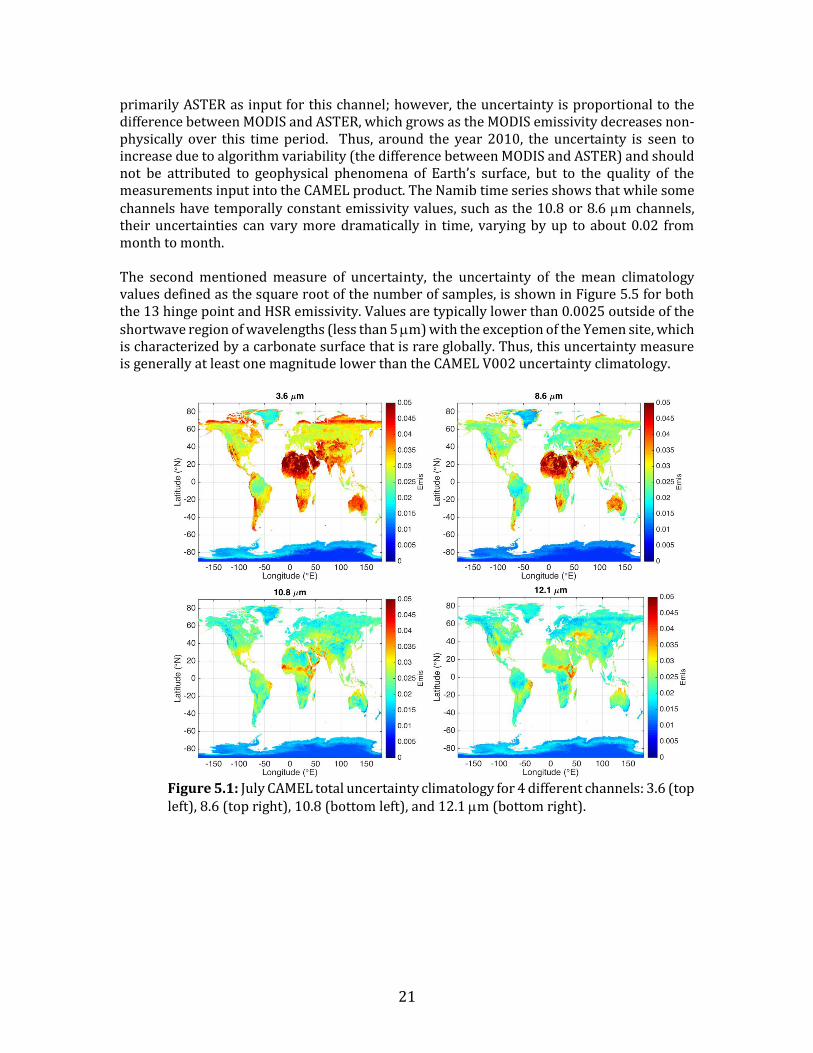
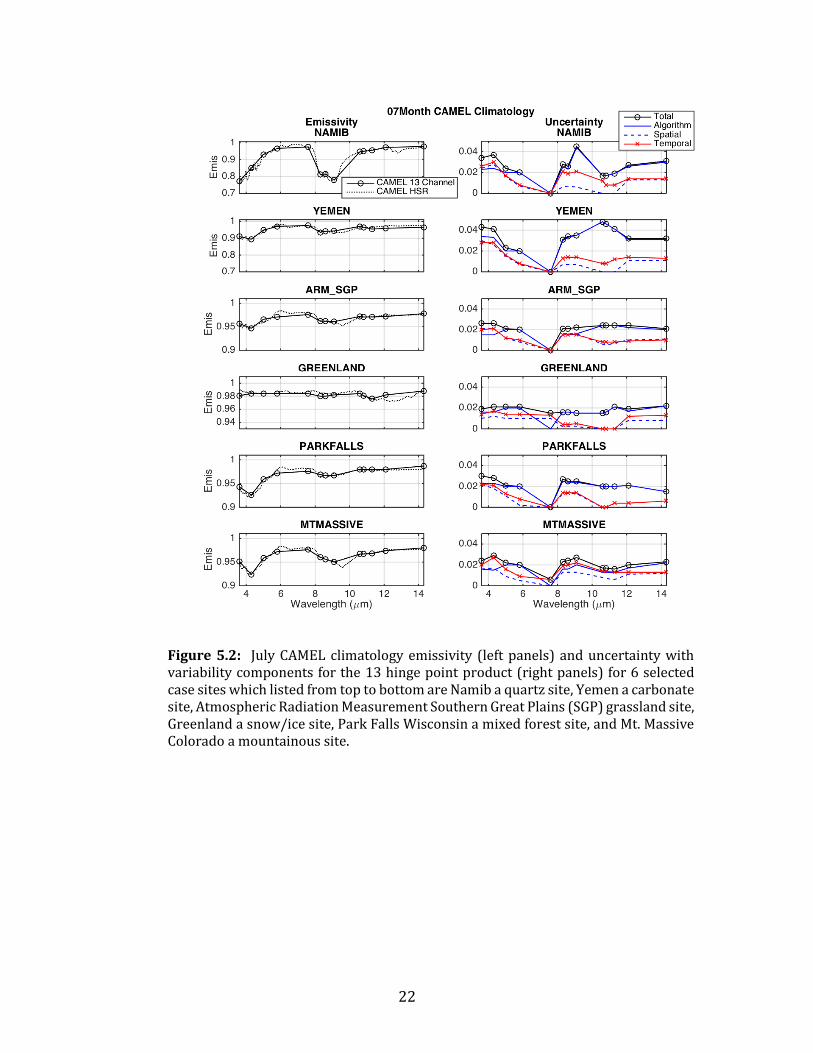
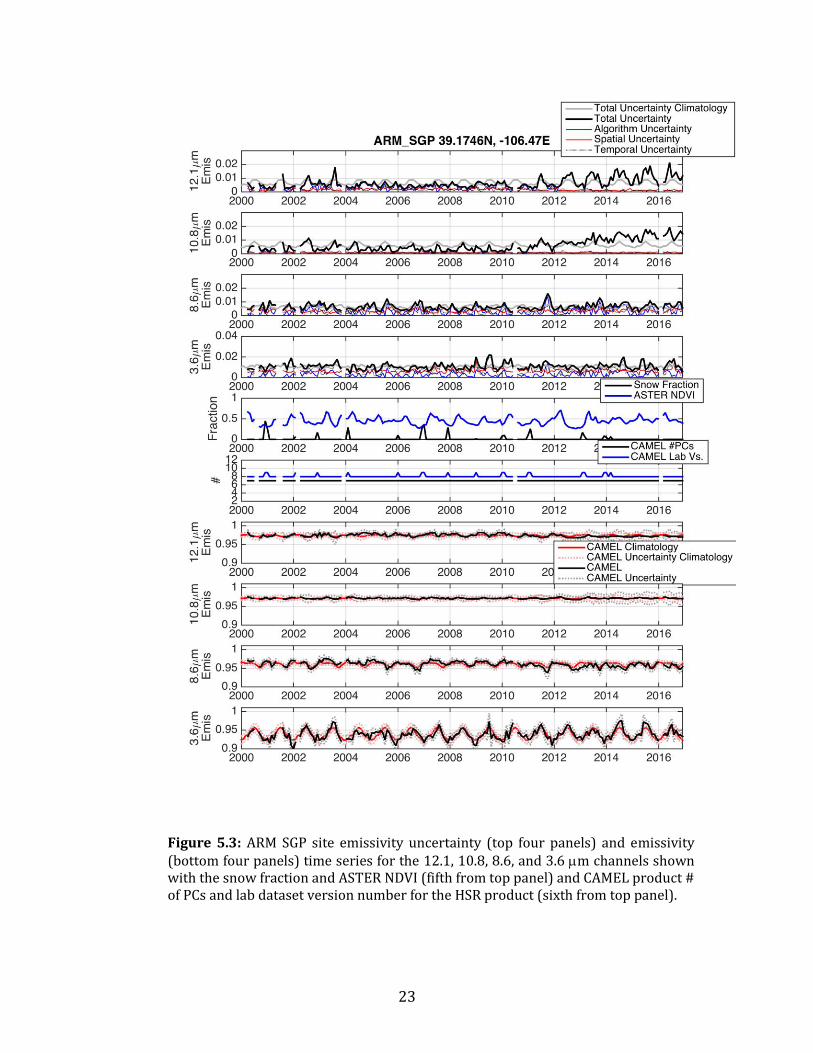
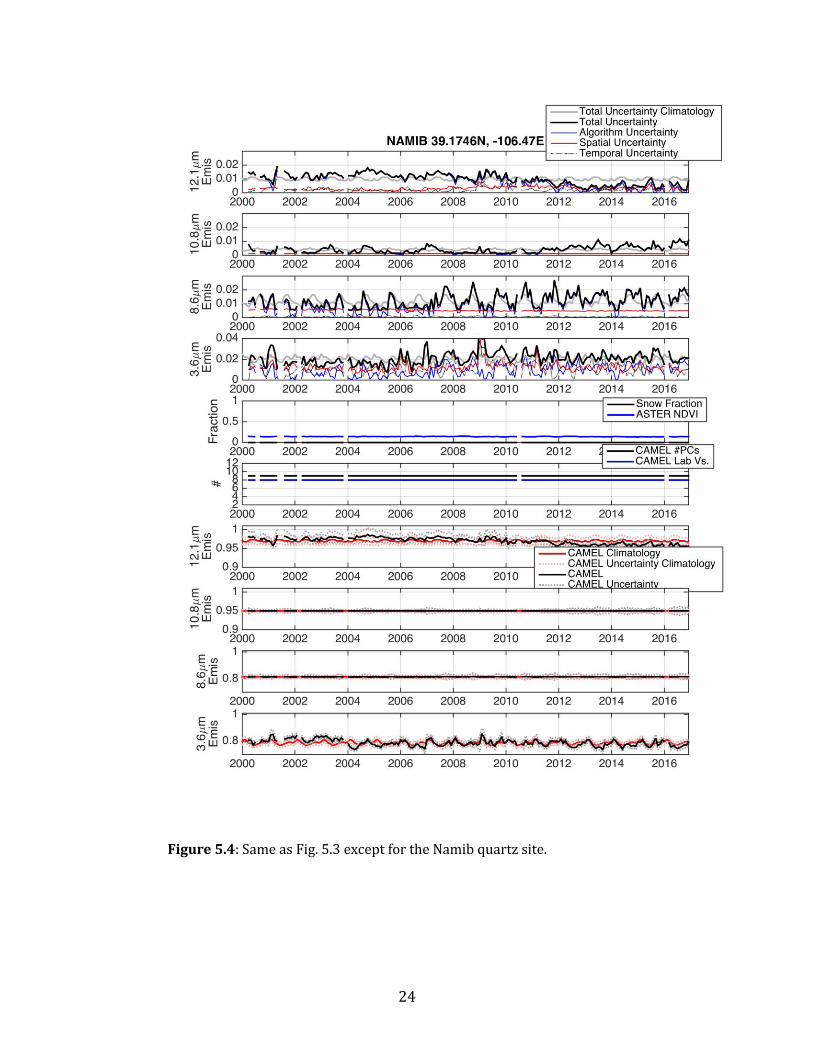
5. Uncertainty of the climatological CAMEL data The previous sections described the mean of the CAMEL climatology used in RTTOVclim and a product specially created for the RTTOV module—the covariance on a coarse grid (5x5 pixels) corresponding to the 16 year record. The RTTOV covariance represents the variability of the monthly observations over time and space and thus is of immediate use in NWP applications. In contrast, this section will outline the uncertainty in the CAMEL mean emissivity estimate based on the CAMEL monthly uncertainties described in the publication Feltz et al. 2018. This uncertainty has not been included in the current RRTOV update but it could be considered for inclusion in a future RTTOV version if desired; therefore it has been included in this report. The CAMEL climatology has several sources of uncertainty that characterize the mean spectra. Here, the uncertainty is discussed as two distinct measures— 1) the monthly CAMEL V002 product uncertainty climatology and 2) the uncertainty of the mean climatological estimates (i.e. standard deviation divided by the square root of the number of sample years). As mentioned, a climatology of the CAMEL V002 monthly uncertainty product is planned to be made available in 2019—included below are figures illustrating the pre-distribution version of this dataset. The uncertainty climatology is calculated for each month by averaging over all the years of the CAMEL record. Figure 5.1 shows the CAMEL ‘total uncertainty’ climatology for the month of July for 4 different channels (see Borbas and Feltz et al. (2018) for more details). Comparing the 4 subpanels shows that generally across the globe the largest uncertainties are in the shorter wavelength 3.6 m channel where solar reflection complicates the daytime measurement. For this channel, each of the subcomponents of variability—the spatial, temporal, and algorithm—are generally equal contributors to the total uncertainty (not shown). The 8.6 m channel, like the 3.6, has largest total uncertainties over the Sahara Desert and Arabian Peninsula with the main global contributor being the algorithm variability and the smallest being the temporal variability. The 10.8 and 12.1 m channels have more consistency in the uncertainty magnitude across the globe, with the largest contributor to these channels being the algorithm uncertainty. The spectral shape of the July CAMEL emissivity climatology is shown in Figure 5.2 for several case study sites. Here, the uncertainty climatology is shown with its subcomponents of variability. The largest uncertainty seen at any of the sites is about 5 % of the emissivity estimate—this is exemplified in the 9.1 m channel for the quartz Namib site and in the 10.6/10.8 m channels for the carbonate Yemen site. Comparison of the subpanels shows the algorithm variability is generally the dominant or one of the multiple dominant contributors to the total uncertainty. The temporal change in the CAMEL uncertainty is illustrated in Figures 5.3 and 5.4 for the ARM SGP grassland and Namib quartz desert site respectively. Seasonal and month to month differences are seen in the total uncertainty for each site and each channel shown, though for some channels, for example the ARM SGP 10.8 or Namib 10.8/8.6 m, the sub-components of variability of space and time are constant over the CAMEL record, making the algorithm variability the cause of seasonal/month-to-month differences. Illustrated in Fig 5.3’s ARM SGP 10.8 and 12.1 m uncertainty time series is the degradation of the MODIS instrument whose derived emissivity is used as input into the CAMEL monthly product. The degradation shows up in the uncertainty but not in the emissivity due to the fact that the emissivity uses
21
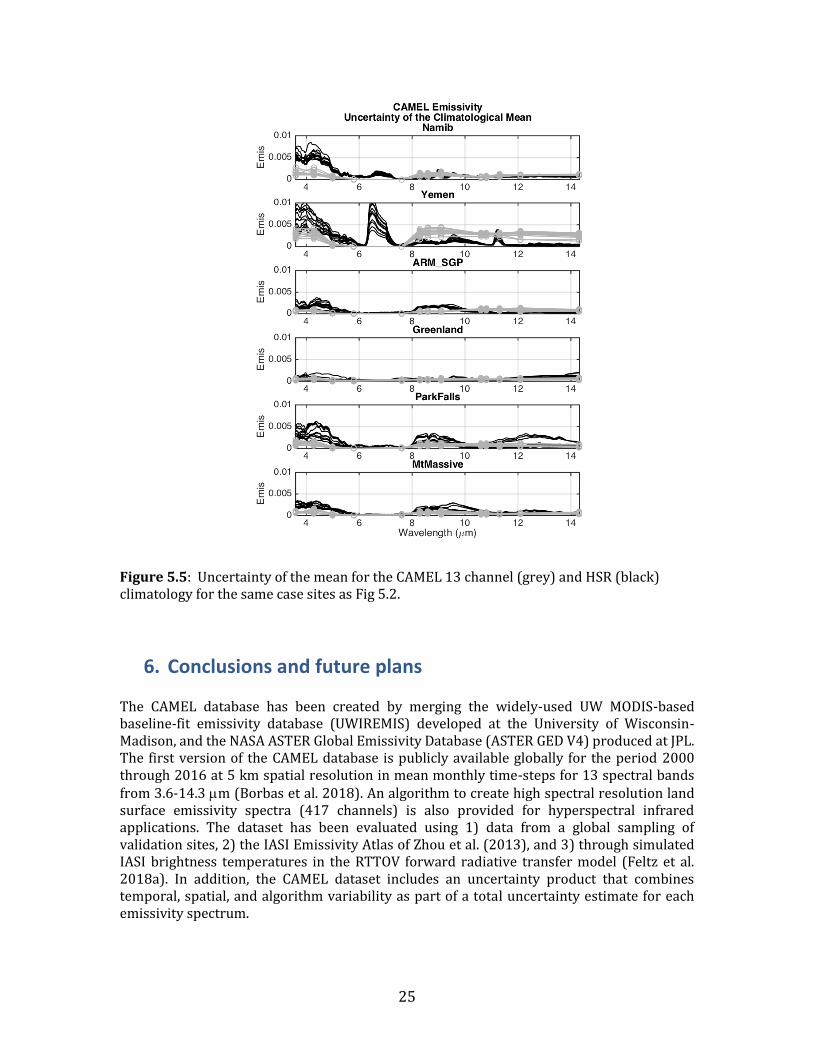
primarily ASTER as input for this channel; however, the uncertainty is proportional to the difference between MODIS and ASTER, which grows as the MODIS emissivity decreases non-physically over this time period. Thus, around the year 2010, the uncertainty is seen to increase due to algorithm variability (the difference between MODIS and ASTER) and should not be attributed to geophysical phenomena of Earth’s surface, but to the quality of the measurements input into the CAMEL product. The Namib time series shows that while some channels have temporally constant emissivity values, such as the 10.8 or 8.6 m channels, their uncertainties can vary more dramatically in time, varying by up to about 0.02 from month to month. The second mentioned measure of uncertainty, the uncertainty of the mean climatology values defined as the square root of the number of samples, is shown in Figure 5.5 for both the 13 hinge point and HSR emissivity. Values are typically lower than 0.0025 outside of the shortwave region of wavelengths (less than 5 m) with the exception of the Yemen site, which is characterized by a carbonate surface that is rare globally. Thus, this uncertainty measure is generally at least one magnitude lower than the CAMEL V002 uncertainty climatology.
Figure 5.1: July CAMEL total uncertainty climatology for 4 different channels: 3.6 (top left), 8.6 (top right), 10.8 (bottom left), and 12.1 m (bottom right).
22
Figure 5.2: July CAMEL climatology emissivity (left panels) and uncertainty with variability components for the 13 hinge point product (right panels) for 6 selected case sites which listed from top to bottom are Namib a quartz site, Yemen a carbonate site, Atmospheric Radiation Measurement Southern Great Plains (SGP) grassland site, Greenland a snow/ice site, Park Falls Wisconsin a mixed forest site, and Mt. Massive Colorado a mountainous site.
23
Figure 5.3: ARM SGP site emissivity uncertainty (top four panels) and emissivity (bottom four panels) time series for the 12.1, 10.8, 8.6, and 3.6 m channels shown with the snow fraction and ASTER NDVI (fifth from top panel) and CAMEL product # of PCs and lab dataset version number for the HSR product (sixth from top panel).
24
Figure 5.4: Same as Fig. 5.3 except for the Namib quartz site.
25
Figure 5.5: Uncertainty of the mean for the CAMEL 13 channel (grey) and HSR (black) climatology for the same case sites as Fig 5.2.
6. Conclusions and future plans The CAMEL database has been created by merging the widely-used UW MODIS-based baseline-fit emissivity database (UWIREMIS) developed at the University of Wisconsin-Madison, and the NASA ASTER Global Emissivity Database (ASTER GED V4) produced at JPL. The first version of the CAMEL database is publicly available globally for the period 2000 through 2016 at 5 km spatial resolution in mean monthly time-steps for 13 spectral bands from 3.6-14.3 m (Borbas et al. 2018). An algorithm to create high spectral resolution land surface emissivity spectra (417 channels) is also provided for hyperspectral infrared applications. The dataset has been evaluated using 1) data from a global sampling of validation sites, 2) the IASI Emissivity Atlas of Zhou et al. (2013), and 3) through simulated IASI brightness temperatures in the RTTOV forward radiative transfer model (Feltz et al. 2018a). In addition, the CAMEL dataset includes an uncertainty product that combines temporal, spatial, and algorithm variability as part of a total uncertainty estimate for each emissivity spectrum.
26
To facilitate the use of the CAMEL database in NWP 1-D Var data assimilation, a January-December monthly climatology has been created for use by NWP models. This climatology is intended to provide a high spectral resolution mean infrared emissivity spectra for the 16+ year time period 2000 to 2016 on a spatial grid of 0.05 degree (about 5 km x 5 km). Under this EUMETSAT NWP-SAF AS Mission the CAMEL V002 climatological dataset with an advanced snow correction has been implemented into the RTTOV as a third choice of the IR emissivity atlases for the users. Overall, for all spectral regions, the use of the CAMEL CLIM emissivity module provides more cases of improvement in the agreement of the calculated and observed IASI brightness temperatures than it does degradation. This is as measured by the de-biased variance over the IGBP statistic biases for the four case study days. The artificial decrease/increase and jump at January 2007 in the CAMEL emissivity timeseries (which is due to the cross talk error of Terra MODIS bands and processing resetting), in addition to the RTTOV case site and four case day simulation evaluation, demonstrates that the CAMEL CLIM emissivity module is preferable and advantageous in comparison to the current module based on the CAMEL V001 2007 selected year database. The mean and the variance of the IR emissivity has been updated and provided with a higher spatial resolution (0.25x0.25 degree vs. 0.5x0.5 degree). This climatology can be degraded to NWP model resolutions to make it suitable for a first guess to the land surface emissivity for 1-D var data assimilation of infrared sensor data. A self-consistent broadband emissivity (BBE) is also available for use in NWP land surface models (Feltz et al, 2018b). In the future we are investigating the potential for reconstruction of the full covariance matrix using Singular Value Decomposition (SVD) to compress the information content of the matrix. The final product is expected to use SVD compression of the covariance matrices to save storage space. Acknowledgments: We would like to thank Robert Knuteson (UW/SSEC) for his support and advice during this work and James Hocking, Met Office, UK for programing support. This research was supported by an Associate Scientist Mission of the EUMETSAT NWP-SAF.
7. References Borbas, E. E. and Ruston B.C. (2010). The RTTOV UWiremis IR land surface emissivity module. Mission
Report EUMETSAT NWPSAF-MO-VS-042. http://research.metoffice.gov.uk/research/interproj/nwpsaf/vs_reports/nwpsaf-mo-vs-042.pdf Borbas, E.E.; Hulley, G.; Feltz, M.; Knuteson, R.; Hook, S. (2018).The Combined ASTER MODIS Emissivity
over Land (CAMEL) Part 1: Methodology and High Spectral Resolution Application. Remote Sens.2018, 10, 643. ; https://doi.org/10.3390/rs10040643
Capelle, V., Chédin, A., Péquignot, E., Schlüssel, P., Newman, S. M., & Scott, N. A. (2012). Infrared continental surface emissivity spectra and skin temperature retrieved from IASI observations over the tropics. Journal of Applied Meteorology and Climatology, 51(6), 1164-1179.
Desroziers, G., Berre, L., Chapnik, B., & Poli, P. (2005). Diagnosis of observation, background and analysis‐error statistics in observation space. Quarterly Journal of the Royal Meteorological
27
Society: A journal of the atmospheric sciences, applied meteorology and physical oceanography, 131(613), 3385-3396.
Feltz, M.; Borbas, E.; Knuteson, R.; Hulley, G.; Hook, S. (2018). The Combined ASTER MODIS Emissivity over Land (CAMEL) Part 2: Uncertainty and Validation.Remote Sens., 2018, 10, 664. https://doi.org/10.3390/rs10050664
Feltz, M.; Borbas, E.; Knuteson, R.; Hulley, G.; Hook, S. (2018). The Combined ASTER and MODIS Emissivity over Land (CAMEL) Global Broadband Infrared Emissivity Product. Remote Sens., 2018, 10, 1027. https://doi.org/10.3390/rs10071027
Hook, S. (2017). Combined ASTER and MODIS Emissivity database over Land (CAMEL) Emissivity Monthly Global 0.05Deg V001 [Data set]. NASA EOSDIS Land Processes DAAC. doi: 10.5067/MEaSUREs/LSTE/CAM5K30EM.001
Hulley, G. C., & Hook, S. J. (2009). The North American ASTER land surface emissivity database (NAALSED) version 2.0. Remote Sensing of Environment, 113(9), 1967-1975.
Hulley, G. C., Hook, S. J., Abbott, E., Malakar, N., Islam, T., & Abrams, M. (2015). The ASTER Global Emissivity Dataset (ASTER GED): Mapping Earth's emissivity at 100 meter spatial scale. Geophysical Research Letters, 42(19), 7966-7976.
Knuteson, R. O., Best, F. A., DeSlover, D. H., Osborne, B. J., Revercomb, H. E., & Smith Sr, W. L. (2004). Infrared land surface remote sensing using high spectral resolution aircraft observations. Advances in Space Research, 33(7), 1114-1119.
Péquignot, E., Chédin, A., & Scott, N. A. (2008). Infrared continental surface emissivity spectra retrieved from AIRS hyperspectral sensor. Journal of Applied Meteorology and Climatology, 47(6), 1619-1633.
Ruston, B., Weng, F., and Yan, (B. 2008), Use of a One-Dimensional variation retrieval to Diagnose Estimates of Infrared and Microwave Surface Emissivity Over Land for ATOVS Sounding Instruments, IEEE Transactions on Geoscience and Remote Sensing, Vol. 46, No. 2 February, 2008.
RTTOV UWIR TD, 2010: The RTTOV UWiremis IR land surface emissivity module, technical documentation by Eva Borbas, EUMETSAT, NWP-SAF, 2010.
Salisbury, J. W. and D’Aria, D. M. (1992): Emissivity of terrestrial materials in the 8-14 μm atmospheric window. Remote Sens. Environ., 42:83–106.
Salisbury, J. W. and D’Aria, D. M. (1994): Emissivity of terrestrial materials in the 3-5 μm atmospheric window. Remote Sens. Environ., 47:345–361.
Saunders, R., Matricardi, M., & Brunel, P. (1999). An improved fast radiative transfer model for assimilation of satellite radiance observations. Quarterly Journal of the Royal Meteorological Society, 125(556), 1407-1425.
Saunders, R., Hocking, J., Turner, E., Rayer, P., Rundle, D., Brunel, P., Vidot, J., Roquet, P., Matricardi, M., Geer, A., Bormann, N., and Lupu, C. (2018). An update on the RTTOV fast radiative transfer model (currently at version 12), Geosci. Model Dev., 11, 2717-2737, https://doi.org/10.5194/gmd-11-2717-2018.
Seemann, S.W., Borbas, E.E., Knuteson, R.O., Stephenson, G.R. and Huang, H-L. (2008). Development of a global infrared emissivity database for application to clear sky sounding retrievals from multi-spectral satellite radiances measurements. J. Appl. Meteorol. and Clim. 47 108-123.
Wan, Z., & Li, Z. L. (1997). A physics-based algorithm for retrieving land-surface emissivity and temperature from EOS/MODIS data. IEEE Transactions on Geoscience and Remote Sensing, 35(4), 980-996.
Zhou, D. K., Larar, A. M., Liu, X., Smith, W. L., Strow, L. L., Yang, P., ... & Calbet, X. (2011). Global land surface emissivity retrieved from satellite ultraspectral IR measurements. IEEE Transactions on Geoscience and Remote Sensing, 49(4), 1277-1290.
Zhou, D.K.; Larar, A.M.; Liu, X. (2013). MetOp-A/IASI observed continental thermal IR emissivity
variations. IEEE J. Sel. Top. Appl. Earth Obs. Remote Sens. 2013, 6, 1156–1162,
doi:10.1109/JSTARS.2013.2238892.