Embed Size (px)
Citation preview

SCIENTIFIC COMMITTEE
NINTH REGULAR SESSION
Pohnpei, Federated States of Micronesia
6-14 August 2013
UPDATED STOCK ASSESSMENT OF SILKY SHARKS IN THE WESTERN AND CENTRAL PACIFIC OCEAN
WCPFC-SC9-2013/ SA-WP-03
Joel Rice1 and Shelton Harley
1 Oceanic Fisheries Programme, Secretariat of the Pacific Community (SPC-OFP), Noumea, New Caledonia.

2
Executive summary
This paper presents an update from the first stock assessment of silky shark in the western and
central Pacific Ocean that was submitted to SC8 in August 2012. The main changes are the inclusion
of a greater number of CPUE and catch time series in the analysis. The assessment uses the stock
assessment model and computer software known as Stock Synthesis (version 3.21B
http://nft.nefsc.noaa.gov/Download.html.). The silky shark model is an age (36 years) structured,
spatially aggregated (1 region) and two sex model. The catch, effort, and size composition of catch,
are grouped into 4 fisheries, all of which cover the time period from 1995 through 2009.
Silky sharks are most often caught as bycatch in the Pacific tuna fisheries, though some directed
mixed species (sharks and tunas/billfish) fisheries do exist. Commercial reporting of landings has
been minimal, as has information regarding the targeting, and fate of sharks encountered in the
fisheries. Useful data on catch and effort is mostly limited to observer data held by the SPC, but the
observer data also suffers from poor coverage. Therefore multiple data gaps had to be overcome
through the use of integrated stock assessment techniques and the inclusion of alternate data that
reflected different states of nature.
Multiple models with different combinations of the input datasets and structural model hypotheses
were run to assess the plausible range of inputs and the resulting estimates of stock status. These
models were each given a ‘weight’ based on the a priori plausibility of the assumptions and data
used in each model. The reference case presented here was the highest weighted run. This
reference case model is used as an example for presenting model diagnostics, but the most
appropriate model run(s) upon which to base management advice will be determined by the
Scientific Committee. The sensitivity of the reference model to key assumptions (i.e. regarding the
stock recruitment relationship, the catch per unit effort time series, the purse seine catch and size
data, the growth model) were explored via sensitivity analyses. The results of these analyses should
also be considered when developing management advice.
We have reported stock status in relation to MSY based reference points, but the actual reference
points to be used to manage this stock have not yet been determined by the Commission.
As requested by the 2013 Pre-Assessment Workshop we have presented key model results for each
set of catch and CPUE series separately, the SPC bycatch longline (no HW) and Japanese RTV series
combined, and for all model runs combined. The main results presented in the executive summary
refer to the model runs with SPC bycatch longline (no HW) and Japanese RTV series combined, but
all model results are available for the consideration of SC9.
This is an update to the first stock assessment for silky sharks in the WCPO. The key conclusions are
as follows.
1. The results of the model can be split into two categories which are mutually exclusive with
respect to the estimates of stock status. These two categories are characterized by the CPUE
input. All runs that included the target longline CPUE trend estimated a current total biomass in
excess of 150,000,000mt. This is more than 18 times greater than the combined 2010 estimate
of bigeye, south Pacific albacore, skipjack and yellowfin tuna total biomass combined. Therefore
these runs are not considered plausible.
2. Notwithstanding the difficulties inherent in the input data, the size composition data shows
consistent declines over the period of the model (1995-2009) which is coupled with increasing
fishing mortality, and a recently declining CPUE trend.

3
3. This is a low productivity species and this is reflected in the low estimated value for FMSY (0.08)
and high estimated value for �����/���(0.39). These directly impact on conclusions about
overfishing and the overfished status of the stock.
4. Based on the reference case the estimated spawning biomass, total biomass and recruitment all
decline consistently throughout the period of the model. The biomass declines are driven by the
CPUE series, and the recruitment decline is driven through the tight assumed relationship
between spawning biomass and recruitment.
5. Estimated fishing mortality has increased to levels far in excess of FMSY (FCURRENT/FMSY = 4.48) and
across nearly all plausible model runs undertaken estimated F values were much higher than
FMSY (the 5th
and 95th
quantiles are 1.41 and 7.96). Based on these results we conclude that
overfishing is occurring.
6. Estimated spawning biomass has declined to levels below SBMSY (����� �/�����= 0.70) and
for the majority of the model runs undertaken, ����� �is less than ����� (the 5th
and 95th
quantiles are 0.51 and 1.23). Based on the distribution of these results we conclude that it is
highly likely that the stock is in an overfished state.
7. Notwithstanding the bullet point above, that estimates of SB0 and SBMSY are uncertain as the
model domain begins in 1995, so it is also useful to compare current stock size to that at the
start of the model. Estimated spawning biomass has declined over the model period to 67% of
the 1995 value for the reference case, and across the majority of the model runs ����� �/��1995has declined (the 5th
and 95th
quantiles are 39% decline and a 67% increase).
8. Current catches are higher than the MSY (5,331 mt versus 1,994 mt), further catch at current
levels of fishing mortality would continue to deplete the stock below SBMSY. Current (2005-2008
average) and latest (2009) catches are significantly greater than the forecast catch in 2010 under
FMSY conditions (approximately 600 mt).
9. The greatest impact on the stock is attributed to bycatch from the longline fishery, but there are
also significant impacts from the associated purse seine fishery which catches predominantly
juvenile individuals.
10. Given the bycatch nature of fishery impacts, mitigation measures provides the best opportunity
to improve the status of the silky shark population. Existing observer data may provide some
information on which measures would be the most effective.
11. Given recent decisions to improve logsheet catch reporting and observer coverage in the
longline fishery, and noting the concerns regarding stock status outlined in this assessment, it is
recommended that an updated assessment be undertaken in 2014 if the key data sets (JPN RTV
and Hawaiian longline observer) are available for analysis.
A series of research recommendations are also provided.
4
1 Background
This paper represents a follow-up to first silky shark assessment presented in Rice and Harley
(2012a). This assessment was not accepted by the Scientific Committee who recommended further
modelling work be undertaken (see Appendix 4 for details of their request). This additional work was
first presented to WCPFC9 in December 2012 (OFP, 2012) and was subsequently reviewed by the
Pre-Assessment Workshop held in April 2013 (OFP, 2013) before being finalized.
A comparison of the results of this assessment compared to that in Rice and Harley (2012a) was
provided in OFP (2012) and is also provided in Appendix 3 of the current paper.
1.1 Distribution, reproduction and growth
Silky shark (Carcharhinus falciformis; FAL) are a circumtropical species found in tropical waters of the
Pacific Ocean (Figure 1). Silky sharks that inhabit the coastal and oceanic waters of the Western and
Central Pacific Ocean (WCPO) are considered a single stock for the purposes of this assessment. Silky
sharks are one of the most commonly caught sharks in the tropical tuna fisheries (Clarke et al.
2011a), but despite this our understanding of silky sharks biology, ecology and movement patterns is
limited (Bonfil 2008; Clarke et al. 2005, 2006). Although little directed work in the Pacific Ocean has
be completed, information on the movements, migration and distribution of silky sharks in the
Pacific can be inferred from previous, globally distributed studies (Strasburg 1958; Springer 1967;
Branstetter 1987; Bonfil et al. 1990, 1993, Bonfil 1997, 2008).
Silky sharks show a preference for warmer tropical waters above 23˚C (Last and Stevens 1994).
Bonfil (2008) suggests that for the first few years of life silky sharks in the Pacific Ocean lead
demersal/semipelagic lifestyles associated with reefs and deeper parts of the continental and insular
shelves before moving to more offshore and pelagic environments as sub-adults. At some point,
probably when near 130cm in total length (TL), silky sharks switch to a more oceanic habitat where
they often join schools of large pelagic fish (such as tuna) and may disperse seasonally from the
equator to higher latitudes (Strasburg 1958, Bonfil 2008). Adult silky sharks are known to return
seasonally to feed and reproduce in shelf waters, however near term pregnant females and
neonates are also found in oceanic waters (Bonfil 2008). This pattern of life stage related movement
patterns with adults travelling long distances (maximum recorded is 1,339 km) seems to be valid for
silky sharks throughout the world (Kohler et al. 1998, Cadena-Cárdenas 2001, Bonfil 2008).
Multiple reproductive studies have been conducted for these species and reproduction is probably
the best known aspect of this species’ biology (Gilbert and Schlernitzauer 1965, 1966, Branstetter
1987, Bonfil et al. 1993, Cadena-Cárdenas 2001, Joung et al. 2008). The silky is viviparous with
placental embryonic development, recent work by Joung et al. (2008) reports 8-10 pups per litter
(based on 4 observations) with a 9-12 month gestation period. Oshitani et al. (2003) collected a
larger sample size (153) of pregnant sharks from throughout the Pacific and report an average litter
size of 6 pups with a sex ratio that is not statistically different than 1:1. A one year resting period
has been suggested for sharks in the Atlantic and Eastern Pacific, though this is unconfirmed in those
locals, and no mention of this occurs in the recent literature on silky shark reproduction in WCPO
(Branstetter, 1987; Cadena-Cárdenas, 2001). Newborn silky sharks estimated size at birth is 63.5-
75.5 cm in the northwest Pacific (Joung et al. 2008). Spawning season in the Pacific spans over much
of the year (February- August) and is less well understood than in the Gulf of Mexico, where it has
been estimated to be during the late spring (Branstetter 1987, Bonfil et al. 1993; Bonfil 2008). A
positive correlation between maternal size and litter size has been found in both the central and
eastern Pacific (Cadena-Cárdenas 2001, Oshitani et al. 2003). Estimated sizes at 50% maturity for
silky sharks in the western Pacific are 212.5 for males and 210-220 cm TL for females (Figure 2)
(Joung et al. 2008).
There are two published studies of age and growth for silky sharks in the Pacific (Oshitani et al. 2003,
Joung et al. 2008). Both studies counted growth bands on the vertebral centrum and estimated

5
combined growth curves, however Oshitani et al. (2003) used the convex/concave central surface of
longitudinally sectioned vertebrae to estimate the age of silky sharks while Joung et al. (2008) used
the more conventional method of examination of translucent and opaque zones. The study by
Oshitani et al. yielded estimate of 0.148 for the Von Bertalanffy growth coefficient k and an estimate
for �� =216.4 cm in pre-caudal length (PCL), while the Joung et al. (2008) study estimated k=0.0838
and �� =332.0 cm TL. Joung et al. (2008) discuss the differences in these studies, the potential
reasons for the differences, and contrast the methods used with age and growth studies of silky
sharks in the Atlantic. In this study the relationship estimated by Joung et al. was used, with a
corresponding longevity of 36 years for females, all reported lengths are in TL.
Estimates of population growth and natural mortality have been obtained using demographic
methods for silky sharks in the Gulf of Mexico, with estimates of the intrinsic rate of increase and
natural mortality being 0.102 and 0.17-0.21 respectively (Cortés, 2002).
1.2 Fisheries
In the WCPO silky sharks are encountered in small and medium scale multispecies fisheries as well as
in the tuna longline and purse seine fisheries (Stevens and Wayte 1999, Clarke et al. 2011). For the
purposes of this assessment the fisheries affecting silky sharks, can be broadly classified into four
fleets, two composed of longline vessels (bycatch and target) and two purse seine (associated and
un-associated sets) (Table 1). It should be noted that this study encompasses areas of the Philippines
and eastern Indonesia, although it does so without data regarding biomass trends (CPUE) or catch
amounts due to lack of information despite the knowledge that silky sharks are caught in small and
medium scale fisheries in these areas.
Silky sharks are predominantly encountered as bycatch in the tuna fisheries and the tuna longline
fleet has the greatest impact on the stock due to the overall effort. The tuna longline fleet operates
throughout the Pacific, and mainly catches juveniles sharks less than 178cm and 191 cm TL for males
and females respectively. Observer records do indicate that some targeting has occurred historically
in the waters of Papua New Guinea, and given the high value of shark fins and their abundance in
the shark fin trade (Clarke et al. 2005, 2006) and low level of observer coverage (annual average
coverage has been <1% from 2005-2008), it is likely that targeting does occur in other areas. The
fleet from this region was separated from the main longline fleet due to the size of the FAL catch,
their reporting of targeting sharks, and the expectation that the factors leading to catching FAL while
targeting them would be different than catching FAL as bycatch. Catch and effort data for these
fleets were standardized separately (see Rice 2012a, b and Rice 2013 for more information).
Purse seine fleets usually operate in equatorial waters from 10°N to 10°S; although a Japanese
offshore purse seine fleet operates in the temperate North Pacific. The vessels mainly target skipjack
tuna and FAL are caught in the process. The purse seine fishery is usually classified by set type
categories − sets on floating objects such as logs and fish aggregation devices (FADs), which are
termed “associated sets” and sets on free-swimming schools, termed “unassociated sets”. These
different set types have somewhat different spatial distributions and catch per unit effort (CPUE),
and also catch different sizes of silky sharks. Although all sizes are present in the catch composition
for both types of sets, associated sets in the WCPO catch predominantly small and medium sized
sharks (<150cm); which is contrast to the eastern Pacific where the majority of the bycatch in the
associated sets consists of small silky sharks (<90cm TL, Watson et al. 2009).
Information on FAL catches in the WCPO is sparse due to limited observer data collection prior to
1995. Theoretically the bycatch of FAL in the tuna fishery would be affected by the level of effort in
the tuna fishery. Estimates of catches have been increasing slowly since 1997 (Figure 3), mainly due
to the sustained decline in longline catch rate (Lawson 2011). Historically, most of the purse seine
catch has been taken from the western equatorial region, which experienced a sharp increase from
about 500,000–800,000 mt in the 1990s to approximately 1,200,000 mt in 2007–2009. This increase
6
along with a large increase in the purse-seine fishery (Williams and Terawasi 2011) in the eastern
equatorial region of the WCPO could imply large increases in fishing mortality for FAL over the last
two decades.
1.3 Previous assessments
This paper presents an update from the first stock assessment of silky shark in the western and
central Pacific Ocean that was submitted to SC8 in August 2012 (Rice and Harley 2012a). Appendix 4
contains the SC8 recommendations on the assessment – in particular the requests for additional
work that are covered in this updated assessment.
The main changes are the inclusion of a greater number of CPUE and catch time series in the
analysis. This is only the forth full integrated stock assessment undertaken for a pelagic shark stock
in the Pacific Ocean following the north Pacific blue shark assessments of Kleiber et al. (2009) and
Rice and Harley (2013), and the oceanic whitetip shark stock assessment by Rice and Harley (2012b).
2 Data compilation
Data used in the silky assessment consist of catch, effort and length-frequency data for the fisheries
defined above. In comparison to most WCPO assessments for tunas, the assessments for silky sharks
draw heavily on observer data for estimating CPUE, and catch. Details of the analyses of the
observer data for CPUE and catch are provided in Rice (2012; 2013) and only briefly described here.
Estimates of the biological parameters were taken from literature (e.g. Cortés 2002, Oshitani et al.
2003, Joung et al. 2008).
2.1 Spatial stratification
The geographical area considered in the assessment corresponds to the western and central Pacific
Ocean from 30°N to 30°S and from oceanic waters adjacent to the east Asian coast to 150°W,
following the boundaries of the eastern boarder of the WCPO convention area. The assessment
model area comprises of one region (Figure 1).
2.2 Temporal stratification
The time period covered by the assessment is 1995−2009. Within this period, data were compiled
into annual values. The heavy reliance on observer data and the need to conduct two assessments
simultaneously (silky sharks and oceanic whitetip sharks) meant that key model inputs were
generated in late 2011 and there were still significant data gaps in 2010 observer data.
2.3 Catch Estimates
These are described in Rice (2012a; 2013) and the key aspects are repeated below.
Estimates of catches (Lawson 2011) were used (Table 2, Figure 3) as the primary catch series in the
silky shark assessment. Because Lawson estimated two time series of catches (for the purse seine
and longline), catch data for the four fisheries defined above had to be estimated by partitioning the
total catch according to the annual proportion of effort in each fishery. The annual catch estimates
from all fisheries, were expressed in numbers of fish. An alternative catch history was developed
based on the SPC held observer data to explore the effect of different trends and magnitudes in the
catch histories (Rice 2012a). Because these two catch trends used similar methods and different
subsets of the same dataset, two estimates from Clarke (2009) were used, with values updated to
2009. These catch estimates were based on trade data extrapolated using various fishery indices
such as tuna catch and area (Clarke 2005).

7
2.4 CPUE and standardised effort time series
Standardized catch per unit of effort series were used as indices of abundance (Figure 5). For
technical details and presentation of standardization model fits see Rice (2013). In brief,
standardized CPUE series were estimated for silky sharks in the western central Pacific based on
observer data held by SPC (SPC LL No Hawaii, the Target LL, purse seine catch/set and purse seine
catch /mt), observer data from Hawaii (HI LL, Walsh and Clarke 2011) and observer data collected by
the Japanese research and training vessels (JPN_RTV Clarke et al. 2011b).
2.5 Length-frequency data
Available length-frequency data from SPC holdings for each of the defined fisheries were compiled
into 156 2-cm size classes (11-13 cm to 323-325cm). Length-frequency observations consisted of the
actual number of FAL measured in each fishery by year. A graphical representation of the availability
of length samples is provided in Figure 6. There is evidence of a decrease in the length of FAL caught
over the last decade in the longline and purse seine fishery (Clarke 2011) which should inform the
assessment model. The weight (effective sample size) of all length frequency data was reduced to
0.01 times the number of individual sets sampled with an alternate run with a scalar of 0.05. The
effective sample size is typically lower than the number of fish sampled because the samples are not
independent.
The observer data indicates that longline fisheries principally catch immature FAL, within the 70-
200cm length range. The purse seine observer data indicates that the equatorial purse-seine
fisheries catch larger (and far fewer) silky sharks in the unassociated sets than the associated sets.
Although the full range of size class is present in both fisheries, 93% of the silky sharks caught in the
associated sets are <150cm TL as opposed to 45% in the unassociated sets. The length frequency
information came from roughly the same spatial area throughout the time period for both fleets
(Figures 7 and 8) with the exception of the lack of the Hawaiian longline observer data in 2005-2009.
3 Model description – structural assumptions, parameterisation, and priors
As with any model, various structural assumptions have been made in the FAL model. Such
assumptions are always a trade-off to some extent between the need, on the one hand, to keep the
parameterization as simple as possible, and on the other, to allow sufficient flexibility so that
important characteristics of the fisheries and population are captured in the model.
The assessment uses the stock assessment model and computer software known as Stock Synthesis
(version 3.21B http://nft.nefsc.noaa.gov/Download.html.). The silky shark model is an age (36 years)
structured, spatially aggregated (1 region) and two sex model. The catch, effort, size composition of
catch, are grouped into 4 fisheries, all of which cover the time period from 1995 through 2009. The
overall stock assessment model can be considered to consist of several individual models, namely (i)
the dynamics of the fish population; (ii) the fishery dynamics; (iii) observation models for the data;
(iv) parameter estimation procedure; and (v) stock assessment interpretations; where each sub-
model is given a different weight based on the underlying assumptions about the data inputs and
fixed parameter values. Detailed technical descriptions of components (i) − (iv) are given in Methot
(2011). The main structural assumptions used in the FAL model are discussed below and are
summarised for convenience in Tables 3 and 4.
3.1 Population dynamics
The model partitions the population into 36 yearly age-classes in one region, defined as the WCPO
between 30˚S and 30˚N and the eastern and western boundaries of the WCPO. The last age-class
comprises a “plus group” in which mortality and other characteristics are assumed to be constant.

8
The population is “monitored” in the model at yearly time steps, extending through a time window
of 1995-2009. The main population dynamics processes are as follows:
3.1.1 Recruitment
“Recruitment” in terms of the SS3 model is the appearance of age-class 1 fish (i.e. fish averaging 90
cm) in the population. The results presented in this report were derived using one recruitment
episode per year, which is assumed to occur at the start of each year. Annual recruitment deviates
from a Beverton and Holt stock-recruitment relationship (SRR2) were estimated, but tightly
constrained, reflecting the limited scope for compensation given estimates of fecundity. For the
purpose of computing the spawning biomass, we assume a logistic maturity schedule based on
length with the age at 50% maturity equal to 215 cm (Joung et al. 2008).
The steepness (h) of the stock-recruitment relationship is defined as the ratio of the equilibrium
recruitment produced by 20% of the equilibrium unexploited spawning biomass to that produced by
the equilibrium unexploited spawning biomass (Mace and Doonan 1988). It is rare for stock
assessment models to reliably estimate steepness, but the key productivity parameters for FAL are
extremely low (e.g. very low fecundity). Therefore steepness was fixed and included in the grid at
three separate values 0.342, 0.409 and 0.4893. Deviations from the SRR were estimated in two parts;
the early recruitment deviates for the 5 years prior to the model period; and the main recruitment
deviates that covered the model period (1995-2009).
There is no information which indicates that sex ratio differs from parity throughout the lifecycle of
FAL. In this assessment the term spawning biomass (SB) is a relative measure of spawning potential
and is a unitless term of reference. It is comparable to other iterations of itself (e.g. ����� �/�����) but not to total biomass.
3.1.2 Age and growth
The standard assumptions made concerning age and growth in the SS3 model are (i) the lengths-at-
age are assumed to be normally distributed for each age-class; (ii) the mean lengths at age are
assumed to follow a von Bertalanffy growth curve. For any specific model, it is necessary to assume
the number of significant age-classes in the exploited population, with the last age-class being
defined as a “plus group”, i.e. all fish of the designated age and older. This is a common assumption
for any age-structured model. For the results presented here, 36 yearly age-classes have been
assumed, as age 36 corresponds to the age at the theoretical maximum length. Growth was not
estimated in the model, but rather was fixed according to the relationship in Joung et al. (2008).
Growth was assumed to be the same for both sexes (Joung et al. 2008).
3.1.3 Natural mortality
Natural mortality was assumed to be constant throughout age classes and in time, with the natural
mortality set according to the values in the grid, the initial reference value of 0.18 assumed based on
a range of estimates (0.1-0.21) from demographic methods (Cortés, 2002). For the grid we included
alternative values of 0.1 and 0.26.
2 An alternative formulation for the relationship between spawning biomass and recruitment was considered
based on Taylor et al. (2003). We encountered considerable stability problems in the estimation procedure
when using this formulation, e.g. the model ‘converged’ to a low gradient without actually fitting the CPUE
series. For this reason we have not included these model runs in the assessment at this time, but we have
more recently successfully used this for the assessment of blue shark in the North Pacific and recommend
further consideration of this approach in the future.
3 These values relate to assumed levels of steepness of 0.3, 0.4, 0.5 under the Taylor et al. (2013)
parameterization which was not included in the final set of model runs.
9
3.1.4 Initial population size and structure.
It is not assumed that the FAL population is at an unfished state of equilibrium at the start of the
model (1995). The population age structure and overall size in the first year is determined as a
function of the first years recruitment (R1) offset from virgin recruitment (R0), the initial
‘equilibrium’ fishing mortality, and the recruitment deviations prior to the start of the year. In this
model the R1 offset, and the recruitment deviations are estimated. Typically initial fishing mortality
is an estimated quantity, but due to the lack of catch at age data (that would be critical to estimate
the total mortality experienced by the population at the start of the model) and no information on
pre-1995 removals, this was not possible. Instead the initial fishing mortality was fixed at three levels
(0.05, 0.1, and 0.2) within the grid. For reference the estimated FMSY was in the range 0.05 to 0.1.
3.2 Fishery dynamics
3.2.1 Selectivity
Selectivity is fishery-specific and was assumed to be time-invariant. Selectivity coefficients have a
range of 0-1, and for the longline bycatch fishery selectivity was assumed to be dome shaped with a
maximum at 172cm (Figure 9). Selectivity for the target longline fishery was also assumed to be
dome shaped but with maximum selectivity value that ranged from 168cm to 204cm. The selectivity
for purse seine unassociated sets was assumed to be logistic with size at inflection of 64cm. The
selectivity of the purse seine associated sets was estimated using a cubic spline parameterisation4.
All selectivities were initially estimated with all other parameters fixed at the reference values, to
produce the ‘best selectivity estimate’. The resulting estimated selectivity was then fixed at the best
estimate for the grid of runs.
3.2.2 Catchability and observation error
Given the lack of information regarding the change in abundance and CPUE, it was assumed that
each CPUE trend was directly and independently proportional to abundance. This is calculated by
assuming that the expected abundance index is based upon the sum of retained catch Btf, summed
over the length, age and gender. The expected abundance index G is then related to the overall
population abundance by
�� =������
where, ��is the catchability coefficient for fishery f, ��is the observation error that is assumed to
be lognormally distributed as: ln����~�(−0.5#�$, #�$) where #� is the standard error of ln(Gf), and
f index the individual fisheries.
Uncertainty in the standardized CPUE estimates was included in the model through the use of the
nominal annual standard error of the mean (σ √n⁄ , where σ is the annual standard deviation and n
is the number of samples) scaled by the mean annual value to produce the coefficient of variation.
This allows the model to reflect the uncertainty in the underlying data rather than standard errors
resulting from the standardization process which were in some cases unrealistically large or small.
3.3 Observation models for the data
For this model the total objective function is composed of the observation models for three data
components− the total catch data, the length-frequency data and the CPUE data, along with the
recruitment deviation, and parameter priors.
4 We used four nodes which allow considerable flexibility in the functional form while minimising the number
of parameters required to be estimated.

10
The objective function L is the weighted sum of the individual components indexed by year i, kind j,
and fishery f for those observations that are fishery specific (the catch, length composition, and
CPUE);
� = ∑ ∑ +,��,� ++����. + ∑ +/�//
Where ω is a weighting factor for each objective function component, R indexes the likelihood for
the recruitment deviates and θ indexes the likelihood for the priors. We briefly describe the
likelihoods for each component here but omit the details for the sake of brevity; interested readers
are referred to the Stock Synthesis Technical documentation (Methot, 2005).
The contribution to the objective function for the recruitment deviations is then defined as
�� = 0$123∑ 456$6 +78ln(#� )
Where 456 is the deviation in recruitment which is lognormally distributed with the expected value
equal the to the deterministic stock-recruitment curve, #� is the standard deviation for recruitment
and 78 is the number of years for which recruitment is estimated (Methot, 2005).
The contribution for the parameter priors (Lθ) depends on the distribution for the prior. Normal
error structures can be used for all priors while symmetric beta distributions were used for the stock
recruit parameters. The normal priors distribution for a parameter θ is then
�/ = 0.5 9/:;<1< =$
where > is the parameter, which is distributed �(?/, #/). The contribution to the objective function
for the beta priors is;
�/ =�ln(1 − >@) − ln�1 − ?@/��(>A − 1) + �ln(>@) − ln�?@/��(>B − 1)
where >@ is the > parameter rescaled into [0,1], ?@/ is the prior mean rescaled into [0,1], , ?/ is the
input prior, #/ is the standard deviation after rescaling into [0,1] and >A & >Bare derived quantities
relating to the beta function (Methot, 2005).
The contribution of the length composition to the objective function is then defined as
�CDEF6GHIJ =∑ ∑ 76�KLL6 + ∑ M6�Lln(M6�KL M6�KL)⁄K
where 76�Lis the number of observed lengths in the catch at each time step t for fishery O in length
bin P, gender Q and M6�KLis the observed proportion of the catch at each time step t for fishery O in
length bin P, gender Q, and M6�KL is the corresponding expected proportion of the catch at each time
step t for fishery O in length bin P, gender Q (Methot, 2005).
The objective function component for CPUE is defined as
�R� = 0.5∑ STU�VWX�:TU(V5WX)1YZ[\,W,X ]$
6
Where for the expected abundance index G is then related to the overall population abundance by
�� =������
Where, ��is the catchability coefficient for fishery f, ��is the observation error that is assumed to
be lognormally distributed as: ln����~�(−0.5#�$, #�$) where #� is the standard error of ln(Gf), Bf
is the biomass estimate for fishery f.
The contribution to the objective function component for catch is defined in terms of biomass, and is
defined as

11
�A�^ = 0.5∑ ∑ S _ab:_c ab1YdeYf,W,X]$
6g
Where wij, wc ij, and #A�^,6,� are the observed mean weight, the expected mean weight and the
standard deviation (respectively) of the catch by fishery f at time t, v indexes the observations
(Methot, 2005). The observed total catch data were assumed to be unbiased and relatively precise,
with the standard error of the log of the catch being 0.05. Because catch was specified in numbers
the observed catch was converted to biomass based on the estimated population structure and
fishery selectivity.
3.4 Assessment Strategy
Due to the reliance on observer data and the general lack of knowledge of silky shark biology when
compared to the tropical tunas, and because it was generally difficult to identify with confidence
which clearly were the most appropriate data inputs or structural assumptions to make in a model,
some of the data inputs are contradictory (e.g. CPUE trends in different fisheries). Therefore the
focus was on establishing the key areas of uncertainty and then within each area, identifying a small
number of alternative hypotheses that a relative plausibility could be assigned to. In this assessment
we identified seven key areas on uncertainty and for each of these we identified 2-3 alternative
hypotheses. These are listed below and described in further detail in Table 4, with the reference case
parameters listed in bold.
• Catch (4 time series)
• CPUE (6 scenarios)
• Natural Mortality (3 values)
• Steepness (3 values)
• Initial fishing mortality (3 values)
• Effective Sample Size weighting (2 values )
• Standard Deviation of the Recruitment deviates (2 values).
We examined all possible combinations to give a ‘grid’ over 2592 models. Each model had its own
overall weight calculated as the product of the probability (plausibility) assigned to the hypotheses
under each area of uncertainty. The model run which had the most plausible hypothesis under each
area of uncertainty was our reference case model, the values associated with each option are listed
in Table 4. Because the CPUE series are all equally weighted, the reference case was chosen
randomly from the multiple highest weighted models.
For simple sensitivity analysis we identified those model runs from the grid which represented just a
single change from the reference case model – this gave 16 sensitivity analyses.
3.5 Parameter estimation and uncertainty
The parameters of the model were estimated by maximizing the log-likelihoods of the data plus the
log of the probability density functions of the priors, and the normalized sum of the recruitment
deviates estimated in the model. The maximization was performed by an efficient optimization using
exact numerical derivatives with respect to the model parameters (Fournier et al. 2012). Estimation
was conducted in a series of phases, the first of which used arbitrary starting values for most
parameters. The control file FAL.ctl documenting the phased procedure, initial starting values and
model assumptions is provided in Appendix 1.
The Hessian matrix computed at the mode of the posterior distribution was used to obtain estimates
of the covariance matrix. This was used in combination with the Delta method to compute
approximate confidence intervals for parameters of interest. The reference case model was analysed
with Markov Chain Monte Carlo simulations to provide an estimate of the statistical uncertainty with

12
respect to the estimated and derived parameters. 1,000,000 function evaluations thinned every 100
with a 1000 iteration burn in period.
3.6 Stock assessment interpretation methods
Several ancillary analyses were conducted in order to interpret the results of the model for stock
assessment purposes. Note that, in each case, these ancillary analyses were completely integrated
into the model, and therefore confidence intervals for quantities of interest are available using the
Hessian-Delta or MCMC approaches. The standard yield analysis consists of computing equilibrium
catch, adult and total biomass, conditional on the current average fishing mortality, and the same
reference points at the theoretical MSY. The ratios of the current (or recent average) levels of fishing
mortality and biomass to their respective levels at MSY are of interest as reference points.
For the standard yield analysis, the F values are determined as the average over some recent period
of time. In this assessment, we use the average over the period 2005−2008. The last year in which
catch and effort data are available for all fisheries is 2009. We do not include 2009 in the average as
fishing mortality tends to have high uncertainty for the terminal data years of the analysis, and the
catch and effort data for this terminal year are usually incomplete. Many models had a downward
trend in the biomass and an upward trend in the cumulative fishing mortality over the years 2005-
2008, so the reference points based on the average current biomass may be biased. Due to
uncertainty in the data and the extrapolation necessary to estimate virgin biomass and the
corresponding spawning stock size an additional reference point, depletion since 1995 is also used to
summarize the impact of fishing.
4 Results
This section provides a detailed summary of the results from the reference-case assessment and is
based on advice from the Pre-Assessment Workshop (OFP, 2013). Also presented for comparison of
important results are the 16 sensitivity analyses.
As requested by the 2013 Pre-Assessment Workshop we have presented key model results for each
set of catch and CPUE series separately, the SPC bycatch longline (no HW) and Japanese RTV series
combined, and for all model runs combined. The main results presented here refer to the model
runs with SPC bycatch longline (no HW) and Japanese RTV series combined, but all model results are
available for the consideration of SC9 and summaries for each CPUE and catch series and the overall
grid are provided in Appendix2.
4.1 Reference case
Detailed results and diagnostics are presented for the reference case. The reference case model was
catch from Lawson (2011), natural mortality = 0.18, initial fishing mortality=0.1, sample size
weighting = 0.1, CPUE trend based on the bycatch longline, and SigmaR=0.1 and steepness=0.409.
The reference case was one of 24 models with equal weighting, but was selected randomly.
Uncertainties in the reference case model are explored via a sensitivity analysis.
4.1.1 Fit of the model to the data, and convergence
A summary of the fit statistics for the reference case and sensitivity analyses is given in Table 5. Due
to differences in the catch and effort data sets, the total likelihood values are not comparable
between all runs.
The fit of the model to the CPUE data was within expectation for the reference case (bycatch LL
CPUE), because the model is constrained by the biology of the species and the catch data do not
provide a basis for a large increase and then decrease in biomass. The observed trend balances the
lack of fit through the observed CPUE with a declining trend (Figure 10). There was a consistent lack
of fit for the alternate CPUE data (target LL ) (Figure 10). The lack of fit with the alternate CPUE data

13
is driven by the conflict of the CPUE and the biological parameters with respect to the estimated
catch.
The size composition of individual length samples is roughly consistent with the predicted size
composition of the overall exploitable component of the population (Figure 11). The observed
variation in the length composition is likely to reflect variation in the distribution of sampling effort
between the individual fisheries and sampling programs given that FAL are predominantly bycatch.
The effect of these data has also been down-weighted in the likelihood to reflect this variability.
4.1.2 Recruitment
The time-series of recruitment estimates is shown in Figure 12 with recruitment tightly coupled to
the spawning stock biomass size. Overall, recruitment was estimated to decline over the model
period (1995-2009) due to a reduction in the spawning stock biomass. A time series of recruitment is
presented in Figure 13.
4.1.3 Biomass
The total and spawning biomass trajectories for the reference case are presented in Figure 13. We
also present the depletion from 1995 because estimates of overall virgin biomass are uncertain,
even in scenarios with excellent data and more so when only recent CPUE data is available and the
catch is estimated, such as in the current model. The highest biomass (and lowest depletion) occurs
during the initial year of the model and the biomass steadily declines throughout the model period,
correspondingly the depletion increases. Time series plots of spawning biomass depletion, relative
to 1995 and MSY for all runs and shaded by probability are shown in Figure 14.
4.1.4 Fishing mortality and the impact of fishing
Yearly average fishing mortality rates are shown in Figure 15. The non-target LL is by far the largest
component of the overall F, increasingly rapidly from the assumed levels of 0.1 in 1995 to a high of
over 0.3 in 2009. The next highest component of F is the associated purse seine fishery which
increases to approximately 0.125 by 2009, which on its own is above the estimated FMSY = 0.084.
Compared to the longline fleets, the associated purse seine fishery has a disproportionate effect on
the overall fishing relative to the number of fish it catches due to the fact that it catches
predominantly juveniles.
4.1.5 Yield and reference point analysis
Biomass estimates, yield estimates, and management quantities for the reference case are defined
in Table 6 and presented in Table 7. For the reference-case, MSY is estimated to be 1,994 mt per
annum at a level of fishing effort approximately 22% of the current level of fishing mortality.
Therefore to reduce fishing mortality to the MSY level would require a reduction in fishing mortality
of 78%. The level of average current catch (5,331 mt) is higher than the estimated MSY. The
estimate of current biomass is 44,988 mt, which is 78% of BMSY.
Current estimates of stock depletion are that the total biomass has been reduced to 30% of
theoretical equilibrium virgin biomass. Although estimates of virgin biomass are inherently uncertain
due to the extrapolation necessary, declines are evident over just the model period, with spawning
biomass having been reduced by 33% (SBCurrent/SB1995 = 0.66). This decline is consistent with a
k��� �/ kl��� value of 4.4.
4.1.6 Sensitivity analyses and structural uncertainty grid
Sensitivity to several alternative scenarios was examined in a grid, in which all scenarios were
interacted with one another (Table 7). Sensitivity analyses are also presented for the Catch_2,
Catch_4, Catch_5, CPUE_3, CPUE_4, CPUE_5, CPUE_6, CPUE_7, Nat_M_1 , Nat_M_3, Steep_1,

14
Steep_3 Init_F_1, Init_F_3, SampSz_2, SigmaR_2 model runs in Table 7. The biomass and
recruitment time series for these runs are shown in Figure 16.
The model was most sensitive to the CPUE input data, which dictated the overall model results with
respect to stock status (Table 7 and Table 9). All runs that included the target longline and purse
seine CPUE trends estimated a current total biomass in excess of 150,000,000mt. This value is more
than 18 times greater than the combined 2010 estimate of bigeye, south Pacific albacore, skipjack
and yellowfin tuna total biomass combined. Therefore these runs are not considered plausible.
Each scenario was weighted based upon the values included in the model run (Table 4), results are
presented here as the uncertainty grid and reflect a re-sampling of the results based on the weights
described in Table 4. The reference case and the quantiles from the structural uncertainty grid runs
that included the SPC no-Hawaii longline series and the JPN RTV CPUE series are presented in Table
8. Grid results for the entire grid and each CPUE and catch series are provided in Appendix 2. The
results of the grid are presented as weighted depletion trajectories (of ��/�����) in Figure 14, and
as Kobe plots in Figure 17.
The effects of each of these alternative scenarios on the ratio-based management indicators
����� �/����� (Figure 18),����� �/��� (Figure 19), ����� �/��0mmn (Figure 20), and
k��� �/ kl��� (Figure 21) are presented. The choice of CPUE series had the largest effect on the
two biomass based management parameters ���� �/����, and ����� �/�����, with initial
fishing mortality having the second biggest effect. These two factors along with steepness, natural
mortality and sample size weighting were the most influential factors on the management quantity
k��� �/ kl���. The full array of management parameters for each alternate variable level (from
the reference case) is also presented (Table 7). The alternate catch time series (Catch_2, Catch_4
and Catch 5) had little effect on the stock status. The higher natural mortality estimate (Nat_M_3),
lower initial fishing mortality (Init_F_1), and the alternate sample size (Samp.Sz_2) and the higher
steepness (Steep_3) showed a more pessimistic stock status based on biomass ratios (lower
����� �/����� ) (Table 7). The 5th
and 95th
quantiles of structural uncertainty based on runs
using the SPC no-Hawaii longline series and the JPN RTV CPUE series regarding the stock status
ranged from 0.51 to 1.23 for ����� �/�����, from 0.55 to 1.39 for ���� �/���� and from
1.41 to 7.96 for k��� �/kl���. Results of the entire grid are included in Appendix 2 for
completeness.
4.1.7 Stock status
Fishing mortality rates tended to increase over the modelling period, driven mainly by the increased
effort in the longline fleet. The mortality rates remain substantially above the MSYF
level,k��� �/k��� =4.48 for the reference case and 3.39 for the median of the runs that included
the SPC no-Hawaii longline series and the JPN RTV CPUE series (Table 8), therefore, we conclude that
overfishing of silky sharks is occurring. Total biomass was estimated to be lower than the MSYB~
level
for the reference case and the grid median, the current total biomass is 30% for the reference case
and 34% for the grid median of the equilibrium unexploited level ( 0
~B Table 8). The ����� �/
����� is 0.70 for the reference case and 0.82 for the grid median based on the SPC Non target LL
and the JPNRTV. For the majority of the SPC Non target LL and the JPNRTV runs undertaken,
����� �is less than ����� (the 5th
and 95th
quantiles are 0.51 and 1.23). Based on the
distribution of these results we conclude that it is highly likely that the stock is in an overfished state.
The distribution of stock status as a function of the CPUE and catch inputs with respect to the Kobe
plot is described in Table 9. This table highlights the Effect that the CPUE inputs, in particular the
target longline have on the overall results.
15
5 Discussion
Aside from the unique challenges of assessing a non-target species, silky shark is a very difficult
species to assess due to the limitations of the CPUE data, reported landings, total mortality and
minimal information on the life history and biology. This creates a situation where it is difficult to
observe the effect of fishing on the population’s biomass, despite knowing that the species
commonly occurs as bycatch in the largest fisheries of the WCPO.
The WCPO assessment is reliant on the CPUE data and the catch estimates to estimate un-fished
population sizes. The different CPUE scenarios used in this analysis had different trends and as
expected led to different results. Additional observer data exists and would be useful in constructing
CPUE trends and catch estimates. In addition accurate reporting of FAL and other shark catch by
commercial vessels would facilitate the estimation of catch. The alternate catch histories had
different magnitudes and but somewhat similar trends, and the resulting estimates of stock status
were similar. This indicates that the status results incorporate the alternate assumptions made
regarding catch size and trend based on current catch estimates. Additional information regarding
catch, effort and size composition, especially from the Philippines and Indonesia help construct more
accurate catch and CPUE trends.
Estimates of biological and life history traits such as growth, natural mortality and the size at
maturity are less well understood than for other shark species (e.g. blue and short finned mako
sharks) though dependable estimates do exist for the Pacific (growth, and size at maturity) and can
be borrowed from other oceans (natural mortality, rate of population increase). These studies are
crucial to our understanding not only of the species at an individual level but also at the population
level. The stock as a whole is limited by its intrinsic rate of growth and this helps inform and
constrain the model. The low productivity of silky sharks helps constrain the model within plausible
population dynamics. These factors combined with the reliance on observer data that is
characterized by low spatial coverage and spotty temporal continuity necessitates an integrated
modelling approach that can incorporate all available data.
Even with integrated models reliance on observer data, estimates rather than reports of landings
and broad assumptions regarding a species’ ecology and biology can produce different results based
upon different sets of assumptions. Because the most appropriate data inputs and structural
assumptions were not always clearly identifiable we applied a grid approach to investigating multiple
alternate models. The goal of this approach is to produce an assessment that is robust to multiple
assumptions regarding the model inputs. To evaluate this modelling framework and summarize the
overall results we established a relative probability that could be assigned to each model and was
the product of the plausibility of a model’s assumptions. This is the first time this technique has
been applied to a WCPFC assessment but is recommended for assessments where multiple plausible
states of nature exist.
The grid and weighting approach is suited for assessments where the data inputs are limited to a
recent time period but the species has been historically impacted by fisheries. In this assessment
uncertainty regarding the initial depletion was included in the grid because of the lack of historical
landings or abundance data. The different levels of the initial depletion had a substantial impact on
the terminal depletion levels of the plausible runs with the only runs that indicated the stock not
being overfished coming from the first (and lowest) level of initial fishing mortality. This indicates
that the historical landings have a large impact on the current status and that further studies to
quantify historical landings are warranted. This decline in catch rates corresponds with an increase in
effort and a general level estimate of catch (for the reference case) and is consistent with biological
information indicating a low productivity stock that is experiencing increasing fishing mortality. The
combination of increasing fishing mortality, increasing effort, sustained catch, declining CPUE and
constraining biology give some additional certainty that the stock assessment results are in the
correct quadrant of the Kobe plot.

16
Notwithstanding the critical concerns over stock status, in this assessment we have reported stock
status in relation to MSY based reference points, but the actual reference points to be used to
manage this stock have not yet been considered by the Scientific Committee or Commission.
Reference points for bycatch species should be an area of important consideration for the
Commission and the oceanic whitetip and silky shark stocks will provide useful candidates for the
work.
This assessment addresses regional-scale stock abundance and status. Estimates of management
quantities do not reflect upon the status of FAL in the eastern Pacific, or the results of potential
localized depletion in either half of the ocean. Further work should include a Pacific wide assessment
and inclusion of tagging results. This combined with additional biological work such as determining
the pupping frequency, gestation period, and improved estimates of the relationship between
length and fecundity could significantly improve any future modelling work. However obtaining
adequate sample sizes would come at the cost of sacrificing what may be a significant portion of the
fecund population.
Further development of the methods and inputs for this stock assessment would greatly improve an
updated stock assessment, which we recommend for 2014 if the key data sets (JPN RTV and
Hawaiian longline observer) are available for analysis. The advantage of this is that we would have
an assessment with 3 more years, potentially 4 more years of data with increased coverage rates for
the observer data and better reporting on the levels of bycatch in commercial fisheries. The next
assessment should consider the Low Fecundity Spawner Recruitment relationship of Taylor et al.
(2013) which wasn’t used here, but has been successfully applied to blue shark in the North Pacific
Ocean.
6 Conclusions
This is an update to the first stock assessment for silky sharks in the WCPO considered by SC8 in
August 2012. The key conclusions are as follows.
1. The results of the model can be split into two categories which are mutually exclusive with
respect to the estimates of stock status. These two categories are characterized by the CPUE
input. All runs that included the target longline CPUE trend estimated a current total biomass in
excess of 150,000,000mt. This is more than 18 times greater than the combined 2010 estimate
of bigeye, south Pacific albacore, skipjack and yellowfin tuna total biomass combined. Therefore
these runs are not considered plausible.
2. Notwithstanding the difficulties inherent in the input data, the size composition data shows
consistent declines over the period of the model (1995-2009) which is coupled with increasing
fishing mortality, and a recently declining CPUE trend.
3. This is a low productivity species and this is reflected in the low estimated value for FMSY (0.08)
and high estimated value for �����/���(0.39). These directly impact on conclusions about
overfishing and the overfished status of the stock.
4. Based on the reference case the estimated spawning biomass, total biomass and recruitment all
decline consistently throughout the period of the model. The biomass declines are driven by the
CPUE series, and the recruitment decline is driven through the tight assumed relationship
between spawning biomass and recruitment.
5. Estimated fishing mortality has increased to levels far in excess of FMSY (FCURRENT/FMSY = 4.48) and
across nearly all plausible model runs undertaken estimated F values were much higher than
FMSY (the 5th
and 95th
quantiles are 1.41 and 7.96). Based on these results we conclude that
overfishing is occurring.
6. Estimated spawning biomass has declined to levels below SBMSY (����� �/�����= 0.70) and
for the majority of the model runs undertaken, ����� �is less than ����� (the 5th
and 95th

17
quantiles are 0.51 and 1.23). Based on the distribution of these results we conclude that it is
highly likely that the stock is in an overfished state.
7. Notwithstanding the bullet point above, estimates of SB0 and SBMSY are uncertain as the model
domain begins in 1995, so it is also useful to compare current stock size to that at the start of the
model. Estimated spawning biomass has declined over the model period to 67% of the 1995
value for the reference case, and across the majority of the model runs model runs ����� �/��1995has declined (the 5th
and 95th
quantiles are 39% decline and a 67% increase).
8. Current catches are higher than the MSY (5,331 mt versus 1,994 mt), further catch at current
levels of fishing mortality would continue to deplete the stock below SBMSY. Current (2005-2008
average) and latest (2009) catches are significantly greater than the forecast catch in 2010 under
FMSY conditions (approximately 600 mt).
9. The greatest impact on the stock is attributed to bycatch from the longline fishery, but there are
also significant impacts from the associated purse seine fishery which catches predominantly
juvenile individuals.
10. Given the bycatch nature of fishery impacts, mitigation measures provides the best opportunity
to improve the status of the silky shark population. Existing observer data may provide some
information on which measures would be the most effective.
11. Given recent decisions to improve logsheet catch reporting and observer coverage in the
longline fishery, and noting the concerns regarding stock status outlined in this assessment, it is
recommended that an updated assessment be undertaken in 2014 if the key data sets (JPN RTV
and Hawaiian longline observer) are available for analysis.
12. As this was an update to the first stock assessment, there are many research activities that could
improve future assessments including:
a. Increased observer coverage in the longline fishery, as this is the major component
of fishing mortality. Additional information on the fate and condition at release
would allow for a better modelling framework for decision making.
b. Data from Philippines and Indonesia regarding catch, effort and size composition of
shark catches.
c. Tagging studies which are critical for understanding stock structure and post release
survival (e.g. Campana et al. 2009, Moyes et al. 2006).
d. Studies on growth and reproductive biology – especially female maturity to inform
the use of the Low Fecundity Spawner Recruitment relationship of Taylor et al.
(2013).
7 Acknowledgements
We thank the various fisheries agencies for the provision of the catch, effort and size composition
data used in this analysis. This analysis benefited greatly from the help given by the entire Oceanic
Fisheries Programme at the SPC which provided advice and recommendations at multiple intervals.
Mark Maunder and Alex da Silva from IATTC provided invaluable help in the initial modelling phase
and Ian Taylor (NWFSC NOAA) provided expert advice on the technical aspects of the stock
assessment model Stock Synthesis.
8 References
Bonfil, R. (1997) Status of shark resources in the southern Gulf of Mexico and Caribbean:
Implications for management. Fisheries Research 29, 101–117.

18
Bonfil, R. (2008). "The Biology and Ecology of the Silky Shark, Carcharhinus falciformis". In Camhi, M.,
Pikitch, E.K. and Babcock, E.A.. Sharks of the Open Ocean: Biology, Fisheries and Conservation.
Blackwell Science. pp. 114–127.
Bonfil, R., de Anda, D. and Mena, R. (1990) Shark fisheries in México: The case of Yucatán as an
example. In: Elasmobranchs As Living Resources: Advances in Biology, Ecology, Systematics,
and the Status of the Fisheries (eds. H. L. Pratt Jr., S. H. Gruber and T. Taniuchi). NOAA
Technical Report NMFS 90. NOAA/NMFS, Silver Spring, MD, pp. 427–441.
Bonfil, R., Mena, R. and de Anda, D. (1993) Biological parameters of commercially exploited silky
sharks, Carcharhinus falciformis, from the Campeche Bank, México. In: Conservation Biology of
Elasmobranchs (ed. S. Branstetter). NOAA Technical Report NMFS 115. NOAA/NMFS, Silver
Spring, MD, pp. 73–86.
Branstetter, S. (1987) Age, growth and reproductive biology of the silky shark, Carcharhinus
falciformis, and the scalloped hammerhead, Sphyrna lewini, from the northwestern Gulf of
Mexico. Environmental Biology of Fishes 19, 161–173.
Cadena-Cárdenas, L. (2001) Biología reproductiva Carcharhinus falciformis (Chondrichthyes
Carcharhiniformes: Carcharhinidae), en el Golfo de California. Bachelor’s thesis, Departamento
de Biología Marina, Universidad Autónoma de Baja California Sur, La Paz, Mexico, 66 pp.
Campana, S.E., Joyce, W., Manning, M.J. (2009). Bycatch and discard mortality in commercially
caught blue sharks Prionace glauca assessed using archival satellite pop-up tags. Marine
Ecology Progress Series 387: 241–253.
Clarke, S. C., McAllister, M. K. and Michielsens, C. G. J. (2005) Estimates of shark species composition
and numbers associated with the shark fin trade based on Hong Kong auction data. Journal of
Northwest Atlantic Fishery Science 35, 453–465.
Clarke, S., Magnusson, J. E., Abercrombie, D. L., McAllister, M. and Shivji, M. S. (2006) Identification
of shark species composition and proportion in the Hong Kong shark fin market based on
molecular genetics and trade records. Conservation Biology 20, 201–211.
Clarke, S. (2011) A status snapshot of key shark species in the western and central Pacific and
potential mitigation options. WCPFC-SC7-EB-WP-04.
Clarke, S., Harley, S., Hoyle, S., Rice, J. (2011a) An Indicator based analysis of key shark species based
on data held by SPC-OFP. WCPFC-SC7-EB –WP-04.
Clarke, S., Yokawa, K. Matsunaga, H., Nakano, H. (2011b) Analysis of North Pacific Shark Data from
Japanese Commercial Longline and Research/Training Vessel Records. WCPFC-SC7-EB-WP-04.
Accessed online at http://www.wcpfc.int/doc/eb-wp-02/analysis-north-pacific-shark-data-
japanese-commercial-longline-and-researchtraining-ves
Cortés, E. (2002) Incorporating uncertainty into demographic modelling: Application to shark
populations and their conservation. Conservation Biology 16, 1048–1062.
Gilbert, P. W. and Schlernitzauer, D. A. (1965) Placentation in the silky shark, Carcharhinus
falciformis and bonnet shark, Sphyrna tiburo. The Anatomical Record 151(3), 452.
Joung, S.-J., Chen, C.T., Lee, H.H., Liu, K.-M. (2008) Age, growth, and reproduction of silky sharks,
Carcharhinus falciformis, in northeastern Taiwan waters. Fisheries Research, 90 (1-3): 78-85.
Kleiber, P., Clarke, S.C., Bigelow, K., Nakano, H., McAllister, M., and Takeuchi, Y. (2009). North Pacific
blue shark stock assessment. NOAA Technical Memorandum NMFS-PIFSC-17.
Kohler, N. E., Casey, J. G. and Turner, P. A. (1998) NMFS Cooperative Shark Tagging Program, 1962–
93: An atlas of shark tag and recapture data. Marine Fisheries Review 60(2), 1–87.

19
Last, P. R. and Stevens, J. D. (1994) Sharks and Rays of Australia. CSIRO, Collingwood, Victoria,
Australia.
Lawson, T. (2011) Estimation of Catch Rates for Key Shark Species in Tuna Fisheries of the Western
and Central Pacific Ocean using Observer Data. WCPFC–SC7–2011 / EB–IP–02
Mace, P.M., and Doonan, I.J. (1988) A generalized bioeconomic simulation model for fish
populations. New Zealand Fisheries Research Assessment Document 88/4.
Methot, R. D. (2005). Technical description of the Stock Synthesis II assessment program. NOAA
Technical Memorandum SEDAR 16-AW-04.
Methot, R.D. (2011) User Manual for stock synthesis, Model Version 3.23b.
http://nft.nefsc.noaa.gov/downloads/SS-323b-documentation.zip
Moyes, C.D., Fragoso, N., Musyl, M.K. and Brill, R.W. (2006) Predicting post-release survival in large
pelagic fish. Transactions of the American Fisheries Society 135: 1389–1397.
OFP. 2012. Progress on the updated silky shark stock assessment in the WCPO. WCPFC9-2012-IP13.
OFP. 2013. Report from the SPC pre-assessment workshop, Noumea, April 2013. WCPFC-SC9-3/SA-
IP-01.
Oshitani, S., Nakano, H, Tanaka, S. (2003) Age and growth of the silky shark Carcharhinus falciformis
from the Pacific Ocean. Fisheries Research 69: 456-464.
Rice, J. (2012a) Alternative catch estimates for silky and oceanic whitetip sharks in the WCPO.
WCPFC-SC8-2012/SA-IP-12.
Rice, J. (2012b) Standardization of catch per unit effort for silky sharks in the western and central
Pacific Ocean. WCPFC-SC8-2012/ SA-IP-11
Rice, J. (2013) Catch and catch per unit effort of silky sharks in the Western and Central Pacific
Ocean. WCPFC-SC9-2013/SA-IP-02
Rice J. and Harley, S. (2012a) Stock assessment of silky sharks in the western and central Pacific
Ocean. WCPFC-SC8-2012/SA WP-07
Rice J. and Harley, S. (2012b) Stock assessment of oceanic whitetip sharks in the western and central
Pacific Ocean. WCPFC-SC8-2012/SA WP-06
Rice J. and Harley, S. (2013) Stock assessment of blue sharks in the north Pacific Ocean using Stock
Synthesis, WCPFC-SC9-2013/SA-WP-02.
Springer, S. (1967) Social organization of shark populations. In: Sharks, Skates and Rays (eds. P. W.
Gilbert, R. F. Mathews and D. P. Ralls). Johns Hopkins University Press, Baltimore, MD, pp.
141–174.
Stevens, J. D. and Wayte, S. E. (1999) A Review of Australia’s Pelagic Shark Resources. Final Report
Project 98/107. Fisheries Research and Development Corporation, Deakin West, Australian
Capital Territory, Australia, 64 pp.
Strasburg, D.W. (1958) Distribution, abundance and habits of pelagic sharks in the central Pacific
Ocean. Fishery Bulletin 59, 335-361.
Taylor I G, Gertseva V, Methot R D, Maunder M N (2013) A stock-recruitment relationship based on
pre-recruit survival, illustrated with application to spiny dogfish shark. Fisheries Research 142:
15– 21.
Walsh, W. A., and S. C. Clarke. (2011). Analyses of catch data for silky and silky sharks reported by
fishery observers in the Hawaii-based longline fishery in 1995−2010. Pacific Islands Fish. Sci.
Cent., Natl. Mar. Fish. Serv., NOAA, Honolulu, HI 96822-2396. Pacific Islands Fish. Sci. Cent.
Admin. Rep. H-11-10, 43 p. + Appendices.

20
Watson, J.T., Essington, T.E., Lennert-Cody, C.E., Hall, M.A. (2009). Trade-offs in the design of
fisheries closure: Management of silky shark bycatch in the eastern Pacific Ocean tuna fishery.
Conserv. Biol. 23(3): 626-235.
Williams, P., and Terawasi, P. (2011) Overview of tuna fisheries in the western and central Pacific
Ocean, including economic conditions – 2010. WCPFC-SC7-2011/GN WP-1
21
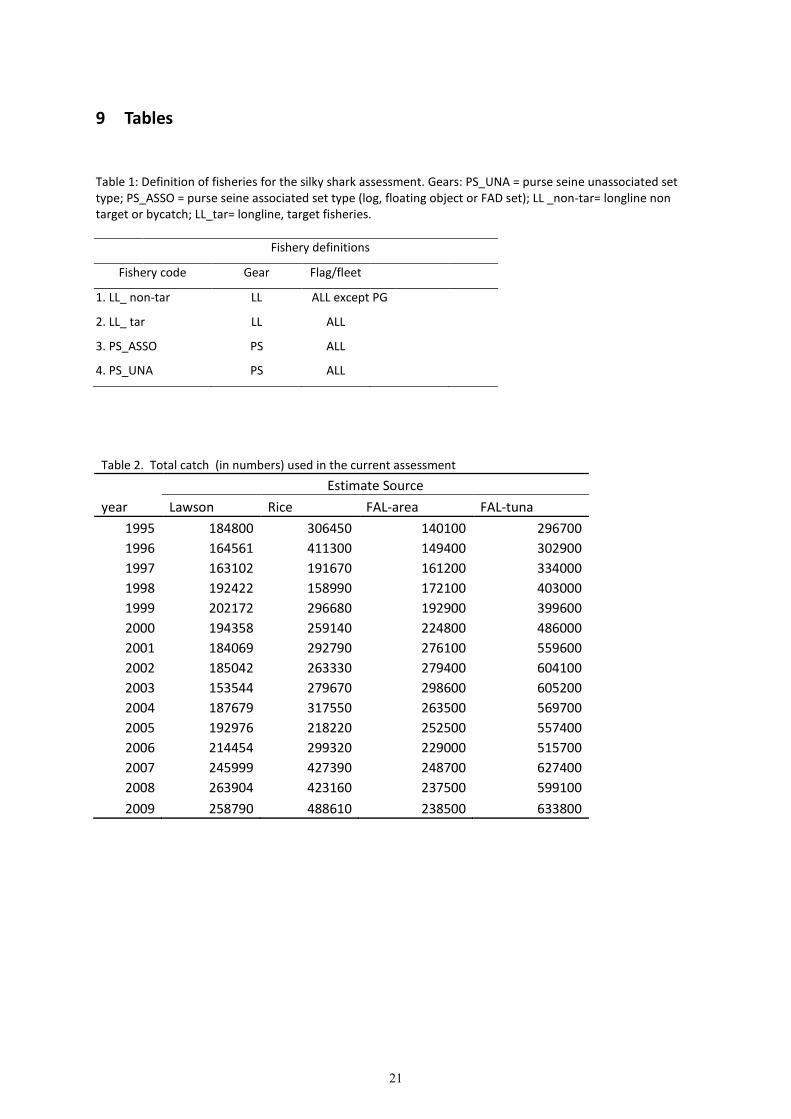
9 Tables
Table 1: Definition of fisheries for the silky shark assessment. Gears: PS_UNA = purse seine unassociated set
type; PS_ASSO = purse seine associated set type (log, floating object or FAD set); LL _non-tar= longline non
target or bycatch; LL_tar= longline, target fisheries.
Fishery definitions
Fishery code Gear Flag/fleet
1. LL_ non-tar LL ALL except PG
2. LL_ tar LL ALL
3. PS_ASSO PS ALL
4. PS_UNA PS ALL
Table 2. Total catch (in numbers) used in the current assessment
Estimate Source
year Lawson Rice FAL-area FAL-tuna
1995 184800 306450 140100 296700
1996 164561 411300 149400 302900
1997 163102 191670 161200 334000
1998 192422 158990 172100 403000
1999 202172 296680 192900 399600
2000 194358 259140 224800 486000
2001 184069 292790 276100 559600
2002 185042 263330 279400 604100
2003 153544 279670 298600 605200
2004 187679 317550 263500 569700
2005 192976 218220 252500 557400
2006 214454 299320 229000 515700
2007 245999 427390 248700 627400
2008 263904 423160 237500 599100
2009 258790 488610 238500 633800

22
Table 3. Main structural assumptions used in the reference case model.
Category Assumption
Observation model for
total catch data
Observation errors small, equivalent 0.5 on the log scale.
Observation model for
length-frequency data
Normal probability distribution of frequencies with variance determined
by sample size and observed frequency. Effective sample size varies
among fisheries, assumed at most to be 0.01 times actual sample size.
Recruitment Occurs as discrete events at the start of each year. Spatially-aggregated
recruitment is related to spawning biomass in the prior year via a
Beverton-Holt SRR (steepness fixed at the 0.409). Deviates from annual
recruitment are estimated with the maximum fixed standard deviation set
to 0.1.
Initial population The population age structure and overall size in the first year is
determined as a function of the first years’ recruitment (R1) offset from
virgin recruitment (R0), the initial ‘equilibrium’ fishing mortality, and the
recruitment deviations prior to the start of the year. The R1 offset, and the
recruitment deviations are estimated. The initial fishing mortality was
fixed at 0.1 for the reference case.
Age and growth 36 yearly age-classes, with the last representing a plus group. Individual
age-classes have independent mean lengths constrained by the von
Bertalanffy growth curve. Mean weights were computed internally by
estimating the distribution of weight-at-age from the distribution of
length-at-age and applying the weight-length relationship o =p�q(a=2.92e-06, b=3.15, based on a study from FAL in the western central
pacific (Joung et al. 2008)).
Selectivity The longline bycatch fishery selectivity was assumed to be dome shaped
with the maximum selectivity occurring at 172cm. Selectivity for the target
longline fishery was assumed to be dome shaped with a maximum
selectivity value at 170cm. The selectivity of the purse seine associated
sets was estimated using a cubic spline parameterisation. Selectivity’s for
purse seine unassociated sets were assumed to be logistic with size at
inflection of 63.
Catchability Catchability is calculated independently for all fisheries and each CPUE
trend was directly and independently proportional to abundance via the
catchability term.
Natural mortality Natural mortality was assumed to be constant throughout age classes and
in time, with the natural mortality for the reference case set according to
0.18, calculated according to the relationship of Pauly (1980).
23
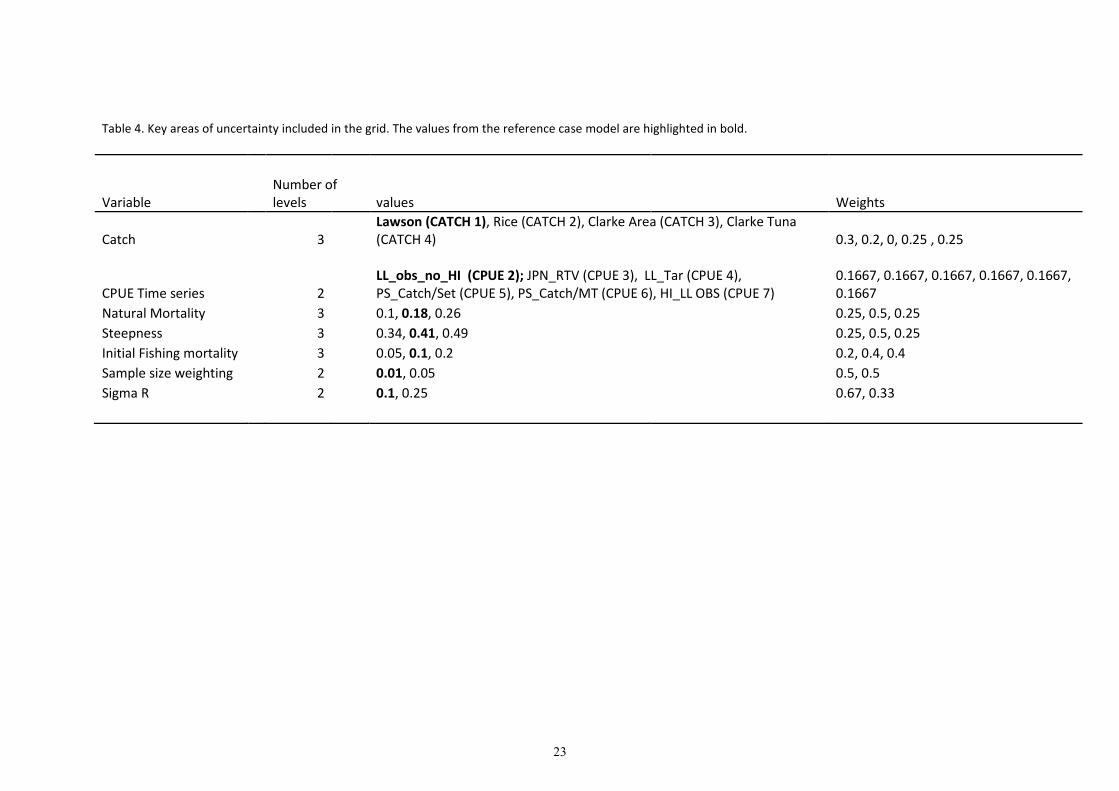
Table 4. Key areas of uncertainty included in the grid. The values from the reference case model are highlighted in bold.
Variable
Number of
levels values Weights
Catch 3
Lawson (CATCH 1), Rice (CATCH 2), Clarke Area (CATCH 3), Clarke Tuna
(CATCH 4) 0.3, 0.2, 0, 0.25 , 0.25
CPUE Time series 2
LL_obs_no_HI (CPUE 2); JPN_RTV (CPUE 3), LL_Tar (CPUE 4),
PS_Catch/Set (CPUE 5), PS_Catch/MT (CPUE 6), HI_LL OBS (CPUE 7)
0.1667, 0.1667, 0.1667, 0.1667, 0.1667,
0.1667
Natural Mortality 3 0.1, 0.18, 0.26 0.25, 0.5, 0.25
Steepness 3 0.34, 0.41, 0.49 0.25, 0.5, 0.25
Initial Fishing mortality 3 0.05, 0.1, 0.2 0.2, 0.4, 0.4
Sample size weighting 2 0.01, 0.05 0.5, 0.5
Sigma R 2 0.1, 0.25 0.67, 0.33

24
Table 5. Comparison of the objective function and likelihood components. The runs that are directly comparable are the Reference are Nat_M_1, Nat_M_3, Steep_1,
Steep_3, Init_F_1, Init F_3. Lower is better.

25
Table 6: Description of symbols used in the management quantity analysis
Manage
ment
Quantity Units Description
C_latest t Estimated catch in 2009
C_cur
t per
annum Average Current (2005- 2008) Catch
Y_MSY
t per
annum Theoretical equilibrium yield at FMSY, or maximum sustainable yield (MSY).
B_zero t Equilibrium total unexploited biomass
B_msy t Equilibrium total biomass at MSY
B_cur t Average Current (2005-2008) total biomass
SB_zero t Equilibrium unexploited adult biomass
SB_msy Equilibrium adult biomass at MSY
SB_cur Average Current (2005-2008) adult biomass
SB_1995 Estimated adult biomass in 1995
F_msy Average Current (2005-2008) fishing mortality.
F_cur Fishing mortality producing the maximum sustainable yield (MSY)

26
Table 7. Estimates of Managment quantities for th reference case and sensitivity runs. For details onf the managment quantities see Table 6.
Units Reference Catch_2 Catch_4 Catch_5 CPUE_3 CPUE_4 CPUE_5 CPUE_6 CPUE_7
C_latest t 6,090 12,264 9,567 25,513 6,523 7,227 6,556 6,264 6,669
C_cur t per annum 5,331 8,328 6,562 16,020 5,564 5,981 5,539 5,376 5,629
Y_MSY t per annum 1,994 3,134 2,389 5,401 2,665 6,092,720 2,751 2,096 3,328
B_zero t 149,368 229,893 175,221 395,969 201,352 467,638,000 207,899 157,469 252,219
B_msy t 57,660 88,556 67,494 152,523 77,785 180,878,468 80,314 60,804 97,459
B_cur t 44,988 70,520 58,407 140,462 82,887 364,973,250 87,142 51,144 118,832
SB_zero 2,257 3,473 2,647 5,982 3,042 7,065,070 3,141 2,379 3,811
SB_msy 871 1,338 1,020 2,304 1,175 2,732,710 1,213 919 1,472
SB_cur 613 966 817 1,978 1,154 5,318,520 1,207 692 1,671
B_cur/B_zero 0.301 0.307 0.333 0.355 0.412 0.78 0.419 0.325 0.471
B_cur/B_msy 0.78 0.796 0.865 0.921 1.066 2.018 1.085 0.841 1.219
SB_cur/SB_zero 0.272 0.278 0.309 0.331 0.379 0.753 0.384 0.291 0.438
SB_cur/SB_msy 0.704 0.722 0.801 0.858 0.982 1.946 0.995 0.753 1.135
SB_cur/SB_1995 0.667 0.682 0.757 0.811 0.931 1.847 0.943 0.713 1.076
B_msy/ B_zero 0.386 0.385 0.385 0.385 0.386 0.387 0.386 0.386 0.386
SB_msy/SB_zero 0.386 0.385 0.385 0.385 0.386 0.387 0.386 0.386 0.386
F_cur 0.374 0.369 0.353 0.359 0.198 0 0.183 0.323 0.139
F_msy 0.084 0.078 0.078 0.078 0.086 0.089 0.086 0.084 0.086
F_cur/F_msy 4.476 4.726 4.522 4.599 2.316 0.001 2.141 3.828 1.613
Units Nat_M_1 Nat_M_3 Steep_1 Steep_3 Init_F_1 Init_F_3 SampSz_2 SigmaR_2
C_latest t 7,619 5,261 6,315 5,859 6,140 5,999 6,100 5,983
C_cur t per annum 6,620 4,603 5,477 5,179 5,387 5,205 5,324 5,248
Y_MSY t per annum 2,276 1,826 1,662 2,265 1,762 2,537 1,989 2,060
B_zero t 325,676 97,063 169,891 132,028 132,110 189,649 149,021 153,894
B_msy t 128,486 36,742 70,886 46,477 51,002 73,197 57,527 59,392
B_cur t 96,458 32,041 52,086 39,068 47,281 41,523 44,713 44,999
SB_zero 5,630 1,116 2,567 1,995 1,996 2,865 2,251 2,325
SB_msy 2,221 422 1,071 702 771 1,106 869 897
SB_cur 1,614 302 741 507 647 564 607 623
B_cur/B_zero 0.296 0.33 0.307 0.296 0.358 0.219 0.3 0.292
B_cur/B_msy 0.751 0.872 0.735 0.841 0.927 0.567 0.777 0.758
SB_cur/SB_zero 0.287 0.27 0.289 0.254 0.324 0.197 0.27 0.268
SB_cur/SB_msy 0.727 0.714 0.692 0.722 0.839 0.51 0.698 0.694
SB_cur/SB_1995 0.756 0.629 0.708 0.624 0.543 1.015 0.662 0.657
B_msy/ B_zero 0.395 0.379 0.417 0.352 0.386 0.386 0.386 0.386
SB_msy/SB_zero 0.395 0.379 0.417 0.352 0.386 0.386 0.386 0.386
F_cur 0.44 0.287 0.446 0.347 0.354 0.337 0.336 0.386
F_msy 0.08 0.087 0.061 0.109 0.084 0.083 0.084 0.083
F_cur/F_msy 5.508 3.28 7.33 3.19 4.219 4.058 4.015 4.653

Table 8 Estimates of management quantities for the reference case and
27
nt quantities for the reference case and based on runs using the SPC no-Hawaii longline series and the JPN
Hawaii longline series and the JPN RTV CPUE series.

28
Table 9 Distribution of stock status outcomes (percentage of model runs in each quadrant of the Kobe plot) for models that included different CPUE and catch time series.
Kobe plot quadrant
CPUE RED ORANGE GREEN YELLOW
Non-target LL (no Hawaii) 87 13 0 0
Japanese research and training vessels 52 45 3 0
Target LL 0 0 100 0
Purse seine (catch per set) 58 35 7 0
Purse seine (catch per mt of tuna) 83 17 0 0
Hawaiian LL 36 36 28 0
Catches RED ORANGE GREEN YELLOW
Lawson 57 19 24 0
Rice 58 18 24 0
Clarke (area based) 50 28 22 0
Clarke (tuna catch based) 46 33 22 0

29
10 Figures
Figure 1. Distribution of the observed silky shark catches by fishing method (longline – left; purse seine –
right) during 1995-2009.
Figure 2. Important biological parameters assumed in the assessment; length at maturity (left panel) and
the growth curve (right panel) both taken from Joung et al. 1998.
0 50 100 150 200 250 300
01
23
45
6
Length (cm)
Spawning output
0 5 10 15 20 25 30
0100
200
300
Age
Fork length (cm)

30
Figure 3. Estimated oceanic white tip catches in all fisheries by estimation study (see Rice 2013 for details).

Figure 4. Annual estimated silky shark catch
(Based on Lawson 2011, black line Figure 3)
31
shark catch (in weight) in the WCPO by fleet (fishing
(Based on Lawson 2011, black line Figure 3) .
in the WCPO by fleet (fishing method), 1995-2009
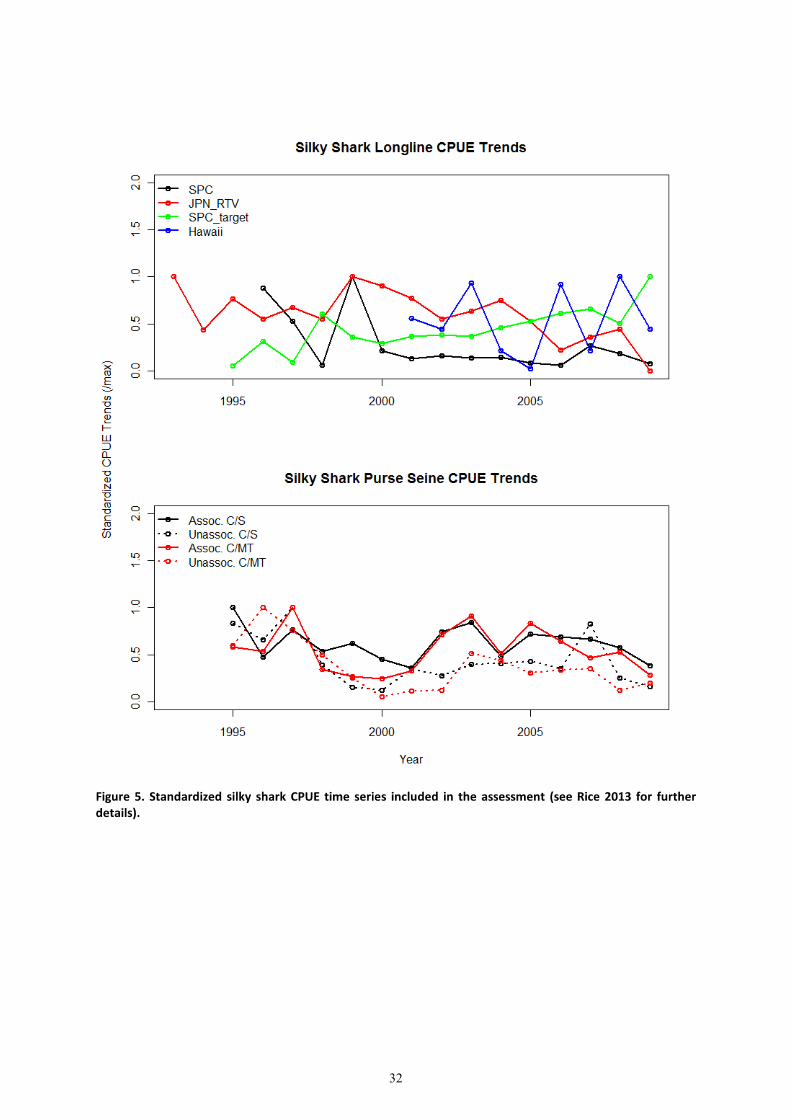
32
Figure 5. Standardized silky shark CPUE time series included in the assessment (see Rice 2013 for further
details).

33
Figure 6. Number of length measurements by fishery and year. The histogram bars are proportional to the
maximum number of fish measured in a fishery/year (the value presented in the upper right hand corner).

Figure 7. Number and location of silky
5-year block in 5x5 degree squares.
34
silky sharks measured in the longline fishery (both target and bycatch)
degree squares.
(both target and bycatch) by

35
Figure 8. Number and location of silky sharks measured in the purse seine fishery by 5year block in 5x5
degree squares.
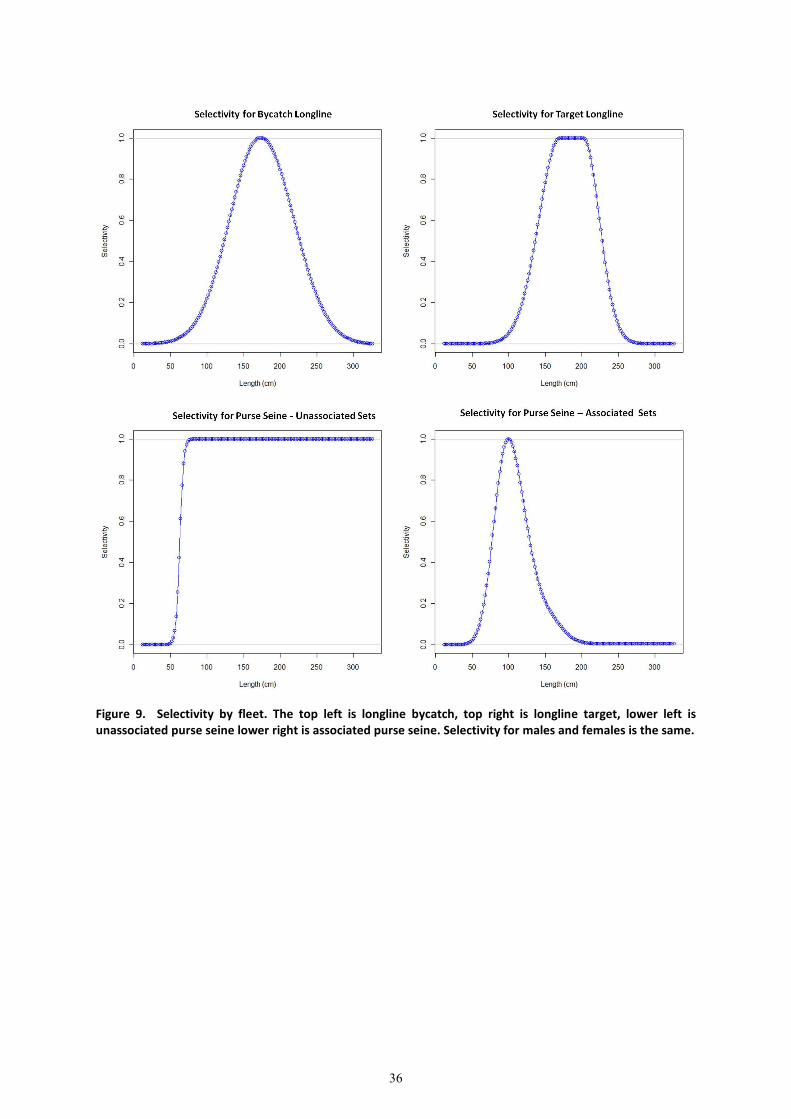
36
Figure 9. Selectivity by fleet. The top left is longline bycatch, top right is longline target, lower left is
unassociated purse seine lower right is associated purse seine. Selectivity for males and females is the same.

37
Figure 10. Fits to the observed CPUE series used in the assessment with blue lines giving the model
predictions and observations given by the empty circles with 95% confidence intervals. Each fit relates to the
model in which it was used: Index S_NO_HI_LL is the SPC bycatch CPUE series that excludes Hawaiian data
that was the reference case and CPUE2; S_JPNRTV (CPUE 3); S_TAR_LL (CPUE 4); S_AS0_CPS and
S_UNA_CPS (CPUE 5); S_ASO_CPMT and S_UNA_CPMT (CPUE 6); and S_HI_LL_WC (CPUE 7).
1996 2000 2004 2008
01
23
45
Index S_NO_HI_LL
Year
Index
1996 2000 2004 2008
0.0
0.5
1.0
1.5
2.0
Index S_JPNRTV
Year
Index
1996 2000 2004 2008
05
10
15
Index S_TAR_LL
Year
Index
1996 2000 2004 2008
01
23
45
Index S_AS0_CPS
Year
Index
1996 2000 2004 2008
01
23
45
6Index S_UNA_CPS
Year
Index
1996 2000 2004 2008
0.00
0.10
0.20
Index S_ASO_CPMT
Year
Index
1996 2000 2004 2008
0.000
0.006
0.012
Index S_UNA_CPMT
Year
Index
2002 2004 2006 2008
0.0
1.0
2.0
Index S_HI_LL_WC
Year
Index

Figure 11. Predicted catch at length (red line) and observed lengths (black line and grey shaded area) in the
longline fishery by fleet for the reference case
The top four panels are for the longline fisheries (males on the
two panels are for the purse seine fisheries i
38
at length (red line) and observed lengths (black line and grey shaded area) in the
for the reference case model. Samples and predictions are pooled across all years
The top four panels are for the longline fisheries (males on the left and females on the
two panels are for the purse seine fisheries in which the length composition was unsexed.
at length (red line) and observed lengths (black line and grey shaded area) in the
model. Samples and predictions are pooled across all years.
and females on the right), the bottom
n which the length composition was unsexed.

39
Figure 12. Spawning biomass per recruitment estimates and the assumed Beverton and Holt stock-
recruitment relationship (SRR) based on assuming steepness of 0.409.

40
Figure 13. Estimated total biomass (top left, 1000 metric tons), estimated spawning biomass (top right) and
estimated annual recruitment (1000’s of fish) in the WCPO for the reference case.

41
Figure 14. Changes in the spawning biomass relative to the first year of the model (1995 – top panel) and
SBmsy (bottom panel). Each line represents one of 2592 runs from the grid and the darker the line, the
higher the assigned weight (plausibility) for that model run.

Figure 15. Estimated fishing mortality by fleet for the reference case over the model period.
42
Estimated fishing mortality by fleet for the reference case over the model period.
Estimated fishing mortality by fleet for the reference case over the model period.

43
Figure 16. Sensitivity analysis effects on total biomass (top) and recruitment (bottom) of alternate variable
levels on the reference case. The figures on the left show the effects of the natural mortality, SigmaR (the
s.d. on the recruitment devs.), and the steepness. The figures on the right show the effects of changing the
catch inputs, initial depletion, sample size down weighting, and the CPUE inputs. Note that in the right hand
side panels the sensitivity CPUE_trend is not visible because it exceeds the limits of the y axis.

44
Figure 17. Kobe plots indicating annual stock status, relative to SBMSY (x-axis) and FMSY (y-axis). These
present the reference points for the reference model for the period 1995–2009 (top left panel) with the
white X for the current (avg. of 2005 – 2008), and for the statistical uncertainty for the current (average
2005-2008) conditions based on the MCMC analysis (top right panel) and based on the current (average of
2005-2008) estimates for all 2592 models in the grid (bottom panel). In the bottom plot the size of the circle
is proportional to the weight (plausibility) of the model run.

45
Figure 18. Box plots showing of the effects of the different values of the 7 grid parameters (catch, natural
mortality, initial depletion, sample size weighting, CPUE, SigmaR and steepness) on the management
parameter Spawning SBCURRENT/SBMSY.

46
Figure 19. Box plots showing of the effects of the different values of the 7 grid parameters (catch, natural
mortality, initial depletion, sample size weighting, CPUE, SigmaR and steepness) on the management
parameter SBCURRENT / SB0.
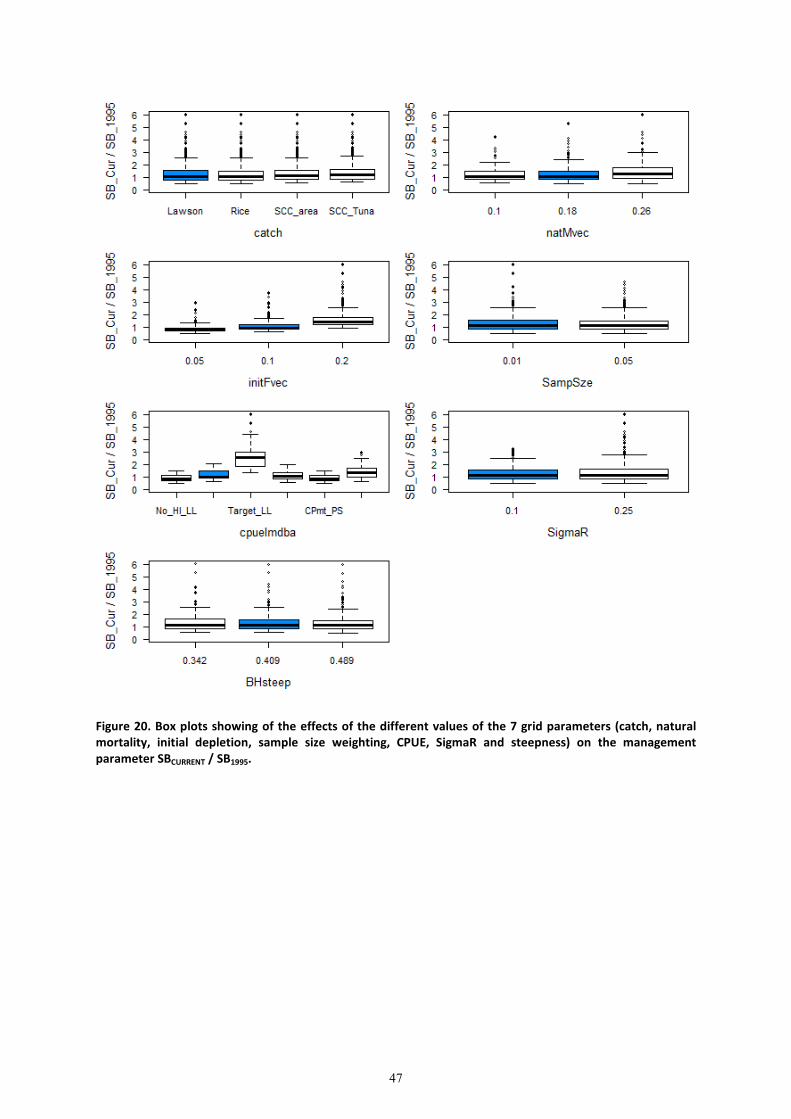
47
Figure 20. Box plots showing of the effects of the different values of the 7 grid parameters (catch, natural
mortality, initial depletion, sample size weighting, CPUE, SigmaR and steepness) on the management
parameter SBCURRENT / SB1995.
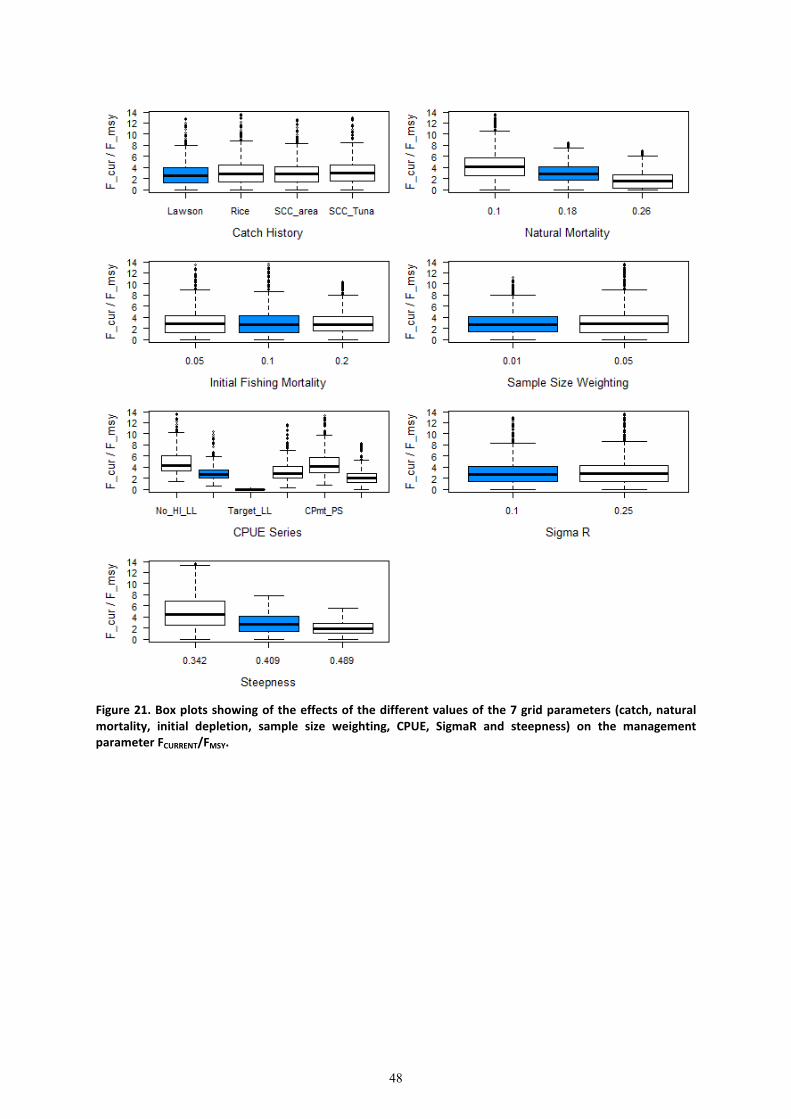
48
Figure 21. Box plots showing of the effects of the different values of the 7 grid parameters (catch, natural
mortality, initial depletion, sample size weighting, CPUE, SigmaR and steepness) on the management
parameter FCURRENT/FMSY.

49
11 Appendix 1: Control File for SS3 model _SS-V3.21d-win64-safe;_05/22/2011;_Stock_Synthesis_by_Richard_Methot_(NOAA)_using_ADMB
1 #_N_Growth_Patterns
1 #_N_Morphs_Within_GrowthPattern
#_Cond 1 #_Morph_between/within_stdev_ratio (no read if N_morphs=1)
#_Cond 1 #vector_Morphdist_(-1_in_first_val_gives_normal_approx)
#
#_Cond 0 # N recruitment designs goes here if N_GP*nseas*area>1
#_Cond 0 # placeholder for recruitment interaction request
#_Cond 1 1 1 # example recruitment design element for GP=1, seas=1, area=1
#
#_Cond 0 # N_movement_definitions goes here if N_areas > 1
#_Cond 1.0 # first age that moves (real age at begin of season, not integer) also cond on do_migration>0
#_Cond 1 1 1 2 4 10 # example move definition for seas=1, morph=1, source=1 dest=2, age1=4, age2=10
#
0 #_Nblock_Patterns
#_Cond 0 #_blocks_per_pattern
# begin and end years of blocks
#
0.5 #_fracfemale
0 #_natM_type:_0=1Parm; 1=N_breakpoints;_2=Lorenzen;_3=agespecific;_4=agespec_withseasinterpolate
#_no additional input for selected M option; read 1P per morph
2 # GrowthModel: 1=vonBert with L1&L2; 2=Richards with L1&L2; 3=not implemented; 4=not implemented
1 #_Growth_Age_for_L1
12 #_Growth_Age_for_L2 (999 to use as Linf)
0 #_SD_add_to_LAA (set to 0.1 for SS2 V1.x compatibility)
1 #_CV_Growth_Pattern: 0 CV=f(LAA); 1 CV=F(A); 2 SD=F(LAA); 3 SD=F(A); 4 logSD=F(A)
1 #_maturity_option: 1=length logistic; 2=age logistic; 3=read age-maturity matrix by growth_pattern; 4=read age-
fecundity; 5=read fec and wt from wtatage.ss
#_placeholder for empirical age-maturity by growth pattern
0 #_First_Mature_Age
2 #_fecundity option:(1)eggs=Wt*(a+b*Wt);(2)eggs=a*L^b;(3)eggs=a*Wt^b; (4)eggs=a+b*L; (5)eggs=a+b*W
0 #_hermaphroditism option: 0=none; 1=age-specific fxn
3 #_parameter_offset_approach (1=none, 2= M, G, CV_G as offset from female-GP1, 3=like SS2 V1.x)
1 #_env/block/dev_adjust_method (1=standard; 2=logistic transform keeps in base parm bounds; 3=standard w/ no bound
check)
#
#_growth_parms
#_LO HI INIT PRIOR PR_type SD PHASE env-var use_dev dev_minyr dev_maxyr dev_stddev Block Block_Fxn
-3 3 0.18 0.2 0 0.8 -3 0 0 0 0 0 0 0 # NatM_p_1_Fem_GP_1
70 100 90.9988 90.9988 0 10 -4 0 0 0 0 0.5 0 0 # L_at_Amin_Fem_GP_1
40 350 233.882 233.882 0 10 -2 0 0 0 0 0.5 0 0 # L_at_Amax_Fem_GP_1
0.05 0.15 0.0838 0.0838 0 0.8 -4 0 0 0 0 0.5 0 0 # VonBert_K_Fem_GP_1
-10 10 1 1 0 0.8 -4 0 0 0 0 0.5 0 0 # Richards_Fem_GP_1
0.01 1 0.085 0.0834877 0 0.8 -3 0 0 0 0 0.5 0 0 # CV_young_Fem_GP_1
-3 3 0 0 0 0.8 -3 0 0 0 0 0.5 0 0 # CV_old_Fem_GP_1
-3 3 0 0 0 0.8 -3 0 0 0 0 0.5 0 0 # NatM_p_1_Mal_GP_1
-3 3 0 0 0 0.8 -3 0 0 0 0 0.5 0 0 # L_at_Amin_Mal_GP_1
-3 3 0 0 0 0.8 -2 0 0 0 0 0.5 0 0 # L_at_Amax_Mal_GP_1
-3 3 0 0 0 0.8 -3 0 0 0 0 0.5 0 0 # VonBert_K_Mal_GP_1
-3 3 0 0 0 0.8 -3 0 0 0 0 0.5 0 0 # Richards_Mal_GP_1
-3 3 0 0 0 0.8 -3 0 0 0 0 0.5 0 0 # CV_young_Mal_GP_1
-3 3 0 0 0 0.8 -3 0 0 0 0 0.5 0 0 # CV_old_Mal_GP_1
-3 3 2.92e-006 2.92e-006 0 0.8 -3 0 0 0 0 0.5 0 0 # Wtlen_1_Fem
-3 3.5 3.15 3.15 0 0.8 -3 0 0 0 0 0.5 0 0 # Wtlen_2_Fem
-3 300 215 55 0 0.8 -3 0 0 0 0 0.5 0 0 # Mat50%_Fem
-3 3 -0.138 -0.138 0 0.8 -3 0 0 0 0 0.5 0 0 # Mat_slope_Fem
-3 9 6 1 0 0.8 -3 0 0 0 0 0.5 0 0 # Eggs_scalar_Fem
-3 3 0 0 0 0.8 -3 0 0 0 0 0.5 0 0 # Eggs_exp_len_Fem
-3 3 2.92e-006 2.92e-006 0 0.8 -3 0 0 0 0 0.5 0 0 # Wtlen_1_Mal
-3 4 3.15 3.15 0 0.8 -3 0 0 0 0 0.5 0 0 # Wtlen_2_Mal

50
-4 4 0 0 -1 99 -3 0 0 0 0 0.5 0 0 # RecrDist_GP_1
-4 4 0 0 -1 99 -3 0 0 0 0 0.5 0 0 # RecrDist_Area_1
-4 4 4 0 -1 99 -3 0 0 0 0 0.5 0 0 # RecrDist_Seas_1
1 1 1 1 -1 99 -3 0 0 0 0 0.5 0 0 # CohortGrowDev
#
#_Cond 0 #custom_MG-env_setup (0/1)
#_Cond -2 2 0 0 -1 99 -2 #_placeholder when no MG-environ parameters
#
#_Cond 0 #custom_MG-block_setup (0/1)
#_Cond -2 2 0 0 -1 99 -2 #_placeholder when no MG-block parameters
#_Cond No MG parm trends
#
#_seasonal_effects_on_biology_parms
0 0 0 0 0 0 0 0 0 0 #_femwtlen1,femwtlen2,mat1,mat2,fec1,fec2,Malewtlen1,malewtlen2,L1,K
#_Cond -2 2 0 0 -1 99 -2 #_placeholder when no seasonal MG parameters
#
#_Cond -4 #_MGparm_Dev_Phase
#
#_Spawner-Recruitment
3 #_SR_function: 2=Ricker; 3=std_B-H; 4=SCAA; 5=Hockey; 6=B-H_flattop; 7=survival_3Parm
#_LO HI INIT PRIOR PR_type SD PHASE
3 15 6.65596 12.3 0 10 1 # SR_LN(R0)
0.2 0.7 0.409 0.5 2 0.05 -3 # SR_BH_steep
0 2 0.1 0.6 0 0.8 -3 # SR_sigmaR
-5 5 0 0 0 1 -3 # SR_envlink
-5 5 0 0 0 1 -1 # SR_R1_offset
0 0 0 0 -1 99 -99 # SR_autocorr
0 #_SR_env_link
1 #_SR_env_target_0=none;1=devs;_2=R0;_3=steepness
2 #do_recdev: 0=none; 1=devvector; 2=simple deviations
1995 # first year of main recr_devs; early devs can preceed this era
2009 # last year of main recr_devs; forecast devs start in following year
2 #_recdev phase
1 # (0/1) to read 13 advanced options
-5 #_recdev_early_start (0=none; neg value makes relative to recdev_start)
-2 #_recdev_early_phase
0 #_forecast_recruitment phase (incl. late recr) (0 value resets to maxphase+1)
1 #_lambda for Fcast_recr_like occurring before endyr+1
-2 #_last_early_yr_nobias_adj_in_MPD
-1 #_first_yr_fullbias_adj_in_MPD
2006 #_last_yr_fullbias_adj_in_MPD
2007 #_first_recent_yr_nobias_adj_in_MPD
0.85 #_max_bias_adj_in_MPD (-1 to override ramp and set biasadj=1.0 for all estimated recdevs)
0 #_period of cycles in recruitment (N parms read below)
-15 #min rec_dev
15 #max rec_dev
0 #_read_recdevs
#_end of advanced SR options
#
#_placeholder for full parameter lines for recruitment cycles
# read specified recr devs
#_Yr Input_value
#
# all recruitment deviations
#DisplayOnly 0 # Early_InitAge_5
#DisplayOnly 0 # Early_InitAge_4
#DisplayOnly 0 # Early_InitAge_3
#DisplayOnly 0 # Early_InitAge_2
#DisplayOnly 0 # Early_InitAge_1
#DisplayOnly 0.00422917 # Main_RecrDev_1995
#DisplayOnly -0.000264621 # Main_RecrDev_1996
#DisplayOnly -0.00637532 # Main_RecrDev_1997
#DisplayOnly -0.00903816 # Main_RecrDev_1998

51
#DisplayOnly -0.0221679 # Main_RecrDev_1999
#DisplayOnly -0.0221076 # Main_RecrDev_2000
#DisplayOnly -0.0160356 # Main_RecrDev_2001
#DisplayOnly -0.0109021 # Main_RecrDev_2002
#DisplayOnly -0.000156095 # Main_RecrDev_2003
#DisplayOnly 0.00494055 # Main_RecrDev_2004
#DisplayOnly 0.0146801 # Main_RecrDev_2005
#DisplayOnly 0.01276 # Main_RecrDev_2006
#DisplayOnly 0.00185953 # Main_RecrDev_2007
#DisplayOnly 0.00124062 # Main_RecrDev_2008
#DisplayOnly 0.00044676 # Main_RecrDev_2009
#DisplayOnly 0 # ForeRecr_2010
#DisplayOnly 0 # Impl_err_2010
#
#Fishing Mortality info
0.2 # F ballpark for tuning early phases
1996 # F ballpark year (neg value to disable)
3 # F_Method: 1=Pope; 2=instan. F; 3=hybrid (hybrid is recommended)
3 # max F or harvest rate, depends on F_Method
# no additional F input needed for Fmethod 1
# if Fmethod=2; read overall start F value; overall phase; N detailed inputs to read
# if Fmethod=3; read N iterations for tuning for Fmethod 3
3 # N iterations for tuning F in hybrid method (recommend 3 to 7)
#
#_initial_F_parms
#_LO HI INIT PRIOR PR_type SD PHASE
0 1 0.1 0.1 0 99 -1 # InitF_1F_NonTarLL
0 1 0 0.01 0 99 -1 # InitF_2F_YesTarLL
0.05 1 0.05 0.1 0 99 -1 # InitF_3F_AssoPS
0 1 0 0.01 0 99 -1 # InitF_4F_UnAssoPS
#
#_Q_setup
# Q_type options: <0=mirror, 0=median_float, 1=mean_float, 2=parameter, 3=parm_w_random_dev,
4=parm_w_randwalk, 5=mean_unbiased_float_assign_to_parm
#_Den-dep env-var extra_se Q_type
0 0 0 0 # 1 F_NonTarLL
0 0 0 0 # 2 F_YesTarLL
0 0 0 0 # 3 F_AssoPS
0 0 0 0 # 4 F_UnAssoPS
0 0 0 0 # 5 S_HI_LL
0 0 0 0 # 6 S_NO_HI_LL
0 0 0 0 # 7 S_JPNRTV
0 0 0 0 # 8 S_TAR_LL
0 0 0 0 # 9 S_AS0_CPS
0 0 0 0 # 10 S_UNA_CPS
0 0 0 0 # 11 S_ASO_CPMT
0 0 0 0 # 12 S_UNA_CPMT
0 0 0 0 # 13 S_HI_LL_WC
#
#_Cond 0 #_If q has random component, then 0=read one parm for each fleet with random q; 1=read a parm for each year
of index
#_Q_parms(if_any)
#
#_size_selex_types
#_Pattern Discard Male Special
24 0 0 0 # 1 F_NonTarLL
24 0 0 0 # 2 F_YesTarLL
27 0 0 4 # 3 F_AssoPS
1 0 0 0 # 4 F_UnAssoPS
5 0 0 1 # 5 S_HI_LL
5 0 0 1 # 6 S_NO_HI_LL
5 0 0 1 # 7 S_JPNRTV
5 0 0 2 # 8 S_TAR_LL

52
5 0 0 3 # 9 S_AS0_CPS
5 0 0 4 # 10 S_UNA_CPS
5 0 0 3 # 11 S_ASO_CPMT
5 0 0 4 # 12 S_UNA_CPMT
5 0 0 1 # 13 S_HI_LL_WC
#
#_age_selex_types
#_Pattern ___ Male Special
11 0 0 0 # 1 F_NonTarLL
11 0 0 0 # 2 F_YesTarLL
11 0 0 0 # 3 F_AssoPS
11 0 0 0 # 4 F_UnAssoPS
11 0 0 0 # 5 S_HI_LL
11 0 0 0 # 6 S_NO_HI_LL
11 0 0 0 # 7 S_JPNRTV
11 0 0 0 # 8 S_TAR_LL
11 0 0 0 # 9 S_AS0_CPS
11 0 0 0 # 10 S_UNA_CPS
11 0 0 0 # 11 S_ASO_CPMT
11 0 0 0 # 12 S_UNA_CPMT
11 0 0 0 # 13 S_HI_LL_WC
#_LO HI INIT PRIOR PR_type SD PHASE env-var use_dev dev_minyr dev_maxyr dev_stddev Block Block_Fxn
14 300 172.246 50 -1 0 -2 0 0 0 0 0.5 0 0 # SizeSel_1P_1_F_NonTarLL
-15 15 -9.18625 0 -1 0 -3 0 0 0 0 0.5 0 0 # SizeSel_1P_2_F_NonTarLL
-15 15 8.14063 0 -1 0 -3 0 0 0 0 0.5 0 0 # SizeSel_1P_3_F_NonTarLL
-15 15 8.29226 0 -1 0 -3 0 0 0 0 0.5 0 0 # SizeSel_1P_4_F_NonTarLL
-15 15 -15 0 -1 0 -2 0 0 0 0 0.5 0 0 # SizeSel_1P_5_F_NonTarLL
-15 15 -15 0 -1 5 -2 0 0 0 0 0.5 0 0 # SizeSel_1P_6_F_NonTarLL
14 300 170.027 50 -1 0 -2 0 0 0 0 0.5 0 0 # SizeSel_2P_1_F_YesTarLL
-15 15 -1.38388 0 -1 0 -3 0 0 0 0 0.5 0 0 # SizeSel_2P_2_F_YesTarLL
-15 15 7.40335 0 -1 0 -3 0 0 0 0 0.5 0 0 # SizeSel_2P_3_F_YesTarLL
-15 15 6.86228 0 -1 0 -3 0 0 0 0 0.5 0 0 # SizeSel_2P_4_F_YesTarLL
-15 15 -15 0 -1 0 -2 0 0 0 0 0.5 0 0 # SizeSel_2P_5_F_YesTarLL
-15 15 -15 0 -1 5 -2 0 0 0 0 0.5 0 0 # SizeSel_2P_6_F_YesTarLL
-15 15 0 0 -1 0 -3 0 0 0 0 0.5 0 0 # SizeSpline_Code_F_AssoPS_3
-15 15 0.0001 0 -1 0 -3 0 0 0 0 0.5 0 0 # SizeSpline_GradLo_F_AssoPS_3
-15 15 -0.0001 0 -1 0 -3 0 0 0 0 0.5 0 0 # SizeSpline_GradHi_F_AssoPS_3
40 240 100 200 1 0 -4 0 0 0 0 0.5 0 0 # SizeSpline_Knot_1_F_AssoPS_3
40 240 150 200 1 0 -4 0 0 0 0 0.5 0 0 # SizeSpline_Knot_2_F_AssoPS_3
40 240 175 200 1 0 -4 0 0 0 0 0.5 0 0 # SizeSpline_Knot_3_F_AssoPS_3
40 240 225 200 1 0 -4 0 0 0 0 0.5 0 0 # SizeSpline_Knot_4_F_AssoPS_3
-15 15 8.37772 0 -1 0 -3 0 0 0 0 0.5 0 0 # SizeSpline_Val_1_F_AssoPS_3
-15 15 6.82497 0 -1 0 -3 0 0 0 0 0.5 0 0 # SizeSpline_Val_2_F_AssoPS_3
-15 15 5.77554 0 -1 0 -3 0 0 0 0 0.5 0 0 # SizeSpline_Val_3_F_AssoPS_3
0 15 3.04248 0 -1 0 -3 0 0 0 0 0.5 0 0 # SizeSpline_Val_4_F_AssoPS_3
1 200 62.7967 50 0 99 -2 0 0 0 0 0.5 0 0 # SizeSel_4P_1_F_UnAssoPS
-200 200 7.67376 50 0 99 -3 0 0 0 0 0.5 0 0 # SizeSel_4P_2_F_UnAssoPS
1 200 -1 50 0 99 -2 0 0 0 0 0.5 0 0 # SizeSel_5P_1_S_HI_LL
1 239 -1 50 0 99 -3 0 0 0 0 0.5 0 0 # SizeSel_5P_2_S_HI_LL
1 200 -1 50 0 99 -2 0 0 0 0 0.5 0 0 # SizeSel_6P_1_S_NO_HI_LL
1 239 -1 50 0 99 -3 0 0 0 0 0.5 0 0 # SizeSel_6P_2_S_NO_HI_LL
1 200 -1 50 0 99 -2 0 0 0 0 0.5 0 0 # SizeSel_7P_1_S_JPNRTV
1 239 -1 50 0 99 -3 0 0 0 0 0.5 0 0 # SizeSel_7P_2_S_JPNRTV
1 200 -1 50 0 99 -2 0 0 0 0 0.5 0 0 # SizeSel_8P_1_S_TAR_LL
1 239 -1 50 0 99 -3 0 0 0 0 0.5 0 0 # SizeSel_8P_2_S_TAR_LL
1 200 -1 50 0 99 -2 0 0 0 0 0.5 0 0 # SizeSel_9P_1_S_AS0_CPS
1 239 -1 50 0 99 -3 0 0 0 0 0.5 0 0 # SizeSel_9P_2_S_AS0_CPS
1 200 -1 50 0 99 -2 0 0 0 0 0.5 0 0 # SizeSel_10P_1_S_UNA_CPS
1 239 -1 50 0 99 -3 0 0 0 0 0.5 0 0 # SizeSel_10P_2_S_UNA_CPS
1 200 -1 50 0 99 -2 0 0 0 0 0.5 0 0 # SizeSel_11P_1_S_ASO_CPMT
1 239 -1 50 0 99 -3 0 0 0 0 0.5 0 0 # SizeSel_11P_2_S_ASO_CPMT
1 200 -1 50 0 99 -2 0 0 0 0 0.5 0 0 # SizeSel_12P_1_S_UNA_CPMT
1 239 -1 50 0 99 -3 0 0 0 0 0.5 0 0 # SizeSel_12P_2_S_UNA_CPMT

53
1 200 -1 50 0 99 -2 0 0 0 0 0.5 0 0 # SizeSel_13P_1_S_HI_LL_WC
1 239 -1 50 0 99 -3 0 0 0 0 0.5 0 0 # SizeSel_13P_2_S_HI_LL_WC
1 40 0 1 0 99 -1 0 0 0 0 0.5 0 0 # AgeSel_1P_1_F_NonTarLL
1 40 36 3 0 99 -1 0 0 0 0 0.5 0 0 # AgeSel_1P_2_F_NonTarLL
1 40 0 1 0 99 -1 0 0 0 0 0.5 0 0 # AgeSel_2P_1_F_YesTarLL
1 40 36 3 0 99 -1 0 0 0 0 0.5 0 0 # AgeSel_2P_2_F_YesTarLL
1 40 0 1 0 99 -1 0 0 0 0 0.5 0 0 # AgeSel_3P_1_F_AssoPS
1 40 36 3 0 99 -1 0 0 0 0 0.5 0 0 # AgeSel_3P_2_F_AssoPS
1 40 0 1 0 99 -1 0 0 0 0 0.5 0 0 # AgeSel_4P_1_F_UnAssoPS
1 40 36 3 0 99 -1 0 0 0 0 0.5 0 0 # AgeSel_4P_2_F_UnAssoPS
1 40 0 1 0 99 -1 0 0 0 0 0.5 0 0 # AgeSel_5P_1_S_HI_LL
1 40 36 3 0 99 -1 0 0 0 0 0.5 0 0 # AgeSel_5P_2_S_HI_LL
1 40 0 1 0 99 -1 0 0 0 0 0.5 0 0 # AgeSel_6P_1_S_NO_HI_LL
1 40 36 3 0 99 -1 0 0 0 0 0.5 0 0 # AgeSel_6P_2_S_NO_HI_LL
1 40 0 1 0 99 -1 0 0 0 0 0.5 0 0 # AgeSel_7P_1_S_JPNRTV
1 40 36 3 0 99 -1 0 0 0 0 0.5 0 0 # AgeSel_7P_2_S_JPNRTV
1 40 0 1 0 99 -1 0 0 0 0 0.5 0 0 # AgeSel_8P_1_S_TAR_LL
1 40 36 3 0 99 -1 0 0 0 0 0.5 0 0 # AgeSel_8P_2_S_TAR_LL
1 40 0 1 0 99 -1 0 0 0 0 0.5 0 0 # AgeSel_9P_1_S_AS0_CPS
1 40 36 3 0 99 -1 0 0 0 0 0.5 0 0 # AgeSel_9P_2_S_AS0_CPS
1 40 0 1 0 99 -1 0 0 0 0 0.5 0 0 # AgeSel_10P_1_S_UNA_CPS
1 40 36 3 0 99 -1 0 0 0 0 0.5 0 0 # AgeSel_10P_2_S_UNA_CPS
1 40 0 1 0 99 -1 0 0 0 0 0.5 0 0 # AgeSel_11P_1_S_ASO_CPMT
1 40 36 3 0 99 -1 0 0 0 0 0.5 0 0 # AgeSel_11P_2_S_ASO_CPMT
1 40 0 1 0 99 -1 0 0 0 0 0.5 0 0 # AgeSel_12P_1_S_UNA_CPMT
1 40 36 3 0 99 -1 0 0 0 0 0.5 0 0 # AgeSel_12P_2_S_UNA_CPMT
1 40 0 1 0 99 -1 0 0 0 0 0.5 0 0 # AgeSel_13P_1_S_HI_LL_WC
1 40 36 3 0 99 -1 0 0 0 0 0.5 0 0 # AgeSel_13P_2_S_HI_LL_WC
#_Cond 0 #_custom_sel-env_setup (0/1)
#_Cond -2 2 0 0 -1 99 -2 #_placeholder when no enviro fxns
#_Cond 0 #_custom_sel-blk_setup (0/1)
#_Cond -2 2 0 0 -1 99 -2 #_placeholder when no block usage
#_Cond No selex parm trends
#_Cond -4 # placeholder for selparm_Dev_Phase
#_Cond 0 #_env/block/dev_adjust_method (1=standard; 2=logistic trans to keep in base parm bounds; 3=standard w/ no
bound check)
#
# Tag loss and Tag reporting parameters go next
0 # TG_custom: 0=no read; 1=read if tags exist
#_Cond -6 6 1 1 2 0.01 -4 0 0 0 0 0 0 0 #_placeholder if no parameters
#
1 #_Variance_adjustments_to_input_values
#_fleet: 1 2 3 4 5 6 7 8 9 10 11 12 13
0 0 0 0 0 0 0 0 0 0 0 0 0 #_add_to_survey_CV
0 0 0 0 0 0 0 0 0 0 0 0 0 #_add_to_discard_stddev
0 0 0 0 0 0 0 0 0 0 0 0 0 #_add_to_bodywt_CV
0.01 0.01 0.01 0.01 0.01 0.01 0.01 0.01 0.01 0.01 0.01 0.01 0.01 #_mult_by_lencomp_N
1 1 1 1 1 1 1 1 1 1 1 1 1 #_mult_by_agecomp_N
1 1 1 1 1 1 1 1 1 1 1 1 1 #_mult_by_size-at-age_N
#
1 #_maxlambdaphase
1 #_sd_offset
#
39 # number of changes to make to default Lambdas (default value is 1.0)
# Like_comp codes: 1=surv; 2=disc; 3=mnwt; 4=length; 5=age; 6=SizeFreq; 7=sizeage; 8=catch;
# 9=init_equ_catch; 10=recrdev; 11=parm_prior; 12=parm_dev; 13=CrashPen; 14=Morphcomp; 15=Tag-comp; 16=Tag-
negbin
#like_comp fleet/survey phase value sizefreq_method
1 1 1 0 1
1 2 1 0 1
1 3 1 0 1
1 4 1 0 1
1 5 1 0 1

54
1 6 1 1 1
1 7 1 0 1
1 8 1 0 1
1 9 1 0 1
1 10 1 0 1
1 11 1 0 1
1 12 1 0 1
1 13 1 0 1
4 1 1 1 1
4 2 1 1 1
4 3 1 1 1
4 4 1 1 1
4 5 1 0 1
4 6 1 0 1
4 7 1 0 1
4 8 1 0 1
4 9 1 0 1
4 10 1 0 1
4 11 1 0 1
4 12 1 0 1
4 13 1 0 1
9 1 1 0 1
9 2 1 0 1
9 3 1 0 1
9 4 1 0 1
9 5 1 0 1
9 6 1 0 1
9 7 1 0 1
9 8 1 0 1
9 9 1 0 1
9 10 1 0 1
9 11 1 0 1
9 12 1 0 1
9 13 1 0 1
#
# lambdas (for info only; columns are phases)
# 0 #_CPUE/survey:_1
# 0 #_CPUE/survey:_2
# 0 #_CPUE/survey:_3
# 0 #_CPUE/survey:_4
# 0 #_CPUE/survey:_5
# 1 #_CPUE/survey:_6
# 0 #_CPUE/survey:_7
# 0 #_CPUE/survey:_8
# 0 #_CPUE/survey:_9
# 0 #_CPUE/survey:_10
# 0 #_CPUE/survey:_11
# 0 #_CPUE/survey:_12
# 0 #_CPUE/survey:_13
# 1 #_lencomp:_1
# 1 #_lencomp:_2
# 1 #_lencomp:_3
# 1 #_lencomp:_4
# 0 #_lencomp:_5
# 0 #_lencomp:_6
# 0 #_lencomp:_7
# 0 #_lencomp:_8
# 0 #_lencomp:_9
# 0 #_lencomp:_10
# 0 #_lencomp:_11
# 0 #_lencomp:_12
# 0 #_lencomp:_13
# 0 #_init_equ_catch

55
# 1 #_recruitments
# 1 #_parameter-priors
# 1 #_parameter-dev-vectors
# 1 #_crashPenLambda
0 # (0/1) read specs for more stddev reporting
# 0 1 -1 5 1 5 1 -1 5 # placeholder for selex type, len/age, year, N selex bins, Growth pattern, N growth ages, NatAge_area(-
1 for all), NatAge_yr, N Natages
# placeholder for vector of selex bins to be reported
# placeholder for vector of growth ages to be reported
# placeholder for vector of NatAges ages to be reported
999
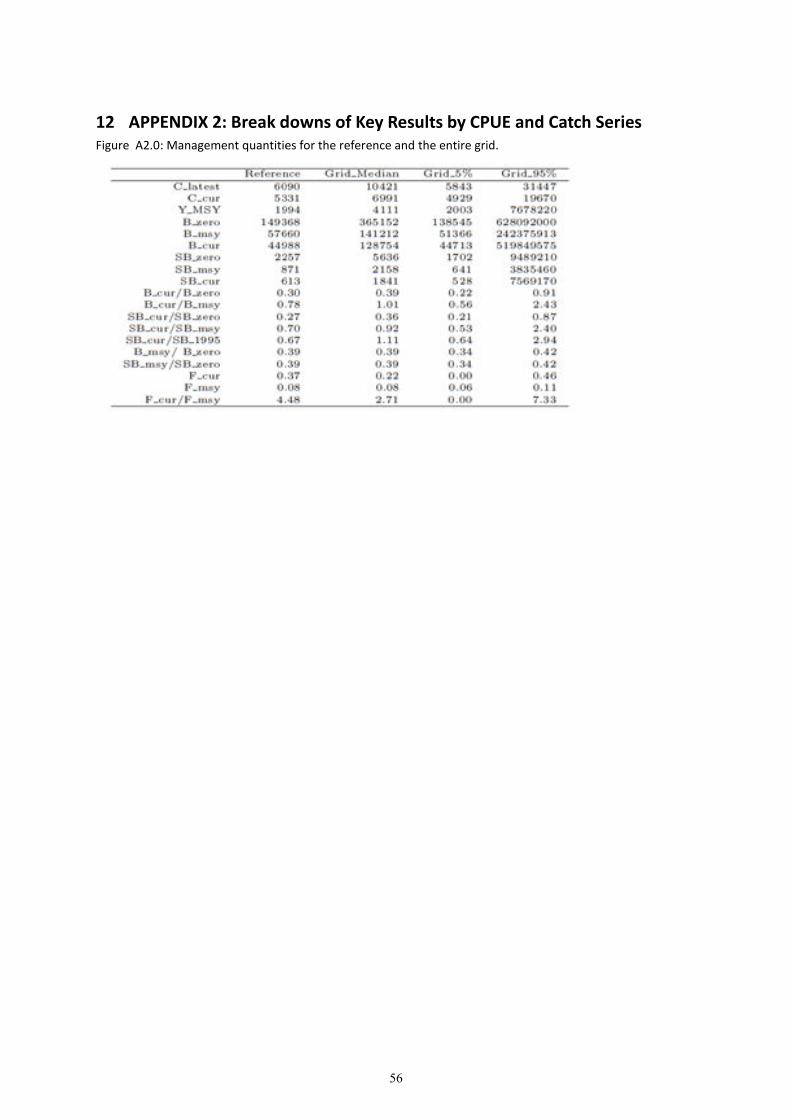
12 APPENDIX 2: Break downs of Key Results by CPUE and Catch Series
Figure A2.0: Management quantities for the reference and the entire grid.
56
APPENDIX 2: Break downs of Key Results by CPUE and Catch Series
Figure A2.0: Management quantities for the reference and the entire grid.
APPENDIX 2: Break downs of Key Results by CPUE and Catch Series

Key Results by the SPC _LL and JP_RTV series.
Table A2.1 Management quantities for the reference and grid based only on the SPC LL and JP_RTV CPUEs.
Figure A2.1: Kobe plot from the grid based only on the SPC LL and JP_RTV CPUEs.
57
SPC _LL and JP_RTV series.
Table A2.1 Management quantities for the reference and grid based only on the SPC LL and JP_RTV CPUEs.
Figure A2.1: Kobe plot from the grid based only on the SPC LL and JP_RTV CPUEs.
Table A2.1 Management quantities for the reference and grid based only on the SPC LL and JP_RTV CPUEs.

58
Key Results by the SPC _LL CPUE series.
Table A2.2 Management quantities for the reference and grid based only on the SPC LL CPUE.
Figure A2.2: Kobe plot from the grid based only on the SPC LL CPUE.

59
Key Results by the JP_RTV CPUE series.
Table A2.3 Management quantities for the reference and grid based only on the JP_RTV CPUE.
Figure A2.3: Kobe plot from the grid based only on the JPRTV.

60
Key Results by the Target LL CPUE series.
Table A2.4 Management quantities for the reference and grid based only on the Target LL CPUE.
Figure A2.4: Kobe plot from the grid based only on the model runs using the target LL cpue series.

61
Key Results by the Purse Seine Catch per set series.
Table A2.5 Management quantities for the reference and grid based only on the purse seine catch per set
CPUE.
Figure A2.5: Kobe plot from the grid based only on the model runs using the purse seine catch per set cpue
series.

62
Key Results by the Purse Seine Catch per metric ton series.
Table A2.6 Management quantities for the reference and grid based only on the purse seine catch per metric
ton CPUE.
Figure A2.6: Kobe plot from the grid based only on the model runs using the purse seine catch per metric ton
cpue series.
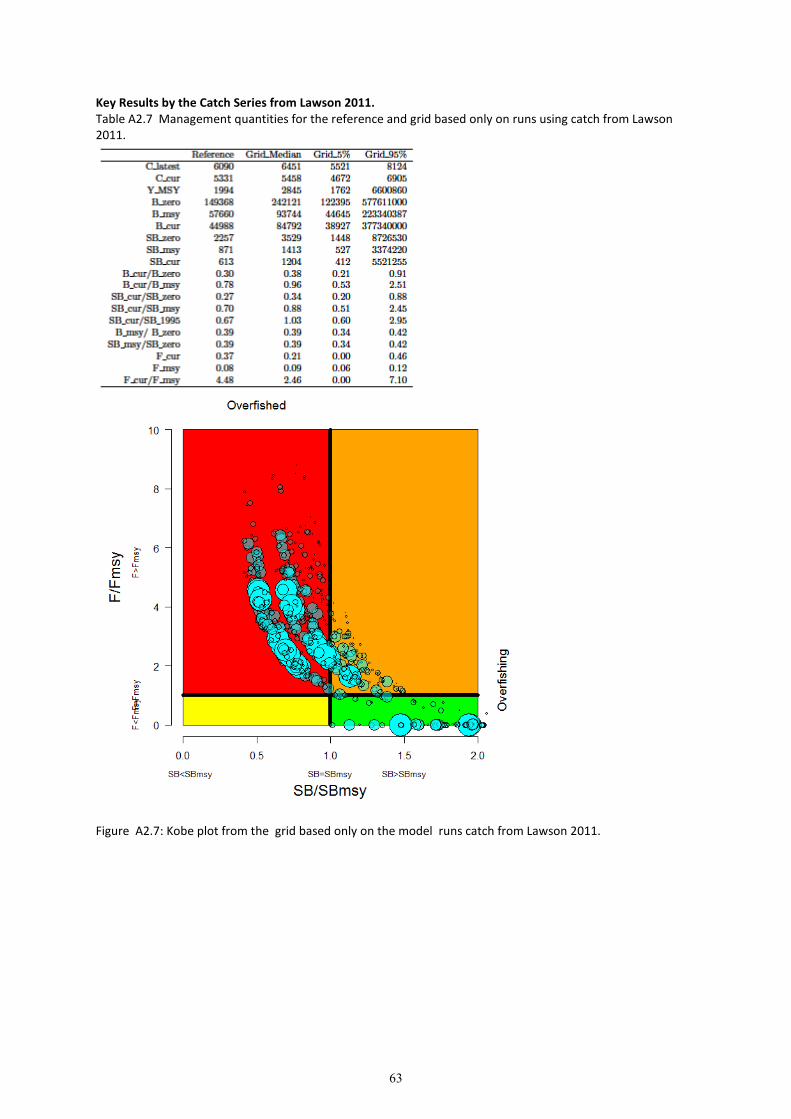
63
Key Results by the Catch Series from Lawson 2011.
Table A2.7 Management quantities for the reference and grid based only on runs using catch from Lawson
2011.
Figure A2.7: Kobe plot from the grid based only on the model runs catch from Lawson 2011.
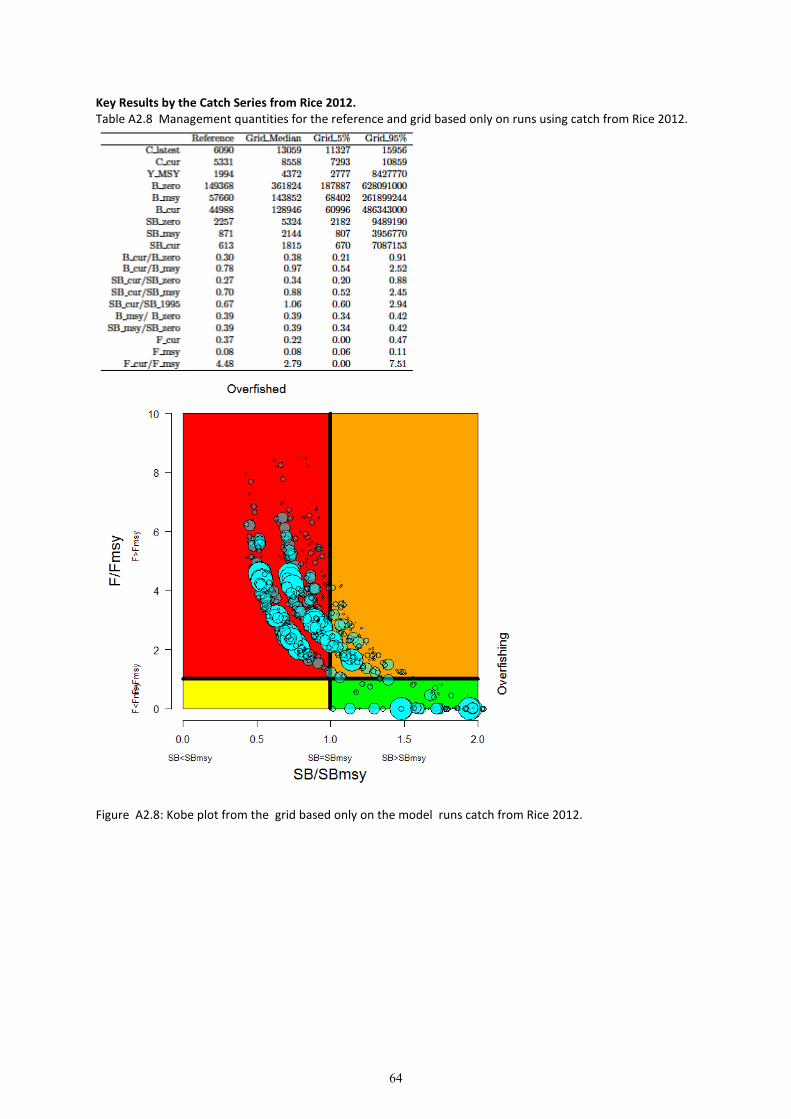
64
Key Results by the Catch Series from Rice 2012.
Table A2.8 Management quantities for the reference and grid based only on runs using catch from Rice 2012.
Figure A2.8: Kobe plot from the grid based only on the model runs catch from Rice 2012.

65
Key Results by the Catch Series from Clarke’s Area method .
Table A2.9 Management quantities for the reference and grid based only on runs using catch based on
Clarke’s area method.
Figure A2.9: Kobe plot from the grid based only on the model runs using catch based on Clarke’s area
method.
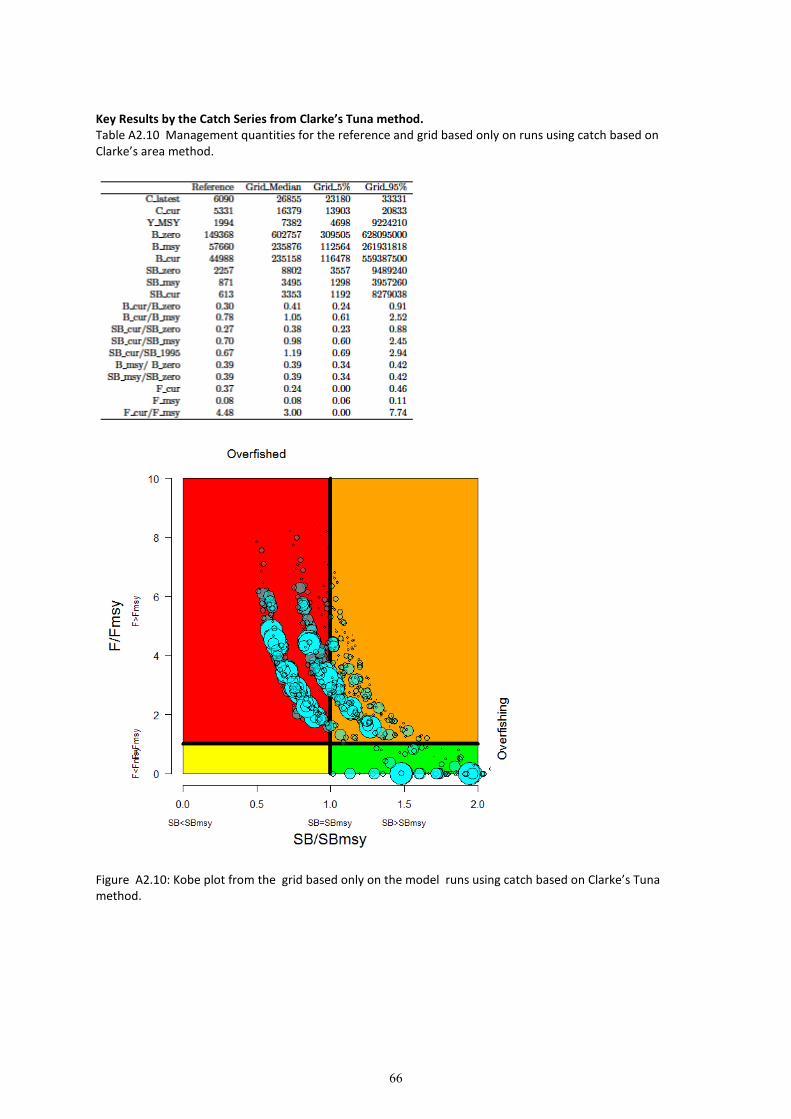
66
Key Results by the Catch Series from Clarke’s Tuna method.
Table A2.10 Management quantities for the reference and grid based only on runs using catch based on
Clarke’s area method.
Figure A2.10: Kobe plot from the grid based only on the model runs using catch based on Clarke’s Tuna
method.
67
13 APPENDIX 3. Key Results from WCPFC9-2012-IP1:3Progress on the updated silky shark stock assessment in the WCPO
At SC8 the first stock assessment for silky shark in the Western Central Pacific Ocean was
presented. The conclusions made by SC8 regarding this assessment are provided in
Attachment 1 of this paper and are briefly summarized below:
• The conclusions on stock status from the stock assessment depended heavily on the
catch per unit effort series used. Some indices suggested major sustainability
concerns and other suggested no concerns;
• A level of discomfort that the non-target longline catch per unit effort series showed
patterns that could be an artifact due to gaps in data for one fleet;
• A conclusion that it was not possible to provide management advice based on the
assessment at this time; and
• A recommendation to update the assessment and in doing so address concerns over
some data conflicts (including the purse seine CPUE) and include other data series
that were available, but not included in the assessment.
The purpose of this paper is to provide an update on progress since SC8 towards an updated
assessment for silky shark in the WCPO. This paper does not include detailed data or
analysis descriptions – these will be provided in the working paper(s) for the full assessment
provided to SC9. In this paper were compare the original and updated Kobe plot describing
the stock status (Figure 1). Note that for the shark assessments for WCPFC, we have
preferred to describe stock status with a large number of model runs (that include different
assumptions and data sets) to capture uncertainty.
In response to requests from SC8, we have:
• addressed concerns over the partial inclusion of the Hawaiian longline data;
• addressed the conflict between the purse seine CPUE and other CPUE series that
seems to have been driven by our exclusion of unidentified sharks from the data set.
These were most likely silky sharks, and their inclusion has reduced the conflict; and
• included two alternative longline series, one derived solely from Hawaiian longline
data, and a second derived from Japanese research and training vessels.
A detailed breakdown of the stock status outcomes against particular data inputs is
provided in Table 1. A summary of the changes from the SC8 assessment and the impacts
that they had are provided in Table 2.
The conclusions regarding this updated assessment are:
• Any conclusions regarding stock status are strongly dependent on which CPUE series

68
is believed to be a true reflection of trends in abundance.
• The revised stock assessment is slightly more optimistic that the one presented to
SC8, though most CPUE series lead to conclusions that the stock is subject to
overfishing and more than half also suggest that it is overfished.
• Across all combinations of CPUE series, catch series, and alternative biological
assumptions, 58.5% of the runs are in the red quadrant, 20.5% are in the orange
quadrant and only 21% are in the green. Almost all the ‘green runs’ are for the target
longline series, and these runs do not provide plausible estimates of population
biomass.
Table A3.1. Distribution of stock status outcomes (percentage of model runs in each quadrant of the
Kobe plot) for models that included different CPUE and catch time series (see Table 2 for further
details of the data sets).
Kobe plot quadrant
CPUE RED ORANGE GREEN YELLOW
Non-target LL (no Hawaii) 87 13 0 0
Japanese research and training vessels 52 45 3 0
Target LL 0 0 100 0
Purse seine (catch per set) 58 35 7 0
Purse seine (catch per mt of tuna) 83 17 0 0
Hawaiian LL 36 36 28 0
Catches RED ORANGE GREEN YELLOW
Lawson 57 19 24 0
Rice 58 18 24 0
Clarke (area based) 50 28 22 0
Clarke (tuna catch based) 46 33 22 0
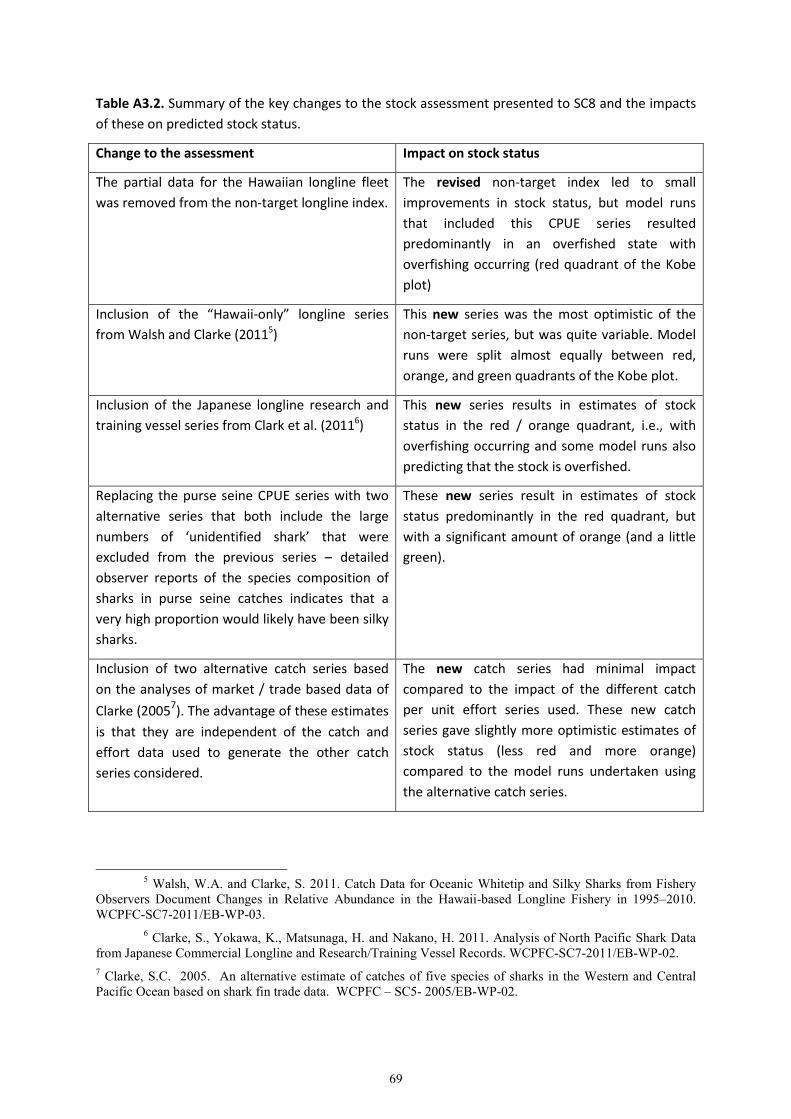
69
Table A3.2. Summary of the key changes to the stock assessment presented to SC8 and the impacts
of these on predicted stock status.
Change to the assessment Impact on stock status
The partial data for the Hawaiian longline fleet
was removed from the non-target longline index.
The revised non-target index led to small
improvements in stock status, but model runs
that included this CPUE series resulted
predominantly in an overfished state with
overfishing occurring (red quadrant of the Kobe
plot)
Inclusion of the “Hawaii-only” longline series
from Walsh and Clarke (20115)
This new series was the most optimistic of the
non-target series, but was quite variable. Model
runs were split almost equally between red,
orange, and green quadrants of the Kobe plot.
Inclusion of the Japanese longline research and
training vessel series from Clark et al. (20116)
This new series results in estimates of stock
status in the red / orange quadrant, i.e., with
overfishing occurring and some model runs also
predicting that the stock is overfished.
Replacing the purse seine CPUE series with two
alternative series that both include the large
numbers of ‘unidentified shark’ that were
excluded from the previous series – detailed
observer reports of the species composition of
sharks in purse seine catches indicates that a
very high proportion would likely have been silky
sharks.
These new series result in estimates of stock
status predominantly in the red quadrant, but
with a significant amount of orange (and a little
green).
Inclusion of two alternative catch series based
on the analyses of market / trade based data of
Clarke (20057). The advantage of these estimates
is that they are independent of the catch and
effort data used to generate the other catch
series considered.
The new catch series had minimal impact
compared to the impact of the different catch
per unit effort series used. These new catch
series gave slightly more optimistic estimates of
stock status (less red and more orange)
compared to the model runs undertaken using
the alternative catch series.
5 Walsh, W.A. and Clarke, S. 2011. Catch Data for Oceanic Whitetip and Silky Sharks from Fishery
Observers Document Changes in Relative Abundance in the Hawaii-based Longline Fishery in 1995–2010.
WCPFC-SC7-2011/EB-WP-03.
6 Clarke, S., Yokawa, K., Matsunaga, H. and Nakano, H. 2011. Analysis of North Pacific Shark Data
from Japanese Commercial Longline and Research/Training Vessel Records. WCPFC-SC7-2011/EB-WP-02.
7 Clarke, S.C. 2005. An alternative estimate of catches of five species of sharks in the Western and Central
Pacific Ocean based on shark fin trade data. WCPFC – SC5- 2005/EB-WP-02.

Figure A3 1. Kobe plots indicating
present the reference points and based on the current (average of 2005
the analysis delivered to SC8 (left panel),
in the updated analysis (right panel). In
of the model run, respectively.
70
Kobe plots indicating annual stock status, relative to SBMSY (x-axis) and F
present the reference points and based on the current (average of 2005-2008) estimates for all 648 models
(left panel), and the current (average of 2005-2008) estimates for all
panel). In each plot the size of the circle is proportional to the weight (plausibility)
axis) and FMSY (y-axis). These
2008) estimates for all 648 models form
2008) estimates for all 2592 models
the size of the circle is proportional to the weight (plausibility)

71
Appendix 4: Extract from the Executive Summary of the SC8 report


![d ] v€¦ · EPSON Easy Photo Print Photo Print ladi stock DOI ladi stock 002 ladi stock stock ladi stock 005 ladi stock DDE ladi stock 007 stock DDB ladi stock DDS ladi stock 010](https://img.pdfslide.us/doc/110x75/5f06f3837e708231d41a8cef/d-v-epson-easy-photo-print-photo-print-ladi-stock-doi-ladi-stock-002-ladi-stock.jpg)