Embed Size (px)
Citation preview

AREA PROFILE
Community Planning
Ward
6

Introduction to Area Profile This Area Profile has been produced by the Performance and Community Engagement division within Services for Communities at the City of Edinburgh Council. We are interested in hearing your comments and feedback on the profiles so please contact either:
• Pam Lambert ([email protected]), • Justin Ward ([email protected]) • Daniel Sawyers ([email protected]).
The profiles have been based around the Scottish Indices of Multiple Deprivation (SIMD) and updates to the profiles will be in line with the publication of the new SIMD data and other appropriate information from partner organisations as it becomes available. Thank you Angela Leitch Head of Performance and Community Engagement Services for Communities
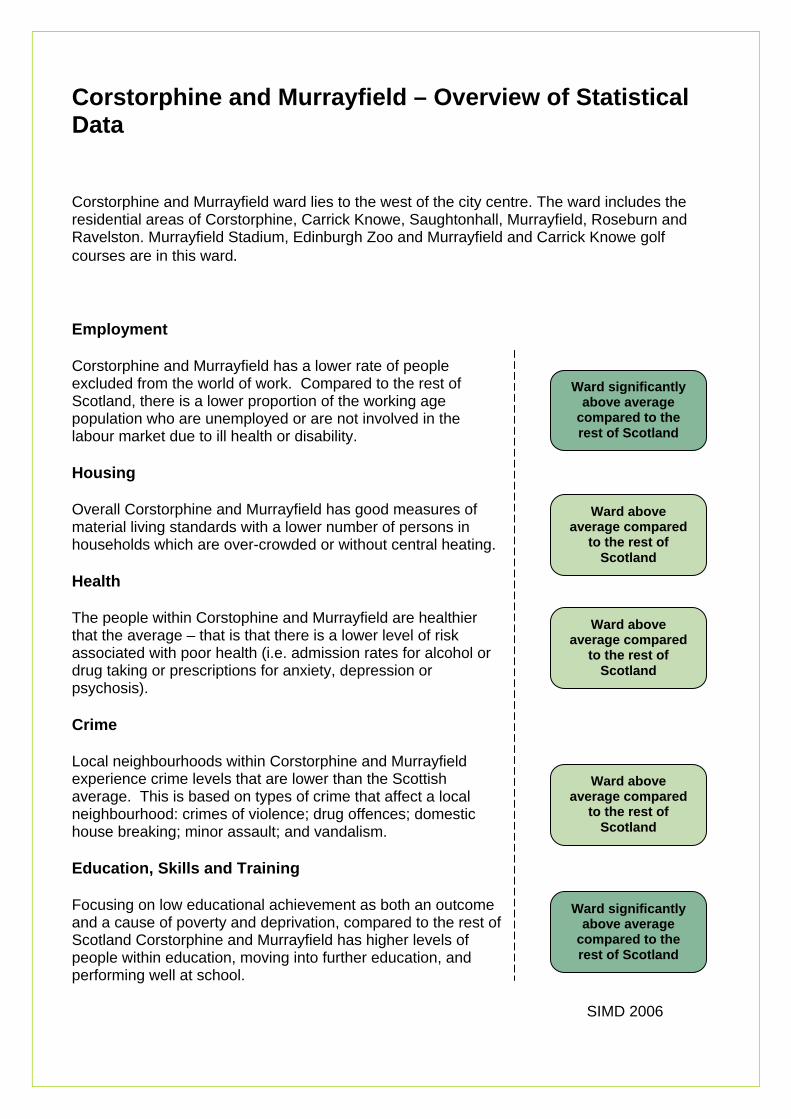
Corstorphine and Murrayfield – Overview of Statistical Data
Corstorphine and Murrayfield ward lies to the west of the city centre. The ward includes the residential areas of Corstorphine, Carrick Knowe, Saughtonhall, Murrayfield, Roseburn and Ravelston. Murrayfield Stadium, Edinburgh Zoo and Murrayfield and Carrick Knowe golf courses are in this ward.
Employment
Corstorphine and Murrayfield has a lower rate of people excluded from the world of work. Compared to the rest of Scotland, there is a lower proportion of the working age population who are unemployed or are not involved in the labour market due to ill health or disability.
Housing
Overall Corstorphine and Murrayfield has good measures of material living standards with a lower number of persons in households which are over-crowded or without central heating.
Health
The people within Corstophine and Murrayfield are healthier that the average – that is that there is a lower level of risk associated with poor health (i.e. admission rates for alcohol or drug taking or prescriptions for anxiety, depression or psychosis).
Crime
Local neighbourhoods within Corstorphine and Murrayfield experience crime levels that are lower than the Scottish average. This is based on types of crime that affect a local neighbourhood: crimes of violence; drug offences; domestic house breaking; minor assault; and vandalism.
Education, Skills and Training
Focusing on low educational achievement as both an outcome and a cause of poverty and deprivation, compared to the rest of Scotland Corstorphine and Murrayfield has higher levels of people within education, moving into further education, and performing well at school.
SIMD 2006
Ward significantly above average
compared to the rest of Scotland
Ward above average compared
to the rest of Scotland
Ward significantly above average
compared to the rest of Scotland
Ward above average compared
to the rest of Scotland
Ward above average compared
to the rest of Scotland
AREA PROFILE Com
mun
ity
Pla
nnin
g
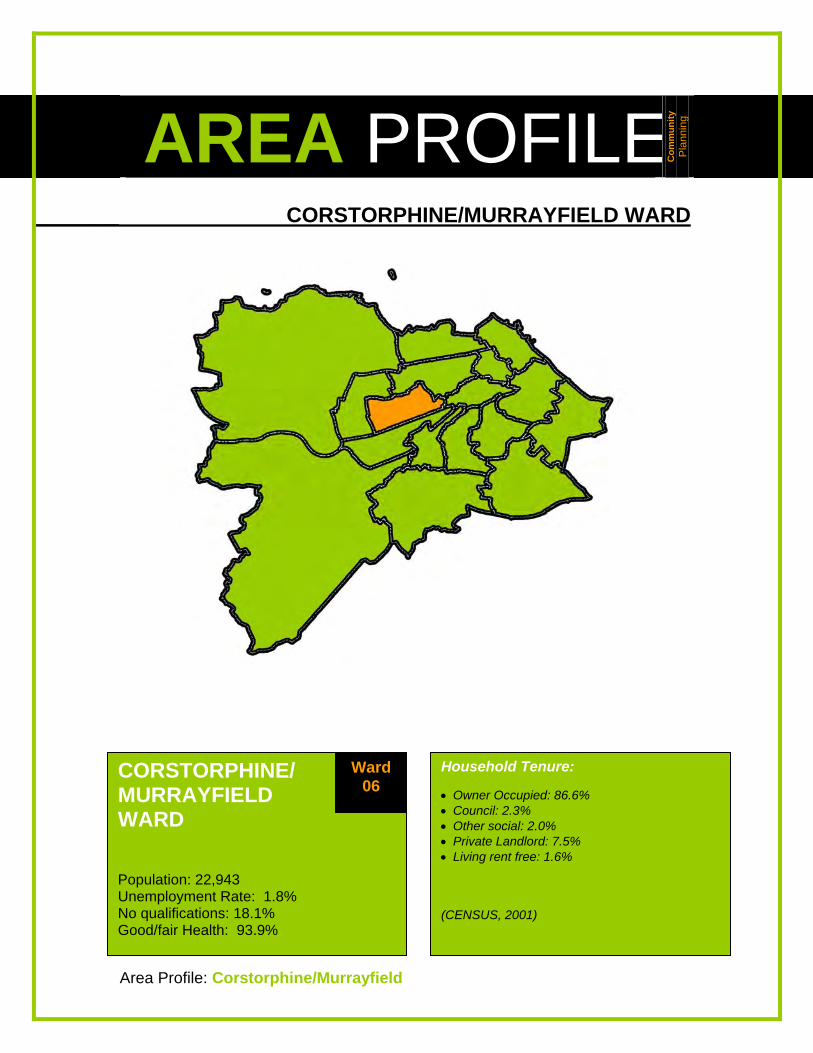
_______ CORSTORPHINE/MURRAYFIELD WARD
Area Profile: Corstorphine/Murrayfield
Household Tenure: • Owner Occupied: 86.6% • Council: 2.3% • Other social: 2.0% • Private Landlord: 7.5% • Living rent free: 1.6% (CENSUS, 2001)
CORSTORPHINE/ MURRAYFIELD WARD Population: 22,943 Unemployment Rate: 1.8% No qualifications: 18.1% Good/fair Health: 93.9%
Ward 06
AREA PROFILING
“This area profile brings together a number of components to help map the quality of life and services in a local area. It can provide a valuable resource for neighbourhood managers and neighbourhood partnerships to address the issues that matter in their locality”
The profiles use the Scottish Indices of Multiple Deprivation (SIMD) – the Scottish Executive’s official tool for identifying small area concentrations of multiple deprivation across Scotland. This has been selected as it is relevant to policies aimed at tackling the causes and effects of area based multiple deprivation. For a detailed explanation of SIMD and guidance on how to use the SIMD data please see the last page of this report.
Area Profile: Corstorphine/Murrayfield

________PEOPLE AND PLACE________PEOPLE AND PLACE Population dynamics Total Population – 22,943 Density (persons/ha) – 30.1
Household Composition
17.5%
16.0%
34.4%
2.9%
13.9%
5.7%
9.6%
1 person pensioner
1 person other
2 adult, no children
1 adult plus children
2 adults, 1 or 2 children
2 adults, 3+children /3 +adults, 1 +children 3 + adults, no children
For census information please see: http://www.scrol.gov.uk/scrol/common/home.jsp
Age profile
5.1%7.8%
4.3%8.5%
29.1%24.0%
18.0%3.2%
0.0% 10.0% 20.0% 30.0% 40.0%
0-4
5 to 11
12 to 15
16 to 24
25 to 44
45 to 64
65 to 84
85 plus85 plus65 to 8445 to 6425 to 4416 to 2412 to 155 to 110-4
v
http://www.scrol.gov.uk/scrol/common/home.jsp
Area Profile: Corstorphine/Murrayfield
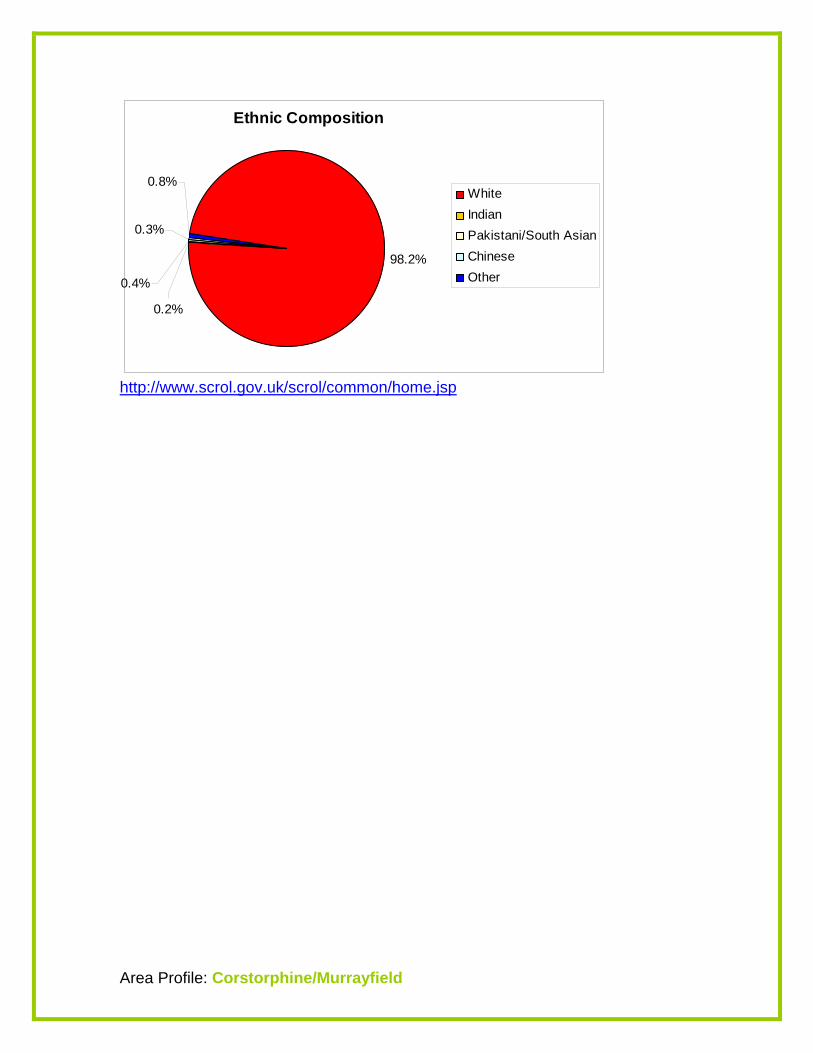
Ethnic Composition
98.2%
0.3%
0.8%
0.4%
0.2%
WhiteIndianPakistani/South AsianChineseOther
http://www.scrol.gov.uk/scrol/common/home.jsp
Area Profile: Corstorphine/Murrayfield
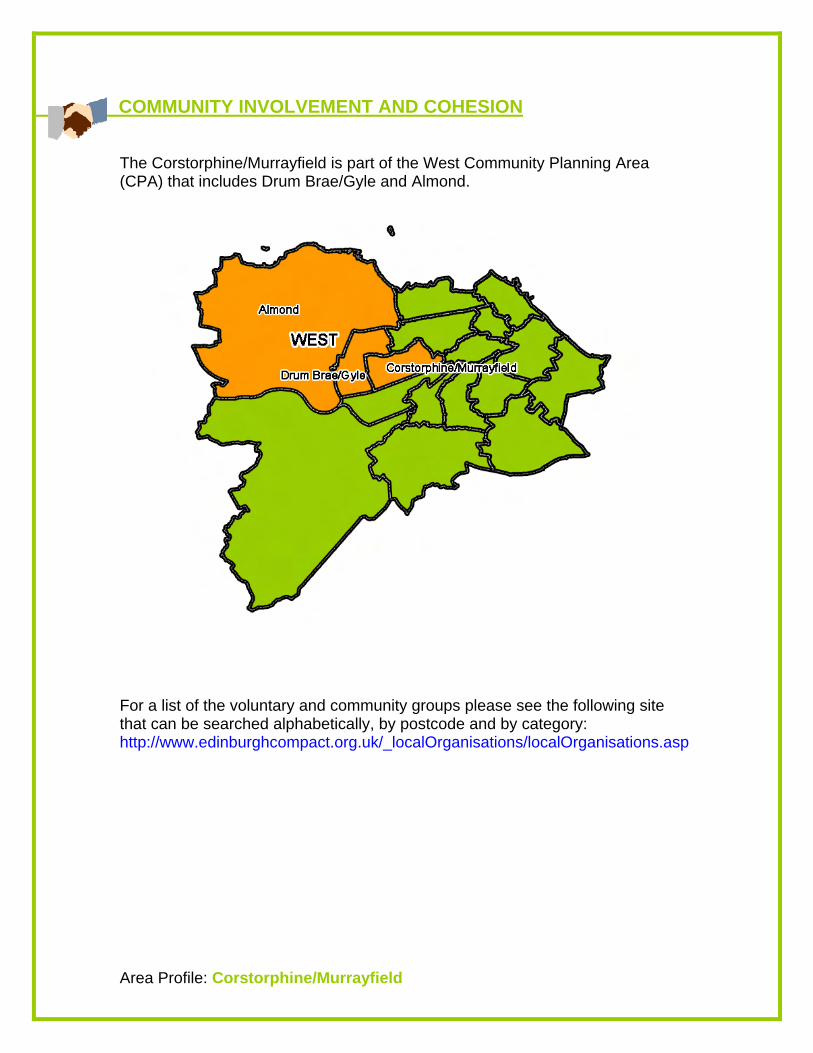
COMMUNITY INVOLVEMENT AND COHESION The Corstorphine/Murrayfield is part of the West Community Planning Area (CPA) that includes Drum Brae/Gyle and Almond.
For a list of the voluntary and community groups please see the following site that can be searched alphabetically, by postcode and by category: http://www.edinburghcompact.org.uk/_localOrganisations/localOrganisations.asp
Area Profile: Corstorphine/Murrayfield
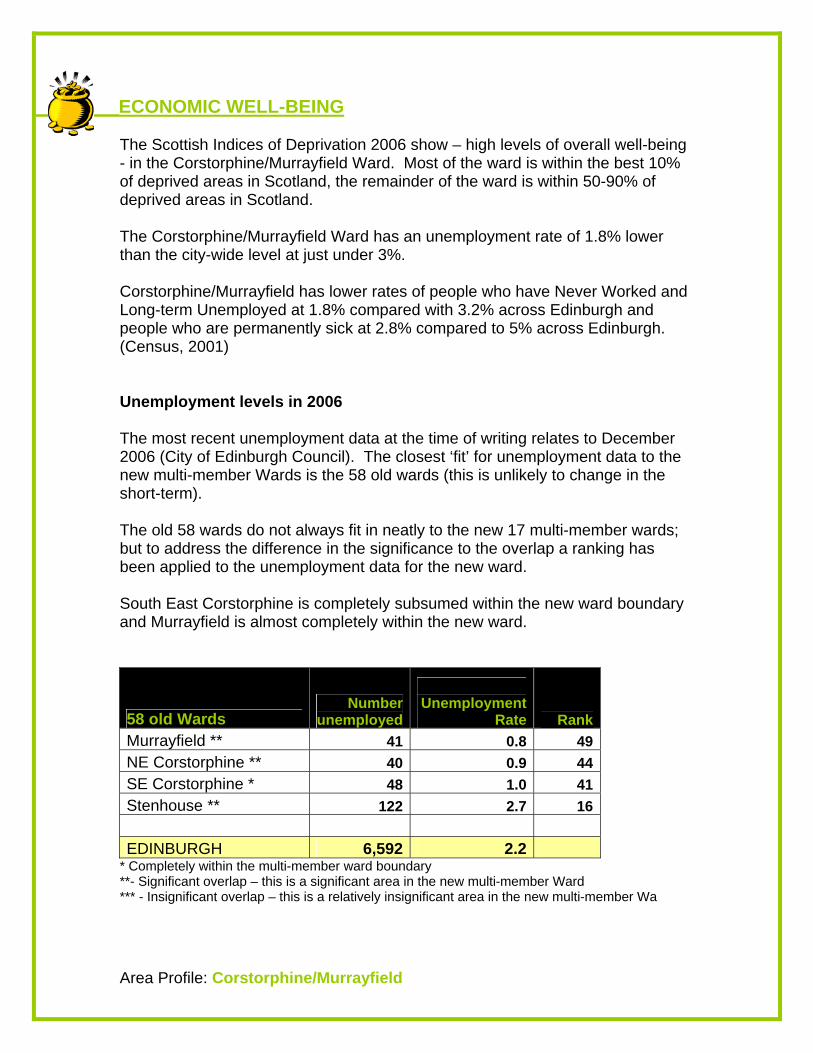
________ECONOMIC WELL-BEING The Scottish Indices of Deprivation 2006 show – high levels of overall well-being - in the Corstorphine/Murrayfield Ward. Most of the ward is within the best 10% of deprived areas in Scotland, the remainder of the ward is within 50-90% of deprived areas in Scotland. The Corstorphine/Murrayfield Ward has an unemployment rate of 1.8% lower than the city-wide level at just under 3%. Corstorphine/Murrayfield has lower rates of people who have Never Worked and Long-term Unemployed at 1.8% compared with 3.2% across Edinburgh and people who are permanently sick at 2.8% compared to 5% across Edinburgh. (Census, 2001) Unemployment levels in 2006 The most recent unemployment data at the time of writing relates to December 2006 (City of Edinburgh Council). The closest ‘fit’ for unemployment data to the new multi-member Wards is the 58 old wards (this is unlikely to change in the short-term). The old 58 wards do not always fit in neatly to the new 17 multi-member wards; but to address the difference in the significance to the overlap a ranking has been applied to the unemployment data for the new ward. South East Corstorphine is completely subsumed within the new ward boundary and Murrayfield is almost completely within the new ward.
58 old Wards Number
unemployed
Unemployment
Rate Rank Murrayfield ** 41 0.8 49 NE Corstorphine ** 40 0.9 44 SE Corstorphine * 48 1.0 41 Stenhouse ** 122 2.7 16 EDINBURGH 6,592 2.2
* Completely within the multi-member ward boundary **- Significant overlap – this is a significant area in the new multi-member Ward *** - Insignificant overlap – this is a relatively insignificant area in the new multi-member Wa
Area Profile: Corstorphine/Murrayfield
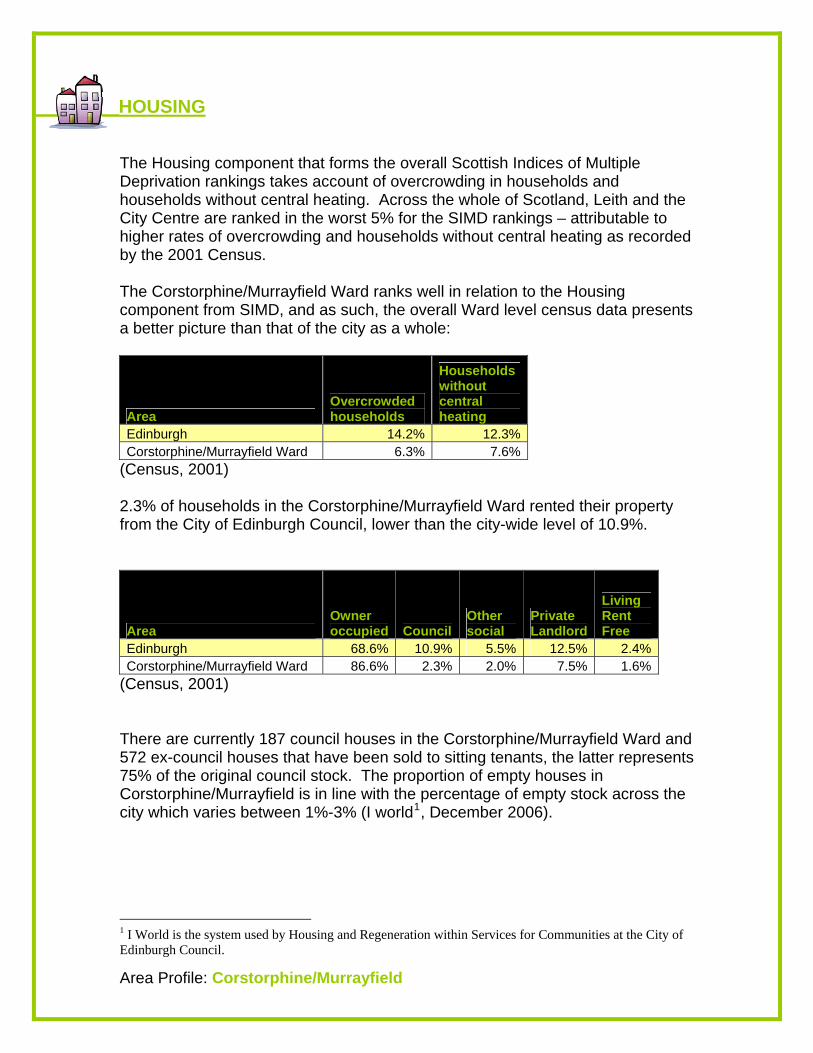
________HOUSING The Housing component that forms the overall Scottish Indices of Multiple Deprivation rankings takes account of overcrowding in households and households without central heating. Across the whole of Scotland, Leith and the City Centre are ranked in the worst 5% for the SIMD rankings – attributable to higher rates of overcrowding and households without central heating as recorded by the 2001 Census. The Corstorphine/Murrayfield Ward ranks well in relation to the Housing component from SIMD, and as such, the overall Ward level census data presents a better picture than that of the city as a whole:
Area Overcrowded households
Households without central heating
Edinburgh 14.2% 12.3%Corstorphine/Murrayfield Ward 6.3% 7.6%
(Census, 2001) 2.3% of households in the Corstorphine/Murrayfield Ward rented their property from the City of Edinburgh Council, lower than the city-wide level of 10.9%.
Area Owner occupied Council
Other social
Private Landlord
Living Rent Free
Edinburgh 68.6% 10.9% 5.5% 12.5% 2.4% Corstorphine/Murrayfield Ward 86.6% 2.3% 2.0% 7.5% 1.6%
(Census, 2001) There are currently 187 council houses in the Corstorphine/Murrayfield Ward and 572 ex-council houses that have been sold to sitting tenants, the latter represents 75% of the original council stock. The proportion of empty houses in Corstorphine/Murrayfield is in line with the percentage of empty stock across the city which varies between 1%-3% (I world1, December 2006).
1 I World is the system used by Housing and Regeneration within Services for Communities at the City of Edinburgh Council.
Area Profile: Corstorphine/Murrayfield
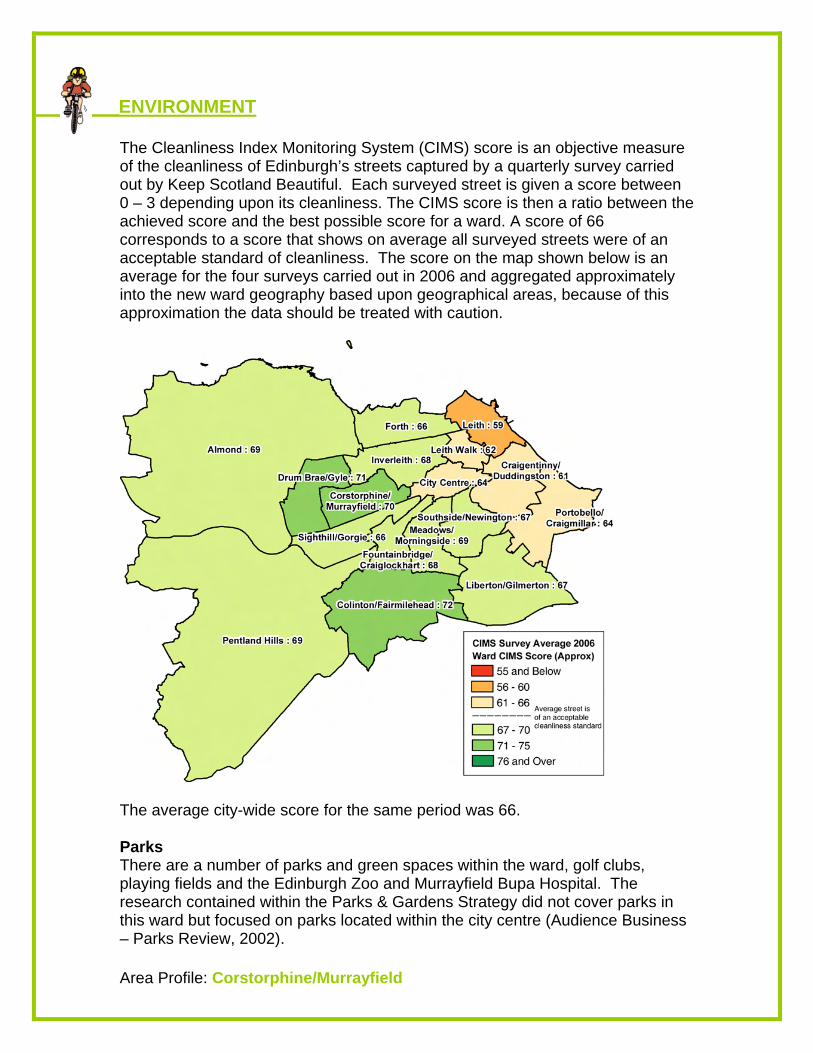
________ENVIRONMENT The Cleanliness Index Monitoring System (CIMS) score is an objective measure of the cleanliness of Edinburgh’s streets captured by a quarterly survey carried out by Keep Scotland Beautiful. Each surveyed street is given a score between 0 – 3 depending upon its cleanliness. The CIMS score is then a ratio between the achieved score and the best possible score for a ward. A score of 66 corresponds to a score that shows on average all surveyed streets were of an acceptable standard of cleanliness. The score on the map shown below is an average for the four surveys carried out in 2006 and aggregated approximately into the new ward geography based upon geographical areas, because of this approximation the data should be treated with caution.
The average city-wide score for the same period was 66. Parks There are a number of parks and green spaces within the ward, golf clubs, playing fields and the Edinburgh Zoo and Murrayfield Bupa Hospital. The research contained within the Parks & Gardens Strategy did not cover parks in this ward but focused on parks located within the city centre (Audience Business – Parks Review, 2002).
Area Profile: Corstorphine/Murrayfield
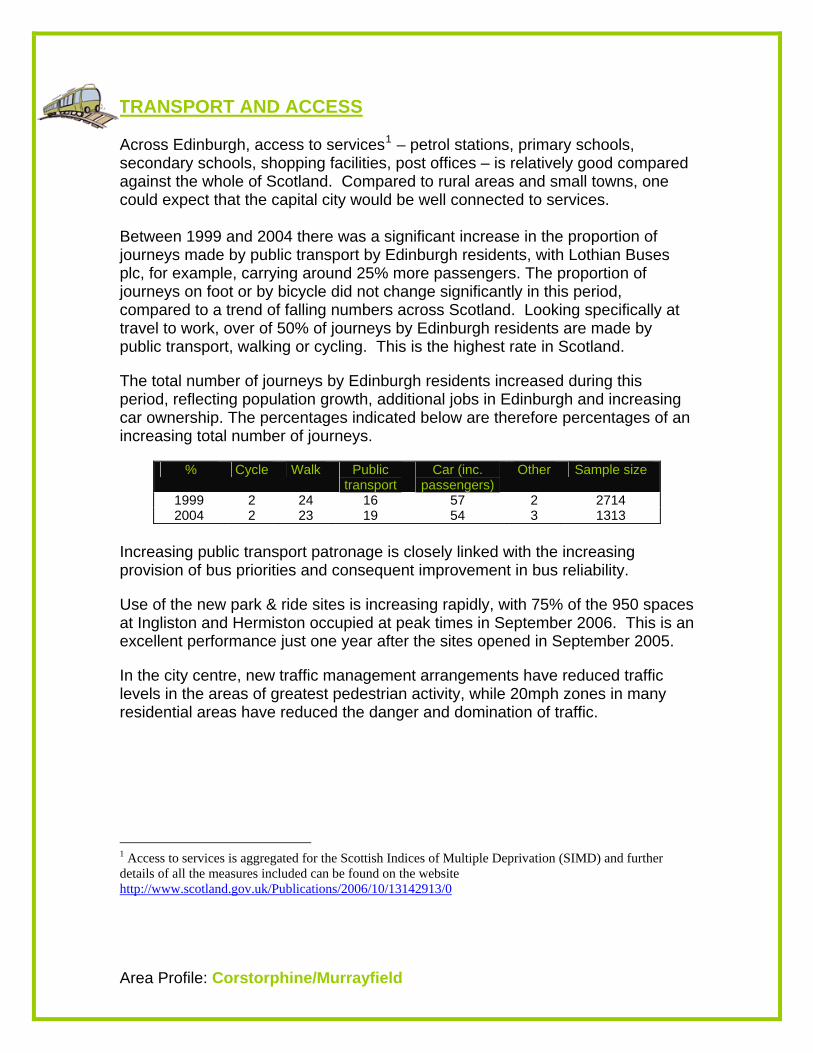
________TRANSPORT AND ACCESS Across Edinburgh, access to services1 – petrol stations, primary schools, secondary schools, shopping facilities, post offices – is relatively good compared against the whole of Scotland. Compared to rural areas and small towns, one could expect that the capital city would be well connected to services. Between 1999 and 2004 there was a significant increase in the proportion of journeys made by public transport by Edinburgh residents, with Lothian Buses plc, for example, carrying around 25% more passengers. The proportion of journeys on foot or by bicycle did not change significantly in this period, compared to a trend of falling numbers across Scotland. Looking specifically at travel to work, over of 50% of journeys by Edinburgh residents are made by public transport, walking or cycling. This is the highest rate in Scotland.
The total number of journeys by Edinburgh residents increased during this period, reflecting population growth, additional jobs in Edinburgh and increasing car ownership. The percentages indicated below are therefore percentages of an increasing total number of journeys.
% Cycle Walk Public transport
Car (inc. passengers)
Other Sample size
1999 2 24 16 57 2 2714 2004 2 23 19 54 3 1313
Increasing public transport patronage is closely linked with the increasing provision of bus priorities and consequent improvement in bus reliability.
Use of the new park & ride sites is increasing rapidly, with 75% of the 950 spaces at Ingliston and Hermiston occupied at peak times in September 2006. This is an excellent performance just one year after the sites opened in September 2005.
In the city centre, new traffic management arrangements have reduced traffic levels in the areas of greatest pedestrian activity, while 20mph zones in many residential areas have reduced the danger and domination of traffic.
1 Access to services is aggregated for the Scottish Indices of Multiple Deprivation (SIMD) and further details of all the measures included can be found on the website http://www.scotland.gov.uk/Publications/2006/10/13142913/0
Area Profile: Corstorphine/Murrayfield
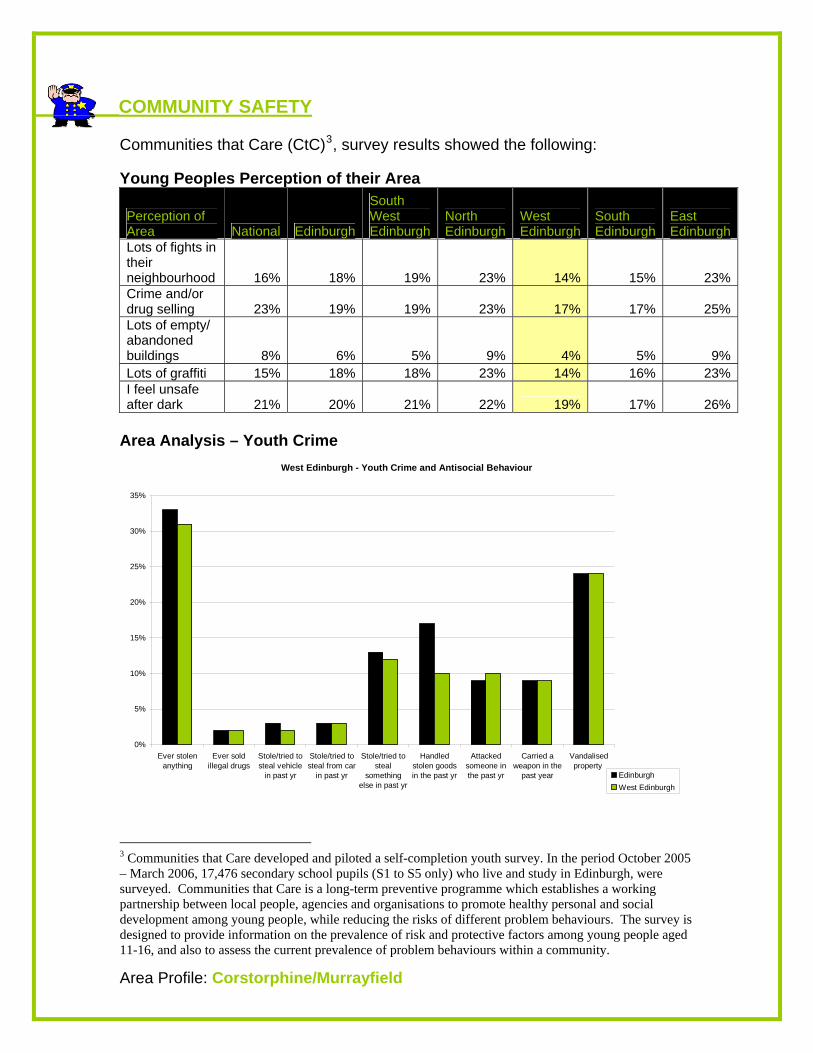
________COMMUNITY SAFETY Communities that Care (CtC)3, survey results showed the following: Young Peoples Perception of their Area
Perception of Area National Edinburgh
South West Edinburgh
North Edinburgh
West Edinburgh
South Edinburgh
East Edinburgh
Lots of fights in their neighbourhood 16% 18% 19% 23% 14% 15% 23%Crime and/or drug selling 23% 19% 19% 23% 17% 17% 25%Lots of empty/ abandoned buildings 8% 6% 5% 9% 4% 5% 9%Lots of graffiti 15% 18% 18% 23% 14% 16% 23%I feel unsafe after dark 21% 20% 21% 22% 19% 17% 26%
Area Analysis – Youth Crime
West Edinburgh - Youth Crime and Antisocial Behaviour
0%
5%
10%
15%
20%
25%
30%
35%
Ever stolenanything
Ever soldillegal drugs
Stole/tried tosteal vehicle
in past yr
Stole/tried tosteal from car
in past yr
Stole/tried tosteal
somethingelse in past yr
Handledstolen goodsin the past yr
Attackedsomeone inthe past yr
Carried aweapon in the
past year
Vandalisedproperty
EdinburghWest Edinburgh
3 Communities that Care developed and piloted a self-completion youth survey. In the period October 2005 – March 2006, 17,476 secondary school pupils (S1 to S5 only) who live and study in Edinburgh, were surveyed. Communities that Care is a long-term preventive programme which establishes a working partnership between local people, agencies and organisations to promote healthy personal and social development among young people, while reducing the risks of different problem behaviours. The survey is designed to provide information on the prevalence of risk and protective factors among young people aged 11-16, and also to assess the current prevalence of problem behaviours within a community.
Area Profile: Corstorphine/Murrayfield
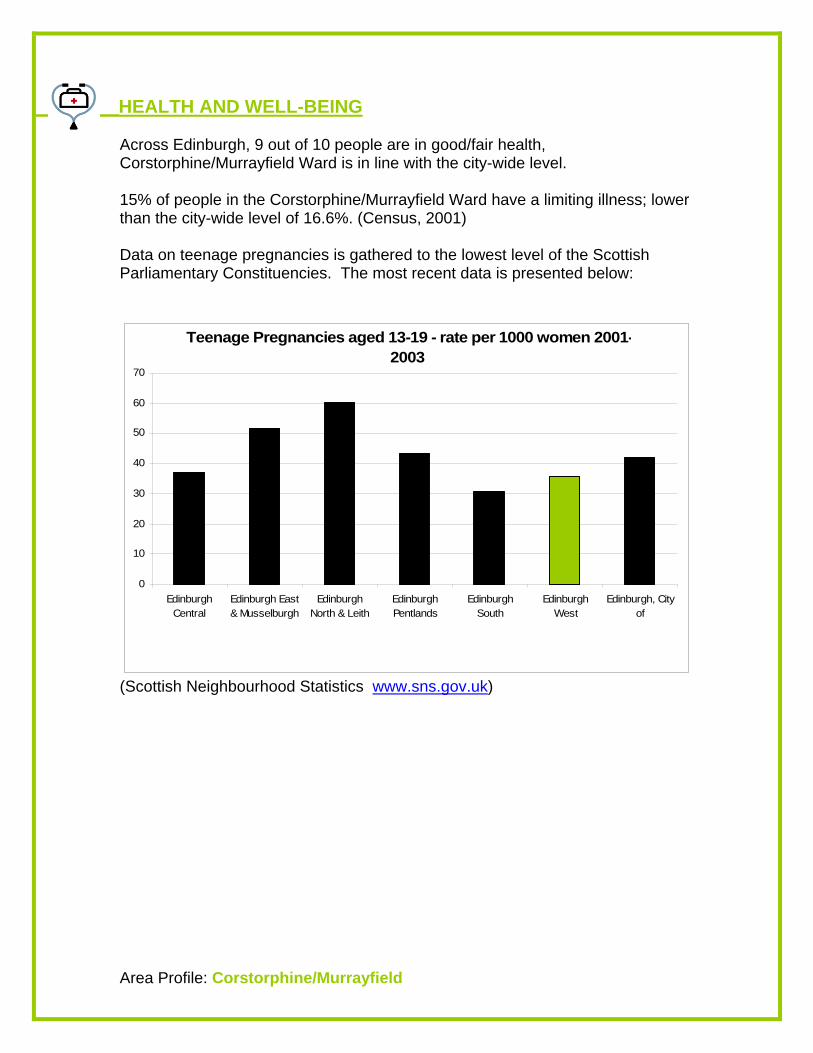
________HEALTH AND WELL-BEING Across Edinburgh, 9 out of 10 people are in good/fair health, Corstorphine/Murrayfield Ward is in line with the city-wide level. 15% of people in the Corstorphine/Murrayfield Ward have a limiting illness; lower than the city-wide level of 16.6%. (Census, 2001) Data on teenage pregnancies is gathered to the lowest level of the Scottish Parliamentary Constituencies. The most recent data is presented below:
Teenage Pregnancies aged 13-19 - rate per 1000 women 2001-2003
0
10
20
30
40
50
60
70
EdinburghCentral
Edinburgh East& Musselburgh
EdinburghNorth & Leith
EdinburghPentlands
EdinburghSouth
EdinburghWest
Edinburgh, Cityof
(Scottish Neighbourhood Statistics www.sns.gov.uk)
Area Profile: Corstorphine/Murrayfield
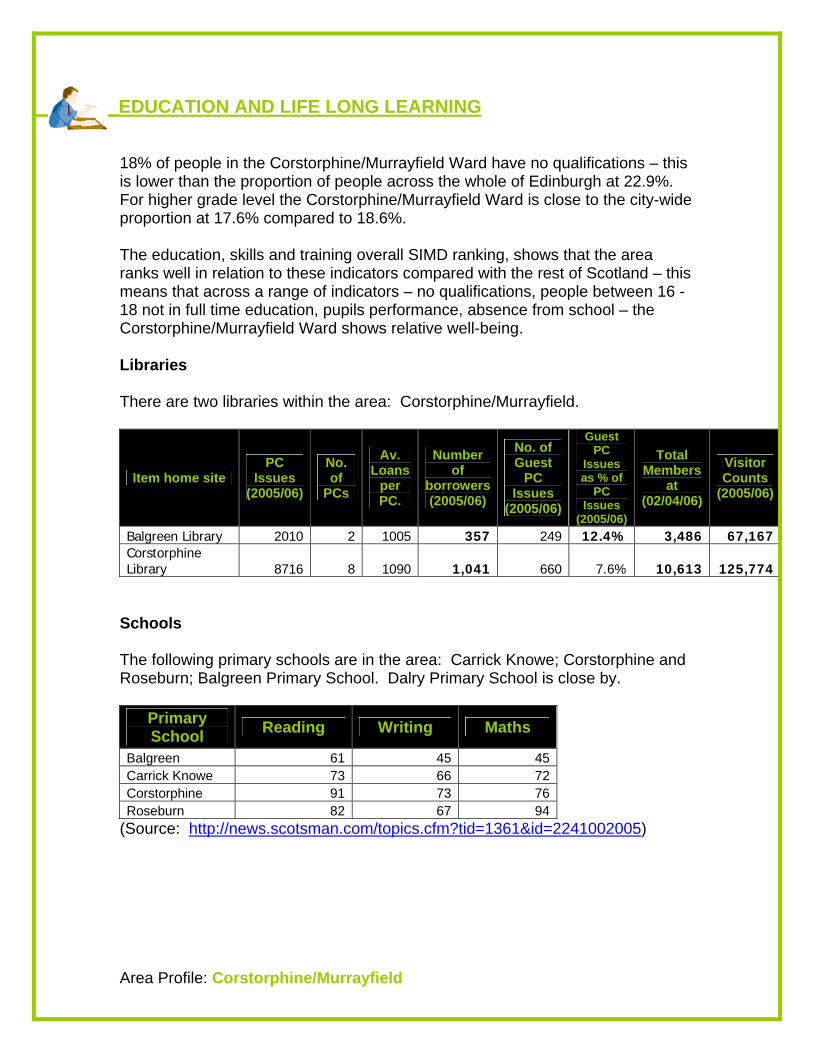
________EDUCATION AND LIFE LONG LEARNING 18% of people in the Corstorphine/Murrayfield Ward have no qualifications – this is lower than the proportion of people across the whole of Edinburgh at 22.9%. For higher grade level the Corstorphine/Murrayfield Ward is close to the city-wide proportion at 17.6% compared to 18.6%. The education, skills and training overall SIMD ranking, shows that the area ranks well in relation to these indicators compared with the rest of Scotland – this means that across a range of indicators – no qualifications, people between 16 -18 not in full time education, pupils performance, absence from school – the Corstorphine/Murrayfield Ward shows relative well-being. Libraries There are two libraries within the area: Corstorphine/Murrayfield.
Item home site PC
Issues (2005/06)
No. of
PCs
Av. Loans
per PC.
Number of
borrowers (2005/06)
No. of Guest
PC Issues
(2005/06)
Guest PC
Issues as % of
PC Issues
(2005/06)
Total Members
at (02/04/06)
Visitor Counts
(2005/06)
Balgreen Library 2010 2 1005 357 249 12.4% 3,486 67,167Corstorphine Library 8716 8 1090 1,041 660 7.6% 10,613 125,774
Schools The following primary schools are in the area: Carrick Knowe; Corstorphine and Roseburn; Balgreen Primary School. Dalry Primary School is close by.
Primary School Reading Writing Maths
Balgreen 61 45 45Carrick Knowe 73 66 72Corstorphine 91 73 76Roseburn 82 67 94
(Source: http://news.scotsman.com/topics.cfm?tid=1361&id=2241002005)
Area Profile: Corstorphine/Murrayfield

Secondary schools within the area have the following profiles:
Secondary School No. of pupils
Percentage authorised absences
for 2005/06
Percentage unauthorised absences for
2005/06
Percentage of the S4 year group achieving
five or more awards at SCQF Level 4 (Standard Grade General level or equivalent) or better
Staying on to S5
Edinburgh 6.5% 3.1% 74% 64%Scotland 7.5% 1.8% 76% 64%Forrester High School * 695 5.7% 3.3% 78% 52%St Augustines RC High School * 778 7.5% 2.4% 83% 61%Tynecastle High School * 721 7.2% 3.3% 59% 55%
(Source: http://www.scottishschoolsonline.gov.uk/)
* Schools that are outside the Ward boundary NEET group The table below is based on the School Leaver Destination survey and is the main set for the NEET (Not in Education, Employment or Training) group.
School Unemployed
Seeking Unemployed Not Seeking
Not Known
Total Leavers
Forrester High 14% 1% 0% 149 St Augustine's High 8% 0% 0% 146 Tynecastle High 15% 2% 0% 136
As the graph below shows the % of school leavers in education, employment or training is as follows:
• Forrester has 85% • St Augustine’s High has 92%
Area Profile: Corstorphine/Murrayfield
• Tynecastle High has 83%
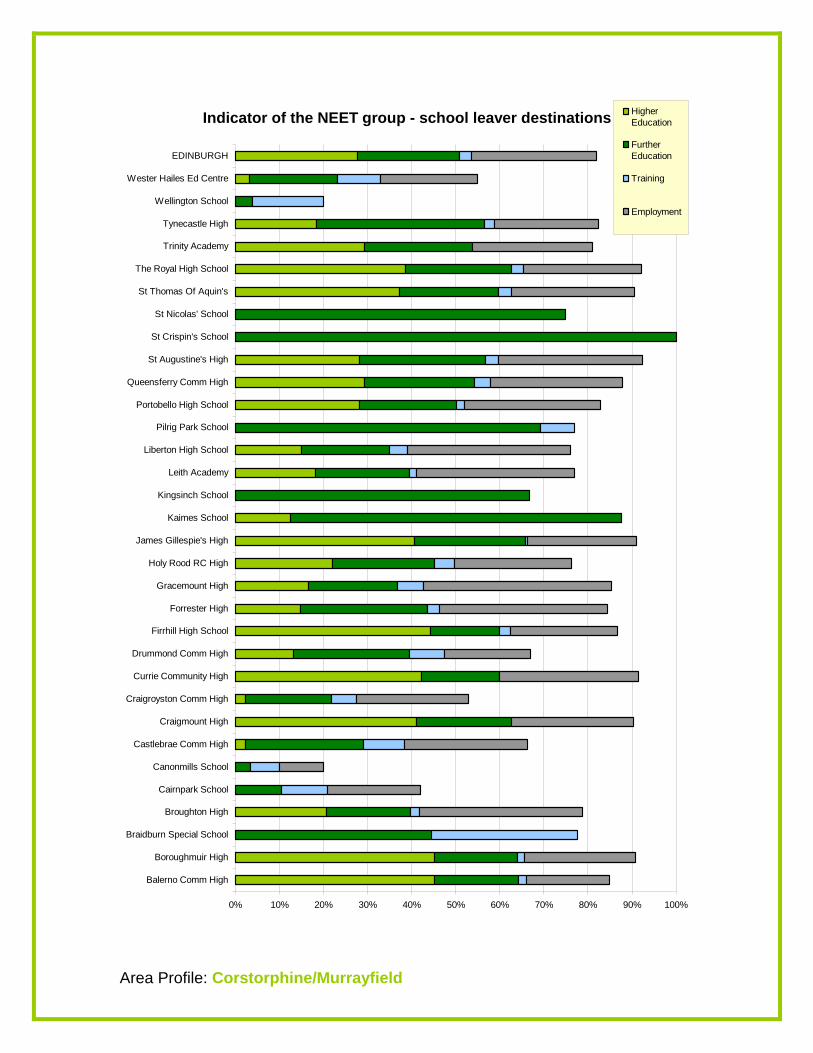
Indicator of the NEET group - school leaver destinations
0% 10% 20% 30% 40% 50% 60% 70% 80% 90% 100%
Balerno Comm High
Boroughmuir High
Braidburn Special School
Broughton High
Cairnpark School
Canonmills School
Castlebrae Comm High
Craigmount High
Craigroyston Comm High
Currie Community High
Drummond Comm High
Firrhill High School
Forrester High
Gracemount High
Holy Rood RC High
James Gillespie's High
Kaimes School
Kingsinch School
Leith Academy
Liberton High School
Pilrig Park School
Portobello High School
Queensferry Comm High
St Augustine's High
St Crispin's School
St Nicolas' School
St Thomas Of Aquin's
The Royal High School
Trinity Academy
Tynecastle High
Wellington School
Wester Hailes Ed Centre
EDINBURGH
HigherEducation
FurtherEducation
Training
Employment
Area Profile: Corstorphine/Murrayfield
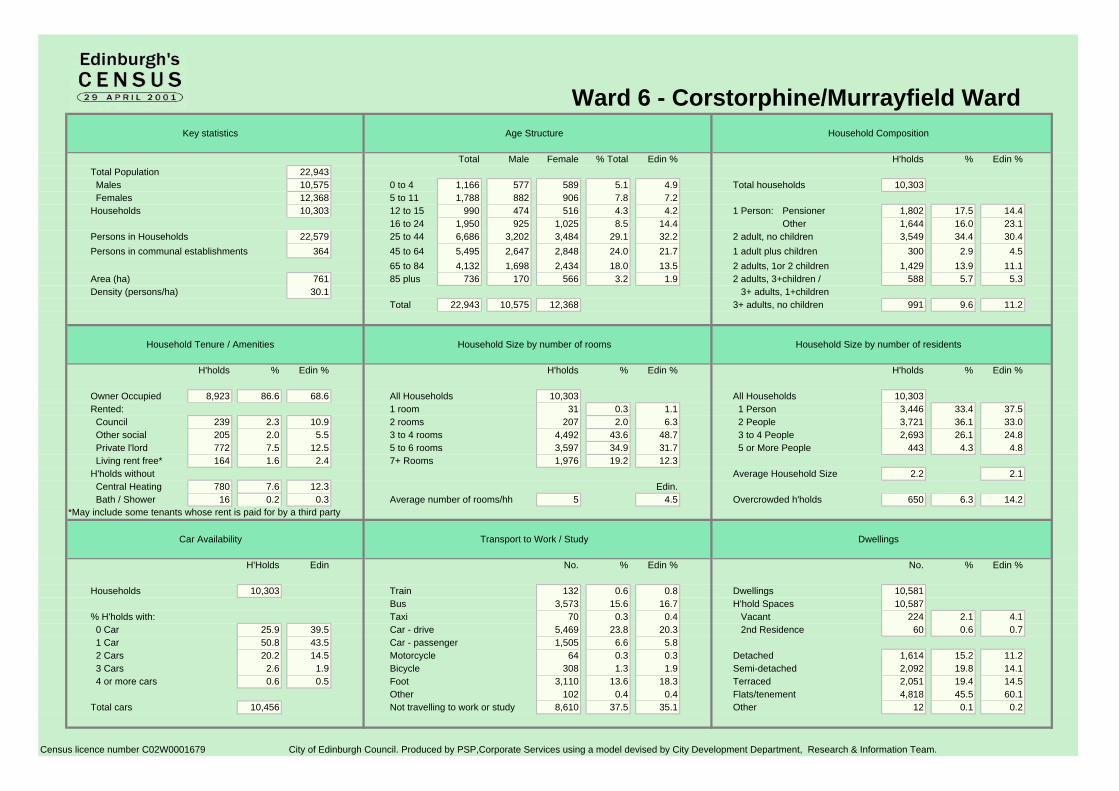
Ward 6 - Corstorphine/Murrayfield WardKey statistics Age Structure Household Composition
Total Male Female % Total Edin % H'holds % Edin %Total Population 22,943 Males 10,575 0 to 4 1,166 577 589 5.1 4.9 Total households 10,303 Females 12,368 5 to 11 1,788 882 906 7.8 7.2Households 10,303 12 to 15 990 474 516 4.3 4.2 1 Person: Pensioner 1,802 17.5 14.4
16 to 24 1,950 925 1,025 8.5 14.4 Other 1,644 16.0 23.1Persons in Households 22,579 25 to 44 6,686 3,202 3,484 29.1 32.2 2 adult, no children 3,549 34.4 30.4Persons in communal establishments 364 45 to 64 5,495 2,647 2,848 24.0 21.7 1 adult plus children 300 2.9 4.5
65 to 84 4,132 1,698 2,434 18.0 13.5 2 adults, 1or 2 children 1,429 13.9 11.1Area (ha) 761 85 plus 736 170 566 3.2 1.9 2 adults, 3+children / 588 5.7 5.3Density (persons/ha) 30.1 3+ adults, 1+children
Total 22,943 10,575 12,368 3+ adults, no children 991 9.6 11.2
Household Tenure / Amenities Household Size by number of rooms Household Size by number of residents
H'holds % Edin % H'holds % Edin % H'holds % Edin %
Owner Occupied 8,923 86.6 68.6 All Households 10,303 All Households 10,303Rented: 1 room 31 0.3 1.1 1 Person 3,446 33.4 37.5 Council 239 2.3 10.9 2 rooms 207 2.0 6.3 2 People 3,721 36.1 33.0 Other social 205 2.0 5.5 3 to 4 rooms 4,492 43.6 48.7 3 to 4 People 2,693 26.1 24.8 Private l'lord 772 7.5 12.5 5 to 6 rooms 3,597 34.9 31.7 5 or More People 443 4.3 4.8 Living rent free* 164 1.6 2.4 7+ Rooms 1,976 19.2 12.3H'holds without Average Household Size 2.2 2.1 Central Heating 780 7.6 12.3 Edin. Bath / Shower 16 0.2 0.3 Average number of rooms/hh 5 4.5 Overcrowded h'holds 650 6.3 14.2
*May include some tenants whose rent is paid for by a third party
Car Availability Transport to Work / Study Dwellings
H'Holds Edin No. % Edin % No. % Edin %
Households 10,303 Train 132 0.6 0.8 Dwellings 10,581Bus 3,573 15.6 16.7 H'hold Spaces 10,587
% H'holds with: Taxi 70 0.3 0.4 Vacant 224 2.1 4.1 0 Car 25.9 39.5 Car - drive 5,469 23.8 20.3 2nd Residence 60 0.6 0.7 1 Car 50.8 43.5 Car - passenger 1,505 6.6 5.8 2 Cars 20.2 14.5 Motorcycle 64 0.3 0.3 Detached 1,614 15.2 11.2 3 Cars 2.6 1.9 Bicycle 308 1.3 1.9 Semi-detached 2,092 19.8 14.1 4 or more cars 0.6 0.5 Foot 3,110 13.6 18.3 Terraced 2,051 19.4 14.5
Other 102 0.4 0.4 Flats/tenement 4,818 45.5 60.1Total cars 10,456 Not travelling to work or study 8,610 37.5 35.1 Other 12 0.1 0.2
Census licence number C02W0001679 City of Edinburgh Council. Produced by PSP,Corporate Services using a model devised by City Development Department, Research & Information Team.
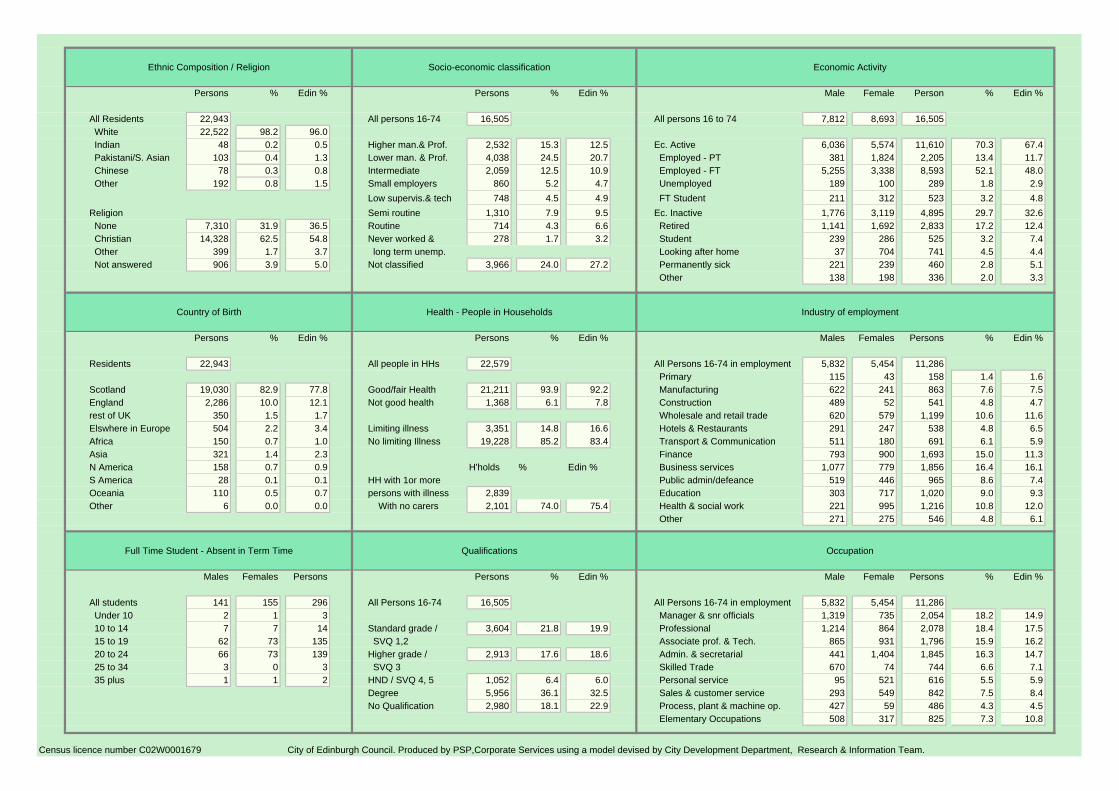
Ethnic Composition / Religion Socio-economic classification Economic Activity
Persons % Edin % Persons % Edin % Male Female Person % Edin %
All Residents 22,943 All persons 16-74 16,505 All persons 16 to 74 7,812 8,693 16,505 White 22,522 98.2 96.0 Indian 48 0.2 0.5 Higher man.& Prof. 2,532 15.3 12.5 Ec. Active 6,036 5,574 11,610 70.3 67.4 Pakistani/S. Asian 103 0.4 1.3 Lower man. & Prof. 4,038 24.5 20.7 Employed - PT 381 1,824 2,205 13.4 11.7 Chinese 78 0.3 0.8 Intermediate 2,059 12.5 10.9 Employed - FT 5,255 3,338 8,593 52.1 48.0 Other 192 0.8 1.5 Small employers 860 5.2 4.7 Unemployed 189 100 289 1.8 2.9 Low supervis.& tech 748 4.5 4.9 FT Student 211 312 523 3.2 4.8Religion Semi routine 1,310 7.9 9.5 Ec. Inactive 1,776 3,119 4,895 29.7 32.6 None 7,310 31.9 36.5 Routine 714 4.3 6.6 Retired 1,141 1,692 2,833 17.2 12.4 Christian 14,328 62.5 54.8 Never worked & 278 1.7 3.2 Student 239 286 525 3.2 7.4 Other 399 1.7 3.7 long term unemp. Looking after home 37 704 741 4.5 4.4 Not answered 906 3.9 5.0 Not classified 3,966 24.0 27.2 Permanently sick 221 239 460 2.8 5.1
Other 138 198 336 2.0 3.3
Country of Birth Health - People in Households Industry of employment
Persons % Edin % Persons % Edin % Males Females Persons % Edin %
Residents 22,943 All people in HHs 22,579 All Persons 16-74 in employment 5,832 5,454 11,286 Primary 115 43 158 1.4 1.6
Scotland 19,030 82.9 77.8 Good/fair Health 21,211 93.9 92.2 Manufacturing 622 241 863 7.6 7.5England 2,286 10.0 12.1 Not good health 1,368 6.1 7.8 Construction 489 52 541 4.8 4.7rest of UK 350 1.5 1.7 Wholesale and retail trade 620 579 1,199 10.6 11.6Elswhere in Europe 504 2.2 3.4 Limiting illness 3,351 14.8 16.6 Hotels & Restaurants 291 247 538 4.8 6.5Africa 150 0.7 1.0 No limiting Illness 19,228 85.2 83.4 Transport & Communication 511 180 691 6.1 5.9Asia 321 1.4 2.3 Finance 793 900 1,693 15.0 11.3N America 158 0.7 0.9 H'holds % Edin % Business services 1,077 779 1,856 16.4 16.1S America 28 0.1 0.1 HH with 1or more Public admin/defeance 519 446 965 8.6 7.4Oceania 110 0.5 0.7 persons with illness 2,839 Education 303 717 1,020 9.0 9.3Other 6 0.0 0.0 With no carers 2,101 74.0 75.4 Health & social work 221 995 1,216 10.8 12.0
Other 271 275 546 4.8 6.1
Full Time Student - Absent in Term Time Qualifications Occupation
Males Females Persons Persons % Edin % Male Female Persons % Edin %
All students 141 155 296 All Persons 16-74 16,505 All Persons 16-74 in employment 5,832 5,454 11,286 Under 10 2 1 3 Manager & snr officials 1,319 735 2,054 18.2 14.9 10 to 14 7 7 14 Standard grade / 3,604 21.8 19.9 Professional 1,214 864 2,078 18.4 17.5 15 to 19 62 73 135 SVQ 1,2 Associate prof. & Tech. 865 931 1,796 15.9 16.2 20 to 24 66 73 139 Higher grade / 2,913 17.6 18.6 Admin. & secretarial 441 1,404 1,845 16.3 14.7 25 to 34 3 0 3 SVQ 3 Skilled Trade 670 74 744 6.6 7.1 35 plus 1 1 2 HND / SVQ 4, 5 1,052 6.4 6.0 Personal service 95 521 616 5.5 5.9
Degree 5,956 36.1 32.5 Sales & customer service 293 549 842 7.5 8.4No Qualification 2,980 18.1 22.9 Process, plant & machine op. 427 59 486 4.3 4.5
Elementary Occupations 508 317 825 7.3 10.8
Census licence number C02W0001679 City of Edinburgh Council. Produced by PSP,Corporate Services using a model devised by City Development Department, Research & Information Team.
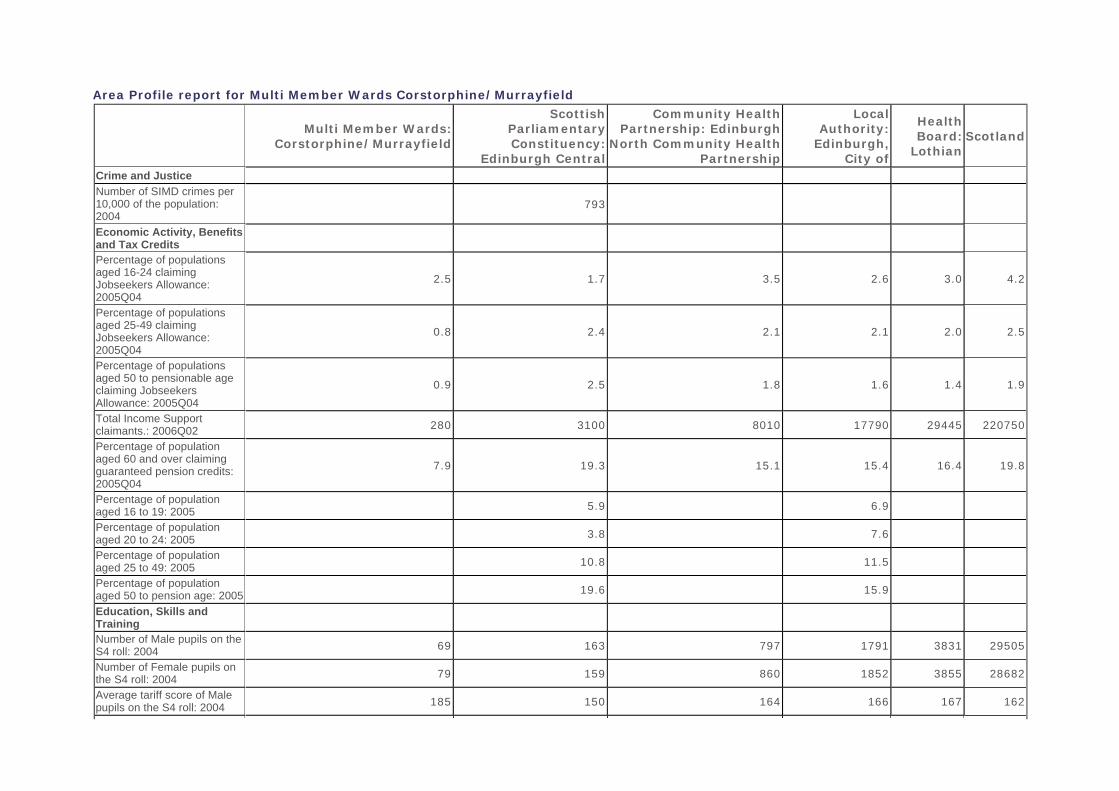
Area Profile report for Multi Member Wards Corstorphine/Murrayfield
Multi Member Wards:
Corstorphine/Murrayfield
Scottish Parliamentary Constituency:
Edinburgh Central
Community Health Partnership: Edinburgh
North Community Health Partnership
Local Authority:
Edinburgh, City of
Health Board:
Lothian Scotland
Crime and Justice Number of SIMD crimes per 10,000 of the population: 2004
793
Economic Activity, Benefits and Tax Credits
Percentage of populations aged 16-24 claiming Jobseekers Allowance: 2005Q04
2.5 1.7 3.5 2.6 3.0 4.2
Percentage of populations aged 25-49 claiming Jobseekers Allowance: 2005Q04
0.8 2.4 2.1 2.1 2.0 2.5
Percentage of populations aged 50 to pensionable age claiming Jobseekers Allowance: 2005Q04
0.9 2.5 1.8 1.6 1.4 1.9
Total Income Support claimants.: 2006Q02 280 3100 8010 17790 29445 220750
Percentage of population aged 60 and over claiming guaranteed pension credits: 2005Q04
7.9 19.3 15.1 15.4 16.4 19.8
Percentage of population aged 16 to 19: 2005 5.9 6.9
Percentage of population aged 20 to 24: 2005 3.8 7.6
Percentage of population aged 25 to 49: 2005 10.8 11.5
Percentage of population aged 50 to pension age: 2005 19.6 15.9
Education, Skills and Training
Number of Male pupils on the S4 roll: 2004 69 163 797 1791 3831 29505
Number of Female pupils on the S4 roll: 2004 79 159 860 1852 3855 28682
Average tariff score of Male pupils on the S4 roll: 2004 185 150 164 166 167 162
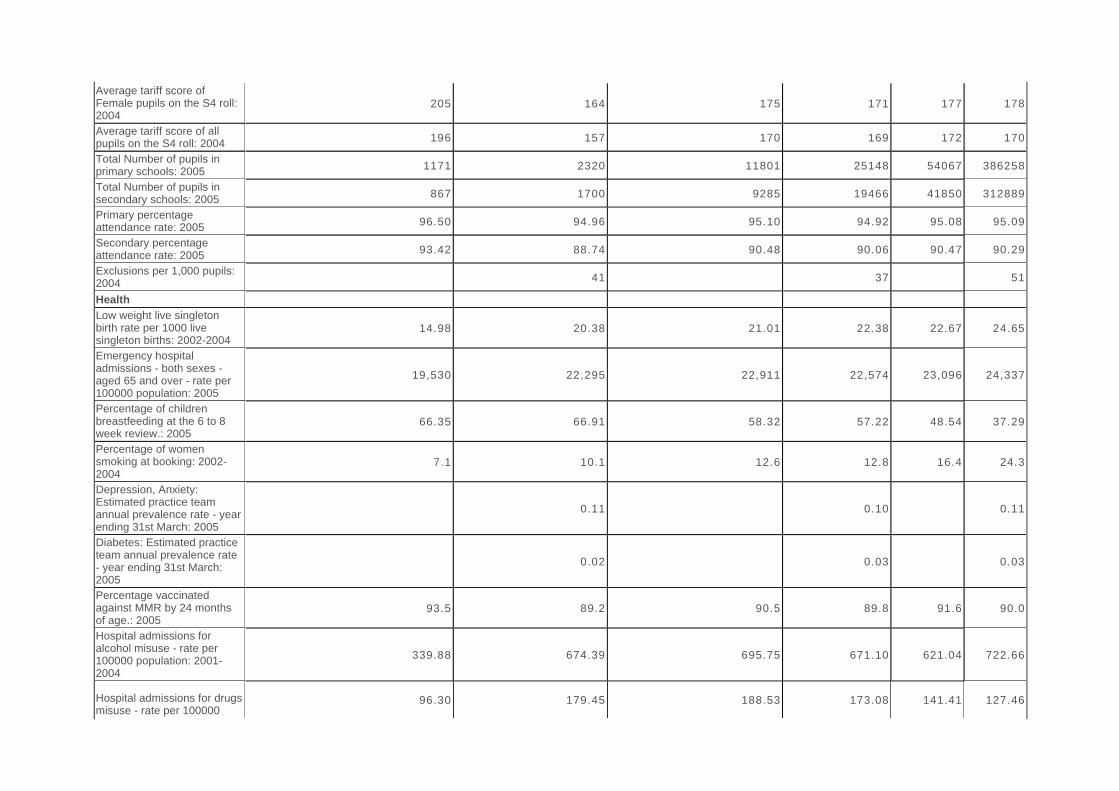
Average tariff score of Female pupils on the S4 roll: 2004
205 164 175 171 177 178
Average tariff score of all pupils on the S4 roll: 2004 196 157 170 169 172 170
Total Number of pupils in primary schools: 2005 1171 2320 11801 25148 54067 386258
Total Number of pupils in secondary schools: 2005 867 1700 9285 19466 41850 312889
Primary percentage attendance rate: 2005 96.50 94.96 95.10 94.92 95.08 95.09
Secondary percentage attendance rate: 2005 93.42 88.74 90.48 90.06 90.47 90.29
Exclusions per 1,000 pupils: 2004 41 37 51
Health Low weight live singleton birth rate per 1000 live singleton births: 2002-2004
14.98 20.38 21.01 22.38 22.67 24.65
Emergency hospital admissions - both sexes - aged 65 and over - rate per 100000 population: 2005
19,530 22,295 22,911 22,574 23,096 24,337
Percentage of children breastfeeding at the 6 to 8 week review.: 2005
66.35 66.91 58.32 57.22 48.54 37.29
Percentage of women smoking at booking: 2002-2004
7.1 10.1 12.6 12.8 16.4 24.3
Depression, Anxiety: Estimated practice team annual prevalence rate - year ending 31st March: 2005
0.11 0.10 0.11
Diabetes: Estimated practice team annual prevalence rate - year ending 31st March: 2005
0.02 0.03 0.03
Percentage vaccinated against MMR by 24 months of age.: 2005
93.5 89.2 90.5 89.8 91.6 90.0
Hospital admissions for alcohol misuse - rate per 100000 population: 2001-2004
339.88 674.39 695.75 671.10 621.04 722.66
Hospital admissions for drugs misuse - rate per 100000
96.30 179.45 188.53 173.08 141.41 127.46
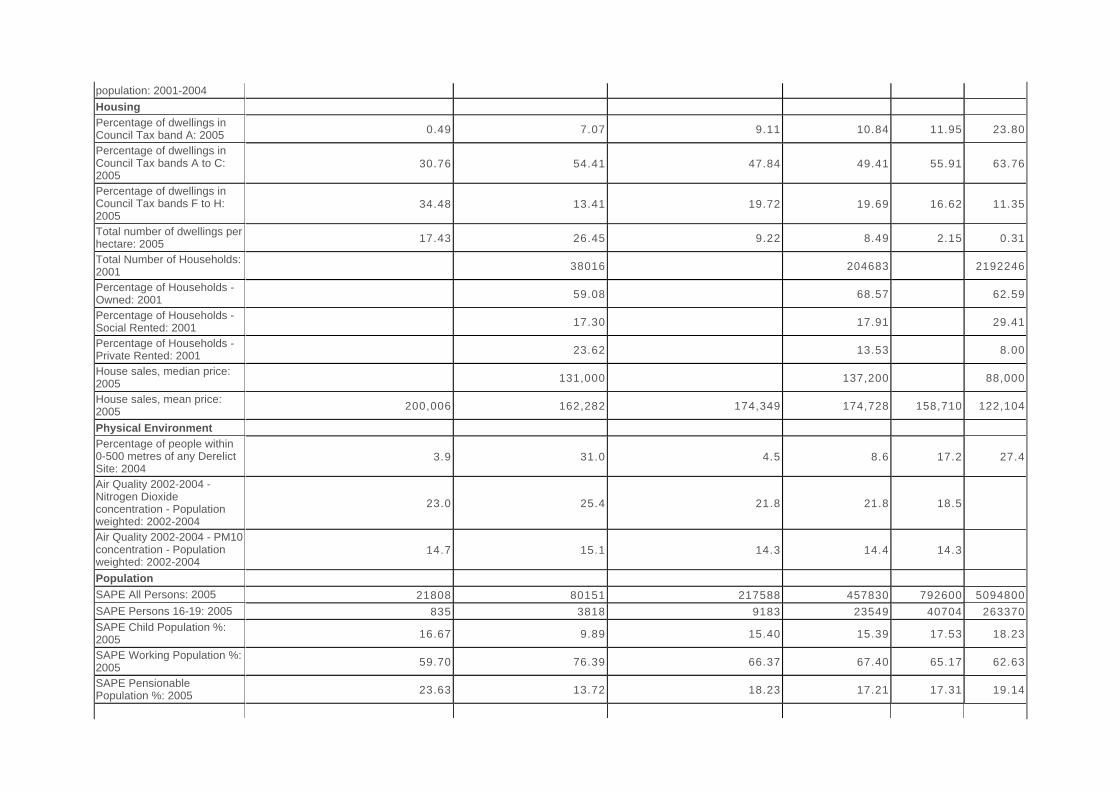
population: 2001-2004Housing Percentage of dwellings in Council Tax band A: 2005 0.49 7.07 9.11 10.84 11.95 23.80
Percentage of dwellings in Council Tax bands A to C: 2005
30.76 54.41 47.84 49.41 55.91 63.76
Percentage of dwellings in Council Tax bands F to H: 2005
34.48 13.41 19.72 19.69 16.62 11.35
Total number of dwellings per hectare: 2005 17.43 26.45 9.22 8.49 2.15 0.31
Total Number of Households: 2001 38016 204683 2192246
Percentage of Households - Owned: 2001 59.08 68.57 62.59
Percentage of Households - Social Rented: 2001 17.30 17.91 29.41
Percentage of Households - Private Rented: 2001 23.62 13.53 8.00
House sales, median price: 2005 131,000 137,200 88,000
House sales, mean price: 2005 200,006 162,282 174,349 174,728 158,710 122,104
Physical Environment Percentage of people within 0-500 metres of any Derelict Site: 2004
3.9 31.0 4.5 8.6 17.2 27.4
Air Quality 2002-2004 - Nitrogen Dioxide concentration - Population weighted: 2002-2004
23.0 25.4 21.8 21.8 18.5
Air Quality 2002-2004 - PM10 concentration - Population weighted: 2002-2004
14.7 15.1 14.3 14.4 14.3
Population SAPE All Persons: 2005 21808 80151 217588 457830 792600 5094800SAPE Persons 16-19: 2005 835 3818 9183 23549 40704 263370SAPE Child Population %: 2005 16.67 9.89 15.40 15.39 17.53 18.23
SAPE Working Population %: 2005 59.70 76.39 66.37 67.40 65.17 62.63
SAPE Pensionable Population %: 2005 23.63 13.72 18.23 17.21 17.31 19.14
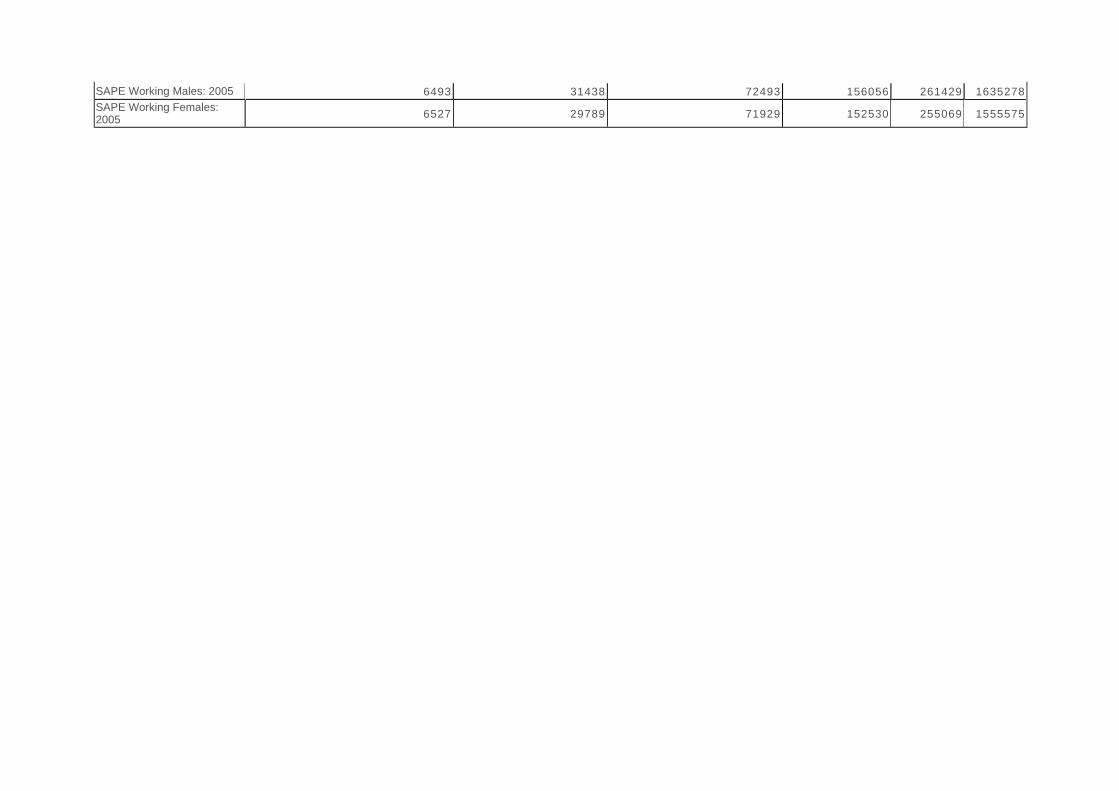
SAPE Working Males: 2005 6493 31438 72493 156056 261429 1635278SAPE Working Females: 2005 6527 29789 71929 152530 255069 1555575

Corstophine/Murrayfield ward – future developments
Planning proposals arrive in two forms: those defined in the Development Plan as opportunities for development; and, speculative proposals which have not been defined. Both can form the basis for planning applications, and just because a piece of land has been defined as suitable for a particular use, say housing, does not mean that an application for housing will be any less contentious. Below are listed the major development opportunities as defined in the city’s Local Plans. Information on current planning applications can be accessed at www.edinburgh.gov.uk/planning. From this portal you can access information on the planning system (policy documents and guidance) and search for application by address, application reference, ward, date and on a map.
HOUSING
• Pinkhill (Cala Homes) - 64 units allocated
NON-HOUSING
• None
1
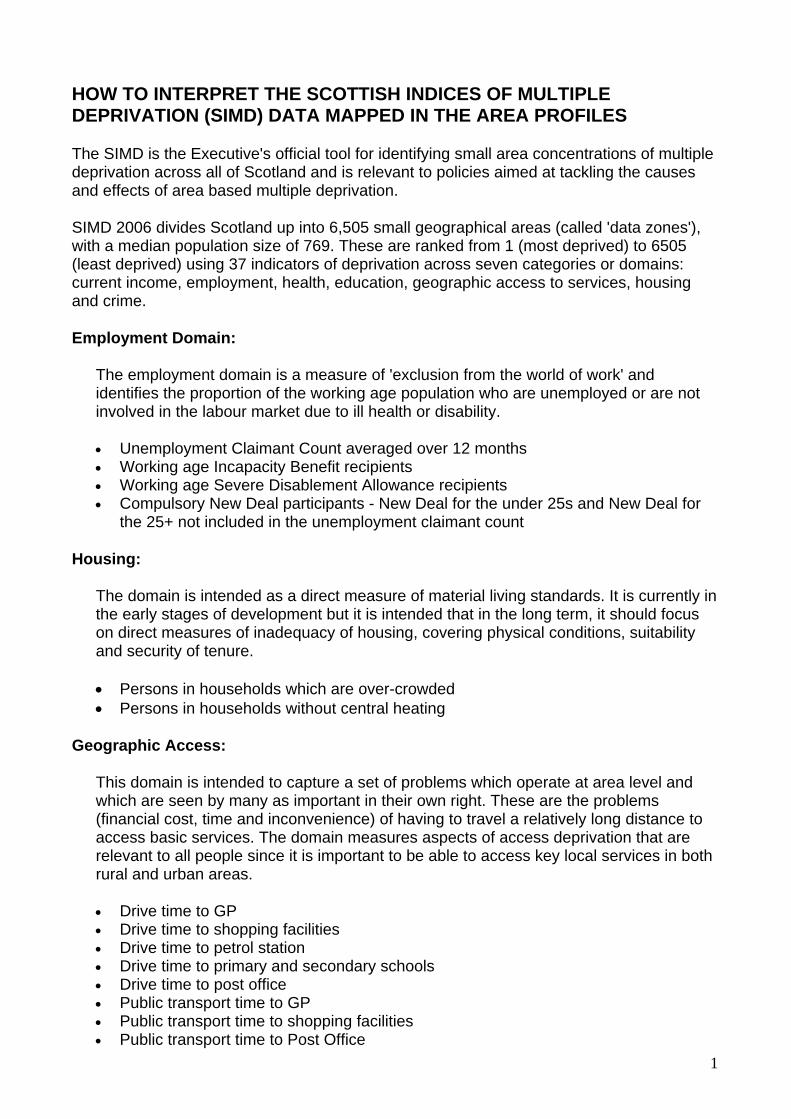
HOW TO INTERPRET THE SCOTTISH INDICES OF MULTIPLE DEPRIVATION (SIMD) DATA MAPPED IN THE AREA PROFILES
The SIMD is the Executive's official tool for identifying small area concentrations of multiple deprivation across all of Scotland and is relevant to policies aimed at tackling the causes and effects of area based multiple deprivation.
SIMD 2006 divides Scotland up into 6,505 small geographical areas (called 'data zones'), with a median population size of 769. These are ranked from 1 (most deprived) to 6505 (least deprived) using 37 indicators of deprivation across seven categories or domains: current income, employment, health, education, geographic access to services, housing and crime.
Employment Domain:
The employment domain is a measure of 'exclusion from the world of work' and identifies the proportion of the working age population who are unemployed or are not involved in the labour market due to ill health or disability.
• Unemployment Claimant Count averaged over 12 months • Working age Incapacity Benefit recipients • Working age Severe Disablement Allowance recipients • Compulsory New Deal participants - New Deal for the under 25s and New Deal for
the 25+ not included in the unemployment claimant count
Housing:
The domain is intended as a direct measure of material living standards. It is currently in the early stages of development but it is intended that in the long term, it should focus on direct measures of inadequacy of housing, covering physical conditions, suitability and security of tenure.
• Persons in households which are over-crowded • Persons in households without central heating
Geographic Access:
This domain is intended to capture a set of problems which operate at area level and which are seen by many as important in their own right. These are the problems (financial cost, time and inconvenience) of having to travel a relatively long distance to access basic services. The domain measures aspects of access deprivation that are relevant to all people since it is important to be able to access key local services in both rural and urban areas.
• Drive time to GP • Drive time to shopping facilities • Drive time to petrol station • Drive time to primary and secondary schools • Drive time to post office • Public transport time to GP • Public transport time to shopping facilities • Public transport time to Post Office
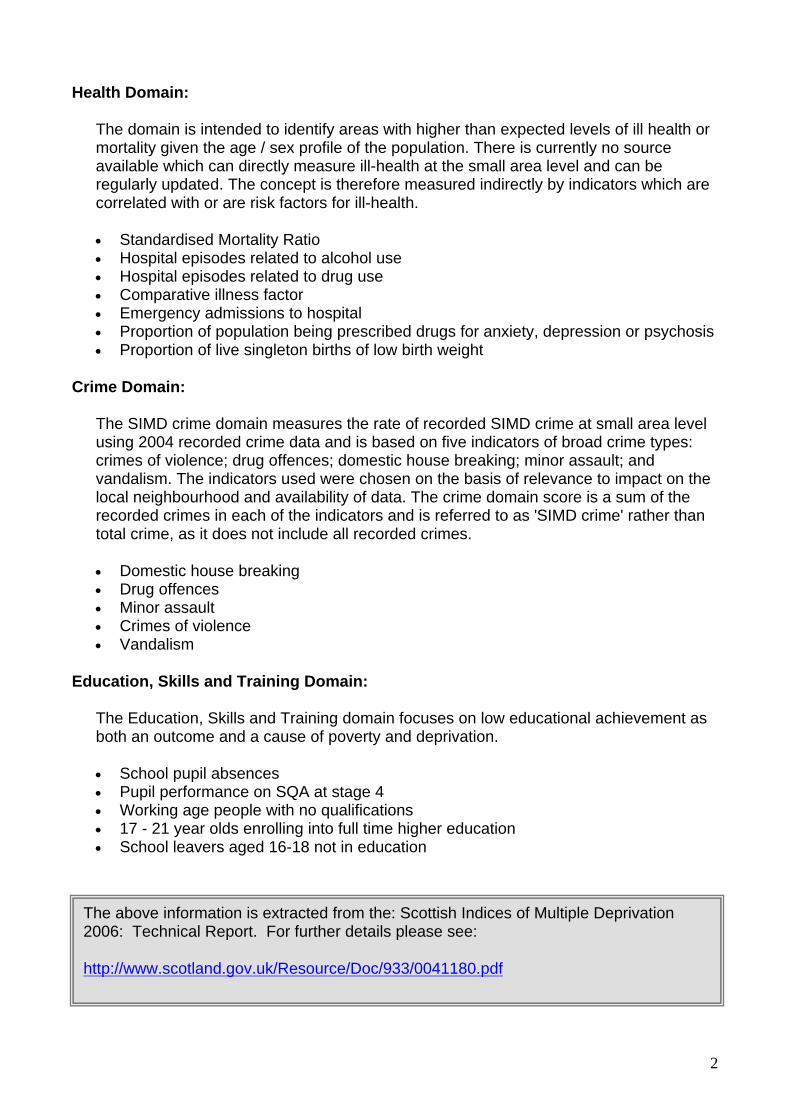
Health Domain:
The domain is intended to identify areas with higher than expected levels of ill health or mortality given the age / sex profile of the population. There is currently no source available which can directly measure ill-health at the small area level and can be regularly updated. The concept is therefore measured indirectly by indicators which are correlated with or are risk factors for ill-health.
• Standardised Mortality Ratio • Hospital episodes related to alcohol use • Hospital episodes related to drug use • Comparative illness factor • Emergency admissions to hospital • Proportion of population being prescribed drugs for anxiety, depression or psychosis • Proportion of live singleton births of low birth weight
Crime Domain:
The SIMD crime domain measures the rate of recorded SIMD crime at small area level using 2004 recorded crime data and is based on five indicators of broad crime types: crimes of violence; drug offences; domestic house breaking; minor assault; and vandalism. The indicators used were chosen on the basis of relevance to impact on the local neighbourhood and availability of data. The crime domain score is a sum of the recorded crimes in each of the indicators and is referred to as 'SIMD crime' rather than total crime, as it does not include all recorded crimes.
• Domestic house breaking • Drug offences • Minor assault • Crimes of violence • Vandalism
Education, Skills and Training Domain:
The Education, Skills and Training domain focuses on low educational achievement as both an outcome and a cause of poverty and deprivation.
• School pupil absences • Pupil performance on SQA at stage 4 • Working age people with no qualifications • 17 - 21 year olds enrolling into full time higher education • School leavers aged 16-18 not in education
The above information is extracted from the: Scottish Indices of Multiple Deprivation 2006: Technical Report. For further details please see:
http://www.scotland.gov.uk/Resource/Doc/933/0041180.pdf
2