Embed Size (px)
Citation preview
UpdatedDevelopmentFeesPinalCounty,AZDecember9,2015
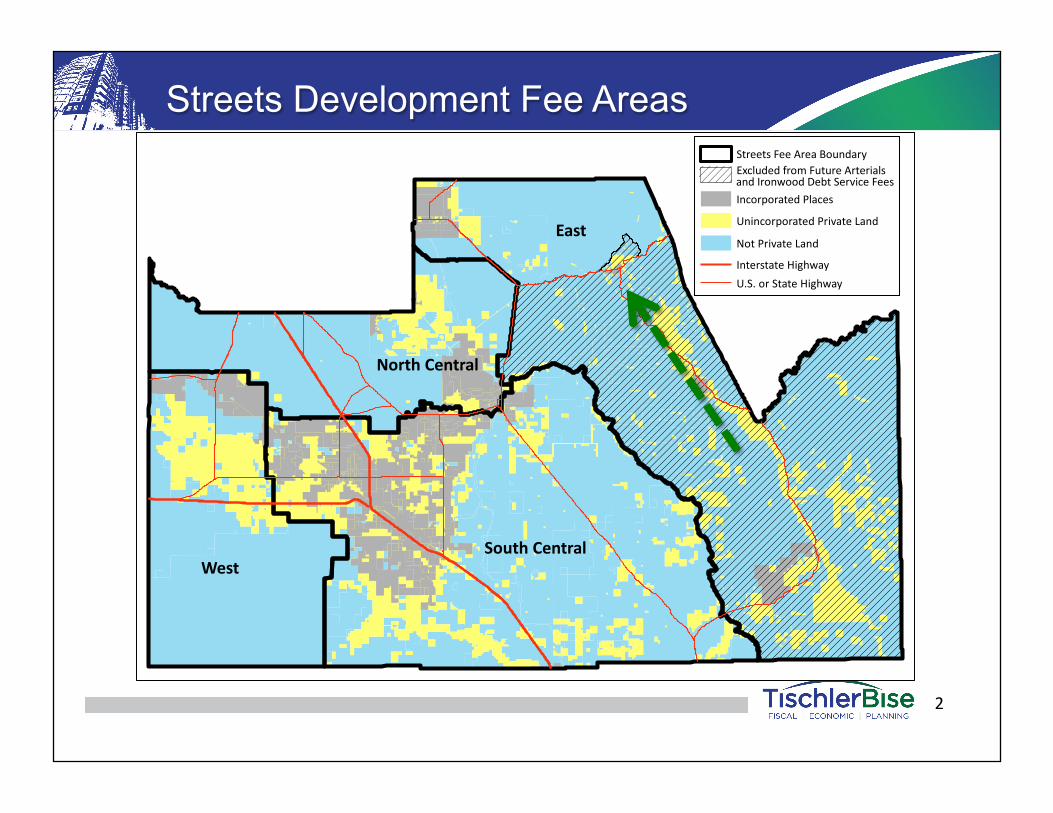
East
South Central
North Central
West
Proposed 2015 Streets Fee Area
U.S. or State Highway
Interstate Highway
Unincorporated Private Land
Not Private Land
Incorporated Places
Excluded from Future Arterials
and Ironwood Debt Service Fees
Streets Fee Area Boundary
Streets Development Fee Areas
2
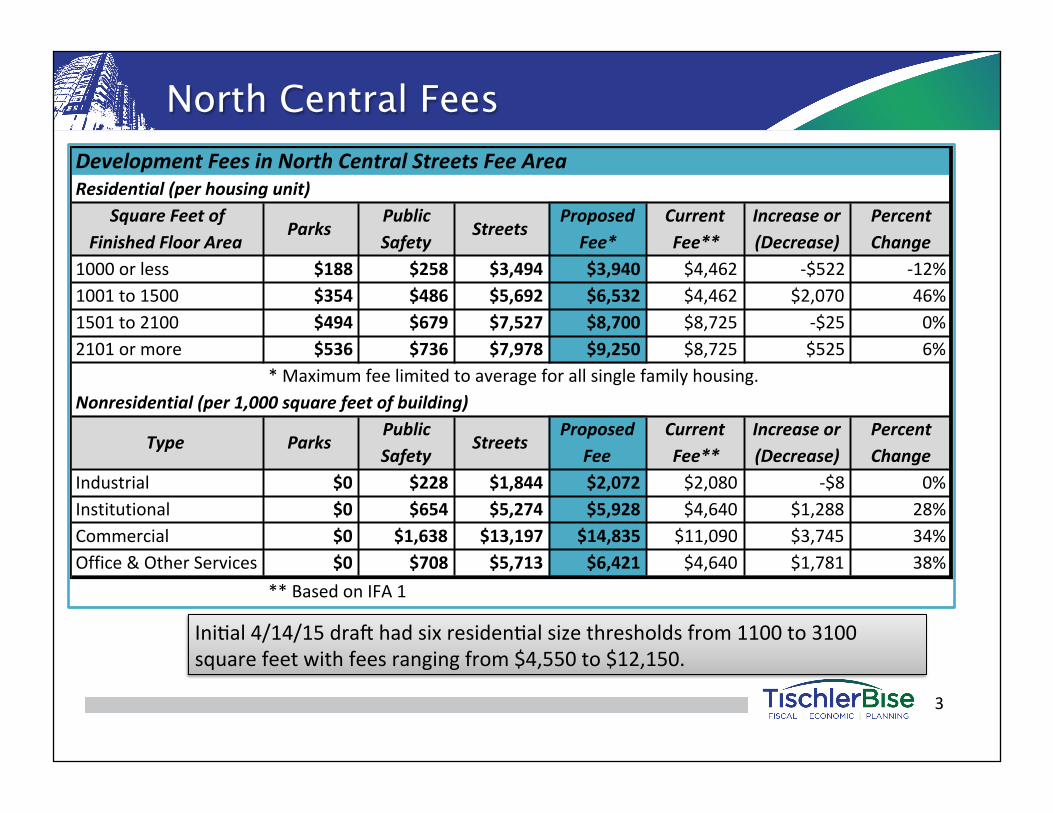
North Central Fees
IniAal4/14/15draDhadsixresidenAalsizethresholdsfrom1100to3100squarefeetwithfeesrangingfrom$4,550to$12,150.
3
DevelopmentFeesinNorthCentralStreetsFeeAreaResidential(perhousingunit)
SquareFeetofFinishedFloorArea
ParksPublicSafety
StreetsProposedFee*
CurrentFee**
Increaseor(Decrease)
PercentChange
1000orless $188 $258 $3,494 $3,940 $4,462 -$522 -12%1001to1500 $354 $486 $5,692 $6,532 $4,462 $2,070 46%1501to2100 $494 $679 $7,527 $8,700 $8,725 -$25 0%2101ormore $536 $736 $7,978 $9,250 $8,725 $525 6%
*Maximumfeelimitedtoaverageforallsinglefamilyhousing.Nonresidential(per1,000squarefeetofbuilding)
Type ParksPublicSafety
StreetsProposed
FeeCurrentFee**
Increaseor(Decrease)
PercentChange
Industrial $0 $228 $1,844 $2,072 $2,080 -$8 0%Institutional $0 $654 $5,274 $5,928 $4,640 $1,288 28%Commercial $0 $1,638 $13,197 $14,835 $11,090 $3,745 34%Office&OtherServices $0 $708 $5,713 $6,421 $4,640 $1,781 38%
**BasedonIFA1
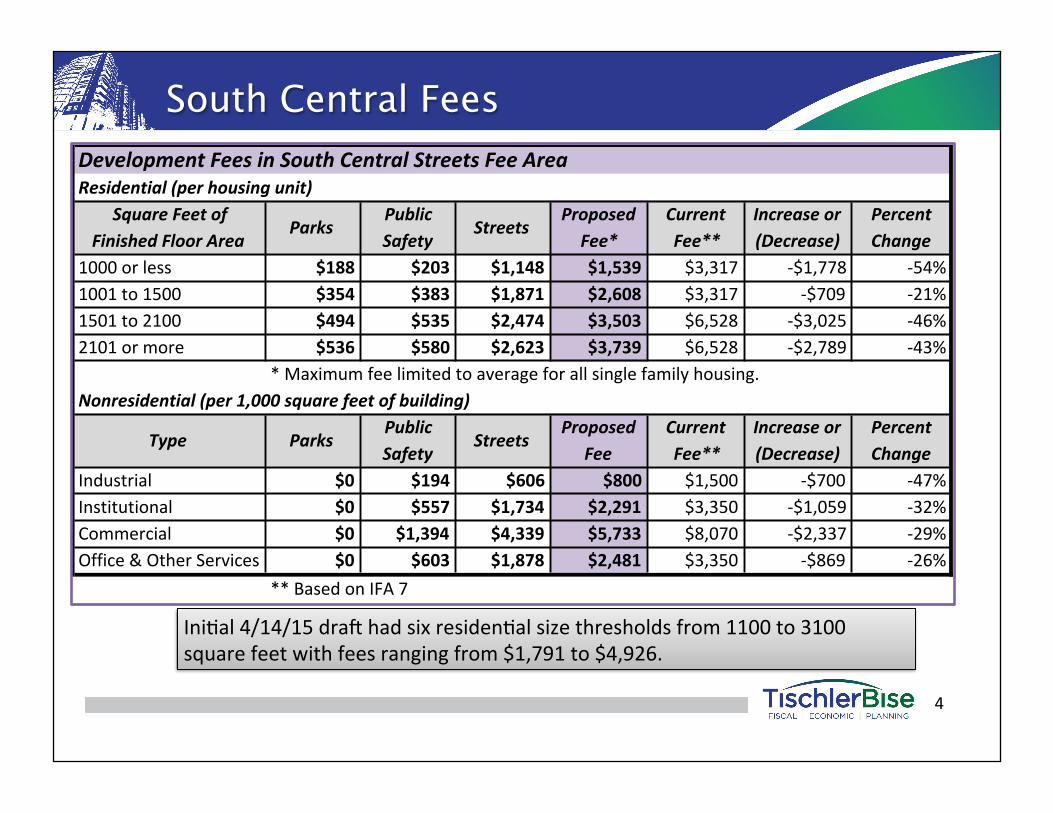
South Central Fees
IniAal4/14/15draDhadsixresidenAalsizethresholdsfrom1100to3100squarefeetwithfeesrangingfrom$1,791to$4,926.
4
DevelopmentFeesinSouthCentralStreetsFeeAreaResidential(perhousingunit)
SquareFeetofFinishedFloorArea
ParksPublicSafety
StreetsProposedFee*
CurrentFee**
Increaseor(Decrease)
PercentChange
1000orless $188 $203 $1,148 $1,539 $3,317 -$1,778 -54%1001to1500 $354 $383 $1,871 $2,608 $3,317 -$709 -21%1501to2100 $494 $535 $2,474 $3,503 $6,528 -$3,025 -46%2101ormore $536 $580 $2,623 $3,739 $6,528 -$2,789 -43%
*Maximumfeelimitedtoaverageforallsinglefamilyhousing.Nonresidential(per1,000squarefeetofbuilding)
Type ParksPublicSafety
StreetsProposed
FeeCurrentFee**
Increaseor(Decrease)
PercentChange
Industrial $0 $194 $606 $800 $1,500 -$700 -47%Institutional $0 $557 $1,734 $2,291 $3,350 -$1,059 -32%Commercial $0 $1,394 $4,339 $5,733 $8,070 -$2,337 -29%Office&OtherServices $0 $603 $1,878 $2,481 $3,350 -$869 -26%
**BasedonIFA7
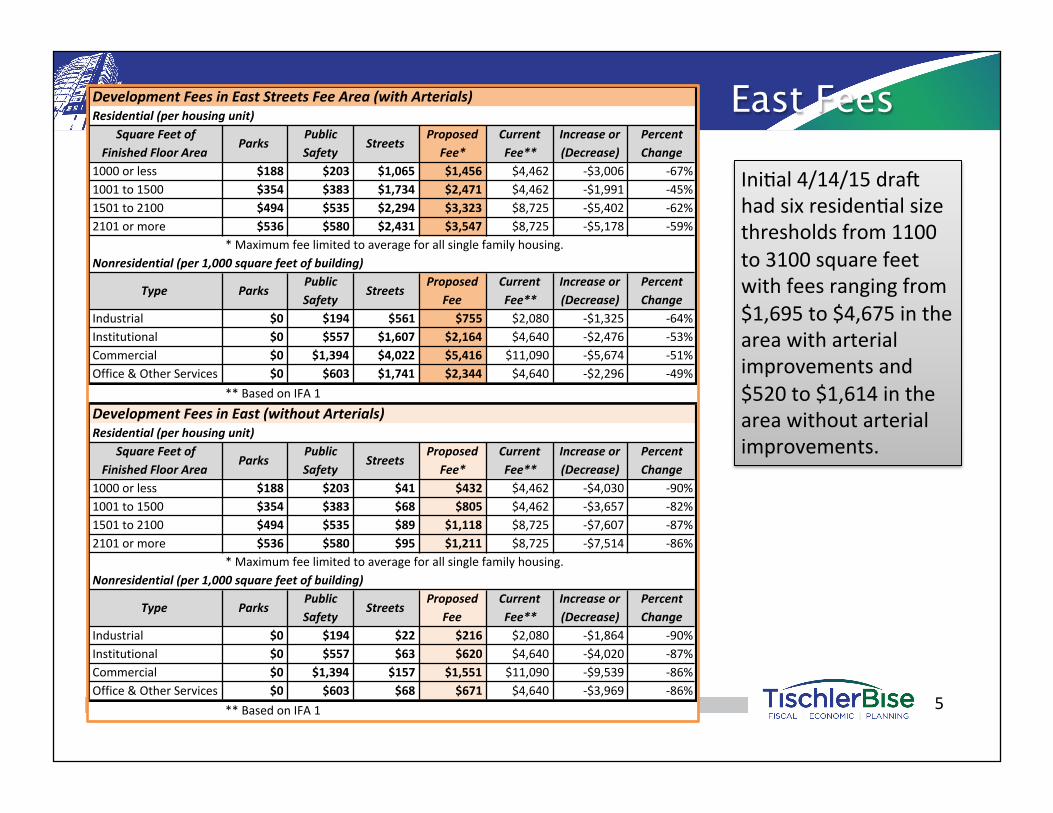
East Fees
IniAal4/14/15draDhadsixresidenAalsizethresholdsfrom1100to3100squarefeetwithfeesrangingfrom$1,695to$4,675intheareawitharterialimprovementsand$520to$1,614intheareawithoutarterialimprovements.
5
DevelopmentFeesinEastStreetsFeeArea(withArterials)Residential(perhousingunit)
SquareFeetofFinishedFloorArea
ParksPublicSafety
StreetsProposedFee*
CurrentFee**
Increaseor(Decrease)
PercentChange
1000orless $188 $203 $1,065 $1,456 $4,462 -$3,006 -67%1001to1500 $354 $383 $1,734 $2,471 $4,462 -$1,991 -45%1501to2100 $494 $535 $2,294 $3,323 $8,725 -$5,402 -62%2101ormore $536 $580 $2,431 $3,547 $8,725 -$5,178 -59%
*Maximumfeelimitedtoaverageforallsinglefamilyhousing.Nonresidential(per1,000squarefeetofbuilding)
Type ParksPublicSafety
StreetsProposed
FeeCurrentFee**
Increaseor(Decrease)
PercentChange
Industrial $0 $194 $561 $755 $2,080 -$1,325 -64%Institutional $0 $557 $1,607 $2,164 $4,640 -$2,476 -53%Commercial $0 $1,394 $4,022 $5,416 $11,090 -$5,674 -51%Office&OtherServices $0 $603 $1,741 $2,344 $4,640 -$2,296 -49%
**BasedonIFA1DevelopmentFeesinEast(withoutArterials)Residential(perhousingunit)
SquareFeetofFinishedFloorArea
ParksPublicSafety
StreetsProposedFee*
CurrentFee**
Increaseor(Decrease)
PercentChange
1000orless $188 $203 $41 $432 $4,462 -$4,030 -90%1001to1500 $354 $383 $68 $805 $4,462 -$3,657 -82%1501to2100 $494 $535 $89 $1,118 $8,725 -$7,607 -87%2101ormore $536 $580 $95 $1,211 $8,725 -$7,514 -86%
*Maximumfeelimitedtoaverageforallsinglefamilyhousing.Nonresidential(per1,000squarefeetofbuilding)
Type ParksPublicSafety
StreetsProposed
FeeCurrentFee**
Increaseor(Decrease)
PercentChange
Industrial $0 $194 $22 $216 $2,080 -$1,864 -90%Institutional $0 $557 $63 $620 $4,640 -$4,020 -87%Commercial $0 $1,394 $157 $1,551 $11,090 -$9,539 -86%Office&OtherServices $0 $603 $68 $671 $4,640 -$3,969 -86%
**BasedonIFA1
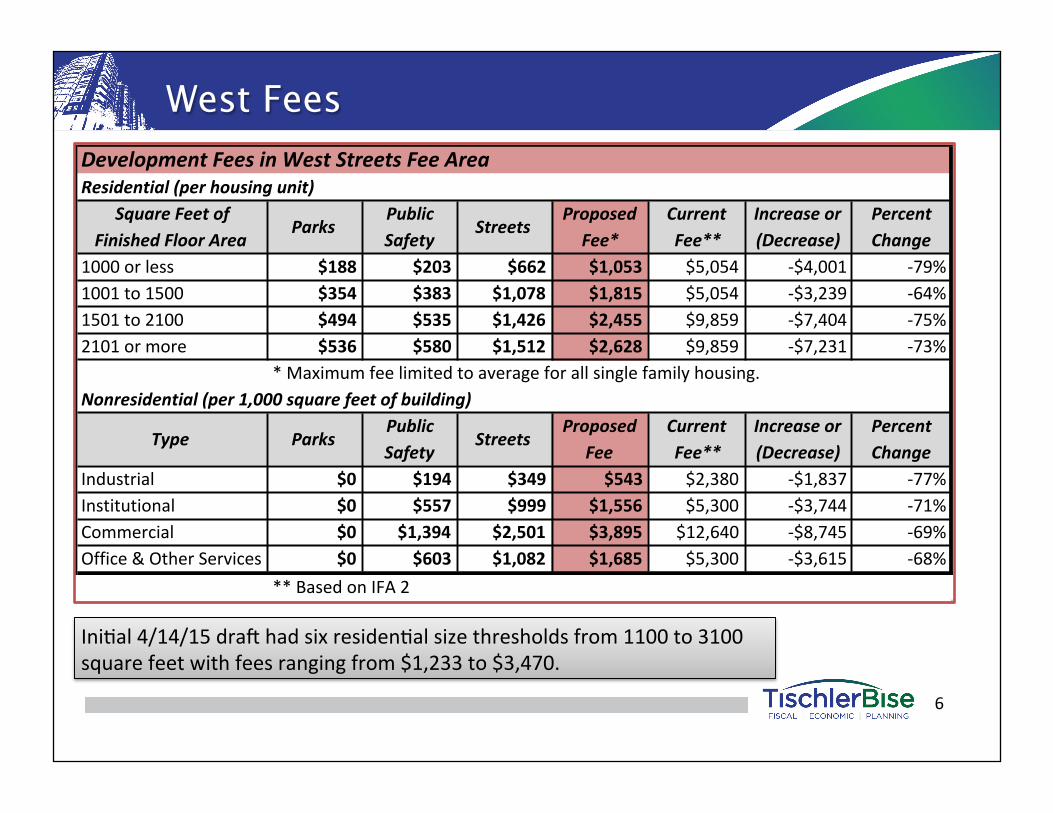
West Fees
IniAal4/14/15draDhadsixresidenAalsizethresholdsfrom1100to3100squarefeetwithfeesrangingfrom$1,233to$3,470.
6
DevelopmentFeesinWestStreetsFeeAreaResidential(perhousingunit)
SquareFeetofFinishedFloorArea
ParksPublicSafety
StreetsProposedFee*
CurrentFee**
Increaseor(Decrease)
PercentChange
1000orless $188 $203 $662 $1,053 $5,054 -$4,001 -79%1001to1500 $354 $383 $1,078 $1,815 $5,054 -$3,239 -64%1501to2100 $494 $535 $1,426 $2,455 $9,859 -$7,404 -75%2101ormore $536 $580 $1,512 $2,628 $9,859 -$7,231 -73%
*Maximumfeelimitedtoaverageforallsinglefamilyhousing.Nonresidential(per1,000squarefeetofbuilding)
Type ParksPublicSafety
StreetsProposed
FeeCurrentFee**
Increaseor(Decrease)
PercentChange
Industrial $0 $194 $349 $543 $2,380 -$1,837 -77%Institutional $0 $557 $999 $1,556 $5,300 -$3,744 -71%Commercial $0 $1,394 $2,501 $3,895 $12,640 -$8,745 -69%Office&OtherServices $0 $603 $1,082 $1,685 $5,300 -$3,615 -68%
**BasedonIFA2
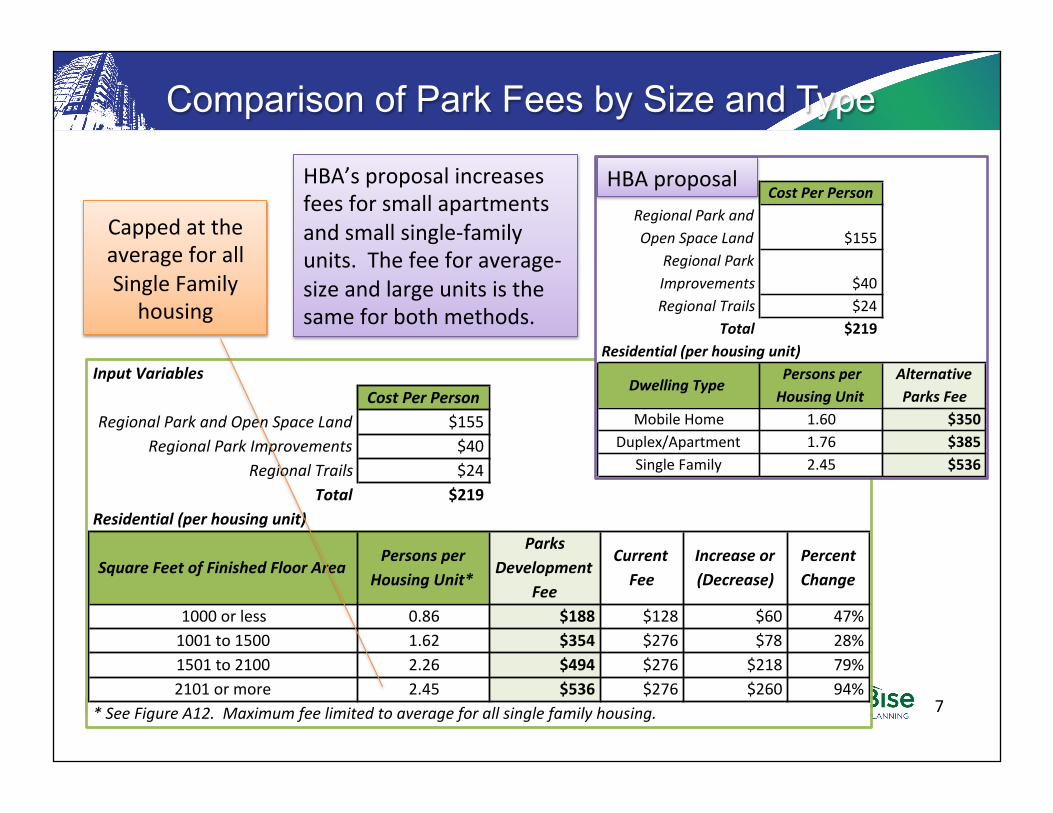
InputVariablesCostPerPerson
RegionalParkandOpenSpaceLand $155RegionalParkImprovements $40
RegionalTrails $24Total $219
Residential(perhousingunit)
SquareFeetofFinishedFloorAreaPersonsper
HousingUnit*
ParksDevelopment
Fee
CurrentFee
Increaseor(Decrease)
PercentChange
1000orless 0.86 $188 $128 $60 47%1001to1500 1.62 $354 $276 $78 28%1501to2100 2.26 $494 $276 $218 79%2101ormore 2.45 $536 $276 $260 94%
*SeeFigureA12.Maximumfeelimitedtoaverageforallsinglefamilyhousing.
Comparison of Park Fees by Size and Type
HBA’sproposalincreasesfeesforsmallapartmentsandsmallsingle-familyunits.Thefeeforaverage-sizeandlargeunitsisthesameforbothmethods.
InputVariablesCostPerPerson
RegionalParkandOpenSpaceLand $155
RegionalParkImprovements $40RegionalTrails $24
Total $219Residential(perhousingunit)
DwellingTypePersonsperHousingUnit
AlternativeParksFee
MobileHome 1.60 $350Duplex/Apartment 1.76 $385
SingleFamily 2.45 $536
7
HBAproposal
CappedattheaverageforallSingleFamily
housing
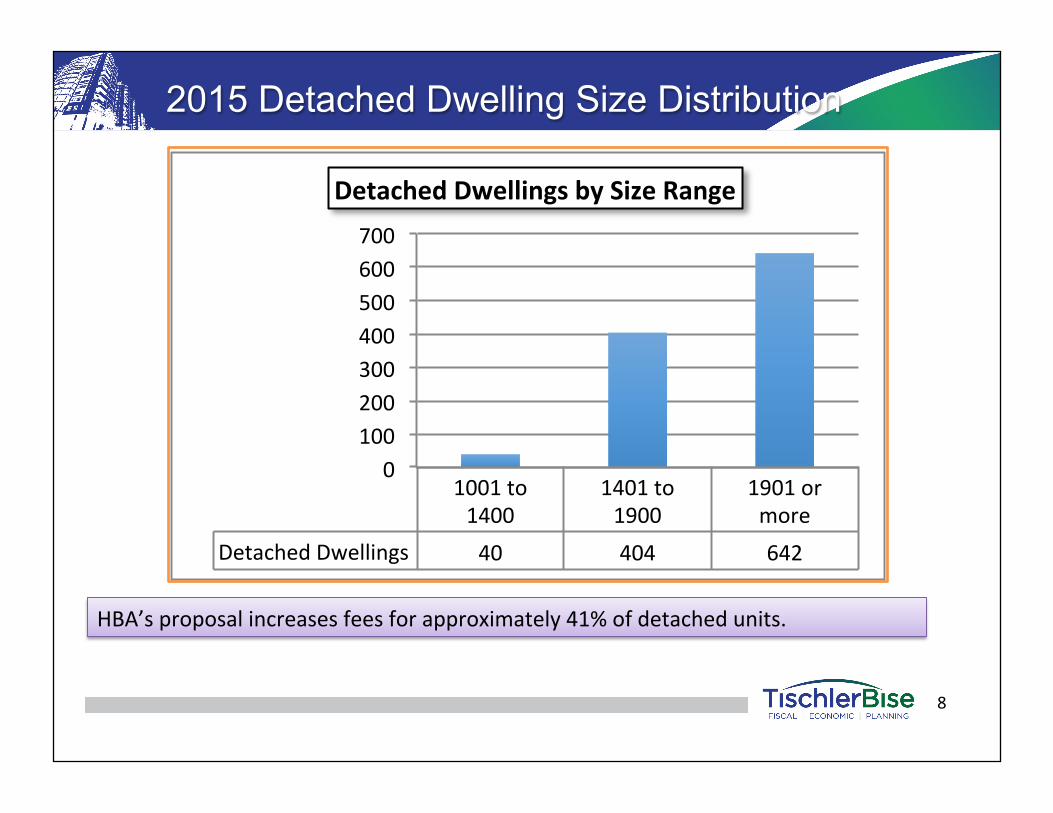
2015 Detached Dwelling Size Distribution
1001to1400
1401to1900
1901ormore
DetachedDwellings 40 404 642
0100200300400500600700
DetachedDwellingsbySizeRange
HBA’sproposalincreasesfeesforapproximately41%ofdetachedunits.
8
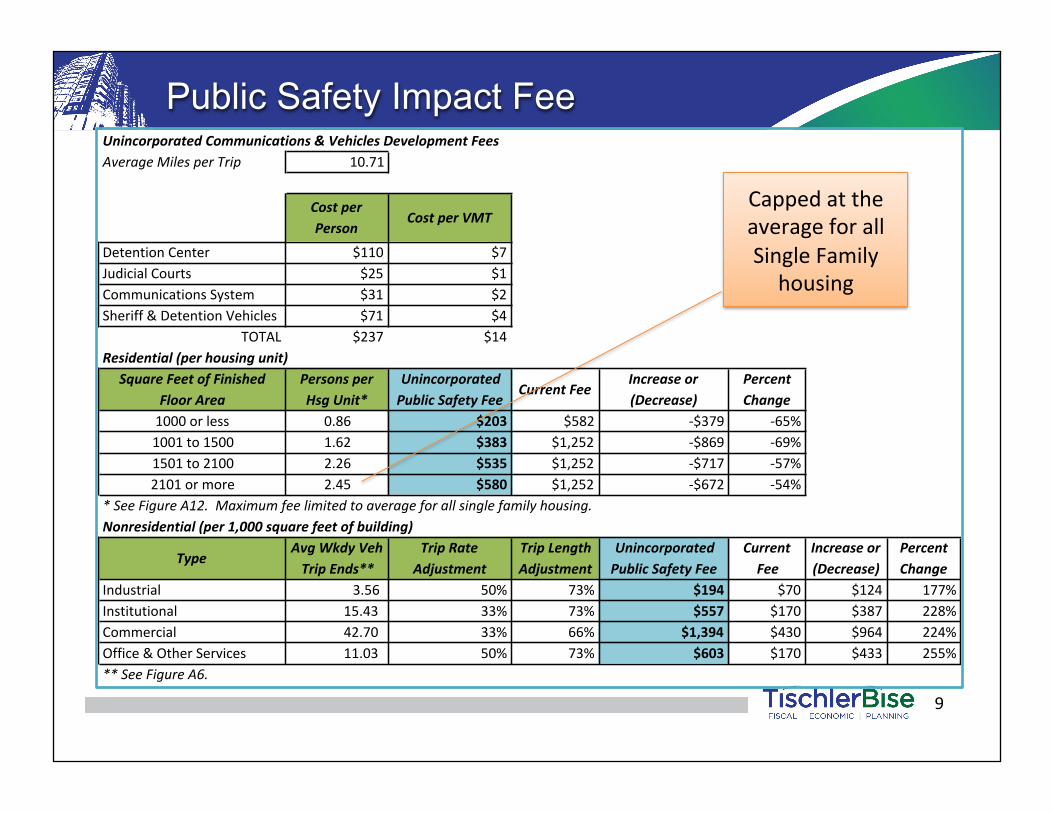
Public Safety Impact Fee
9
UnincorporatedCommunications&VehiclesDevelopmentFeesAverageMilesperTrip 10.71
CostperPerson
CostperVMT
DetentionCenter $110 $7JudicialCourts $25 $1CommunicationsSystem $31 $2Sheriff&DetentionVehicles $71 $4
TOTAL $237 $14Residential(perhousingunit)
SquareFeetofFinishedFloorArea
PersonsperHsgUnit*
UnincorporatedPublicSafetyFee
CurrentFeeIncreaseor(Decrease)
PercentChange
1000orless 0.86 $203 $582 -$379 -65%1001to1500 1.62 $383 $1,252 -$869 -69%1501to2100 2.26 $535 $1,252 -$717 -57%2101ormore 2.45 $580 $1,252 -$672 -54%
*SeeFigureA12.Maximumfeelimitedtoaverageforallsinglefamilyhousing.Nonresidential(per1,000squarefeetofbuilding)
TypeAvgWkdyVehTripEnds**
TripRateAdjustment
TripLengthAdjustment
UnincorporatedPublicSafetyFee
CurrentFee
Increaseor(Decrease)
PercentChange
Industrial 3.56 50% 73% $194 $70 $124 177%Institutional 15.43 33% 73% $557 $170 $387 228%Commercial 42.70 33% 66% $1,394 $430 $964 224%Office&OtherServices 11.03 50% 73% $603 $170 $433 255%**SeeFigureA6.
CappedattheaverageforallSingleFamily
housing
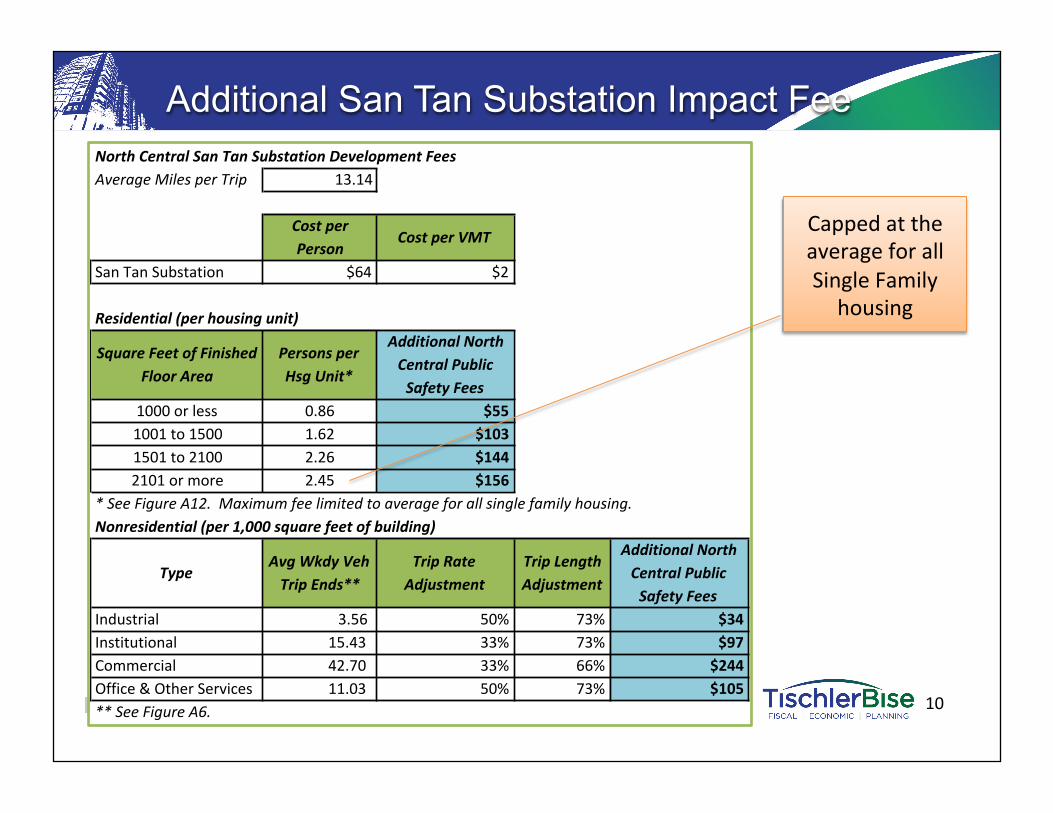
Additional San Tan Substation Impact Fee
10
NorthCentralSanTanSubstationDevelopmentFees
AverageMilesperTrip 13.14
Costper
PersonCostperVMT
SanTanSubstation $64 $2
Residential(perhousingunit)
SquareFeetofFinished
FloorArea
Personsper
HsgUnit*
AdditionalNorth
CentralPublic
SafetyFees
1000orless 0.86 $551001to1500 1.62 $1031501to2100 2.26 $1442101ormore 2.45 $156
*SeeFigureA12.Maximumfeelimitedtoaverageforallsinglefamilyhousing.Nonresidential(per1,000squarefeetofbuilding)
TypeAvgWkdyVeh
TripEnds**
TripRate
Adjustment
TripLength
Adjustment
AdditionalNorth
CentralPublic
SafetyFees
Industrial 3.56 50% 73% $34Institutional 15.43 33% 73% $97Commercial 42.70 33% 66% $244Office&OtherServices 11.03 50% 73% $105**SeeFigureA6.
CappedattheaverageforallSingleFamily
housing
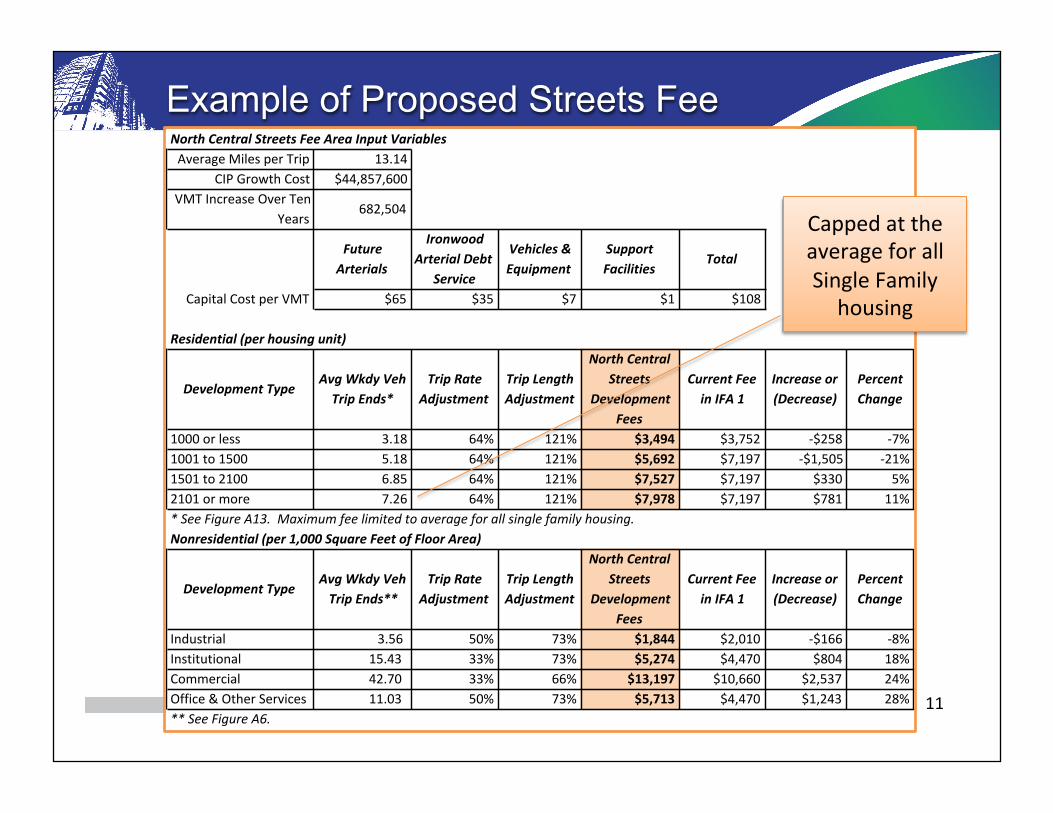
Example of Proposed Streets Fee
11
NorthCentralStreetsFeeAreaInputVariablesAverageMilesperTrip 13.14
CIPGrowthCost $44,857,600
VMTIncreaseOverTen
Years682,504
FutureArterials
IronwoodArterialDebt
Service
Vehicles&Equipment
SupportFacilities
Total
CapitalCostperVMT $65 $35 $7 $1 $108
Residential(perhousingunit)
DevelopmentTypeAvgWkdyVehTripEnds*
TripRateAdjustment
TripLengthAdjustment
NorthCentralStreets
DevelopmentFees
CurrentFeeinIFA1
Increaseor(Decrease)
PercentChange
1000orless 3.18 64% 121% $3,494 $3,752 -$258 -7%
1001to1500 5.18 64% 121% $5,692 $7,197 -$1,505 -21%
1501to2100 6.85 64% 121% $7,527 $7,197 $330 5%
2101ormore 7.26 64% 121% $7,978 $7,197 $781 11%
*SeeFigureA13.Maximumfeelimitedtoaverageforallsinglefamilyhousing.Nonresidential(per1,000SquareFeetofFloorArea)
DevelopmentTypeAvgWkdyVehTripEnds**
TripRateAdjustment
TripLengthAdjustment
NorthCentralStreets
DevelopmentFees
CurrentFeeinIFA1
Increaseor(Decrease)
PercentChange
Industrial 3.56 50% 73% $1,844 $2,010 -$166 -8%
Institutional 15.43 33% 73% $5,274 $4,470 $804 18%
Commercial 42.70 33% 66% $13,197 $10,660 $2,537 24%
Office&OtherServices 11.03 50% 73% $5,713 $4,470 $1,243 28%
**SeeFigureA6.
CappedattheaverageforallSingleFamily
housing