Embed Size (px)
Citation preview

Updated 8-15-17

For assistance with any TRAINING needs, please contact:
BEST SHARED SERVICES
Phone - (Raleigh area): (919) 707-0707
Phone - (Toll Free): (866) 622-3784
Email: BEST @osc.nc.gov
Web: https://www.osc.nc.gov/state-agency-resources/training
North Carolina Office of the State Controller
Linda Combs, State Controller
Business Objects Reporting Table of Contents
BOBJ410
updated 8-15-17 North Carolina Office of the State Controller Page i
TABLE OF CONTENTS
INTRODUCTION ................................................................................................. 1
Definitions and Launch Pad ....................................................................................................................1
Prerequisites .................................................................................................................................................1
Integrated HR/Payroll Training Curriculum ......................................................................................1
Strategy for Training .................................................................................................................................2
Course Map ..................................................................................................................................................2
Course Objectives ......................................................................................................................................3
Reference Materials ...................................................................................................................................3
BUSINESS OBJECT DEFINITIONS AND LAUNCH PAD ............................................... 5
Objectives .....................................................................................................................................................5
What is Business Objects? .......................................................................................................................5
Components of BOBJ ................................................................................................................................5
Report Icon Designation ..........................................................................................................................5
Dashboard................................................................................................................................................................. 6
Crystal Reports ........................................................................................................................................................ 6
Web Intelligence (WEBI) ...................................................................................................................................... 6
Tips ..................................................................................................................................................................6
Accessing Business Objects ....................................................................................................................7
Launch Pad ...................................................................................................................................................7
Screen Components of Launch Pad ....................................................................................................8
Navigation Tabs ...................................................................................................................................................... 8
Navigation Panel ................................................................................................................................................. 10
Workspace Panel ................................................................................................................................................. 12
Details Panel .......................................................................................................................................................... 12
Working with Documents on Launch Pad ...................................................................................... 13
Search for a Document ..................................................................................................................................... 13
Create New Folder in My Favorites Folder ................................................................................................ 15
Table of Contents Business Objects Reporting
BOBJ410
Page ii North Carolina Office of the State Controller updated 8-15-17
Create a Shortcut to a Document ................................................................................................................. 16
Opening Objects or Reports from Launch Pad (Public Folders) ........................................................ 21
Pin a Report for Future Viewing......................................................................................................... 21
Close a Report .......................................................................................................................................... 21
Help Folder ................................................................................................................................................ 22
Logging Off ............................................................................................................................................... 22
BUSINESS OBJECTS - DASHBOARD REPORTS ...................................................... 23
Objectives .................................................................................................................................................. 23
Definition of Dashboard Reports ...................................................................................................... 23
Components of Dashboard Reports ................................................................................................ 24
To Open and View a Dashboard Report ......................................................................................... 24
BUSINESS OBJECTS - CRYSTAL REPORTS ............................................................ 29
Objectives .................................................................................................................................................. 29
Definition of Crystal Reports ............................................................................................................... 29
To Open and View a Crystal Report ................................................................................................. 29
Navigation Panel ..................................................................................................................................... 34
Toolbar Elements ..................................................................................................................................... 36
Prompt Selections for Organizational Units and Dates............................................................. 39
Selecting Organizational Unit(s) on Prompts Box ................................................................................... 39
Selecting Dates on Prompts Box ................................................................................................................... 41
BUSINESS OBJECTS - WEB INTELLIGENCE READING MODE ................................... 45
Objectives .................................................................................................................................................. 45
Definition of Web Intelligence ........................................................................................................... 45
To Open and View a Web Intelligence Report ............................................................................. 45
Web Intelligence Modes of Review .................................................................................................. 50
Reading Mode .......................................................................................................................................... 50
Toolbar Menu ....................................................................................................................................................... 50
Status Bar ............................................................................................................................................................... 57
Navigation Panel ................................................................................................................................................. 58
Business Objects Reporting Table of Contents
BOBJ410
updated 8-15-17 North Carolina Office of the State Controller Page iii
BUSINESS OBJECTS - WEB INTELLIGENCE DESIGN MODE ..................................... 61
Objectives .................................................................................................................................................. 61
Design Mode ............................................................................................................................................ 61
Toolbars .................................................................................................................................................................. 61
Status Bar ............................................................................................................................................................... 66
Navigation Left Side Panel ............................................................................................................................... 67
Adding Objects to a Report ................................................................................................................ 70
Adding Columns, Creating Formulas, and Creating Variables ................................................ 74
Adding Columns .................................................................................................................................................. 74
Creating a Formula ............................................................................................................................................. 75
Creating a Variable ............................................................................................................................................. 79
Formatting Numbers ............................................................................................................................. 81
Freeze Columns/Rows ........................................................................................................................... 83
Creating a Table ....................................................................................................................................... 85
Dragging and Dropping Method for Creating a Table ......................................................................... 85
Choosing Table Layout Method for Creating Table ............................................................................... 87
Resizing Columns and Rows ........................................................................................................................... 90
Adding a Header to a Table ............................................................................................................................ 90
Adding a Chart to Report ..................................................................................................................... 93
Adding a Title to a Chart .................................................................................................................................. 97
Formatting Chart Areas ................................................................................................................................... 100
Changing Data Objects in a Chart .............................................................................................................. 103
Filtering Data .......................................................................................................................................... 104
Creating Input Controls using Dimensions ............................................................................................. 105
Creating Input Controls using Measures .................................................................................................. 112
Creating Sections and Breaks ........................................................................................................... 116
Creating a Section ............................................................................................................................................. 116
Creating a Break ................................................................................................................................................ 117
Calculating Totals and Subtotals ..................................................................................................... 119
Exporting the report ............................................................................................................................. 121
Table of Contents Business Objects Reporting
BOBJ410
Page iv North Carolina Office of the State Controller updated 8-15-17
Printing the Report ............................................................................................................................... 123
Save As ...................................................................................................................................................... 124
Creating a Variant ................................................................................................................................. 126
COURSE REVIEW ........................................................................................... 129
Objectives ................................................................................................................................................ 129
Next Steps ................................................................................................................................................ 129
Course Assessment/Evaluation ........................................................................................................ 130
Business Objects Reporting Introduction
BOBJ410
updated 8-15-17 North Carolina Office of the State Controller Page 1
Definitions and Launch Pad
Welcome to the Business Objects, also known as BOBJ, training course. BOBJ is a suite of front-
end applications from SAP that allows business users to view, sort, and analyze business
intelligence data.
Prerequisites
This BOBJ410 student guide includes the required materials for all Business Objects courses
including the four online video prerequisites as well as for the instructor-led class.
BOBJ200 Definition and Launch Pad
BOBJ210 Dashboard
BOBJ220 Crystal
BOBJ230 WEBI Read
The course introduction for the BOBJ410 ILT class is an opportunity to get to know others who
are attending class as well as to agree on classroom courtesy. The instructor will inform you
about the building facilities and when breaks will occur.
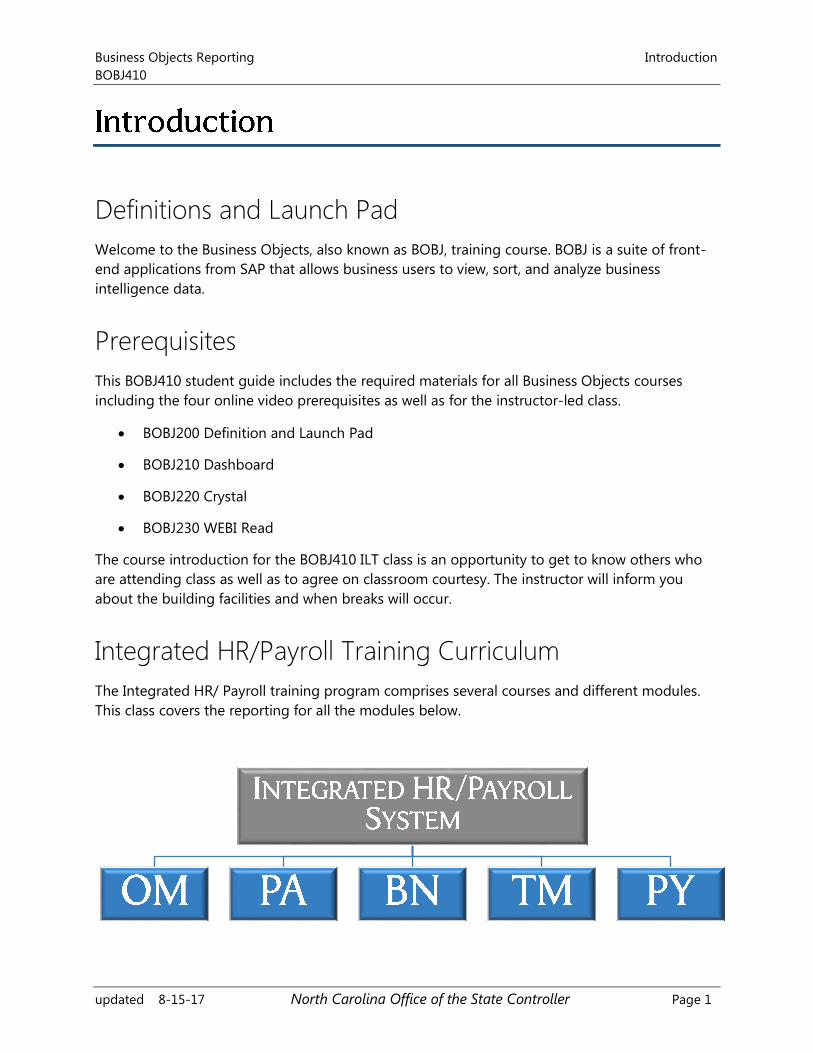
Integrated HR/Payroll Training Curriculum
The Integrated HR/ Payroll training program comprises several courses and different modules.
This class covers the reporting for all the modules below.
Introduction Business Objects Reporting
BOBJ410
Page 2 North Carolina Office of the State Controller updated 8-15-17
Strategy for Training
TELL ME (Concepts)
Instructor will discuss the process, responsibilities, and describe the transactions – LISTEN
SHOW ME (Demonstrations)
Instructor will demonstrate job-related tasks performed in the Integrated HR/Payroll System –
HANDS OFF.
LET ME (Exercises)
Student will complete the exercises which allows for hands-on practice in class – HANDS ON
SUPPORT ME (Availability)
Instructor will be available to answer questions while the students complete the exercises
Course Map
The lessons covered in this class include:
Lesson 1: Business Objects Definitions and Launch Pad
Lesson 2: Dashboard Reports
Lesson 3: Crystal Reports
Lesson 4: Web Intelligence - Reading Mode
Lesson 5: Web Intelligence - Design Mode
Lesson 6: Course Review
Business Objects Reporting Introduction
BOBJ410
updated 8-15-17 North Carolina Office of the State Controller Page 3
Course Objectives
Upon completion of this course, you should be able to:
Understand the definition of Business Objects
Understand the definition of Launch Pad and the components
Understand the definition and view of Dashboard Reports
Understand the definition and view of Crystal Reports
Understand the definition of Web Intelligence Reports
Open a WEBI report and change to design mode to analyze and explore data
Add columns and Variables to WEBI Reports
Add Tables and Charts to WEBI Reports
Save a WEBI report to My Favorites Folder for future access
Reference Materials
The materials below can be accessed through the OSC website. Use the following link to access
the OSC website:
https://www.osc.nc.gov/state-agencies
HR/Payroll Customer Service site:
System Status - This link will be used to announce data load issues and report
migrations. The system status page should be checked if you are experiencing any
problems or issues with the BOBJ reports or access to see if it is a known issue before
contacting BEST to record an incident ticket. This link is located on the OSC Training
website.
OSC Training site
Integrated HR/Payroll System Course - This site will provide you a list of the BOBJ
courses and links to the course descriptions as well as training materials.
Help Documents - This site contains BOBJ documents such as:
Job Aids
Known Issues
Reference Documents
Report Descriptions
Introduction Business Objects Reporting
BOBJ410
Page 4 North Carolina Office of the State Controller updated 8-15-17
Other Resources
_Help Folder within Business Objects Reporting Tools
SUMMARY
This course is intended to give business users an understanding of the Business Objects
reporting tool. It will provide you with explanations and demonstrations of the Business Objects
navigation and functionality.
Business Objects Reporting Overview
BOBJ410
updated 8-15-17 North Carolina Office of the State Controller Page 5
Objectives
Understand the definition of Business Objects
Identify the components of the Launch Pad
Work with the documents in the Launch Pad
What is Business Objects?
Business Objects, also known as BOBJ, is a suite of front-end applications from SAP that allows
business users to view, sort, and analyze business intelligence data. The business benefit of this
course is that users will be able to efficiently and effectively manage personal and business
documents to access the information they need when they need it. Users will be able to design
their own reports using Web Intelligence.
Components of BOBJ
There are four components of BOBJ.
Launch Pad - a web application that acts as a window to all business information viewed
in a single location.
Dashboards - interactive view that contains charts and graphs for visualizing data.
Crystal Reports - formatted reports with parameter selections for users to run and
generate reports.
Web Intelligence (WEBI) - a self-service environment for creating ad hoc queries and
analysis of data online. WEBI allows the option of viewing as formatted reports or
manipulating and adjusting of reports to meet your business requirements.
Report Icon Designation
There are three types of objects in BOBJ, and each type has an icon designation with which it is
designated. Below are the icons for each type of object.
Overview Business Objects Reporting
BOBJ410
Page 6 North Carolina Office of the State Controller updated 8-15-17
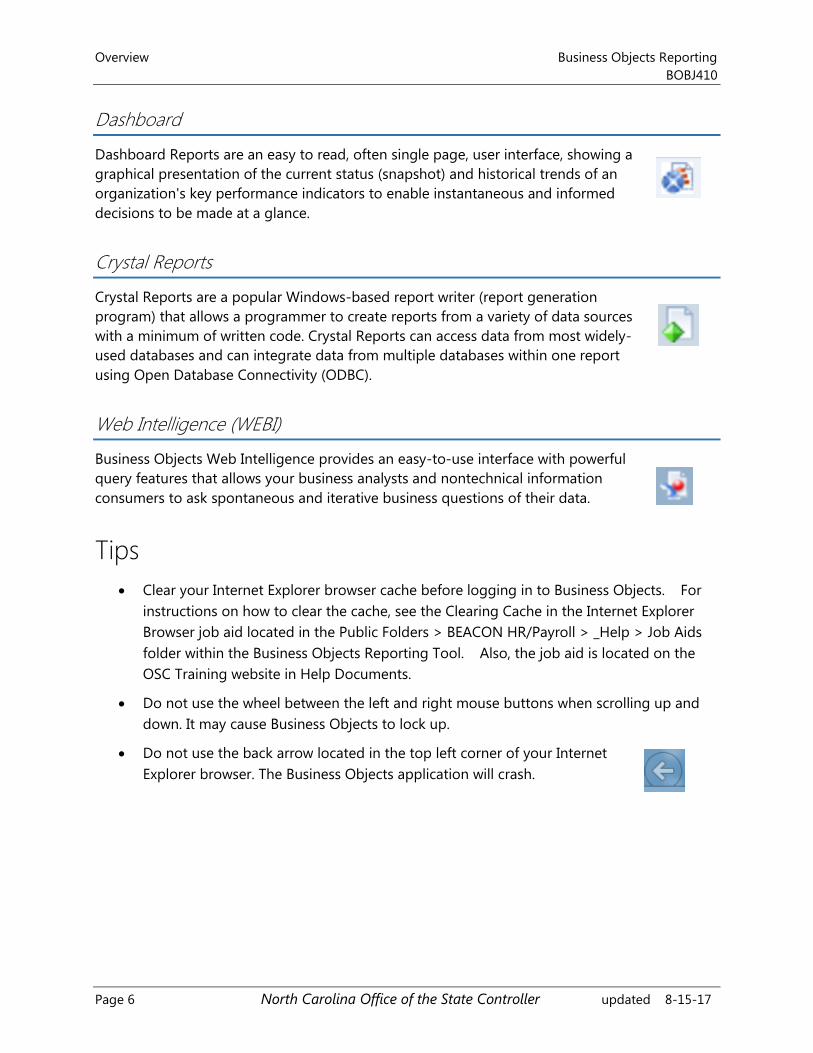
Dashboard
Dashboard Reports are an easy to read, often single page, user interface, showing a
graphical presentation of the current status (snapshot) and historical trends of an
organization's key performance indicators to enable instantaneous and informed
decisions to be made at a glance.
Crystal Reports
Crystal Reports are a popular Windows-based report writer (report generation
program) that allows a programmer to create reports from a variety of data sources
with a minimum of written code. Crystal Reports can access data from most widely-
used databases and can integrate data from multiple databases within one report
using Open Database Connectivity (ODBC).
Web Intelligence (WEBI)
Business Objects Web Intelligence provides an easy-to-use interface with powerful
query features that allows your business analysts and nontechnical information
consumers to ask spontaneous and iterative business questions of their data.
Tips
Clear your Internet Explorer browser cache before logging in to Business Objects. For
instructions on how to clear the cache, see the Clearing Cache in the Internet Explorer
Browser job aid located in the Public Folders > BEACON HR/Payroll > _Help > Job Aids
folder within the Business Objects Reporting Tool. Also, the job aid is located on the
OSC Training website in Help Documents.
Do not use the wheel between the left and right mouse buttons when scrolling up and
down. It may cause Business Objects to lock up.
Do not use the back arrow located in the top left corner of your Internet
Explorer browser. The Business Objects application will crash.
Business Objects Reporting Overview
BOBJ410
updated 8-15-17 North Carolina Office of the State Controller Page 7
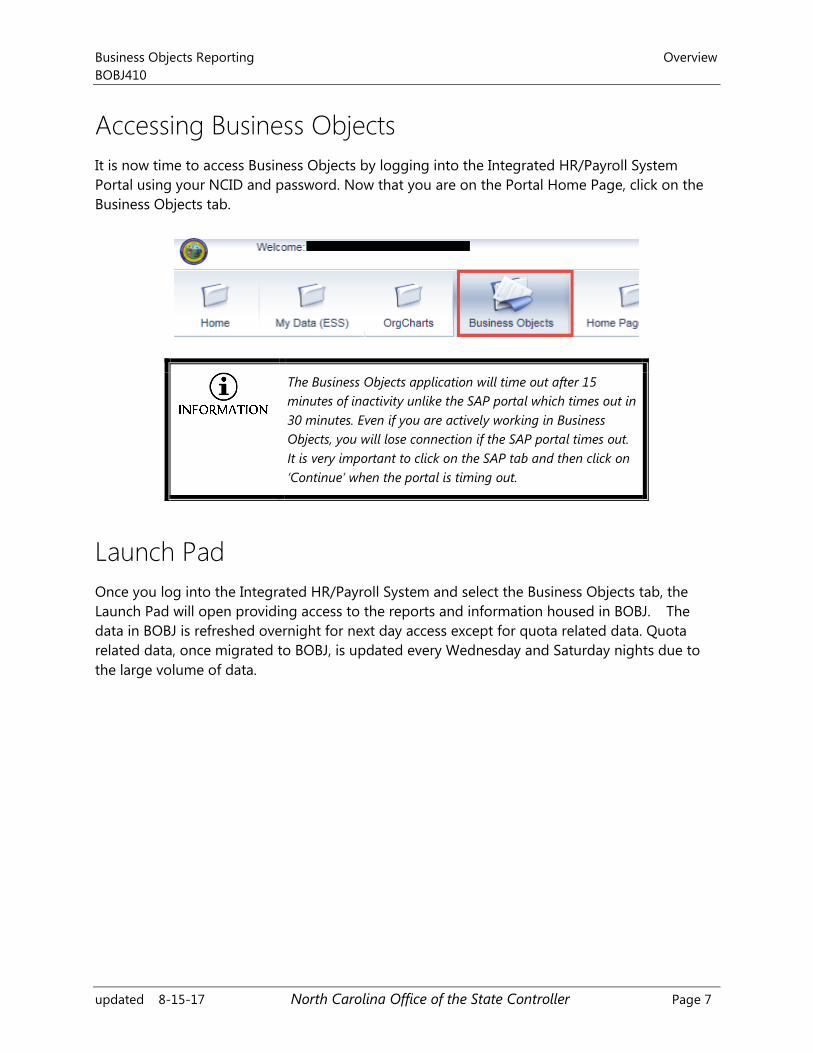
Accessing Business Objects
It is now time to access Business Objects by logging into the Integrated HR/Payroll System
Portal using your NCID and password. Now that you are on the Portal Home Page, click on the
Business Objects tab.
The Business Objects application will time out after 15
minutes of inactivity unlike the SAP portal which times out in
30 minutes. Even if you are actively working in Business
Objects, you will lose connection if the SAP portal times out.
It is very important to click on the SAP tab and then click on
‘Continue’ when the portal is timing out.
Launch Pad
Once you log into the Integrated HR/Payroll System and select the Business Objects tab, the
Launch Pad will open providing access to the reports and information housed in BOBJ. The
data in BOBJ is refreshed overnight for next day access except for quota related data. Quota
related data, once migrated to BOBJ, is updated every Wednesday and Saturday nights due to
the large volume of data.
Overview Business Objects Reporting
BOBJ410
Page 8 North Carolina Office of the State Controller updated 8-15-17
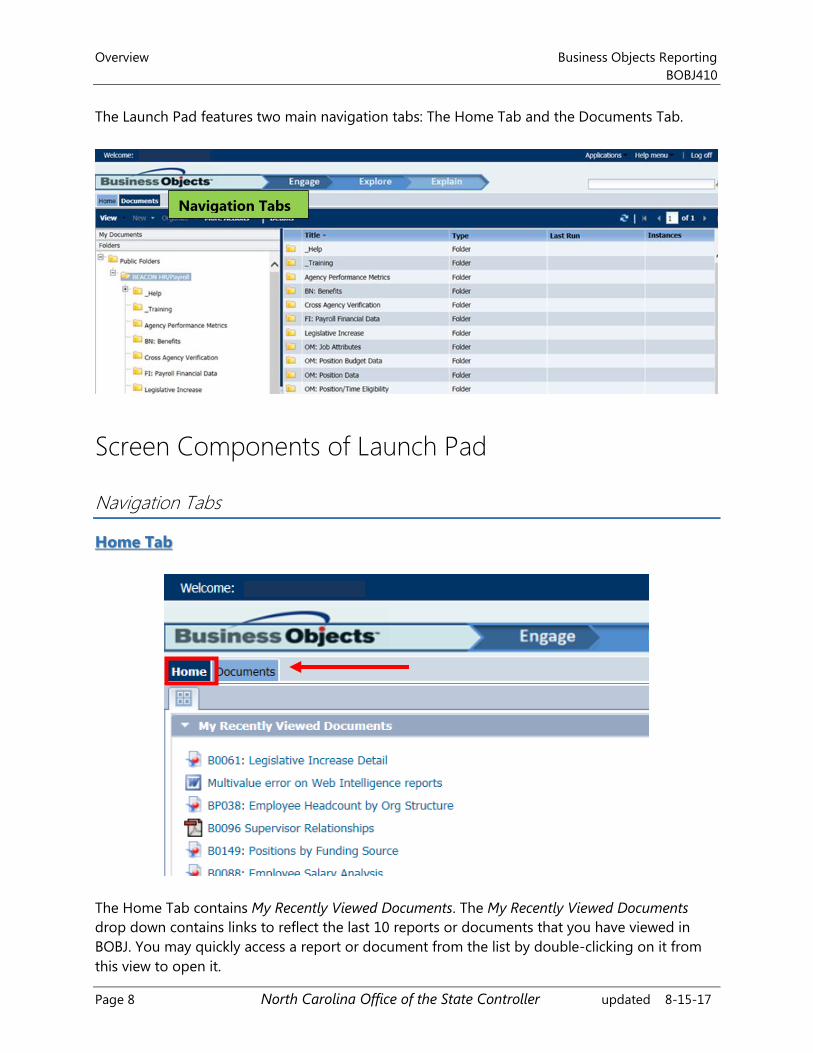
The Launch Pad features two main navigation tabs: The Home Tab and the Documents Tab.
Screen Components of Launch Pad
Navigation Tabs
Home Tab
The Home Tab contains My Recently Viewed Documents. The My Recently Viewed Documents
drop down contains links to reflect the last 10 reports or documents that you have viewed in
BOBJ. You may quickly access a report or document from the list by double-clicking on it from
this view to open it.
Navigation Tabs
Business Objects Reporting Overview
BOBJ410
updated 8-15-17 North Carolina Office of the State Controller Page 9
This drop down will be empty the first time it is accessed. It will populate with the last 10 report
or document links you accessed regardless of where the report is located (i.e. Public Folders and
My Favorites Folder).
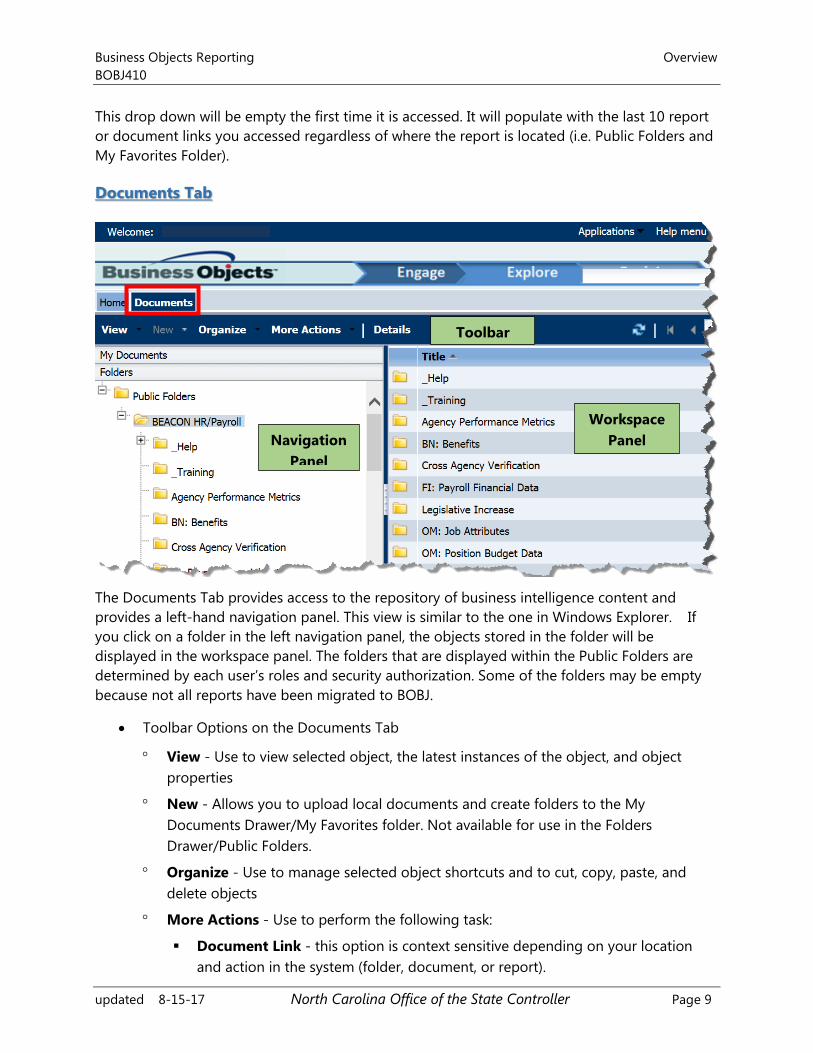
Documents Tab
The Documents Tab provides access to the repository of business intelligence content and
provides a left-hand navigation panel. This view is similar to the one in Windows Explorer. If
you click on a folder in the left navigation panel, the objects stored in the folder will be
displayed in the workspace panel. The folders that are displayed within the Public Folders are
determined by each user’s roles and security authorization. Some of the folders may be empty
because not all reports have been migrated to BOBJ.
Toolbar Options on the Documents Tab
View - Use to view selected object, the latest instances of the object, and object
properties
New - Allows you to upload local documents and create folders to the My
Documents Drawer/My Favorites folder. Not available for use in the Folders
Drawer/Public Folders.
Organize - Use to manage selected object shortcuts and to cut, copy, paste, and
delete objects
More Actions - Use to perform the following task:
Document Link - this option is context sensitive depending on your location
and action in the system (folder, document, or report).
Toolbar
Navigation
Panel
Workspace
Panel
Overview Business Objects Reporting
BOBJ410
Page 10 North Carolina Office of the State Controller updated 8-15-17
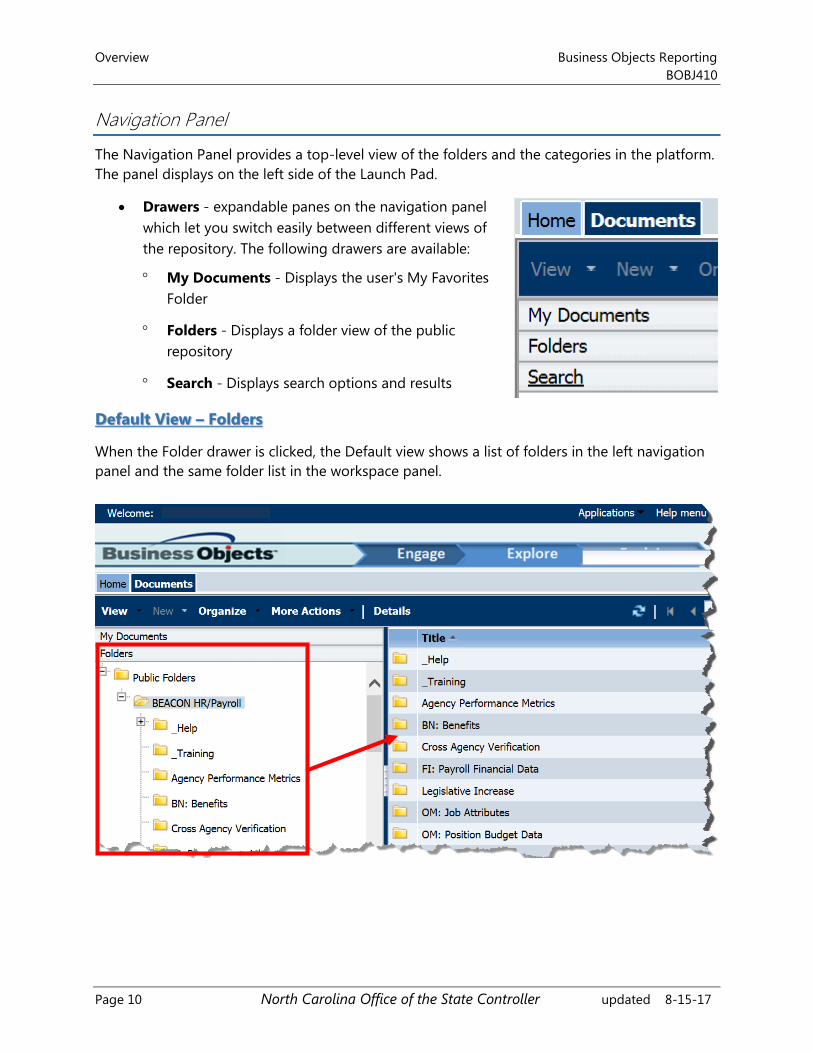
Navigation Panel
The Navigation Panel provides a top-level view of the folders and the categories in the platform.
The panel displays on the left side of the Launch Pad.
Drawers - expandable panes on the navigation panel
which let you switch easily between different views of
the repository. The following drawers are available:
My Documents - Displays the user's My Favorites
Folder
Folders - Displays a folder view of the public
repository
Search - Displays search options and results
Default View – Folders
When the Folder drawer is clicked, the Default view shows a list of folders in the left navigation
panel and the same folder list in the workspace panel.
Business Objects Reporting Overview
BOBJ410
updated 8-15-17 North Carolina Office of the State Controller Page 11
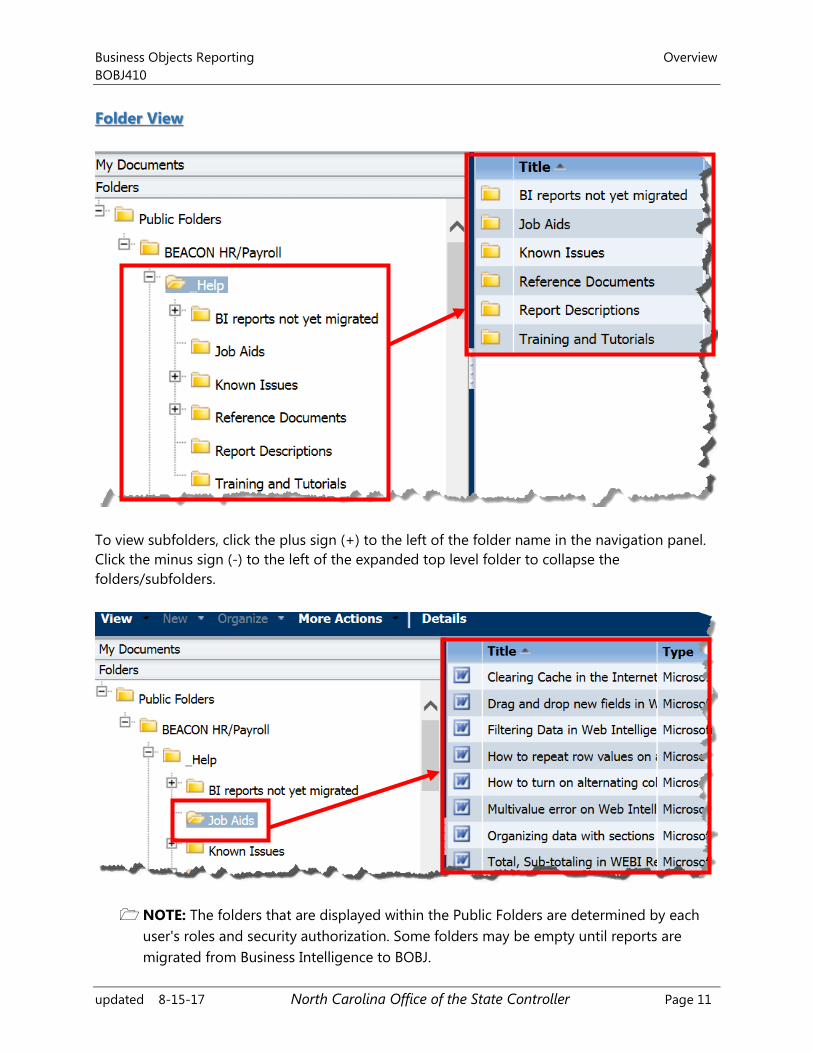
Folder View
To view subfolders, click the plus sign (+) to the left of the folder name in the navigation panel.
Click the minus sign (-) to the left of the expanded top level folder to collapse the
folders/subfolders.
NOTE: The folders that are displayed within the Public Folders are determined by each
user's roles and security authorization. Some folders may be empty until reports are
migrated from Business Intelligence to BOBJ.
Overview Business Objects Reporting
BOBJ410
Page 12 North Carolina Office of the State Controller updated 8-15-17
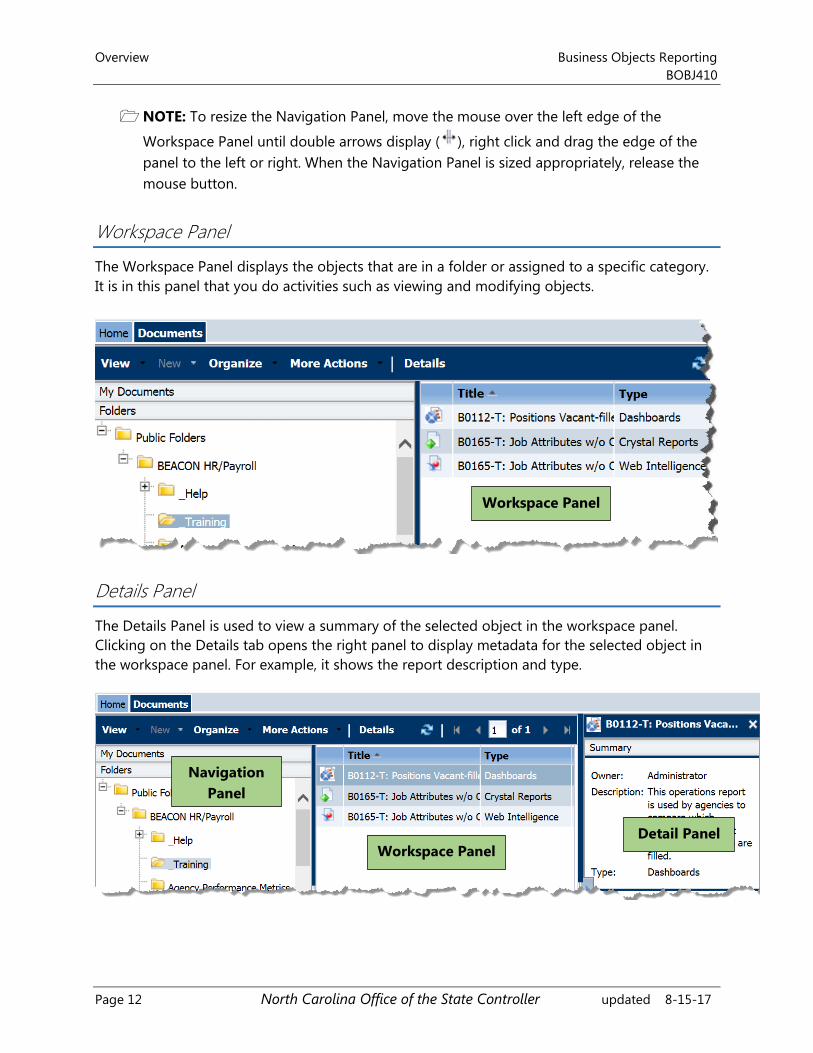
NOTE: To resize the Navigation Panel, move the mouse over the left edge of the
Workspace Panel until double arrows display ( ), right click and drag the edge of the
panel to the left or right. When the Navigation Panel is sized appropriately, release the
mouse button.
Workspace Panel
The Workspace Panel displays the objects that are in a folder or assigned to a specific category.
It is in this panel that you do activities such as viewing and modifying objects.
Details Panel
The Details Panel is used to view a summary of the selected object in the workspace panel.
Clicking on the Details tab opens the right panel to display metadata for the selected object in
the workspace panel. For example, it shows the report description and type.
Workspace Panel
Workspace Panel
Navigation
Panel
Detail Panel
Business Objects Reporting Overview
BOBJ410
updated 8-15-17 North Carolina Office of the State Controller Page 13
To close the Details Panel, click on the X located in the top right corner of the Details
Panel or click on the arrow located on the left edge of the details panel or click on
the Details Tab.
Working with Documents on Launch Pad
Search for a Document
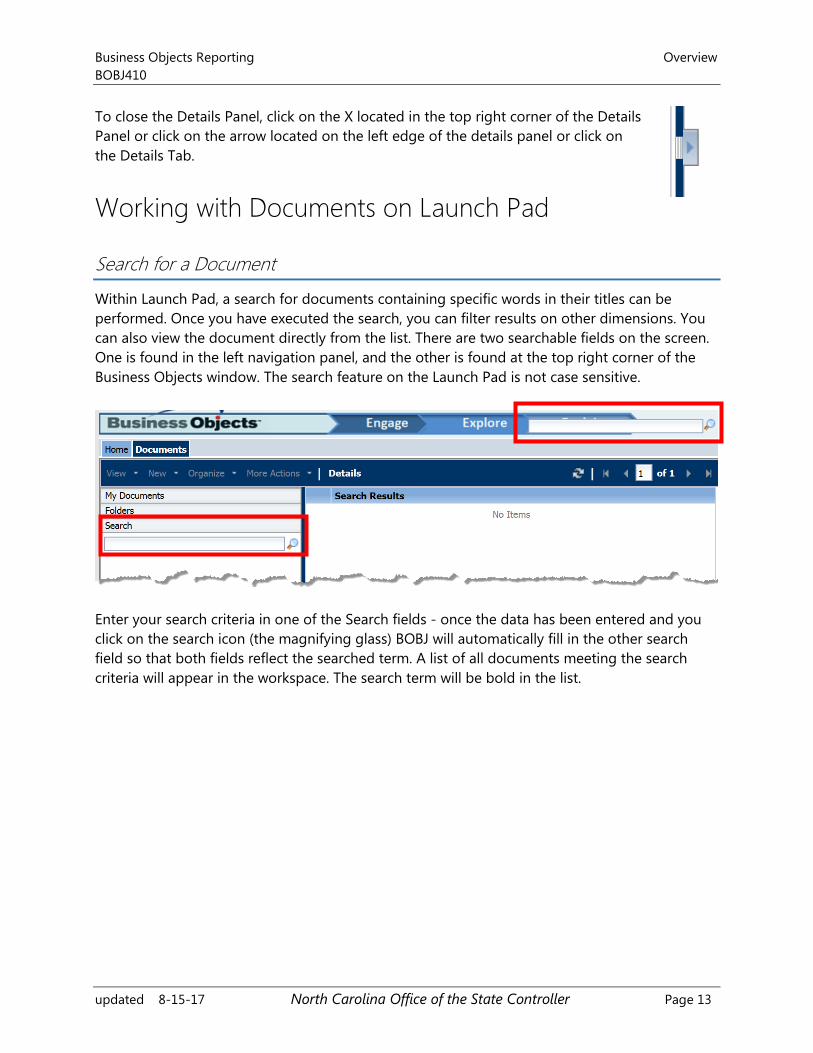
Within Launch Pad, a search for documents containing specific words in their titles can be
performed. Once you have executed the search, you can filter results on other dimensions. You
can also view the document directly from the list. There are two searchable fields on the screen.
One is found in the left navigation panel, and the other is found at the top right corner of the
Business Objects window. The search feature on the Launch Pad is not case sensitive.
Enter your search criteria in one of the Search fields - once the data has been entered and you
click on the search icon (the magnifying glass) BOBJ will automatically fill in the other search
field so that both fields reflect the searched term. A list of all documents meeting the search
criteria will appear in the workspace. The search term will be bold in the list.

Overview Business Objects Reporting
BOBJ410
Page 14 North Carolina Office of the State Controller updated 8-15-17
You may refine your search results by using the default results in the
left navigation panel to narrow the choices returned. For example, if
you want to see only search results for Dashboard Reports, click on the
dashboard reports link in the type box.
Once you have selected this link, it will narrow the results and change the search results. The
Current Filters field indicates that you have set a filter.
To remove the filter, hover over the X beside the filter and click.
This will return you to the original full search results.
To open a report from the search results, double click the report. The report object will open in
the format selected.
Business Objects Reporting Overview
BOBJ410
updated 8-15-17 North Carolina Office of the State Controller Page 15
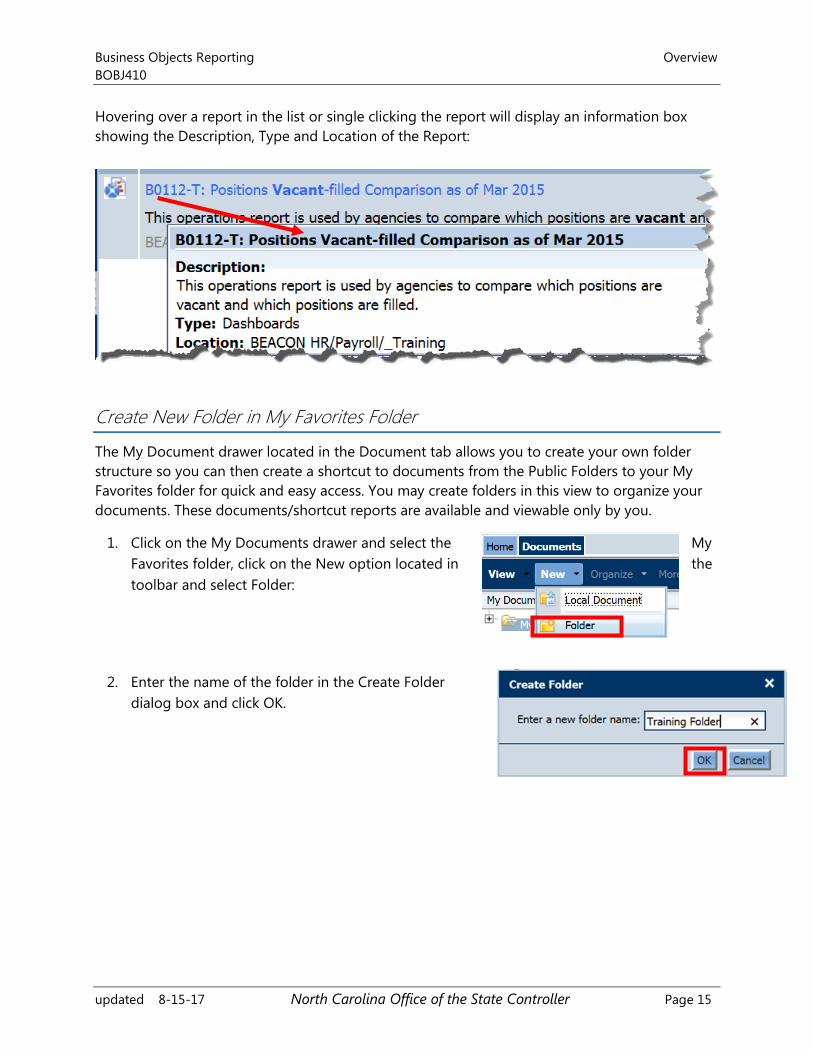
Hovering over a report in the list or single clicking the report will display an information box
showing the Description, Type and Location of the Report:
Create New Folder in My Favorites Folder
The My Document drawer located in the Document tab allows you to create your own folder
structure so you can then create a shortcut to documents from the Public Folders to your My
Favorites folder for quick and easy access. You may create folders in this view to organize your
documents. These documents/shortcut reports are available and viewable only by you.
1. Click on the My Documents drawer and select the My
Favorites folder, click on the New option located in the
toolbar and select Folder:
2. Enter the name of the folder in the Create Folder
dialog box and click OK.
Overview Business Objects Reporting
BOBJ410
Page 16 North Carolina Office of the State Controller updated 8-15-17
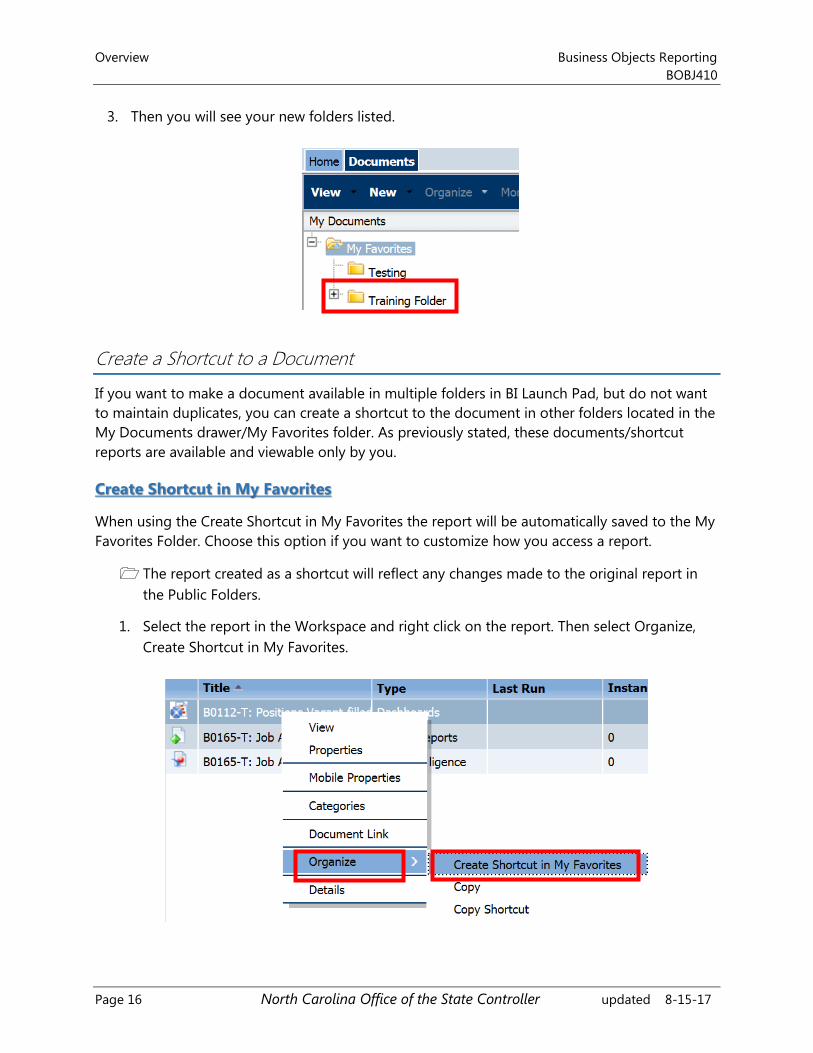
3. Then you will see your new folders listed.
Create a Shortcut to a Document
If you want to make a document available in multiple folders in BI Launch Pad, but do not want
to maintain duplicates, you can create a shortcut to the document in other folders located in the
My Documents drawer/My Favorites folder. As previously stated, these documents/shortcut
reports are available and viewable only by you.
Create Shortcut in My Favorites
When using the Create Shortcut in My Favorites the report will be automatically saved to the My
Favorites Folder. Choose this option if you want to customize how you access a report.
The report created as a shortcut will reflect any changes made to the original report in
the Public Folders.
1. Select the report in the Workspace and right click on the report. Then select Organize,
Create Shortcut in My Favorites.
Business Objects Reporting Overview
BOBJ410
updated 8-15-17 North Carolina Office of the State Controller Page 17
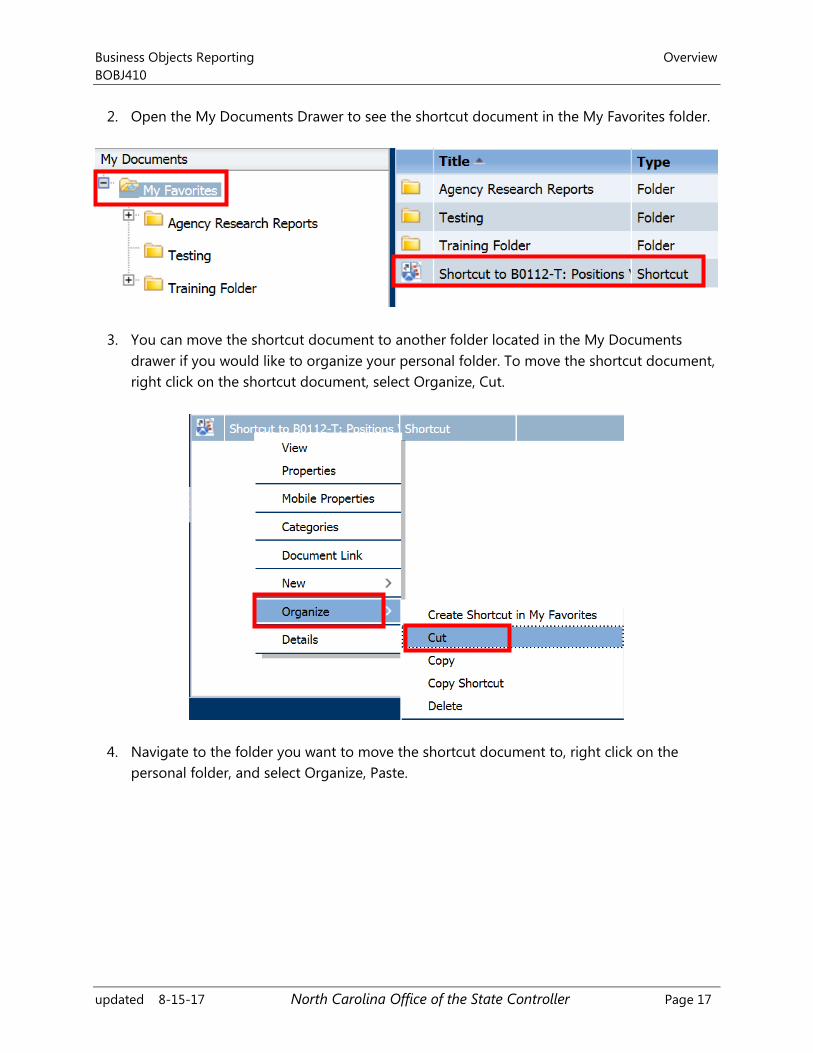
2. Open the My Documents Drawer to see the shortcut document in the My Favorites folder.
3. You can move the shortcut document to another folder located in the My Documents
drawer if you would like to organize your personal folder. To move the shortcut document,
right click on the shortcut document, select Organize, Cut.
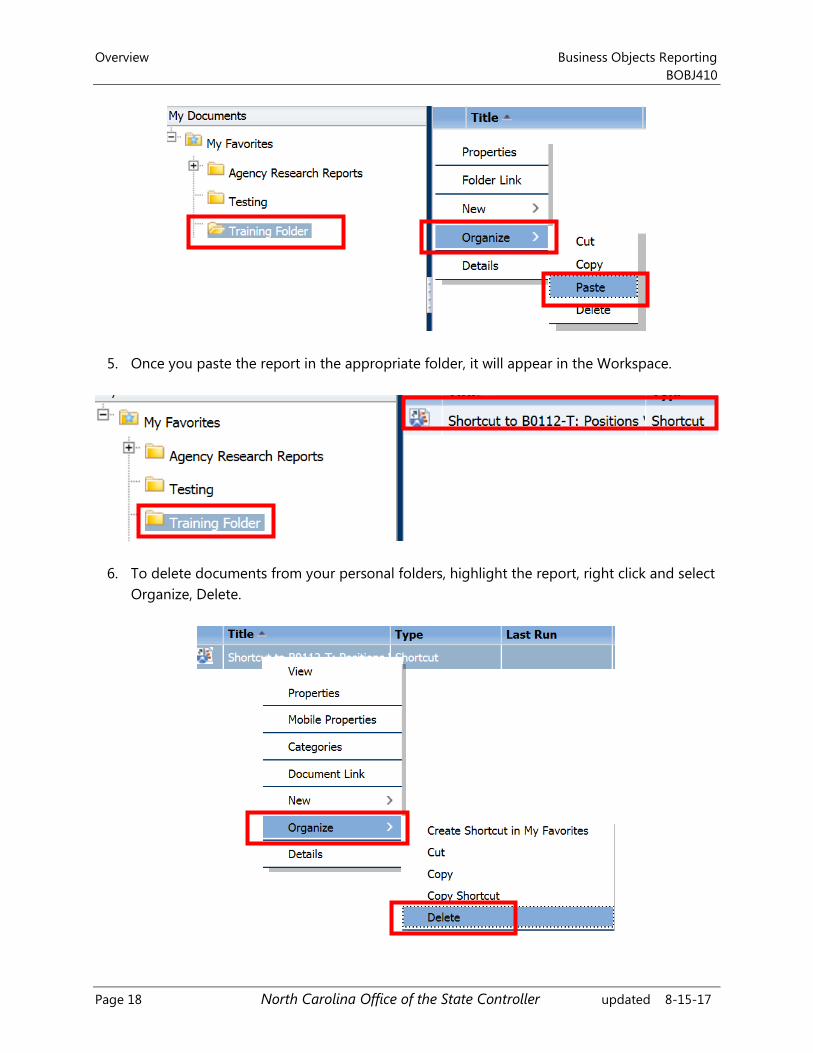
4. Navigate to the folder you want to move the shortcut document to, right click on the
personal folder, and select Organize, Paste.
Overview Business Objects Reporting
BOBJ410
Page 18 North Carolina Office of the State Controller updated 8-15-17
5. Once you paste the report in the appropriate folder, it will appear in the Workspace.
6. To delete documents from your personal folders, highlight the report, right click and select
Organize, Delete.
Business Objects Reporting Overview
BOBJ410
updated 8-15-17 North Carolina Office of the State Controller Page 19
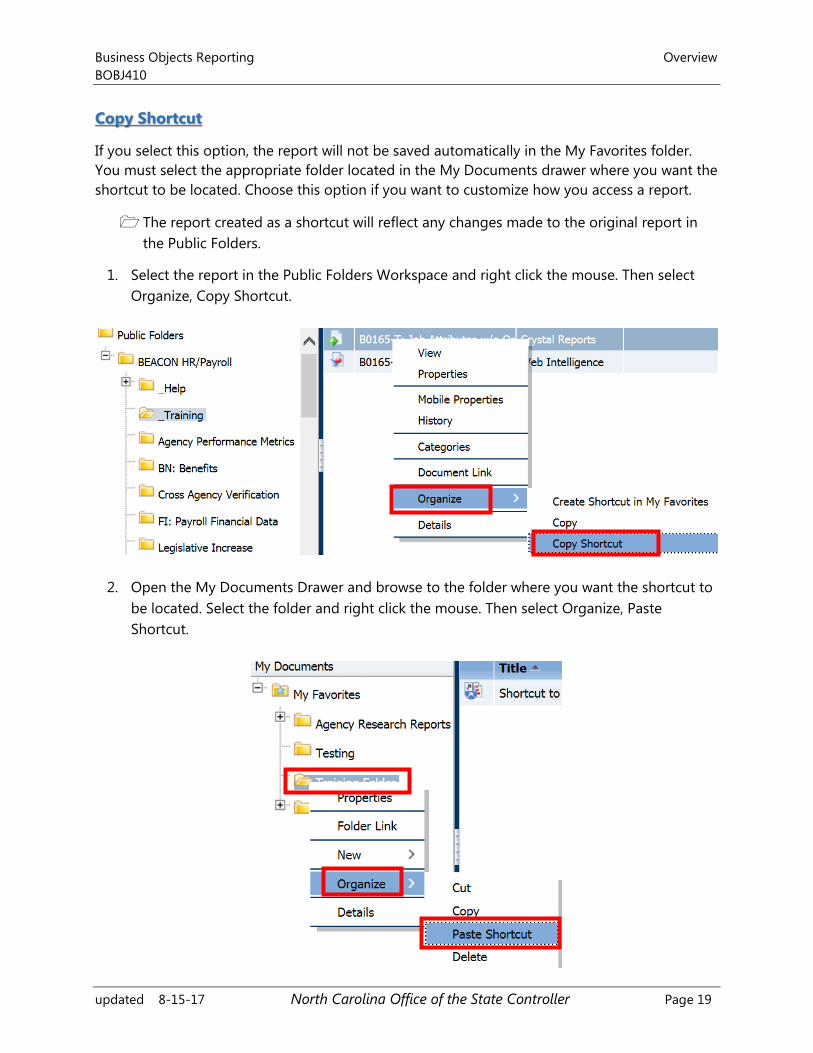
Copy Shortcut
If you select this option, the report will not be saved automatically in the My Favorites folder.
You must select the appropriate folder located in the My Documents drawer where you want the
shortcut to be located. Choose this option if you want to customize how you access a report.
The report created as a shortcut will reflect any changes made to the original report in
the Public Folders.
1. Select the report in the Public Folders Workspace and right click the mouse. Then select
Organize, Copy Shortcut.
2. Open the My Documents Drawer and browse to the folder where you want the shortcut to
be located. Select the folder and right click the mouse. Then select Organize, Paste
Shortcut.
Overview Business Objects Reporting
BOBJ410
Page 20 North Carolina Office of the State Controller updated 8-15-17
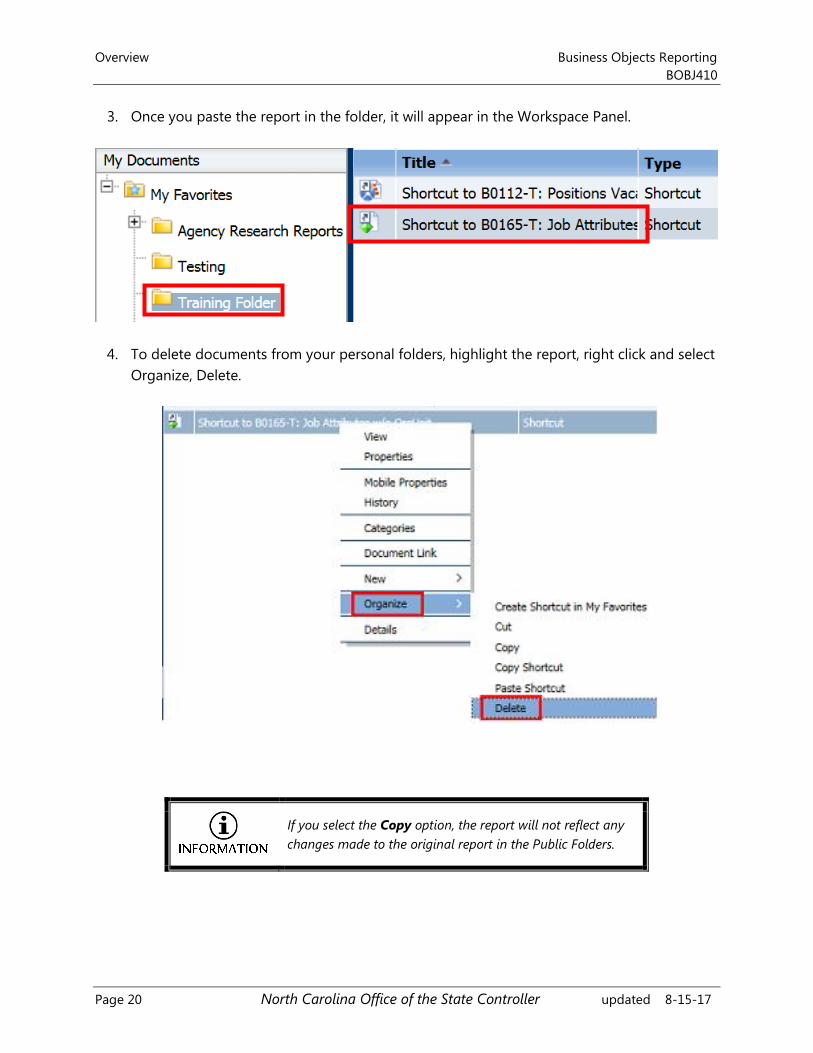
3. Once you paste the report in the folder, it will appear in the Workspace Panel.
4. To delete documents from your personal folders, highlight the report, right click and select
Organize, Delete.
If you select the Copy option, the report will not reflect any
changes made to the original report in the Public Folders.
Business Objects Reporting Overview
BOBJ410
updated 8-15-17 North Carolina Office of the State Controller Page 21
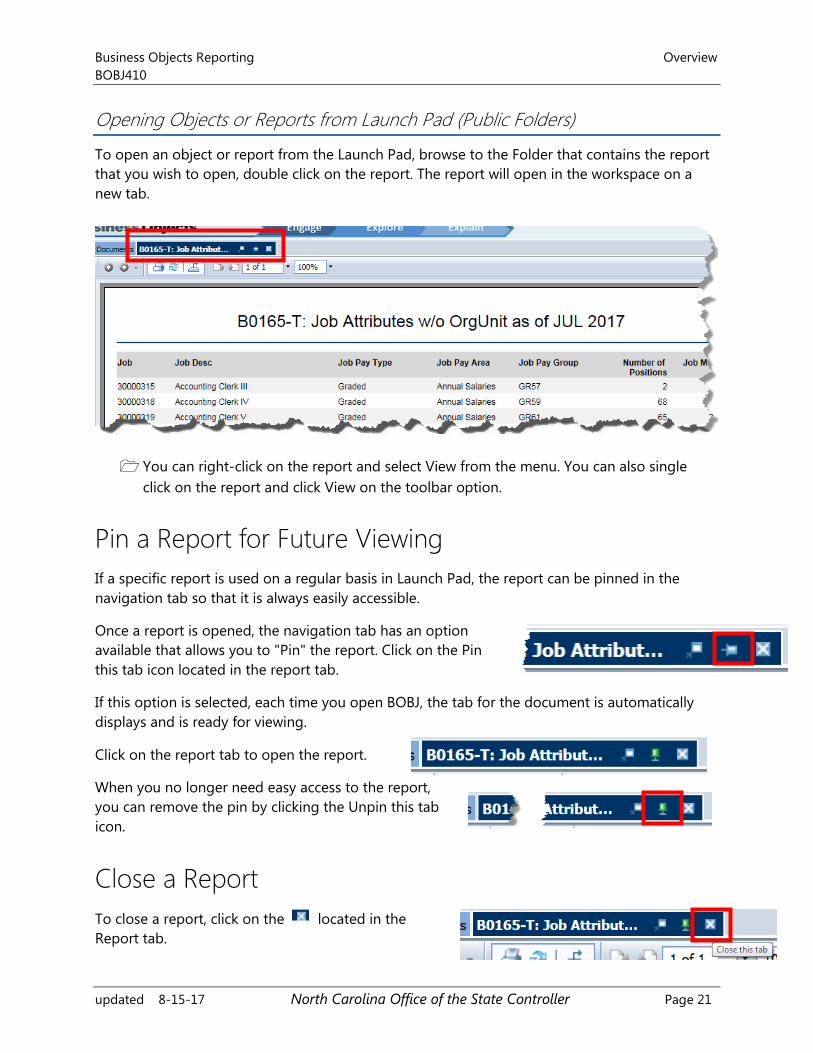
Opening Objects or Reports from Launch Pad (Public Folders)
To open an object or report from the Launch Pad, browse to the Folder that contains the report
that you wish to open, double click on the report. The report will open in the workspace on a
new tab.
You can right-click on the report and select View from the menu. You can also single
click on the report and click View on the toolbar option.
Pin a Report for Future Viewing
If a specific report is used on a regular basis in Launch Pad, the report can be pinned in the
navigation tab so that it is always easily accessible.
Once a report is opened, the navigation tab has an option
available that allows you to "Pin" the report. Click on the Pin
this tab icon located in the report tab.
If this option is selected, each time you open BOBJ, the tab for the document is automatically
displays and is ready for viewing.
Click on the report tab to open the report.
When you no longer need easy access to the report,
you can remove the pin by clicking the Unpin this tab
icon.
Close a Report
To close a report, click on the located in the
Report tab.
Overview Business Objects Reporting
BOBJ410
Page 22 North Carolina Office of the State Controller updated 8-15-17
Help Folder
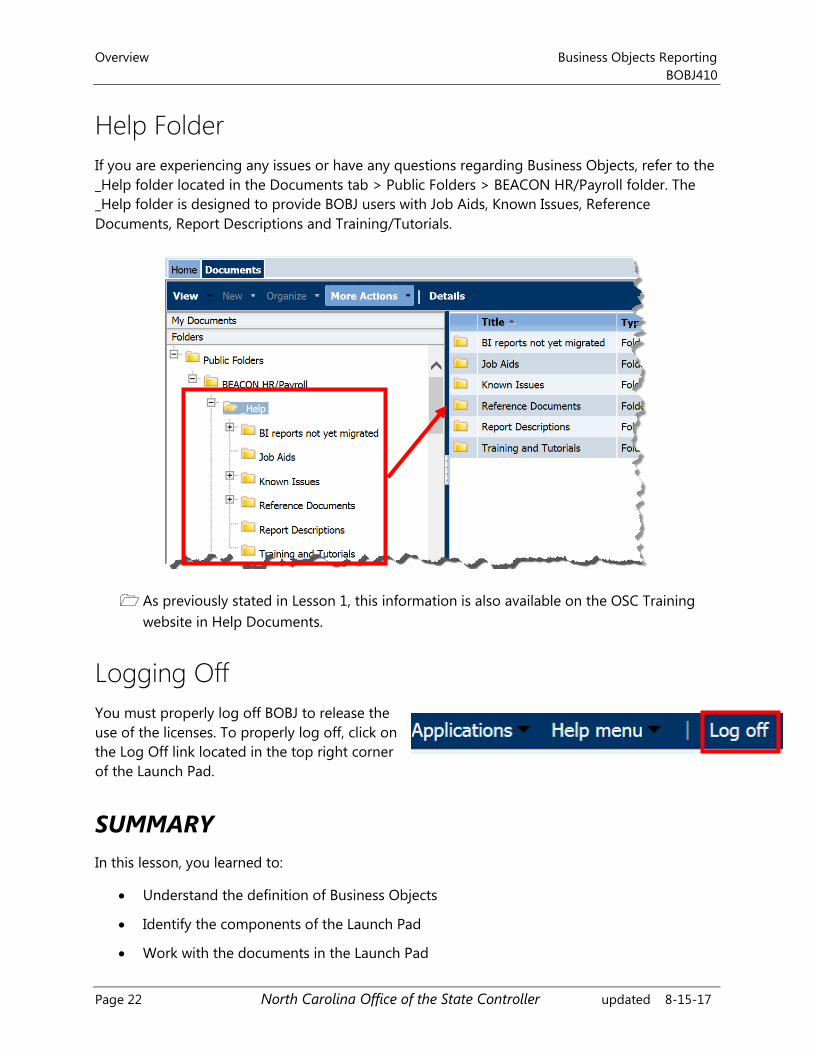
If you are experiencing any issues or have any questions regarding Business Objects, refer to the
_Help folder located in the Documents tab > Public Folders > BEACON HR/Payroll folder. The
_Help folder is designed to provide BOBJ users with Job Aids, Known Issues, Reference
Documents, Report Descriptions and Training/Tutorials.
As previously stated in Lesson 1, this information is also available on the OSC Training
website in Help Documents.
Logging Off
You must properly log off BOBJ to release the
use of the licenses. To properly log off, click on
the Log Off link located in the top right corner
of the Launch Pad.
SUMMARY
In this lesson, you learned to:
Understand the definition of Business Objects
Identify the components of the Launch Pad
Work with the documents in the Launch Pad
Business Objects Reporting Dashboard Reports
BOBJ410
updated 8-15-17 North Carolina Office of the State Controller Page 23
Objectives
Understand the definition of Dashboard Reports
Identify the components of Dashboard Reports
Open and View Dashboard Reports
Definition of Dashboard Reports
Dashboard Reports often provide at-a-glance views of KPIs (key performance indicators)
relevant to a particular objective or business process (e.g. sales, marketing, human resources, or
production). The term dashboard originates from the automobile dashboard where drivers
monitor the major functions at a glance via the instrument cluster. Dashboards give signs about
a business letting the user know something is wrong or something is right. The corporate world
has tried for years to come up with a solution that would tell them if their business needed
maintenance or if the temperature of their business was running above normal. Dashboards
typically are limited to show summaries, key trends, comparisons, and exceptions. There are four
key elements to a good dashboard:
Simple, communicates easily
Minimum distractions...it could cause confusion
Supports organized business with meaningful and useful data
Applies human visual perception to visual presentation of information
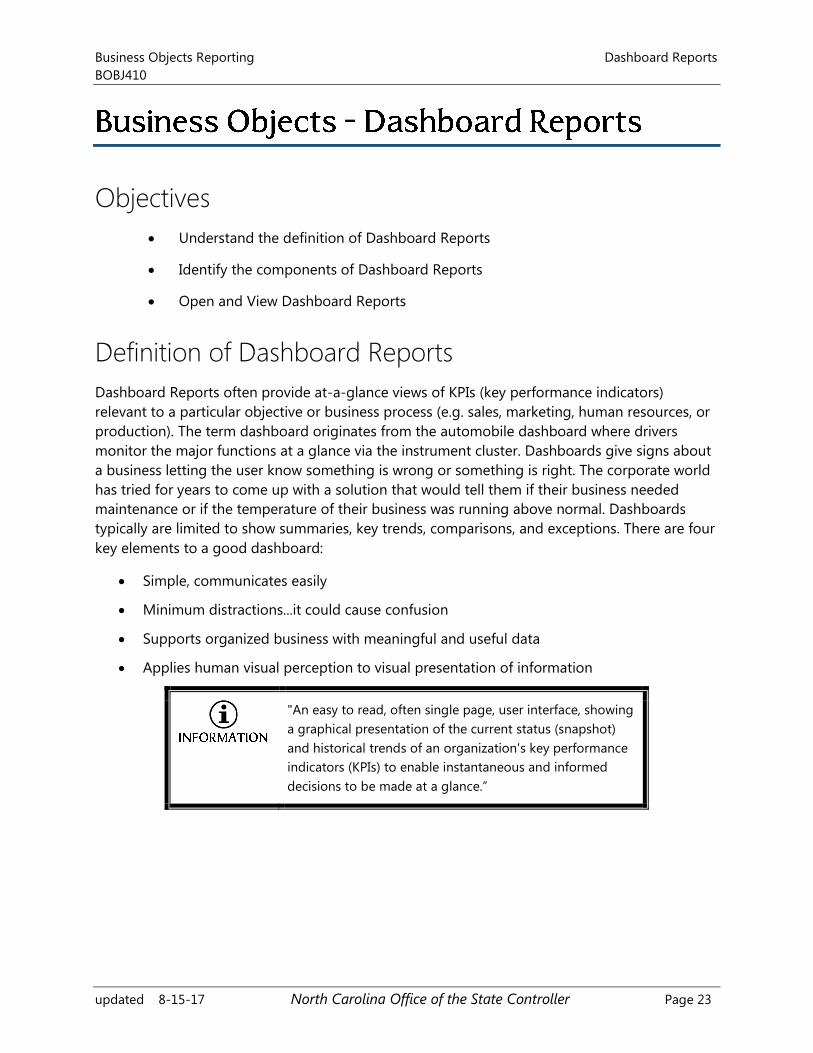
"An easy to read, often single page, user interface, showing
a graphical presentation of the current status (snapshot)
and historical trends of an organization's key performance
indicators (KPIs) to enable instantaneous and informed
decisions to be made at a glance.”
Dashboard Reports Business Objects Reporting
BOBJ410
Page 24 North Carolina Office of the State Controller updated 8-15-17
Components of Dashboard Reports
Components are the visual elements of your dashboard. They are designed to display or select
large amounts of data in an efficient manner.
Line Chart - The "Line Chart" is ideal for showing tendency over a period of time. Use
this chart in models which emphasize a trend or a continuing sequence of data.
Pie Chart - The "Pie Chart" is a circular chart that represents the distribution or
participation of each item (represented by a slice) of a certain total that is represented as
the overall pie value.
Stacked Area Chart - This standard chart has vertical and horizontal axis. Each point
along the horizontal axis represents a data point. The actual values for the data points
are plotted against the vertical axis, with each series adding to the total value.
Stacked Column Chart and Stacked Bar Chart - These are multi-bar charts that show
and compare one or more variables, with each variable adding to the total value. These
charts compare several variables over a period of time for example, marketing cost and
administrative cost. Each one of the cost components is presented in a different color,
and each bar represents a different time period. The total bar size represents the total
cost.
To Open and View a Dashboard Report
Once you log into the HR/Payroll System and select the Business Objects tab, the Launch Pad
will open providing access to the reports and information housed in BOBJ. Click on the
appropriate folder (My Documents or Folders) to locate the report in the workspace panel which
you would like to view.
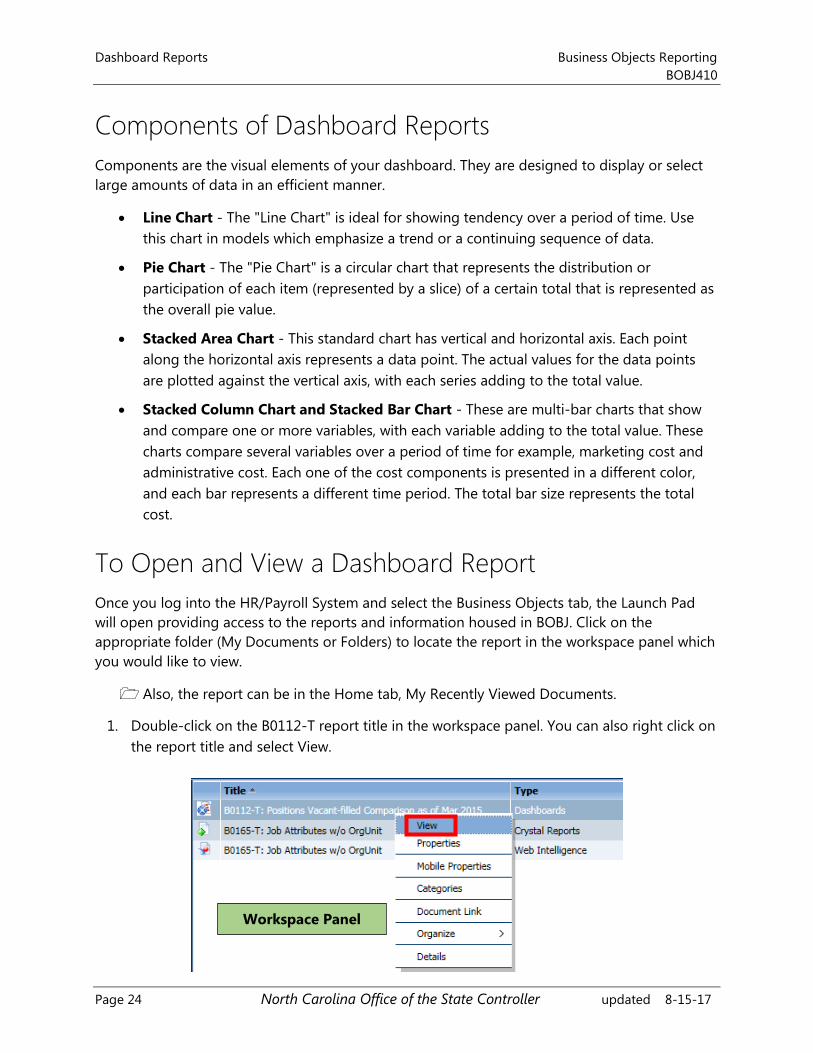
Also, the report can be in the Home tab, My Recently Viewed Documents.
1. Double-click on the B0112-T report title in the workspace panel. You can also right click on
the report title and select View.
Workspace Panel
Business Objects Reporting Dashboard Reports
BOBJ410
updated 8-15-17 North Carolina Office of the State Controller Page 25
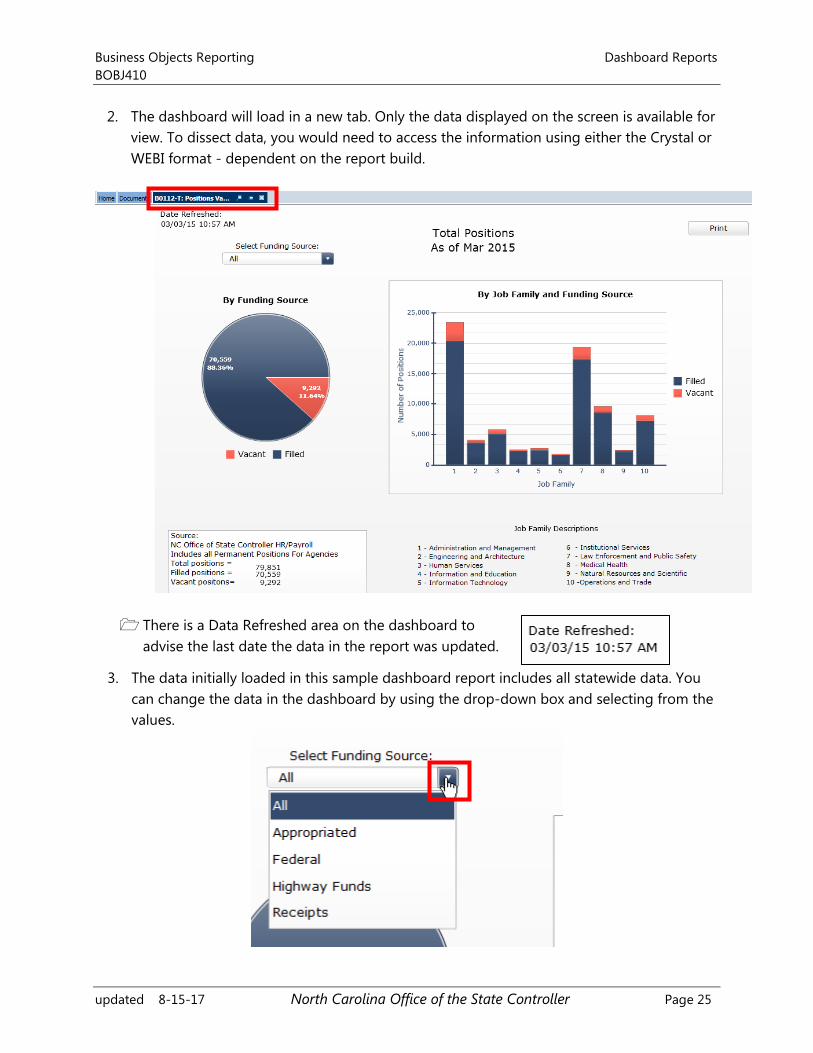
2. The dashboard will load in a new tab. Only the data displayed on the screen is available for
view. To dissect data, you would need to access the information using either the Crystal or
WEBI format - dependent on the report build.
There is a Data Refreshed area on the dashboard to
advise the last date the data in the report was updated.
3. The data initially loaded in this sample dashboard report includes all statewide data. You
can change the data in the dashboard by using the drop-down box and selecting from the
values.
Dashboard Reports Business Objects Reporting
BOBJ410
Page 26 North Carolina Office of the State Controller updated 8-15-17
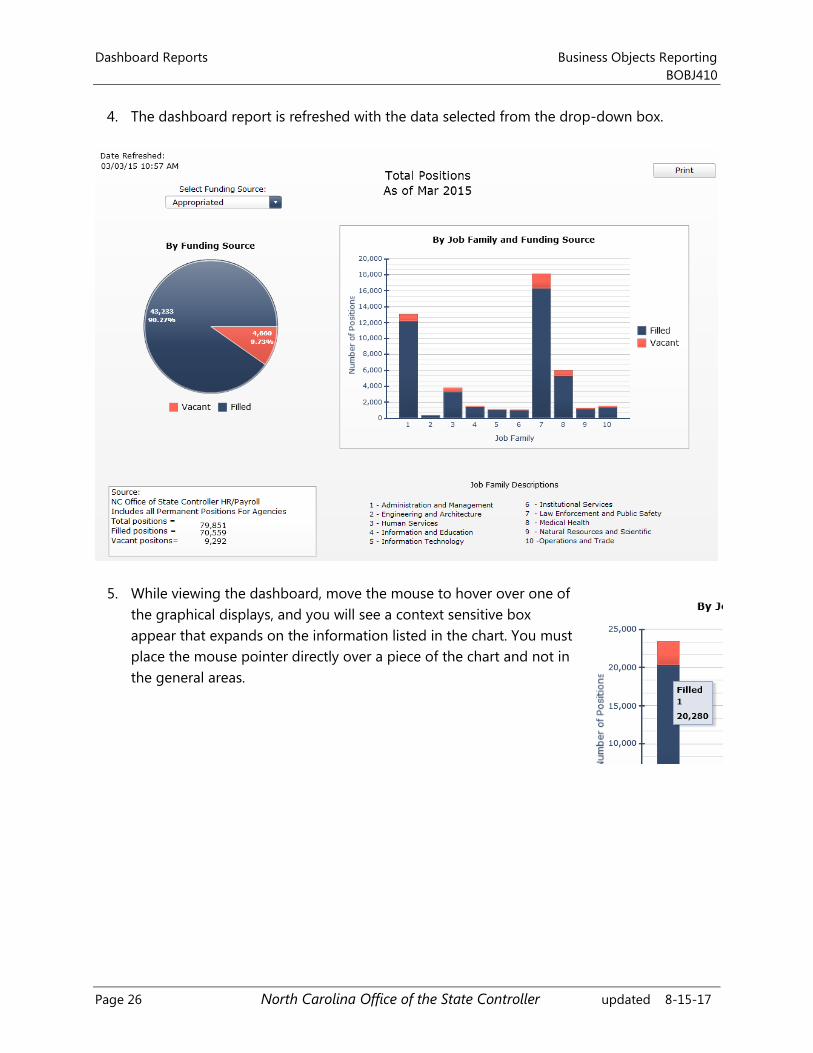
4. The dashboard report is refreshed with the data selected from the drop-down box.
5. While viewing the dashboard, move the mouse to hover over one of
the graphical displays, and you will see a context sensitive box
appear that expands on the information listed in the chart. You must
place the mouse pointer directly over a piece of the chart and not in
the general areas.
Business Objects Reporting Dashboard Reports
BOBJ410
updated 8-15-17 North Carolina Office of the State Controller Page 27
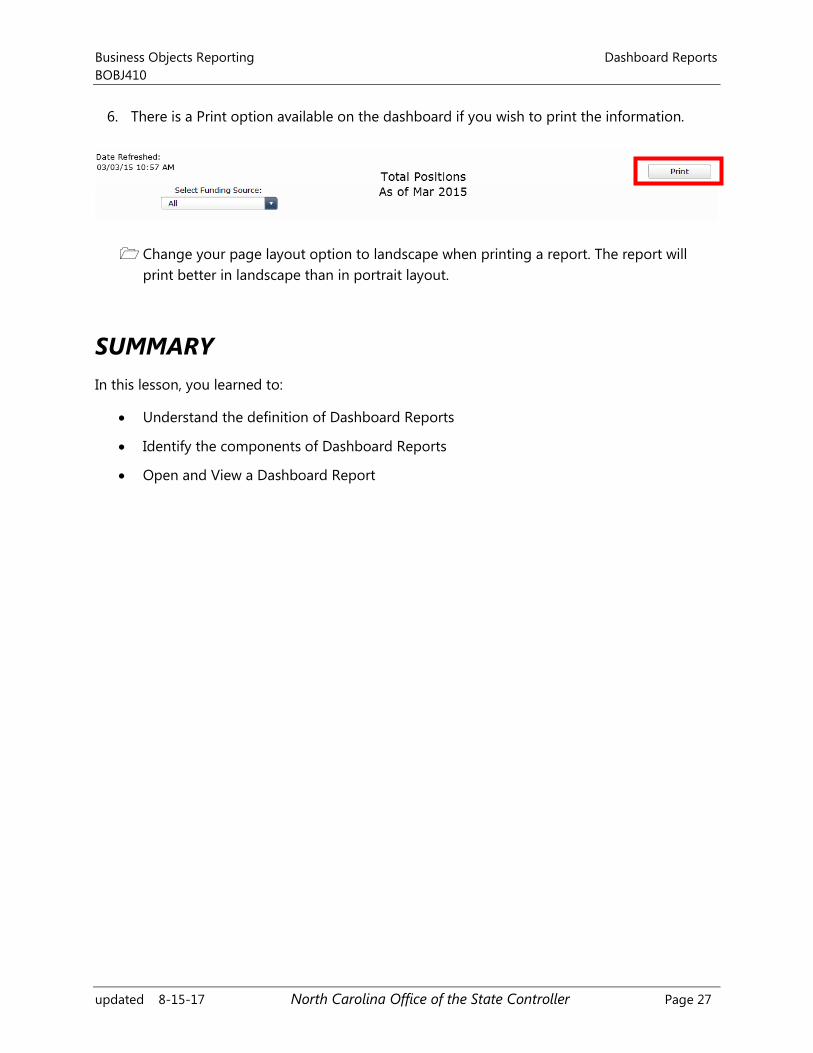
6. There is a Print option available on the dashboard if you wish to print the information.
Change your page layout option to landscape when printing a report. The report will
print better in landscape than in portrait layout.
SUMMARY
In this lesson, you learned to:
Understand the definition of Dashboard Reports
Identify the components of Dashboard Reports
Open and View a Dashboard Report

Dashboard Reports Business Objects Reporting
BOBJ410
Page 28 North Carolina Office of the State Controller updated 8-15-17
THIS PAGE
INTENTIONALLY LEFT BLANK
Business Objects Reporting Crystal Reports
BOBJ410
updated 8-15-17 North Carolina Office of the State Controller Page 29
Objectives
Understand the definition of Crystal Reports
Open and view a Crystal Report
Definition of Crystal Reports
Crystal Reports are delivered reports with prompt selections for users to run and generate
reports. These reports are pixel perfect with complex layouts which can be printed or exported
to PDF format. Graphics, charts and other external objects can be embedded in a crystal report
to provide professionally formatted reports.
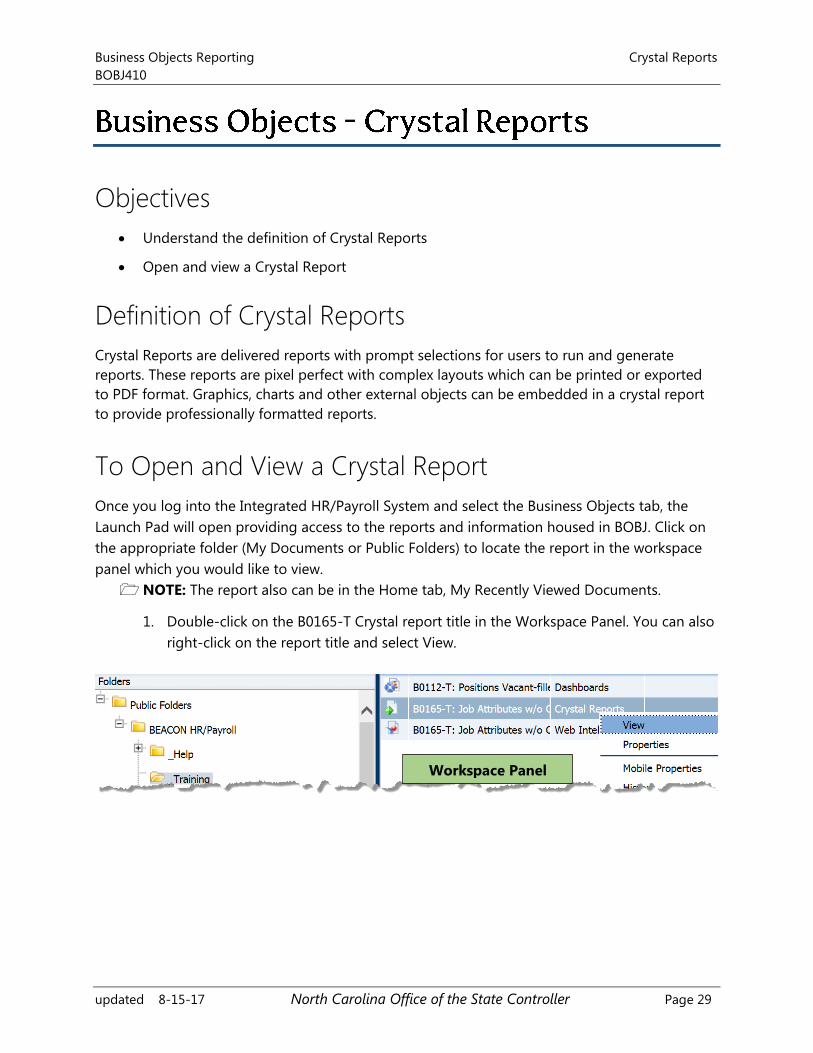
To Open and View a Crystal Report
Once you log into the Integrated HR/Payroll System and select the Business Objects tab, the
Launch Pad will open providing access to the reports and information housed in BOBJ. Click on
the appropriate folder (My Documents or Public Folders) to locate the report in the workspace
panel which you would like to view.
NOTE: The report also can be in the Home tab, My Recently Viewed Documents.
1. Double-click on the B0165-T Crystal report title in the Workspace Panel. You can also
right-click on the report title and select View.
Workspace Panel
Crystal Reports Business Objects Reporting
BOBJ410
Page 30 North Carolina Office of the State Controller updated 8-15-17
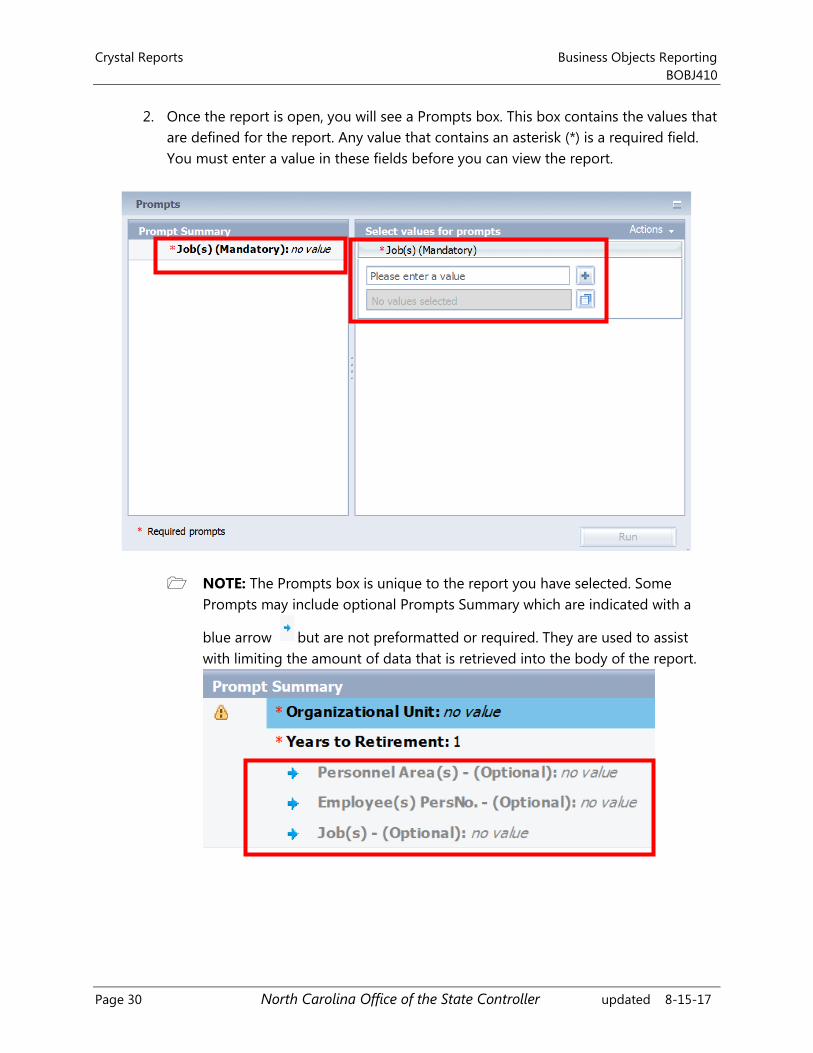
2. Once the report is open, you will see a Prompts box. This box contains the values that
are defined for the report. Any value that contains an asterisk (*) is a required field.
You must enter a value in these fields before you can view the report.
NOTE: The Prompts box is unique to the report you have selected. Some
Prompts may include optional Prompts Summary which are indicated with a
blue arrow but are not preformatted or required. They are used to assist
with limiting the amount of data that is retrieved into the body of the report.
Business Objects Reporting Crystal Reports
BOBJ410
updated 8-15-17 North Carolina Office of the State Controller Page 31
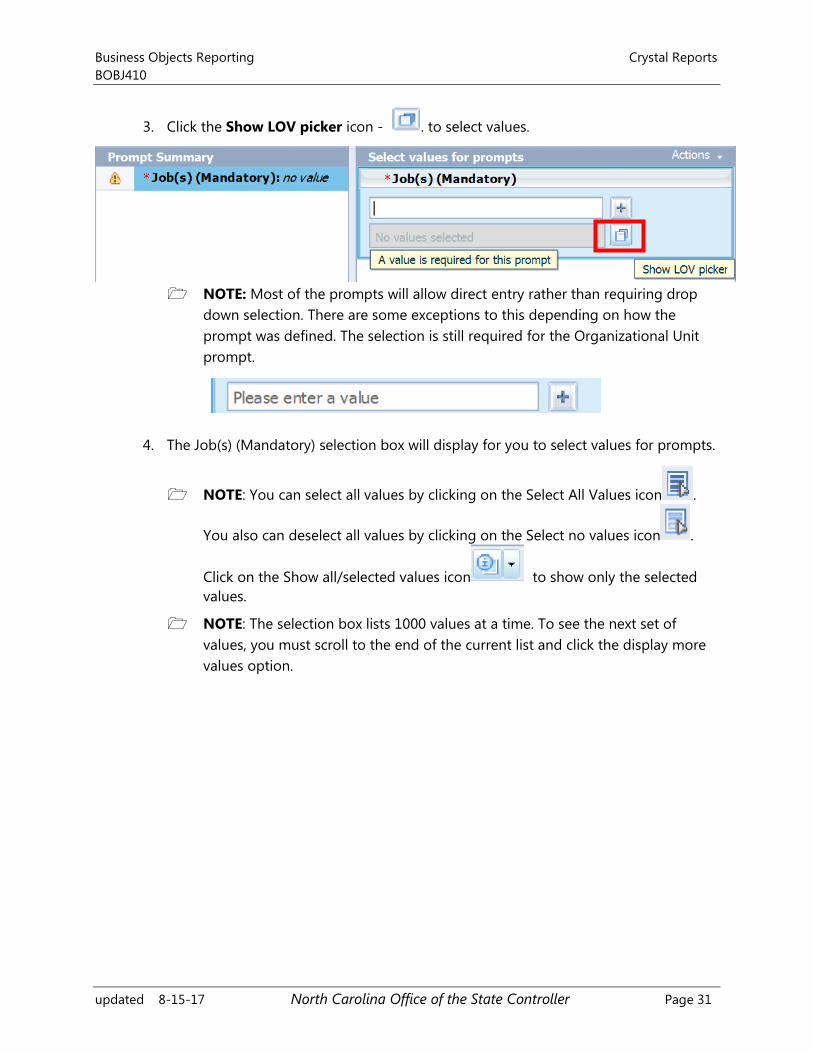
3. Click the Show LOV picker icon - . to select values.
NOTE: Most of the prompts will allow direct entry rather than requiring drop
down selection. There are some exceptions to this depending on how the
prompt was defined. The selection is still required for the Organizational Unit
prompt.
4. The Job(s) (Mandatory) selection box will display for you to select values for prompts.
NOTE: You can select all values by clicking on the Select All Values icon .
You also can deselect all values by clicking on the Select no values icon .
Click on the Show all/selected values icon to show only the selected
values.
NOTE: The selection box lists 1000 values at a time. To see the next set of
values, you must scroll to the end of the current list and click the display more
values option.
Crystal Reports Business Objects Reporting
BOBJ410
Page 32 North Carolina Office of the State Controller updated 8-15-17
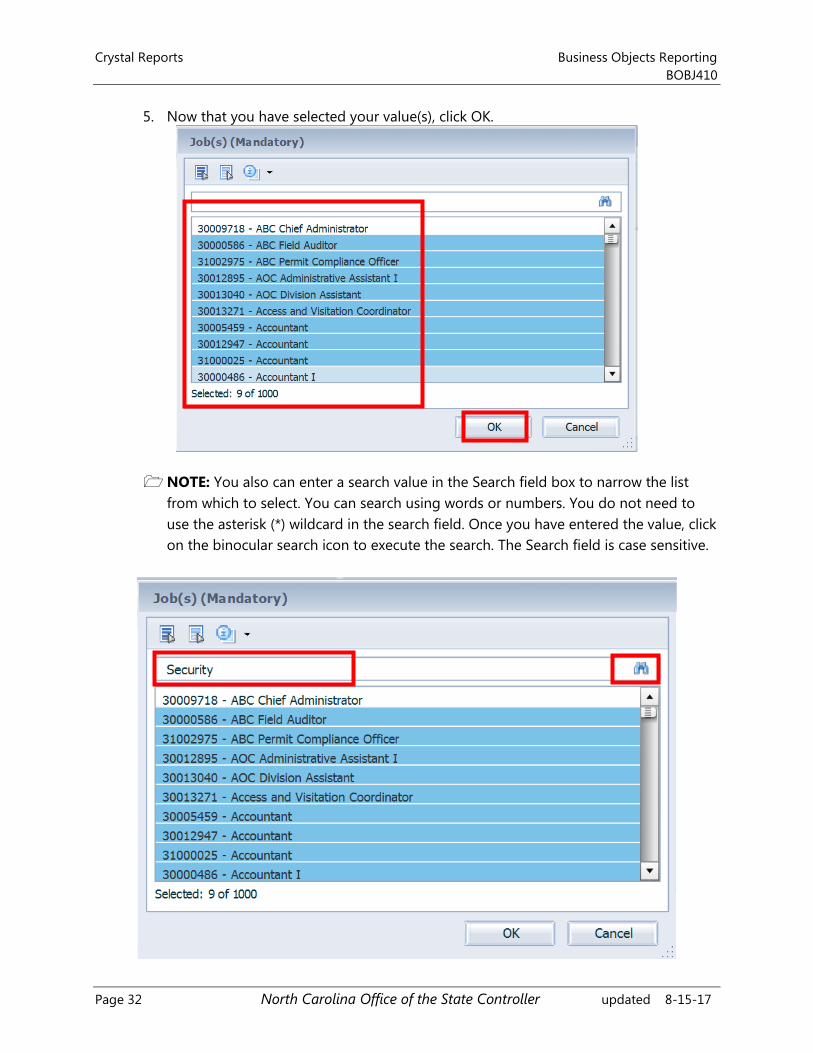
5. Now that you have selected your value(s), click OK.
NOTE: You also can enter a search value in the Search field box to narrow the list
from which to select. You can search using words or numbers. You do not need to
use the asterisk (*) wildcard in the search field. Once you have entered the value, click
on the binocular search icon to execute the search. The Search field is case sensitive.
Business Objects Reporting Crystal Reports
BOBJ410
updated 8-15-17 North Carolina Office of the State Controller Page 33
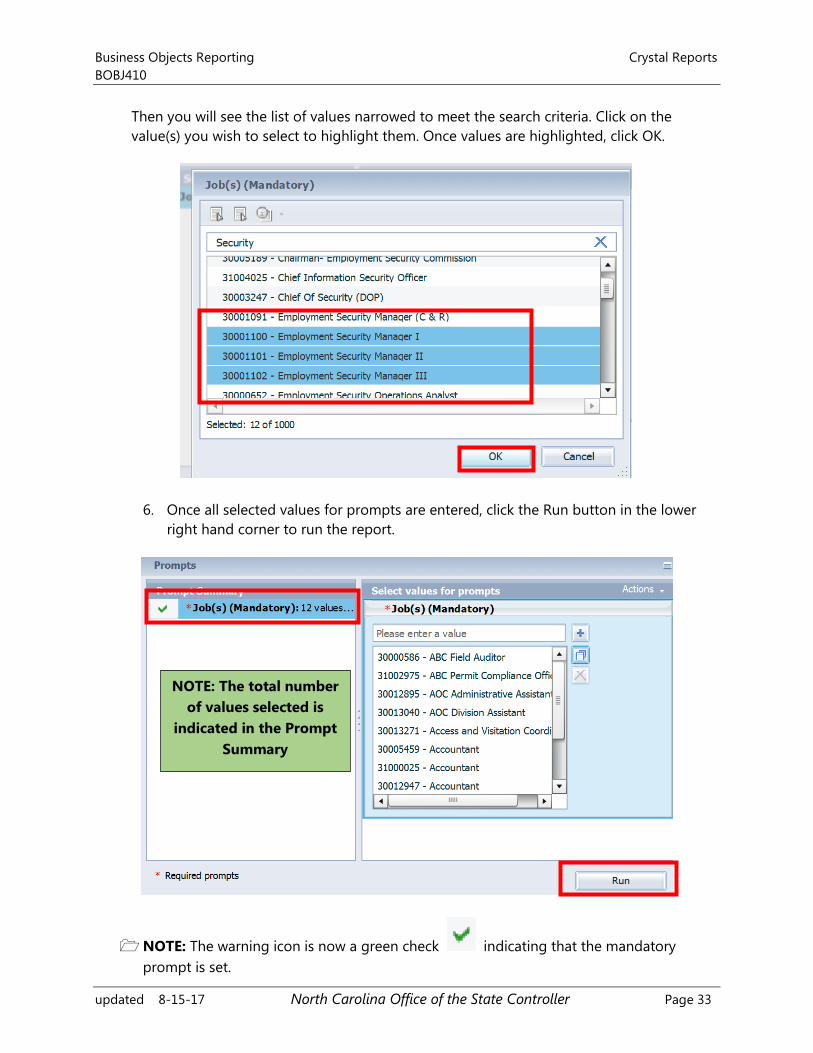
Then you will see the list of values narrowed to meet the search criteria. Click on the
value(s) you wish to select to highlight them. Once values are highlighted, click OK.
6. Once all selected values for prompts are entered, click the Run button in the lower
right hand corner to run the report.
NOTE: The warning icon is now a green check indicating that the mandatory
prompt is set.
NOTE: The total number
of values selected is
indicated in the Prompt
Summary
Crystal Reports Business Objects Reporting
BOBJ410
Page 34 North Carolina Office of the State Controller updated 8-15-17
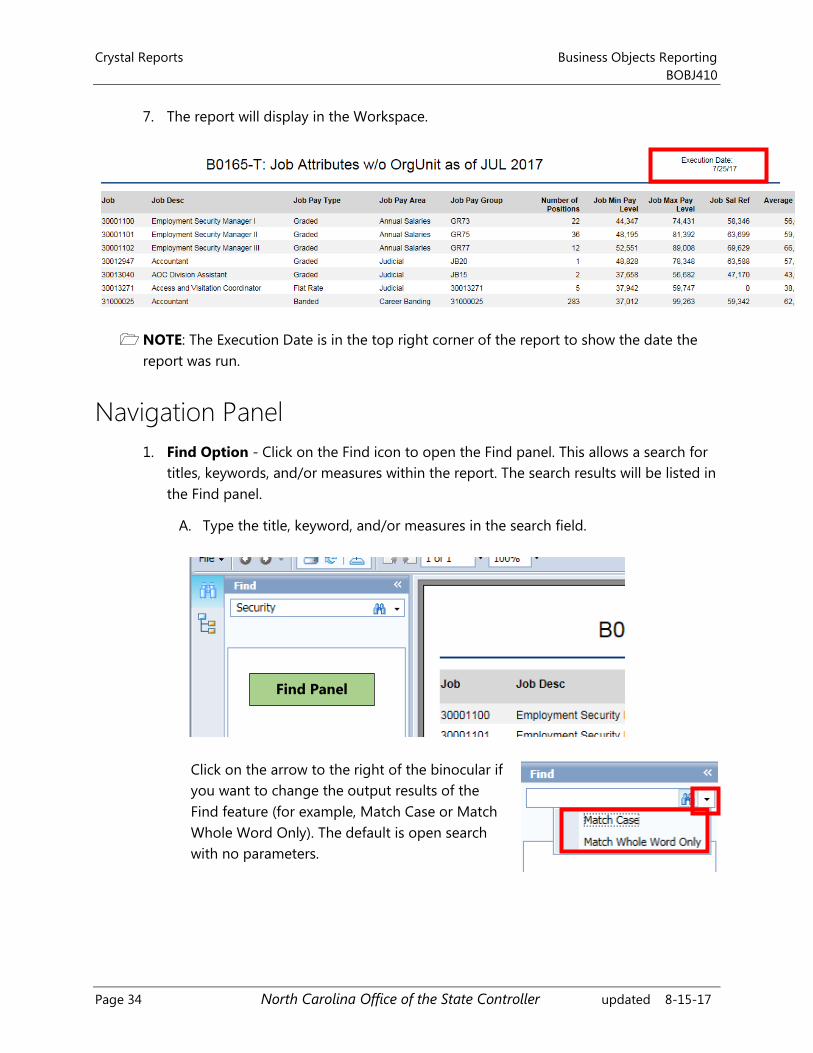
7. The report will display in the Workspace.
NOTE: The Execution Date is in the top right corner of the report to show the date the
report was run.
Navigation Panel
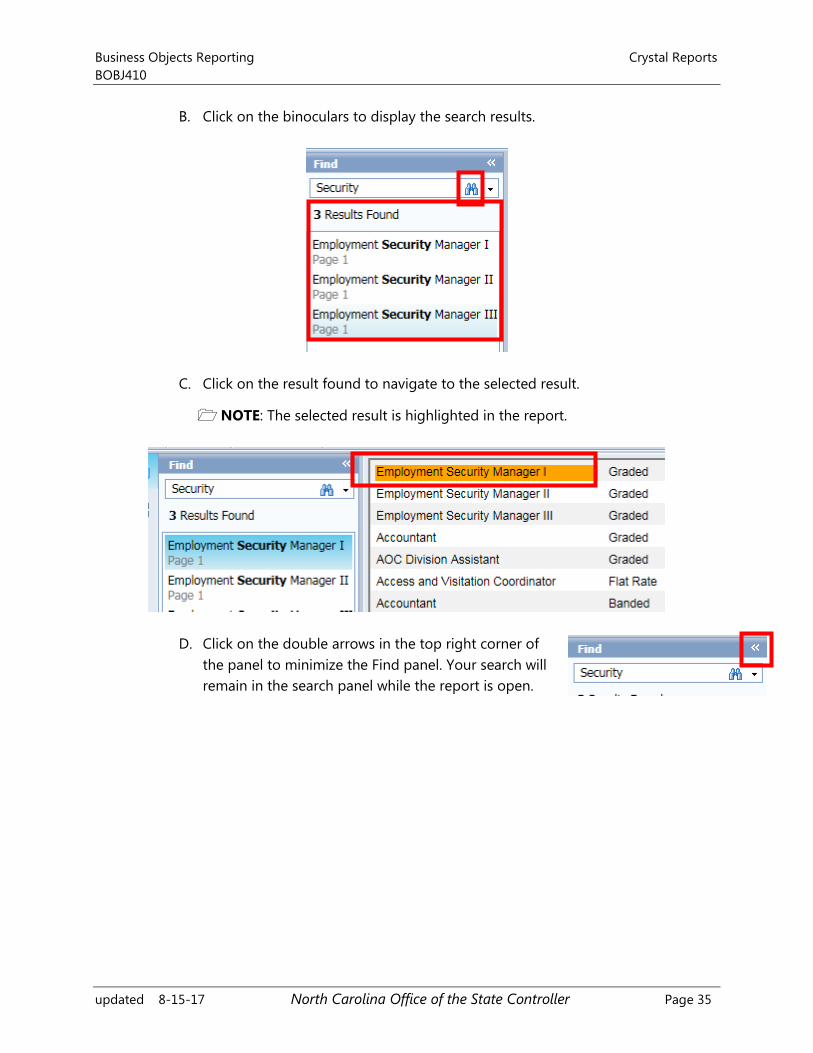
1. Find Option - Click on the Find icon to open the Find panel. This allows a search for
titles, keywords, and/or measures within the report. The search results will be listed in
the Find panel.
A. Type the title, keyword, and/or measures in the search field.
Click on the arrow to the right of the binocular if
you want to change the output results of the
Find feature (for example, Match Case or Match
Whole Word Only). The default is open search
with no parameters.
Find Panel
Business Objects Reporting Crystal Reports
BOBJ410
updated 8-15-17 North Carolina Office of the State Controller Page 35
B. Click on the binoculars to display the search results.
C. Click on the result found to navigate to the selected result.
NOTE: The selected result is highlighted in the report.
D. Click on the double arrows in the top right corner of
the panel to minimize the Find panel. Your search will
remain in the search panel while the report is open.
Crystal Reports Business Objects Reporting
BOBJ410
Page 36 North Carolina Office of the State Controller updated 8-15-17
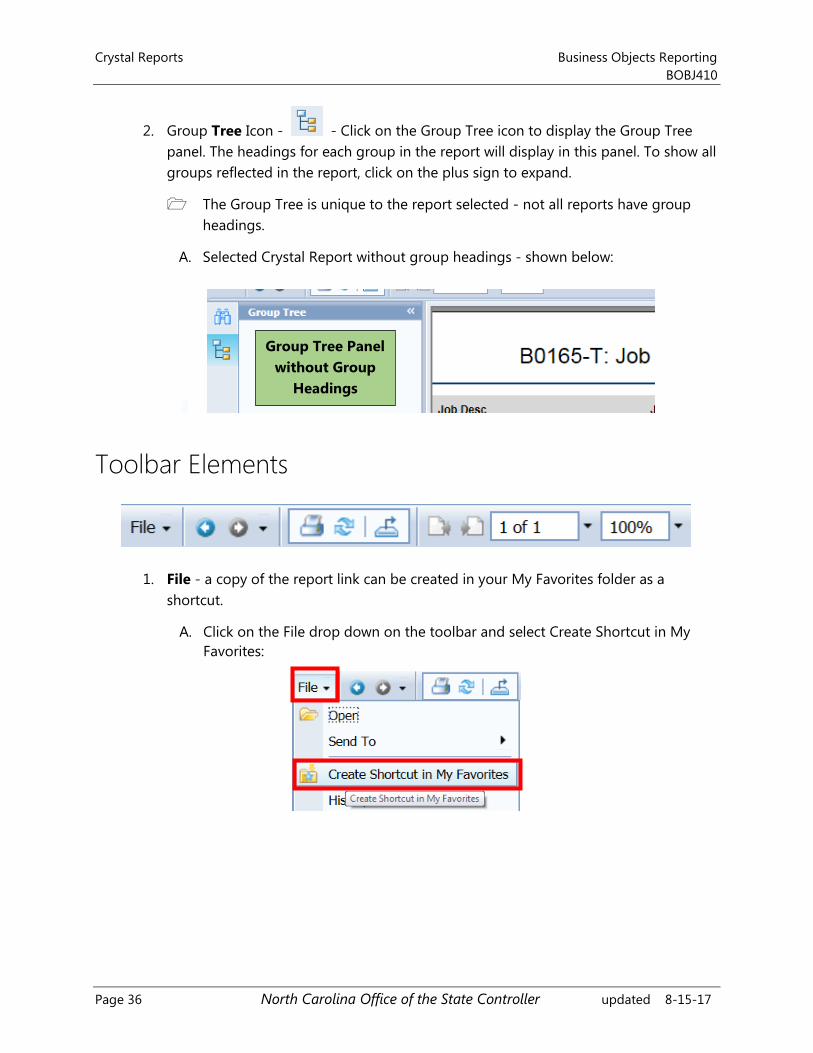
2. Group Tree Icon - - Click on the Group Tree icon to display the Group Tree
panel. The headings for each group in the report will display in this panel. To show all
groups reflected in the report, click on the plus sign to expand.
The Group Tree is unique to the report selected - not all reports have group
headings.
A. Selected Crystal Report without group headings - shown below:
Toolbar Elements
1. File - a copy of the report link can be created in your My Favorites folder as a
shortcut.
A. Click on the File drop down on the toolbar and select Create Shortcut in My
Favorites:
Group Tree Panel
without Group
Headings
Business Objects Reporting Crystal Reports
BOBJ410
updated 8-15-17 North Carolina Office of the State Controller Page 37
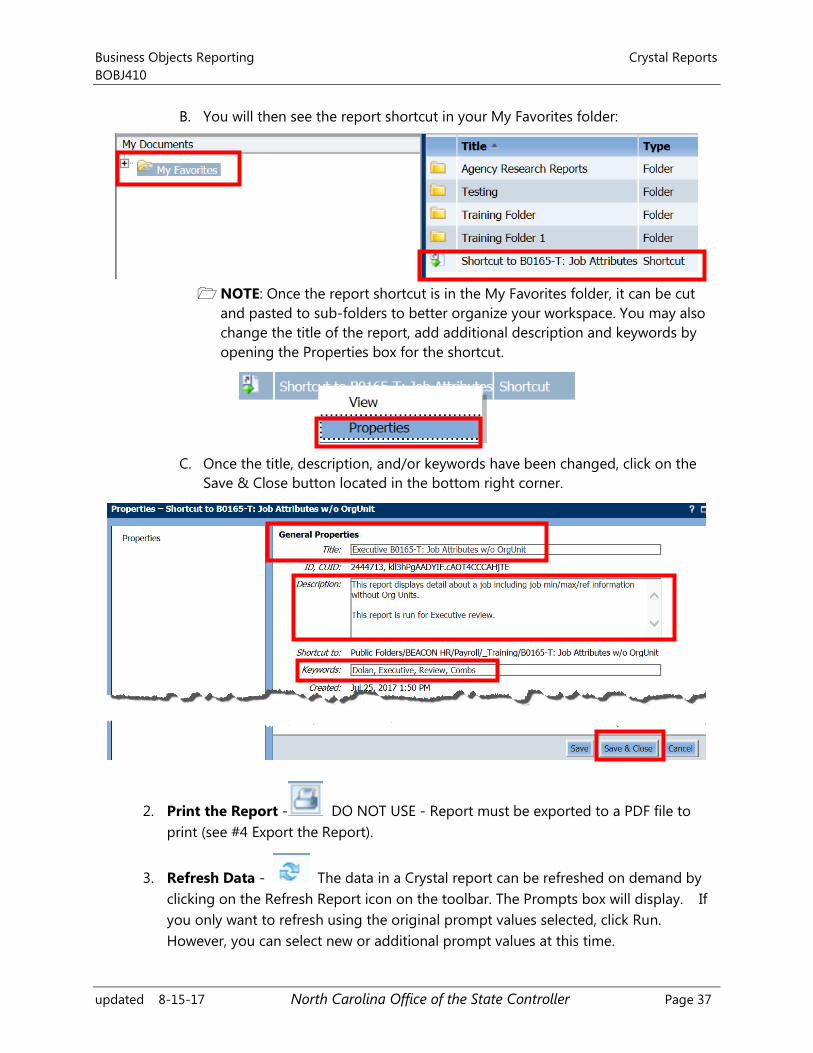
B. You will then see the report shortcut in your My Favorites folder:
NOTE: Once the report shortcut is in the My Favorites folder, it can be cut
and pasted to sub-folders to better organize your workspace. You may also
change the title of the report, add additional description and keywords by
opening the Properties box for the shortcut.
C. Once the title, description, and/or keywords have been changed, click on the
Save & Close button located in the bottom right corner.
2. Print the Report - DO NOT USE - Report must be exported to a PDF file to
print (see #4 Export the Report).
3. Refresh Data - The data in a Crystal report can be refreshed on demand by
clicking on the Refresh Report icon on the toolbar. The Prompts box will display. If
you only want to refresh using the original prompt values selected, click Run.
However, you can select new or additional prompt values at this time.
Crystal Reports Business Objects Reporting
BOBJ410
Page 38 North Carolina Office of the State Controller updated 8-15-17
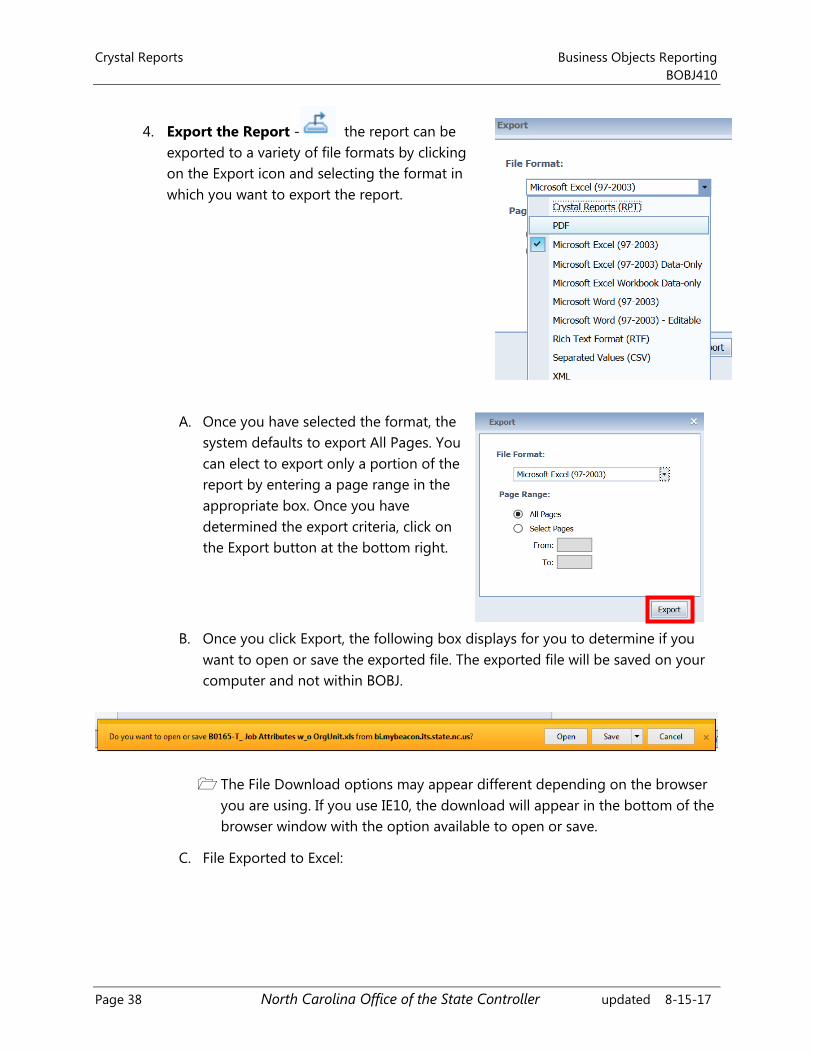
4. Export the Report - the report can be
exported to a variety of file formats by clicking
on the Export icon and selecting the format in
which you want to export the report.
A. Once you have selected the format, the
system defaults to export All Pages. You
can elect to export only a portion of the
report by entering a page range in the
appropriate box. Once you have
determined the export criteria, click on
the Export button at the bottom right.
B. Once you click Export, the following box displays for you to determine if you
want to open or save the exported file. The exported file will be saved on your
computer and not within BOBJ.
The File Download options may appear different depending on the browser
you are using. If you use IE10, the download will appear in the bottom of the
browser window with the option available to open or save.
C. File Exported to Excel:
Business Objects Reporting Crystal Reports
BOBJ410
updated 8-15-17 North Carolina Office of the State Controller Page 39
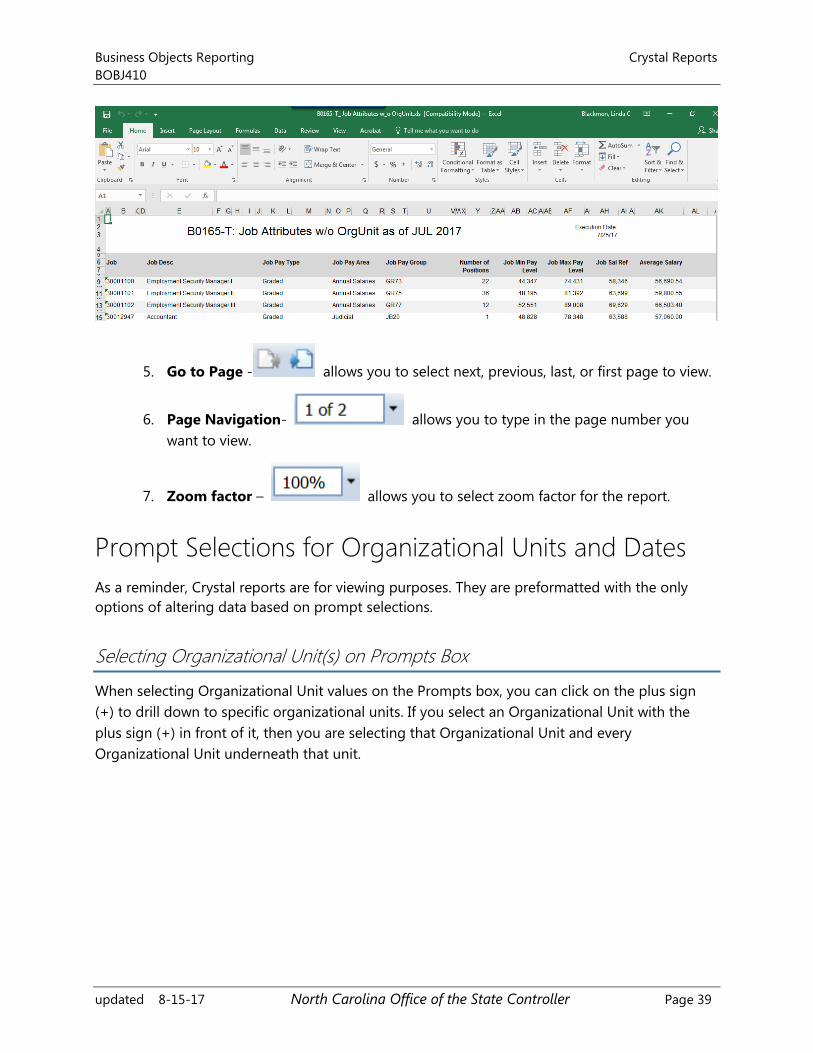
5. Go to Page - allows you to select next, previous, last, or first page to view.
6. Page Navigation- allows you to type in the page number you
want to view.
7. Zoom factor – allows you to select zoom factor for the report.
Prompt Selections for Organizational Units and Dates
As a reminder, Crystal reports are for viewing purposes. They are preformatted with the only
options of altering data based on prompt selections.
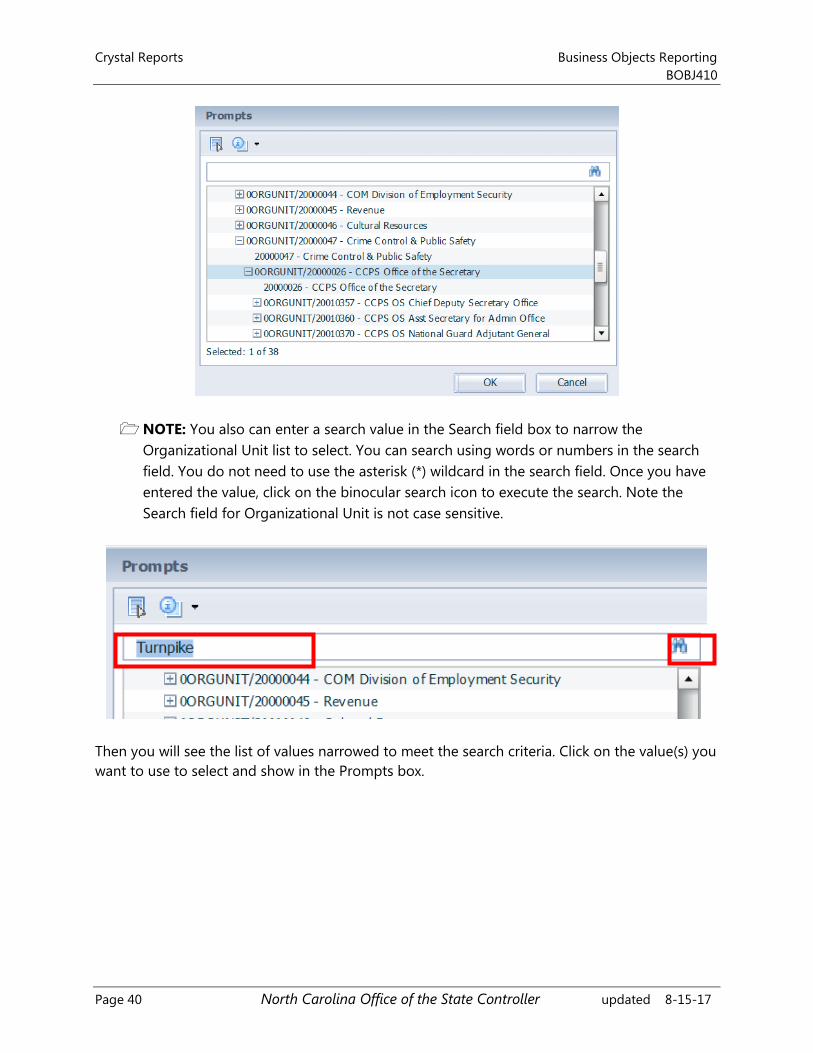
Selecting Organizational Unit(s) on Prompts Box
When selecting Organizational Unit values on the Prompts box, you can click on the plus sign
(+) to drill down to specific organizational units. If you select an Organizational Unit with the
plus sign (+) in front of it, then you are selecting that Organizational Unit and every
Organizational Unit underneath that unit.
Crystal Reports Business Objects Reporting
BOBJ410
Page 40 North Carolina Office of the State Controller updated 8-15-17
NOTE: You also can enter a search value in the Search field box to narrow the
Organizational Unit list to select. You can search using words or numbers in the search
field. You do not need to use the asterisk (*) wildcard in the search field. Once you have
entered the value, click on the binocular search icon to execute the search. Note the
Search field for Organizational Unit is not case sensitive.
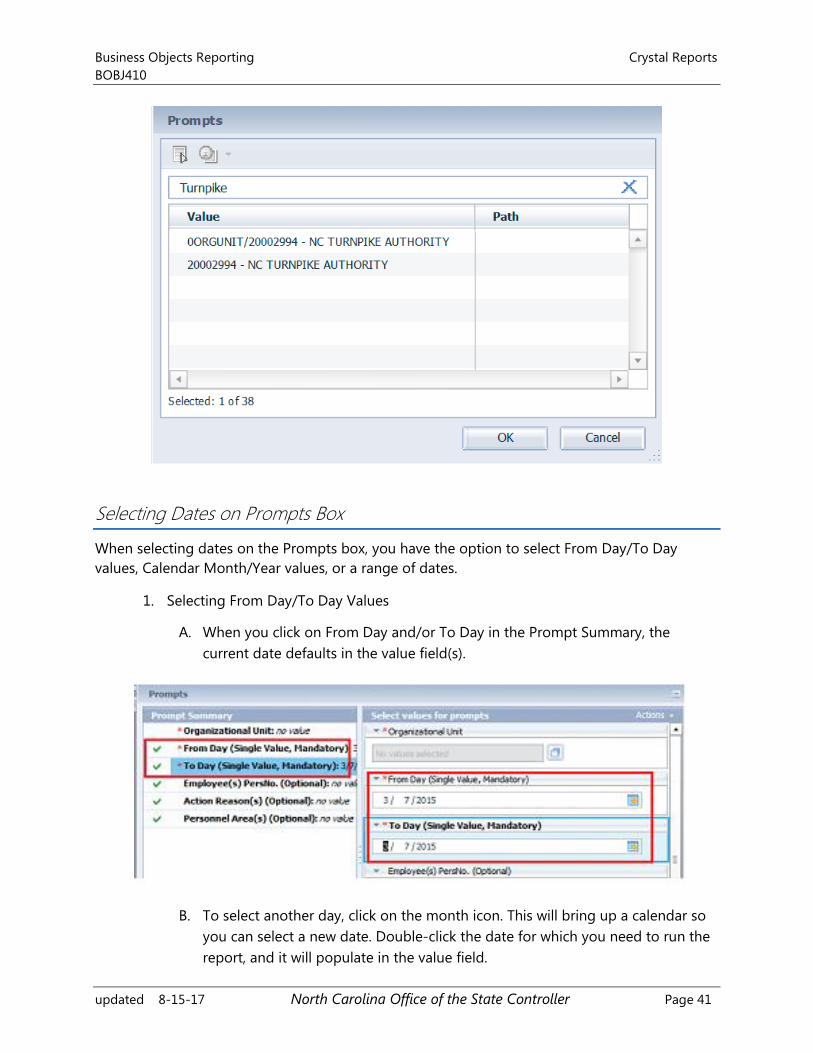
Then you will see the list of values narrowed to meet the search criteria. Click on the value(s) you
want to use to select and show in the Prompts box.
Business Objects Reporting Crystal Reports
BOBJ410
updated 8-15-17 North Carolina Office of the State Controller Page 41
Selecting Dates on Prompts Box
When selecting dates on the Prompts box, you have the option to select From Day/To Day
values, Calendar Month/Year values, or a range of dates.
1. Selecting From Day/To Day Values
A. When you click on From Day and/or To Day in the Prompt Summary, the
current date defaults in the value field(s).
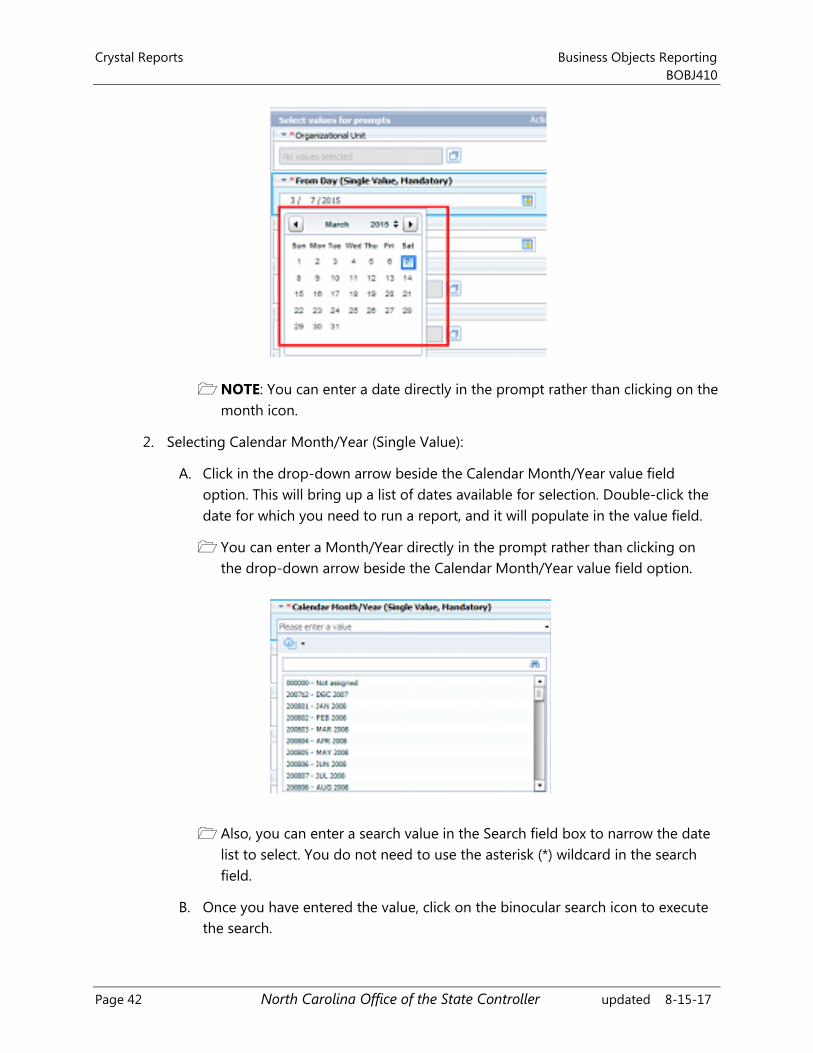
B. To select another day, click on the month icon. This will bring up a calendar so
you can select a new date. Double-click the date for which you need to run the
report, and it will populate in the value field.
Crystal Reports Business Objects Reporting
BOBJ410
Page 42 North Carolina Office of the State Controller updated 8-15-17
NOTE: You can enter a date directly in the prompt rather than clicking on the
month icon.
2. Selecting Calendar Month/Year (Single Value):
A. Click in the drop-down arrow beside the Calendar Month/Year value field
option. This will bring up a list of dates available for selection. Double-click the
date for which you need to run a report, and it will populate in the value field.
You can enter a Month/Year directly in the prompt rather than clicking on
the drop-down arrow beside the Calendar Month/Year value field option.
Also, you can enter a search value in the Search field box to narrow the date
list to select. You do not need to use the asterisk (*) wildcard in the search
field.
B. Once you have entered the value, click on the binocular search icon to execute
the search.
Business Objects Reporting Crystal Reports
BOBJ410
updated 8-15-17 North Carolina Office of the State Controller Page 43
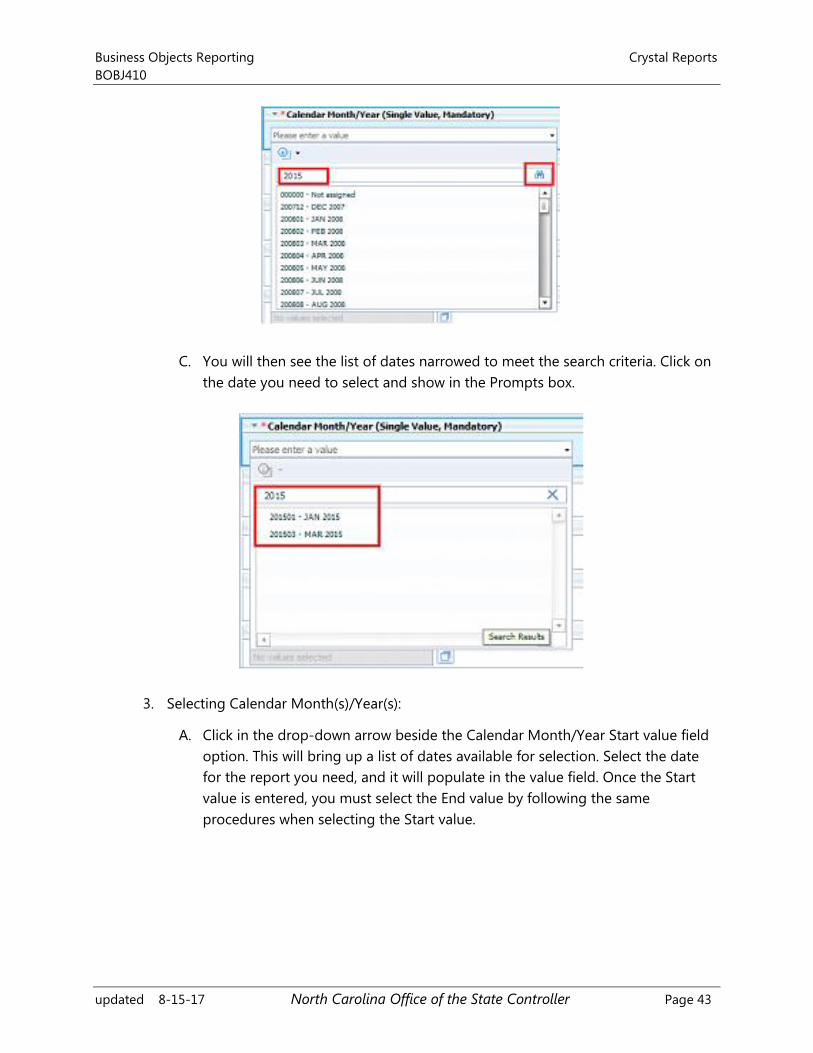
C. You will then see the list of dates narrowed to meet the search criteria. Click on
the date you need to select and show in the Prompts box.
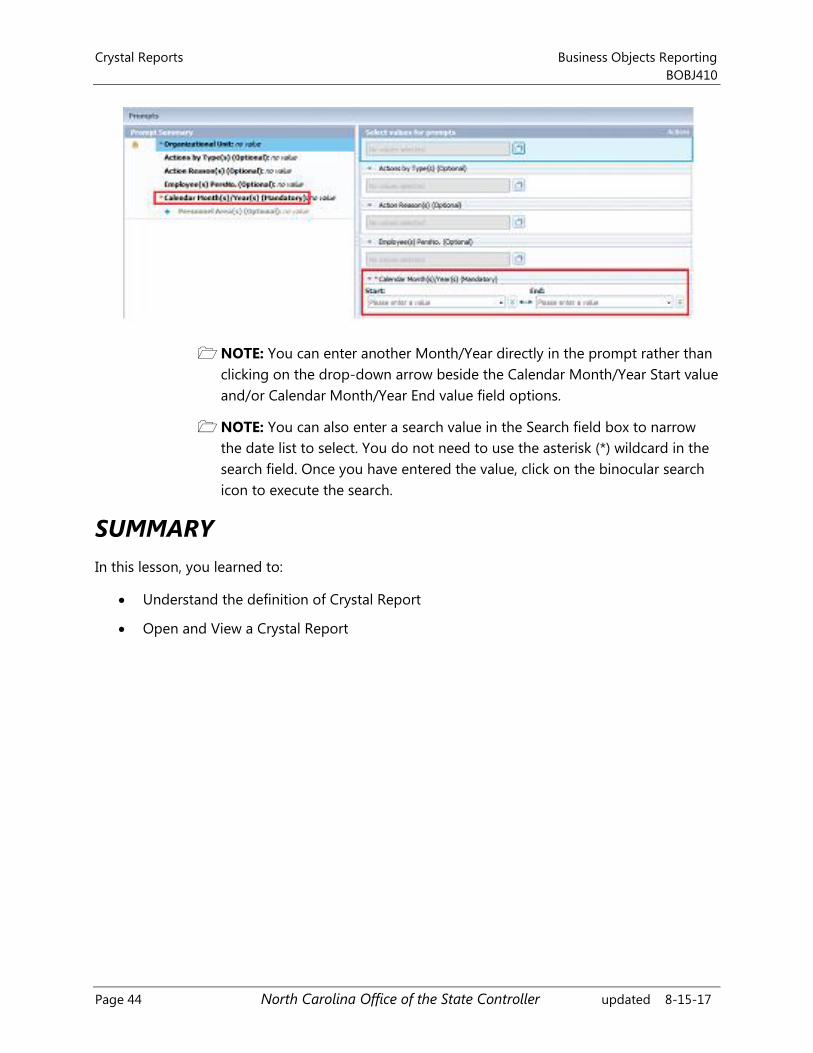
3. Selecting Calendar Month(s)/Year(s):
A. Click in the drop-down arrow beside the Calendar Month/Year Start value field
option. This will bring up a list of dates available for selection. Select the date
for the report you need, and it will populate in the value field. Once the Start
value is entered, you must select the End value by following the same
procedures when selecting the Start value.
Crystal Reports Business Objects Reporting
BOBJ410
Page 44 North Carolina Office of the State Controller updated 8-15-17
NOTE: You can enter another Month/Year directly in the prompt rather than
clicking on the drop-down arrow beside the Calendar Month/Year Start value
and/or Calendar Month/Year End value field options.
NOTE: You can also enter a search value in the Search field box to narrow
the date list to select. You do not need to use the asterisk (*) wildcard in the
search field. Once you have entered the value, click on the binocular search
icon to execute the search.
SUMMARY
In this lesson, you learned to:
Understand the definition of Crystal Report
Open and View a Crystal Report
Business Objects Reporting WEBI Reading
BOBJ410
updated 8-15-17 North Carolina Office of the State Controller Page 45
Objectives
Understand the definition of Web intelligence (WEBI) - Reading Mode
Open and view a Web Intelligence Report
Definition of Web Intelligence
Web Intelligence (WEBI) allows you to perform querying, reporting and analysis tasks all in a
single tool. It provides an easy-to-use interface with powerful query features that allows your
business analysts and nontechnical information consumers to ask spontaneous and iterative
business questions of their data.
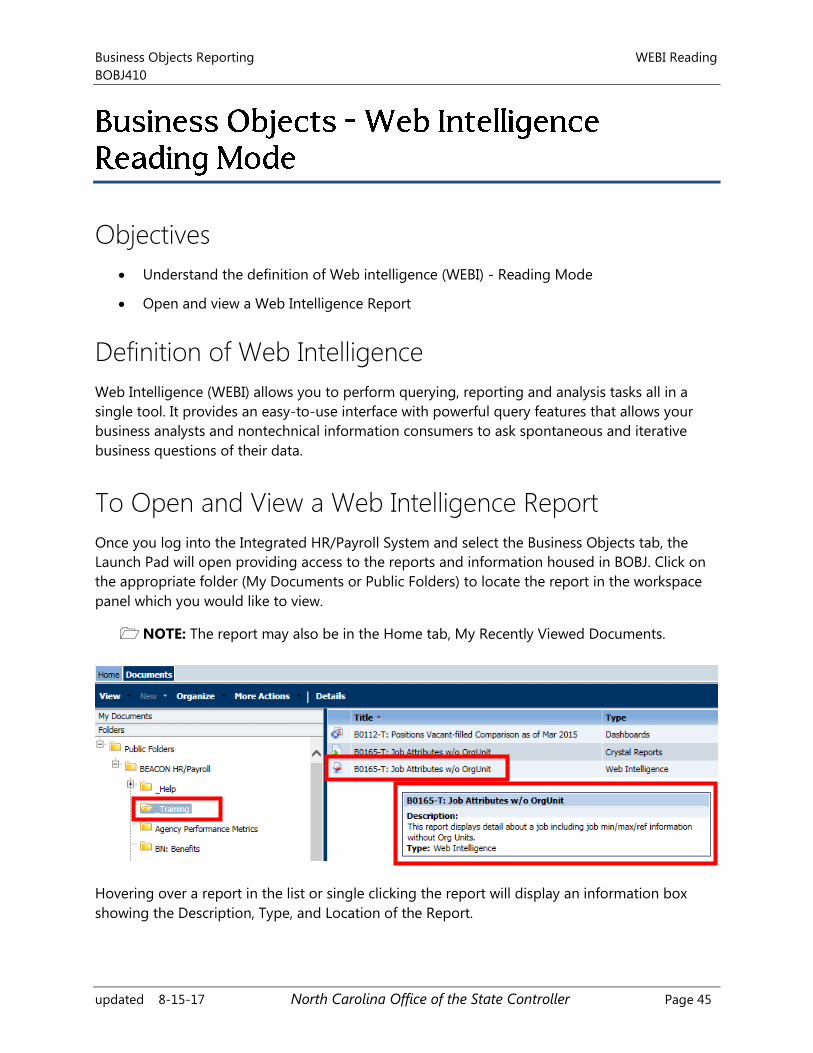
To Open and View a Web Intelligence Report
Once you log into the Integrated HR/Payroll System and select the Business Objects tab, the
Launch Pad will open providing access to the reports and information housed in BOBJ. Click on
the appropriate folder (My Documents or Public Folders) to locate the report in the workspace
panel which you would like to view.
NOTE: The report may also be in the Home tab, My Recently Viewed Documents.
Hovering over a report in the list or single clicking the report will display an information box
showing the Description, Type, and Location of the Report.
WEBI Reading Business Objects Reporting
BOBJ410
Page 46 North Carolina Office of the State Controller updated 8-15-17
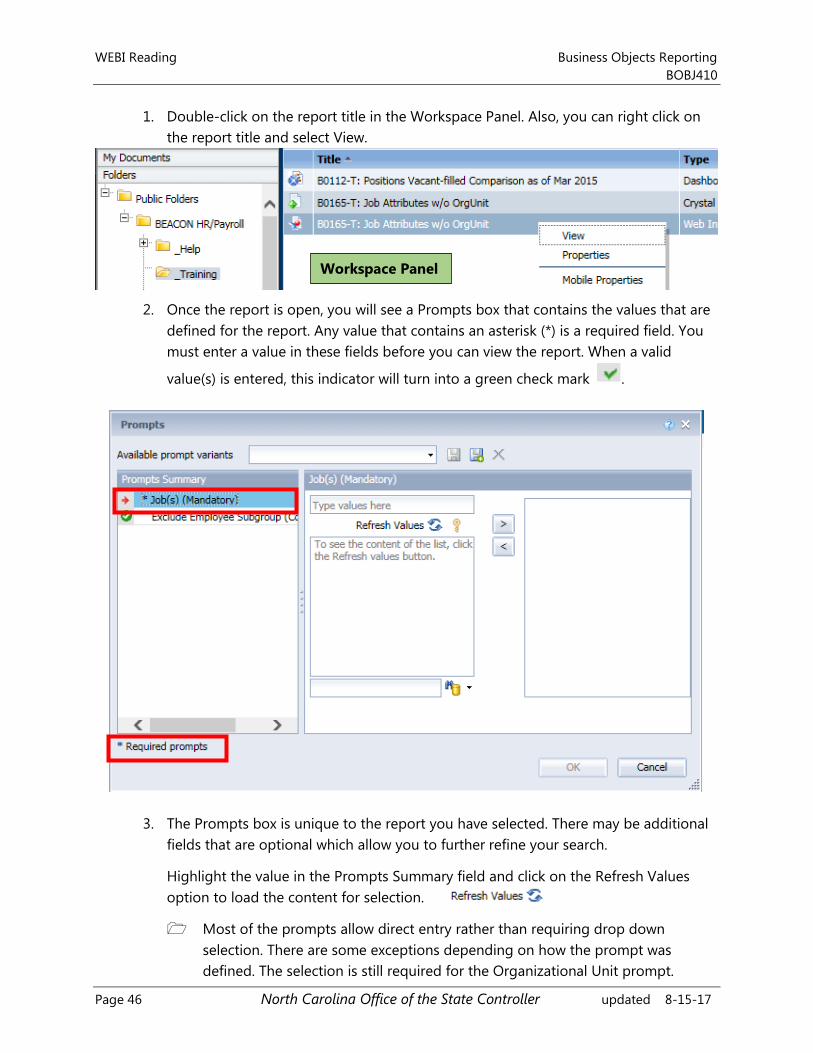
1. Double-click on the report title in the Workspace Panel. Also, you can right click on
the report title and select View.
2. Once the report is open, you will see a Prompts box that contains the values that are
defined for the report. Any value that contains an asterisk (*) is a required field. You
must enter a value in these fields before you can view the report. When a valid
value(s) is entered, this indicator will turn into a green check mark .
3. The Prompts box is unique to the report you have selected. There may be additional
fields that are optional which allow you to further refine your search.
Highlight the value in the Prompts Summary field and click on the Refresh Values
option to load the content for selection.
Most of the prompts allow direct entry rather than requiring drop down
selection. There are some exceptions depending on how the prompt was
defined. The selection is still required for the Organizational Unit prompt.
Workspace Panel
Business Objects Reporting WEBI Reading
BOBJ410
updated 8-15-17 North Carolina Office of the State Controller Page 47
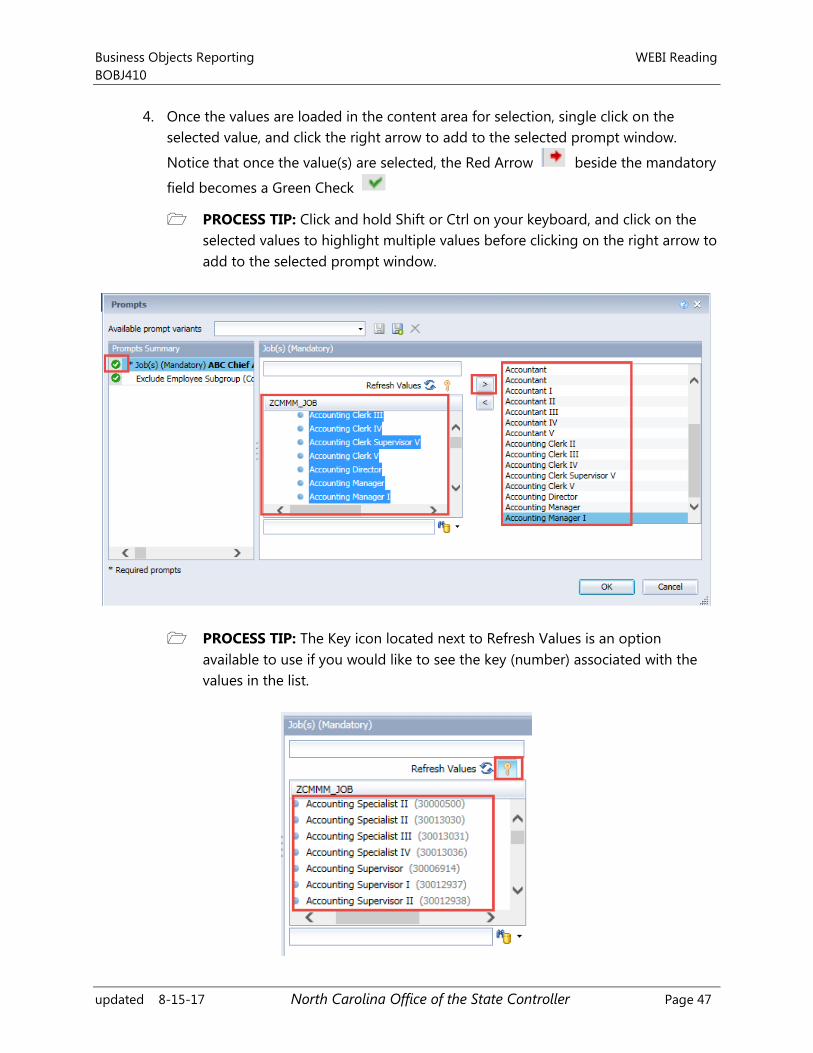
4. Once the values are loaded in the content area for selection, single click on the
selected value, and click the right arrow to add to the selected prompt window.
Notice that once the value(s) are selected, the Red Arrow beside the mandatory
field becomes a Green Check
PROCESS TIP: Click and hold Shift or Ctrl on your keyboard, and click on the
selected values to highlight multiple values before clicking on the right arrow to
add to the selected prompt window.
PROCESS TIP: The Key icon located next to Refresh Values is an option
available to use if you would like to see the key (number) associated with the
values in the list.
WEBI Reading Business Objects Reporting
BOBJ410
Page 48 North Carolina Office of the State Controller updated 8-15-17
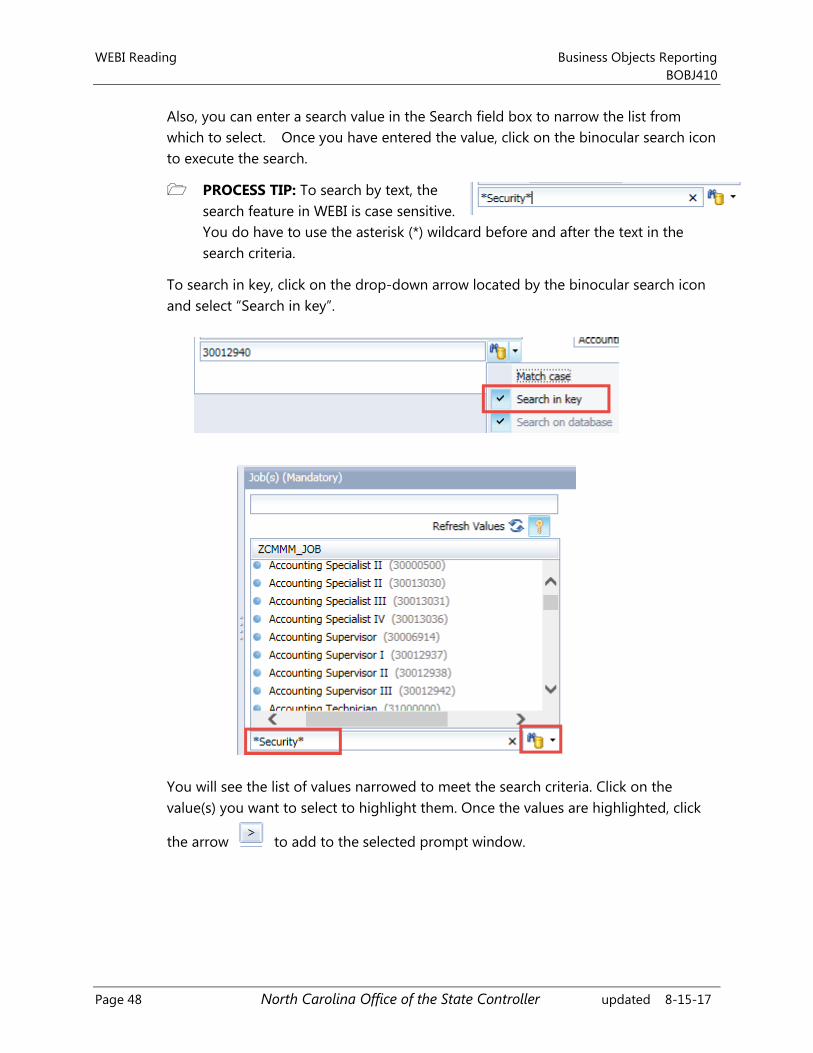
Also, you can enter a search value in the Search field box to narrow the list from
which to select. Once you have entered the value, click on the binocular search icon
to execute the search.
PROCESS TIP: To search by text, the
search feature in WEBI is case sensitive.
You do have to use the asterisk (*) wildcard before and after the text in the
search criteria.
To search in key, click on the drop-down arrow located by the binocular search icon
and select “Search in key”.
You will see the list of values narrowed to meet the search criteria. Click on the
value(s) you want to select to highlight them. Once the values are highlighted, click
the arrow to add to the selected prompt window.
Business Objects Reporting WEBI Reading
BOBJ410
updated 8-15-17 North Carolina Office of the State Controller Page 49
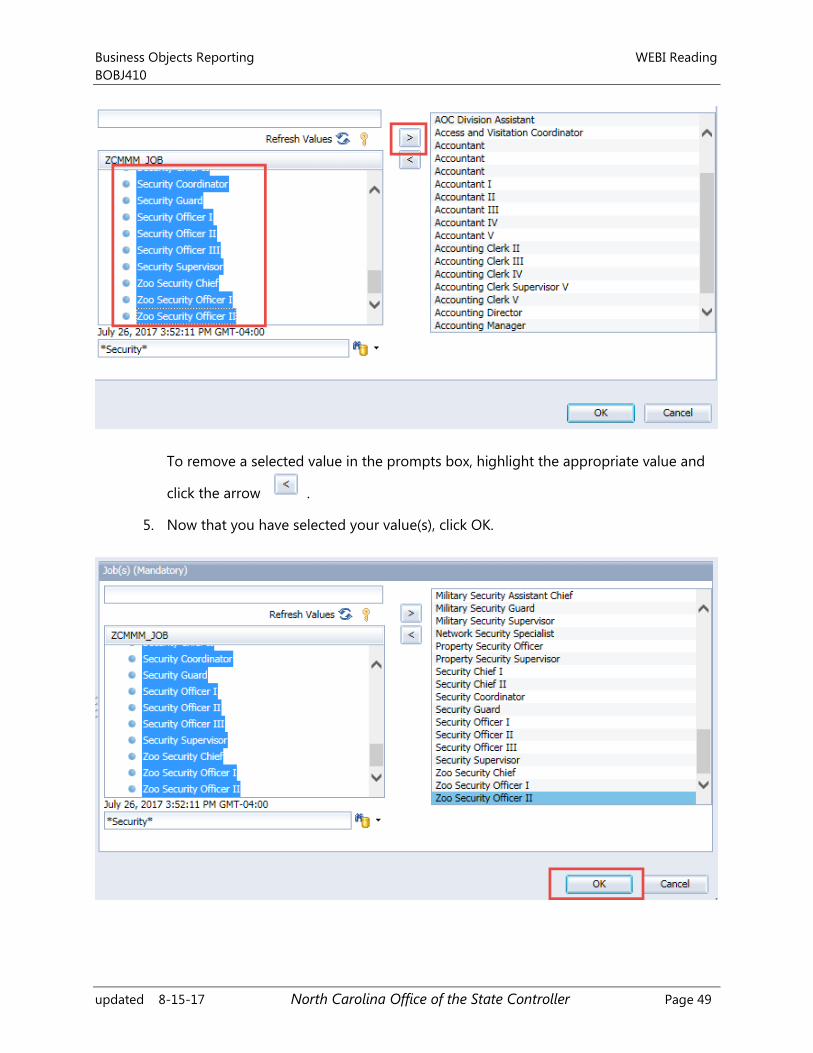
To remove a selected value in the prompts box, highlight the appropriate value and
click the arrow .
5. Now that you have selected your value(s), click OK.
WEBI Reading Business Objects Reporting
BOBJ410
Page 50 North Carolina Office of the State Controller updated 8-15-17
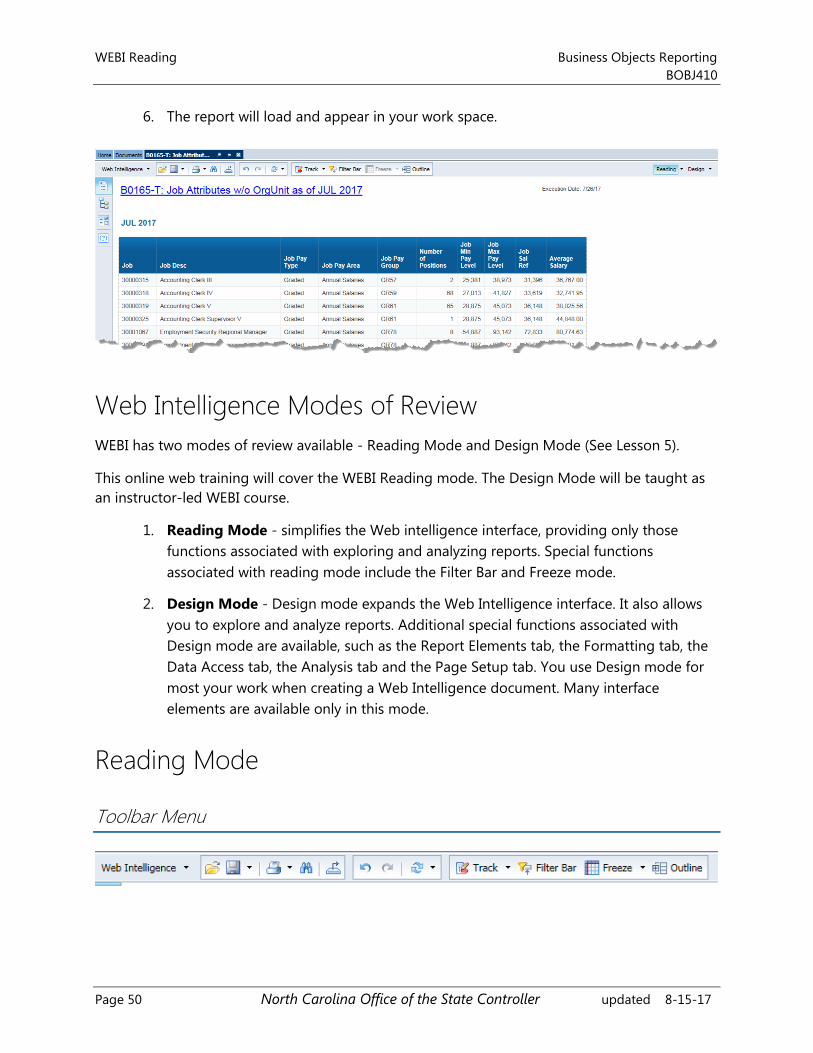
6. The report will load and appear in your work space.
Web Intelligence Modes of Review
WEBI has two modes of review available - Reading Mode and Design Mode (See Lesson 5).
This online web training will cover the WEBI Reading mode. The Design Mode will be taught as
an instructor-led WEBI course.
1. Reading Mode - simplifies the Web intelligence interface, providing only those
functions associated with exploring and analyzing reports. Special functions
associated with reading mode include the Filter Bar and Freeze mode.
2. Design Mode - Design mode expands the Web Intelligence interface. It also allows
you to explore and analyze reports. Additional special functions associated with
Design mode are available, such as the Report Elements tab, the Formatting tab, the
Data Access tab, the Analysis tab and the Page Setup tab. You use Design mode for
most your work when creating a Web Intelligence document. Many interface
elements are available only in this mode.
Reading Mode
Toolbar Menu
Business Objects Reporting WEBI Reading
BOBJ410
updated 8-15-17 North Carolina Office of the State Controller Page 51
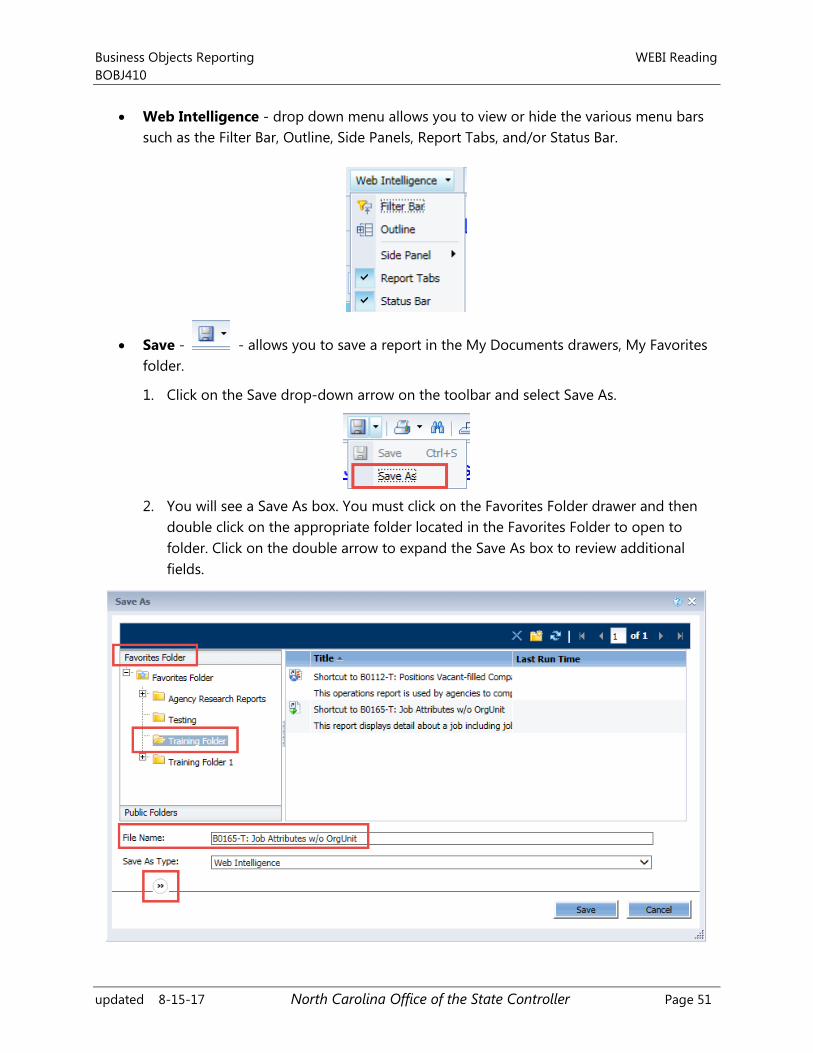
Web Intelligence - drop down menu allows you to view or hide the various menu bars
such as the Filter Bar, Outline, Side Panels, Report Tabs, and/or Status Bar.
Save - - allows you to save a report in the My Documents drawers, My Favorites
folder.
1. Click on the Save drop-down arrow on the toolbar and select Save As.
2. You will see a Save As box. You must click on the Favorites Folder drawer and then
double click on the appropriate folder located in the Favorites Folder to open to
folder. Click on the double arrow to expand the Save As box to review additional
fields.
WEBI Reading Business Objects Reporting
BOBJ410
Page 52 North Carolina Office of the State Controller updated 8-15-17
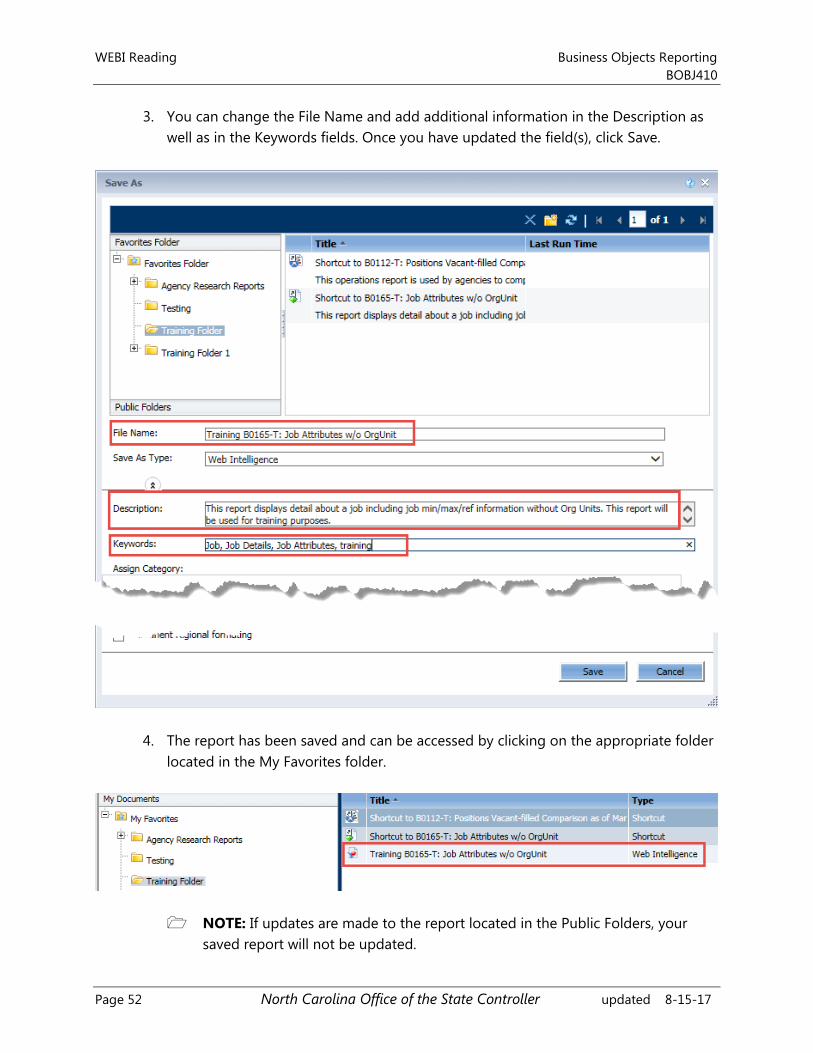
3. You can change the File Name and add additional information in the Description as
well as in the Keywords fields. Once you have updated the field(s), click Save.
4. The report has been saved and can be accessed by clicking on the appropriate folder
located in the My Favorites folder.
NOTE: If updates are made to the report located in the Public Folders, your
saved report will not be updated.
Business Objects Reporting WEBI Reading
BOBJ410
updated 8-15-17 North Carolina Office of the State Controller Page 53
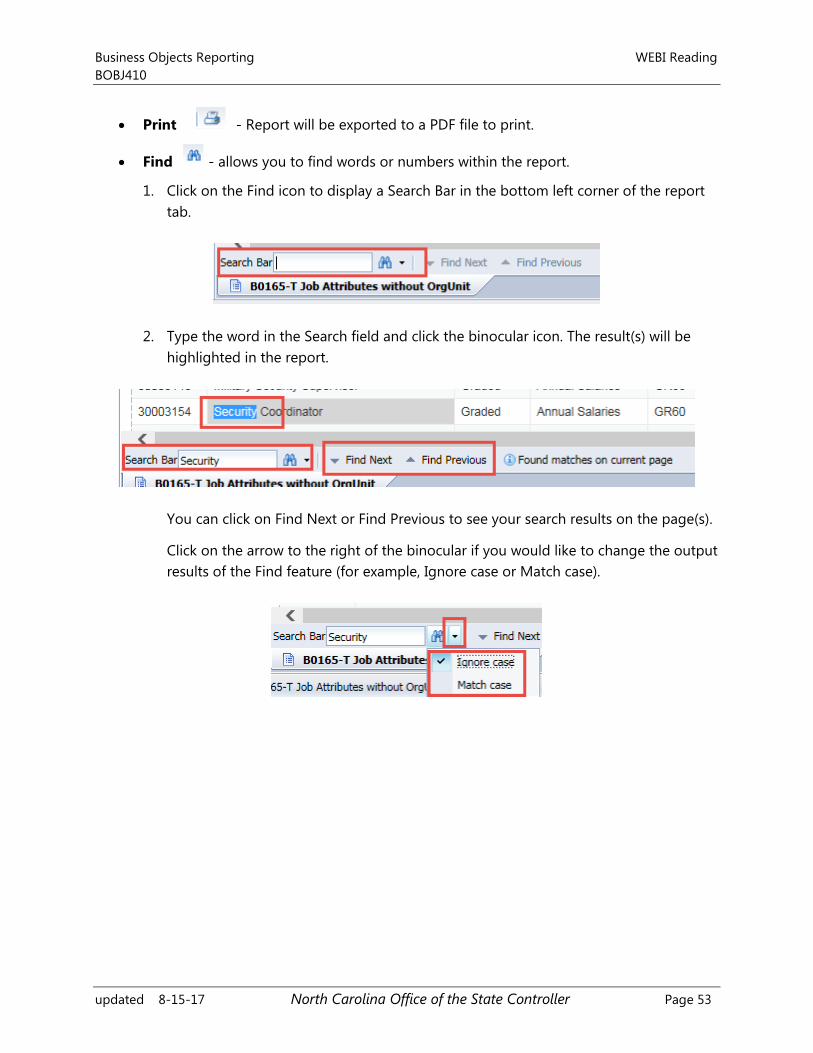
Print - Report will be exported to a PDF file to print.
Find - allows you to find words or numbers within the report.
1. Click on the Find icon to display a Search Bar in the bottom left corner of the report
tab.
2. Type the word in the Search field and click the binocular icon. The result(s) will be
highlighted in the report.
You can click on Find Next or Find Previous to see your search results on the page(s).
Click on the arrow to the right of the binocular if you would like to change the output
results of the Find feature (for example, Ignore case or Match case).
WEBI Reading Business Objects Reporting
BOBJ410
Page 54 North Carolina Office of the State Controller updated 8-15-17
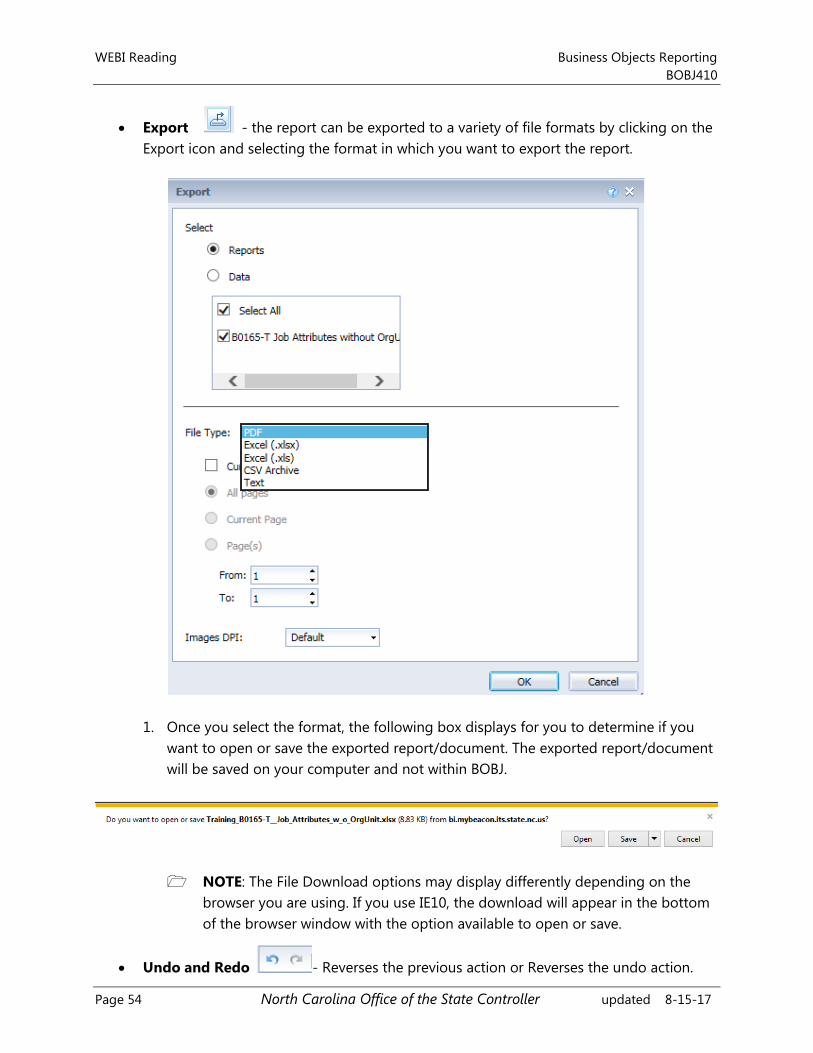
Export - the report can be exported to a variety of file formats by clicking on the
Export icon and selecting the format in which you want to export the report.
1. Once you select the format, the following box displays for you to determine if you
want to open or save the exported report/document. The exported report/document
will be saved on your computer and not within BOBJ.
NOTE: The File Download options may display differently depending on the
browser you are using. If you use IE10, the download will appear in the bottom
of the browser window with the option available to open or save.
Undo and Redo - Reverses the previous action or Reverses the undo action.
Business Objects Reporting WEBI Reading
BOBJ410
updated 8-15-17 North Carolina Office of the State Controller Page 55
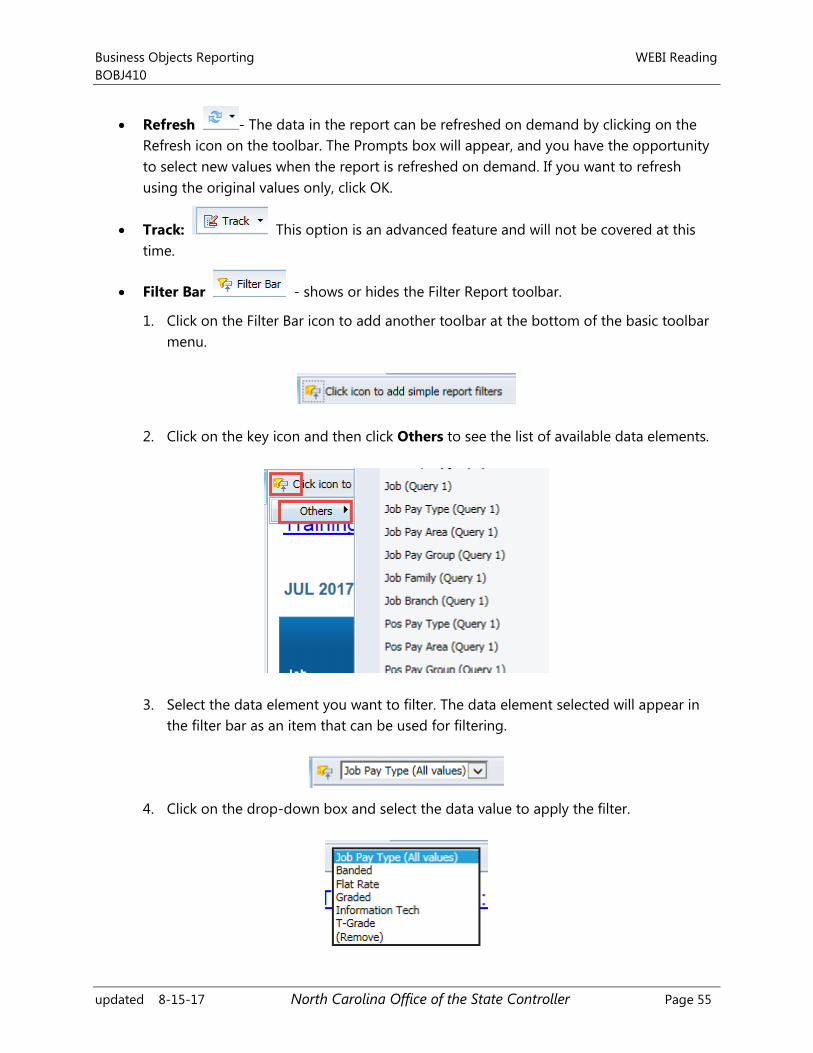
Refresh - The data in the report can be refreshed on demand by clicking on the
Refresh icon on the toolbar. The Prompts box will appear, and you have the opportunity
to select new values when the report is refreshed on demand. If you want to refresh
using the original values only, click OK.
Track: This option is an advanced feature and will not be covered at this
time.
Filter Bar - shows or hides the Filter Report toolbar.
1. Click on the Filter Bar icon to add another toolbar at the bottom of the basic toolbar
menu.
2. Click on the key icon and then click Others to see the list of available data elements.
3. Select the data element you want to filter. The data element selected will appear in
the filter bar as an item that can be used for filtering.
4. Click on the drop-down box and select the data value to apply the filter.
WEBI Reading Business Objects Reporting
BOBJ410
Page 56 North Carolina Office of the State Controller updated 8-15-17
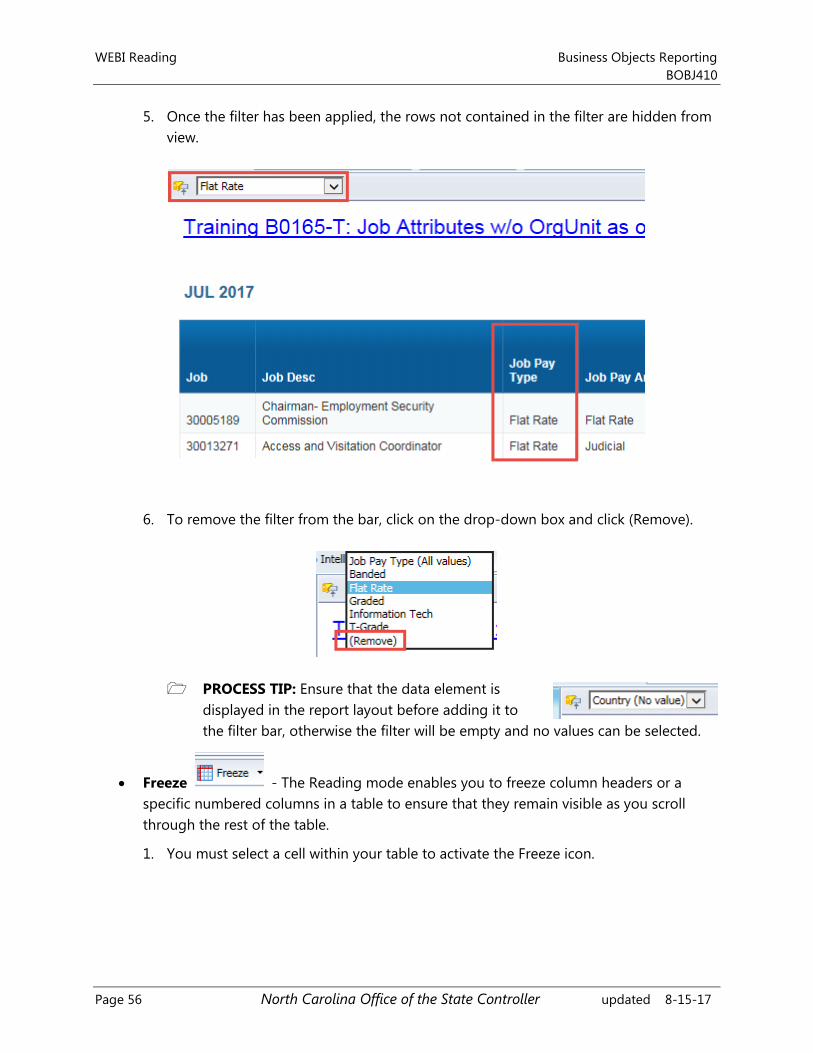
5. Once the filter has been applied, the rows not contained in the filter are hidden from
view.
6. To remove the filter from the bar, click on the drop-down box and click (Remove).
PROCESS TIP: Ensure that the data element is
displayed in the report layout before adding it to
the filter bar, otherwise the filter will be empty and no values can be selected.
Freeze - The Reading mode enables you to freeze column headers or a
specific numbered columns in a table to ensure that they remain visible as you scroll
through the rest of the table.
1. You must select a cell within your table to activate the Freeze icon.
Business Objects Reporting WEBI Reading
BOBJ410
updated 8-15-17 North Carolina Office of the State Controller Page 57
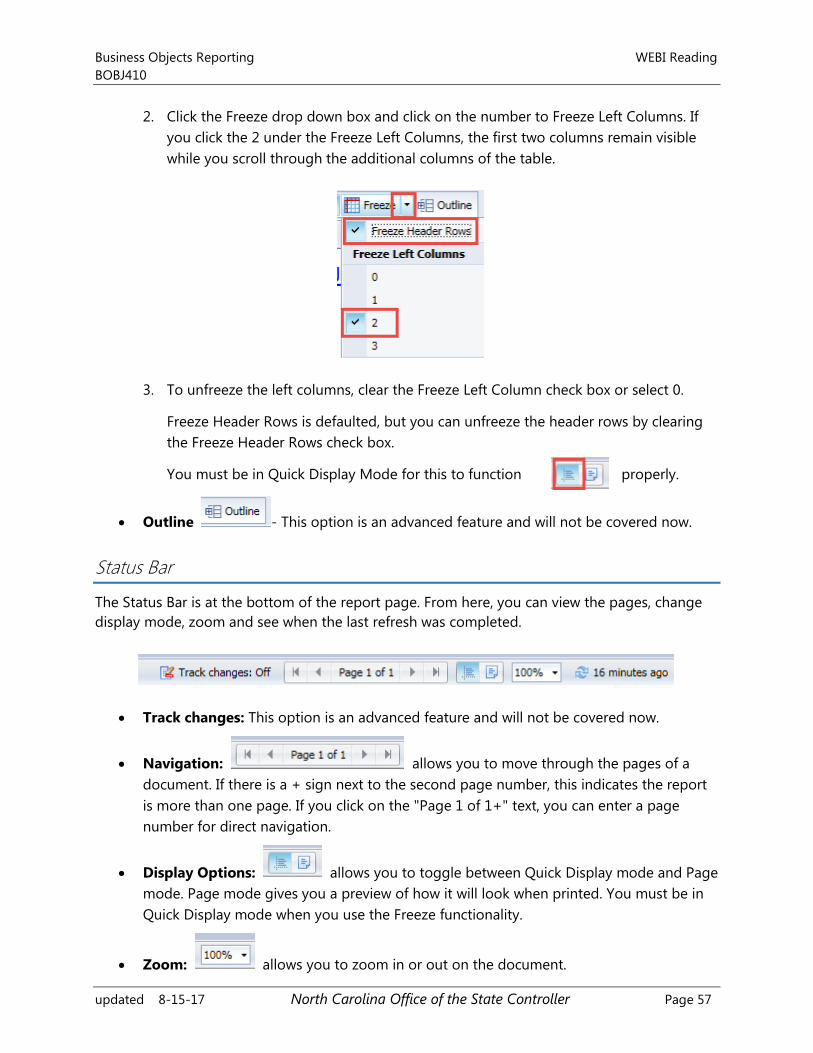
2. Click the Freeze drop down box and click on the number to Freeze Left Columns. If
you click the 2 under the Freeze Left Columns, the first two columns remain visible
while you scroll through the additional columns of the table.
3. To unfreeze the left columns, clear the Freeze Left Column check box or select 0.
Freeze Header Rows is defaulted, but you can unfreeze the header rows by clearing
the Freeze Header Rows check box.
You must be in Quick Display Mode for this to function properly.
Outline - This option is an advanced feature and will not be covered now.
Status Bar
The Status Bar is at the bottom of the report page. From here, you can view the pages, change
display mode, zoom and see when the last refresh was completed.
Track changes: This option is an advanced feature and will not be covered now.
Navigation: allows you to move through the pages of a
document. If there is a + sign next to the second page number, this indicates the report
is more than one page. If you click on the "Page 1 of 1+" text, you can enter a page
number for direct navigation.
Display Options: allows you to toggle between Quick Display mode and Page
mode. Page mode gives you a preview of how it will look when printed. You must be in
Quick Display mode when you use the Freeze functionality.
Zoom: allows you to zoom in or out on the document.
WEBI Reading Business Objects Reporting
BOBJ410
Page 58 North Carolina Office of the State Controller updated 8-15-17
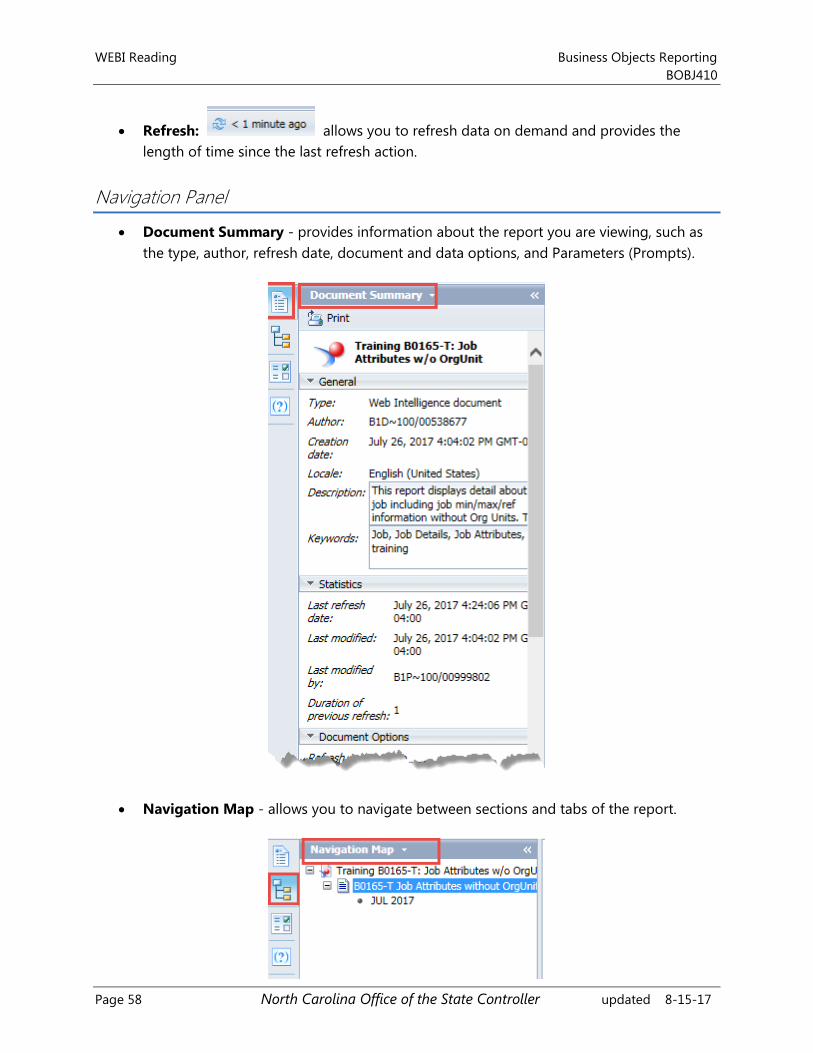
Refresh: allows you to refresh data on demand and provides the
length of time since the last refresh action.
Navigation Panel
Document Summary - provides information about the report you are viewing, such as
the type, author, refresh date, document and data options, and Parameters (Prompts).
Navigation Map - allows you to navigate between sections and tabs of the report.
Business Objects Reporting WEBI Reading
BOBJ410
updated 8-15-17 North Carolina Office of the State Controller Page 59
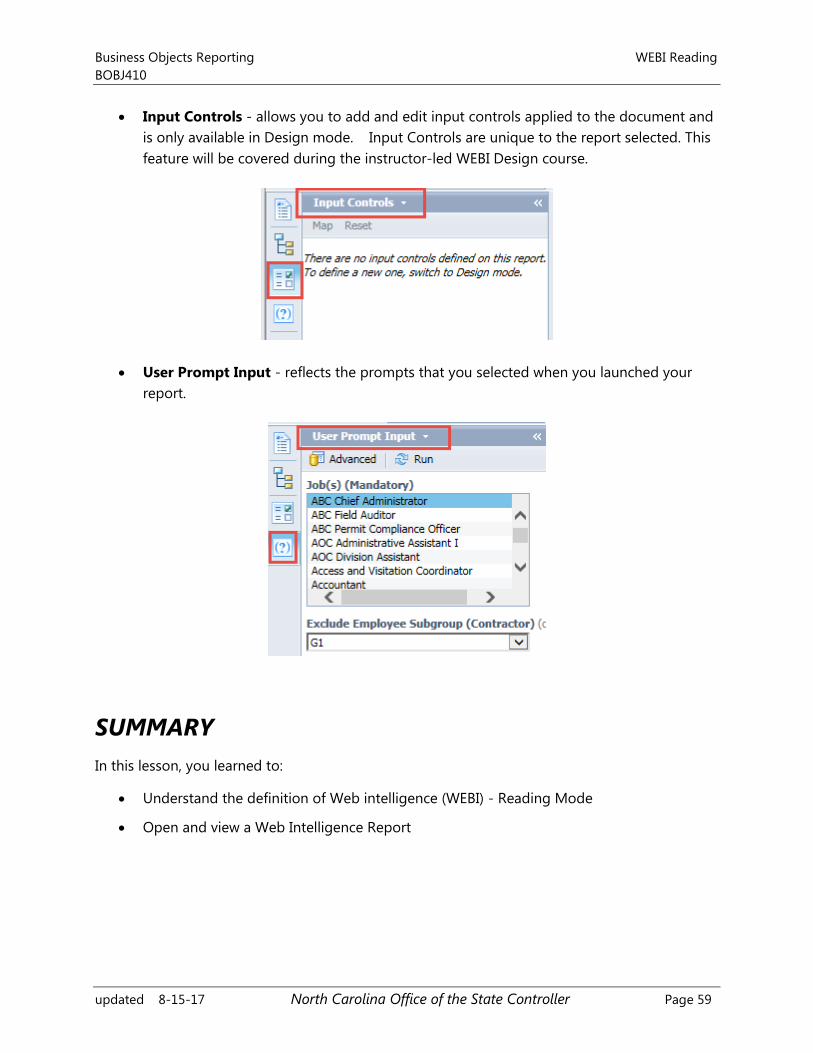
Input Controls - allows you to add and edit input controls applied to the document and
is only available in Design mode. Input Controls are unique to the report selected. This
feature will be covered during the instructor-led WEBI Design course.
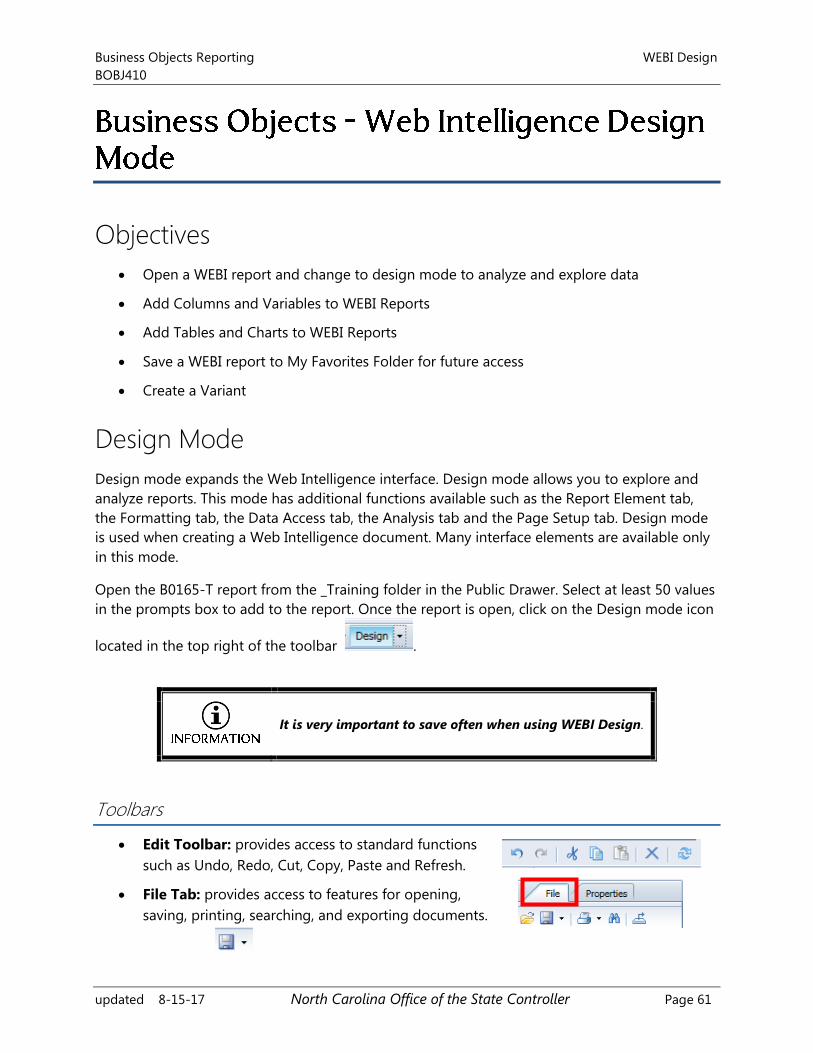
User Prompt Input - reflects the prompts that you selected when you launched your
report.
SUMMARY
In this lesson, you learned to:
Understand the definition of Web intelligence (WEBI) - Reading Mode
Open and view a Web Intelligence Report

WEBI Reading Business Objects Reporting
BOBJ410
Page 60 North Carolina Office of the State Controller updated 8-15-17
THIS PAGE
INTENTIONALLY LEFT BLANK
Business Objects Reporting WEBI Design
BOBJ410
updated 8-15-17 North Carolina Office of the State Controller Page 61
Objectives
Open a WEBI report and change to design mode to analyze and explore data
Add Columns and Variables to WEBI Reports
Add Tables and Charts to WEBI Reports
Save a WEBI report to My Favorites Folder for future access
Create a Variant
Design Mode
Design mode expands the Web Intelligence interface. Design mode allows you to explore and
analyze reports. This mode has additional functions available such as the Report Element tab,
the Formatting tab, the Data Access tab, the Analysis tab and the Page Setup tab. Design mode
is used when creating a Web Intelligence document. Many interface elements are available only
in this mode.
Open the B0165-T report from the _Training folder in the Public Drawer. Select at least 50 values
in the prompts box to add to the report. Once the report is open, click on the Design mode icon
located in the top right of the toolbar .
It is very important to save often when using WEBI Design.
Toolbars
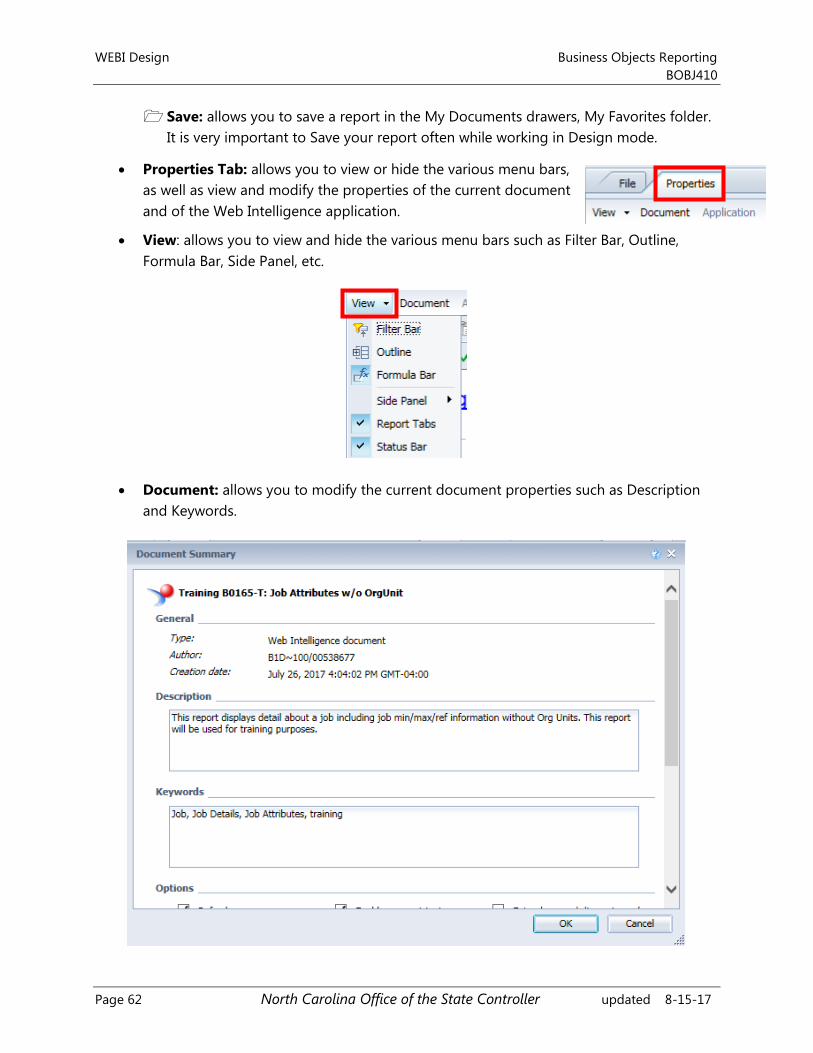
Edit Toolbar: provides access to standard functions
such as Undo, Redo, Cut, Copy, Paste and Refresh.
File Tab: provides access to features for opening,
saving, printing, searching, and exporting documents.
WEBI Design Business Objects Reporting
BOBJ410
Page 62 North Carolina Office of the State Controller updated 8-15-17
Save: allows you to save a report in the My Documents drawers, My Favorites folder.
It is very important to Save your report often while working in Design mode.
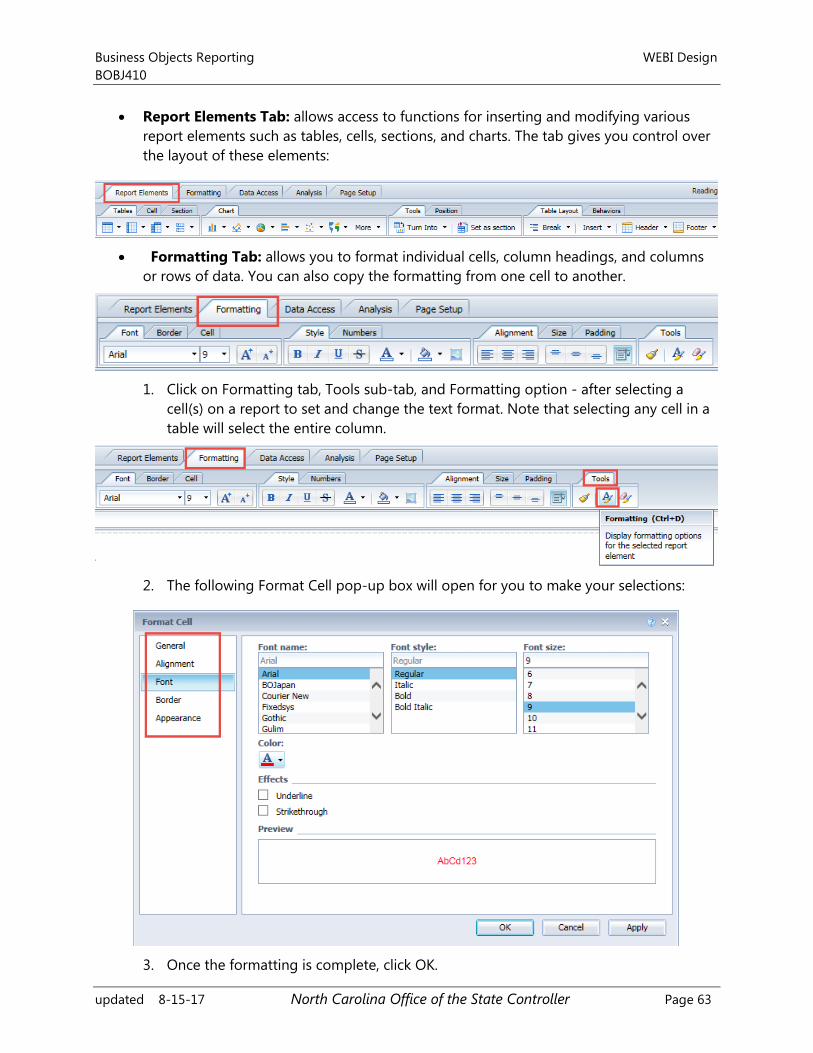
Properties Tab: allows you to view or hide the various menu bars,
as well as view and modify the properties of the current document
and of the Web Intelligence application.
View: allows you to view and hide the various menu bars such as Filter Bar, Outline,
Formula Bar, Side Panel, etc.
Document: allows you to modify the current document properties such as Description
and Keywords.
Business Objects Reporting WEBI Design
BOBJ410
updated 8-15-17 North Carolina Office of the State Controller Page 63
Report Elements Tab: allows access to functions for inserting and modifying various
report elements such as tables, cells, sections, and charts. The tab gives you control over
the layout of these elements:
Formatting Tab: allows you to format individual cells, column headings, and columns
or rows of data. You can also copy the formatting from one cell to another.
1. Click on Formatting tab, Tools sub-tab, and Formatting option - after selecting a
cell(s) on a report to set and change the text format. Note that selecting any cell in a
table will select the entire column.
2. The following Format Cell pop-up box will open for you to make your selections:
3. Once the formatting is complete, click OK.
WEBI Design Business Objects Reporting
BOBJ410
Page 64 North Carolina Office of the State Controller updated 8-15-17
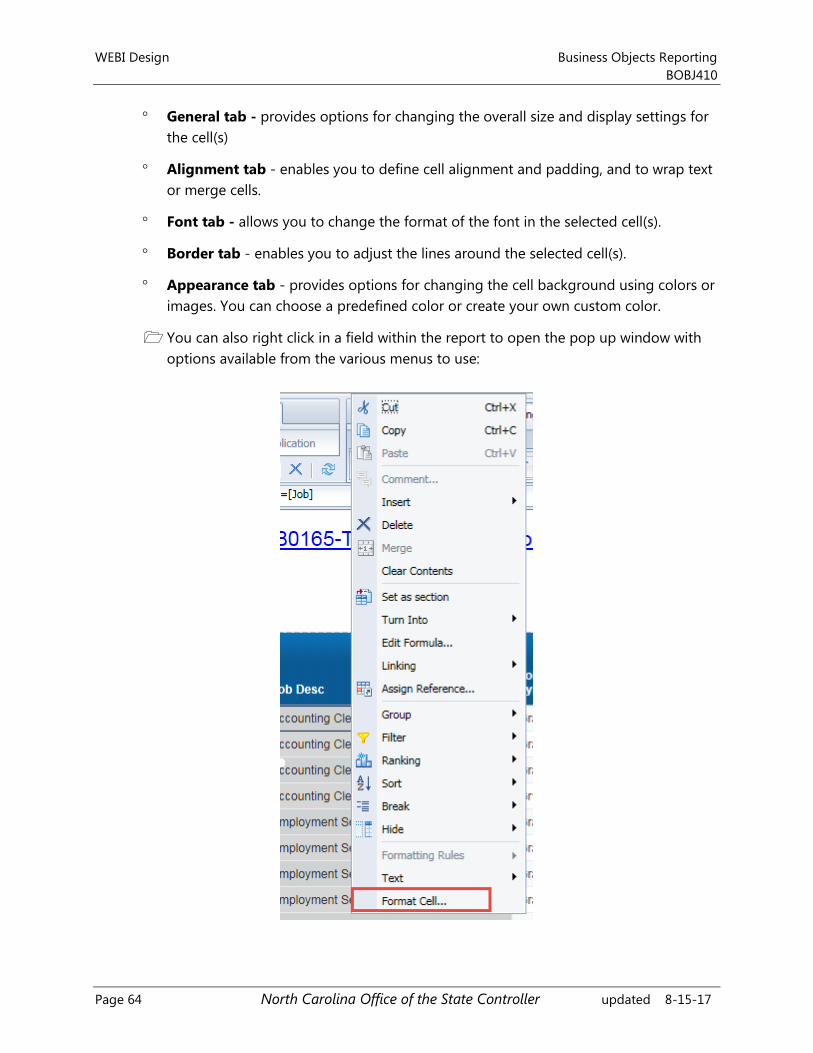
General tab - provides options for changing the overall size and display settings for
the cell(s)
Alignment tab - enables you to define cell alignment and padding, and to wrap text
or merge cells.
Font tab - allows you to change the format of the font in the selected cell(s).
Border tab - enables you to adjust the lines around the selected cell(s).
Appearance tab - provides options for changing the cell background using colors or
images. You can choose a predefined color or create your own custom color.
You can also right click in a field within the report to open the pop up window with
options available from the various menus to use:
Business Objects Reporting WEBI Design
BOBJ410
updated 8-15-17 North Carolina Office of the State Controller Page 65
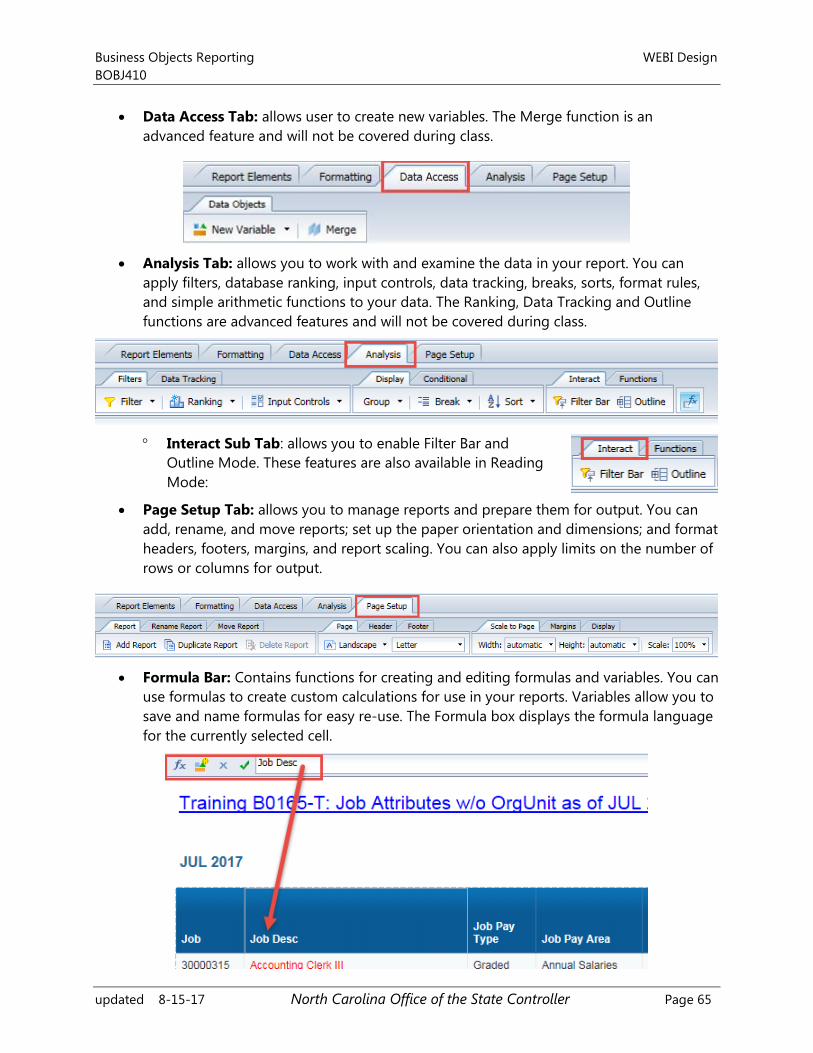
Data Access Tab: allows user to create new variables. The Merge function is an
advanced feature and will not be covered during class.
Analysis Tab: allows you to work with and examine the data in your report. You can
apply filters, database ranking, input controls, data tracking, breaks, sorts, format rules,
and simple arithmetic functions to your data. The Ranking, Data Tracking and Outline
functions are advanced features and will not be covered during class.
Interact Sub Tab: allows you to enable Filter Bar and
Outline Mode. These features are also available in Reading
Mode:
Page Setup Tab: allows you to manage reports and prepare them for output. You can
add, rename, and move reports; set up the paper orientation and dimensions; and format
headers, footers, margins, and report scaling. You can also apply limits on the number of
rows or columns for output.
Formula Bar: Contains functions for creating and editing formulas and variables. You can
use formulas to create custom calculations for use in your reports. Variables allow you to
save and name formulas for easy re-use. The Formula box displays the formula language
for the currently selected cell.
WEBI Design Business Objects Reporting
BOBJ410
Page 66 North Carolina Office of the State Controller updated 8-15-17
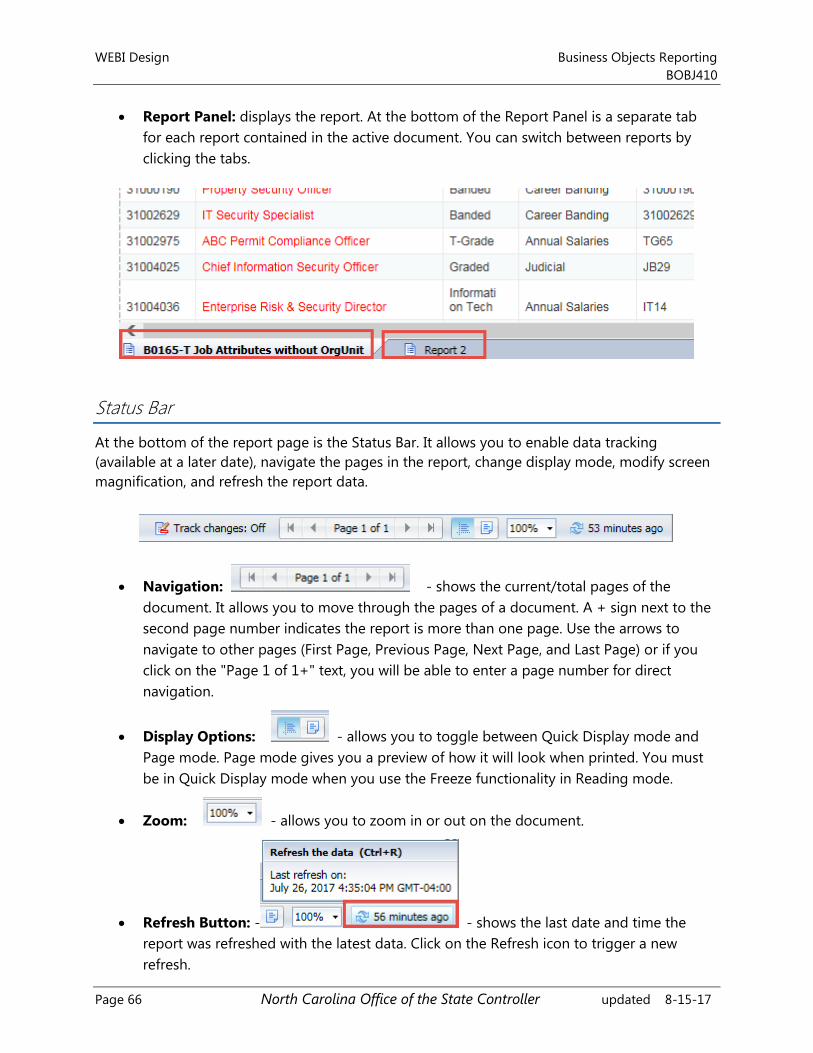
Report Panel: displays the report. At the bottom of the Report Panel is a separate tab
for each report contained in the active document. You can switch between reports by
clicking the tabs.
Status Bar
At the bottom of the report page is the Status Bar. It allows you to enable data tracking
(available at a later date), navigate the pages in the report, change display mode, modify screen
magnification, and refresh the report data.
Navigation: - shows the current/total pages of the
document. It allows you to move through the pages of a document. A + sign next to the
second page number indicates the report is more than one page. Use the arrows to
navigate to other pages (First Page, Previous Page, Next Page, and Last Page) or if you
click on the "Page 1 of 1+" text, you will be able to enter a page number for direct
navigation.
Display Options: - allows you to toggle between Quick Display mode and
Page mode. Page mode gives you a preview of how it will look when printed. You must
be in Quick Display mode when you use the Freeze functionality in Reading mode.
Zoom: - allows you to zoom in or out on the document.
Refresh Button: - - shows the last date and time the
report was refreshed with the latest data. Click on the Refresh icon to trigger a new
refresh.
Business Objects Reporting WEBI Design
BOBJ410
updated 8-15-17 North Carolina Office of the State Controller Page 67
Navigation Left Side Panel
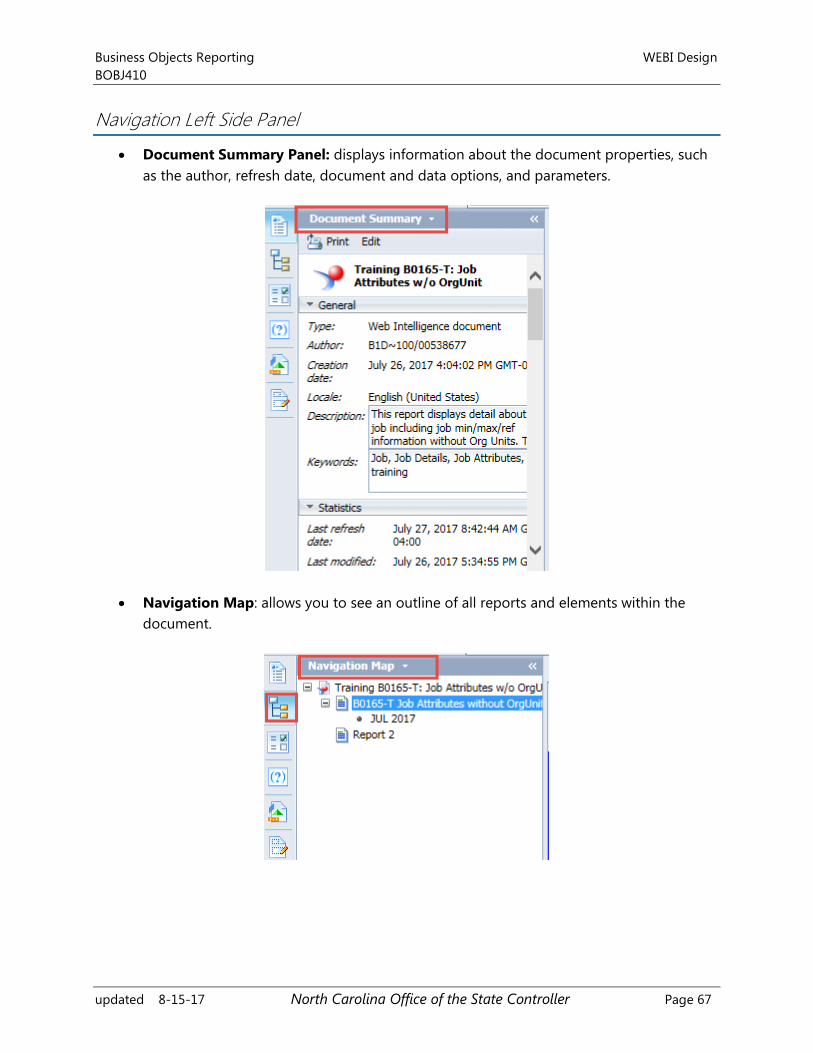
Document Summary Panel: displays information about the document properties, such
as the author, refresh date, document and data options, and parameters.
Navigation Map: allows you to see an outline of all reports and elements within the
document.
WEBI Design Business Objects Reporting
BOBJ410
Page 68 North Carolina Office of the State Controller updated 8-15-17
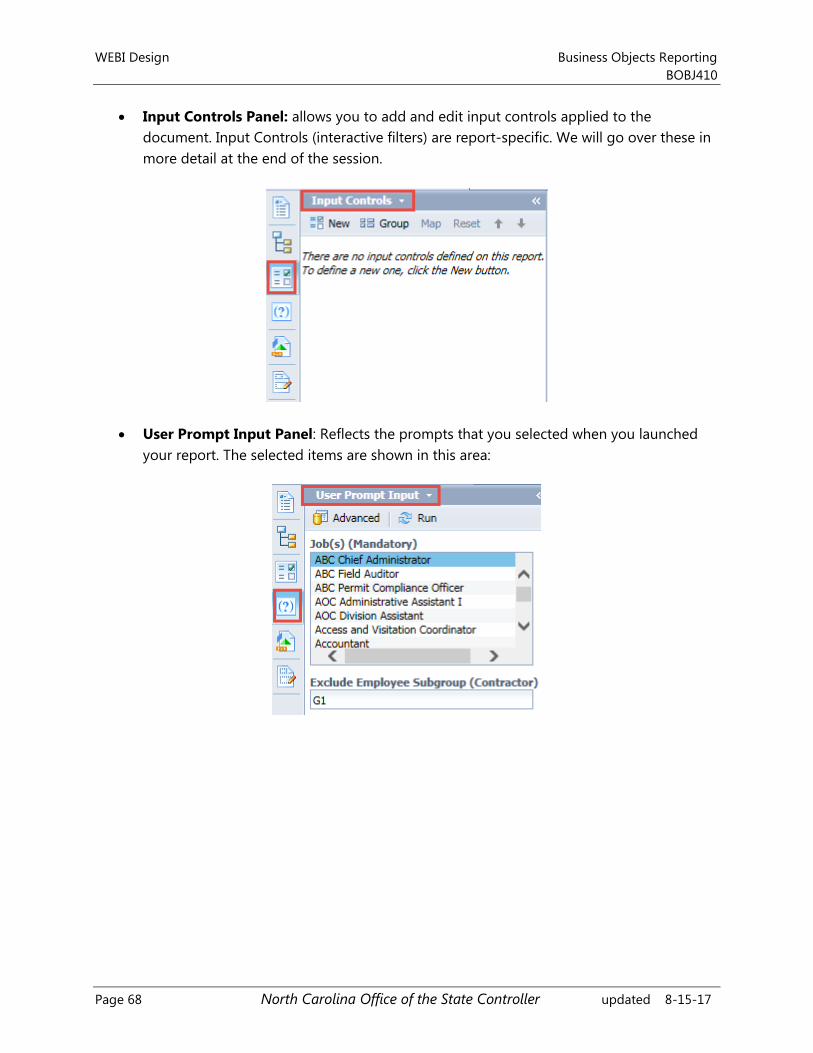
Input Controls Panel: allows you to add and edit input controls applied to the
document. Input Controls (interactive filters) are report-specific. We will go over these in
more detail at the end of the session.
User Prompt Input Panel: Reflects the prompts that you selected when you launched
your report. The selected items are shown in this area:
Business Objects Reporting WEBI Design
BOBJ410
updated 8-15-17 North Carolina Office of the State Controller Page 69
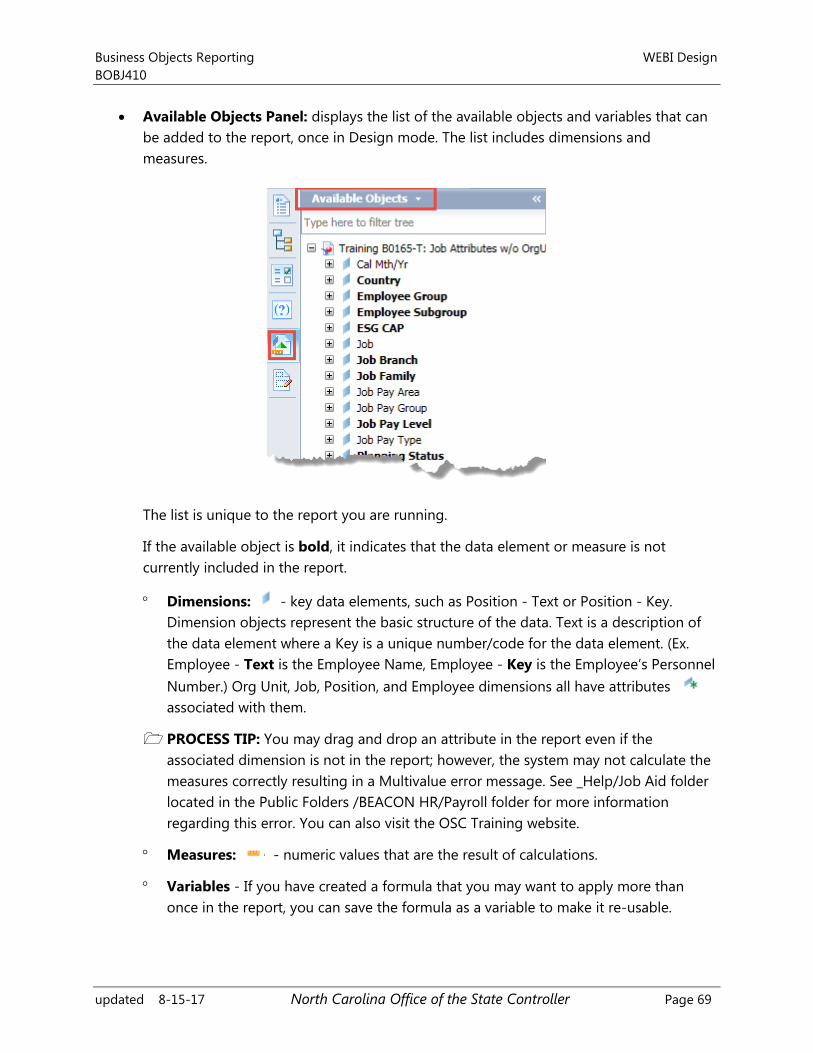
Available Objects Panel: displays the list of the available objects and variables that can
be added to the report, once in Design mode. The list includes dimensions and
measures.
The list is unique to the report you are running.
If the available object is bold, it indicates that the data element or measure is not
currently included in the report.
Dimensions: - key data elements, such as Position - Text or Position - Key.
Dimension objects represent the basic structure of the data. Text is a description of
the data element where a Key is a unique number/code for the data element. (Ex.
Employee - Text is the Employee Name, Employee - Key is the Employee’s Personnel
Number.) Org Unit, Job, Position, and Employee dimensions all have attributes
associated with them.
PROCESS TIP: You may drag and drop an attribute in the report even if the
associated dimension is not in the report; however, the system may not calculate the
measures correctly resulting in a Multivalue error message. See _Help/Job Aid folder
located in the Public Folders /BEACON HR/Payroll folder for more information
regarding this error. You can also visit the OSC Training website.
Measures: - numeric values that are the result of calculations.
Variables - If you have created a formula that you may want to apply more than
once in the report, you can save the formula as a variable to make it re-usable.
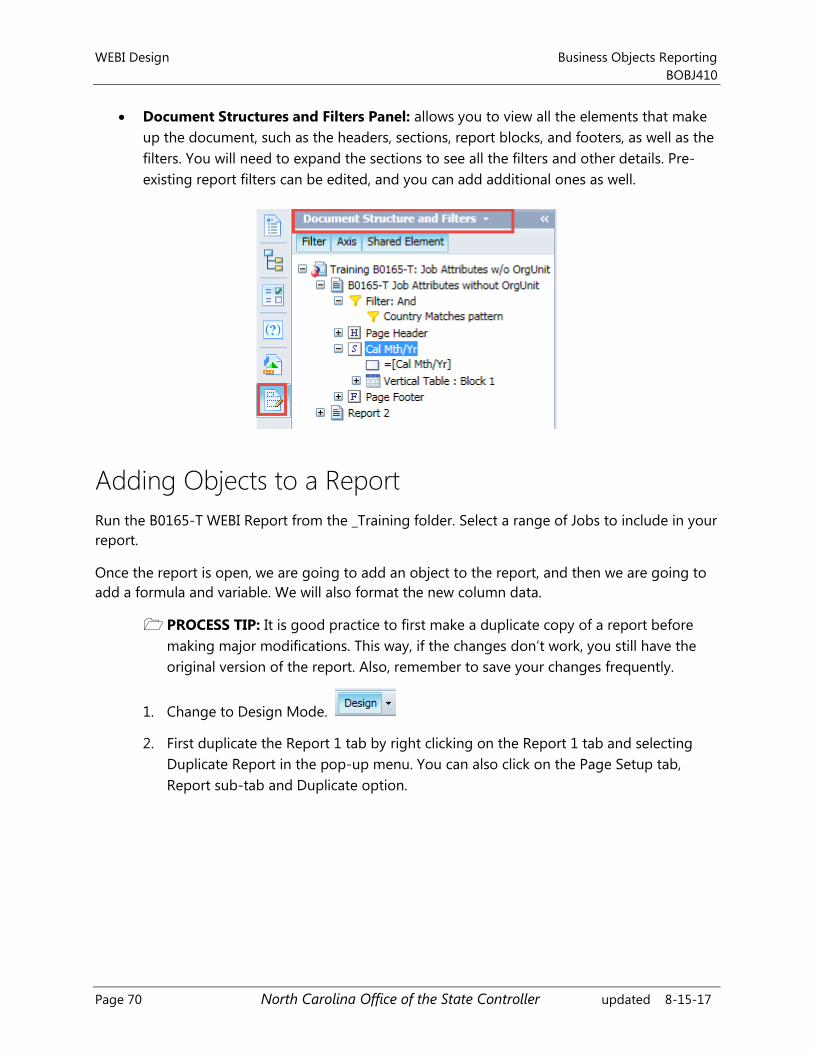
WEBI Design Business Objects Reporting
BOBJ410
Page 70 North Carolina Office of the State Controller updated 8-15-17
Document Structures and Filters Panel: allows you to view all the elements that make
up the document, such as the headers, sections, report blocks, and footers, as well as the
filters. You will need to expand the sections to see all the filters and other details. Pre-
existing report filters can be edited, and you can add additional ones as well.
Adding Objects to a Report
Run the B0165-T WEBI Report from the _Training folder. Select a range of Jobs to include in your
report.
Once the report is open, we are going to add an object to the report, and then we are going to
add a formula and variable. We will also format the new column data.
PROCESS TIP: It is good practice to first make a duplicate copy of a report before
making major modifications. This way, if the changes don’t work, you still have the
original version of the report. Also, remember to save your changes frequently.
1. Change to Design Mode.
2. First duplicate the Report 1 tab by right clicking on the Report 1 tab and selecting
Duplicate Report in the pop-up menu. You can also click on the Page Setup tab,
Report sub-tab and Duplicate option.
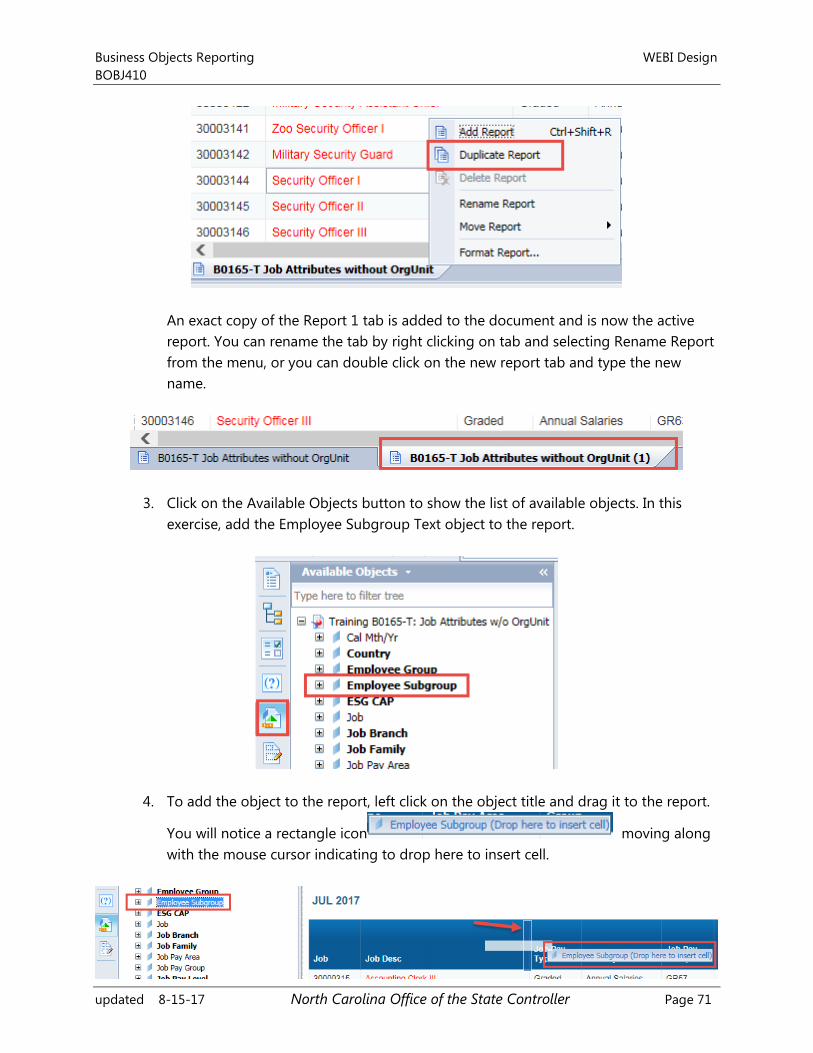
Business Objects Reporting WEBI Design
BOBJ410
updated 8-15-17 North Carolina Office of the State Controller Page 71
An exact copy of the Report 1 tab is added to the document and is now the active
report. You can rename the tab by right clicking on tab and selecting Rename Report
from the menu, or you can double click on the new report tab and type the new
name.
3. Click on the Available Objects button to show the list of available objects. In this
exercise, add the Employee Subgroup Text object to the report.
4. To add the object to the report, left click on the object title and drag it to the report.
You will notice a rectangle icon moving along
with the mouse cursor indicating to drop here to insert cell.
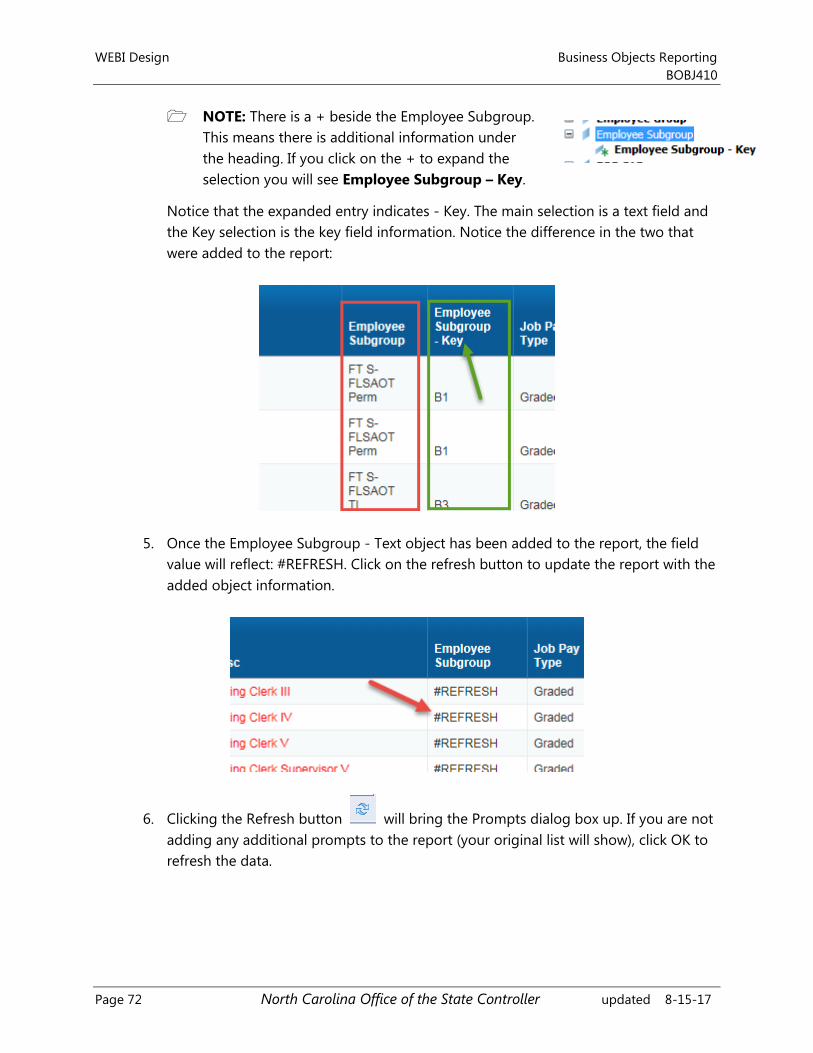
WEBI Design Business Objects Reporting
BOBJ410
Page 72 North Carolina Office of the State Controller updated 8-15-17
NOTE: There is a + beside the Employee Subgroup.
This means there is additional information under
the heading. If you click on the + to expand the
selection you will see Employee Subgroup – Key.
Notice that the expanded entry indicates - Key. The main selection is a text field and
the Key selection is the key field information. Notice the difference in the two that
were added to the report:
5. Once the Employee Subgroup - Text object has been added to the report, the field
value will reflect: #REFRESH. Click on the refresh button to update the report with the
added object information.
6. Clicking the Refresh button will bring the Prompts dialog box up. If you are not
adding any additional prompts to the report (your original list will show), click OK to
refresh the data.
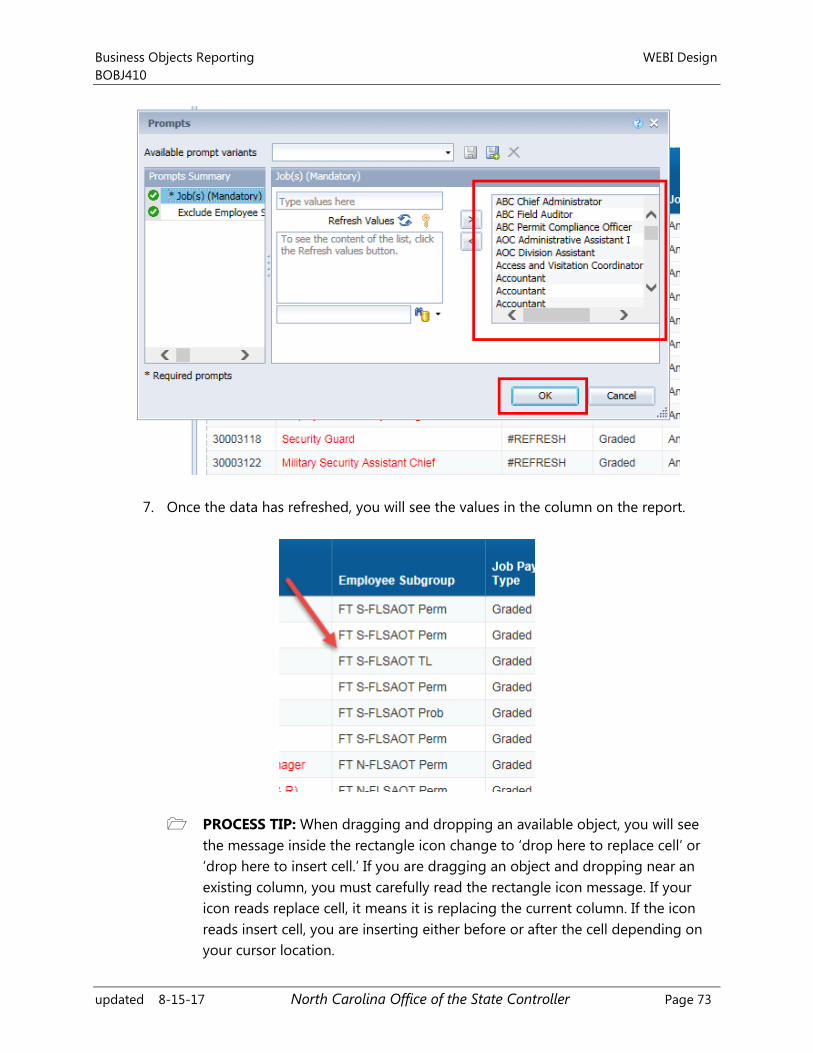
Business Objects Reporting WEBI Design
BOBJ410
updated 8-15-17 North Carolina Office of the State Controller Page 73
7. Once the data has refreshed, you will see the values in the column on the report.
PROCESS TIP: When dragging and dropping an available object, you will see
the message inside the rectangle icon change to ‘drop here to replace cell’ or
‘drop here to insert cell.’ If you are dragging an object and dropping near an
existing column, you must carefully read the rectangle icon message. If your
icon reads replace cell, it means it is replacing the current column. If the icon
reads insert cell, you are inserting either before or after the cell depending on
your cursor location.
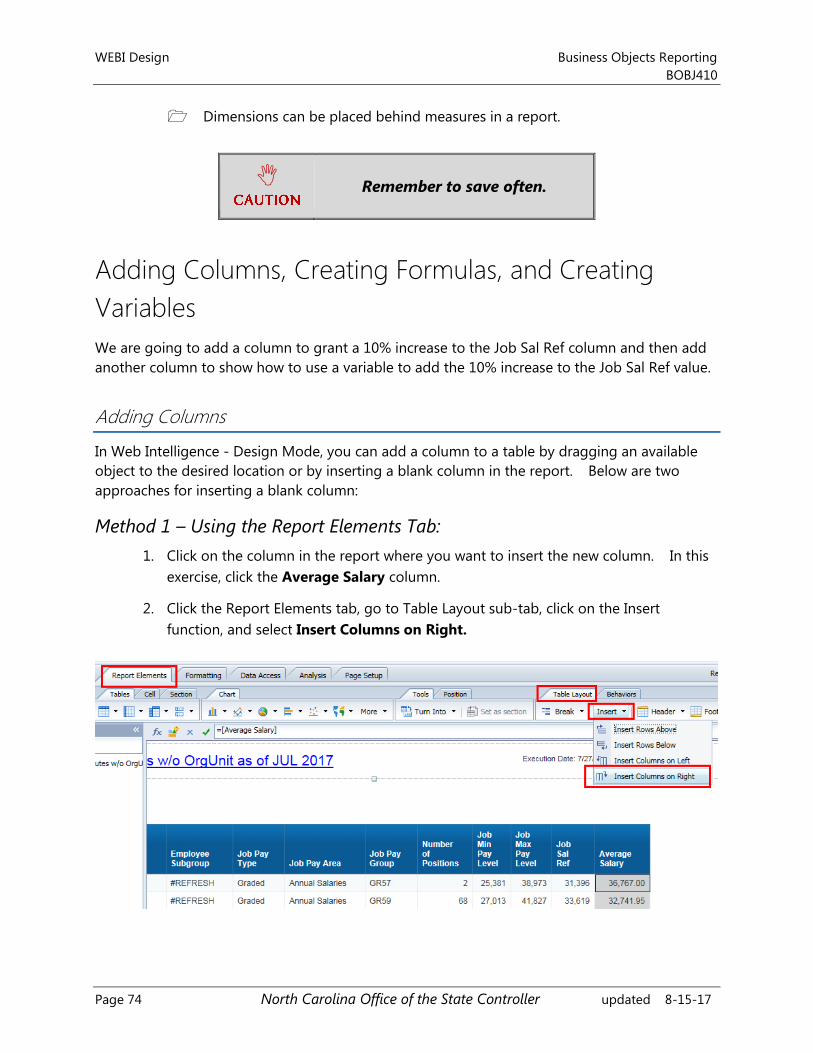
WEBI Design Business Objects Reporting
BOBJ410
Page 74 North Carolina Office of the State Controller updated 8-15-17
Dimensions can be placed behind measures in a report.
Remember to save often.
Adding Columns, Creating Formulas, and Creating
Variables
We are going to add a column to grant a 10% increase to the Job Sal Ref column and then add
another column to show how to use a variable to add the 10% increase to the Job Sal Ref value.
Adding Columns
In Web Intelligence - Design Mode, you can add a column to a table by dragging an available
object to the desired location or by inserting a blank column in the report. Below are two
approaches for inserting a blank column:
Method 1 – Using the Report Elements Tab:
1. Click on the column in the report where you want to insert the new column. In this
exercise, click the Average Salary column.
2. Click the Report Elements tab, go to Table Layout sub-tab, click on the Insert
function, and select Insert Columns on Right.
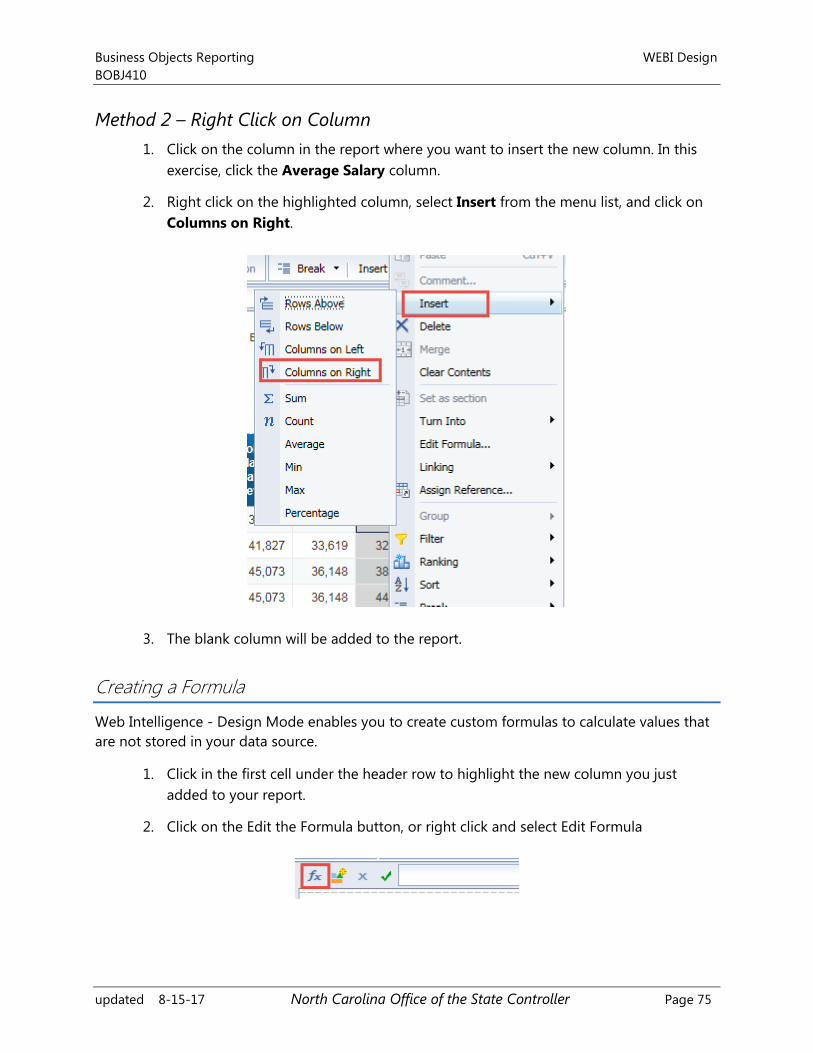
Business Objects Reporting WEBI Design
BOBJ410
updated 8-15-17 North Carolina Office of the State Controller Page 75
Method 2 – Right Click on Column
1. Click on the column in the report where you want to insert the new column. In this
exercise, click the Average Salary column.
2. Right click on the highlighted column, select Insert from the menu list, and click on
Columns on Right.
3. The blank column will be added to the report.
Creating a Formula
Web Intelligence - Design Mode enables you to create custom formulas to calculate values that
are not stored in your data source.
1. Click in the first cell under the header row to highlight the new column you just
added to your report.
2. Click on the Edit the Formula button, or right click and select Edit Formula
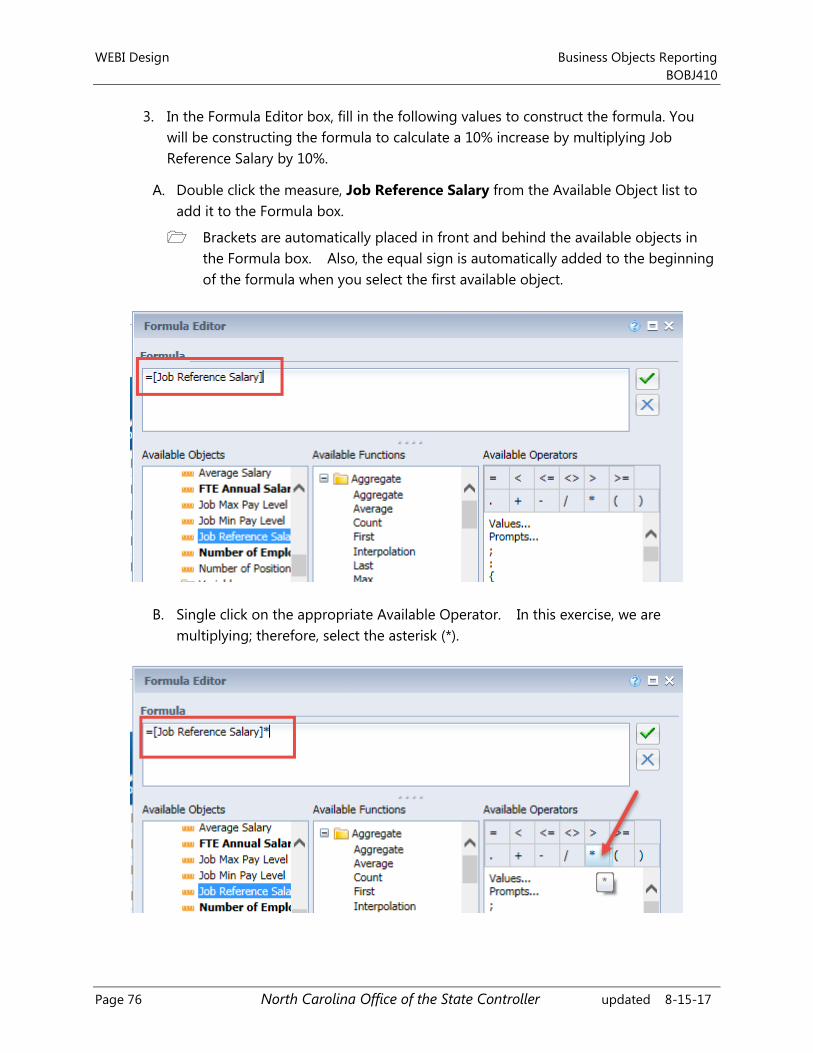
WEBI Design Business Objects Reporting
BOBJ410
Page 76 North Carolina Office of the State Controller updated 8-15-17
3. In the Formula Editor box, fill in the following values to construct the formula. You
will be constructing the formula to calculate a 10% increase by multiplying Job
Reference Salary by 10%.
A. Double click the measure, Job Reference Salary from the Available Object list to
add it to the Formula box.
Brackets are automatically placed in front and behind the available objects in
the Formula box. Also, the equal sign is automatically added to the beginning
of the formula when you select the first available object.
B. Single click on the appropriate Available Operator. In this exercise, we are
multiplying; therefore, select the asterisk (*).
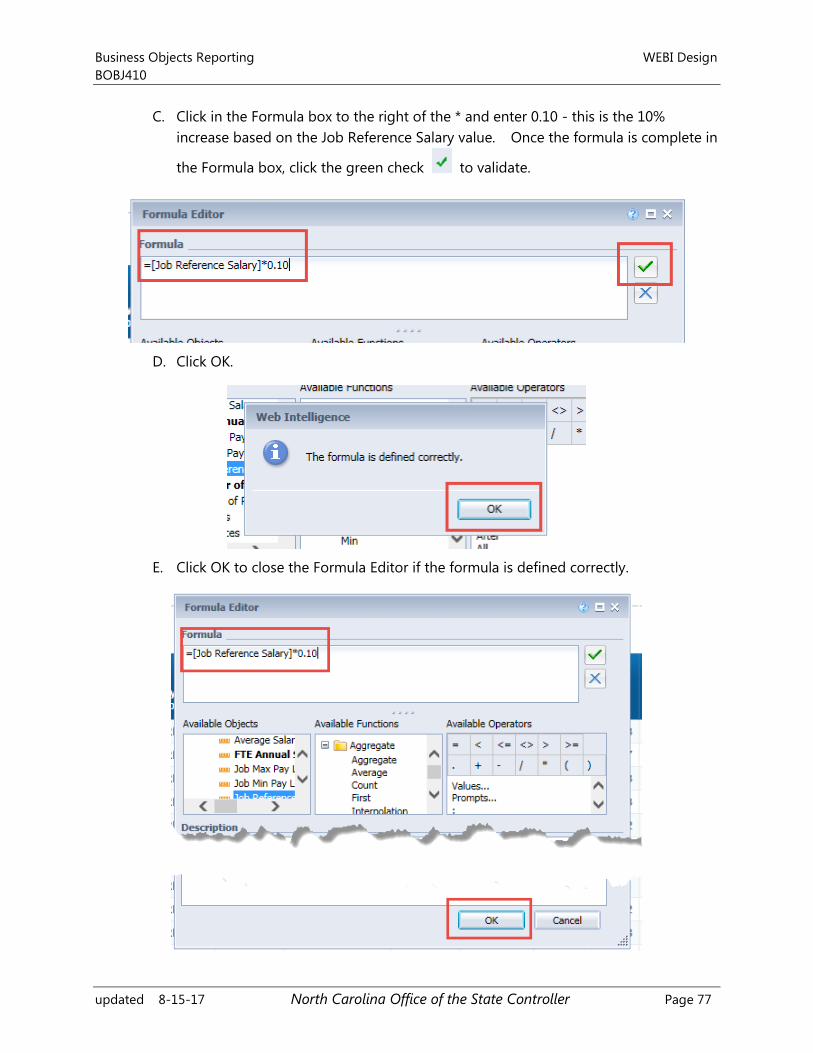
Business Objects Reporting WEBI Design
BOBJ410
updated 8-15-17 North Carolina Office of the State Controller Page 77
C. Click in the Formula box to the right of the * and enter 0.10 - this is the 10%
increase based on the Job Reference Salary value. Once the formula is complete in
the Formula box, click the green check to validate.
D. Click OK.
E. Click OK to close the Formula Editor if the formula is defined correctly.
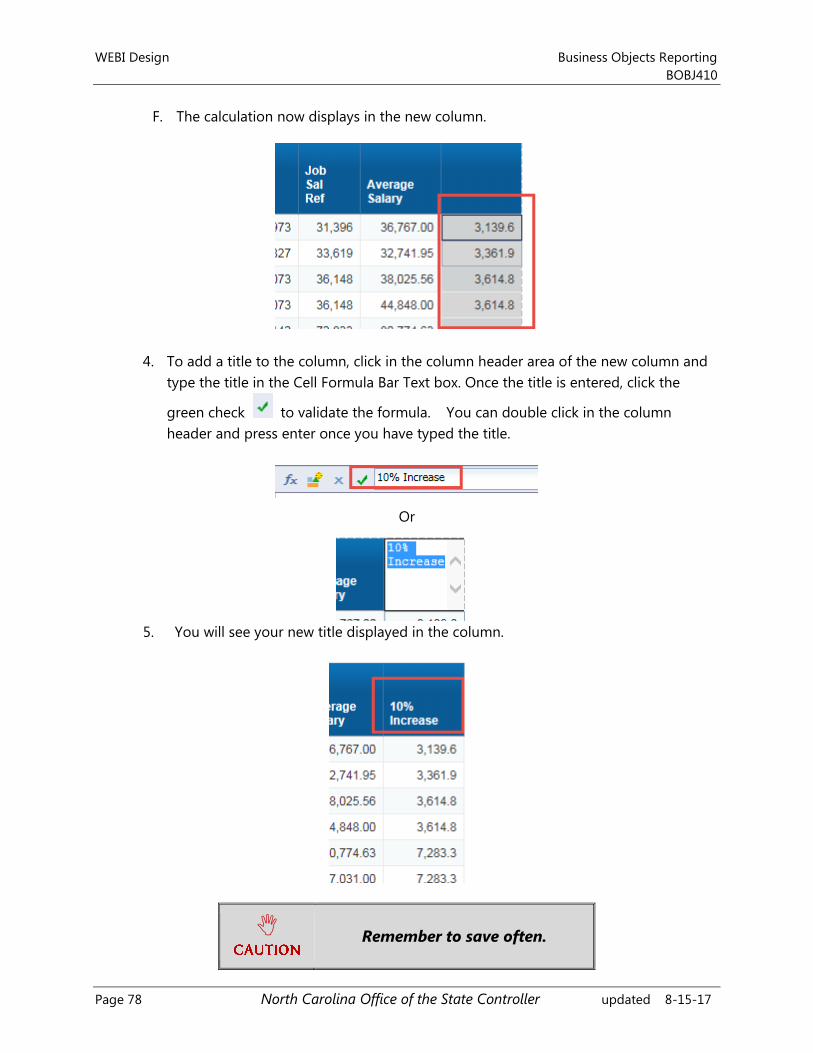
WEBI Design Business Objects Reporting
BOBJ410
Page 78 North Carolina Office of the State Controller updated 8-15-17
F. The calculation now displays in the new column.
4. To add a title to the column, click in the column header area of the new column and
type the title in the Cell Formula Bar Text box. Once the title is entered, click the
green check to validate the formula. You can double click in the column
header and press enter once you have typed the title.
Or
5. You will see your new title displayed in the column.
Remember to save often.

Business Objects Reporting WEBI Design
BOBJ410
updated 8-15-17 North Carolina Office of the State Controller Page 79
Creating a Variable
If you have created a formula that you may want to apply more than once, you can save
the formula as a variable to make it reusable.
1. Click on the 10% Increase column to set as a variable and then click on the Variable
icon on the formula bar.
2. You will need to define a unique name for the variable, which will appear in the list of
Available Objects. Name the variable in the Name text box to populate it and click
OK.
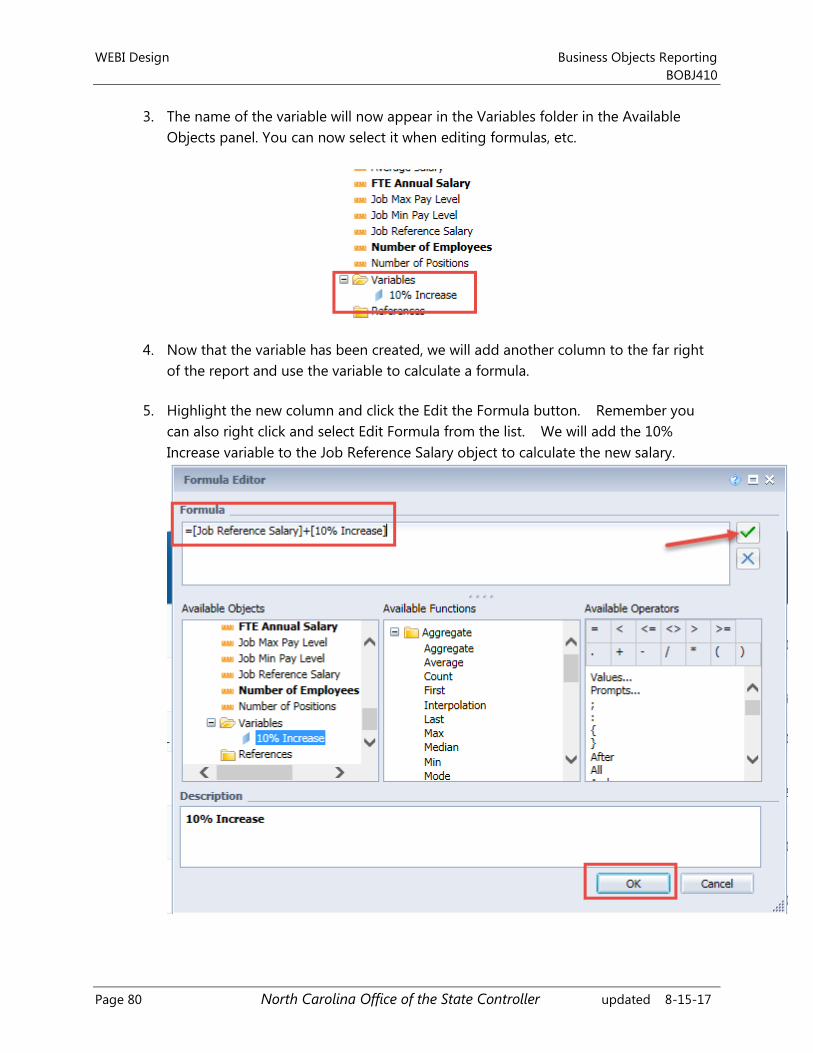
WEBI Design Business Objects Reporting
BOBJ410
Page 80 North Carolina Office of the State Controller updated 8-15-17
3. The name of the variable will now appear in the Variables folder in the Available
Objects panel. You can now select it when editing formulas, etc.
4. Now that the variable has been created, we will add another column to the far right
of the report and use the variable to calculate a formula.
5. Highlight the new column and click the Edit the Formula button. Remember you
can also right click and select Edit Formula from the list. We will add the 10%
Increase variable to the Job Reference Salary object to calculate the new salary.
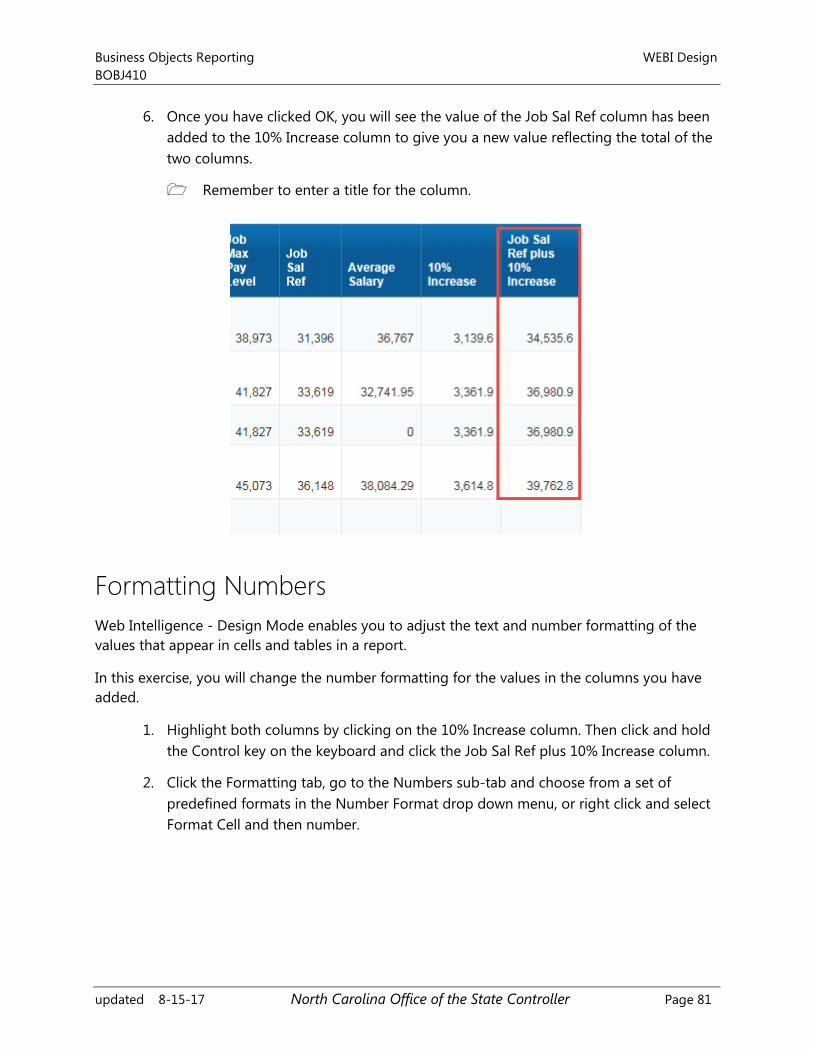
Business Objects Reporting WEBI Design
BOBJ410
updated 8-15-17 North Carolina Office of the State Controller Page 81
6. Once you have clicked OK, you will see the value of the Job Sal Ref column has been
added to the 10% Increase column to give you a new value reflecting the total of the
two columns.
Remember to enter a title for the column.
Formatting Numbers
Web Intelligence - Design Mode enables you to adjust the text and number formatting of the
values that appear in cells and tables in a report.
In this exercise, you will change the number formatting for the values in the columns you have
added.
1. Highlight both columns by clicking on the 10% Increase column. Then click and hold
the Control key on the keyboard and click the Job Sal Ref plus 10% Increase column.
2. Click the Formatting tab, go to the Numbers sub-tab and choose from a set of
predefined formats in the Number Format drop down menu, or right click and select
Format Cell and then number.
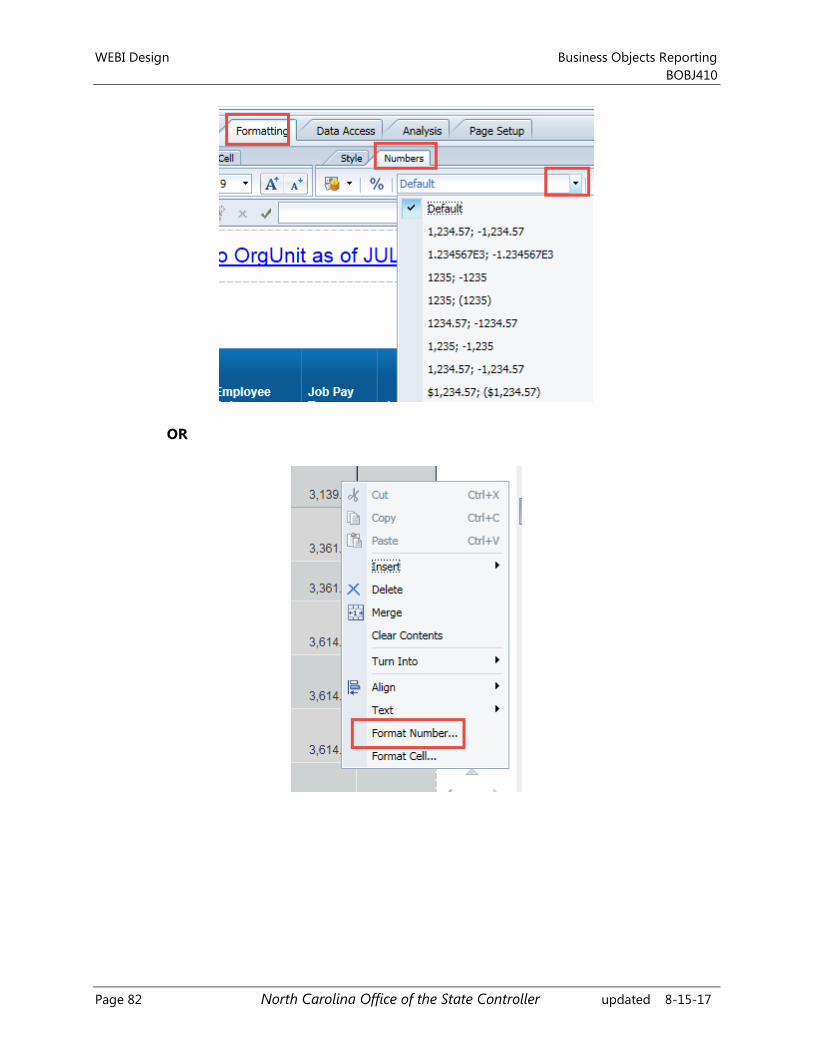
WEBI Design Business Objects Reporting
BOBJ410
Page 82 North Carolina Office of the State Controller updated 8-15-17
OR
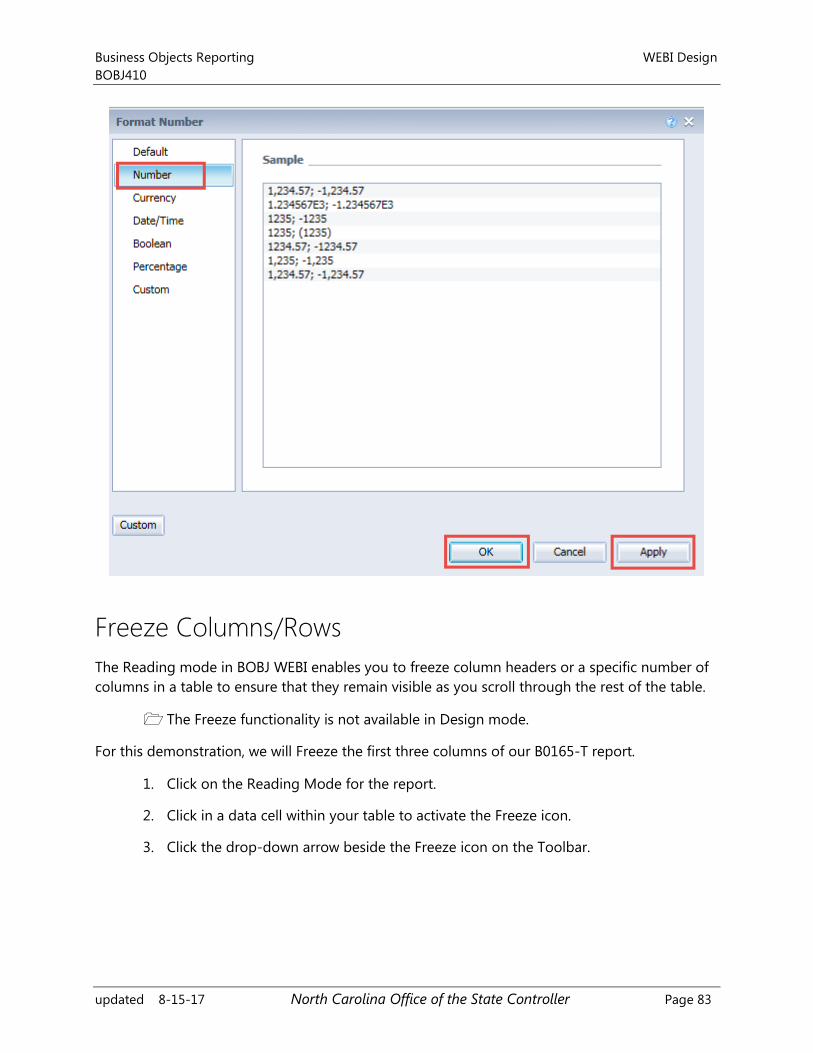
Business Objects Reporting WEBI Design
BOBJ410
updated 8-15-17 North Carolina Office of the State Controller Page 83
Freeze Columns/Rows
The Reading mode in BOBJ WEBI enables you to freeze column headers or a specific number of
columns in a table to ensure that they remain visible as you scroll through the rest of the table.
The Freeze functionality is not available in Design mode.
For this demonstration, we will Freeze the first three columns of our B0165-T report.
1. Click on the Reading Mode for the report.
2. Click in a data cell within your table to activate the Freeze icon.
3. Click the drop-down arrow beside the Freeze icon on the Toolbar.
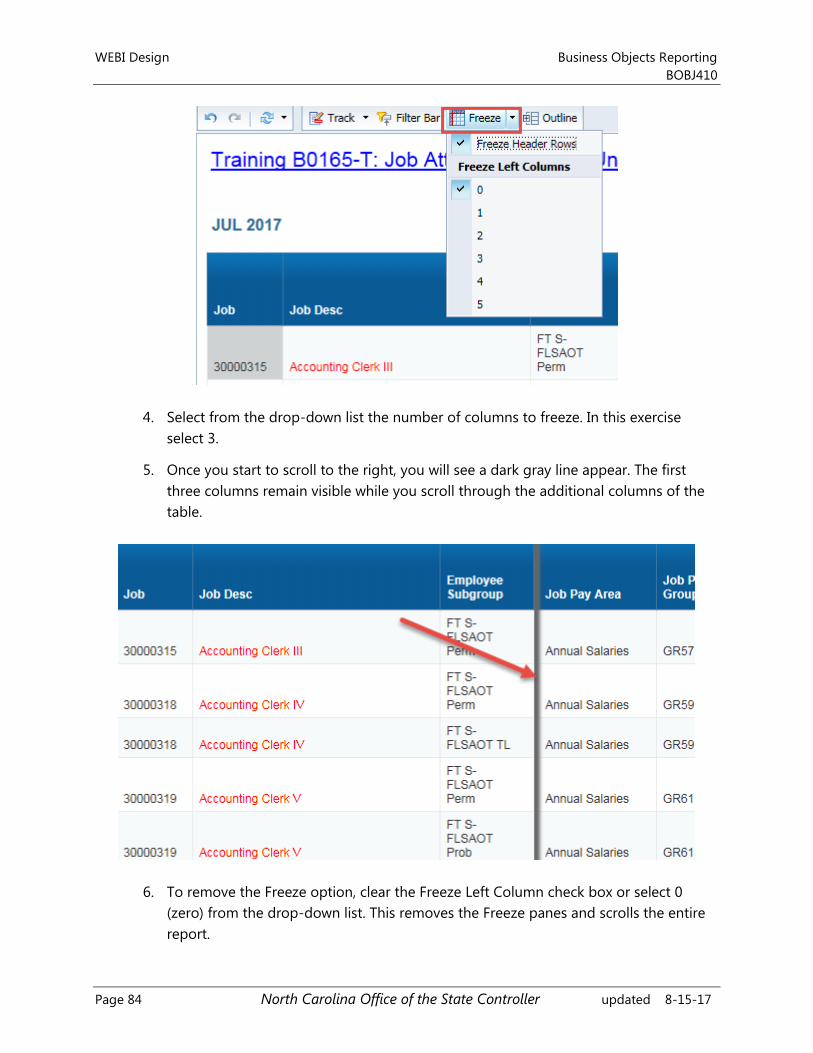
WEBI Design Business Objects Reporting
BOBJ410
Page 84 North Carolina Office of the State Controller updated 8-15-17
4. Select from the drop-down list the number of columns to freeze. In this exercise
select 3.
5. Once you start to scroll to the right, you will see a dark gray line appear. The first
three columns remain visible while you scroll through the additional columns of the
table.
6. To remove the Freeze option, clear the Freeze Left Column check box or select 0
(zero) from the drop-down list. This removes the Freeze panes and scrolls the entire
report.
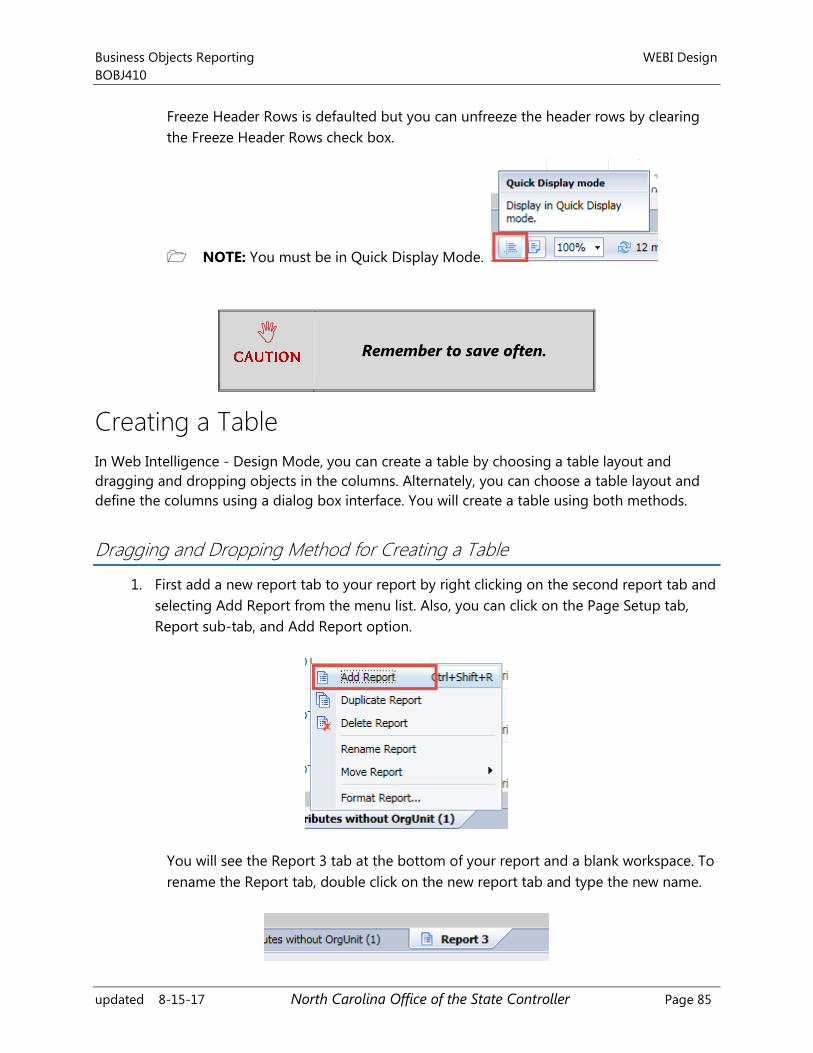
Business Objects Reporting WEBI Design
BOBJ410
updated 8-15-17 North Carolina Office of the State Controller Page 85
Freeze Header Rows is defaulted but you can unfreeze the header rows by clearing
the Freeze Header Rows check box.
NOTE: You must be in Quick Display Mode.
Remember to save often.
Creating a Table
In Web Intelligence - Design Mode, you can create a table by choosing a table layout and
dragging and dropping objects in the columns. Alternately, you can choose a table layout and
define the columns using a dialog box interface. You will create a table using both methods.
Dragging and Dropping Method for Creating a Table
1. First add a new report tab to your report by right clicking on the second report tab and
selecting Add Report from the menu list. Also, you can click on the Page Setup tab,
Report sub-tab, and Add Report option.
You will see the Report 3 tab at the bottom of your report and a blank workspace. To
rename the Report tab, double click on the new report tab and type the new name.
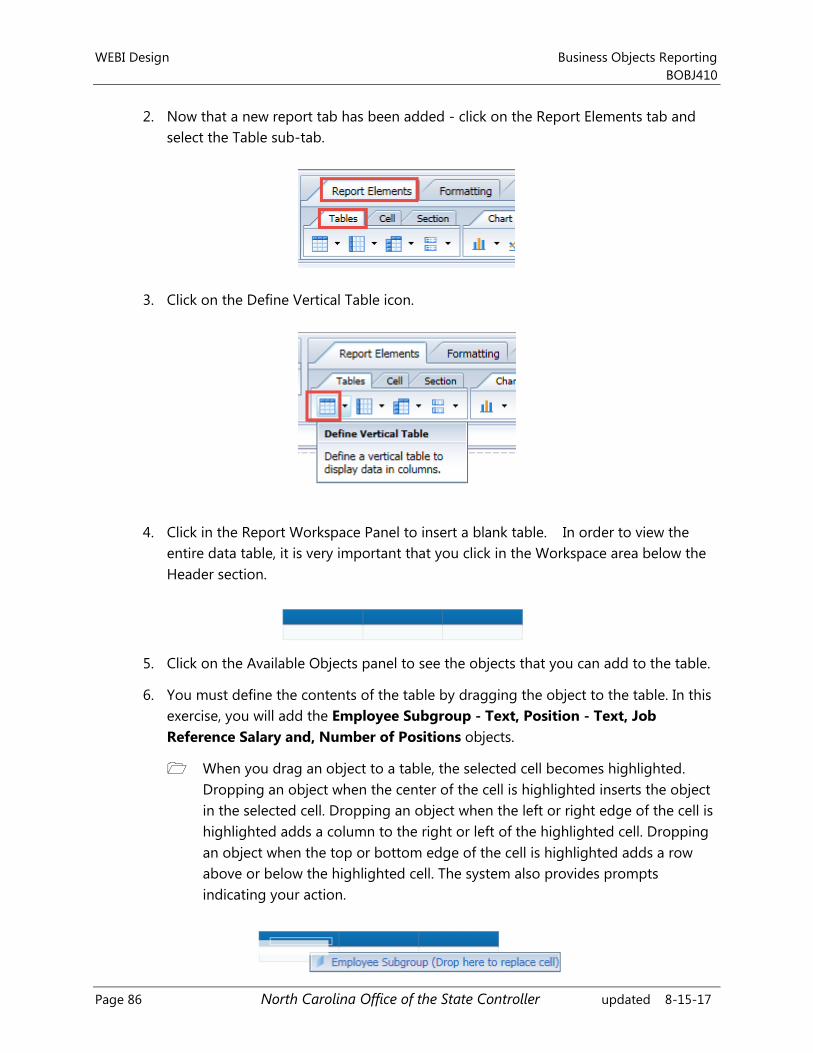
WEBI Design Business Objects Reporting
BOBJ410
Page 86 North Carolina Office of the State Controller updated 8-15-17
2. Now that a new report tab has been added - click on the Report Elements tab and
select the Table sub-tab.
3. Click on the Define Vertical Table icon.
4. Click in the Report Workspace Panel to insert a blank table. In order to view the
entire data table, it is very important that you click in the Workspace area below the
Header section.
5. Click on the Available Objects panel to see the objects that you can add to the table.
6. You must define the contents of the table by dragging the object to the table. In this
exercise, you will add the Employee Subgroup - Text, Position - Text, Job
Reference Salary and, Number of Positions objects.
When you drag an object to a table, the selected cell becomes highlighted.
Dropping an object when the center of the cell is highlighted inserts the object
in the selected cell. Dropping an object when the left or right edge of the cell is
highlighted adds a column to the right or left of the highlighted cell. Dropping
an object when the top or bottom edge of the cell is highlighted adds a row
above or below the highlighted cell. The system also provides prompts
indicating your action.
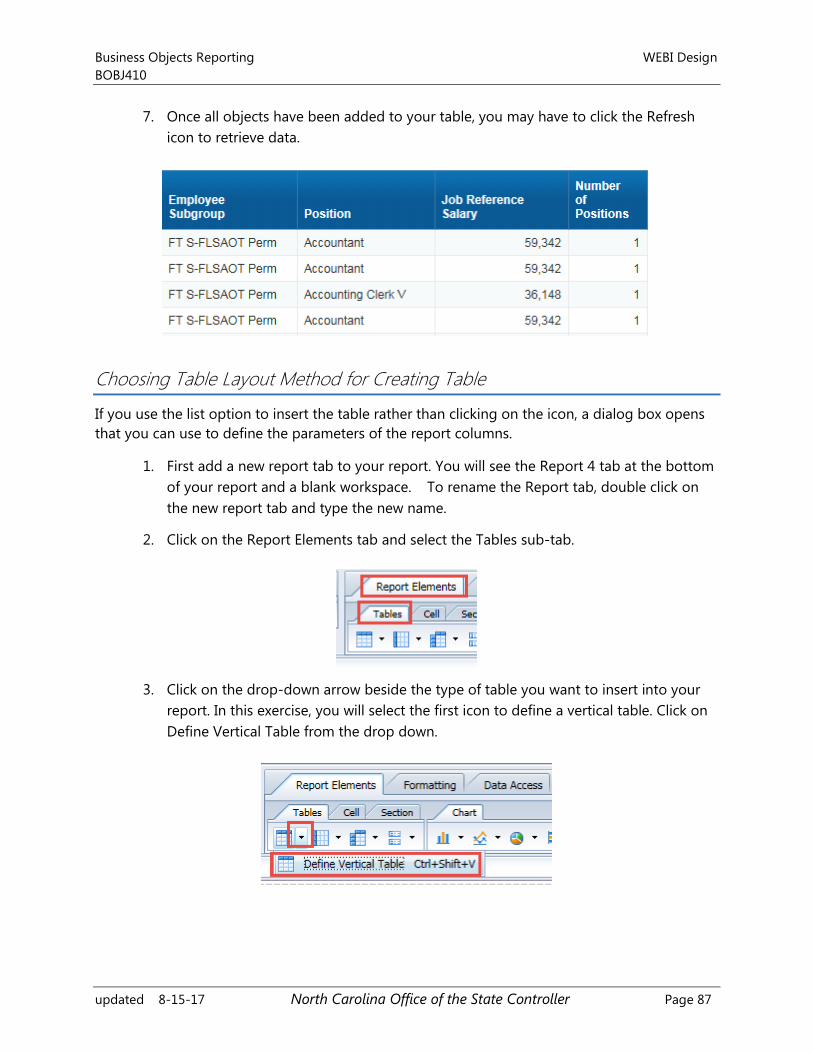
Business Objects Reporting WEBI Design
BOBJ410
updated 8-15-17 North Carolina Office of the State Controller Page 87
7. Once all objects have been added to your table, you may have to click the Refresh
icon to retrieve data.
Choosing Table Layout Method for Creating Table
If you use the list option to insert the table rather than clicking on the icon, a dialog box opens
that you can use to define the parameters of the report columns.
1. First add a new report tab to your report. You will see the Report 4 tab at the bottom
of your report and a blank workspace. To rename the Report tab, double click on
the new report tab and type the new name.
2. Click on the Report Elements tab and select the Tables sub-tab.
3. Click on the drop-down arrow beside the type of table you want to insert into your
report. In this exercise, you will select the first icon to define a vertical table. Click on
Define Vertical Table from the drop down.
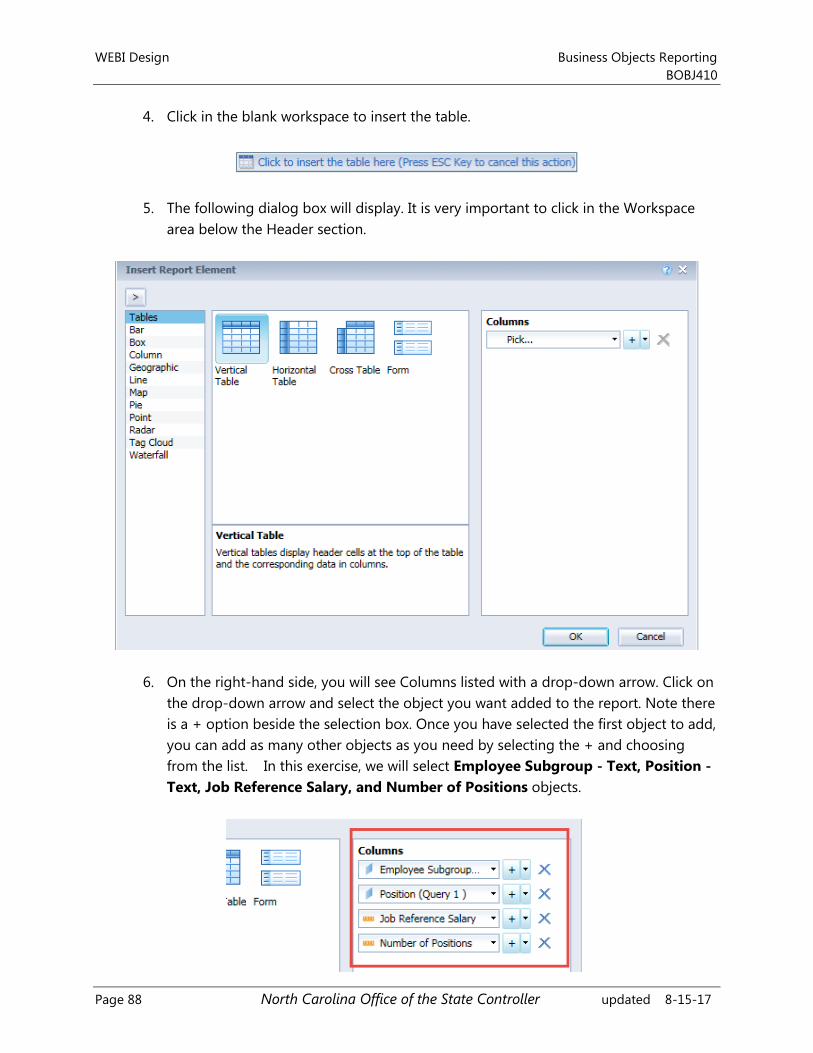
WEBI Design Business Objects Reporting
BOBJ410
Page 88 North Carolina Office of the State Controller updated 8-15-17
4. Click in the blank workspace to insert the table.
5. The following dialog box will display. It is very important to click in the Workspace
area below the Header section.
6. On the right-hand side, you will see Columns listed with a drop-down arrow. Click on
the drop-down arrow and select the object you want added to the report. Note there
is a + option beside the selection box. Once you have selected the first object to add,
you can add as many other objects as you need by selecting the + and choosing
from the list. In this exercise, we will select Employee Subgroup - Text, Position -
Text, Job Reference Salary, and Number of Positions objects.
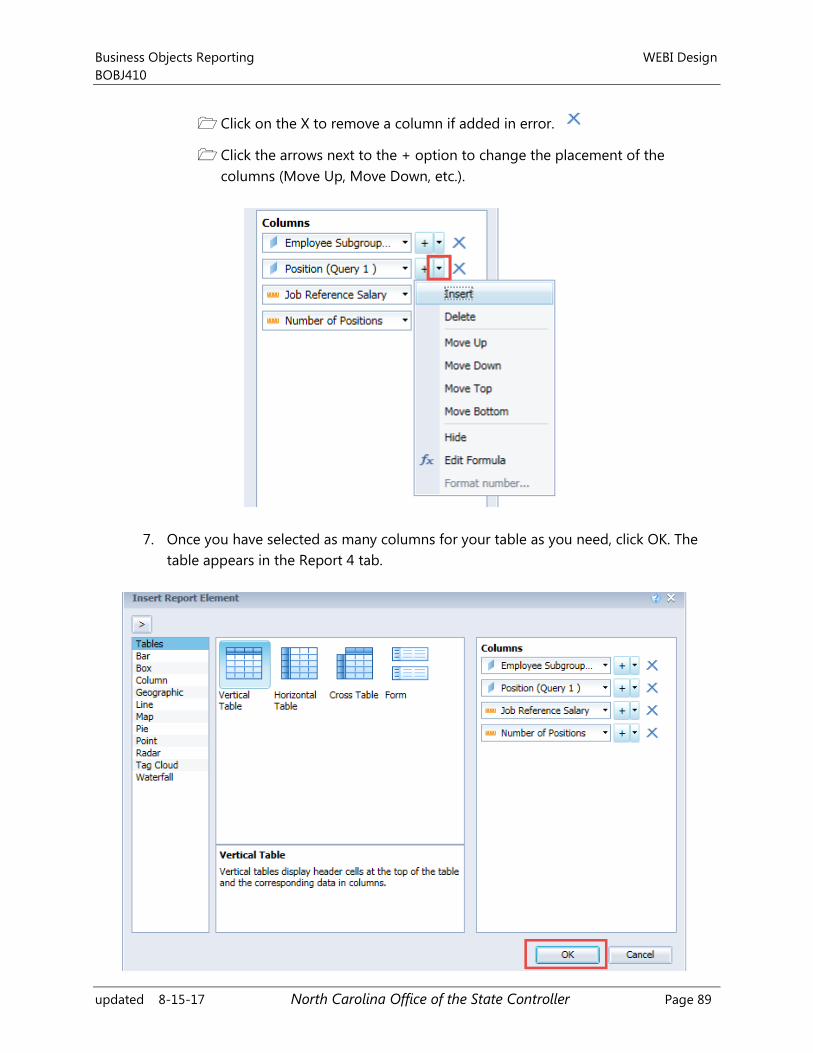
Business Objects Reporting WEBI Design
BOBJ410
updated 8-15-17 North Carolina Office of the State Controller Page 89
Click on the X to remove a column if added in error.
Click the arrows next to the + option to change the placement of the
columns (Move Up, Move Down, etc.).
7. Once you have selected as many columns for your table as you need, click OK. The
table appears in the Report 4 tab.
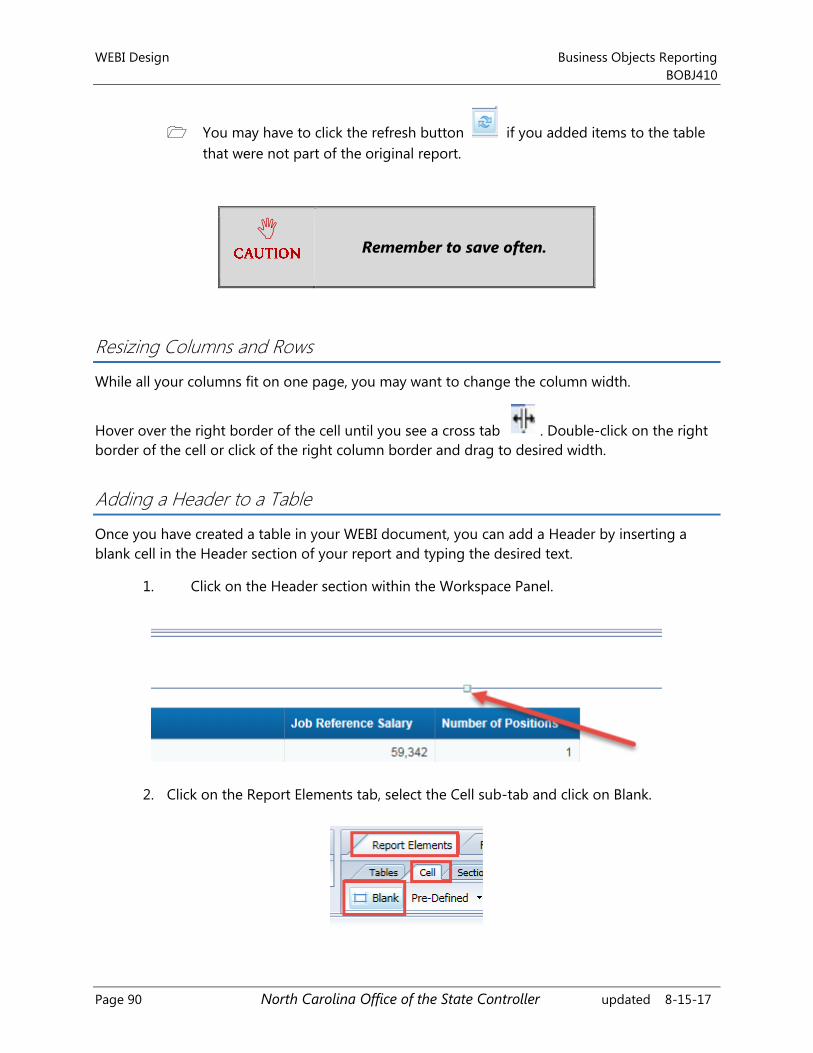
WEBI Design Business Objects Reporting
BOBJ410
Page 90 North Carolina Office of the State Controller updated 8-15-17
You may have to click the refresh button if you added items to the table
that were not part of the original report.
Remember to save often.
Resizing Columns and Rows
While all your columns fit on one page, you may want to change the column width.
Hover over the right border of the cell until you see a cross tab . Double-click on the right
border of the cell or click of the right column border and drag to desired width.
Adding a Header to a Table
Once you have created a table in your WEBI document, you can add a Header by inserting a
blank cell in the Header section of your report and typing the desired text.
1. Click on the Header section within the Workspace Panel.
2. Click on the Report Elements tab, select the Cell sub-tab and click on Blank.
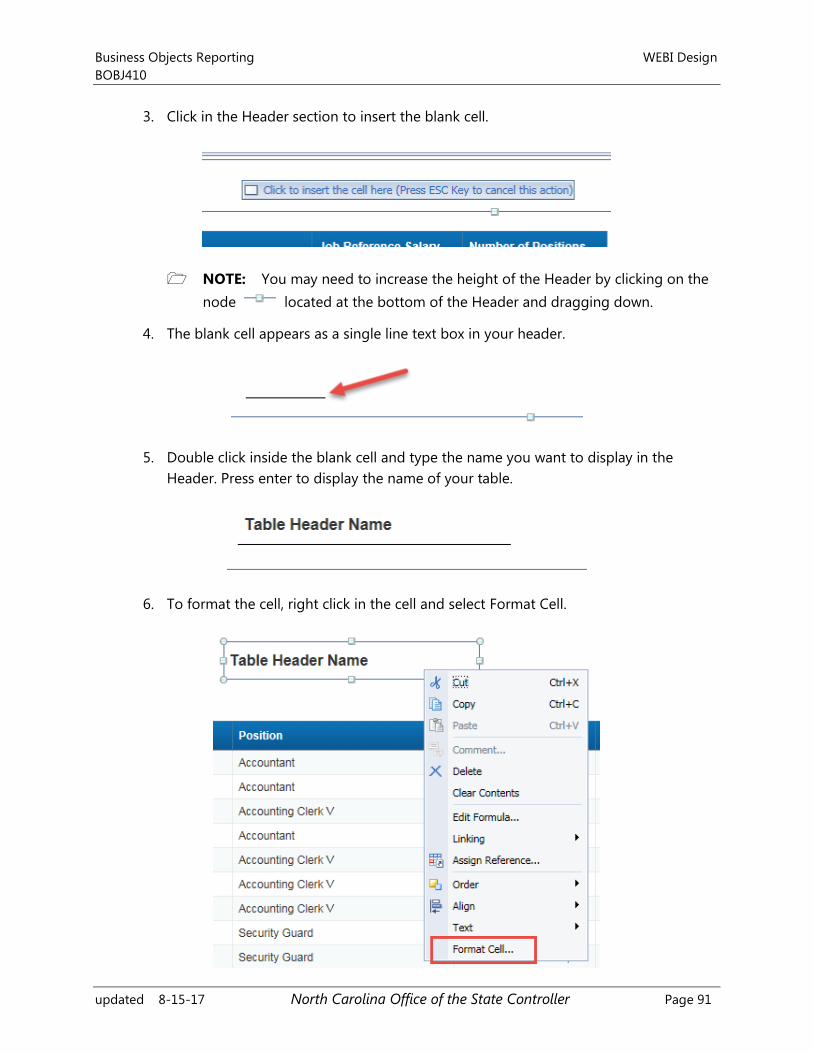
Business Objects Reporting WEBI Design
BOBJ410
updated 8-15-17 North Carolina Office of the State Controller Page 91
3. Click in the Header section to insert the blank cell.
NOTE: You may need to increase the height of the Header by clicking on the
node located at the bottom of the Header and dragging down.
4. The blank cell appears as a single line text box in your header.
5. Double click inside the blank cell and type the name you want to display in the
Header. Press enter to display the name of your table.
6. To format the cell, right click in the cell and select Format Cell.
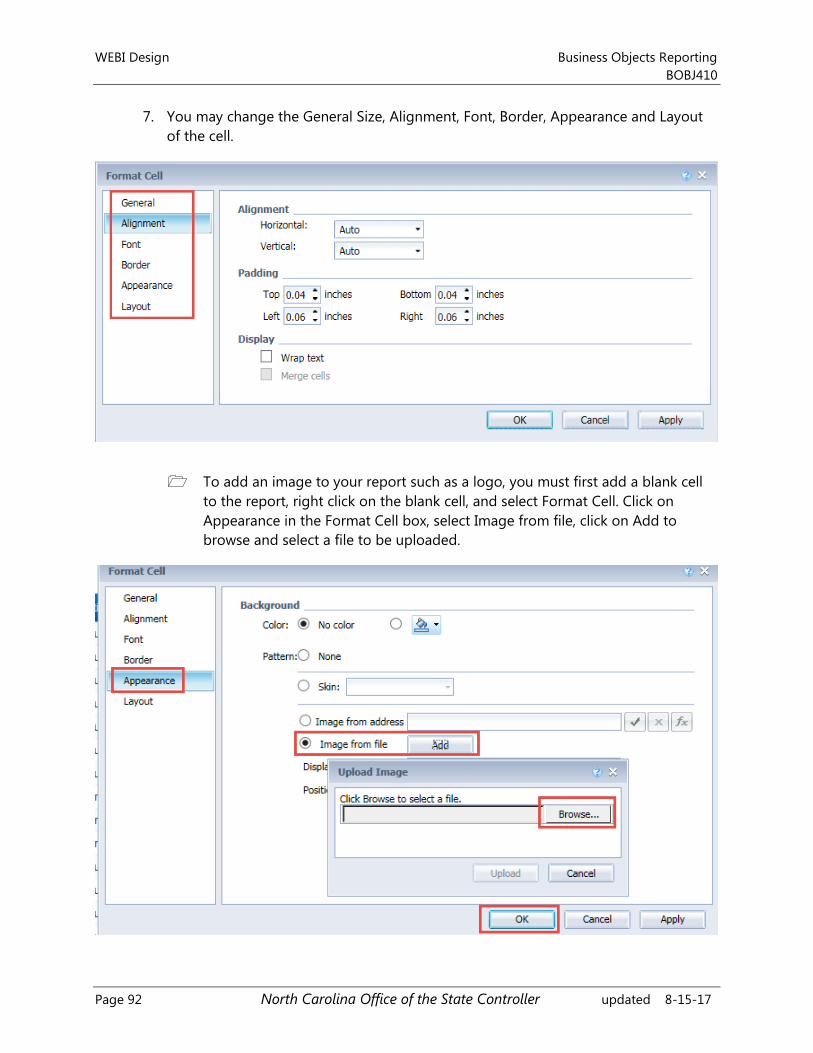
WEBI Design Business Objects Reporting
BOBJ410
Page 92 North Carolina Office of the State Controller updated 8-15-17
7. You may change the General Size, Alignment, Font, Border, Appearance and Layout
of the cell.
To add an image to your report such as a logo, you must first add a blank cell
to the report, right click on the blank cell, and select Format Cell. Click on
Appearance in the Format Cell box, select Image from file, click on Add to
browse and select a file to be uploaded.
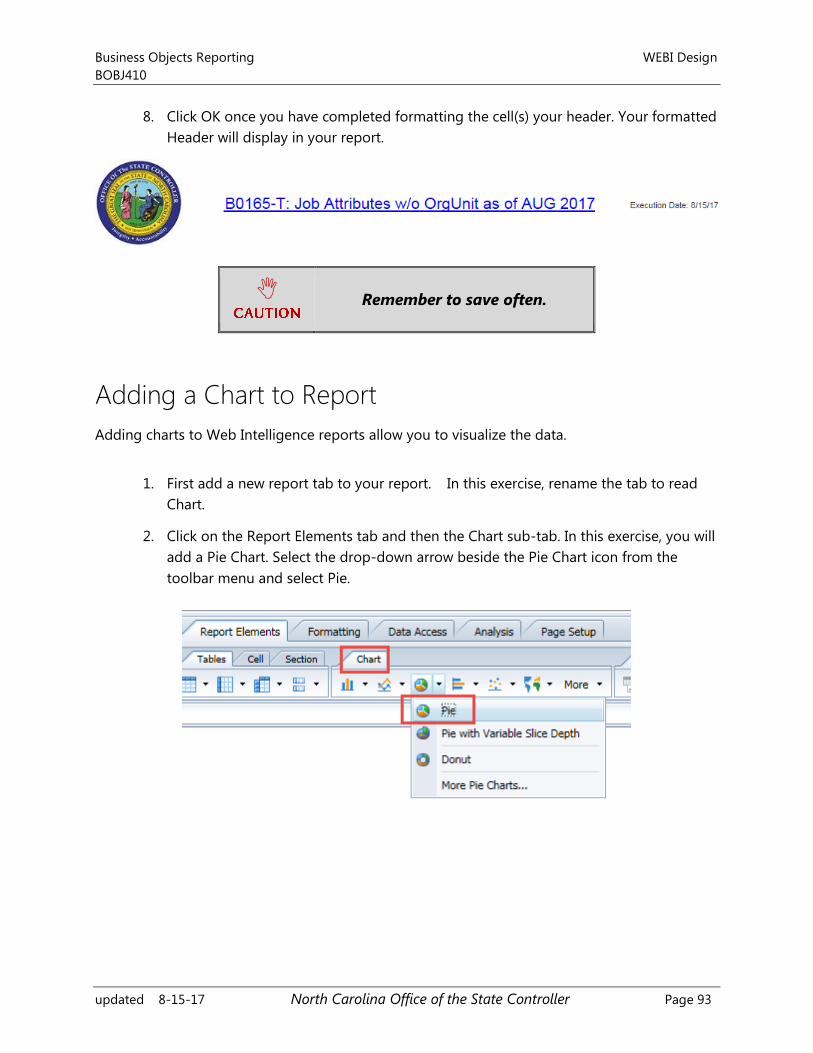
Business Objects Reporting WEBI Design
BOBJ410
updated 8-15-17 North Carolina Office of the State Controller Page 93
8. Click OK once you have completed formatting the cell(s) your header. Your formatted
Header will display in your report.
Remember to save often.
Adding a Chart to Report
Adding charts to Web Intelligence reports allow you to visualize the data.
1. First add a new report tab to your report. In this exercise, rename the tab to read
Chart.
2. Click on the Report Elements tab and then the Chart sub-tab. In this exercise, you will
add a Pie Chart. Select the drop-down arrow beside the Pie Chart icon from the
toolbar menu and select Pie.
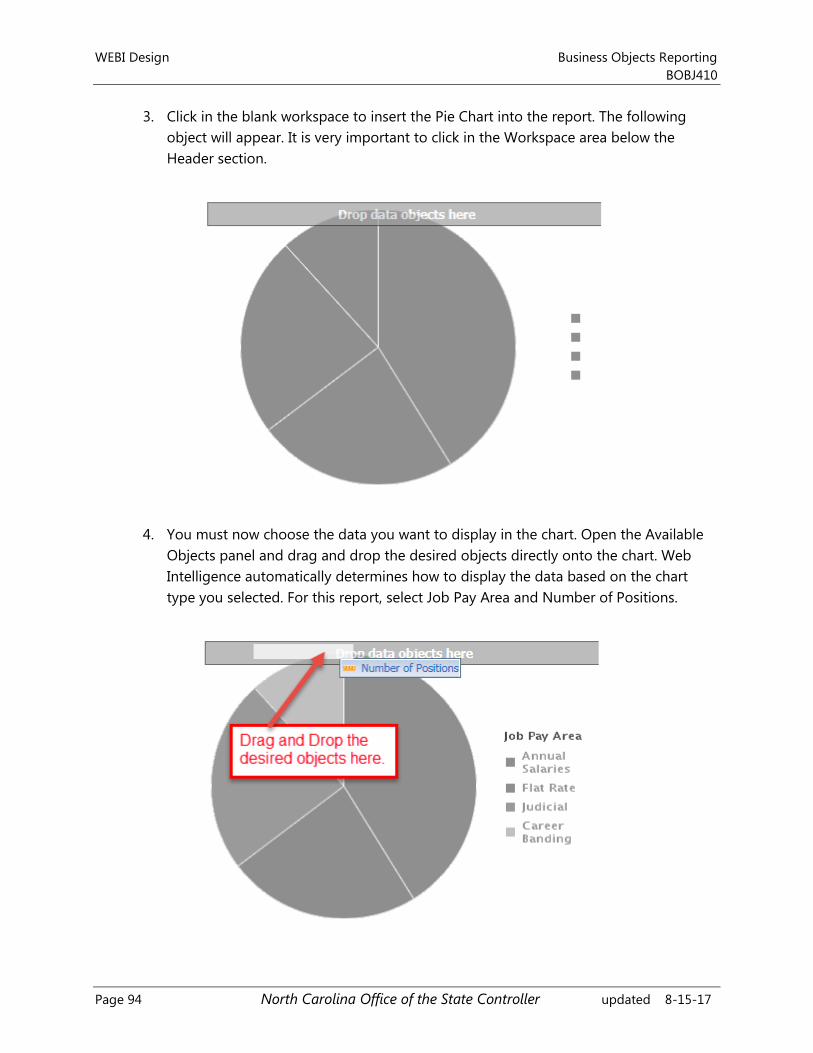
WEBI Design Business Objects Reporting
BOBJ410
Page 94 North Carolina Office of the State Controller updated 8-15-17
3. Click in the blank workspace to insert the Pie Chart into the report. The following
object will appear. It is very important to click in the Workspace area below the
Header section.
4. You must now choose the data you want to display in the chart. Open the Available
Objects panel and drag and drop the desired objects directly onto the chart. Web
Intelligence automatically determines how to display the data based on the chart
type you selected. For this report, select Job Pay Area and Number of Positions.
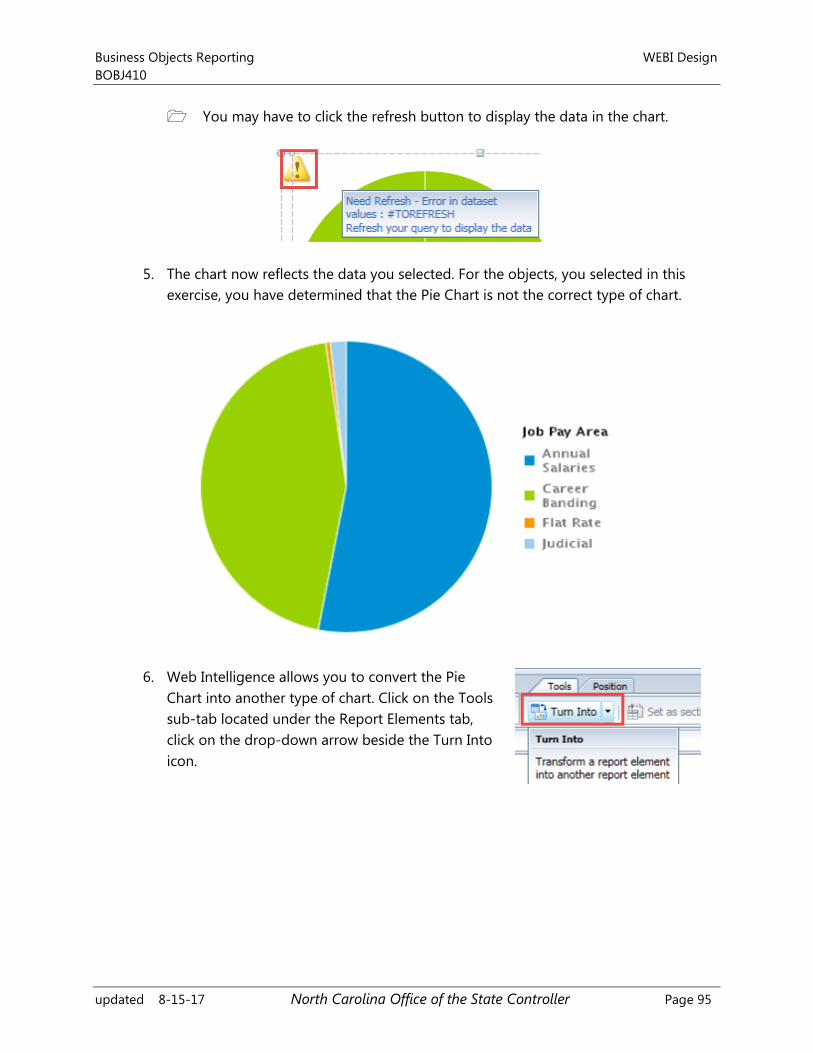
Business Objects Reporting WEBI Design
BOBJ410
updated 8-15-17 North Carolina Office of the State Controller Page 95
You may have to click the refresh button to display the data in the chart.
5. The chart now reflects the data you selected. For the objects, you selected in this
exercise, you have determined that the Pie Chart is not the correct type of chart.
6. Web Intelligence allows you to convert the Pie
Chart into another type of chart. Click on the Tools
sub-tab located under the Report Elements tab,
click on the drop-down arrow beside the Turn Into
icon.
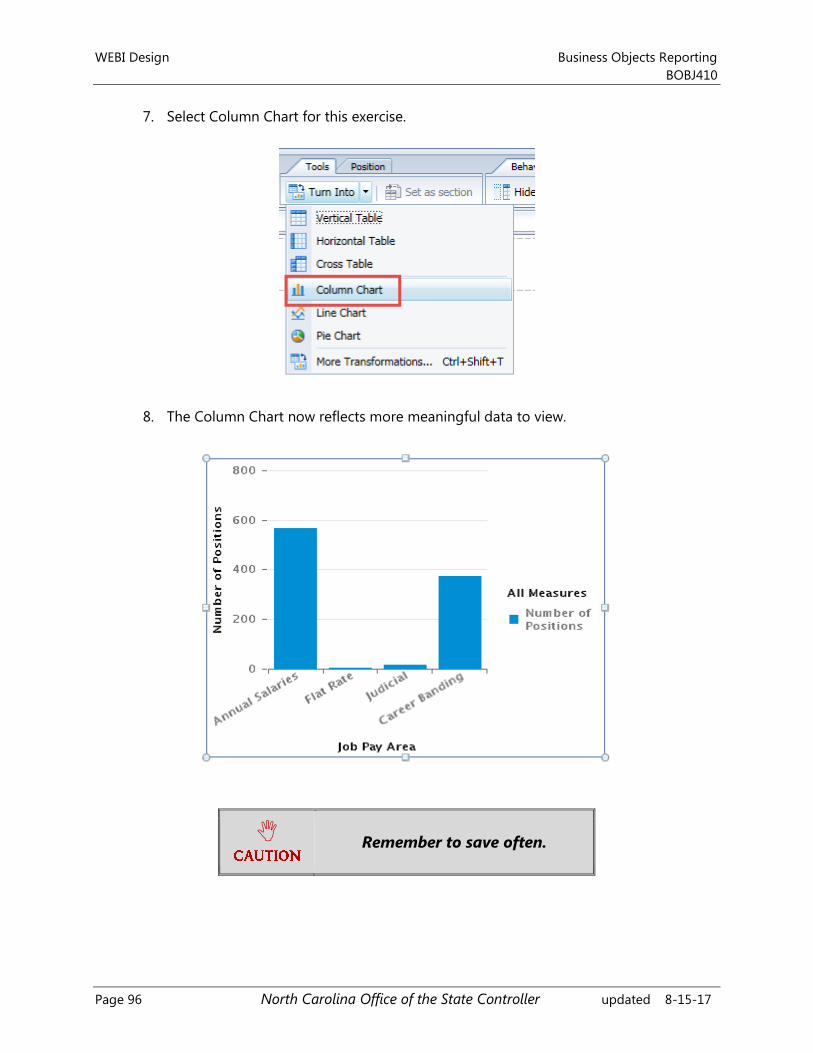
WEBI Design Business Objects Reporting
BOBJ410
Page 96 North Carolina Office of the State Controller updated 8-15-17
7. Select Column Chart for this exercise.
8. The Column Chart now reflects more meaningful data to view.
Remember to save often.
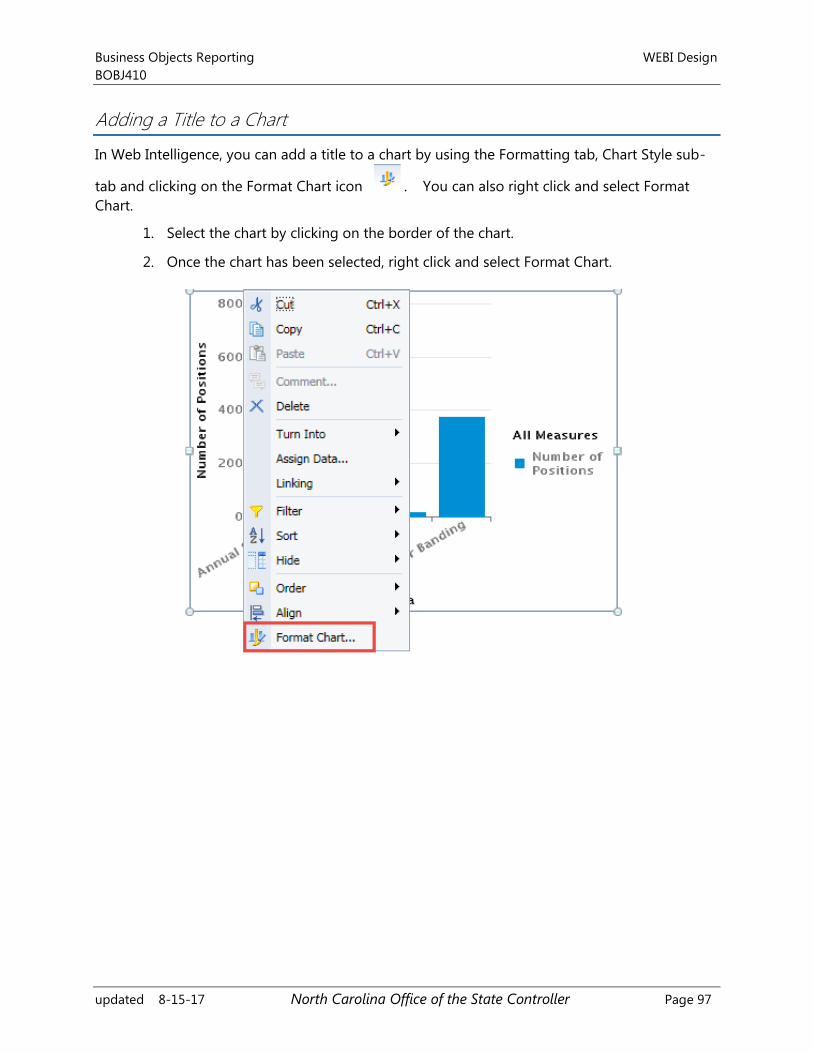
Business Objects Reporting WEBI Design
BOBJ410
updated 8-15-17 North Carolina Office of the State Controller Page 97
Adding a Title to a Chart
In Web Intelligence, you can add a title to a chart by using the Formatting tab, Chart Style sub-
tab and clicking on the Format Chart icon . You can also right click and select Format
Chart.
1. Select the chart by clicking on the border of the chart.
2. Once the chart has been selected, right click and select Format Chart.
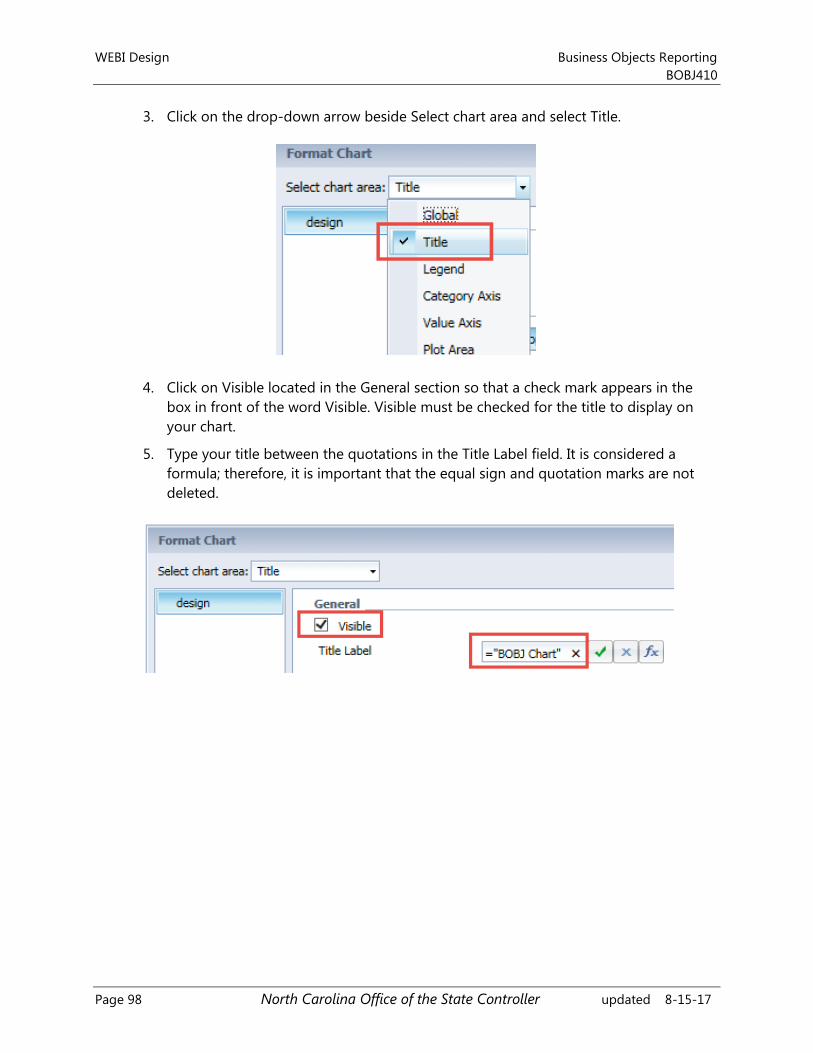
WEBI Design Business Objects Reporting
BOBJ410
Page 98 North Carolina Office of the State Controller updated 8-15-17
3. Click on the drop-down arrow beside Select chart area and select Title.
4. Click on Visible located in the General section so that a check mark appears in the
box in front of the word Visible. Visible must be checked for the title to display on
your chart.
5. Type your title between the quotations in the Title Label field. It is considered a
formula; therefore, it is important that the equal sign and quotation marks are not
deleted.
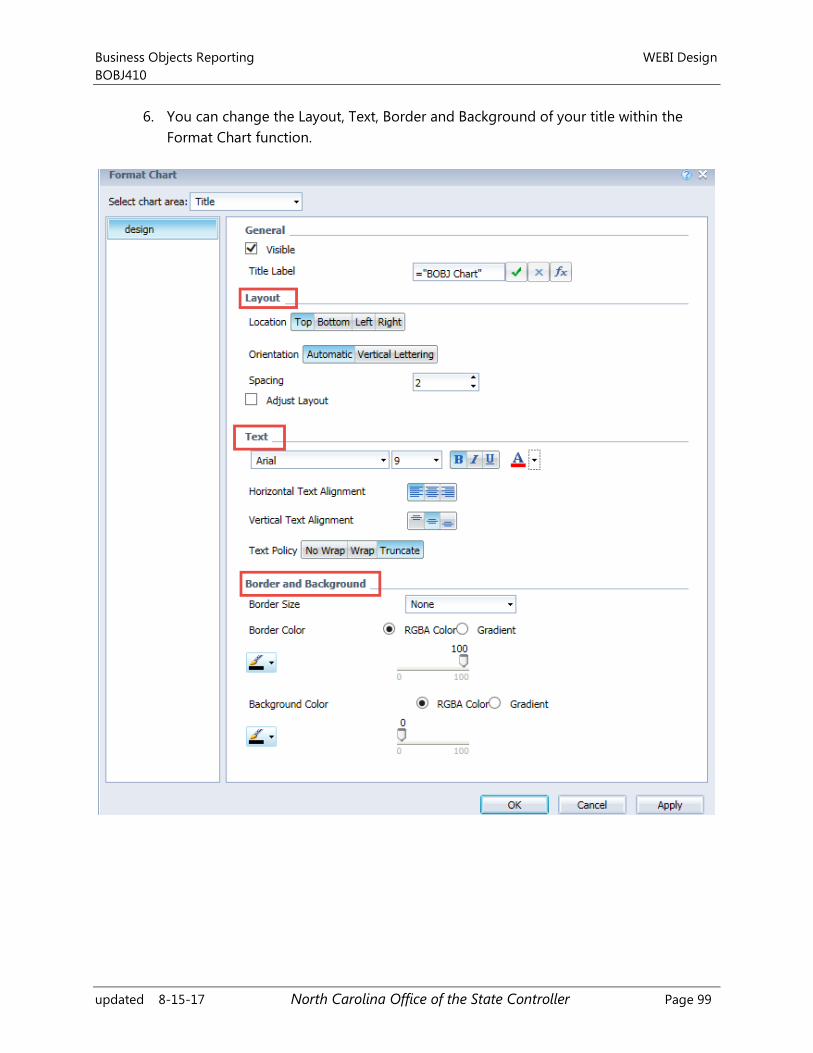
Business Objects Reporting WEBI Design
BOBJ410
updated 8-15-17 North Carolina Office of the State Controller Page 99
6. You can change the Layout, Text, Border and Background of your title within the
Format Chart function.
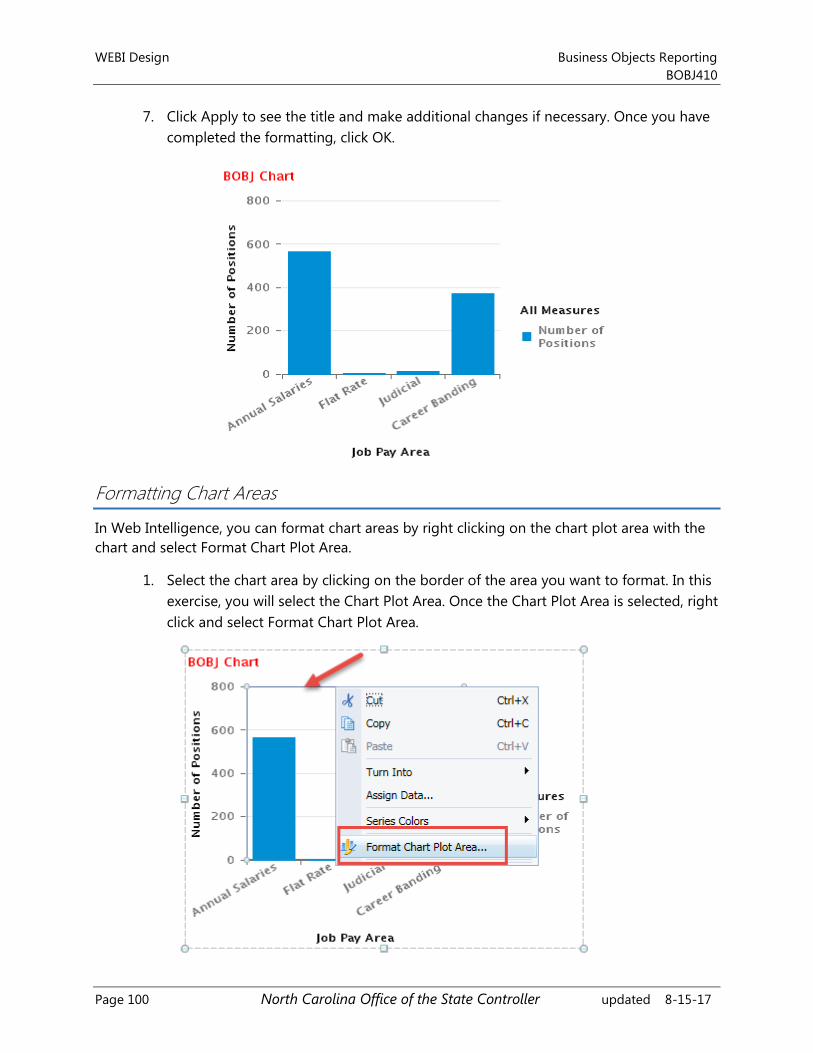
WEBI Design Business Objects Reporting
BOBJ410
Page 100 North Carolina Office of the State Controller updated 8-15-17
7. Click Apply to see the title and make additional changes if necessary. Once you have
completed the formatting, click OK.
Formatting Chart Areas
In Web Intelligence, you can format chart areas by right clicking on the chart plot area with the
chart and select Format Chart Plot Area.
1. Select the chart area by clicking on the border of the area you want to format. In this
exercise, you will select the Chart Plot Area. Once the Chart Plot Area is selected, right
click and select Format Chart Plot Area.
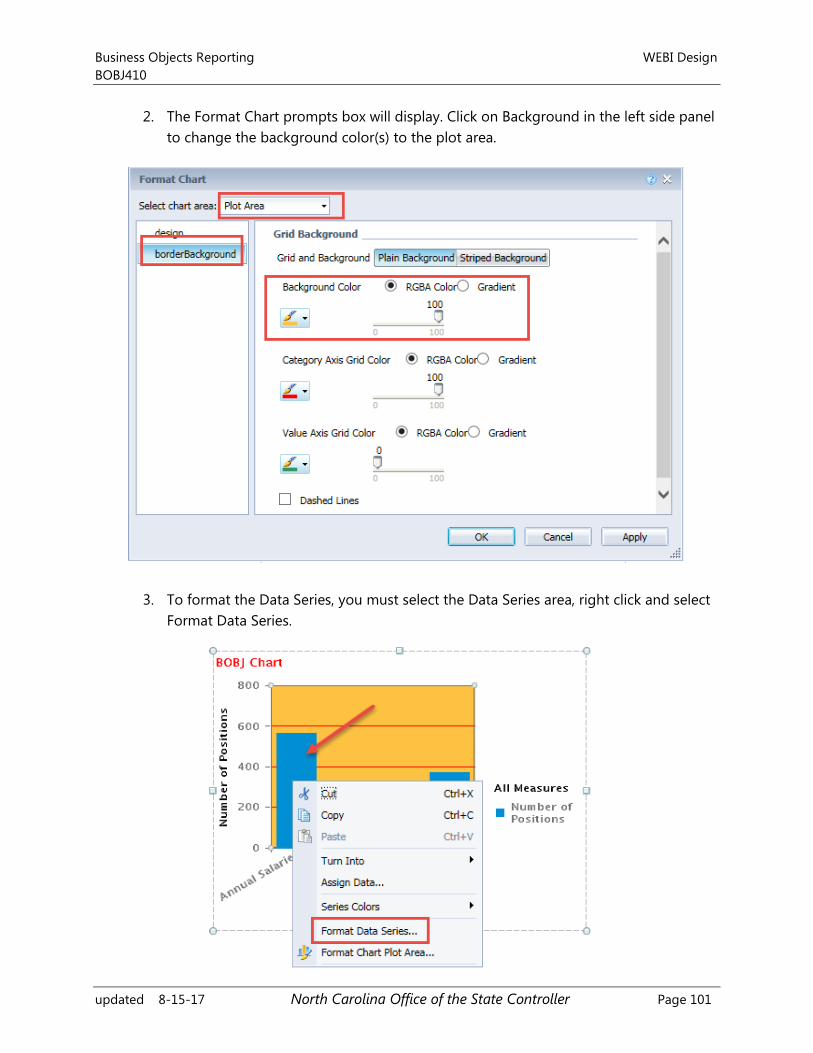
Business Objects Reporting WEBI Design
BOBJ410
updated 8-15-17 North Carolina Office of the State Controller Page 101
2. The Format Chart prompts box will display. Click on Background in the left side panel
to change the background color(s) to the plot area.
3. To format the Data Series, you must select the Data Series area, right click and select
Format Data Series.
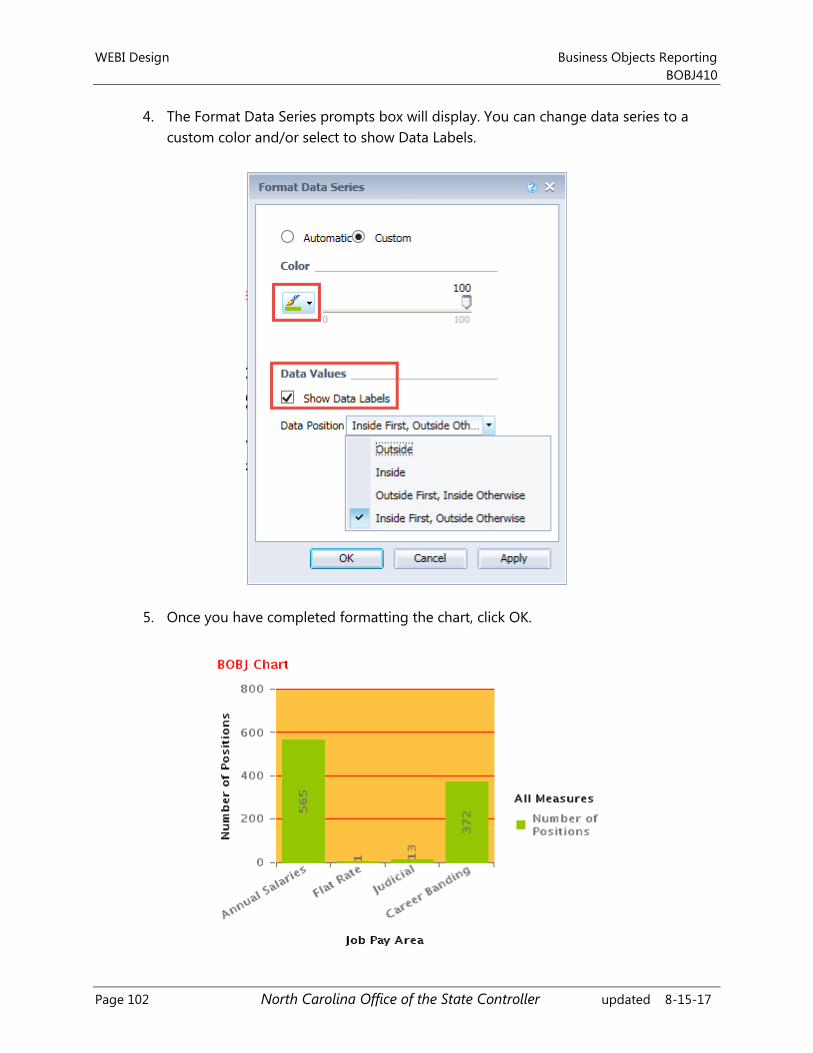
WEBI Design Business Objects Reporting
BOBJ410
Page 102 North Carolina Office of the State Controller updated 8-15-17
4. The Format Data Series prompts box will display. You can change data series to a
custom color and/or select to show Data Labels.
5. Once you have completed formatting the chart, click OK.
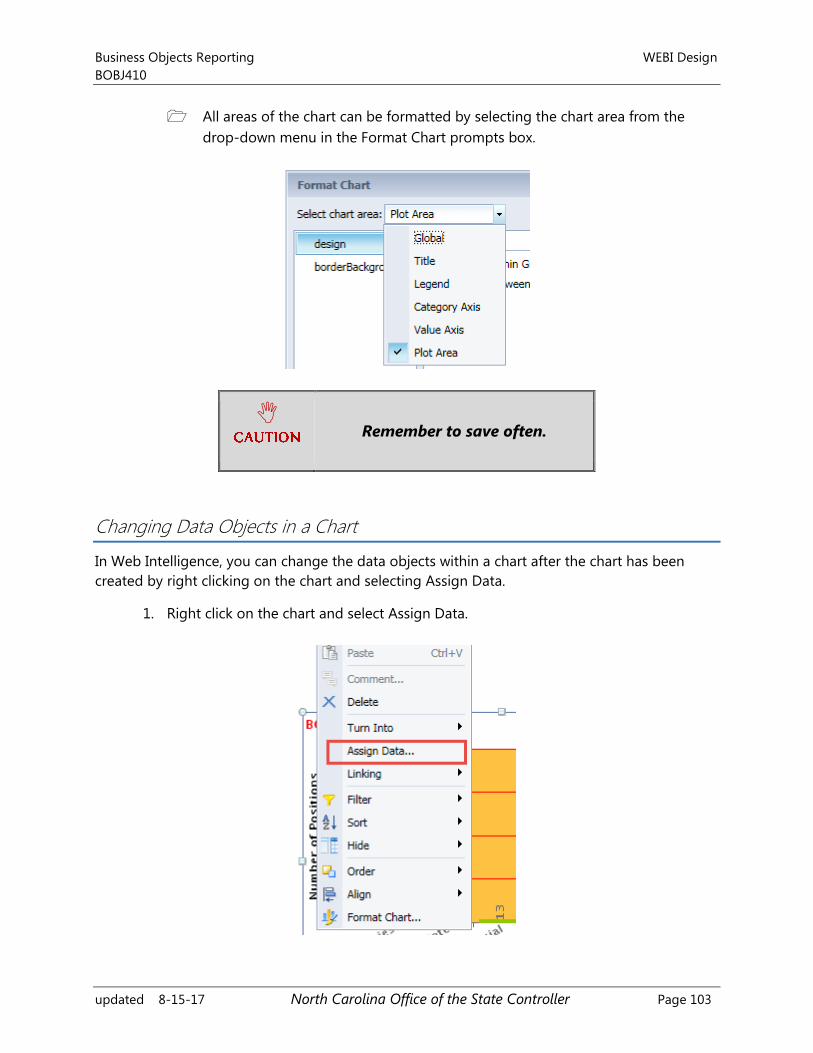
Business Objects Reporting WEBI Design
BOBJ410
updated 8-15-17 North Carolina Office of the State Controller Page 103
All areas of the chart can be formatted by selecting the chart area from the
drop-down menu in the Format Chart prompts box.
Remember to save often.
Changing Data Objects in a Chart
In Web Intelligence, you can change the data objects within a chart after the chart has been
created by right clicking on the chart and selecting Assign Data.
1. Right click on the chart and select Assign Data.
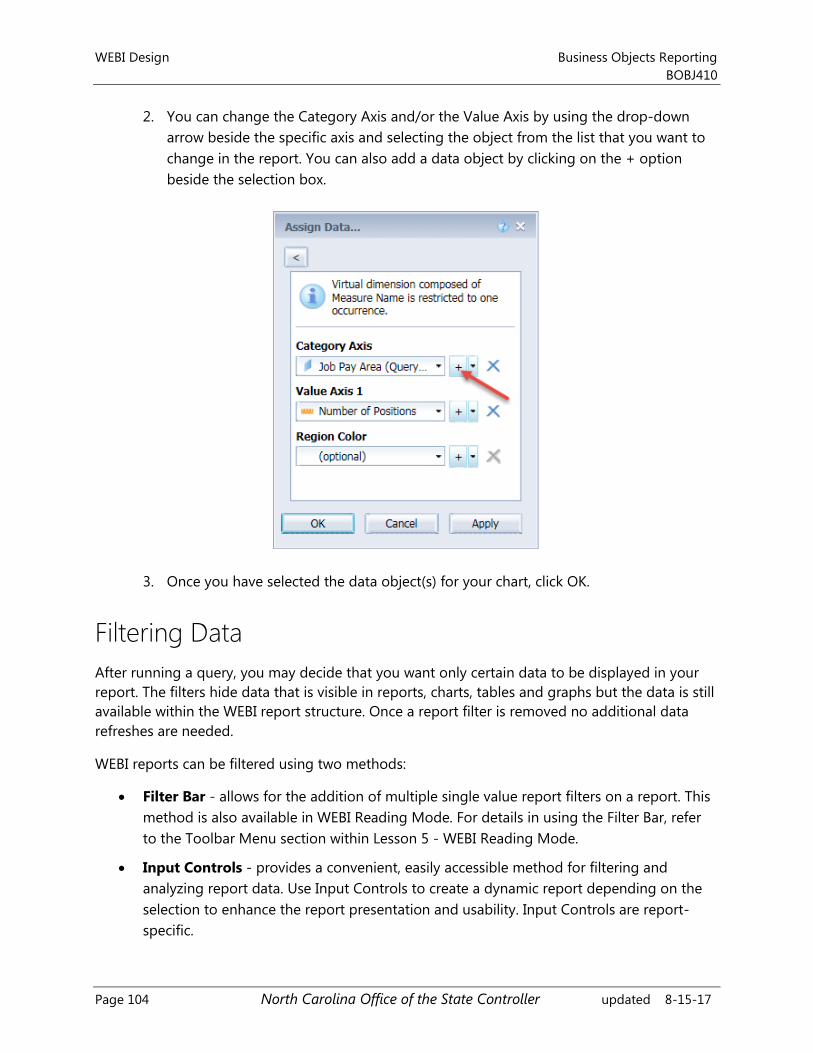
WEBI Design Business Objects Reporting
BOBJ410
Page 104 North Carolina Office of the State Controller updated 8-15-17
2. You can change the Category Axis and/or the Value Axis by using the drop-down
arrow beside the specific axis and selecting the object from the list that you want to
change in the report. You can also add a data object by clicking on the + option
beside the selection box.
3. Once you have selected the data object(s) for your chart, click OK.
Filtering Data
After running a query, you may decide that you want only certain data to be displayed in your
report. The filters hide data that is visible in reports, charts, tables and graphs but the data is still
available within the WEBI report structure. Once a report filter is removed no additional data
refreshes are needed.
WEBI reports can be filtered using two methods:
Filter Bar - allows for the addition of multiple single value report filters on a report. This
method is also available in WEBI Reading Mode. For details in using the Filter Bar, refer
to the Toolbar Menu section within Lesson 5 - WEBI Reading Mode.
Input Controls - provides a convenient, easily accessible method for filtering and
analyzing report data. Use Input Controls to create a dynamic report depending on the
selection to enhance the report presentation and usability. Input Controls are report-
specific.
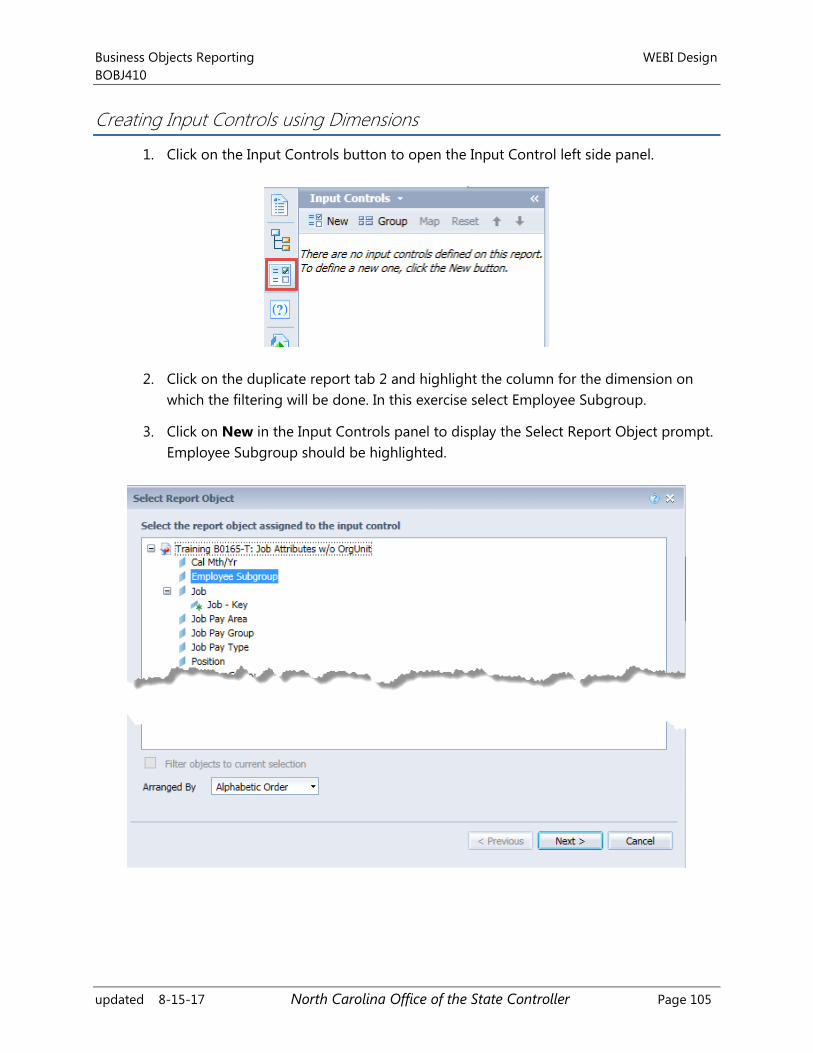
Business Objects Reporting WEBI Design
BOBJ410
updated 8-15-17 North Carolina Office of the State Controller Page 105
Creating Input Controls using Dimensions
1. Click on the Input Controls button to open the Input Control left side panel.
2. Click on the duplicate report tab 2 and highlight the column for the dimension on
which the filtering will be done. In this exercise select Employee Subgroup.
3. Click on New in the Input Controls panel to display the Select Report Object prompt.
Employee Subgroup should be highlighted.
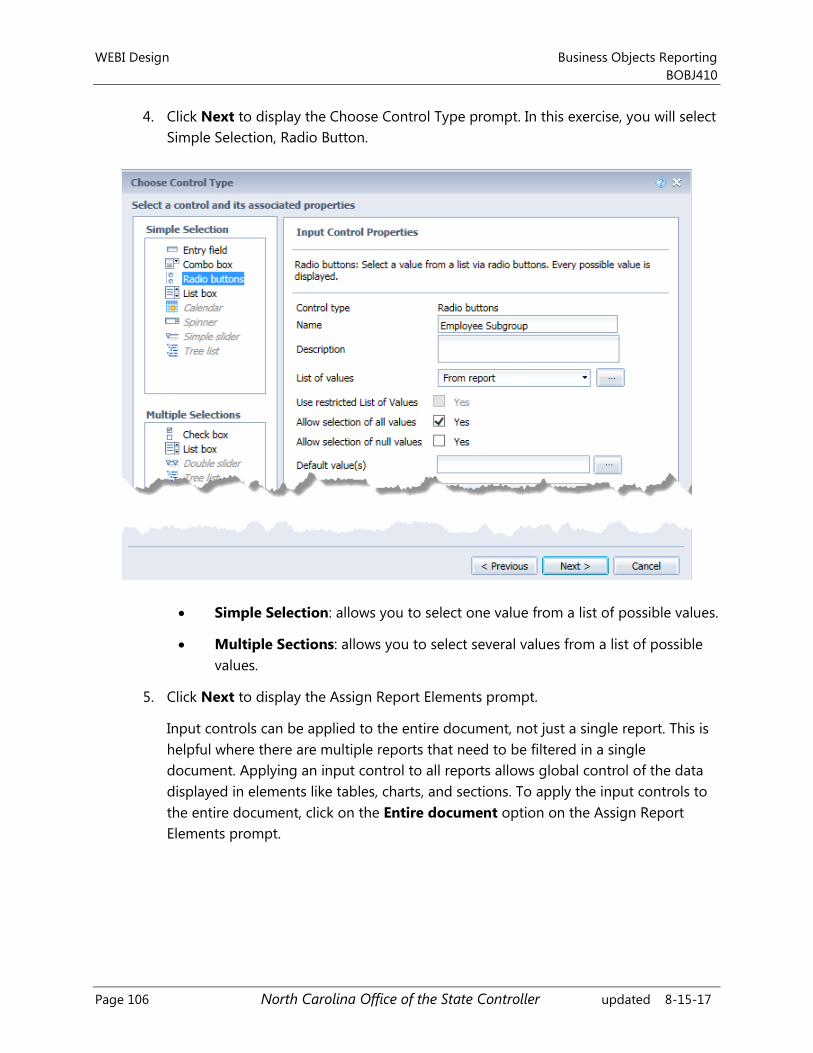
WEBI Design Business Objects Reporting
BOBJ410
Page 106 North Carolina Office of the State Controller updated 8-15-17
4. Click Next to display the Choose Control Type prompt. In this exercise, you will select
Simple Selection, Radio Button.
Simple Selection: allows you to select one value from a list of possible values.
Multiple Sections: allows you to select several values from a list of possible
values.
5. Click Next to display the Assign Report Elements prompt.
Input controls can be applied to the entire document, not just a single report. This is
helpful where there are multiple reports that need to be filtered in a single
document. Applying an input control to all reports allows global control of the data
displayed in elements like tables, charts, and sections. To apply the input controls to
the entire document, click on the Entire document option on the Assign Report
Elements prompt.
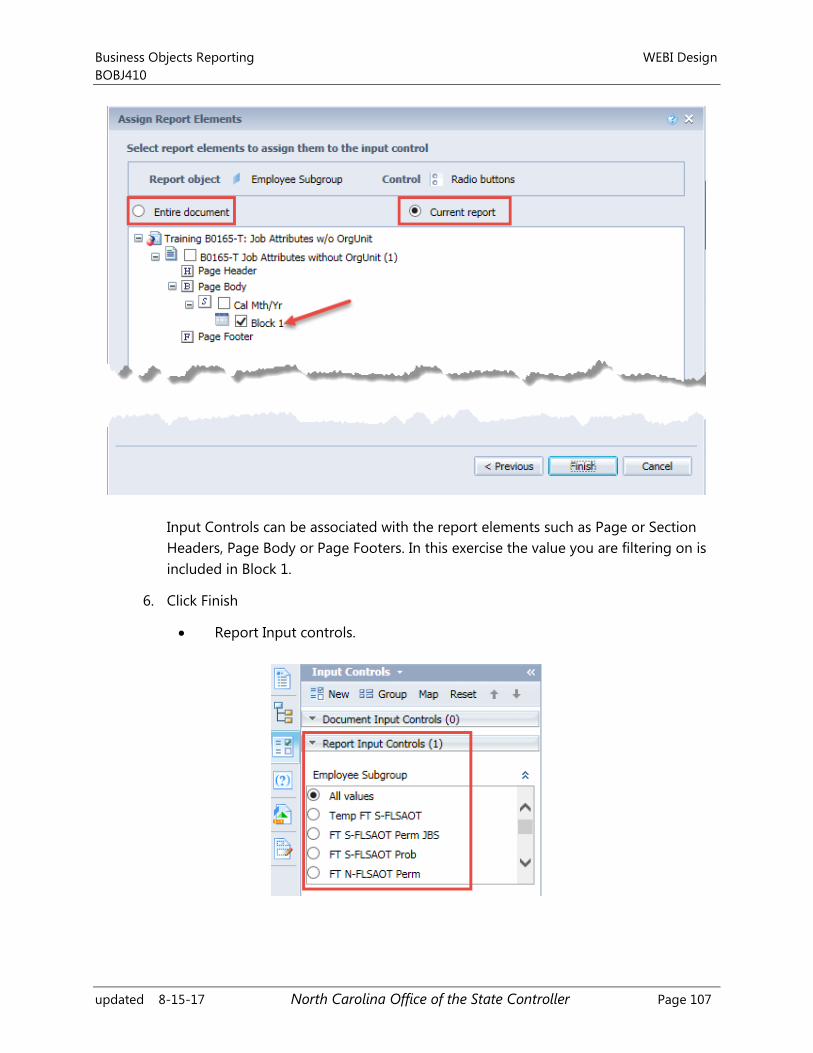
Business Objects Reporting WEBI Design
BOBJ410
updated 8-15-17 North Carolina Office of the State Controller Page 107
Input Controls can be associated with the report elements such as Page or Section
Headers, Page Body or Page Footers. In this exercise the value you are filtering on is
included in Block 1.
6. Click Finish
Report Input controls.
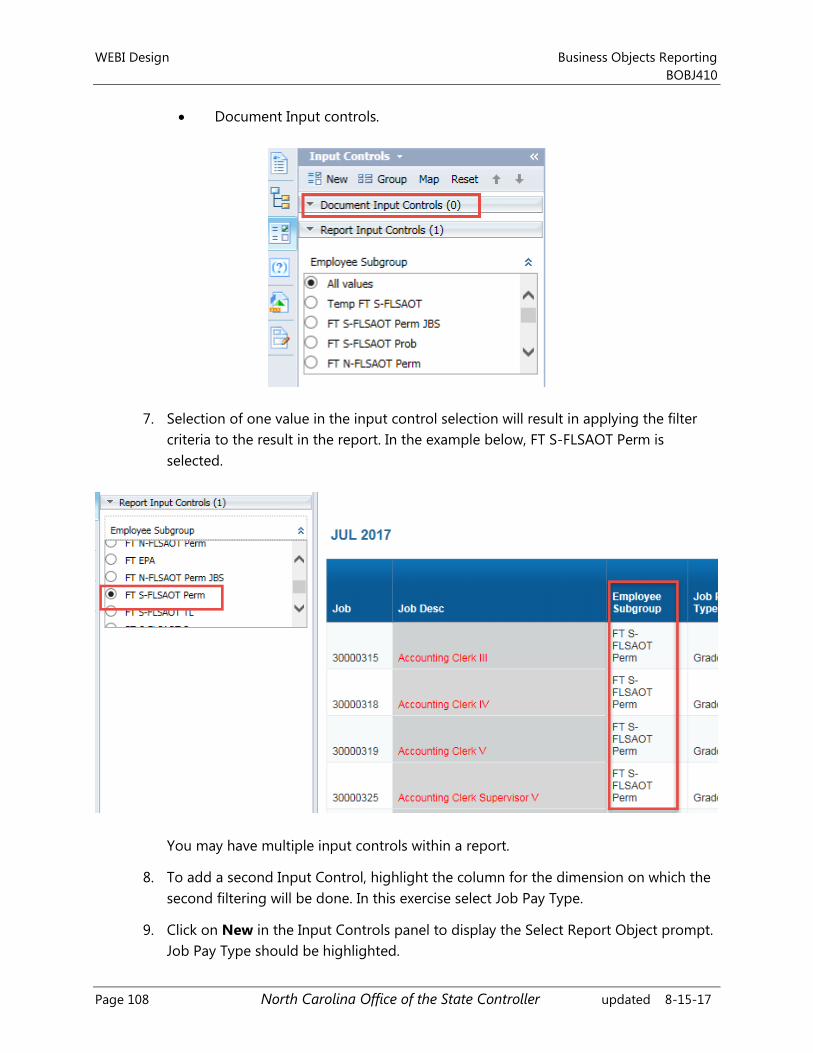
WEBI Design Business Objects Reporting
BOBJ410
Page 108 North Carolina Office of the State Controller updated 8-15-17
Document Input controls.
7. Selection of one value in the input control selection will result in applying the filter
criteria to the result in the report. In the example below, FT S-FLSAOT Perm is
selected.
You may have multiple input controls within a report.
8. To add a second Input Control, highlight the column for the dimension on which the
second filtering will be done. In this exercise select Job Pay Type.
9. Click on New in the Input Controls panel to display the Select Report Object prompt.
Job Pay Type should be highlighted.

Business Objects Reporting WEBI Design
BOBJ410
updated 8-15-17 North Carolina Office of the State Controller Page 109
10. Click Next to display the Choose Control Type prompt. In this exercise select Multiple
Selection, List box.
11. Click Next to display the Assign Report Elements prompt.
NOTE: Remember, input controls can be applied to the current report or to the
whole document.
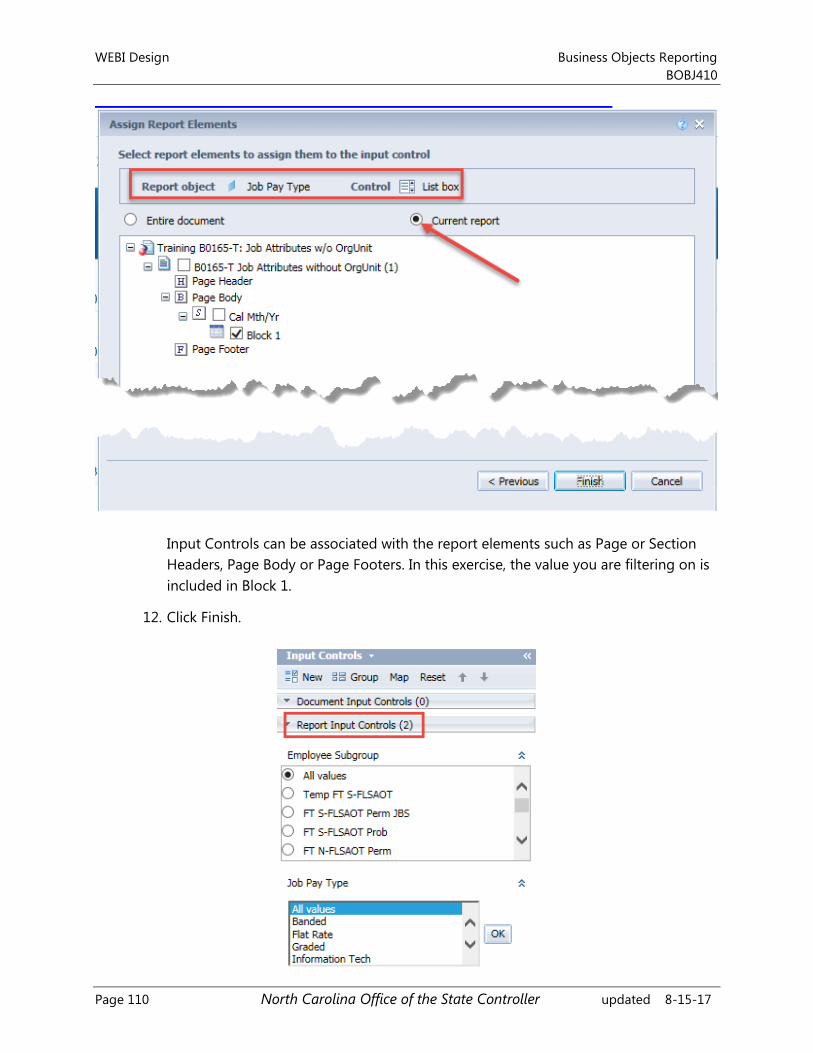
WEBI Design Business Objects Reporting
BOBJ410
Page 110 North Carolina Office of the State Controller updated 8-15-17
Input Controls can be associated with the report elements such as Page or Section
Headers, Page Body or Page Footers. In this exercise, the value you are filtering on is
included in Block 1.
12. Click Finish.
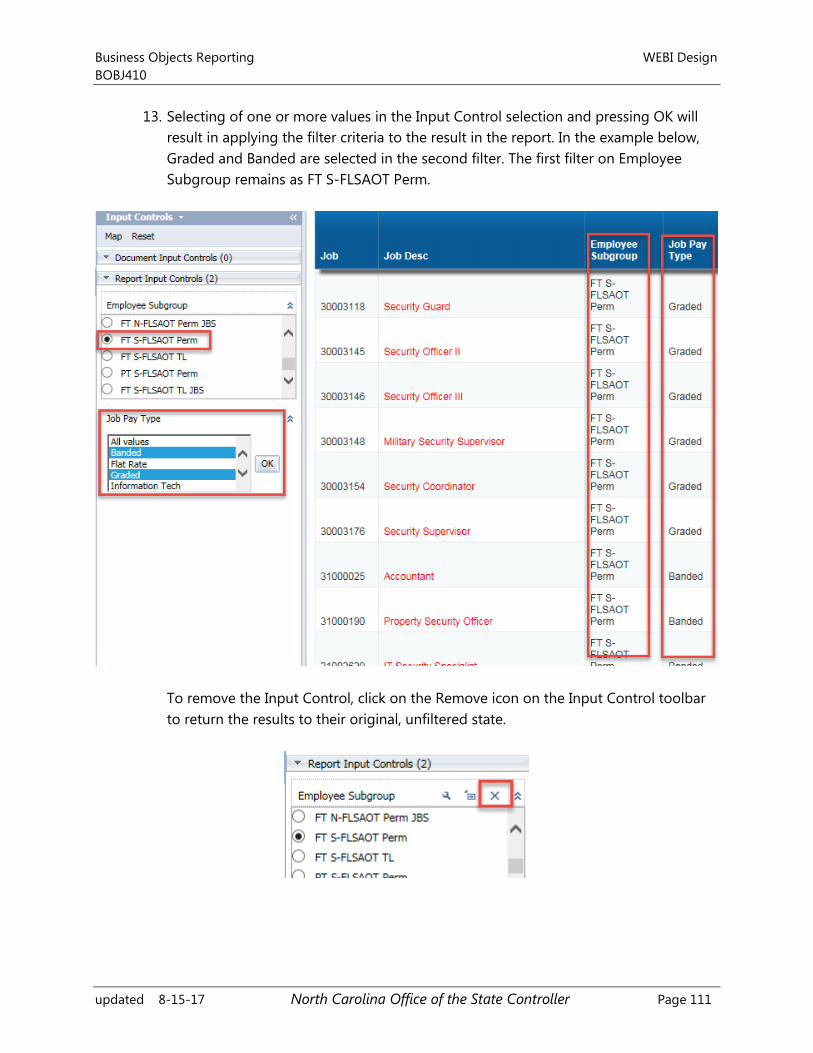
Business Objects Reporting WEBI Design
BOBJ410
updated 8-15-17 North Carolina Office of the State Controller Page 111
13. Selecting of one or more values in the Input Control selection and pressing OK will
result in applying the filter criteria to the result in the report. In the example below,
Graded and Banded are selected in the second filter. The first filter on Employee
Subgroup remains as FT S-FLSAOT Perm.
To remove the Input Control, click on the Remove icon on the Input Control toolbar
to return the results to their original, unfiltered state.
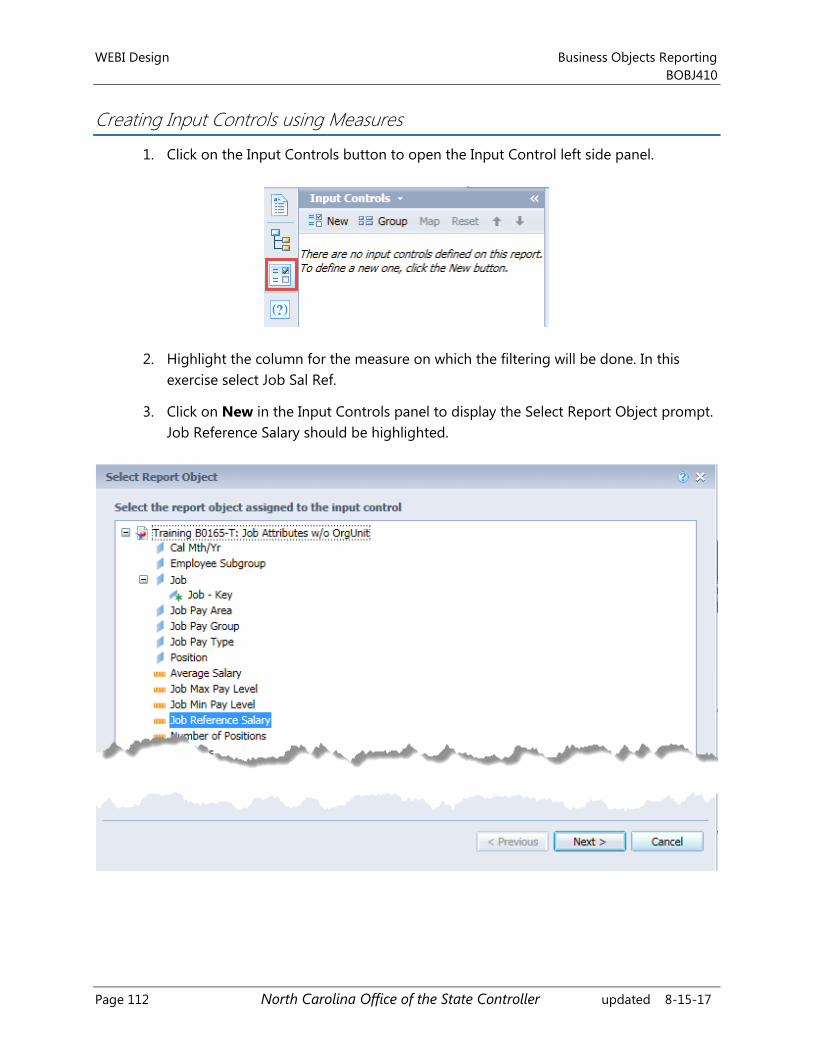
WEBI Design Business Objects Reporting
BOBJ410
Page 112 North Carolina Office of the State Controller updated 8-15-17
Creating Input Controls using Measures
1. Click on the Input Controls button to open the Input Control left side panel.
2. Highlight the column for the measure on which the filtering will be done. In this
exercise select Job Sal Ref.
3. Click on New in the Input Controls panel to display the Select Report Object prompt.
Job Reference Salary should be highlighted.
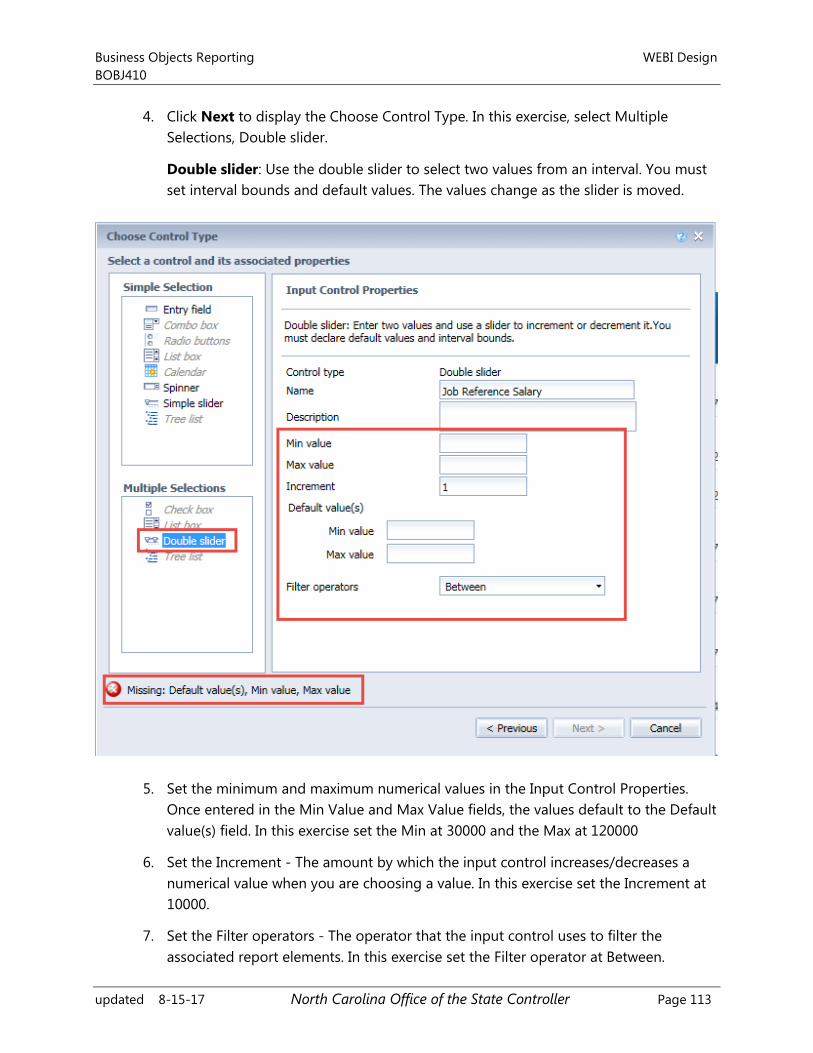
Business Objects Reporting WEBI Design
BOBJ410
updated 8-15-17 North Carolina Office of the State Controller Page 113
4. Click Next to display the Choose Control Type. In this exercise, select Multiple
Selections, Double slider.
Double slider: Use the double slider to select two values from an interval. You must
set interval bounds and default values. The values change as the slider is moved.
5. Set the minimum and maximum numerical values in the Input Control Properties.
Once entered in the Min Value and Max Value fields, the values default to the Default
value(s) field. In this exercise set the Min at 30000 and the Max at 120000
6. Set the Increment - The amount by which the input control increases/decreases a
numerical value when you are choosing a value. In this exercise set the Increment at
10000.
7. Set the Filter operators - The operator that the input control uses to filter the
associated report elements. In this exercise set the Filter operator at Between.
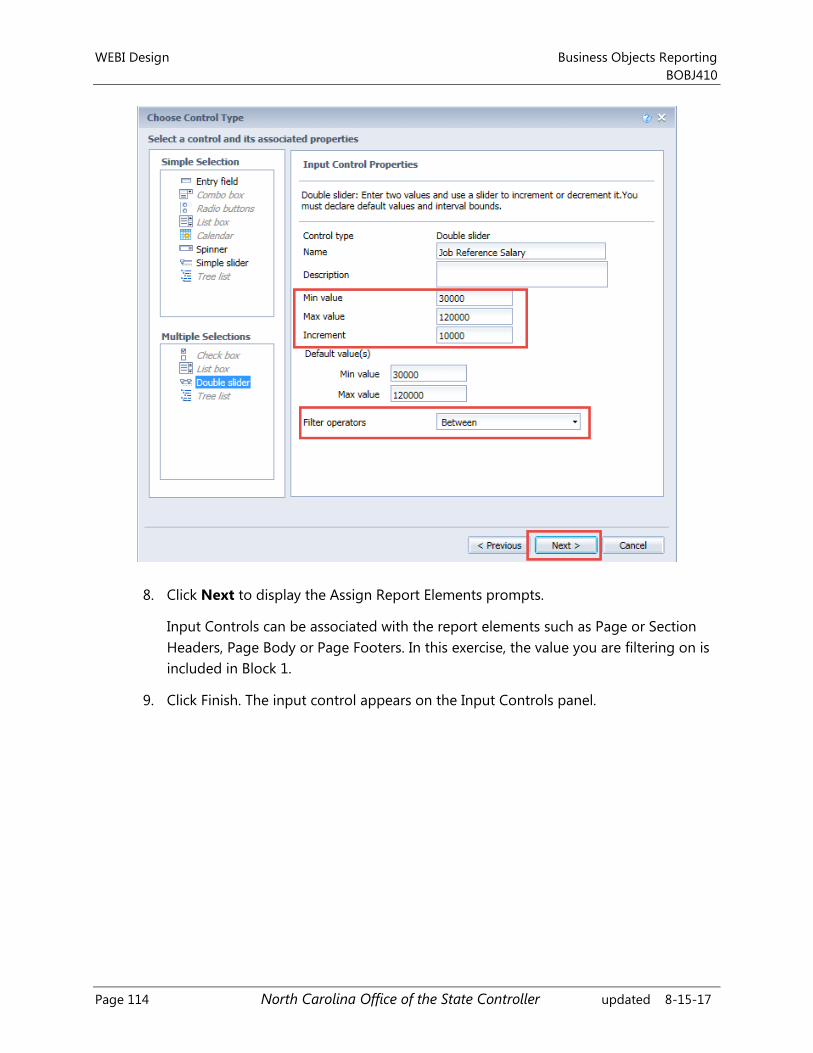
WEBI Design Business Objects Reporting
BOBJ410
Page 114 North Carolina Office of the State Controller updated 8-15-17
8. Click Next to display the Assign Report Elements prompts.
Input Controls can be associated with the report elements such as Page or Section
Headers, Page Body or Page Footers. In this exercise, the value you are filtering on is
included in Block 1.
9. Click Finish. The input control appears on the Input Controls panel.
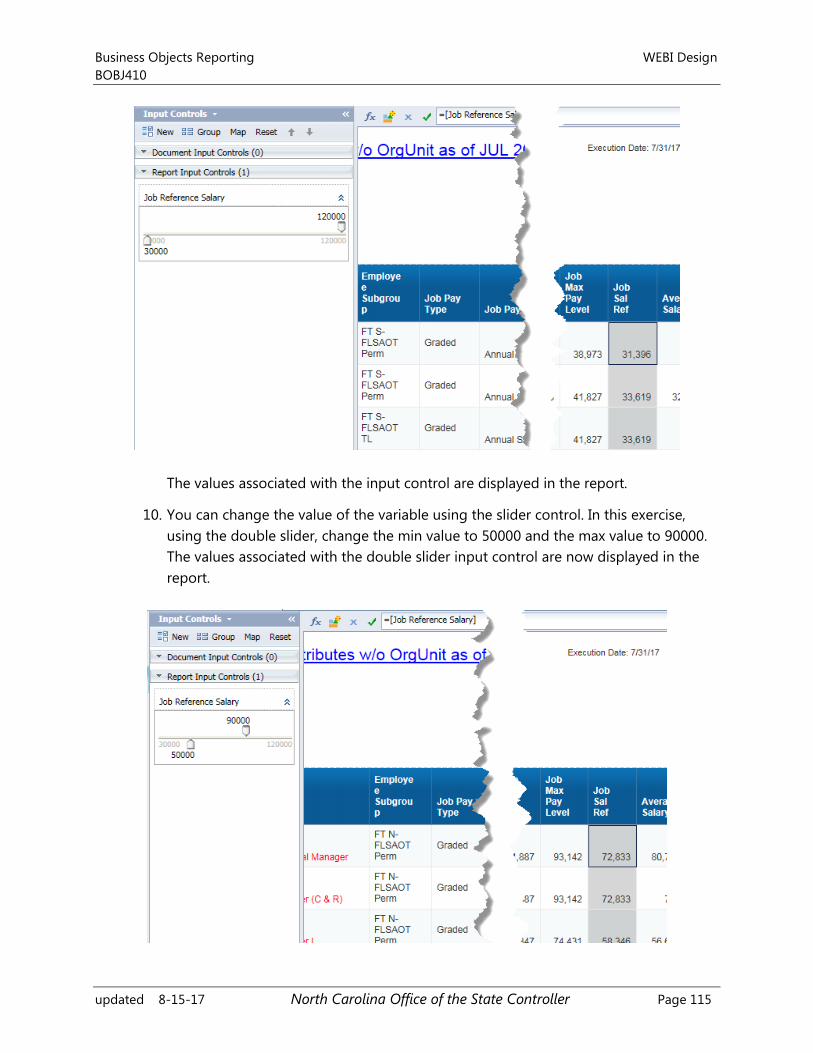
Business Objects Reporting WEBI Design
BOBJ410
updated 8-15-17 North Carolina Office of the State Controller Page 115
The values associated with the input control are displayed in the report.
10. You can change the value of the variable using the slider control. In this exercise,
using the double slider, change the min value to 50000 and the max value to 90000.
The values associated with the double slider input control are now displayed in the
report.
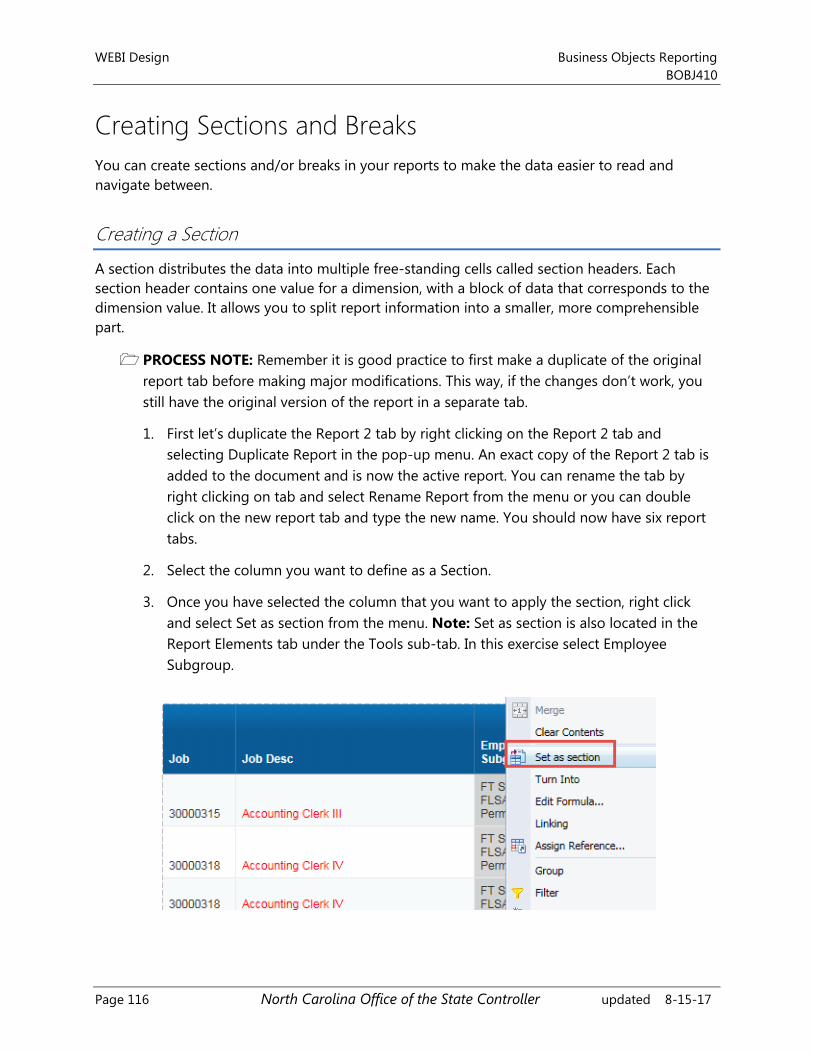
WEBI Design Business Objects Reporting
BOBJ410
Page 116 North Carolina Office of the State Controller updated 8-15-17
Creating Sections and Breaks
You can create sections and/or breaks in your reports to make the data easier to read and
navigate between.
Creating a Section
A section distributes the data into multiple free-standing cells called section headers. Each
section header contains one value for a dimension, with a block of data that corresponds to the
dimension value. It allows you to split report information into a smaller, more comprehensible
part.
PROCESS NOTE: Remember it is good practice to first make a duplicate of the original
report tab before making major modifications. This way, if the changes don’t work, you
still have the original version of the report in a separate tab.
1. First let’s duplicate the Report 2 tab by right clicking on the Report 2 tab and
selecting Duplicate Report in the pop-up menu. An exact copy of the Report 2 tab is
added to the document and is now the active report. You can rename the tab by
right clicking on tab and select Rename Report from the menu or you can double
click on the new report tab and type the new name. You should now have six report
tabs.
2. Select the column you want to define as a Section.
3. Once you have selected the column that you want to apply the section, right click
and select Set as section from the menu. Note: Set as section is also located in the
Report Elements tab under the Tools sub-tab. In this exercise select Employee
Subgroup.
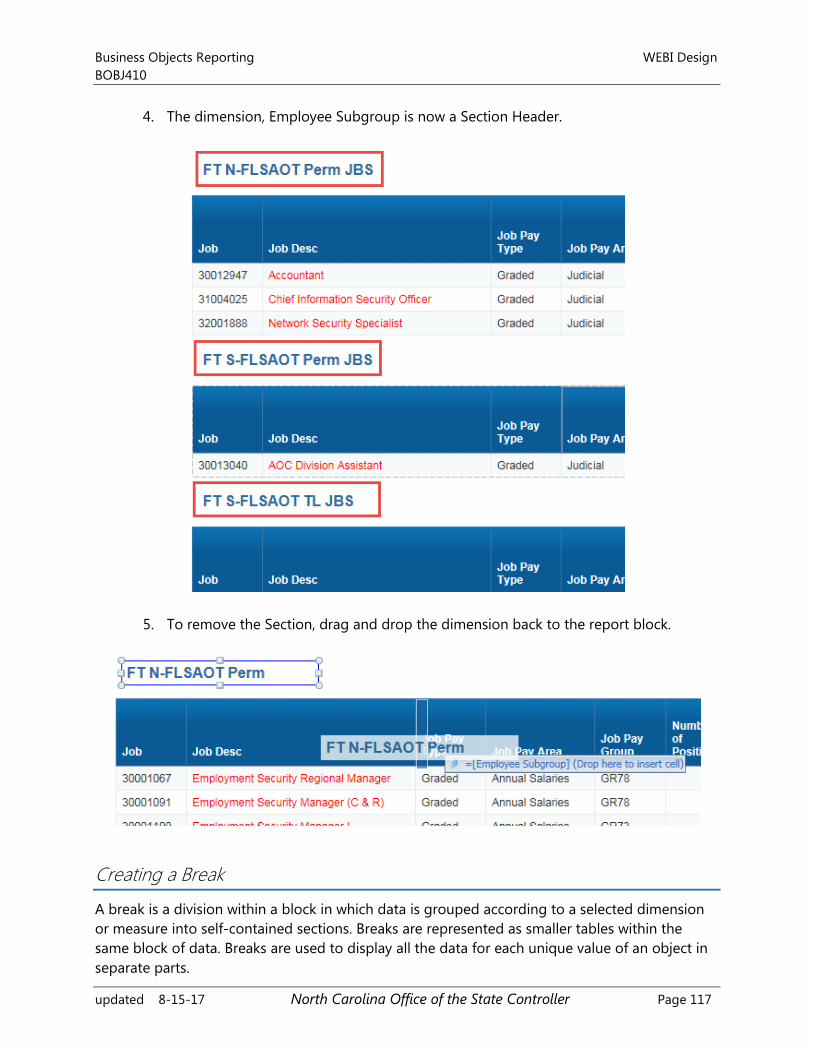
Business Objects Reporting WEBI Design
BOBJ410
updated 8-15-17 North Carolina Office of the State Controller Page 117
4. The dimension, Employee Subgroup is now a Section Header.
5. To remove the Section, drag and drop the dimension back to the report block.
Creating a Break
A break is a division within a block in which data is grouped according to a selected dimension
or measure into self-contained sections. Breaks are represented as smaller tables within the
same block of data. Breaks are used to display all the data for each unique value of an object in
separate parts.
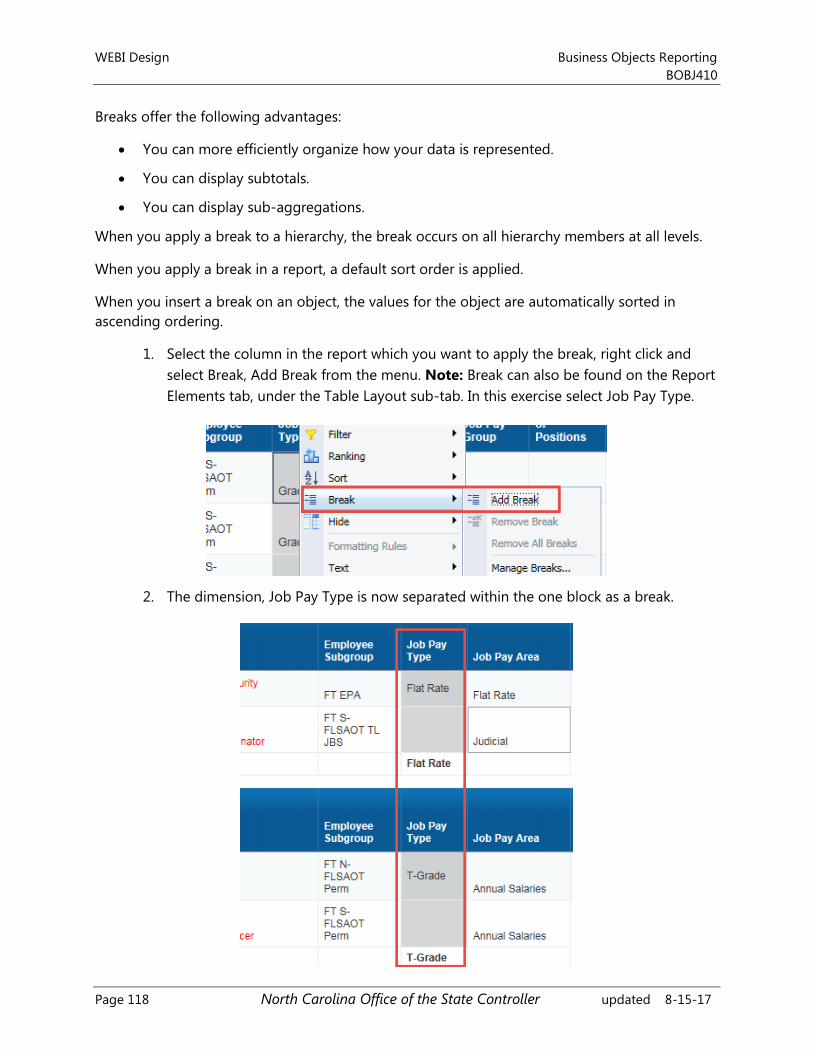
WEBI Design Business Objects Reporting
BOBJ410
Page 118 North Carolina Office of the State Controller updated 8-15-17
Breaks offer the following advantages:
You can more efficiently organize how your data is represented.
You can display subtotals.
You can display sub-aggregations.
When you apply a break to a hierarchy, the break occurs on all hierarchy members at all levels.
When you apply a break in a report, a default sort order is applied.
When you insert a break on an object, the values for the object are automatically sorted in
ascending ordering.
1. Select the column in the report which you want to apply the break, right click and
select Break, Add Break from the menu. Note: Break can also be found on the Report
Elements tab, under the Table Layout sub-tab. In this exercise select Job Pay Type.
2. The dimension, Job Pay Type is now separated within the one block as a break.
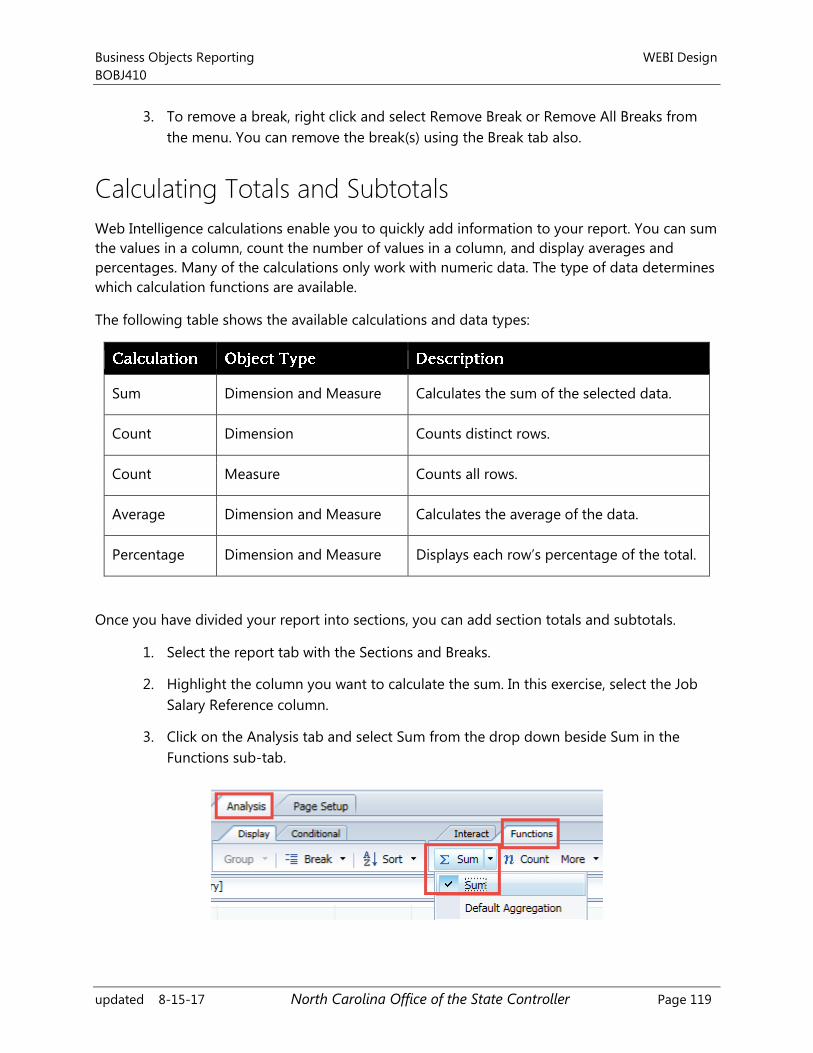
Business Objects Reporting WEBI Design
BOBJ410
updated 8-15-17 North Carolina Office of the State Controller Page 119
3. To remove a break, right click and select Remove Break or Remove All Breaks from
the menu. You can remove the break(s) using the Break tab also.
Calculating Totals and Subtotals
Web Intelligence calculations enable you to quickly add information to your report. You can sum
the values in a column, count the number of values in a column, and display averages and
percentages. Many of the calculations only work with numeric data. The type of data determines
which calculation functions are available.
The following table shows the available calculations and data types:
Sum Dimension and Measure Calculates the sum of the selected data.
Count Dimension Counts distinct rows.
Count Measure Counts all rows.
Average Dimension and Measure Calculates the average of the data.
Percentage Dimension and Measure Displays each row’s percentage of the total.
Once you have divided your report into sections, you can add section totals and subtotals.
1. Select the report tab with the Sections and Breaks.
2. Highlight the column you want to calculate the sum. In this exercise, select the Job
Salary Reference column.
3. Click on the Analysis tab and select Sum from the drop down beside Sum in the
Functions sub-tab.
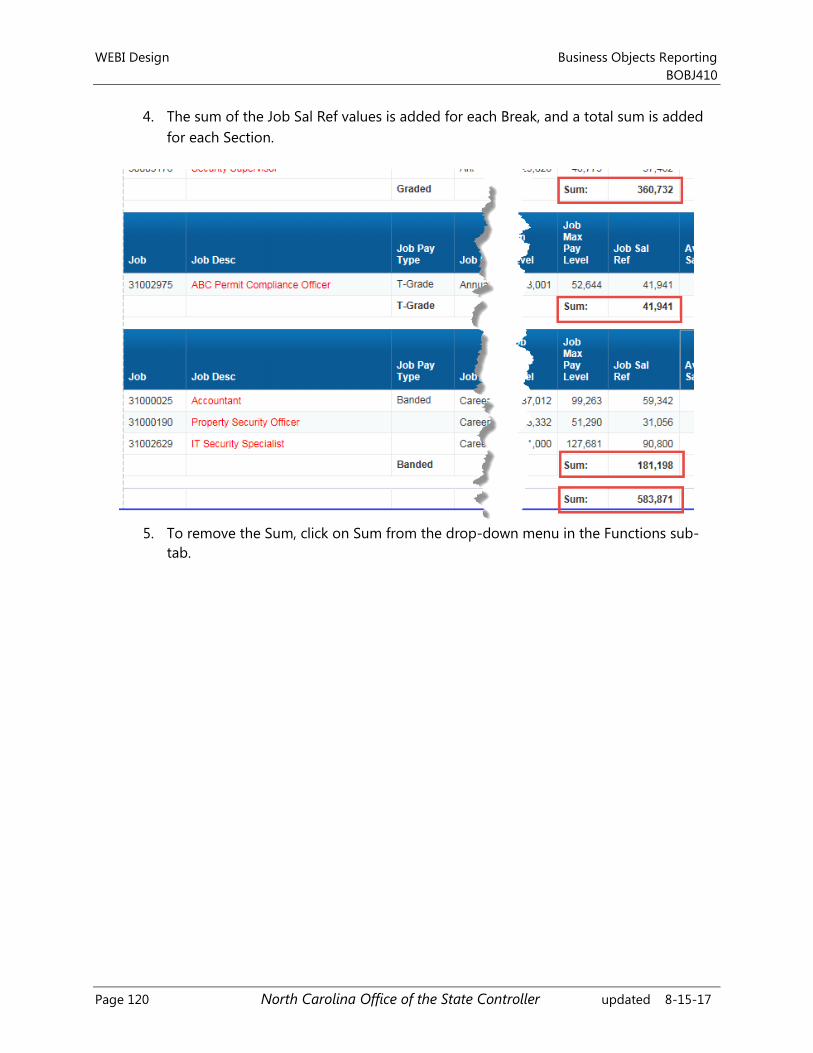
WEBI Design Business Objects Reporting
BOBJ410
Page 120 North Carolina Office of the State Controller updated 8-15-17
4. The sum of the Job Sal Ref values is added for each Break, and a total sum is added
for each Section.
5. To remove the Sum, click on Sum from the drop-down menu in the Functions sub-
tab.
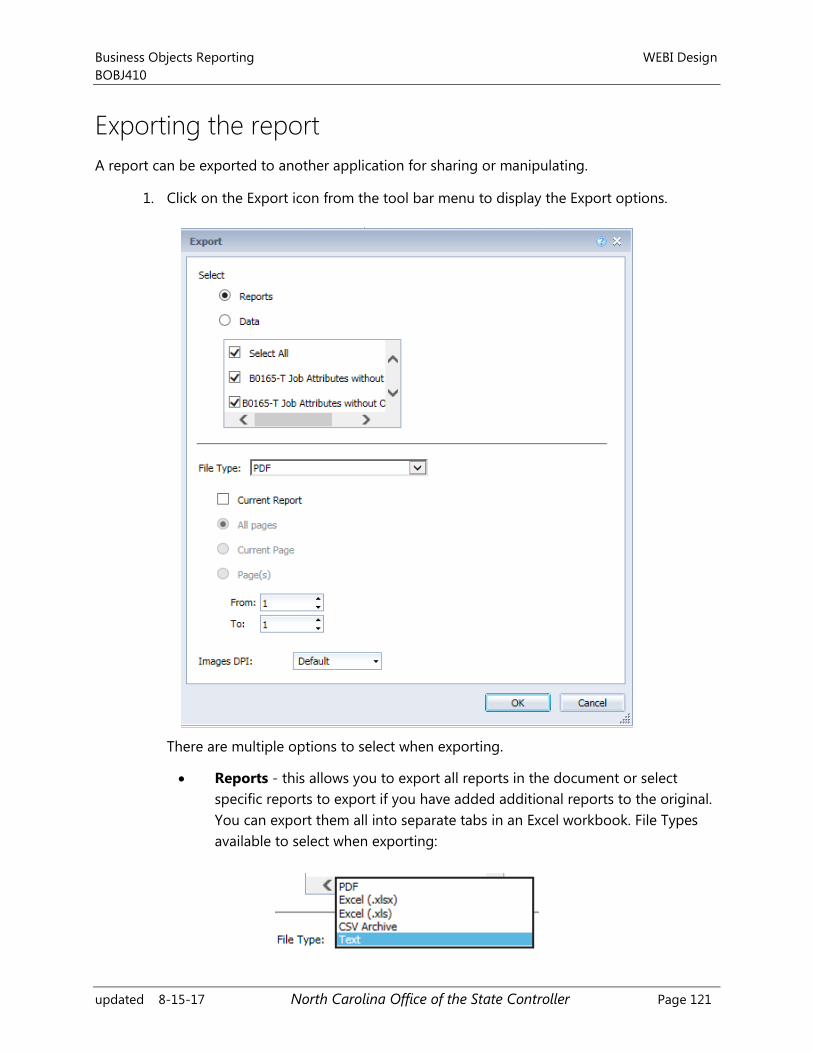
Business Objects Reporting WEBI Design
BOBJ410
updated 8-15-17 North Carolina Office of the State Controller Page 121
Exporting the report
A report can be exported to another application for sharing or manipulating.
1. Click on the Export icon from the tool bar menu to display the Export options.
There are multiple options to select when exporting.
Reports - this allows you to export all reports in the document or select
specific reports to export if you have added additional reports to the original.
You can export them all into separate tabs in an Excel workbook. File Types
available to select when exporting:
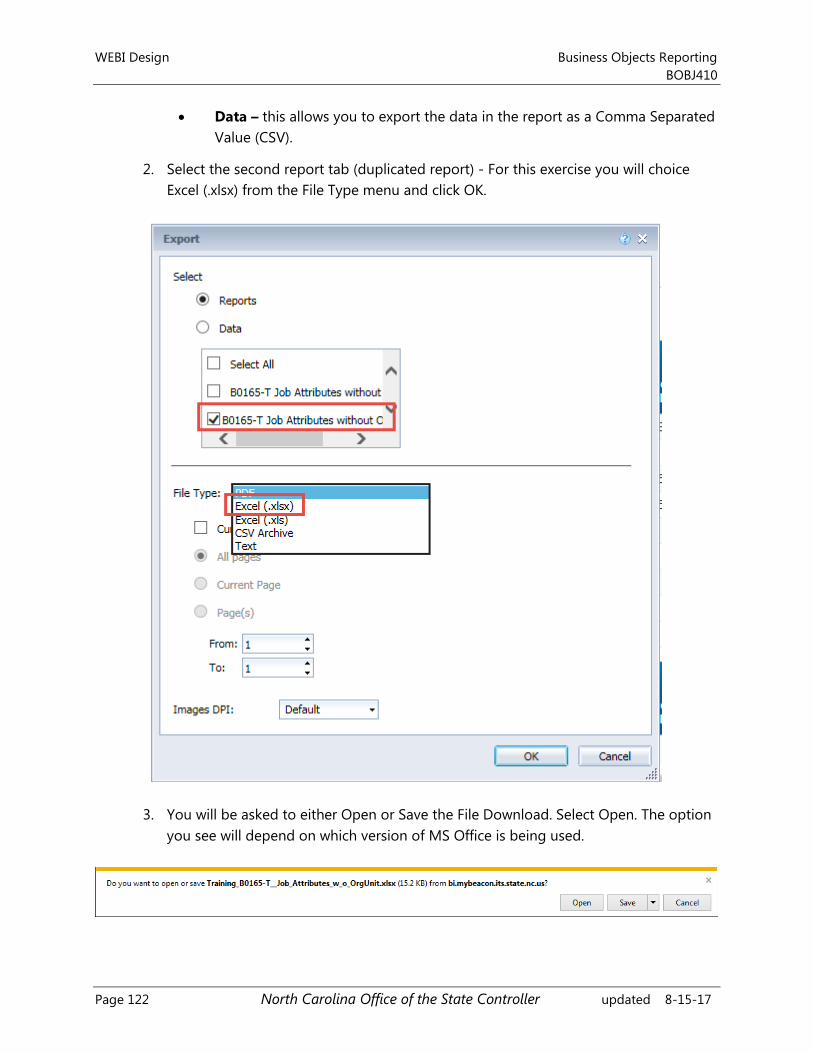
WEBI Design Business Objects Reporting
BOBJ410
Page 122 North Carolina Office of the State Controller updated 8-15-17
Data – this allows you to export the data in the report as a Comma Separated
Value (CSV).
2. Select the second report tab (duplicated report) - For this exercise you will choice
Excel (.xlsx) from the File Type menu and click OK.
3. You will be asked to either Open or Save the File Download. Select Open. The option
you see will depend on which version of MS Office is being used.
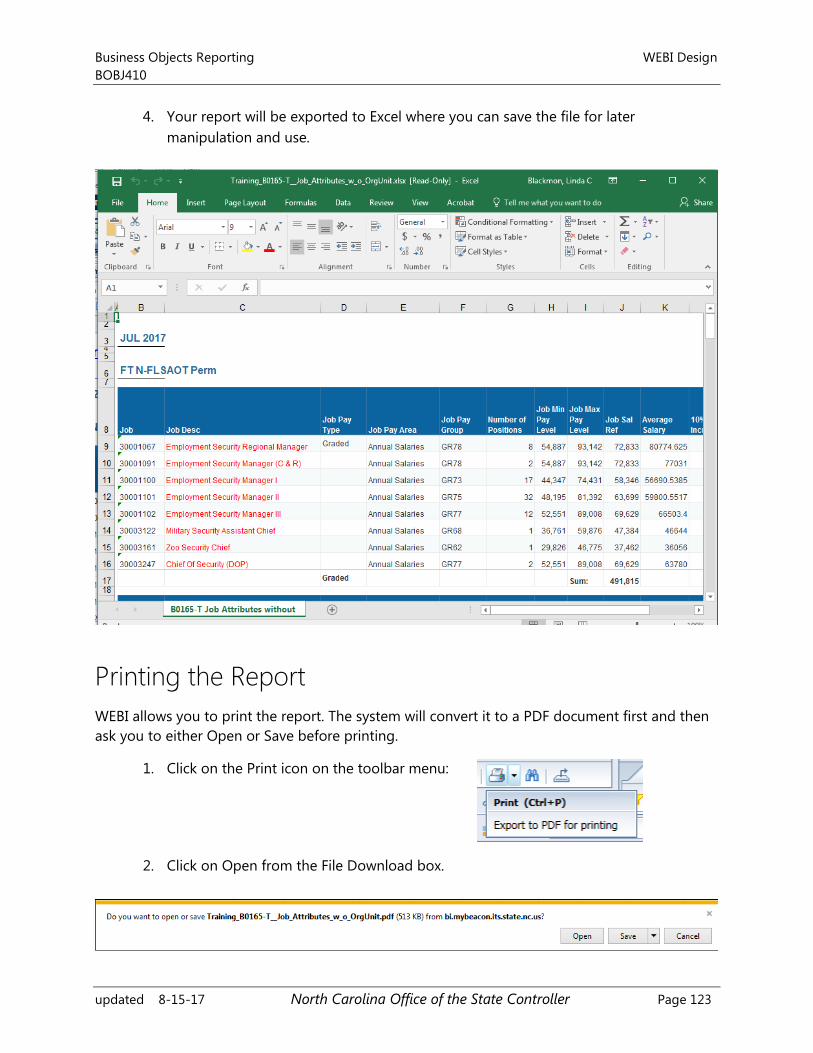
Business Objects Reporting WEBI Design
BOBJ410
updated 8-15-17 North Carolina Office of the State Controller Page 123
4. Your report will be exported to Excel where you can save the file for later
manipulation and use.
Printing the Report
WEBI allows you to print the report. The system will convert it to a PDF document first and then
ask you to either Open or Save before printing.
1. Click on the Print icon on the toolbar menu:
2. Click on Open from the File Download box.
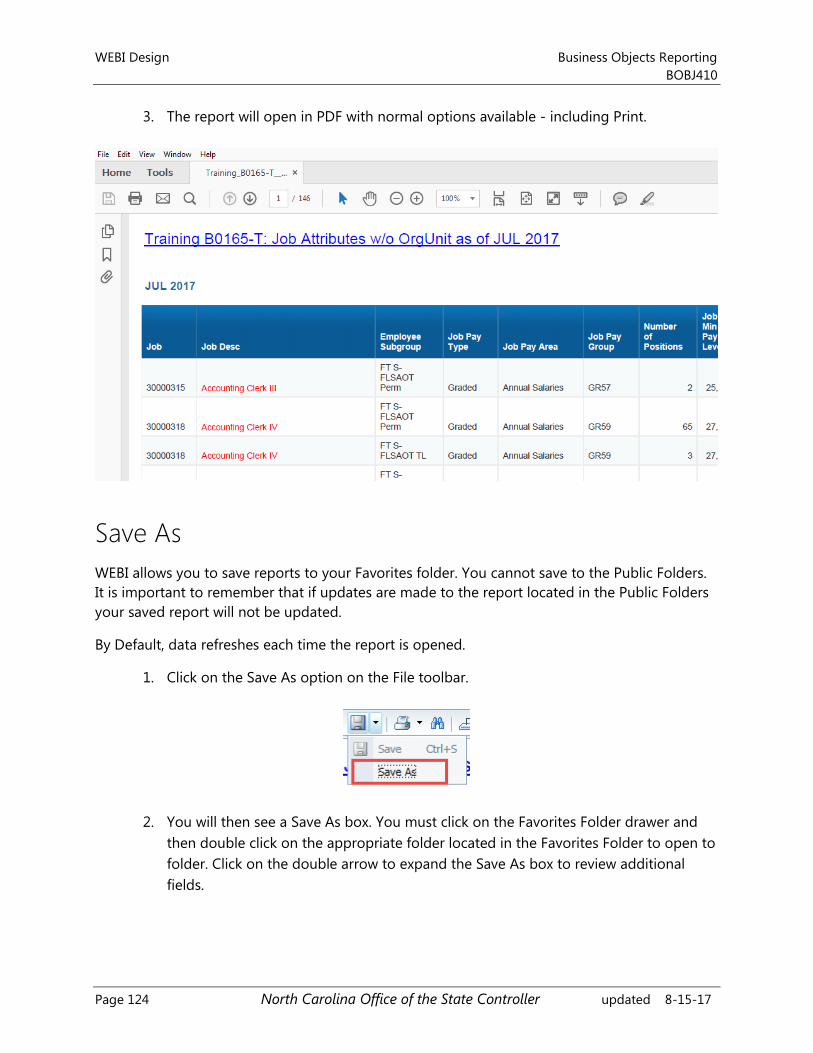
WEBI Design Business Objects Reporting
BOBJ410
Page 124 North Carolina Office of the State Controller updated 8-15-17
3. The report will open in PDF with normal options available - including Print.
Save As
WEBI allows you to save reports to your Favorites folder. You cannot save to the Public Folders.
It is important to remember that if updates are made to the report located in the Public Folders
your saved report will not be updated.
By Default, data refreshes each time the report is opened.
1. Click on the Save As option on the File toolbar.
2. You will then see a Save As box. You must click on the Favorites Folder drawer and
then double click on the appropriate folder located in the Favorites Folder to open to
folder. Click on the double arrow to expand the Save As box to review additional
fields.
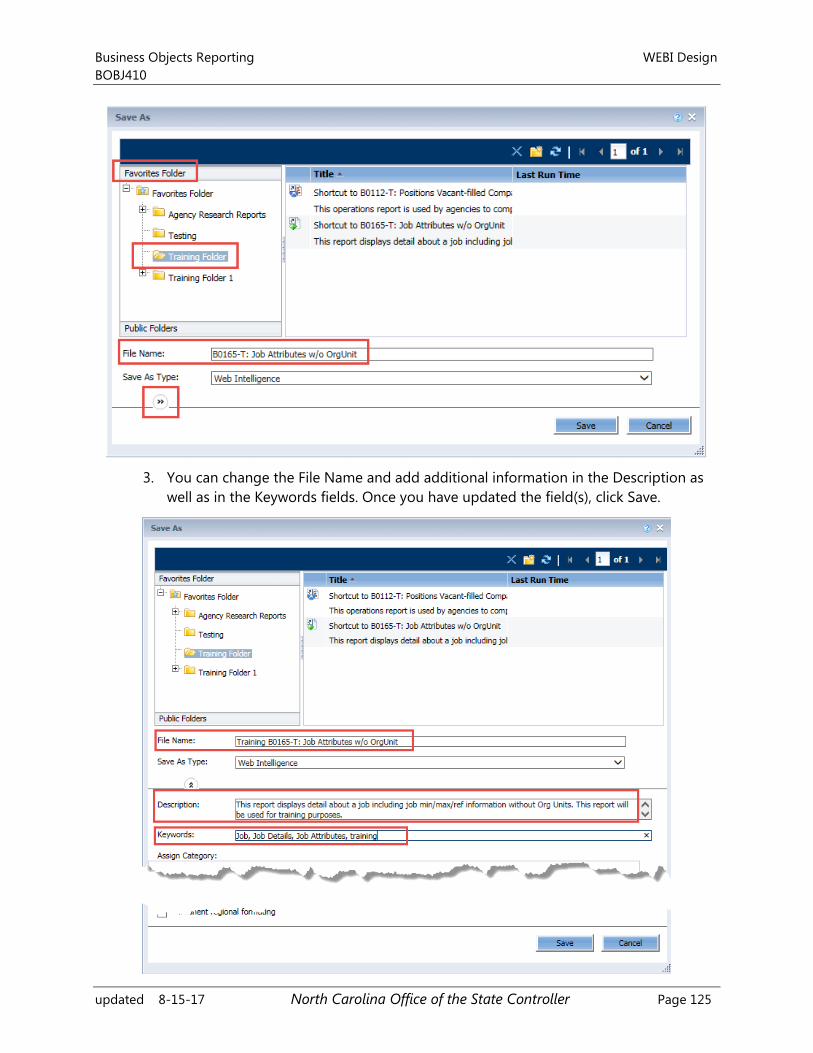
Business Objects Reporting WEBI Design
BOBJ410
updated 8-15-17 North Carolina Office of the State Controller Page 125
3. You can change the File Name and add additional information in the Description as
well as in the Keywords fields. Once you have updated the field(s), click Save.
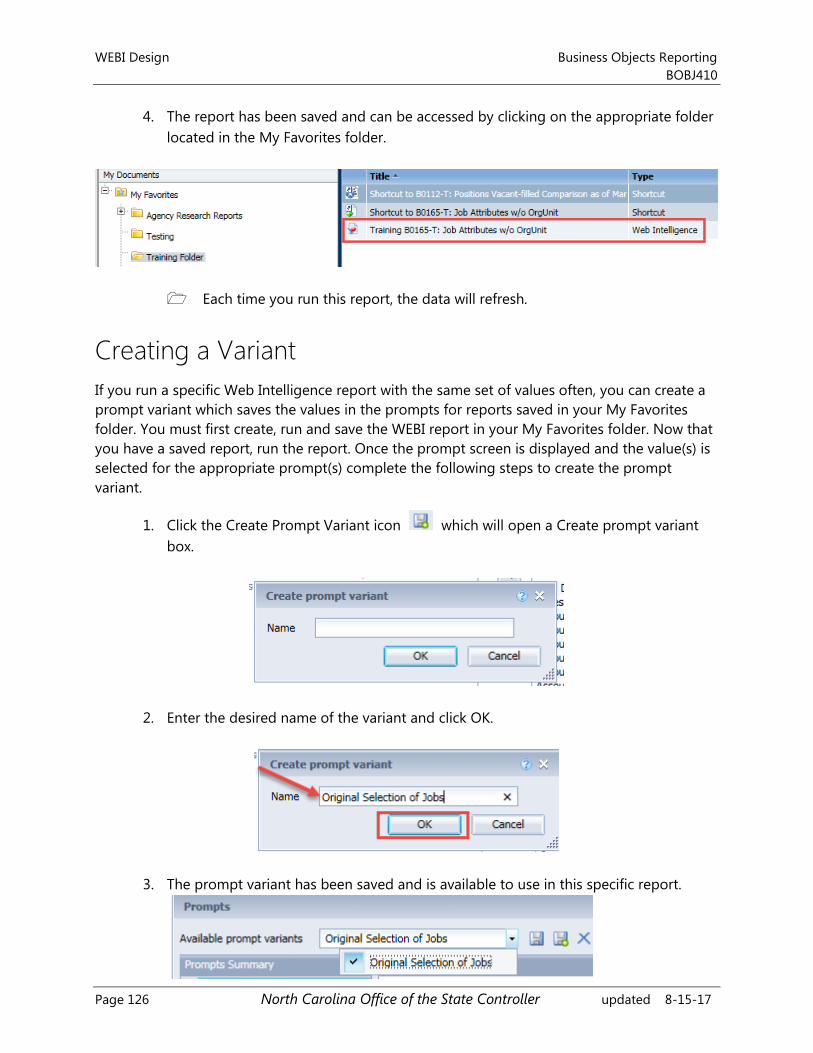
WEBI Design Business Objects Reporting
BOBJ410
Page 126 North Carolina Office of the State Controller updated 8-15-17
4. The report has been saved and can be accessed by clicking on the appropriate folder
located in the My Favorites folder.
Each time you run this report, the data will refresh.
Creating a Variant
If you run a specific Web Intelligence report with the same set of values often, you can create a
prompt variant which saves the values in the prompts for reports saved in your My Favorites
folder. You must first create, run and save the WEBI report in your My Favorites folder. Now that
you have a saved report, run the report. Once the prompt screen is displayed and the value(s) is
selected for the appropriate prompt(s) complete the following steps to create the prompt
variant.
1. Click the Create Prompt Variant icon which will open a Create prompt variant
box.
2. Enter the desired name of the variant and click OK.
3. The prompt variant has been saved and is available to use in this specific report.
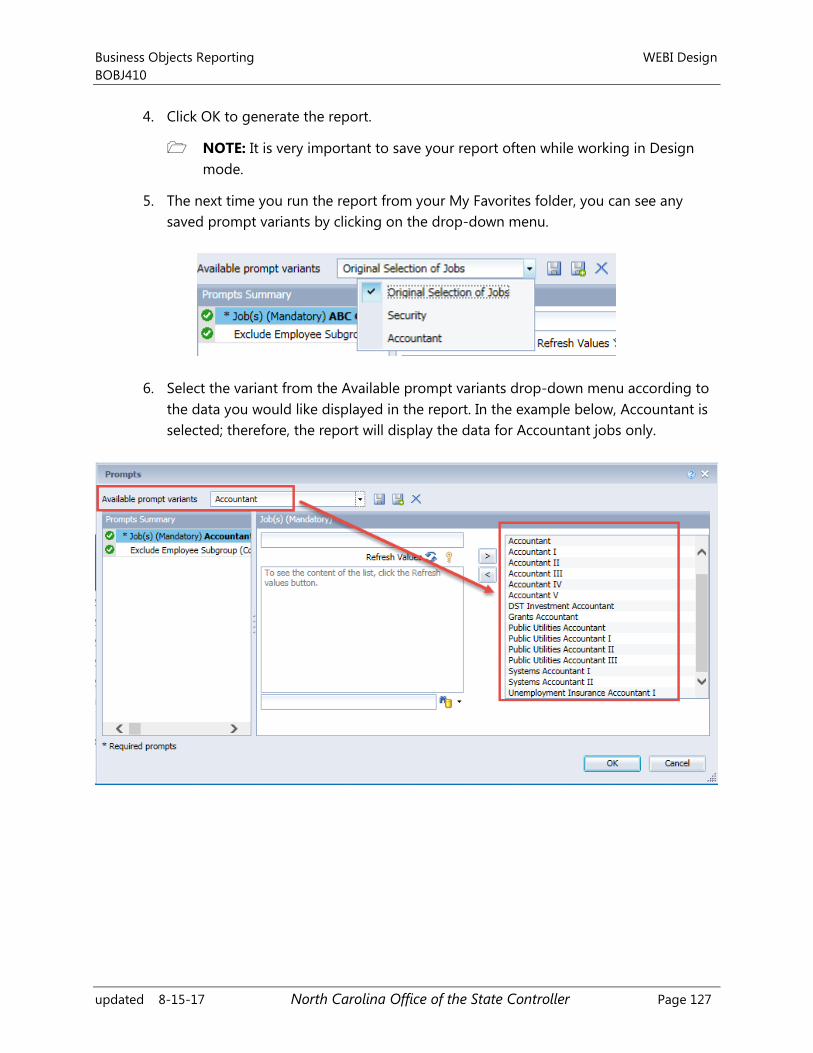
Business Objects Reporting WEBI Design
BOBJ410
updated 8-15-17 North Carolina Office of the State Controller Page 127
4. Click OK to generate the report.
NOTE: It is very important to save your report often while working in Design
mode.
5. The next time you run the report from your My Favorites folder, you can see any
saved prompt variants by clicking on the drop-down menu.
6. Select the variant from the Available prompt variants drop-down menu according to
the data you would like displayed in the report. In the example below, Accountant is
selected; therefore, the report will display the data for Accountant jobs only.
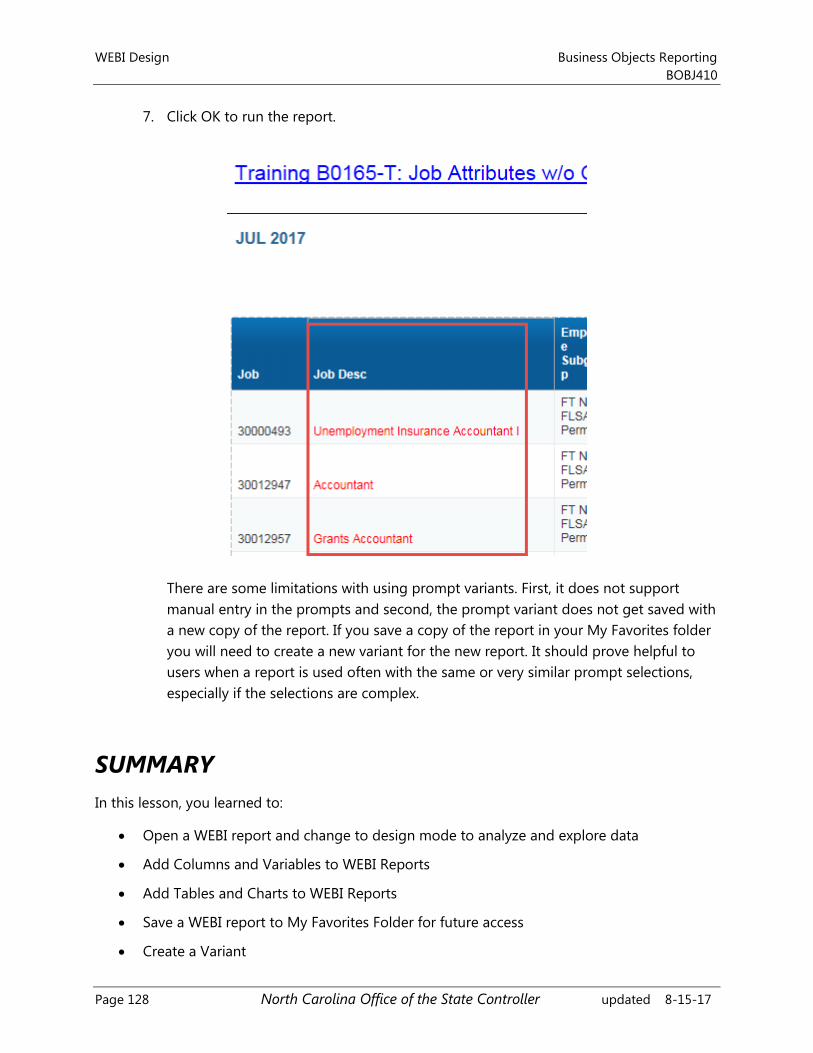
WEBI Design Business Objects Reporting
BOBJ410
Page 128 North Carolina Office of the State Controller updated 8-15-17
7. Click OK to run the report.
There are some limitations with using prompt variants. First, it does not support
manual entry in the prompts and second, the prompt variant does not get saved with
a new copy of the report. If you save a copy of the report in your My Favorites folder
you will need to create a new variant for the new report. It should prove helpful to
users when a report is used often with the same or very similar prompt selections,
especially if the selections are complex.
SUMMARY
In this lesson, you learned to:
Open a WEBI report and change to design mode to analyze and explore data
Add Columns and Variables to WEBI Reports
Add Tables and Charts to WEBI Reports
Save a WEBI report to My Favorites Folder for future access
Create a Variant
Business Objects Reporting Course Review
BOBJ410
updated 8-15-17 North Carolina Office of the State Controller Page 129
Objectives
Understand the definition of Business Objects
Understand the definition of Launch Pad and the components
Understand the definition and view of Dashboard Reports
Understand the definition and view of Crystal Reports
Understand the definition of Web Intelligence Reports
Open a WEBI report and change to design mode to analyze and explore data
Add columns and Variables to WEBI Reports
Add Tables and Charts to WEBI Reports
Save a WEBI report to My Favorites Folder for future access
Create a Variant
Next Steps
Monitor the Integrated HR/Payroll System communication
BEST Shared Services web site (especially BOBJ System Status Log)
URL: https://www.osc.nc.gov/state-employees/BEST
Access the Training HELP site
URL: https://www.osc.nc.gov/state-agency-resources/training/training_help_documents
Keep your training materials close by as a ready reference.
Course Review Business Objects Reporting
BOBJ410
Page 130 North Carolina Office of the State Controller updated 8-15-17
Need transactional assistance?
Remember to access the Training HELP website when you need assistance in completing
transactions. As stated above, the work instructions can be accessed on line through the web
link in the steps above.
Course Assessment/Evaluation
Follow the instructions given by your instructor to complete your competency assessment and
your evaluation of today’s class in the Learning Management System (LMS).
CONGRATULATIONS!
You’ve completed the course!