Embed Size (px)
Citation preview
UPDATED 14 JUN 12
3-1
3.0 GEOTECHNICAL
3.1 DESIGN PROCEDURE FOR EARTHEN EMBANKMENTS The following represents the typical procedure for the geotechnical design and analysis of levee embankments. The procedures stated herein, although considered typical, are in no way implied to eliminate engineering judgment. Factors of safety (FOS) included in this chapter are based on the EM listed below. FOS have been reviewed by an external team, and been approved by USACE Headquarters. 3.1.1 Sampling of References Links to electronic versions of USACE and other documents are listed in Appendix B, if available. Publications:
• American Society of Testing and Materials (ASTM) 1586, Standard Penetration Test and Split-Barrel Sampling of Soils.
• ASTM 1587, Thin Walled Tube Geotechnical Sampling of Soils. • ASTM D 2487, Unified Soil Classification System • DIVR 1110-1-400, Soil Mechanic Data, December 1998 • EM 1110-1-1804, Geotechnical Investigations, January 2001 • EM 1110-1-1904, Settlement Analysis, September 1990 • EM 1110-2-1913, Design & Construction of Levees, April 2000 • EM 1110-2-1901, Seepage Analysis and Control for Dams, April 1993 • EM 1110-2-1902 Slope Stability, October 2003 • Engineer Technical Letter (ETL) 1110-2-569, Design Guidance for Levee
Underseepage, May 2005 • Engineer Technical Letter (ETL) 1110-2-575, Evaluation of I-Walls, September
2011 • TM-3-424, Investigation of Underseepage and Its Control, October 1956
Computer Software:
• Slope Stability Program based on “MVD Method of Planes” (Method of Plane Program, 3 October 2006) and the plotting program is available by contacting New Orleans District.
• Slope Stability Programs based on “Spencer’s Procedure” • Sheet Pile Wall Design/Analysis Program (CWALSHT)
Note: While there are references in this document to specific, proprietary computer programs, these are included only as representative of the function and quality of

UPDATED 14 JUN 12
3-2
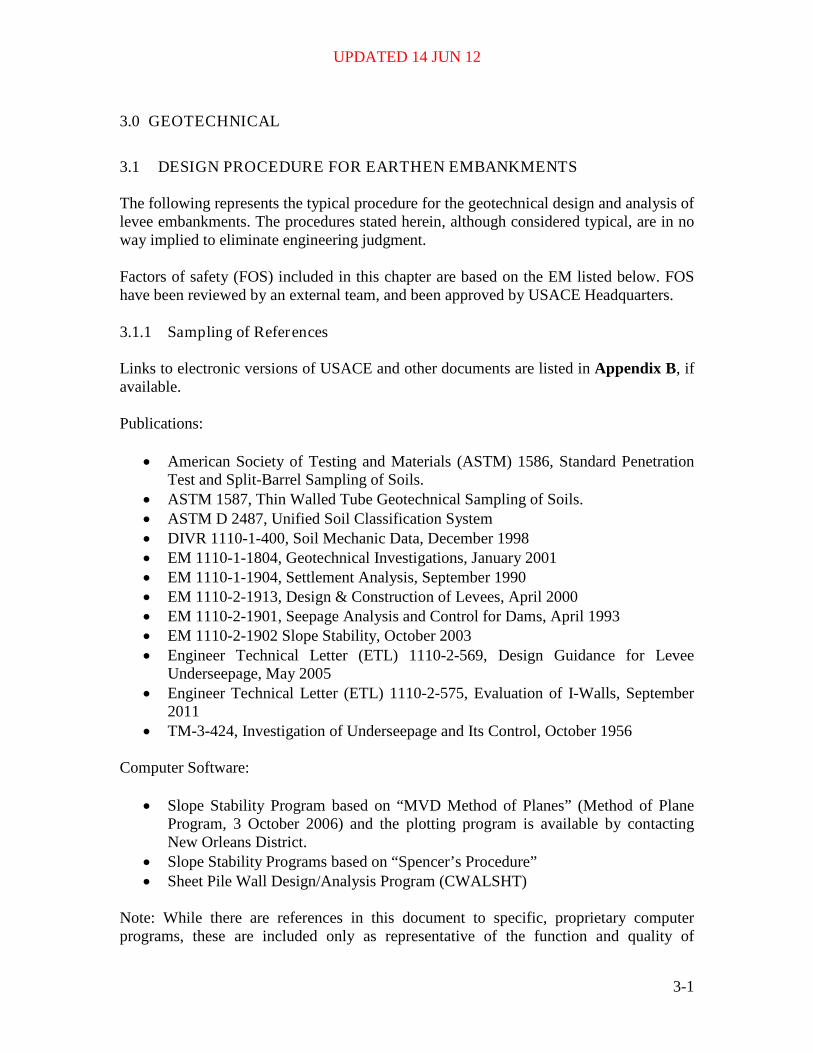
calculations. Other programs which can perform like analyses and provide output in similar format are acceptable. The designer shall provide detailed proof that programs selected for design or analysis are producing accurate analyses utilizing approved methodologies described herein. Programs proposed for use other than the Slope Stability Programs based on MVD Method of Planes or Spencer's Procedure will require written approval from the Chief, Engineering Division, New Orleans District. The designer is required to submit a written request to obtain approval. Supporting documentation that demonstrates the incorporation of approved methodologies described herein shall be included. Field Investigations: Prior to any field investigation, a thorough review of available geologic data should be conducted for the project area. This includes geologic maps, aerial photographs, satellite images, geomorphic maps, soils maps, topographic maps, existing borings, seismic data, etc., (refer to EM 1110-1-1804). This information combined with the site-specific data needs form the basis for the field investigation program. The number and depths of borings and Cone Penetration Tests (CPT) required providing adequate coverage cannot be arbitrarily predetermined but should be sufficient to fully characterize the geotechnical conditions. For levee design, centerline (C/L) and toe borings should be taken at a maximum of every 500 ft off center (OC), with borings alternating between 5 inch continuous Shelby tube borings (undisturbed) and 3 inch Shelby tube borings (general type) or CPT (Figure 3.1). Vane shear tests may also be incorporated into the subsurface investigation process at the discretion of the geotechnical engineer or geologist. The basis for the 5 inch diameter Shelby tube samples requirement is derived from an MVN study conducted within the last 10 years and successful utilization of these borings in levee designs over the past several decades. Laboratory tests from 5 inch borings taken in soft, normally consolidated soils consistently resulted in higher shear strengths than those achieved from 3 inch diameter samples. This is due to the fact that larger sample sizes will experience fewer disturbances during the sampling and extrusion processes. In addition, 5 inch samples allow for four triaxial shear tests at the same elevation, providing the geotechnical engineer with valuable information not possible with 3 inch samples. Borrow borings are typically taken at a maximum of 500 ft OC (Figure 3.1). The project engineer and geologist should consult and agree on the final boring program.
UPDATED 14 JUN 12
3-3
5 inch Undisturbed Boring 3 inch Boring or CPT
Levee Centerline
Flood Side Toe
Protected Side Toe
500 ft
500 ft 500 ft
Figure 3.1 Bor ing Spacing
3.1.1.1 Strength Lines The guidance outlined herein assumes test results are from 5 inch diameter undisturbed samples and supplemented with general-type (3 inch) borings or CPT. Unconsolidated-undrained triaxial (Q) tests are the predominant tests on undisturbed samples and are supplemented by unconfined compression tests (UCT). Plots of undrained strength vs. depth for CPT shall be based on an Nc value obtained by calibrating to nearby undisturbed borings. An Nc value of 20 is commonly used in southeast Louisiana soils. Strength lines should be drawn such that approximately one-third to one-half of the test data (both lab test data and CPT data) falls below the strength line. Strength lines should be drawn such that approximately one-third to one-half of the tests fall below the strengthline. If the designer does not have adequate confidence in the laboratory test data or if there is unwanted scatter in the data, he/she may choose to draw a more conservative strength line where one third of the tests fall below the strengthline. Outliers and scatter in the data can be the result of several possibilities, such as laboratory test errors, foreign material in the sample like roots or shells, and actual variance in the foundation soil properties. It is the responsibility of the designer to consider all possibilities for anomalies in the data and make appropriate design decisions. A line indicating the ratio of cohesion to effective overburden pressure (c/p) should be superimposed on the plot. Typical c/p values historically observed in southeast Louisiana are in the range of 0.22 to 0.24 (depending on local experience) but could be as much as 0.28. The c/p line may be used to assist in determining the trend of the strength line in normally consolidated clays. When an existing embankment is present, a plot of C/L strengths under the existing embankment and separate plots under natural ground to be used for toe strengths (protected side and flood side) should be developed.

UPDATED 14 JUN 12
3-4
3.1.1.2 Slope Stability Design Cr iter ia The methods of analysis for slope stability shall be both the Spencer Method and Method of Planes (MOP) using the FOS outlined in Table 3.1, with the design section satisfying the minimum FOS for all analysis conditions of both methods. Criteria in Table 3.1 are based on criteria presented in EM 1110-2-1902, for new embankment dams adapted for southeast Louisiana HSDRRS. In accordance with EM 1110-2-1902 acceptable FOS for existing structures may be less than for new dams, as referenced in paragraph 3-3. Existing Embankment Dams, only when the existing structures have performed satisfactorily under the design or higher load condition. Given the unique soil conditions of southern Louisiana, the potential complexity of the levee and floodwall features, and the required intricacy of the slope stability software programs now being implemented, designers must take extreme care when utilizing software programs for these geotechnical designs. Engineers must spend appropriate time and effort in verifying that software program input correctly models the problems to be solved and that the resulting output provides a reasonable design with the most critical failure surfaces (i.e. when using SLOPEW program, critical failures surfaces and FOS shall be analyzed both with and without utilizing the optimization option).
UPDATED 14 JUN 12
3-5
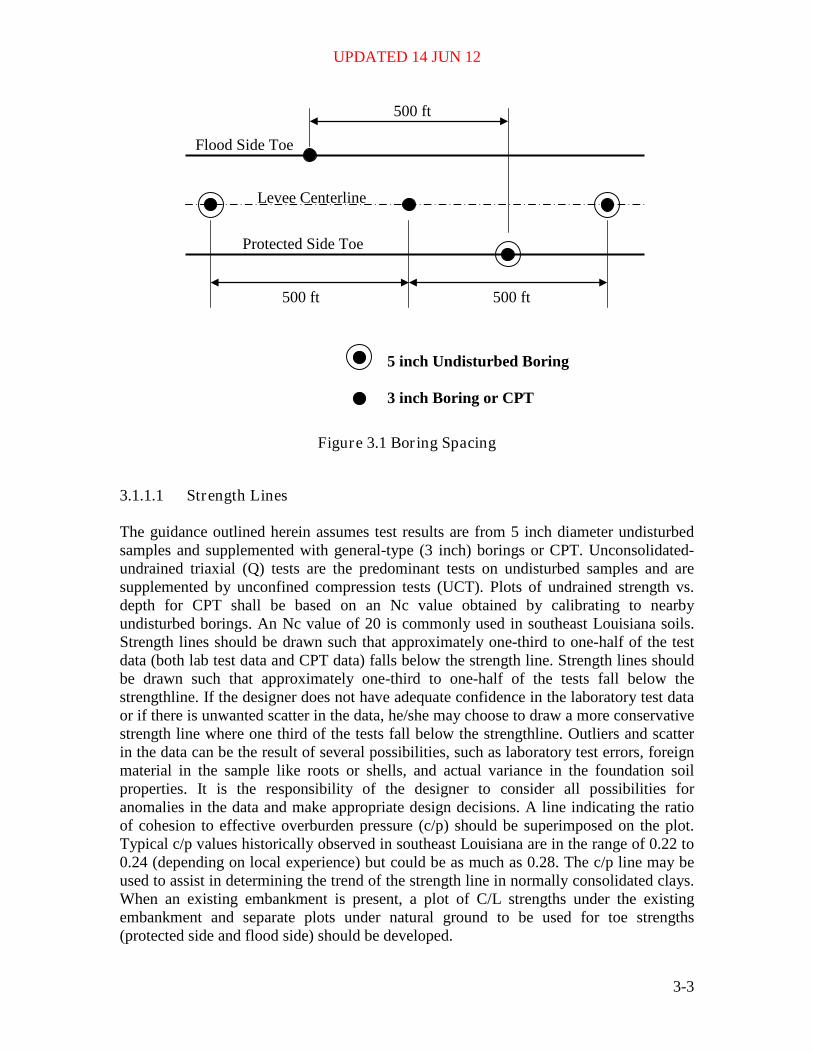
Table 3.1 Slope Stability Design Factors of Safety
Analysis Condition
Required Minimum Factor of Safety
Spencer Method1
Method of Planes2
End of Construction3 1.3 1.3
Design Hurricane4 (SWL) 1.5 1.3
Design Hurricane (SWL) w/ dry PS borrow pit10 1.3 1.3
Water at Project Grade (levees)5 1.4 (1.5)6 1.2
Water at Construction Grade (levees)5 1.2 N/A
Extreme Hurricane (water @ top of I-walls)5 1.4 (1.5)6 1.3
Extreme Hurricane (water @ top of T-walls)5a 1.4 (1.5)6 1.2
Low Water (hurricane condition)7 1.4 1.3
Low Water (non-hurricane condition)8 S-case 1.4 1.3
Water at Project Grade Utility Crossing9 1.5 (1.4) 1.3 (1.2) Notes:
1. Spencer method shall be used for circular and non-circular failure surfaces since it satisfies all conditions of static equilibrium and because its numerical stability is well suited for computer application. These FOS are based on well defined conditions where: (a) available records of construction, operation, and maintenance indicate the structure has met all performance objectives for the load conditions experienced; (b) the level of detail for investigations follow EM 1110-1-1804, Chapter 2, for the PED phase of design; and (c) the governing load conditions are established with a high level of confidence. Poorly defined conditions are not an option, and the Independent Technical Review (ITR) must validate that the defined conditions meet the requirements in this footnote.
2. MOP shall be used as a design check for verification that levee and floodwall designs satisfy historic district requirements. Analysis shall include a full search for the critical failure surface per stratum since it may vary from that found following the Spencer method.
3. Given the non-critical nature of the End of Construction case (i.e. no water loads, as with all other load cases), analysis of this load case is not required.
4. Applies to analyses failing toward the protected side for the SWL condition (100-year return period, 90% assurance, is authorized as the current design hurricane loading condition). Stability is analyzed for the as-constructed section with water a SWL using drained strengths
UPDATED 14 JUN 12
3-6
expressed in terms of effective stresses for free-draining materials and undrained strengths expressed in terms of total stresses for materials that drain slowly. For water at SWL against T-walls, MOP analysis is required as a design check only. Refer to Section 3.4 for T-wall design criteria.
5. Applies to analyses failing toward protected side of the as-constructed levee or floodwall section for different water load cases under a short term hurricane condition. Stability for levee and floodwall systems are analyzed using drained strengths expressed in terms of effective stresses for soils classified as SM or SP and undrained strengths in terms of total stresses for soils classified as CH or CL. Engineering judgment should be used in selecting the appropriate stress analysis for soils classified as something other than CH, CL, SM, or SP.
a. For water at the top of as-constructed T-walls, MOP analysis is required as a design check only. Refer to Section 3.4 for T-wall design criteria.
6. The required FOS shall be increased from 1.4 to 1.5 when steady-state seepage conditions are expected to develop in the embankment or foundation. (The higher FOS only applies to the freely-draining sand stratums that can obtain the steady state condition).
7. Applies to flood side where low hurricane flood side water levels are quickly lowered. MOP analysis is required as a design check only for T-walls. See T-wall criteria later in this chapter for specific details. This analysis represents a short-term rapid drawdown situation that may occur when a hurricane passes so that winds are in a direction away from the levee. Criteria are from EM 1110-2-1902, Table 3.1, and note 5, considering potential erosion concerns. Stability is analyzed for the as-constructed levee section using drained strengths expressed in terms of effective stresses for free-drained strengths expressed in terms of effected stresses for free-draining materials and undrained strengths expressed in term of total stresses for materials that drain slowly.
8. Applies to flood side and protected side. MOP analysis is NOT required for T-wall designs. This analysis represents a long tern water level drawdown where steady state seepage conditions prevail. Stability is analyzed in terms of effective stresses (S-case analysis for normal loading conditions; non-hurricane loading.)
9. Applies to flood side and protected side for levees and I-walls for water at Project Grade. For the flood side analysis, low water elevation is low water produced by hurricane conditions. Stability is analyzed using drained strengths expressed in terms of effective stresses for free-draining materials and undrained strengths expressed in terms of total stresses for materials that drain slowly. The lower FOS (in parenthesis) may be used for levees that have received their final levee lift. The final levee lift is referred to the last required construction activity that ensures the levee will no longer settle below its 1% design grade.
10. The provided FOS for SWL with a dry protected side borrow pit assumes that the dry condition is temporary, such as during construction. If the dry
UPDATED 14 JUN 12
3-7
pit condition is long term / permanent, then the required FOS shall be 1.5 for Spencer’s Method.
3.1.1.3 Reserved 3.1.2 Levee Embankment Design A. Using C/L borings, toe borings, CPT, and applicable test results, determine stratification, shear strength, and unit weights of materials and separate alignment into soils and hydraulic reaches. Soil parameters and stratification to be used for design must be reviewed for approval by senior engineer. B. Using cross-sections of existing conditions, determine minimum composite sections for similar topography for each reach. Spacing for cross-sections with respect to levees is typically 200 to 300 feet. When designing structures the cross section spacing is 100 feet. C. Using consolidation test data, determine stratification for settlement purposes. Verify that the assumed gross section minus the total settlement is greater than or equal to the required net section or determine the number of subsequent lifts during project life to maintain grade higher than design grade. Also future subsidence and sea rise should be considered with information to be provided by a hydraulic engineer. Secondary consolidation does not need to be considered since this value will be negligible (typically 2% to 5% of the total estimated settlement). In addition, since T-walls are limited to 2 inches of settlement, secondary consolidation for those HSDRRS features will also be negligible. Settlement Analysis should be performed in accordance with EM 1110-1-1904. D. Using both the Spencer Method and the MOP (Stability with Uplift program which will be provided by the Government) and design undrained shear strengths; determine the FOS of the gross section. Compare FOS to established design criteria. If inadequate, design stability berms, reinforcing geotextile, soil improvements, or some other means to produce an adequate FOS with regard to the current design criteria. The designer should check the final design section determined by the MOP and the Spencer Method and present the FOS for both analyses. The minimum distance between the active wedge and passive wedge should be 0.7H, as shown in Figure 3.2, where H is the vertical distance of the intersection of the active wedge with the ground surface and its intersection with the failure surface. The 0.7H requirement will ensure that the MOP analysis will provide a kinematically feasible critical failure surface.

UPDATED 14 JUN 12
3-8
ACTIVE WEDGE
PASSIVE WEDGE 0.7 H
H
Figure 3.2 Minimum Distance Between Active and Passive Wedges (Embankments)
E. The typical soil properties given in Tables 3.2 and 3.3 should be utilized when modeling embankment fill (in lieu of test results) for new levee placement/construction. These values are based on decades of field test data for similar levee construction in Southeast Louisiana. Properties for compacted clay fill are based on results from 12 inch lift thicknesses and compacted moisture contents ranging from -3% to +5% of the optimum moisture content. Uncompacted fill properties are based on 3 ft lifts thicknesses. Soil properties for silts, sands, and riprap are based on the MVN’s experience and commonly determined values for these soil types from lab and field tests. While these values are highly recommended, the soil properties in Table 3.2 and Table 3.3 could be varied at the discretion of the designer if validated by site specific lab and field test data.
Table 3.2 Typical Values for Embankment Fill
Soil Type (CH or CL)
Unit Weight
(pcf) Cohesion
(psf)
Friction Angle
(degree) Compacted Clay
(90% Standard Proctor) 115 600 0
Uncompacted Clay (from dry borrow pit) 100 200 0
Notes: pcf = pounds per cubic foot psf = pounds for square foot
All sections of HSDRRS levees (central portion, wave berms and flood/protected side stability berms) shall be designed and constructed utilizing compacted clay.

UPDATED 14 JUN 12
3-9
Table 3.3 Typical Values for Silts, Sands, and Riprap
Soil Type Unit Weight
(pcf) Cohesion
(psf)
Friction Angle
(degree)
Silt 117 200 15
Silty Sand 122 0 30
Poorly graded sand 122 0 33
Riprap 132 0 40 Notes:
1. Weight of riprap may vary based on the filling of the riprap voids over time.
2. Undrained soil parameters for S-Case are: i. Silt Cohesion = 0 psf, phi = 28
ii. Clay Cohesion = 0 psf, phi = 23 3. Engineering judgment or laboratory test data (if available) should be used
in determining soil properties of clayey silts, clayey sands, and sandy silts if they exist in the foundation.
F. Reserved. G. At pipeline crossings, the allowable FOS shall be 1.5 for the gross section for a distance of 150 ft on either side of the C/L of the pipeline or an appropriate distance determined by engineering assessment. This analysis should be performed with flood side water at the SWL. 3.1.3 Seepage Analysis 3.1.3.1 Definitions Stage or Water Surface Elevation (WSE) – the height of water against a levee or floodwall. Water height is measured as the vertical distance above or below a local or national elevation datum. Design Water Surface Elevation (DWSE) – the stage or water level to be used in deterministic analyses such as the geotechnical, structural stability, and seepage analyses. For the HSDRRS, the DWSE is found from the AWSE and its associated uncertainty at the selected confidence limit, where uncertainty is represented by normal distribution, and the confidence limit is 90%:
AWSE = best fit for 50% confidence level DWSE = 90% confidence level
UPDATED 14 JUN 12
3-10
Project Grade – this represents the net grade of the levee or floodwall, and is sometimes referred to as top of protection, top of levee, or net levee grade. The project grade includes increases above the DWSE to account for wave action/runup, minus the overbuild that is provided for primary consolidation. 3.1.3.2 Design Assumptions and Considerations
1. The HSDRRS Seepage Design Criteria will be applied exclusively to the design of levees and floodwalls that protect areas where there would be very high consequences should the levees or floodwalls fail during a flood or hurricane event. Very high consequences entail losses of human life and/or major damage to exceptionally valuable property or critical facilities. The blanket theory mathematical analysis of Underseepage and Substratum Pressure are outlined in Appendix B of EM-1110-2-1913, Design and Construction of Levees, in conjunction with DIVR 1110-1-400 should be used. Illustrative figures can be found in these reference documents.
2. The HSDRRS Seepage Design Criteria will be used only where the uncertainty of
subsurface conditions and soil properties is “small.” To reduce the uncertainty of subsurface conditions to a “small” level, it is necessary to perform more than the minimum number of subsurface explorations. The minimum number of explorations is commonly described as a series of three explorations, boreholes, or soundings, performed approximately every 1,000 ft (~300 meters) – refer to ETL 1110-2-569. In addition to performing additional borings and/or soundings, the subsurface explorations should be coupled with data from geophysical testing or other supplemental investigations such as CPT designed to explore the variability in subsurface conditions. To reduce the uncertainty of soil properties to a “small” level, it is also necessary to perform laboratory tests to characterize soil unit weight properties. Further, post-construction monitoring of piezometric levels need to be performed, where feasible, in order to qualify for a “small” level of uncertainty.
3. The DWSE are associated with the 100-year flood/hurricane events. The fact that
the DWSE has a 90% confidence level results in a DWSE that is more conservative than has been used previously in many instances. In addition, the water surface elevations used for design of the HSDRRS are associated with surges and waves produced by hurricane loadings, and will be sustained at peak levels for durations of hours rather than days or weeks.
4. Due to the short time frames associated with hurricane events, the inability to
work in hurricane winds, and the general inaccessibility of much of the hurricane system during a hurricane, there will be no opportunity to conduct levee patrols or to flood-fight levee or floodwall distress to prevent failure.
5. To the extent possible, design criteria should reflect observed performance of
levees and floodwalls that have been subjected to severe storm loadings.
UPDATED 14 JUN 12
3-11
6. One of the lessons from Hurricane Katrina is the need to provide ductility to the design of the HSDRRS levees and floodwalls in order to avoid the brittle failures which occurred when the floodwalls were overtopped. To this end, it is understood that a developing design principle is that regardless of the level of protection being provided, there will always be the potential for a larger storm to create a stage or water level that would reach all the way to the top of the levee or floodwall, and to even overtop the levee or floodwall. Accordingly, levees and floodwalls should be designed to withstand water levels reaching the top of the levee with a least a small margin of safety (Tables 3.4 and 3.5).
3.1.3.3 Calculation of Underseepage Factors of Safety HSDRRS seepage berms, relief wells, or other seepage control measures shall be designed to meet the minimum FOS illustrated in Tables 3.4 and 3.5. The FOS for underseepage at the landside levee toe are computed as follows:
ow
tg h
zFS
××′
=γγ
, which is the same as e
crg i
iFS =
Where: FSg = apparent underseepage FOS γ' = weighted average effective (or buoyant) unit weight of soil = γsat -γw γw = unit weight of water (64.0 pcf) γsat = total, or saturated, unit weight of soil blanket zt = transformed landside blanket thickness ho = excess head (above hydrostatic) at toe determined from piezometric data or equations in EM 1110-2-1913, Appendix B ** icr = critical exit gradient = γ' / γw ie = exit gradient = ho / zt The excess hydrostatic head ho beneath the top stratum at the landside levee toe is related to the net head on the levee, the dimensions of the levee and foundation, permeability of the foundation, and the character of the top stratum both riverward and landward of the levee. The method to calculate ho is different for various underseepage flow and top substratum conditions. The EM 1110-2-1913, Appendix B, subsection B-5 includes methods for calculating ho for seven (7) different cases.

UPDATED 14 JUN 12
3-12
Table 3.4 Cr iter ia for Safety Against Erosion and Piping at Toe of Levee
Levee/Wall Application
Minimum Factor of Safety at Levee or Wall Toe1 for Still Water Level Shown
Design Water Surface Elevation2 Project Grade3
Riverine 1.6 1.3
Coastal 1.6 1.3 Notes:
1. Minimum FOS are based on steady state seepage conditions. Water surfaces in excess of Project Grade, particularly for hurricane loadings, are likely to be of such short duration that steady state conditions will not develop for this extreme condition. Safety is adequately addressed by the criteria for water surface at DWSE and Project Grade.
2. DWSE is the water level used in deterministic analyses, such as the geotechnical, structural stability, and seepage analyses.
3. Project Grade, sometimes referred to as “top of protection” or “net levee grade,” is higher than the DWSE to account for wave run-up, minus overbuild for primary consolidation.
4. Where FOS do not satisfy the criteria in Table 3.4, relief wells, seepage berms, cutoff walls, or other remediation measures shall be designed to satisfy the criteria shown in Table 3.4. If a seepage berm is used, the berm shall also satisfy the criteria for safety at the toe of the berm shown in Table 3.5.
5. FOS are the same for Riverine and Coastal conditions and would be the same for lake or other impounded bodies of water. Lake and other impounded bodies of water are considered Coastal conditions. Upper Plaquemines Parish Mississippi River levee and Lower St. Bernard Parish Mississippi River levee are considered riverine conditions.

UPDATED 14 JUN 12
3-13
Table 3.5 Cr iter ia of Safety Against Erosion and Piping at the Toes of Seepage
Berms for all River ine and Coastal Levees
Seepage Berm Width Divided by Height
of Levee6, 7
Minimum Factor of Safety at Toe of Berm2, 3 for Still Water Level Shown
Design Water Surface Elevation4 Project Grade5
48 1.5 1.2
8 1.3 1.1
12 1.1 1.0
16 or more 1.0 1.0 Notes: 1. Where a berm is designed to satisfy the criteria for safety at the toe of the
levee shown in Table 3.4, the FOS at the toe of the berm shall satisfy the criteria shown in Table 3.5. FOS for intermediate berm widths shall be interpolated between values shown.
2. Minimum FOS at the berm toe are based on steady state seepage conditions. Water surfaces in excess of Project Grade, particularly for hurricane loadings, are likely to be of such short duration that steady state conditions do not develop for this extreme condition. Safety is adequately addressed by the criteria for water surface at DWSE and Project Grade.
3. Minimum allowable FOS decrease with increasing berm width because damage at the toe of a wider berm poses a smaller threat to the integrity of the levee. With a wider berm, a longer time would be required for erosion to work back to the toe and threaten the integrity of the levee.
4. DWSE is the water level used in deterministic analyses, such as the geotechnical, structural stability, and seepage analyses.
5. Project Grade, sometimes referred to as “top of protection” or “net levee grade,” is higher than the DWSE to account for wave run-up, minus overbuild for primary consolidation.
6. Berm width is measured from levee toe to berm toe. 7. Levee height is defined as the difference in elevation between Project Grade
and the prevailing ground surface elevation in the vicinity of the landside levee toe.
Where seepage berms are required, the minimum berm width shall be four times the height of the levee.

UPDATED 14 JUN 12
3-14
3.2 I-WALL DESIGN CRITERIA This section applies to I-walls that serve as or impact hurricane flood protection. In addition to meeting the criteria laid out in these design guidelines, I-Wall sheet pile tip elevations must meet the requirements of ETL 1110-2-575. 3.2.1 General Design Guidelines Links to electronic versions of USACE and other documents are listed in Appendix B, if available. USACE Publications:
• DIVR 1110-1-400, Soil Mechanic Data, December 1998 • Engineer Technical Letter (ETL) 1110-2-575, Evaluation of I-Walls, September
2011 • EM 1110-2-1901, Seepage Analysis and Control for Dams, April 1993 • EM 1110-2-2502, Retaining and Flood Walls, September 1989 • EM 1110-2-2504, Design of Sheet Pile Walls, March 1994 • EM 1110-2-1913, Design and Construction of Levees, April 2000 • ETL 1110-2-569, Design Guidance for Levee Underseepage, May 2005
Computer Software:
• Sheet Pile Wall Design/Analysis Program (CWALSHT) • Slope Stability Program based on “MVD Method of Planes” (Method of Plane
Program and a plotting program is available by contacting New Orleans District.) • Slope Stability Programs based on “Spencer’s Procedure”
Walls shall be constructed using the latest datum from Permanent Benchmarks certified by National Geodetic Survey (NGS) - NAVD 88 (2004.65). The following is a summary of protection heights for various wall systems. Maximum heights refer to exposed height of the protected side of the wall. The basis for these values are lessons learned from I-wall performance (stability and observed deflections), post-Hurricane Katrina forensic investigations, and numerical modeling (including the final IPET report dated June 2009), I-wall field tests along London outfall canal in 2007, and E-99 sheet pile wall test in 1985.
• I-walls – 4 ft maximum height • T-walls – Typically 4 ft and greater in height • L-walls / Kicker Pile Walls – 8 ft maximum height
Seepage, global stability, heave, settlement, and any other pertinent geotechnical analysis shall be performed in order to ensure that the overall stability of the system is designed to meet all Corps criteria.

UPDATED 14 JUN 12
3-15
Geotechnical engineers shall minimize the height of the wall system by designing the largest earthen section that is practical and stable for each individual project. Floodwall protection systems are dedicated single purpose structures and will not be dependent on or connected to (non-Federal) structural or geotechnical features that affect their intended performance or stability. In an I-wall, the steel sheet piling is a pile acting to control seepage and provide support to the structure. I-walls (steel sheet piling) should not be capped until the foundation primary consolidation has occurred from the embankment loading and/or foundation settlement is negligible. The following criterion is based on experience associated with Hurricane Katrina where some I-walls performed well and others performed poorly. I-walls shall be limited to 4 ft maximum exposed height measured from the protected side. Where existing walls exceed this maximum, fill should be added on the protected side to minimize stick-up and differential fill across the wall should be limited to 2 ft unless additional analysis is performed. I-walls are acceptable as tie-ins from structures and T-walls to levee embankments. Geotechnical Design Guidance 3.2.1.1 Global Stability Analysis I-wall/ Embankment Slope Stability. The MOP and Spencer’s Method shall be used for slope stability analysis (see Table 3.1 for the required FOS). The system shall be designed for global stability utilizing the “Q” shear strengths for the following load cases; No Tension Crack, With Tension Crack. The computer program CWALSHT performs many of the classical design and analysis techniques for determining required depth of penetration and/or FOS and includes application of Rowe’s Moment Reduction for anchored walls. Seepage effects are included in a simplified manner in the program. The details of this program are described in the Instruction Report ITL-91-1 “User Guide: Computer Program for Design and Analysis of Sheet-Pile Walls by Classical Methods (CWALSHT) Including Rowe’s Moment Reduction:” (Dawkins, 1991), which is provided with the software. Additional information on the CWALSHT program can be found in the USACE EM 1110-2-2504 Design of Sheet Pile Walls. Methods for determining crack depths, particularly for penetrating thin layers of sand, were not well developed at this time. The crack depth is important for computation of seepage, global stability, uplift and piping, and pile tip penetration. For the present design, use the CWALSHT program to determine the tension crack depth by the fixed method utilizing a FOS of 1.0. Use the deeper/lower elevation from the two analyses. If the crack ends only a few feet (5 ft or less) above the tip, then assume crack extends to tip. If the computed CWALSHT crack depth is above the sheet pile tip, compare the hydro-static water pressure to the at-rest lateral earth pressure (γwhw vs. γshsKo; where γs is the saturated unit weight of soil) and assume the crack will propagate to a point of equivalence. The crack may be assumed to be deeper, as described in Section 3.2.1.3

UPDATED 14 JUN 12
3-16
Piping and Seepage Analysis, but shall be limited in depth to a point no deeper than the sheet pile tip. Also, because saturated granular soils will not sustain a crack, the designer must determine if the crack will propagate through a thin sand layer to an underlining clay stratum.
1. For global stability, full hydrostatic head shall be used to the depth of the crack at the face of the I-wall (flood side). Protected side piezometric conditions used for stability analysis shall be based on seepage evaluation as described in Section 3.2.1.3 Piping and Seepage Analysis below.
2. To model a tension crack that extends to the sheet pile tip, perform the following for global slope stability. For a full clay foundation, remove all soil above the tension crack tip on the flood side of the wall. Check failure mechanisms in the vicinity of the tip at locations above and below the sheet pile tip for failure surfaces that are the most critical. Failure surfaces with lower FOS may exist if weaker layers are present near the sheet pile tip.
3. These FOS have been reviewed by an external team and approved by USACE Headquarters. The basis for these values is Appendix C of EM 1110-2-1913, Design and Construction of Levees, April 2000, and ETL 1110-2-569, Design Guidance for Levee Underseepage, May 2005.
3.2.1.2 I-wall Sheet Piling Tip Penetration Wall Stability Use the CWALSHT program to determine the required tip by the fixed surface wedge method or Coulomb earth pressure coefficient method with FOS applied to both active and passive soil parameters. The deeper computed tip elevation shall be used for design. Wave loads are not required for slope stability analyses on I-Walls. This is unnecessary since I-Walls are limited to 4ft stickup and any impact from the wave forces will be bracketed with upper and lower bound analyses at SWL and Top of Wall. For T-Wall design, wave forces are directly transferred to the base slab and support piles; therefore, wave forces are not required in corresponding slope stability analyses. (FOS with Load Cases - (CWALSHT program determines depth of tension crack)
“Q” –Shear Strengths
a. Cantilever Wall i. FOS = 1.5: Water to SWL plus wave load shall be furnished by the
hydraulic engineer. b. Bulkhead Wall
i. For walls with fill differential of greater than 2 ft from one side of the wall to the other, a bulkhead analysis should be performed.
ii. FOS = 1.5: Low water for hurricane conditions, bulkhead analysis if applicable.

UPDATED 14 JUN 12
3-17
c. Design check. i. This is not typical hurricane design case but shall be checked to ensure a
bracket of load envelopes and critical loads are considered. ii. (Case 1) FOS = 1.3: Water to top of all plus no wave load.
“S” – shear strengths
a. FOS =1.5; Normal low water (not low water for hurricane conditions bulkhead
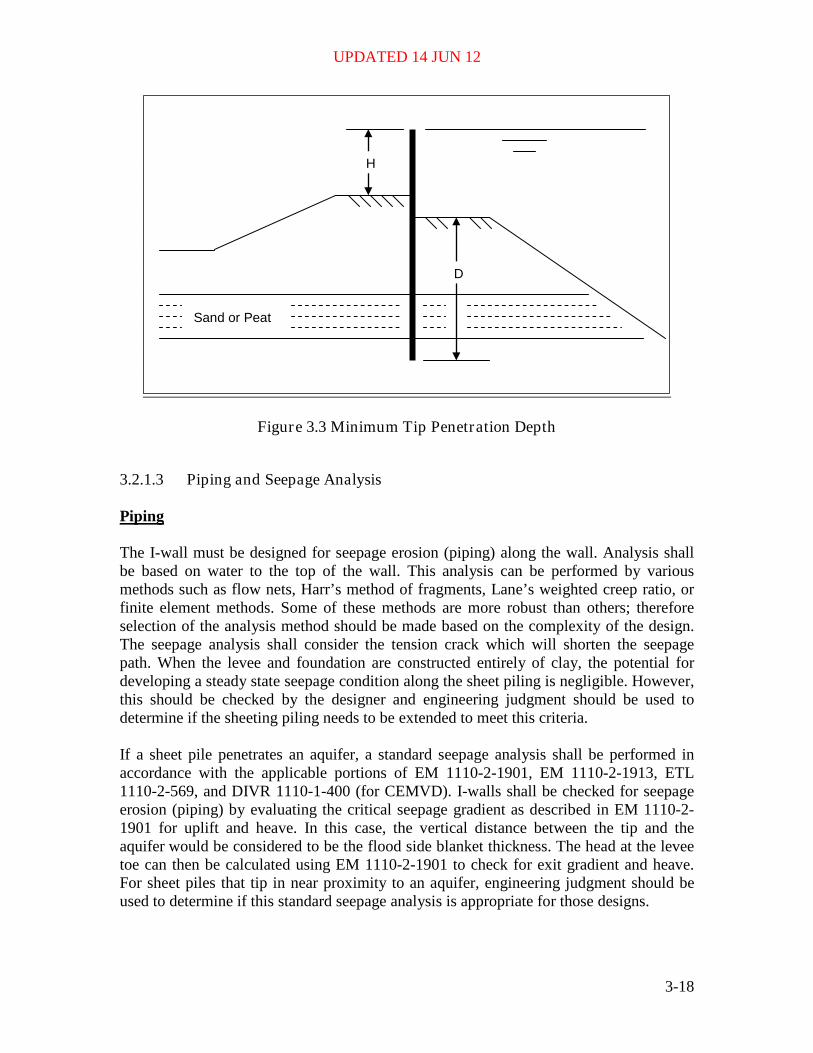
analysis) if applicable. Minimum Tip Penetration In some cases, especially Q-case penetrations derived for low heads, the theoretical required penetration could be minimal. In order to ensure adequate penetration to account for unknown variations in ground surface elevations and soil, the embedded depth (D) of the sheet pile as shown in Figure 3.3 shall be the greatest penetration of:
a. Three times the exposed height (H) on the protected side of the wall as shown in Figure 3.3. The embedment of wall shall be based on the lower ground elevation against the wall as shown on the figure below. In the case shown, the lowest ground surface against the wall is on the flood side.
b. 10 ft below the lower ground elevation. c. Extending sheet piling through very shallow pervious strata (such as silt, sand, or
peat) is good engineering practice even if the theoretical calculations do not require such lengths. This will prevent possible seepage if the strata are saturated.
d. The soil type “peat”, as intended in this chapter, describes soils typically encountered in southern Louisiana with a fibrous or amorphous aggregated of macroscopic and microscopic fragments of partially decayed vegetative matter.
UPDATED 14 JUN 12
3-18
H
D
Sand or Peat
Figure 3.3 Minimum Tip Penetration Depth
3.2.1.3 Piping and Seepage Analysis Piping The I-wall must be designed for seepage erosion (piping) along the wall. Analysis shall be based on water to the top of the wall. This analysis can be performed by various methods such as flow nets, Harr’s method of fragments, Lane’s weighted creep ratio, or finite element methods. Some of these methods are more robust than others; therefore selection of the analysis method should be made based on the complexity of the design. The seepage analysis shall consider the tension crack which will shorten the seepage path. When the levee and foundation are constructed entirely of clay, the potential for developing a steady state seepage condition along the sheet piling is negligible. However, this should be checked by the designer and engineering judgment should be used to determine if the sheeting piling needs to be extended to meet this criteria. If a sheet pile penetrates an aquifer, a standard seepage analysis shall be performed in accordance with the applicable portions of EM 1110-2-1901, EM 1110-2-1913, ETL 1110-2-569, and DIVR 1110-1-400 (for CEMVD). I-walls shall be checked for seepage erosion (piping) by evaluating the critical seepage gradient as described in EM 1110-2-1901 for uplift and heave. In this case, the vertical distance between the tip and the aquifer would be considered to be the flood side blanket thickness. The head at the levee toe can then be calculated using EM 1110-2-1901 to check for exit gradient and heave. For sheet piles that tip in near proximity to an aquifer, engineering judgment should be used to determine if this standard seepage analysis is appropriate for those designs.

UPDATED 14 JUN 12
3-19
If the computed crack depth is within 5 ft of an aquifer, the crack shall be assumed to extend to the aquifer (Figure 3.4). For specific cases where the geology of the foundation is well known and the designer is confident that the sand strata is more than 2.0 ft below the tip of the sheet pile, the crack shall extend only to the depth calculated from the method described in Section 3.2.1.1. A well know geology shall have field investigations (boring and/or CPT data) spaced closer than 100 ft.
Free-draining soil layer
Pile tip penetrates or is within 5 feet of free-draining soil layer.
Assumed crack tip at top of free-draining layer
Undrained soil layer
Figure 3.4 Computed Crack Depth Near Aquifer
Seepage Seepage analysis should be checked in accordance with the applicable portions of EM 1110-2-1901, DIVR 1110-1-400, and ETL 1110-2-569.
UPDATED 14 JUN 12
3-20
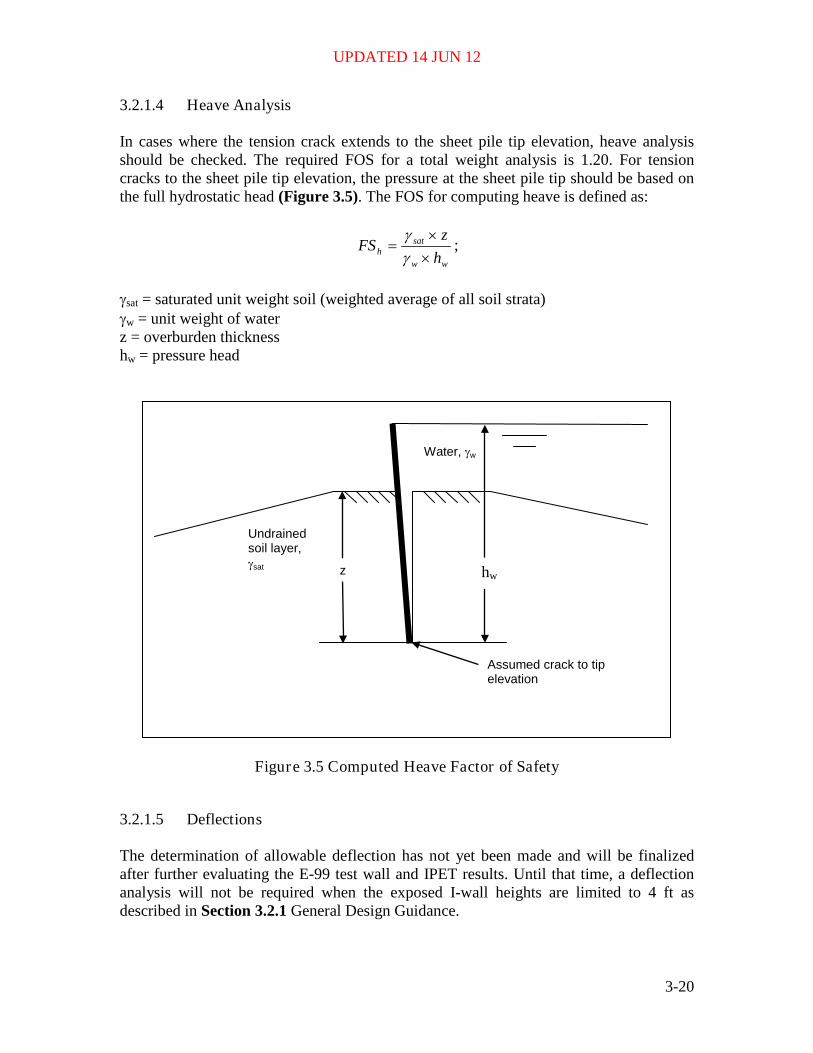
3.2.1.4 Heave Analysis In cases where the tension crack extends to the sheet pile tip elevation, heave analysis should be checked. The required FOS for a total weight analysis is 1.20. For tension cracks to the sheet pile tip elevation, the pressure at the sheet pile tip should be based on the full hydrostatic head (Figure 3.5). The FOS for computing heave is defined as:
ww
sath h
zFS
××
=γγ ;
γsat = saturated unit weight soil (weighted average of all soil strata) γw = unit weight of water z = overburden thickness hw = pressure head
Assumed crack to tip elevation
Undrained soil layer, γsat
Water, γw
z
hw
Figure 3.5 Computed Heave Factor of Safety
3.2.1.5 Deflections The determination of allowable deflection has not yet been made and will be finalized after further evaluating the E-99 test wall and IPET results. Until that time, a deflection analysis will not be required when the exposed I-wall heights are limited to 4 ft as described in Section 3.2.1 General Design Guidance.

UPDATED 14 JUN 12
3-21
3.3 AXIAL PILE CAPACITY Links to electronic versions of USACE and other documents are listed in Appendix B, if available. Publications:
• EM 1110-2-2906, Design of Pile Formations, January 1991 • Interim Downdrag and Drag Load Guidance for Pile Founded Structures, April
2009 (Reproduced here in Section 3.3.2.1) • Interim Guidance, Revised "LPILE Method" to Calculate Bending Moments in
Batter Piles for T-Walls Subject to Downdrag, December 2010 (Appendix F) In addition, the following are typical design considerations used by MVN:
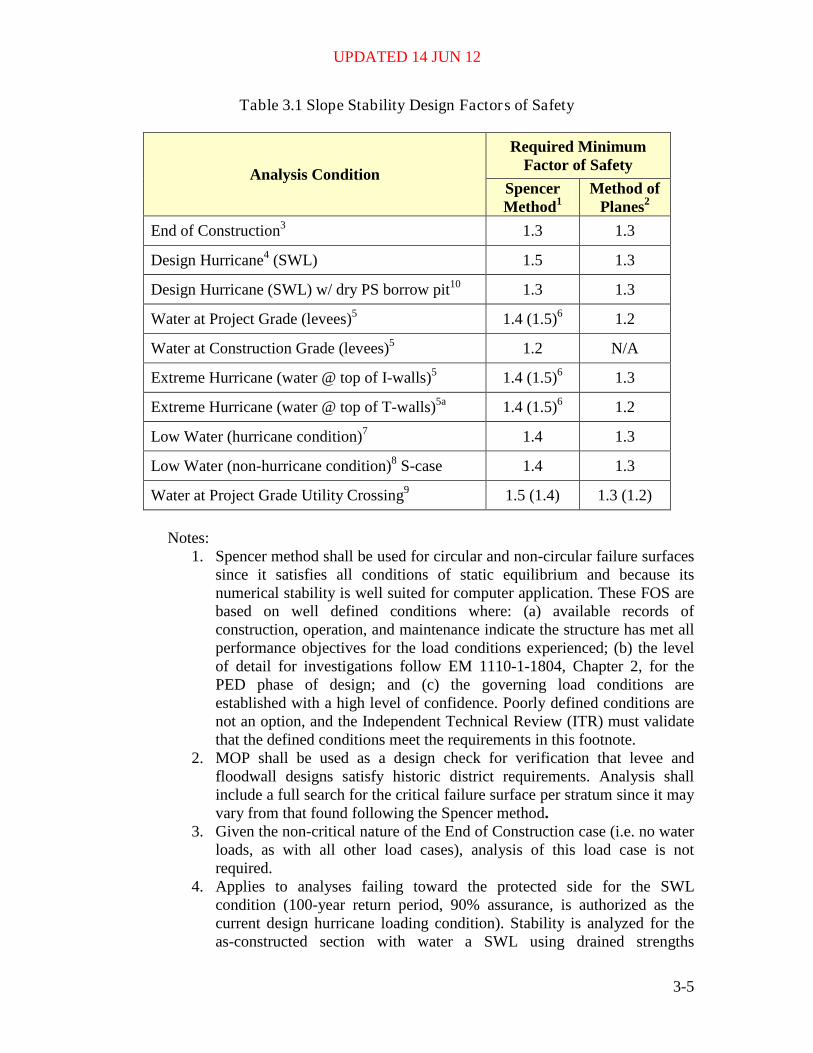
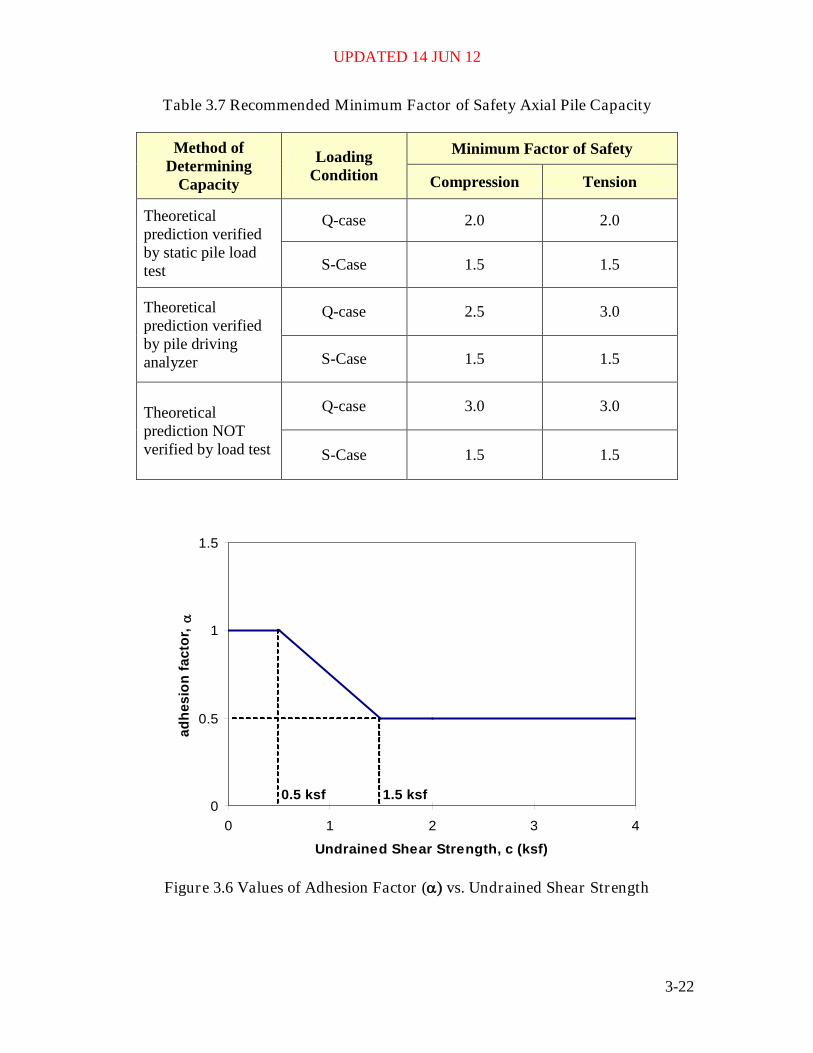
• For cohesion vs. adhesion (Figure 3.6). • Typical values for the angle of friction between soil and pile (δ) can be found in
Table 3.11. • Limited overburden stresses to 3,500 psf for both the "Q" and "S" case. • No tip bearing for Q-case in clays where cohesion is less than 1,000 psf. • Tip bearing may be considered at any depth in the S-case. • Typical values for SM = 30º and SP = 33º for no shear testing. • Tip bearing in cohesionless strata shall be limited to strata deemed competent and
clearly present, based on sufficient field data. • S-case in clay should only be evaluated for the End of Construction (Dead Load)
case. • Pile batter shall not be considered in the determination of skin friction capacity.
Recommended FOS for MVN projects are shown in Table 3.7. In addition, refer to Section 5.0 Structures for additional FOS for specific load cases. While the values given in Table 3.8 through Table 3.11 are highly recommended, these values may be varied at the discretion of the designer if validated by site specific lab and field test data.
Table 3.6 Reserved
UPDATED 14 JUN 12
3-22
Table 3.7 Recommended Minimum Factor of Safety Axial Pile Capacity
Method of Determining
Capacity
Loading Condition
Minimum Factor of Safety
Compression Tension
Theoretical prediction verified by static pile load test
Q-case 2.0 2.0
S-Case 1.5 1.5
Theoretical prediction verified by pile driving analyzer
Q-case 2.5 3.0
S-Case 1.5 1.5
Theoretical prediction NOT verified by load test
Q-case 3.0 3.0
S-Case 1.5 1.5
Figure 3.6 Values of Adhesion Factor (α) vs. Undrained Shear Strength
0
0.5
1
1.5
0 1 2 3 4
Undrained Shear Strength, c (ksf)
adhe
sion
fact
or,
α
1.5 ksf0.5 ksf

UPDATED 14 JUN 12
3-23
Table 3.8 Q-case Soil Dependent Pile Design Coefficients
Q-Case
Type φ Nc Nq
Clay 0 9.0 1.0
Silt 15 12.9 4.5
Silty Sand 30 0 22.5
Poorly Graded Sand 33 0 30.0
Table 3.9 S-case Soil Dependent Pile Design Coefficients
S-Case
Type φ Nc Nq
Clay 23 0 10.0
Silt 28 0 19.5
Silty Sand 30 0 22.5
Poorly Graded Sand 33 0 30.0
Table 3.10 Lateral Ear th Pressure Coefficients for Pile Design
Displacement Piles Non Displacement Piles
Compression (Kc)
Tension (Kt)
Compression (Kc)
Tension (Kt)
Sand 1.25 0.70 1.25 0.50
Silt 1.0 0.50 1.0 0.35
Clay 1.0 0.70 1.0 0.70

UPDATED 14 JUN 12
3-24
Table 3.11 Angles of Fr iction Between Soil and Pile (δ)
Pile Material δ
Steel 0.67φ to 0.83φ
Concrete 0.90φ to 1.0φ
Timber 0.80φ to 1.0φ A range of values of the angle of friction between soil and pile for various pile types are shown in Table 3.11. Typical values used in design for steel, timber, and concrete piles are 0.67, 0.80, and 0.90, respectively. For Steel H-piles, skin friction capacity is determined by assuming half of the surface area is soil against steel and the other half is soil against soil. When calculating end bearing capacity, designers should use the area of the steel or approximately 60% of the end-block area. The latter end bearing method should only be used in very stiff soils and validated with field load test data. For Pipe Piles (Steel or Concrete), skin friction capacity is determined by assuming the entire surface area is soil against steel/concrete. When calculating end bearing capacity, the designer should consider the development of an interior soil plug. The final end bearing value shall be established as the minimum value between (1) the shaft resistance along the soil/inner pile wall interface and (2) the tip resistance considering cross-sectional area of pile. 3.3.1 Lateral Pile Capacity When lateral pile loads are anticipated the modulus of soil reaction should be determined either by empirical equations or through the development of p-y curves for each stratum. USACE and industry standard design limits deflections for pile founded structures. By limiting deflections, designers are ensuring adequate lateral capacity of piles since this capacity is a direction function of the overall deflection of the structure. Except for very special circumstances, lateral pile capacity is not an issue since piles are typically battered and estimated deflections are minimal. 3.3.1.1 Monotonic Lateral Load Testing
a. General. The main purpose of a lateral load test is to verify the values of nh or Es used in design. The value of the cyclic reduction factor used in design can also be verified if the test pile is cyclicly loaded for approximately 100 cycles. The basis for conducting a lateral load test should be ASTM D3966-81 (Item 24) modified to satisfy the specific project requirements.

UPDATED 14 JUN 12
3-25
b. Applying Load.
A lateral load test is most easily conducted by jacking one pile against another. In this manner, two lateral load tests can be conducted simultaneously. When applying the lateral load to the pile, it is important to apply the load at the ground surface with no restraint at the pile head. This gives a free-head pile boundary condition and makes the data easy to reduce to curves of nh or Es versus pile top deflection. The loads are applied with a hydraulic jack. A spherical bearing head should be used to minimize eccentric loading.
c. Instrumentation.
The minimum amount of instrumentation needed would be dial gages to measure lateral pile head deflection and a load cell to measure applied load. A load cell should be used to measure load instead of the pressure gage on the jack because pressure gage measurements are known to be inaccurate. Additional instrumentation could consist of another level of dial gages so the slope at the top of the pile can be calculated, and an inclinometer for the full length of the pile so that lateral pile deflection at any depth along the pile can be calculated. If p-y curves are necessary for the pile foundation design, then strain gages along the pile to measure bending moment are needed. However, since the purpose of lateral load tests described in this section is to verify or determine pile-soil properties to be used in the normal design of a civil works project, the use of strain gages along the length of the pile is not recommended. Accurate strain-gage data are difficult to obtain and only of value in research work where p-y curves are being developed. Strain gages should not be installed by construction contractors because they do not have the necessary expertise to install them. If strain gages are used, consultants experienced in their use should be hired to install them, and record and reduce the data.
d. General Considerations. 1. Groundwater . The location of the ground-water table has an effect on how
laterally loaded piles behave. For this reason it is important to have the groundwater table during testing as near as possible to the level that will exist during operation of the structure.
2. Load to Failure. It is important to carry the load test to failure. Failure is
defined as when the incremental loading can not be maintained. 3. Location of Test Site. Piles should be located as near to the site of the
structure as possible and in similar materials. 4. Repor ting Test Results. Accurate records should be made of the pile
installation, of load testing, and of the load test data to document the test.
UPDATED 14 JUN 12
3-26
3.3.1.2 Cyclic Lateral Load Testing
a. General. The main purpose of a cyclic lateral load test is to verify the value of the cyclic loading reduction factor (Rc) used in design. Approximately 100 cycles of load should be used in a cyclic load test. The load test should be conducted according to ASTM D3966-81 (Item 24) modified as necessary for cyclic loading and specific project requirements. The instrumentation, equipment, and test layout necessary for conducting the cyclic load test is similar to that required for the monotonic lateral load test.
b. Procedure. Generally the cyclic lateral load test would be done in combination
with the monotonic lateral load test on the same piles. Since repeated testing of the same pile can cause permanent nonrecoverable deformations in the soil, the sequence of testing is important. One sequence for doing the monotonic and cyclic lateral load test is outlined as follows: The designer must first select the load level of the cyclic test. This may be done from a known load level applied to the pile founded monoliths or a deflection criterion. A deflection criterion would consist of loading the load test piles to a predetermined deflection and then using that load level for the cyclic load test. Using the cyclic load level, the test piles would be cyclically loaded from zero loading to the load level of the cyclic load test. This cyclic loading procedure would be repeated for the number of cycles required. Dial gage readings of lateral deflection of the pile head should be made at a minimum at each zero load level and at each maximum cyclic load level. Additional dial gage readings can be made as necessary. After the last cycle of cyclic loading has been released the test piles should then be loaded laterally to failure. That portion of the final cycle of load to failure above the cyclic test load can be superimposed on the initial cycle of loading to get the lateral load-deflection curve of the piles to failure.
3.3.2 Effects of Settlement of Piles
3.3.2.1 Downdrag and Drag Load Guidance for Pile Founded Structures The following is guidance for negative skin friction, developed by the St. Louis, MO District Corps of Engineers in April 2009: Purpose The purpose of this memorandum is to provide design guidance regarding negative skin friction induced drag load and downdrag on pile supported structures. Specifically, this memo presents a relatively simple, rational way to determine drag load and downdrag. Terminology The terminology that requires definition is listed below and generally illustrated in Figure 1.
UPDATED 14 JUN 12
3-27
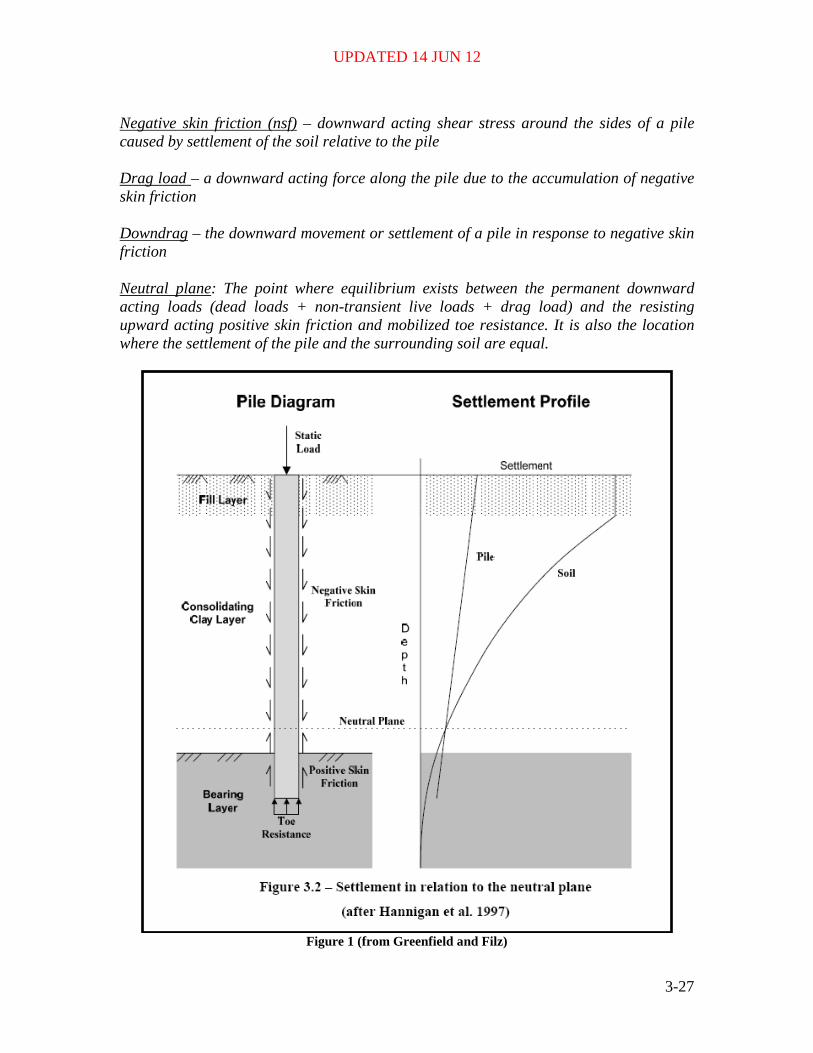
Negative skin friction (nsf) – downward acting shear stress around the sides of a pile caused by settlement of the soil relative to the pile Drag load – a downward acting force along the pile due to the accumulation of negative skin friction Downdrag – the downward movement or settlement of a pile in response to negative skin friction Neutral plane: The point where equilibrium exists between the permanent downward acting loads (dead loads + non-transient live loads + drag load) and the resisting upward acting positive skin friction and mobilized toe resistance. It is also the location where the settlement of the pile and the surrounding soil are equal.
Figure 1 (from Greenfield and Filz)
UPDATED 14 JUN 12
3-28
Force Equilibrium Approach (Basic Fellenius Method) The Fellenius Method evaluates the effects of negative skin friction on a pile foundation by determining an equilibrium condition of the pile loads and resistances. This equilibrium condition is then used to assess the pile settlement. This method incorporates conventional geotechnical computations providing more wide spread application to practicing geotechnical engineers. Assumptions of this approach:
• Positive and negative skin friction are fully mobilized and the unit values are the same at the same depth
• Toe resistance of the pile is fully mobilized • Length of the transition zone from negative to positive skin friction is not
considered In reality, only as much resistance at the pile toe as needed to resist the downward acting loads will be mobilized. In addition, the skin friction in the transition zone from negative to positive skin friction may not be fully mobilized. These factors would affect the magnitude of the computed drag load, location of the neutral plane, and the settlement of the pile. The Fellenius Method provides a well established, conservative approach to compute drag load and downdrag due negative skin friction acting on a pile founded structure. Step-By-Step Design Approach (single pile)
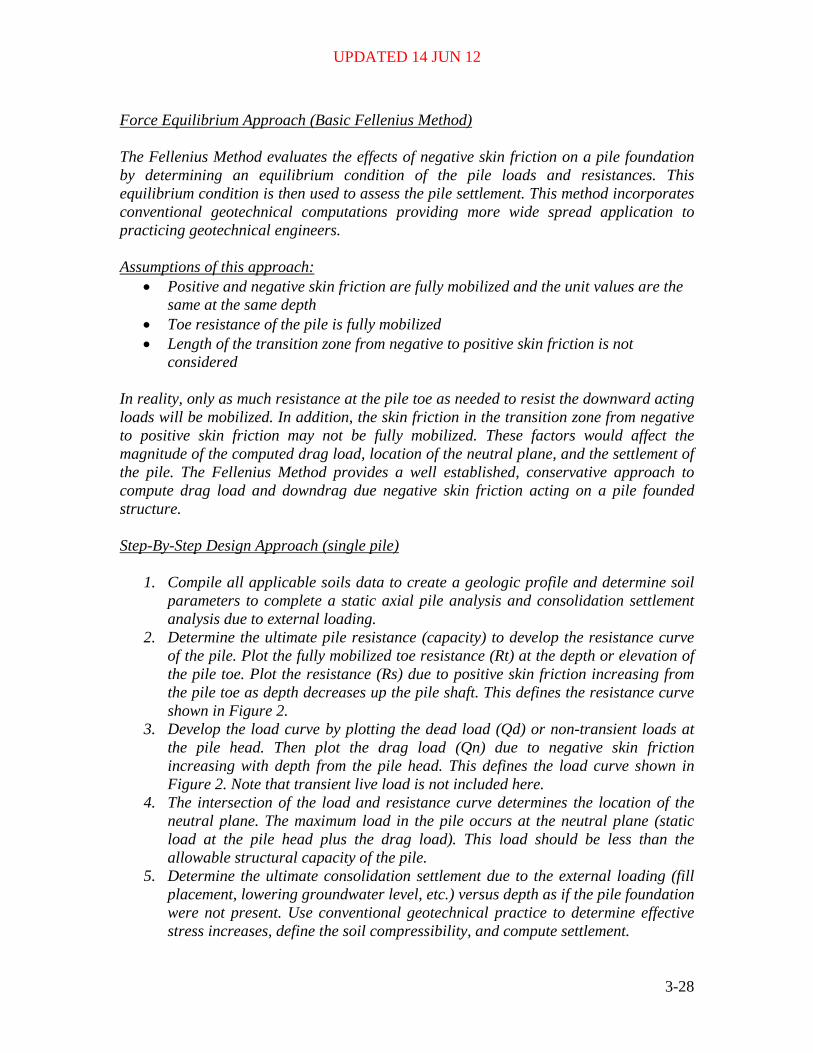
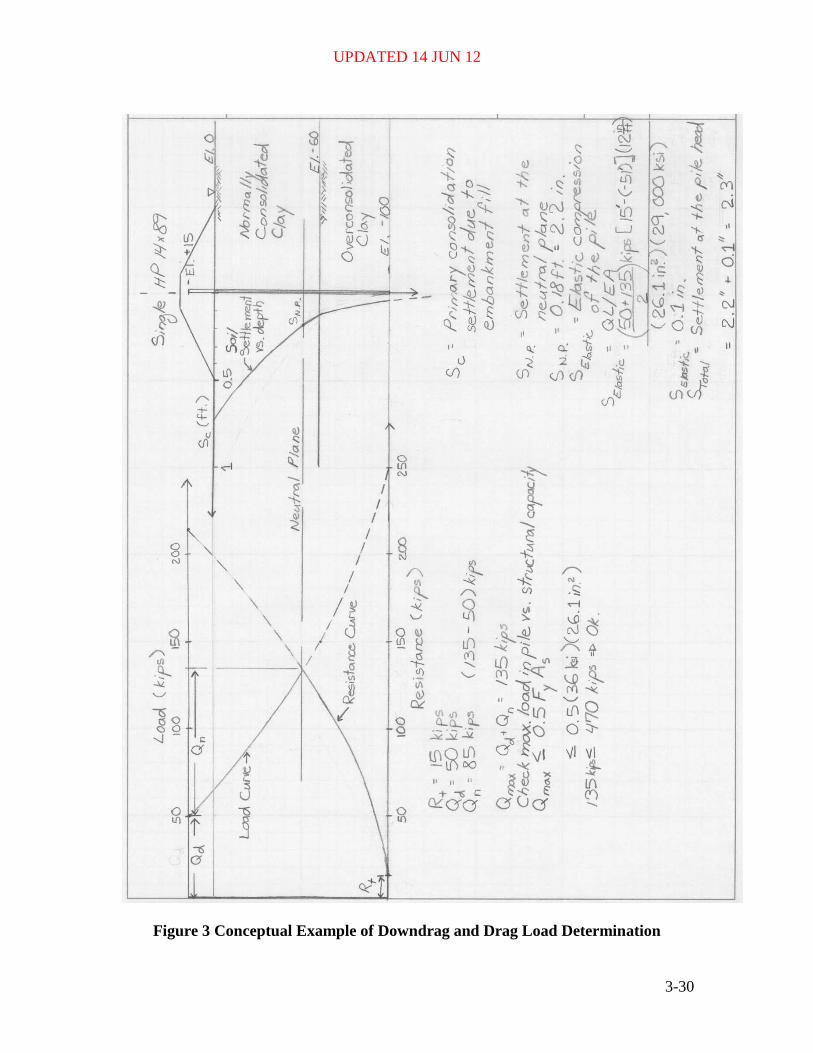
1. Compile all applicable soils data to create a geologic profile and determine soil parameters to complete a static axial pile analysis and consolidation settlement analysis due to external loading.
2. Determine the ultimate pile resistance (capacity) to develop the resistance curve of the pile. Plot the fully mobilized toe resistance (Rt) at the depth or elevation of the pile toe. Plot the resistance (Rs) due to positive skin friction increasing from the pile toe as depth decreases up the pile shaft. This defines the resistance curve shown in Figure 2.
3. Develop the load curve by plotting the dead load (Qd) or non-transient loads at the pile head. Then plot the drag load (Qn) due to negative skin friction increasing with depth from the pile head. This defines the load curve shown in Figure 2. Note that transient live load is not included here.
4. The intersection of the load and resistance curve determines the location of the neutral plane. The maximum load in the pile occurs at the neutral plane (static load at the pile head plus the drag load). This load should be less than the allowable structural capacity of the pile.
5. Determine the ultimate consolidation settlement due to the external loading (fill placement, lowering groundwater level, etc.) versus depth as if the pile foundation were not present. Use conventional geotechnical practice to determine effective stress increases, define the soil compressibility, and compute settlement.

UPDATED 14 JUN 12
3-29
6. Compute the elastic compression in the pile due to the static load (dead loads + non-transient live loads + drag load) above the neutral plane. Use an average of the load at the pile head and the maximum load at the neutral plane. Elastic compression becomes a larger contributor to the settlement in long, toe bearing piles.
7. Determine the total settlement at the pile head which is the elastic compression of the pile plus the settlement at the neutral plane due to the pile-soil interaction. This total settlement value should be less than an established tolerable level (serviceability criteria).
An example of determining downdrag and drag load for a single pile is included in Figure 3.
Figure 2 (from Fellenius)
UPDATED 14 JUN 12
3-30
Figure 3 Conceptual Example of Downdrag and Drag Load Determination
UPDATED 14 JUN 12
3-31
Key Points
• The drag load acting along a pile foundation does not decrease the bearing capacity (geotechnical capacity) of the pile. By definition, a bearing or plunging failure of a pile is the pile moving past the soil and requires mobilization of positive skin friction along the entire length of the pile shaft.
• Drag load plus the static load at the pile head are permanent long-term loads. This load combination must be less than the structural capacity of the pile or the pile will fail.
• Drag load prestresses or stiffens the pile-soil system, reducing the incremental deflections that would otherwise occur from live loads. Drag loads are normally not a problem, only creating a concern in very long, toe bearing piles where the neutral plane is very deep and the maximum load in the pile can become excessive.
• Transient live loads (such as a hurricane loading) push the pile down relative to the surrounding soil, converting negative skin friction to positive skin friction temporarily reducing drag load.
• The allowable bearing capacity (Qa = Qu / FS) of a pile founded structure must equal or exceed the sum of the dead and live loads transferred at the pile head. Again, drag load due to negative skin friction does not affect this calculation.
• The structural connection of the pile and sheet pile to the pile cap must be properly designed to avoid pull out of a pile placed into tension by drag load (e.g. a sheet pile cutoff beneath a pile supported T-wall or corner pile of a large pile group with a rigid pile cap).
• Pile toes should be founded in a stiff soil layer in order to reduce downdrag settlement. Friction piles should be carefully evaluated and used with caution because settlements of “floating” friction piles may be large when subject to drag loads.
Pile Groups The distribution of negative skin friction to a pile group is a relatively complex phenomenon. Drag loads for the exterior piles are larger than drag loads for interior piles in a group. While drag loads in a pile group are expected to vary, the drag load for any given pile in a group would be expected to be less than or at most equal to the drag load determined for a single pile. So if the drag load determined for a single pile by the method previously presented is not a concern; no more work needs to be done. If computed drag loads are an issue, more advanced methods of analysis are required. These potentially range from applying drag load reduction coefficients based on pile location and spacing to conducting three dimensional numerical analysis. The location of the neutral plane for a pile group can be determined in the same manner as was described for a single pile. Settlement of the pile group needs to be analyzed, and using an equivalent footing concept is recommended. This can be done by placing an imaginary footing equal to the pile cap dimensions at the neutral plane, loading the equivalent footing with the dead load and non-transient live load that occur at the pile cap, and then

UPDATED 14 JUN 12
3-32
computing the settlement below this “equivalent footing”. The stiffening effect of the piles on the soil between the neutral plane and pile toes can be accounted for by proportioning the soil modulus and pile modulus by area to determine a combined modulus. Normally, the combined modulus value is large enough that the settlement in this zone is negligible and the equivalent footing can simply be placed at the pile toe elevation. The stress changes induced by the equivalent footing are added to the other stress changes that cause settlement, e.g., fill placement, drop in the ground water level), and then the settlement of the ground at the elevation of the neutral plane is calculated. The compression of the piles above the neutral plane is computed and added to the settlement of the neutral plane to determine the total settlement of the pile cap. Other Considerations If battered piles are located in settling soils, bending is induced in the piles. The general guidance is simply to avoid battered piles in settling soils, especially when the settlements are large. Battered piles are normally expected to deflect or move with the settling soil. If battered piles located in settling soils cannot be avoided, the bending in the piles induced by the settling soils should be evaluated to determine the effect on the structure’s performance. Such an evaluation would normally require advanced numerical modeling. References: Greenfield, M. and Filz, G. (2009). “Downdrag and drag load on piles.” CPGR #56, Center for Geotechnical Practice and Research, Virginia Polytechnic Institute and State University. Fellenius, B. H. (2004). “Unified design of piled foundations with emphasis on settlement analysis.” Geo-Institute Geo-TRANS Conference, ASCE Geotechnical Special Publication. Fellenius, B. H. (2006). Basics of foundation design. Electronic Edition, www.Fellenius.net, 275 p.. Terzaghi, K., Peck, R. B., Mesri, G. (1996). Soil mechanics in engineering practice, third edition.New York, NY. John Wiley & Sons, Inc. 3.3.2.2 Settlement Induced Bending Battered piles that have the potential to experience bending moments induced by downdrag acting on batter piles that support T-Walls must be evaluated according to the latest criteria, (see Interim Guidance, Revised "LPILE Method" to Calculate Bending Moments in Batter Piles for T-Walls Subject to Downdrag, Appendix F). The criteria incorporates project-specific nonlinear settlement profiles throughout the LPILE method.

UPDATED 14 JUN 12
3-33
3.3.3 Pile Dr ivability Considerable engineering experience and judgment are necessary when evaluating or specifying the suitability of driving equipment. The designer should be aware that certain equipment and methods for pile installation have been known to reduce axial and lateral resistance or damage the pile in certain situations. Designer approval of the contractor’s methods and equipment is necessary to ensure the pile can be driven without damage to the pile or soil. Field variations from previously approved methods and equipment require re-submittal to the designer. Piles are normally driven by impact or vibratory-type hammers. The installation of a concrete pile requires special consideration due to its inherent low tensile strength. For this reason, the use of diesel hammers should not be allowed to drive concrete piles. A wave equation analysis is a means for a designer to evaluate pile drivability, hammer selection, anticipating driving stresses, and establishing penetration rates. Data obtained from the wave equation analysis should be used with judgment for friction piles since pile set-up may occur. A wave equation analysis is recommended for all but the simplest of projects. The use of special driving assistance, such as pile shoes, jetting, preboring, spudding, and followers should be carefully evaluated by the designer, and should be clearly defined in contract specifications. EM 1110-2-2906 should be consulted for further information. 3.3.4 Pile Tests A pile test (pile load test, pile driving analyzer, pile drivability test) may be conducted separately or concurrently. A pile load test, which may consist of an axial or lateral load test, is intended to verify the theoretically computed capacity of a pile foundation. A pile driving analyzer is used to assess the capacity of a pile, as well as to evaluate shaft integrity and investigate driving stresses and hammer energy during pile installation. A pile drivability test can be used to determine data on drivability of selected types of piles with selected types of hammers. Field pile tests are warranted if a sufficient number of production piles are to be driven and if a reduced FOS (increased allowable capacity) will result in a sufficient shortening of the piles so that a potential net cost savings will result. Depending on the type of pile test performed, the minimum required FOS may be adjusted (Table 3.7). If the results of a pile test are used to project pile capacity for tip elevations other than those tested, extreme caution should be exercised. Pile tests should be conducted within the footprint of the structure, otherwise as near as possible. Casing of the test pile may be required to model the effects of a structure excavation or to eliminate capacity above a particular elevation (critical elevation of unbalanced loads). Production piles should be driven with the same hammer and other driving equipment and methods that will be used for the test pile. The waiting period between the driving of a test pile and performing an axial or lateral pile load test should allow sufficient time for dissipation of excess pore water pressures resulting from the pile driving operation. The required waiting period is generally 21

UPDATED 14 JUN 12
3-34
days. Tension tests are often conducted on piles which have previously been tested in axial compression. The required waiting period between tests is generally 14 days. Data generated using a pile driving analyzer during original driving will not reflect pile set-up and may under-predict the capacity of the pile. To produce data that reflect the true capacity of the pile, the pile should be re-struck after set-up has occurred, usually a minimum of 14 days after initial driving. EM 1110-2-2906 should be consulted for further information. 3.3.5 Interpretation of the Results of a Pile Load Test The interpretation of the test results generally involves two phases; analyzing the actual test data, and application of the final test results to the overall design of the service piles and the structure. The following method has often been used by USACE MVN:
• Determine the load that causes a movement of 0.25 inch on the net settlement curve.
• Determine the load that corresponds to the point at which the gross settlement curve has a significant change in slope (Tangent Method).
• Determine the load that corresponds to the point on the gross settlement curve that has a slope of 0.01 inch per ton.
The average of the three loads determined in this manner would be considered the ultimate axial capacity of the pile. If one of these three procedures yields a value that differs significantly from the other two, judgment should be used before including or excluding this value from the average. A suitable FOS should be applied to the resulting axial pile capacity. The gross settlement curve is made up of the points corresponding to the largest pile movement and the corresponding load, for each cycle. The net settlement curve is made up of the points corresponding to the maximum load per cycle vs. the movement of the pile after the removal of all loads, for each cycle. Other methods, such as the Davisson Method, have also been found to have merit.
UPDATED 14 JUN 12
3-35
3.3.6 Pile Group Capacity The pile group capacity for piles in cohesionless soils is determined differently than for pile in cohesive soils. For piles in cohesionless soils, the pile group efficiency is defined as:
ult
group
NQQ
=η
Where: η = the pile group efficiency Qgroup = the ultimate capacity of the pile group N = the number of piles in the group Qult = the ultimate capacity of a single pile The ultimate group capacity of driven piles in sand is equal to or greater than the sum of the ultimate capacity of the single piles. Therefore in practice, the ultimate group capacity of driven piles in sand not underlain by a weak layer should be taken as the sum of the single pile capacities ( =η 1). For piles jetted into sand, η is less than one. For piles underlain by a weak layer, the ultimate group capacity is the smaller of (a) the sum of the single pile ultimate capacities or (b) the capacity of an equivalent pier with the geometry defined by enclosing the pile group. The base strength should be that of the weak layer. For piles in cohesive soils, the ultimate group capacity is the smaller of (a) the sum of the single pile ultimate capacities or (b) the capacity of an equivalent pier. The ultimate group capacity of piles in clay is given by the smaller of the following two equations:
ultgroup NQQ = Or,
( ) ggbg
g
gagggroup BLc
LB
BDDcLBQ
+
+++=
51
5152
Where,
95
15
15 ≤
+
+=
g
g
gc L
BBDN
And: Bg = width of the pile group

UPDATED 14 JUN 12
3-36
Lg = length of the pile group D = depth of the pile group ca = weighted average of the adhesion between the clay and the pile over the depth of pile embedment cb = undrained shear strength at the base of the pile group This equation applies to a rectangular pile groups only. It should be modified for other pile group shapes. 3.4 T-WALL AND L-WALL/KICKER PILE WALL DESIGN CRITERIA This section applies to T-walls and L-walls that serve as or impact hurricane flood protection. 3.4.1 Sampling of References Links to electronic versions of USACE and other documents are listed in Appendix B, if available. Publications:
• DIVR 1110-1-400, Soil Mechanic Data, December 1998 • EM 1110-2-1901, Seepage Analysis and Control for Dams, April 1993 • EM 1110-2-1913, Design and Construction of Levees, April 2000 • EM 1110-2-2100, Stability Analysis of Concrete Structures, December 2005 • EM 1110-2-2502, Retaining and Flood Walls, September 1989 • EM 1110-2-2504, Design of Sheet Pile Walls, March 1994 • EM 1110-2-2906, Design of Pile Foundations, January 1991 • ETL 1110-2-569, Design Guidance for Levee Underseepage, May 2005
Computer Software:
• CE Sheet Pile Wall Design/Analysis Program (CWALSHT) • Slope Stability Program based on “MVD Method of Planes” (Method of Plane
Program and plotting program is available by contracting New Orleans District.) • Slope Stability Programs based on “Spencer’s Procedure”
Walls shall be constructed using the latest datum from Permanent Benchmarks certified by NGS as NAVD88 (2004.65). Refer to Section 9.0 Surveys for additional information. The following is a summary of protection heights for various wall systems. Maximum heights refer to exposed height of the protected side of the wall. The basis for these values are lessons learned from I-wall performance (stability and observed deflections), post-Hurricane Katrina forensic investigations, and numerical modeling (including the final IPET report dated June 2009), I-wall field tests along London Avenue Outfall Canal in 2007, and E-99 sheet pile wall test in 1985.

UPDATED 14 JUN 12
3-37
• I-walls – 4 ft maximum height • T-walls – Typically 4 ft and greater in height • L-walls/Kicker Pile Walls – 8 ft maximum height and no unbalanced loads
T-walls are the preferred walls where there is the potential for boat/barge impact loading or unbalanced forces resulting from a deep-seated stability analysis. L-walls may also be used where there is the potential for boat/barge impact loading; however, they shall not be used where an unbalanced force is present resulting from a deep-seated stability analysis. Seepage, global stability, heave, settlement, and any other pertinent geotechnical analysis shall be performed in order to ensure that the overall stability of the system is designed to meet all USACE criteria. Geotechnical Engineers shall minimize the height of the wall system by designing the largest earthen section that is practical and stable for each individual project. Floodwall protection systems are dedicated single purpose structures and shall not be dependent on or connected to other (non-Federal) structural or geotechnical features that affect their intended performance or stability. In an L-wall, the steel sheet piling is a pile acting to control seepage and provide support to the structure. The foundation support piles shall be designed such that settlement is limited to an acceptable amount and differential settlement is negligible. Vertical movement of the cap should be less than 0.50 inch and horizontal deflection of the cap should be limited to 0.75 inch. Deviations shall be approved in advance by the USACE engineer of record. Where levees will be raised or new embankment constructed, the adverse effects of foundation consolidation must be considered which includes drag forces on both the sheet pile cut-off and support piles. In addition, these drag forces must be considered in settlement calculations. 3.4.2 Geotechnical Design Guidance 3.4.2.1 Global Stability Analysis Stability Spencer’s Procedure shall be used for slope stability analysis incorporating FOS for two (2) Load Conditions according to Table 3.1.
• Condition 1 - water at SWL • Condition 2 - water at the top of the wall
When feasible, stability berms shall be designed to counter unbalanced forces within the foundation beneath the floodwall due to unacceptable FOS. The unbalanced force is determined as the additional resistive horizontal force necessary to achieve the required

UPDATED 14 JUN 12
3-38
FOS. Determination of the magnitude, direction, and location of the unbalanced force is described in Section 3.4.3 T-wall Design Procedure. Stability Analysis Results (Case 1) If there are no unbalanced forces, the structure is required to carry only the net at-rest loads acting above the base. These loads must be carried axially by the foundation piles below the base. Therefore, for a T-wall, the sheet piling section and tip elevation, below the base, is determined only by seepage analysis or erosion control, refer to Section 3.4.3 T-wall Design Procedure. For an L-wall, the sheet piling section and tip elevation, below the base, is not only determined by seepage analysis or erosion control, it must also resist tension and compression forces acting in conjunction with the foundation kicker pile. (Case 2) If there are unbalanced soil loads, refer to Section 3.4.3 T-wall Design Procedure. L-walls are not allowed where unbalanced loads exist. For T-wall and L-wall designs, wave forces are directly transferred to the support piles through the wall stem and base slab. Therefore, wave forces are not required during slope stability analyses. 3.4.2.2 T-wall Sheet Piling Cut-off Tip Penetration Sheet pile tip elevations shall meet criteria for seepage control and at a minimum, shall extend 10 ft beneath the T-wall base. Engineering judgment shall be used to determine the final penetration such as extending through very shallow sands or peat layers. When two T-wall sections with different ground surface, base slab and required sheet pile tip elevations are to be constructed adjacent to one another, a minimum overlap of 50 ft of the deeper required sheet pile tip elevation shall be incorporated. For relatively short reaches of floodwall with differing sheet pile requirements, such as for pump station fronting protection, the worst case required sheet pile penetration shall be used for every floodwall part of those structures. If unbalanced forces exist, as determined by the global stability analysis, then the sheet pile tip will be determined by the anchored bulkhead analysis above. Due to the short term loading condition for HSDRRS floodwalls, it can be assumed that hot rolled sheet pile walls will be 100% effective against seepage pressures, although some leakage through the sheet pile interlocks may still occur. The design has discretion to assume reduced efficiency during long term loading events when applicable. 3.4.2.3 L-wall Sheet Piling Tip Penetration Sheet pile tip elevations shall meet criteria for seepage control and at a minimum, shall have either a 3 to 1 penetration ratio of wall height to depth or shall extend 10 ft beneath the L-wall base, whichever is greater. Sheet pile tip elevation shall provide required compression and tension resistance required from T-wall analysis (see below). Engineering judgment shall be used to determine the final penetration such as extending through very shallow sand or peat layers.

UPDATED 14 JUN 12
3-39
The ultimate tension and compression capacity of the sheet pile shall be the allowable shaft resistance on both sides of the sheet using the projected flange line, except in the upper 10 ft below the slab. In this top 10 ft, only the protected side of the sheet pile shall be considered effective. A FOS of 3.5 shall be applied to the ultimate capacity to arrive at the allowable capacity due to reduction inherent when installing sheet piling with vibratory hammers. A FOS of 2.5 may be used in both compression and tension when a pile load tests is performed. 3.4.2.4 T-wall and L-wall Pile Foundation Tip Penetration This section applies to Precast Prestressed Concrete (PPC), Steel H and Pipe sections. Pile lengths will be based on subsurface investigation data from existing contracts or, if time permits, new borings. If data is available from historic pile tests, they can be used to determine pile lengths. The designer would need to determine if the historic data is appropriate based on size, type, length, and soil parameters. If those previous test piles were not tested to failure, this would have to be considered when determining the value of the data. For axial loads in tension and compression, the ultimate capacity should be based on the following FOS:
FOS = 2.0 with static pile test data FOS = 2.5 with pile dynamic analysis (PDA) FOS = 3.0 without pile test data.
(See table in Structural Design Analysis section for additional FOS.)
3.4.2.5 Piping and Seepage Analysis Piping (Cutoff-wall Tip Elevation) T-walls and L-walls must be designed for piping erosion along the base of the pile founded wall. Analysis shall be based on water to the top of the wall. This analysis can be performed by various methods such as Lane’s weighted creep ratio, flow nets, Harr’s method of fragments, or finite element methods. A design procedure used for evaluating piping erosion for clays, silts, and sands directly beneath pile-founded L-walls and T-walls for hurricane protection is to use Lane’s weighted creep ratio for a seepage path along the sheet pile wall. Engineering judgment should be exercised in selecting appropriate weighted creep ratio values for this analysis and using the weighted creep length based on flow path through the different foundation materials. Seepage Seepage analysis through the foundation should be checked in accordance with the applicable portions of EM 1110-2-1901, DIVR 1110-1-400, EM 1110-2-1913, and ETL 1110-2-569. For computing the seepage gradient FOS see Section 3.1.3 Seepage Analysis.

UPDATED 14 JUN 12
3-40
3.4.2.6 Heave Analysis If applicable, heave analysis should be checked. Safety factor for total weight analysis is 1.2. For computing heave FOS refer to Section 3.2.1.4 Heave Analysis. 3.4.3 T-wall Design Procedure The design procedure is applicable to T-walls. Adaptations for drainage structures, floodgates, and extended foundations are discussed in Section 3.4.3.3. Fronting walls, constructed separate from existing structures (i.e. Pump Stations) present other analysis concerns that are discussed in Section 3.4.3.4. Other special exceptions, such as wall alignment changes, 90 degree intersections of walls, etc, are not addressed in this document and are treated on a case-by-case basis involving coordination between the project designer and TFH. 3.4.3.1 Descr iption This design method was developed to incorporate complete loading on T-walls including part of the lateral earth load imposed on pile foundations due to a storm surge acting on the flood side ground surface (termed the unbalanced force). This design procedure is a supplement to existing HSDRRS design criteria and EM 1110-2-2906, which shall govern for design aspects not specifically stated herein. This design method evaluates the improvement in global stability by including the allowable shear and axial force contributions from the foundation piles together with the soil shear resistance in a limit equilibrium slope stability analysis (Spencer's Method). This procedure has the ability to account for both the reinforcing effect the piles have on the foundation soils and ability to determine safe allowable shear and axial forces for the piles. This design procedure is a supplement to existing Hurricane and Storm Damage Risk Reduction System design criteria and EM 1110-2-2906, which shall govern for design aspects not specifically stated herein. The design procedure requires an initial pile layout to get started. The initial pile layout is designed similarly to the current MVN procedure in that slope stability is checked for the T-wall configuration neglecting piles and the water loads directly on the wall. A balancing force is computed to achieve the required global factor of safety (termed the unbalanced force). A portion of the unbalanced force is applied to the pile cap and a CPGA analysis is completed. The initial CPGA based design is verified by applying the unbalanced force as an equivalent "Distributed Load" to the foundation piles in an Ensoft Group Version 7.0 model (Group 7). Refer to Chapter 5 for detailed discussion of these programs. Loads are also applied to the wall base and stem and the axial and shear responses for each pile are then compared with the allowable pile forces found from load tests or from computations. Limiting axial and lateral loads according to load test data helps minimize deflection to tolerable limits. Deflections of the T-wall computed from the Group 7 analysis are also compared to allowable deflections and bending moments and shear are checked to verify that they are within allowable pile limits. Note that all CPGA designs shall include unfactored service loads and the Group 7 input shall include unfactored soil properties.
UPDATED 14 JUN 12
3-41
The initial CPGA based design is verified by applying the unbalanced force as an equivalent uniformly “Distributed Load” to the foundation piles in an Ensoft Group Version 7.0 model (Group 7). A minimum 50-100% of the unbalanced load is applied to the flood side row of piles as discussed in the design steps. Loads are also applied to the wall base and stem, the axial, and shear and bending moment responses (including combined axial and bending stresses) for each pile are then compared with the allowable pile forces found from load tests or from computations. Limiting axial loads according to load test data helps minimize deflection to tolerable limits. Deflections of the T-wall computed from the Group 7 analysis are also compared to allowable deflections and combined axial, bending stresses, and shear are checked to verify that they are within allowable pile limits from EM 1110-2-2906. For a detailed discussion of how the equivalent distributed loads are applied, refer to Section 3.4.3.3 of this document. Note that all CPGA designs and the Group 7 input shall include unfactored service loads and un-factored soil properties. CPGA: The Pile Group Analysis computer program CPGA is a stiffness method analysis of three-dimensional pile groups assuming linear elastic pile-soil interaction and a rigid pile cap. It is intended to be a simple program for pile group analysis to eliminate many of the inaccuracies inherent in hand analysis methods. Soil resistance to pile movement may be included. The details of this program are described in Technical Report ITL-89-3 "User's Guide: Pile Group Analysis (CPGA) Computer Group (July 1989). Additional information on the CPGA program can be found in the USACE Engineer Manual EM 1110-2-2906 Design of Pile Foundations. Group 7: The Ensoft Group Version 7.0 Model (Group 7) is a proprietary program developed by Ensoft, Inc. A summary of this program is described on the Ensoft, Inc. website (http://ensoftinc.com/) as follows:
The (Group 7) program was developed to compute the distribution of loads (vertical, lateral, and overturning moment in up to three orthogonal axes) from the pile cap to piles arranged in a group. The piles may be installed vertically or on a batter and their heads may be fixed, pinned, or elastically restrained by the pile cap. The pile cap may settle, translate, and/or rotate and is assumed to act as a rigid body. The program will generate internally the nonlinear response of the soil, in the form of t-z and q-w curves for axial loading, in the form of p-y curves for lateral loading and in the form of t-r curves for torsional loading. A solution requires iteration to accommodate the nonlinear response of each pile in the group model. Program GROUP solves the nonlinear response of each pile under combined loadings and assures compatibility of geometry and equilibrium of forces between the applied external loads and the reactions of each pile head. The p-y, t-z, q-w and t-r curves may be generated internally, employing recommendations in technical literature, or may be entered manually by the user. The pile-head forces and movements are introduced into equations that yield the behavior of the pile group in a global coordinate system. The program can internally compute the

UPDATED 14 JUN 12
3-42
deflection, bending moment, shear, and soil resistance as a function of depth for each pile.
Additional information regarding this software can be obtained on the Ensoft, Inc. website (http://ensoftinc.com/). Other Programs: The USACE recognizes that other programs may be suitable for the analysis. The designer should either use the referenced programs for the analysis or provide MVN with a request to use a different program/method with all supporting information for review and approval prior to proceeding with the design effort. Refer toChapter 5 for detailed discussion of these programs. Step 1. Initial Slope Stability Analysis 1.1. Determine the critical non-circular failure surface from a slope stability analysis for loading to the SWL and to the Top of Wall using a software program capable of performing Spencer’s method with a robust search procedure (hereinafter termed Spencer’s method). Sufficient deterministic and finite element analyses have been completed on varying soil profiles to assure that the non-circular surfaces shall govern the stability assessment. Furthermore, numerical modeling has indicated that soil displacement is nearly horizontally along the critical failure surface. The slope stability analysis should be performed with only water loads acting on the ground surface flood side of the heel of the T-wall because these are the loads that the foundation must resist to prevent a global stability failure. The analysis should not include any of the water, soil, or surcharge loads acting directly on the structure because these loads are presumed to be carried by the piles to deeper soil layers. Global stability of T-walls includes the foundation materials on the protected side of the wall. If those materials were removed the walls would be required to support a larger unbalanced load. If the foundation on the protected side of the T-wall (like an existing slope towards an inland ditch or canal) is not stable or does not satisfy required factors of safety it must either be improved to meet criteria or be partly removed from the global stability model when calculating the unbalanced load. Landward berms and channel local slope stability analysis shall satisfy the applicable FOS listed in this chapter in order to be included in the global stability analysis. 1.2. If the factor of safety of the critical failure surface is greater than required (see Section 3.1.1.2), a structural analysis of the T-wall system shall be completed using a group pile analysis program (like CPGA or Group 7) using only the water loads and at rest pressures applied directly to the structure. If the lowest factor of safety is less than required, then proceed to Step 2. The factor of safety and defining failure surface coordinates should be noted for use in Step 2. 1.3. As stated in Step 1.1 above, only non-circular failure planes shall be investigated and shall be horizontal along the critical failure surface. This horizontal distance is referred to as the neutral block. The neutral block shall have a minimum dimension of the greater of 0.7 H or the base length of the T-Wall or structure. H is defined as the
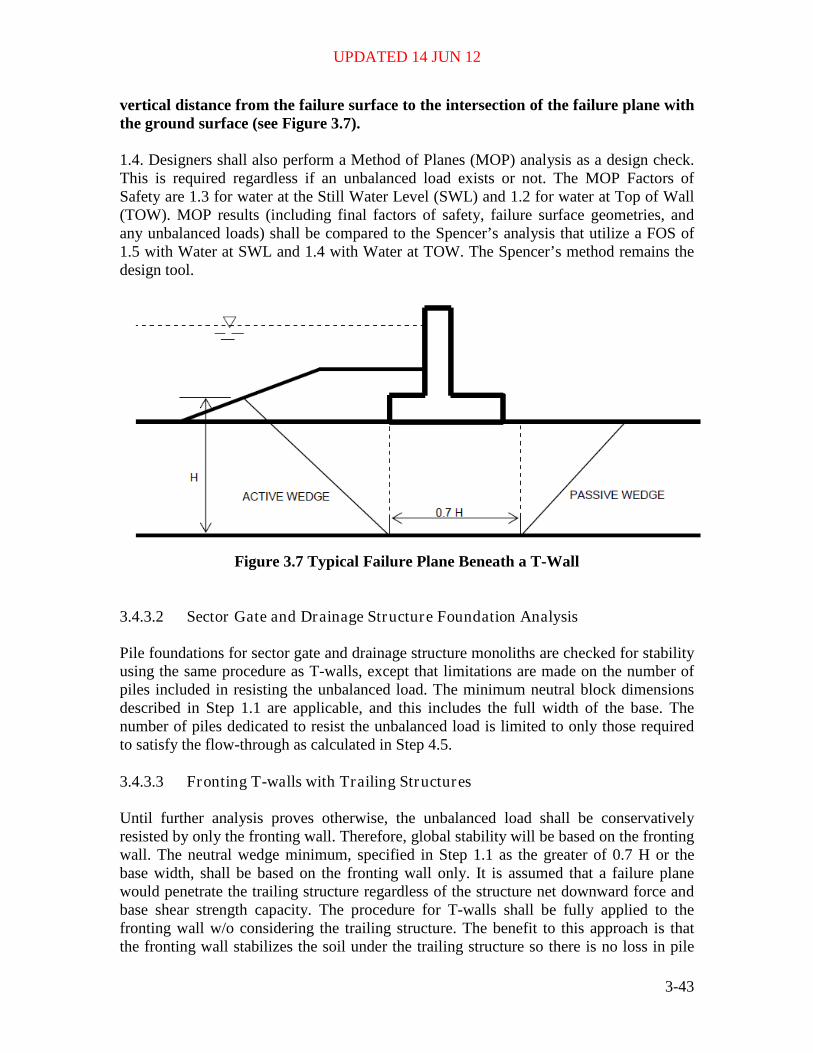
UPDATED 14 JUN 12
3-43
vertical distance from the failure surface to the intersection of the failure plane with the ground surface (see Figure 3.7). 1.4. Designers shall also perform a Method of Planes (MOP) analysis as a design check. This is required regardless if an unbalanced load exists or not. The MOP Factors of Safety are 1.3 for water at the Still Water Level (SWL) and 1.2 for water at Top of Wall (TOW). MOP results (including final factors of safety, failure surface geometries, and any unbalanced loads) shall be compared to the Spencer’s analysis that utilize a FOS of 1.5 with Water at SWL and 1.4 with Water at TOW. The Spencer’s method remains the design tool.
Figure 3.7 Typical Failure Plane Beneath a T-Wall
3.4.3.2 Sector Gate and Drainage Structure Foundation Analysis Pile foundations for sector gate and drainage structure monoliths are checked for stability using the same procedure as T-walls, except that limitations are made on the number of piles included in resisting the unbalanced load. The minimum neutral block dimensions described in Step 1.1 are applicable, and this includes the full width of the base. The number of piles dedicated to resist the unbalanced load is limited to only those required to satisfy the flow-through as calculated in Step 4.5. 3.4.3.3 Fronting T-walls with Trailing Structures Until further analysis proves otherwise, the unbalanced load shall be conservatively resisted by only the fronting wall. Therefore, global stability will be based on the fronting wall. The neutral wedge minimum, specified in Step 1.1 as the greater of 0.7 H or the base width, shall be based on the fronting wall only. It is assumed that a failure plane would penetrate the trailing structure regardless of the structure net downward force and base shear strength capacity. The procedure for T-walls shall be fully applied to the fronting wall w/o considering the trailing structure. The benefit to this approach is that the fronting wall stabilizes the soil under the trailing structure so there is no loss in pile
UPDATED 14 JUN 12
3-44
capacity for the trailing structure. This is significant when considering that many of the existing trailing structures are built on timber piles with minimal capacity. Note that the protected side tail water, where applicable such as the intake basin of a pump station, imposes a dead load. This dead load is relieved by the pile foundation and is not included in the Central Block Resistance for cohesive soils (Rb in MOP analysis). However, the tail water head creates a downward pressure that should be included in passive driving resistance (Dp in MOP analysis). In Spencer based analyses, the protected side water loads are applied to the ground surface but not to the protected structure. One solution to reduce any unbalanced load with sequential structures is to locate the fronting wall further from the pump station such that a stability berm can be built between the two. Step 2. Unbalanced Force Computation 2.1. Determine the unbalanced forces for both loading to Still Water Level (SWL) and Top of Wall (TOW) required to achieve the target factor of safety using Spencer’s method with a non-circular failure surface search. The unbalanced force shall be applied as a horizontal line load at a location having an X-coordinate at the heel of the wall or simply beneath the base of the wall. The Y-coordinate shall be located at an elevation that is half-way between the ground surface at the heel of the wall and the lowest elevation of the critical failure surface beneath the wall base from Step 1. The unbalanced load is arrived at through a trial and error process where the load is varied until the desired factor of safety is achieved. The failure surface found in Step 1 is “reanalyzed” with the specified line load so that the largest unbalanced force is computed. The unbalanced load is determined for both conditions: the slip surface with lowest factor of safety and the slip surface with the highest unbalanced load. The unbalanced load and the defining failure surface coordinates should be noted for use in subsequent steps. The largest unbalanced load does not necessarily coincide with the failure surface with the lowest factor of safety; therefore, multiple failure surfaces at various elevations must be analyzed to determine those corresponding unbalanced forces. The unbalanced load is determined for both conditions: the slip surface with lowest factor of safety and the slip surface with the highest unbalanced load. The unbalanced load and the defining failure surface coordinates should be noted for use in subsequent steps. 2.2. The critical failure plane is defined as the failure surface that produces the greatest unbalanced load. This failure surface is NOT necessarily the failure surface with the lowest factor of safety. Where unbalanced loads are present, all axial pile capacity developed above the critical failure plane shall be disregarded.
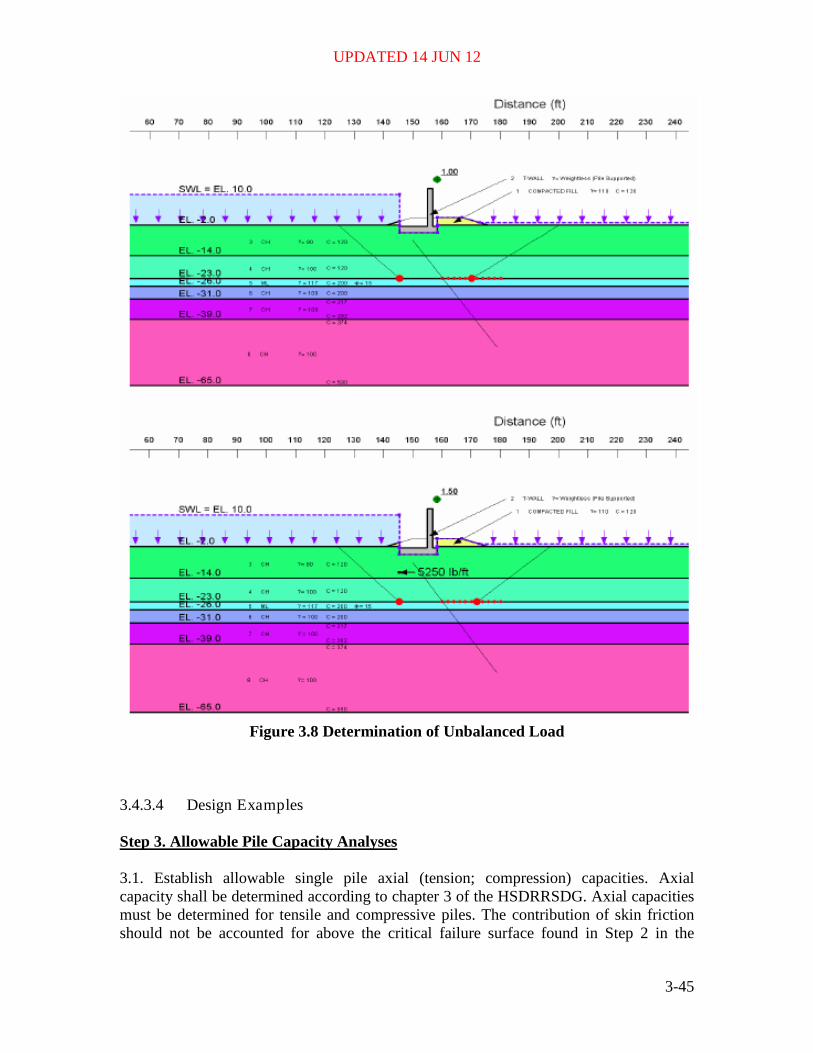
UPDATED 14 JUN 12
3-45
Figure 3.8 Determination of Unbalanced Load
3.4.3.4 Design Examples Step 3. Allowable Pile Capacity Analyses 3.1. Establish allowable single pile axial (tension; compression) capacities. Axial capacity shall be determined according to chapter 3 of the HSDRRSDG. Axial capacities must be determined for tensile and compressive piles. The contribution of skin friction should not be accounted for above the critical failure surface found in Step 2 in the

UPDATED 14 JUN 12
3-46
determination of the axial capacity. Allowable axial loads may also be found using data from pile load tests and applying appropriate factors of safety after the ultimate load has been reduced to neglect the skin friction effects capacity above the critical failure surface. Much like the skin friction along a pile is less during driving than it is after it sets up for multiple weeks, an unstable foundation (from slope stability) can adversely affect the bond between the soil and the piles. Therefore, the skin friction in the foundation above the critical failure surface should not be considered. When pile load tests are performed for these piles, this has typically been taken into account by utilizing casings (auguring out the soil). In addition tension pile test at the critical failure surface can be conducted or theoretical can be calculations made to determine how much skin friction capacity should be removed from a pile test with no casing. No cyclic reductions need to be applied to the capacities. 3.2. Compute allowable shear loads on the pile at the critical failure surface. Lateral shear loads have historically not been computed; instead deflections are calculated at a working stress level and are required to be less than specified limits. For this procedure, in addition to the traditional check of pile cap displacements, allowable lateral loads are now used as a design check. The Ensoft program LPILE or the Corps program COM624G can be used to compute allowable lateral shear in the pile using these steps:
a. Analyze the pile with a free head at the critical failure surface. To account for overburden pressure, make the top foot a layer with a unit weight equal to the effective stress due to the overburden.
b. Run a series of progressively higher lateral loads on the pile, with moment equal to zero, and plot load vs. deflection results. The pile will fail when deflections increase greatly with increasing load. The load vs. deflection curve should be terminated at the load at which yield in the pile is reached. Draw lines roughly tangent to the initial and final portions of the curve. The point of intersection of the two tangent lines is the ultimate shear strength. An example of this is shown in Figure 3.9.
c. Divide the shear load by the same factors of safety used to compute allowable axial capacity from calculated ultimate values.

UPDATED 14 JUN 12
3-47
Figure 3.9 Example of computation of ultimate shear load in the pile from a load vs.
deflection curve developed using LPILE. FOS varies depending on load case. 3.3. Determination of the Modulus of Horizontal Subgrade Reaction (Es).
For cohesive soils or soils with a constant modulus of horizontal subgrade reaction:
𝐸𝑠 = 0.2222𝑞𝑢𝐶𝐷
For cohesionless soils or soils with a linearly increasing modulus of horizontal subgrade reaction:
𝐸𝑠 = 𝑁𝐻𝑍𝐶𝐷 Where: qu is the unconfined compressive strength in units of pounds per square foot B is the pile width in units of inches, measured at right angles to the direction of displacement C is a reduction factor for cyclic loading effects D is a reduction factor for the effect of group action NH is constant of horizontal subgrade reaction in units of pounds per cubic inch (may be found in text books) Z is the depth below the equivalent ground surface in units of inches
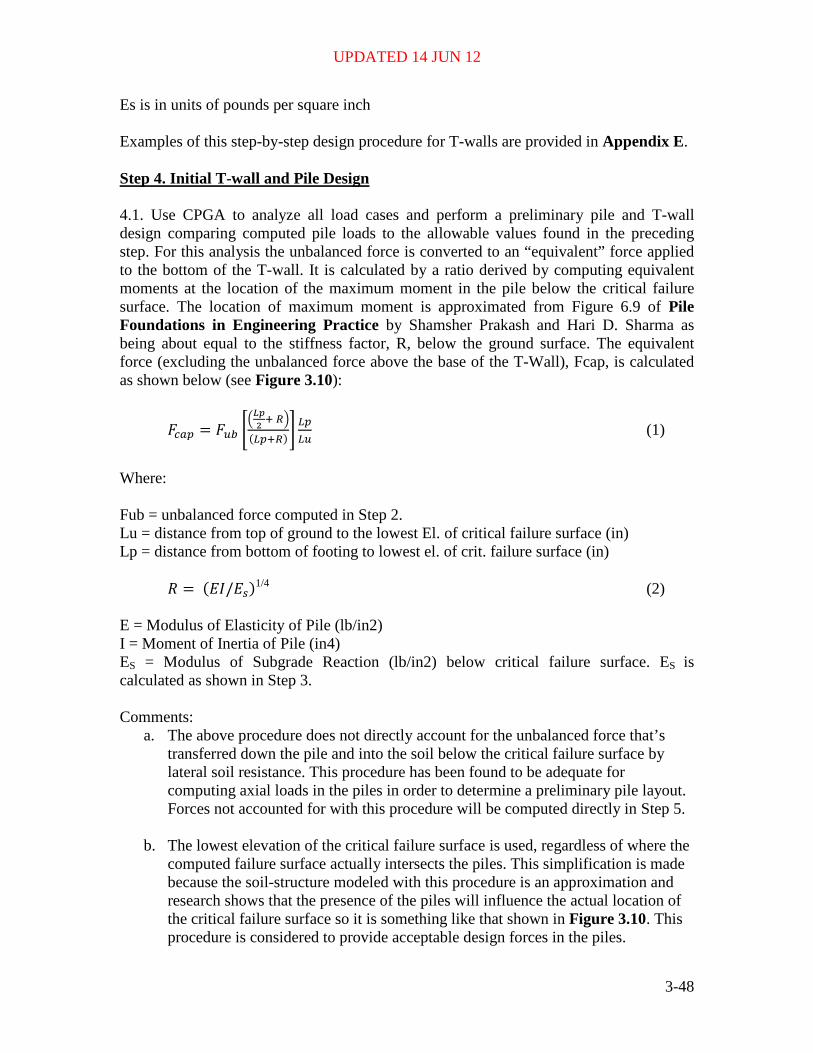
UPDATED 14 JUN 12
3-48
Es is in units of pounds per square inch
Examples of this step-by-step design procedure for T-walls are provided in Appendix E. Step 4. Initial T-wall and Pile Design 4.1. Use CPGA to analyze all load cases and perform a preliminary pile and T-wall design comparing computed pile loads to the allowable values found in the preceding step. For this analysis the unbalanced force is converted to an “equivalent” force applied to the bottom of the T-wall. It is calculated by a ratio derived by computing equivalent moments at the location of the maximum moment in the pile below the critical failure surface. The location of maximum moment is approximated from Figure 6.9 of Pile Foundations in Engineering Practice by Shamsher Prakash and Hari D. Sharma as being about equal to the stiffness factor, R, below the ground surface. The equivalent force (excluding the unbalanced force above the base of the T-Wall), Fcap, is calculated as shown below (see Figure 3.10):
𝐹𝑐𝑎𝑝 = 𝐹𝑢𝑏 ��𝐿𝑝2 + 𝑅�
(𝐿𝑝+𝑅)�𝐿𝑝𝐿𝑢
(1) Where: Fub = unbalanced force computed in Step 2. Lu = distance from top of ground to the lowest El. of critical failure surface (in) Lp = distance from bottom of footing to lowest el. of crit. failure surface (in)
𝑅 = (𝐸𝐼/𝐸𝑠)1/4 (2) E = Modulus of Elasticity of Pile (lb/in2) I = Moment of Inertia of Pile (in4) ES = Modulus of Subgrade Reaction (lb/in2) below critical failure surface. ES is calculated as shown in Step 3. Comments:
a. The above procedure does not directly account for the unbalanced force that’s transferred down the pile and into the soil below the critical failure surface by lateral soil resistance. This procedure has been found to be adequate for computing axial loads in the piles in order to determine a preliminary pile layout. Forces not accounted for with this procedure will be computed directly in Step 5.
b. The lowest elevation of the critical failure surface is used, regardless of where the
computed failure surface actually intersects the piles. This simplification is made because the soil-structure modeled with this procedure is an approximation and research shows that the presence of the piles will influence the actual location of the critical failure surface so it is something like that shown in Figure 3.10. This procedure is considered to provide acceptable design forces in the piles.

UPDATED 14 JUN 12
3-49
Figure 3.10 Unbalanced Forces.
4.2. In CPGA, the top of soil will be modeled at the ground surface, and the subgrade modulus, Es, is reduced with reduced global stability factors of safety to account for lack of support from the less stable soil mass located above the critical failure plane. For cases where the global factor of safety without piles is less than 1.0, Es is input at an R extremely low value, such as 0.00001 ksi (CPGA will not run with Es set at 0.0). For conditions where the factor of safety is between 1.0 and the target factor of safety, Es is computed by multiplying the percentage of the computed factor of safety between 1.0 and the target factor of safety by the actual estimated value of Es. For example, if the FS = 1.0, Es is input as 0.00001. If the FS = 1.2, the target factor of safety is 1.5, and the estimated value of Es below the foundation is 100 psi, Es is input at 40% of the actual estimated value, 40 psi. This accounts for the fact that with higher factors of safety the unbalanced force is a small percentage of the total force, and the soil is able to resist some amount of the lateral forces from the wall. Although Es is reduced, the full pile length is considered braced provided the FOS is above 1.0 or the sheet piling is extended

UPDATED 14 JUN 12
3-50
as stated in Step 4.4 below. One reduced value of Es is used throughout the depth of the pile. There is no distinction in values between the leading and trailing rows. For certain cases with shallow critical failure surfaces, the procedure in the previous paragraph may not match well with the Group results found in later steps. For these cases, the CPGA model may be created with the ground level set at the level of the critical failure surface and the T-wall suspended above it at the actual footing elevation. The soil modulus at the critical failure surface is used for this model. There is no reliable method to account for factors of safety greater than 1.0 with this method however. 4.3. No reductions to the subgrade modulus are required for cyclic loading. Group reductions based on pile spacing are also applicable. However, for monoliths containing battered piles, further refinement of the Es value for Step 4 calculations may not be required for several reasons:
• The horizontal component of Battered Piles provides most of the lateral resistance.
• The Es reduction used in the Step 4.2 conservatively uses the same reduced Es for trailing rows as leading rows.
• The governing load cases will be more accurately analyzed in Step 5. When used, Group reduction factors (Rg) to be applied to subgrade modulus shall be computed as shown below: Subgrade Modulus reductions are computed as follows: For loading perpendicular to the loading direction: Rga = 0.64(sa/b)0.34 ; or = 1.0 for sa/b > 3.75 Where: sa = spacing between piles perpendicular to the direction of loading (parallel to the wall face). Normally piles should be spaced no closer than 5 feet on center. b = pile diameter or width For loading parallel to the loading direction: For leading (flood side) piles: Rgbl = 0.7(sb/b)0.26 ; or = 1.0 for sb/b > 4.0 For trailing piles, the reduction factor, Rgbt is: Rgbt = 0.48(sb/b)0.38 ; or = 1.0 for sb/b > 7.0
UPDATED 14 JUN 12
3-51
Where: sb = spacing between piles parallel to the direction of loading (perpendicular to the wall face. Note: sb can be measured 5 pile diameters below the bottom of the cap, making pile rows trailing others battered in the opposite direction to normally be able to be considered as leading piles. b = pile diameter or width 4.4. Sheet piling shall be included and designed to control seepage. Sheet pile shall be designed for seepage in accordance with Section 3.4.2. When unbalanced loads exist, cutoff sheet piling shall be extended 5 feet below the critical failure plane determined in Step 2. The sheet piling shall be a PZ-22 section or equivalent, structural analysis is not required. The sheet piling curtain wall provides the added benefit of confining the soil wedge such that the pile shall be considered braced full length about both axis regardless of the stability factor of safety. 4.5 This paragraph addresses the resistance to soil flow of the failure wedge through the pile foundation. Storm surge loading on the soil beyond the relieving base width of the T-wall superstructure results in a passive loading on the foundation piles where the soil tends to push through the piles rather than an active loading where the piles tend to push through the soil. The foundation piles need to be checked for resistance to flow through, which is a function of pile spacing, magnitude of load and soil shear strength, and number of pile rows. Pile spacing perpendicular to the load should generally be limited to no more than seven times the pile diameter. To resist flow-through, the passive load capacity of the piles (Pall) is checked against the unbalanced loading. In addition, this check will define the upper limit of possible loading on the flood side row of piles and may lead to redistribution of the unbalanced load for later Group 7 analysis. The procedure for performing this check is set up to evaluate this per monolith or by pile spacing (for uniformly spaced piles) as follows:
a. Compute capacity of the flood side pile row using a basic lateral capacity:
∑ Palln∑Pult1.5
(3) Where: n = number of piles in the row perpendicular to the unbalanced load within a
monolith. Or, for monoliths with ΣPult = summation of Pult over the height Lp, as defined in Step 4.1
For single layer soil is Pult multiplied by Lp For layered soils, Pult for each layer is multiplied by the thickness of the layer and added over the height Lp
Pult = Rf(9Sub)

UPDATED 14 JUN 12
3-52
Su = soil shear strength When there are multiple soil strata between the base of the structure and the ritical failure plane being analyzed, Su shall be calculated as the weighted average of Su of each stratum above that failure plane.
B = pile width Rf = group reduction factor for pile spacing parallel to the load are as follows: For leading (flood side) piles:
Rf = 0.7(s/b)0.26 ; or = 1.0 for s/b > 4.0 For trailing piles, the reduction factor, Rf, is: Rf = 0.48(s/b)0.38 ; or = 1.0 for s/b > 7.0
Where: s = spacing between piles parallel to the loading
Figure 3.11Spacing Between Piles
No reduction is considered for the pile spacing perpendicular to the load. Group effects do not need to be considered between pile rows battered in opposite directions (battered away from each other). A trailing row staggered from a leading row may be treated as a leading row, but additional rows should be treated as trailing. The spacing between lead pile and the staggered pile (row spacing), in the direction of the load, shall be equal to or less than the column spacing of the leading piles.
b. Compute the unbalanced unit load on the piles (Fp) to check against ΣPall:
𝐹 = 𝑤𝑓𝑢𝑏𝐿𝑝 (7)
w = Monolith width. Or, for monoliths with uniformly spaced pile rows, w = the pile spacing perpendicular to the unbalanced force (st).
𝑓𝑢𝑏 = 𝐹𝑢𝑏
𝐿𝑢 (8)

UPDATED 14 JUN 12
3-53
Fub = Net unbalanced force per foot from Step 4.1 Lu and Lp as defined in Step 4.1
If layered soils exist, this check can be made by summing Pall over the length of the pile from the bottom of the wall to the lowest elevation of the critical failure surface (Lp, fig. 2) (i.e., ∑Pall) and comparing it to fub multiplied by Lp.
c. The number of piles is adequate to resist flow-through if ΣPall for the flood side
piles exceeds Fp/2. If Fp/2 exceeds ΣPall for the flood side piles, then compute ΣPall for all rows of piles. If ΣPall is less than Fp, then the pile foundation will need to be modified (decreasing transverse pile spacing and/or increasing pile rows) until this condition is met.
The flow is resisted by the full ΣPall of the floodside row and the balance distributed to all piles behind the flood side row as modified by Rf for trailing piles. Irregular pile layouts with rows that have far fewer piles than other rows should not have increased load on the pile to account for greater lateral spacing.
4.6. For an additional flow-though mechanism check, compute the ability of the soil to resist shear failure between the pile rows from the unbalanced force below the base of the T-wall, fubLp, using the following equation:
𝑓𝑢𝑏𝐿𝑏 ≤𝐴𝑝𝑆𝑢𝐹𝑆
� 2(𝑠1− 𝑏)� (9)
Where: ApSu = The area bounded by the bottom of the T-wall base, the critical failure surface, the upstream pile row and the downstream pile row multiplied by the shear strength of the soil within that area. For layered soils, the product of the area and Su for each layer is computed and added for a total ApSu. See Figure 3.12. FS = Target factor of safety used in Steps 1 and 2. st = the spacing of the piles transverse (perpendicular) to the unbalanced force b = pile width

UPDATED 14 JUN 12
3-54
Figure 3.12 Area for soil flow-through shear check.
Note: The sheet pile is conservatively neglected for this computation.

UPDATED 14 JUN 12
3-55
Figure 3.13 Ultimate Lateral Load Capacity of Short and Long Piles in Cohesionless Soils (Broms, 1964). (a) Ultimate lateral resistance of short piles in cohesionless soil
related to embedded length, (b) ultimate lateral resistance of long piles in cohesionless soil related to ultimate resistance moment.
UPDATED 14 JUN 12
3-56
Step 5. Pile Group Analysis (all loads) 5.1. To verify the preliminary CPGA design, Group 7 (Ensoft Group Version 7.0) is used to check pile loads and stresses. All loads, including the unbalanced loading, are applied to the pile foundation. Only load cases controlling deflections and pile loads in Step 4 need to be checked. It is expected that the critical load cases checked will include the unbalanced force found for loading at the SWL and the Top of Wall. 5.2. Water pressures, at rest soil pressures, concrete weight, vessel impact, etc. are applied directly to the structure. The unbalanced load is applied as uniformly distributed along the length of the bearing piles located above the critical failure plane. 5.3. For the pile group analysis, develop a Group 7 model that incorporates the water and soil loads applied directly to the wall base and stem and also include the computed unbalanced force as distributed loads acting on the piles. At this point, the pile foundation has also been adjusted as needed to resist soil flow through as required in Steps 4.5 and 4.6. The total distributed load on the piles (Fp) was defined in Step 4.5. Distribution of unbalanced loading onto the rows of piles is as follows:
• If the total ultimate capacity (nΣPult) of the flood side pile row is greater than 50% Fp, then 50% of Fp is applied to the flood side row of piles as a uniform load Critical Failure Surface Unbalanced Force, Fub Shear Area bounded by piles, Ap along each pile equal to 0.5fubst (variables are defined in Step 4.5), and the remaining 50% of Fp is divided evenly among the remaining piles.
• If the total ultimate capacity (nΣPult) of the flood side piles is less than 50% of Fp,
then the distributed load on each pile of the flood side row is set equal to Pult and the remaining amount of Fp is distributed onto the remaining piles according to the relative group reduction factors (Rf). Rf values are determined in accordance with Step 4.5 above.
The distribution of load to the piles has a degree of uncertainty. To assure that the piles are not structurally overstressed from combined axial and bending stresses, as well as shear stress, the Group analysis shall also be performed with 100% fubLp applied to the lead pile, but no more than ΣPult as described previously. Pile allowables shall be increased by a 50% overstress factor. The shear strength in the soil shall also be checked, the allowable shear capacity of the soil shall be the ultimate divided by a FOS = 2.0 (see Step 3.2; in Fig 3.5 the allowable load is 12.2 kips). 5.4. The Group analysis will yield the response of the piles to all the loads applied to the T-wall system. The Group 7 program will automatically generate the p-y curves for each soil layer in the foundation based on the strength and the soil type. Once the Group 7 run is completed, the pile shear and axial force responses are determined from the output file. These forces must be determined from the piles local coordinate system. The pile group reduction factors shown previously in Step 4.4 are the same as used by the Group 7 program, so the program can be left to compute them automatically.
UPDATED 14 JUN 12
3-57
5.5. This analysis can be made using partial p-y springs to support the piles in the volume of the critical failure mass similar to reductions for the CPGA method found in step 4.2. The partial p-y curves are interpolated on the basis of the unreinforced factor of safety determined in Step 2. If the unreinforced safety factor is less than or equal to 1 then the p-y curves inside the failure circle are zeroed out so that the soil in the failure mass offers no resistance to pile movement. If the unreinforced factor of safety is between 1 and 1.5the target factor of safety the p-y springs are partially activated based on the percentage that the unreinforced safety factor is between 1 and 1.5 the target factor of safety. Thus, if the unreinforced factor of safety is 1.25 and the target is 1.5, the p-y springs are 50% activated. Fifty percent activation is achieved by reducing the shear strengths in the Group 7 soil layers by 50%. 5.6. Perform structural design checks of the piles and T-wall to ensure that selected components are not overstressed and displacement criteria are met. Include stress check for the 100% fubLp applied to the lead pile as stipulated in Step 5.3. 5.7. Compare the allowable axial and shear capacity loads from Step 3 to the pile responses. If the axial and shear forces in any pile exceed the allowable pile loads the piles are considered over capacity and the pile design must be reconfigured. 3.5 LEVEE TIE-INS AND OVERTOPPING SCOUR PROTECTION For a structural alternative on utility crossings, refer to Section 5.0 Structures details. The tie-in details for T-walls and L-walls that terminate into a levee section must follow the latest guidance (Section 5.0 Structures). Scour protection on the flood side and protected side of wall should follow the latest guidance presented in Section 1.0 Hydraulics and Section 5.0 Structures. 3.6 UTILITY CROSSING These guidelines have been prepared after detailed review, analysis, and practical application of various methods and the performance of crossings subjected to Hurricane Katrina. These guidelines describe the only acceptable methods for pipeline crossings of levees which qualify as part of a Federal Hurricane Protection Levee System. The following is a brief description of the acceptable methods for crossing hurricane protection levees. In general, only four methods are allowed; directional drilling, structural elevated support, T-wall construction (utility passes through structure), or direct contact method. Exceptions to these four alternatives (such as buried jack-in-place I-walls with sleeves) may be allowed depending on site specific conditions. For typical details for utility crossings at levees and floodwalls, see Section 12 Typical Drawings and Details. 3.6.1 Directional Dr illing Directional drilling consists of inserting the pipeline underground well below the hurricane protection system levee. This can be accomplished before, during or after

UPDATED 14 JUN 12
3-58
construction of a project. The required depth is a factor of local soil conditions, design elevation, and anticipated long-term consolidation and settlement of foundation soils. Pipelines must also be designed to emerge from underground at a safe distance from the limits of the project. Currently utility crossings using this method are reviewed individually upon submittal to MVN of a proposed design by the utility owner. General criteria for installing pipelines by near surface directional drilling under levees are discussed in Section 8-8 Installation Requirements of EM 1110-2-1913 (30 April 2000). 3.6.1.1 Layout The pipeline entry or exit point, when located on the protected side of a levee, should be set back sufficiently from the protected side toe of the levee such that (a) the pipeline reaches its horizontal level (maximum depth), and/or (b) the pipeline contacts the substratum sands or some other significant horizon, at least 300 ft from the protected side of the levee toe. When the pipeline entry and/or exit point are located on the flood side of protection, the entry and/or exit points should be positioned such that the pipeline is (a) landward of the projected 50-year bank line migration, (b) at least 20 ft riverward of the levee stability control line based on the applicable project FOS, and (c) at least 10 ft landward of the existing revetment. The purpose of this restriction is to avoid placing a potential source of seepage close to the levee stability control line, and also to help assure the pipeline retains adequate cover. 3.6.1.2 Design Cr iter ia The basic relationship for hydraulic fracture pressure (Pf) for undrained conditions is a function of the in-situ minimum principal total stress, σ3, i.e. the sum of the overburden pressure plus the undrained shear strength (su) at the point of rupture. (Note: This does not include any side forces on the soil column.) [1] Pf = σ3 + su Undrained conditions assume no flow of the borehole fluid into the soil formation. For bores in south Louisiana soils employing a bentonite drilling fluid with good wall cake, it is reasonable to assume that undrained conditions exist. The downhole or borehole mud pressure is composed of hydrostatic pressure (position head) and circulation pressure. The minimum FOS against hydraulic fracture shall be 1.5. FOS is defined here as the ratio of the existing overburden pressure (hydraulic fracture pressure Pf) to the downhole mud pressure (Pm). [2] FOS = (σ3 + su)/Pm

UPDATED 14 JUN 12
3-59
3.6.1.3 Guidelines for Permit Review This list of general criteria is not intended to be all inclusive. Additional design details may be considered on a case-by-case basis. It is recommended that applicants for directional drilling permits and their designers schedule a meeting with the Corps of Engineers in the early stages of planning to discuss how these guidelines apply to their proposed work. Applications for directional drilling permits beneath levees/floodwalls will be evaluated primarily for their affect upon the integrity of the flood protection system. Directional drilling will not be allowed in congested urban areas. Exceptions may be considered where population density and land use allow adequate room for expeditious replacement of the flood protection should hydraulic fracture or other damage occur.
• Applications for directional drilling permits shall furnish engineering evaluations and computations addressing all the issues presented here and provide specific measures of problem avoidance, dimensions, distances, pressures, weights, and all other pertinent data regarding drilling operations.
• Applications for directional drilling permits shall address the ratio of drill diameter versus installed pipe diameter and how seepage through the annular space will be avoided. The applicant should not over-ream the final drill hole, as seepage will potentially result.
• Applications for directional drilling permits shall include details demonstrating that the drilling operation will not create a hydraulic fracture of the foundation soil beneath and near the levee. Designers shall provide calculations confirming that the downhole mud pressure during the drilling operation results in a minimum FOS equal to 1.5 against hydraulic fracture of the levee foundation within 300 ft of the levee toe. These calculations shall bear the stamp of a registered civil engineer.
• Applications shall include a plan for mitigating the potential problem of hydrolock in the borehole due to unanticipated clogging of the return fluid, and the potential loss of drilling fluid return to the surface as a result of other unforeseen downhole problems.
3.6.1.4 Drilling Operations The pilot hole cutter head must not be advanced beyond/ahead of the wash pipe more than a distance such that return flow would be lost. Also, the wash pipe ID should be sufficiently greater than the OD (cutting diameter) of the pilot cutter head such that return flow is enhanced. Applications for directional drilling permits shall directly address the methodology to be employed in the effort to keep the return of flow up the drill hole during the entire operation. These requirements are to assure that blockage of the annular space between the wash pipe and drill pipe and associated pressure build-up do not occur.

UPDATED 14 JUN 12
3-60
• Drilling mud shall be of sufficient noncolloidal lubricating admixtures to (a) assure complete suspension and removal of sands and other "solids" cuttings/ materials, and (b) provide adequate lubrication to minimize bridging by cohesive materials thereby facilitating surface returns flow along the annular space.
• The fly cutter used in the prereamer run shall have an OD (cutting diameter) sufficiently greater than the OD of the production pipe such that the whole diameter remains adequate to minimize hang-ups of the production run and thereby, associated stresses on surrounding soils. Applications for directional drilling permits shall also address the increased seepage potential caused by this annular space developed during drilling.
• Prereamer runs shall be a continuous operation at least through the down-slope and up-slope cutting sections to prevent undue stress on the surrounding soils during re-start operations.
• Shut-off capability in the production pipeline should be provided to immediately cutoff flow through the pipeline should leakage occur.
• Positive seepage cutoff or control and impacts of future levee settlements on the pipeline must be addressed and supported approved engineering analyses.
3.6.1.5 Construction Schedule All work on, around, and under levees or flood protection is season sensitive. Some levee/floodwall systems serve as hurricane protection, some are for river flooding, and still others are for a combination of these. There may be a season during which the sensitivity of the flood control system will not allow work. Designers should make every effort to discern the alternate methods of providing interim flood protection which may be required during each phase of work. 3.6.1.6 Monitor ing and Liability for Damages
• Work shall be monitored by Corps representatives. Applicants shall inform the MVN Operations Division permits representative 36 hours in advance of beginning of installation. Drilling beneath levees shall begin during the daylight hours Monday through Friday to facilitate monitoring. The applicant must estimate his work schedule and inform the Corps so that representatives may have adequate time to study the site.
• The owner/applicant shall be liable for any damage to the levee resulting from drilling operations. Damage is defined as drilling fluid returns to the surface inside the levee cross-section. The owner/applicant shall replace and/or repair the damaged levee to the Corps of Engineers’ satisfaction. Repair may include total replacement of the levee and installation of a grout curtain to the depth of the pipe. Repairs shall be performed in an expedited fashion to Corps specifications.
• Applications for directional drilling permits shall include a plan to replace the flood protection should damage occur. A typical sketch of this repair is shown for information only as Figure 3.14.

UPDATED 14 JUN 12
3-61
Figure 3.14 Sample Detail of Repair of Directional Dr illing Damage to Levee
UPDATED 14 JUN 12
3-62
3.6.2 Structural Elevated Suppor t This method consists of a structure supporting the pipeline using pile bents and framing that elevates the pipeline a minimum of 15 ft above the authorized design grade and section. This method must be engineered for structural integrity, capacity and clearance for site-specific conditions. Some limitations are listed below:
• The low chord of the pipeline truss must be a minimum of 15 ft above the design section.
• If the truss carries power, the minimum above the design section increases to 18 ft for voltages up to 0.75Kv.
• Piles must be at least 10 ft from theoretical levee toe. 3.6.3 T-wall Construction This method focuses on passing the pipeline through T-wall construction with the existing pipeline remaining in place. This method consists of constructing a pile-founded, inverted T-wall flanked by a sheet-pile wall on either side to provide seepage reduction measures for flood protection. The T-wall is built around the in-situ pipeline. This will require that the pipeline be supported on pile bents for a distance on either side the T-wall to be determined by the pipeline owner. The pipeline can penetrate either the T-wall or its attendant cutoff wall depending on specific site conditions and pipeline geometry, but the T-wall is not allowed to support the pipeline. Again, existing site conditions must be taken into account when using this alternative. 3.6.4 Direct Contact Method
1. The pipeline owner has the option of placing the pipeline in direct contact with the surface of the newly constructed hurricane levee. This will require the owner to relocate the pipeline when the levee is raised because of settlement of change in design grade. The owners must also determine that the pipeline can sustain the settlement and resulting stresses that are associated with it. Slope pavement or other approved methods must be installed over pipeline throughout transition area.
2. A modification to the direct contact method is to place pile supports under the pipeline to mitigate the settlement problem. The supported pipe maintains its position as the levee settles beneath it without requiring removal and replacement as additional levee lifts are placed beneath the elevated pipeline. Erosion protection is required beneath the pipeline and around the support piles. Erosion protection will need to be removed and replaced after each levee lift. Since the pile supports are placed in the levee seepage reduction measure is required in the form of a sheet pile.
3. After the final levee lift is conducted and completed the pile supports are removed by cutting them off below the levee surface and the pipeline is placed in
UPDATED 14 JUN 12
3-63
direct contact with the levee and protected with earthen cover and erosion protection. Some limitations are listed below:
• Supports are allowed into the levee cross-section provided a sheetpile is
constructed within the levee section. The vertical supports shall not be located within 15 ft of the levee C/L. The sheetpile must not only provide seepage reduction but also be stable in the event up to 6 ft of scour or erosion could take place. Sheetpile must extend at least 30 ft on either side of pipeline
• Settlement of pile bents within levee section must be addressed. • Slope pavement over crown and on both protected side and flood side
slopes with adequate joints to handle differential settlement must be installed above the pipeline and to a distance at least 10 ft past sheetpile. It is suggested that any pile be isolated from slope pavement. Settlement expectation shall be considered while designing scour protection to ensure that sheetpile or pipeline is embedded sufficiently to avoid contact with slope pavement.
• Access along the levees is required on the levee crown and/or by a road on the landside along the berm or at the levee toe. Pipeline crossings must be so designed to insure continuous access during its construction and adequate cover to provide for access over the completed crossing. The cover must be designed for HS20-44 loading over the line for the life of the crossing. (The HS20-44 loading is for tractor trailers and semi-trailers (including dump trucks) of variable axle spacing. This loading covers a gross truck weight of 20 tons and a rear axle weight of 16 tons).
• Stability analysis and settlement analysis will/may be required for pipeline crossings in some instances, particularly those involving the addition of a substantial amount of fill including road surfacing or the levee section and for levees that require future levee enlargements. The pipeline owner will need to contact the Corps for the slope stability FOS and load cases.
Other methods have been used in the past with unsuccessful results and are therefore not acceptable methods for pipelines crossing hurricane levees in this project area. In particular, the New Orleans District used the encasement method on an experimental basis in a hurricane protection levee on the west bank of Jefferson Parish. The first time a tropical event was experienced, the bentonite washed out, causing a significant seepage problem. In addition, pipelines passing through I-walls are not allowed.
UPDATED 14 JUN 12
3-64
3.7 BORROW SPECIFICATIONS Material, quality control, and construction specifications for levees and embankments is fully detailed in the New Orleans District’s Standard Specification 31 24 00.00 12. Parts of that specification are reproduced here for easy reference by engineers engaged in design work for the HSDRRS. 3.7.1 Mater ial Embankments shall be constructed of earth materials naturally occurring or Contractor blended. Materials that are classified in accordance with ASTM D 2487 as CL or CH with less than 35% sand content are suitable for use as embankment fill. Materials classified as ML are suitable if blended to produce a material that classifies as CH or CL according to ASTM D 2487. All fill materials shall be free from masses of organic matter, sticks, branches, roots, and other debris including hazardous and regulated solid wastes. As earth from the designated excavation areas may contain excessive amounts of wood, isolated pieces of wood will not be considered objectionable in the embankment provided their length does not exceed 1 foot, their cross-sectional area is less than 4 square inches, and they are distributed throughout the fill. Not more than 1% (by volume) of objectionable material shall be contained in the earth material placed in each cubic yard of the levee section. Pockets and/or zones of wood shall not be placed in the embankment. Materials placed in the section must be at or above the Plasticity Index of 10. As a precaution, Contractors are required to notify the Contracting Officer whenever the in-place Plasticity Index of the material is 15 or less. Materials placed in the section must be at or below organic content of 9% by weight, as determined by ASTM D 2974, Method C. 3.7.2 Quality Control
Control Testing:
The Contractor shall perform all control testing such as soil classification, moisture content, control compaction curves, organic content, sand content and in-place density. The results of all tests shall be reported to the Contracting Officer's representative within 24 hours of sampling, except for the organic test results, which shall be reported within 48 hours of sampling. To ensure contract compliance, the Contractor shall submit the results of the control compaction curves, in-place density tests, moisture content tests, one-point compaction tests, sand content tests, and organic content tests to the Contracting Officer's Representative so they can be faxed to Chief of Geotechnical Branch at 504-862-2987. The Contractor's QC test results of in-place compaction, soil classification, moisture content, sand content, organic content, and compaction curves shall be provided to Engineering Division, Geotechnical Branch, on a regular basis throughout the contract, but no later than 5 days of receiving results. Testing shall be
UPDATED 14 JUN 12
3-65
performed by a Government-approved testing agency, organization or field laboratory including on-site testing labs operated by QC personnel. Criteria used for obtaining Government approval shall be in accordance with ASTM E 329. Microwave testing for moisture control in accordance with ASTM D 4643 is allowed in the Contractor's field laboratory. No additional payment will be made for control testing required in this paragraph. All costs in connection therewith shall be included in the contract unit price for "Embankment, Compacted Fill". Documentation of sampling locations for the following tests shall be clearly defined by levee station and offset and also by lift number or elevation. As a minimum, the following tests are required:
1. Soil Classification Tests. Determination of soil classification shall be in accordance
with ASTM D 2487. Atterberg Limits Test required for soil classification shall be performed in accordance with ASTM D 4318. One Atterberg test shall be obtained from the sample material used for each control compaction curve and one shall be obtained from the sample material used for each in-place density test. If the Nuclear Method is used, the material to be tested shall come from within a radius of 12 inches of the center of the in-place density test site. The soil classification obtained from in-place density tests will serve as the basis for determining the applicable control compaction curves. In addition, classification tests shall be performed on uncompacted fill at a minimum frequency of one test per 1,000 linear feet per lift placed in the levee section.
2. Control Compaction Curves - Compacted Fills. Control compaction curves shall be established in accordance with ASTM D 698 (Standard Proctor Density Tests). Two control compaction curves will be required for each type of material from each source. Where construction operations result in blending of several types of material prior to or during fill placement within the embankment design sections, two control compaction curves will be required for each resulting blend of material and will be utilized in lieu of those required for the "unblended materials". The average of the two tests shall be the controlling optimum moisture content and maximum density.
3. In-Place Density Tests - In-place density tests for compacted fill material shall be
made in accordance with ASTM D 2922 (Nuclear Method) or ASTM D 1556 and shall be made at a minimum frequency of one density test per lift per [1500] cubic yards of compacted fill placed in the levee per lift, but not less than one density test per [500] feet per lift. At least one test shall be performed in any shift that compacted fill is placed. A lift on any one side of the existing embankment will be considered one lift. The location of the test shall be representative of the area being tested or as directed by the Contracting Officer. For each in-place density test, the Contractor shall determine the percentage of ASTM D 698 maximum dry density and the deviation from optimum water content in percentage points (plus or minus), using the control compaction curves for the same type of material. The appropriate control compaction curve shall be selected by using the one-point compaction test when available or visual soil classification and soil classification test.
If the Nuclear Method is selected for field density testing, the dry density shall be determined by using the value of wet density reported by the nuclear density

UPDATED 14 JUN 12
3-66
equipment and the value of moisture content obtained from ASTM D 2216 or ASTM D 4643. The Contractor shall not use the value of dry density reported by the nuclear density equipment.
The Sand-Cone Method shall be used to confirm the accuracy of the Nuclear Method. This can be accomplished by performing an initial comparison test of the two methods at the start of construction. If the Nuclear Method wet density is within 3 percent of the Sand Cone Method, no correction of the Nuclear Method wet density will be required and the testing may continue with the Nuclear Method. The Nuclear Method wet density shall be verified throughout the project at a rate of one Sand-Cone test for every ten nuclear tests thereafter. If the variance at any time exceeds 3 percent, a correction factor will be required to be determined prior to any further testing. For comparison purposes, the nuclear and sand-cone wet densities should represent the same layer thickness within the testing area selected. When a nuclear density result is in doubt, the sand-cone density test shall be used for acceptance. The correction factor shall be determined by conducting ten comparison tests (five ASTM D 2922 and five ASTM D 1556) and calculating the average difference (correction) for each soil type encountered. The developed correction shall be used for adjusting the nuclear wet density readings. The results of the in-place density, moisture content, and one point compaction test shall be reported to the Contracting Officer's representative by the end of the working day following the in-place density test.
4. One-Point Compaction Test. As a minimum, the Contractor shall perform a one-point compaction test at every fifth (5th) in-place density test. If the Nuclear Method is used for in-place testing, every other one-point compaction test shall be performed at the sand-cone verification test location on a sample from the same material location as the in-place density test in accordance with ASTM D 698. The material shall be compacted at the same water content as the field test if it is estimated to be on the dry side of optimum laboratory water content. If the field water content is estimated to be above the optimum water content, the corresponding lab sample shall be dried to an estimated water content which is not more than 3 percent dry of the actual optimum water content. The water content/dry density point on the one-point compaction test shall be plotted on the family of curves for the same soil type from the same borrow source. The compaction control curve is estimated by projecting a curve that is parallel to the adjacent compaction curves. The optimum water content and maximum dry density shall be estimated from the control compaction curve. If the laboratory data plots outside of the available family of compaction curves, the Contractor shall perform a complete compaction test in accordance with ASTM D 698.
5. Moisture Content Tests. Moisture content tests at each density test location shall be
taken to assure compliance with requirements for fill placement within the design sections as specified in paragraph "Moisture Control" of the New Orleans District’s Standard Specification. Determination of moisture content shall be performed in accordance with ASTM D 2216 or ASTM D 4643. Determination of moisture content shall not be performed in accordance with ASTM D 3017 (Nuclear Method).

UPDATED 14 JUN 12
3-67
6. In-Place Organic Content Tests. Organic content tests shall be taken at each in-
place density test location. In addition, organic content tests shall be performed on uncompacted fill at the same locations as the soil classification tests as specified in paragraph New Orleans District’s Standard Specification. Limits of organic content are specified in paragraph MATERIALS. Determination of organic content shall be performed in accordance with ASTM D 2974, Method C.
7. Sand Content Tests. One sand content test shall be obtained from the sample
material used for each control compaction curve and one shall be obtained from the sample material used for each in-place density test. In addition, sand content tests shall be performed on uncompacted fill at the same locations as the soil classification tests as specified in New Orleans District’s Standard Specification. Limits of sand content are specified in paragraph MATERIALS. Determination of sand content shall be in accordance with ASTM D 1140
3.7.3 Construction Compacted fill shall not be placed in water. The materials for compacted fill shall be placed or spread in layers, the first or bottom layer and the last two layers not more than 6 inches in thickness and all layers between the first and the last two layers not more than 12 inches in thickness prior to compaction except the first layer on top of a geotextile shall be 15 inches, plus or minus 3 inch tolerance, as specified in Section 31 05 19.03 12 GEOTEXTILE SEPARATOR UNDER LEVEE CROWNS, ROADS, OR RAMPS. Layers shall be started full out to the slope stakes and shall be carried substantially horizontal and parallel to the levee C/L with sufficient crown or slope to provide satisfactory drainage during construction. Areas on which geotextile is to be placed shall be dressed out and leveled to the grade indicated on the drawings. When placing fill on the geotextile, mechanical equipment shall not be allowed to come in contact with the geotextile in any way.