Embed Size (px)
Citation preview
Ashish Chopra ([email protected]); +91 22 3982 5424
Siddharth Vora ([email protected]); +91 22 3982 5585
12 January 2015
Update | Sector: Technology
Tech Mahindra CMP: INR2,680 TP: INR3,100 (+16%) Buy
Acquires Sofgen holdings Limited (SOFGEN) Access to BFSI customer base key rationale; EPS-neutral
Acquires SOFGEN - Implementer of banking and wealth management software TECHM signed an agreement to acquire100% stake in Sofgen holdings Ltd, a niche consulting and services company specializing in Private Wealth, commercial and retail banking solutions. The consideration is USD30m, one-third of which is in the form of earn-outs to be paid after two years.
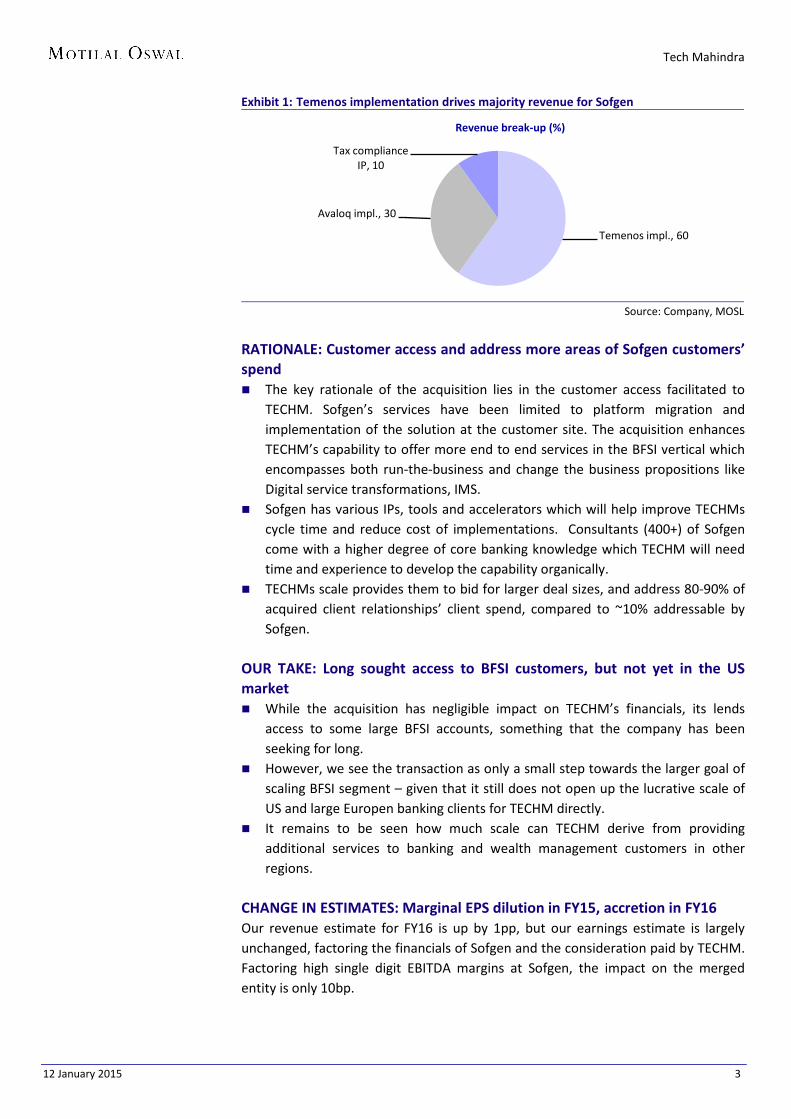
Acquisition adds ~USD45m to FY16 revenues, single digit margin Sofgen’s expected revenue this year is USD45m and has EBITDA margin in high single digits. The company has grown its top line in mid single digits in the past couple of years. Sofgen revenues comprise of Temenos implementations (60%), Avaloq implementations (30%) and a tax compliance reporting platform (10%). Majority of these implementations are in Middle East, Africa and Europe.
Rationale: Access to tier-I Banking and wealth management customers The key rationale of the acquisition lies in the customer access facilitated to TECHM. Sofgen’s services have been limited to platform migration and implementation of the solution at the customer site. The acquisition enhances TECHM’s capability to offer more end to end services in the BFSI vertical which encompasses both run-the-business and change the business propositions like Digital service transformations, IMS.
Our take: Long sought access to BFSI customers, but not yet in the US market While the acquisition has negligible impact on TECHM’s financials, its lends access to some large BFSI accounts, something that the company has been seeking for long. However, we see the transaction as only a small step towards the larger goal of scaling BFSI segment – given that it still does not open up the lucrative scale of US and large Europen banking clients for TECHM directly. It remains to be seen how much scale TECHM can derive from providing additional services to banking and wealth management customers in other regions.
Valuation and view The acquisition has 1% impact on top-line and negligible impact on TECHM’s earnings. We expect TECHM to grow its USD revenue at a CAGR of 20.7% over FY15-17 and EPS at a CAGR of 21.9% during this period. At 15.5x FY16E EPS, the stock is above its 5-year average, justifiably given the improvement in revenue growth and margins, following merger with Satyam and increasing irrelevance of BT. Our Target Price of INR3,100 discounts FY17E EPS by 15x, following expectation of sustained above-industry growth over the medium term. Maintain Buy.
BSE Sensex S&P CNX 27,458 8,285
Stock Info Bloomberg TECHM IN
Equity Shares (m) 240.0
52-Week Range (INR) 2,741/1,678
1, 6, 12 Rel. Per (%) 6/21/14
M.Cap. (INR b) 643.2
M.Cap. (USD b) 10.3
Financial Snapshot (INR b) Y/E Mar 2015E 2016E 2017E
Sales 229.0 293.4 338.2
EBITDA 44.3 57.2 65.2
Adj. PAT 30.3 38.3 45.0
Adj. EPS (INR) 137.0 172.9 203.4
EPS Gr. (%) 13.2 26.2 17.6
RoE (%) 28.6 28.4 26.9
RoCE (%) 29.8 31.8 30.3
Payout (%) 16.1 17.4 17.2
P/E (x) 19.6 15.5 13.2
EV/EBITDA (x) 12.4 9.4 7.8
Shareholding pattern (%)
As on Dec-14 Sep-14 Dec-13 Promoter 36.0 36.2 36.5
DII 10.6 10.8 15.1
FII 39.6 39.1 32.6 Others 13.7 14.0 15.8
FII Includes depository receipts
Stock Performance (1-year)
1,600
1,900
2,200
2,500
2,800
Jan-
14
Apr-
14
Jul-1
4
Oct
-14
Jan-
15
Tech MahindraSensex - Rebased
Investors are advised to refer through disclosures made at the end of the Research Report.
Tech Mahindra
12 January 2015 2
EVENT: Acquires Sofgen holdings Ltd to expand its Core Banking Expertise TECHM signed a definitive agreement to acquire100% stake in Sofgen holdings
Ltd, a niche consulting and services company specializing in Private Wealth, commercial and retail banking solutions
Financial closure is expected in 4QFY15 post the receipt of regulatory approvals. Sofgen will continue to operate as an independent entity after the acquisition CONSIDERATION: ~USD30m EV @ EV/EBITDA of 7x, 0.7x Sales TECHM will acquire 100% of Sofgen for a sub-USD30m total payout, 2/3rd of the
consideration will be paid upfront and 1/3rd is based on the earn outs over the next two years.
Earn outs will be computed on the base of revenue and EBITDA growth of the company.
Currently Sofgen is expected to do USD45m in revenues with high single digit EBITDA margins.
Sofgen has USD4-5m of debt on its balance sheet, included in the consideration. Rest of the consideration will go to the existing shareholders which is a mix of senior management and some private investors.
Given one-third of the consideration is in the form of earn-outs over next two years, Sofgen will continue to operate as an independent entity.
ABOUT SOFGEN: ~USD45m CY14E revenues, high single digit EBITDA margin The company has 450+ employees with 20+ Tier1 client relationships Sofgen revenues comprise of Temenos implementations (60%), Avaloq
implementations (30%) and a tax compliance reporting platform (10%). Temenos has been the largest selling core banking solution worldwide in the
retail and commercial banking space. Sofgen has been a Temenos partner for years.
Sofgen has the second largest pool of Avaloq consultants in the world, which is one of the leading wealth management platforms used by Tier-I wealth managers worldwide.
The tax compliance platform provided by Sofgen is used by a number of wealth managers in Europe to provide tax compliance reporting to individual account holders, primarily as a service which is a regulatory mandate in many parts of Europe.
Sofgen’s client base is spread across Europe, Asia and APAC; which includes number of leading commercial banks, wealth managers and global franchises.
Top 5 clients contribute 30% of revenues and Top 10 clients contribute 50% of revenues
Tech Mahindra
12 January 2015 3
Exhibit 1: Temenos implementation drives majority revenue for Sofgen
Source: Company, MOSL
RATIONALE: Customer access and address more areas of Sofgen customers’ spend The key rationale of the acquisition lies in the customer access facilitated to
TECHM. Sofgen’s services have been limited to platform migration and implementation of the solution at the customer site. The acquisition enhances TECHM’s capability to offer more end to end services in the BFSI vertical which encompasses both run-the-business and change the business propositions like Digital service transformations, IMS.
Sofgen has various IPs, tools and accelerators which will help improve TECHMs cycle time and reduce cost of implementations. Consultants (400+) of Sofgen come with a higher degree of core banking knowledge which TECHM will need time and experience to develop the capability organically.
TECHMs scale provides them to bid for larger deal sizes, and address 80-90% of acquired client relationships’ client spend, compared to ~10% addressable by Sofgen.
OUR TAKE: Long sought access to BFSI customers, but not yet in the US market While the acquisition has negligible impact on TECHM’s financials, its lends
access to some large BFSI accounts, something that the company has been seeking for long.
However, we see the transaction as only a small step towards the larger goal of scaling BFSI segment – given that it still does not open up the lucrative scale of US and large Europen banking clients for TECHM directly.
It remains to be seen how much scale can TECHM derive from providing additional services to banking and wealth management customers in other regions.
CHANGE IN ESTIMATES: Marginal EPS dilution in FY15, accretion in FY16 Our revenue estimate for FY16 is up by 1pp, but our earnings estimate is largely unchanged, factoring the financials of Sofgen and the consideration paid by TECHM. Factoring high single digit EBITDA margins at Sofgen, the impact on the merged entity is only 10bp.
Temenos impl., 60
Avaloq impl., 30
Tax compliance IP, 10
Revenue break-up (%)
Tech Mahindra
12 January 2015 4
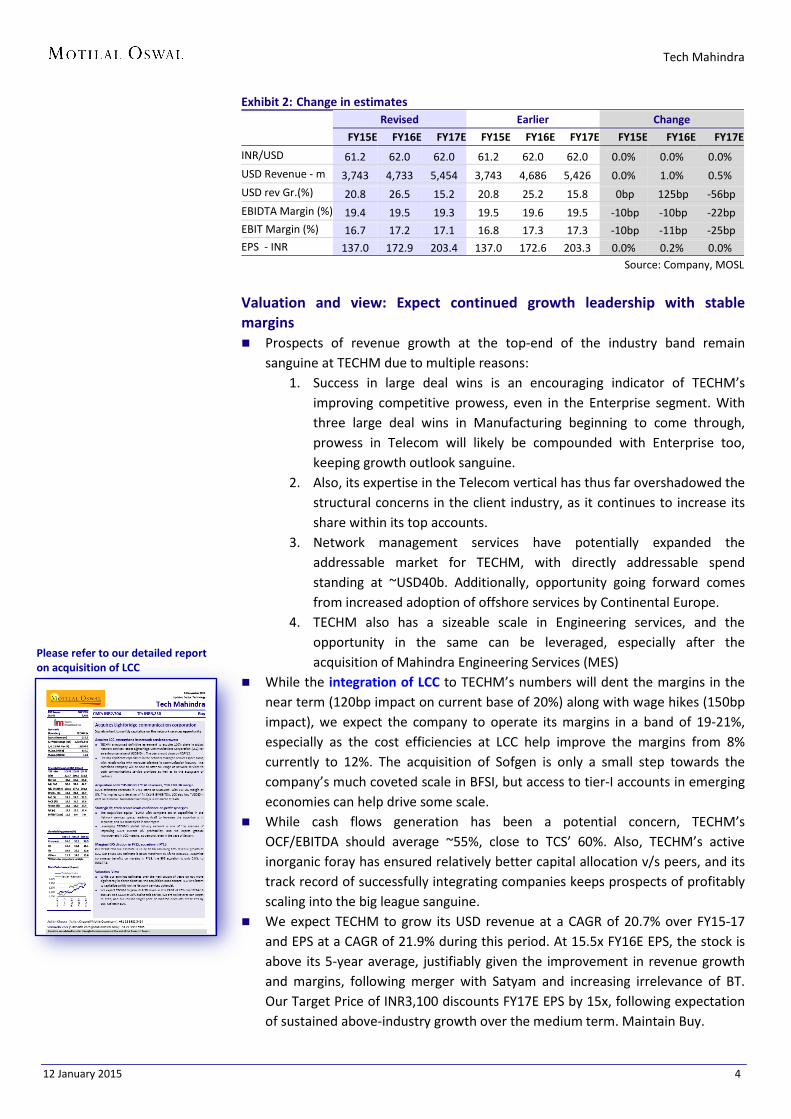
Exhibit 2: Change in estimates Revised Earlier Change
FY15E FY16E FY17E FY15E FY16E FY17E FY15E FY16E FY17E
INR/USD 61.2 62.0 62.0 61.2 62.0 62.0 0.0% 0.0% 0.0% USD Revenue - m 3,743 4,733 5,454 3,743 4,686 5,426 0.0% 1.0% 0.5% USD rev Gr.(%) 20.8 26.5 15.2 20.8 25.2 15.8 0bp 125bp -56bp EBIDTA Margin (%) 19.4 19.5 19.3 19.5 19.6 19.5 -10bp -10bp -22bp EBIT Margin (%) 16.7 17.2 17.1 16.8 17.3 17.3 -10bp -11bp -25bp EPS - INR 137.0 172.9 203.4 137.0 172.6 203.3 0.0% 0.2% 0.0%
Source: Company, MOSL
Valuation and view: Expect continued growth leadership with stable margins Prospects of revenue growth at the top-end of the industry band remain
sanguine at TECHM due to multiple reasons: 1. Success in large deal wins is an encouraging indicator of TECHM’s
improving competitive prowess, even in the Enterprise segment. With three large deal wins in Manufacturing beginning to come through, prowess in Telecom will likely be compounded with Enterprise too, keeping growth outlook sanguine.
2. Also, its expertise in the Telecom vertical has thus far overshadowed the structural concerns in the client industry, as it continues to increase its share within its top accounts.
3. Network management services have potentially expanded the addressable market for TECHM, with directly addressable spend standing at ~USD40b. Additionally, opportunity going forward comes from increased adoption of offshore services by Continental Europe.
4. TECHM also has a sizeable scale in Engineering services, and the opportunity in the same can be leveraged, especially after the acquisition of Mahindra Engineering Services (MES)
While the integration of LCC to TECHM’s numbers will dent the margins in the near term (120bp impact on current base of 20%) along with wage hikes (150bp impact), we expect the company to operate its margins in a band of 19-21%, especially as the cost efficiencies at LCC help improve the margins from 8% currently to 12%. The acquisition of Sofgen is only a small step towards the company’s much coveted scale in BFSI, but access to tier-I accounts in emerging economies can help drive some scale.
While cash flows generation has been a potential concern, TECHM’s OCF/EBITDA should average ~55%, close to TCS’ 60%. Also, TECHM’s active inorganic foray has ensured relatively better capital allocation v/s peers, and its track record of successfully integrating companies keeps prospects of profitably scaling into the big league sanguine.
We expect TECHM to grow its USD revenue at a CAGR of 20.7% over FY15-17 and EPS at a CAGR of 21.9% during this period. At 15.5x FY16E EPS, the stock is above its 5-year average, justifiably given the improvement in revenue growth and margins, following merger with Satyam and increasing irrelevance of BT. Our Target Price of INR3,100 discounts FY17E EPS by 15x, following expectation of sustained above-industry growth over the medium term. Maintain Buy.
Please refer to our detailed report on acquisition of LCC
Tech Mahindra
12 January 2015 5
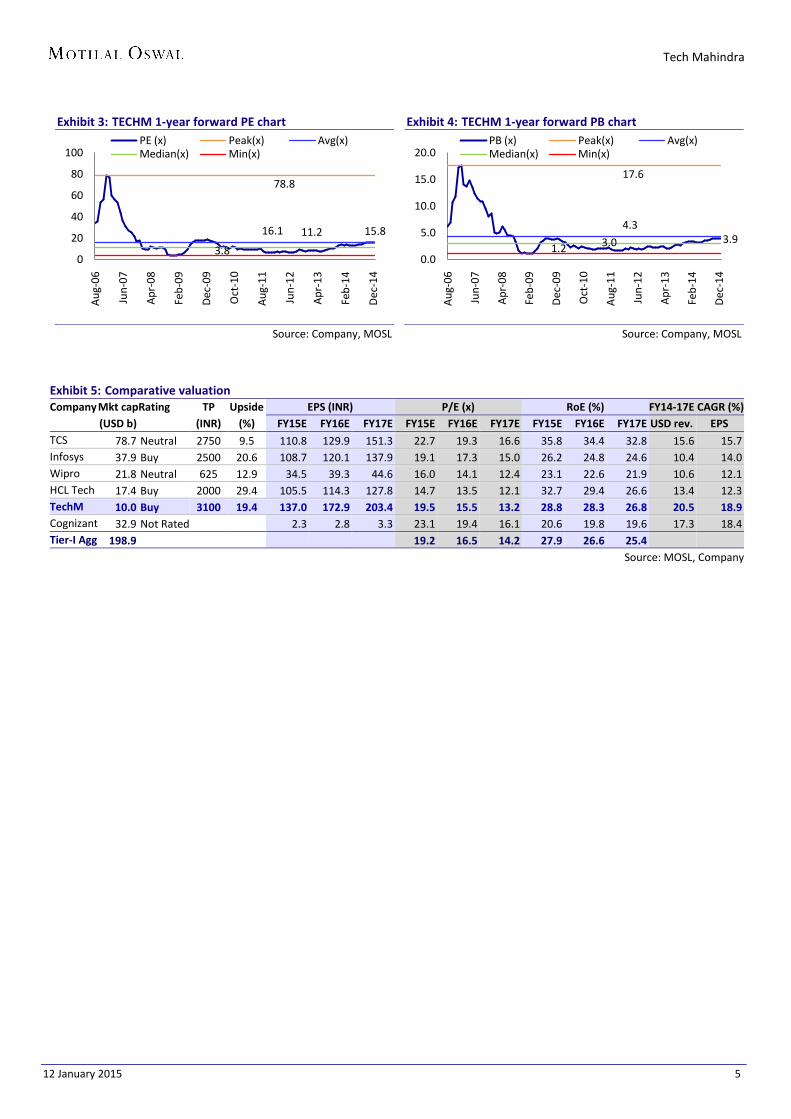
Exhibit 3: TECHM 1-year forward PE chart
Source: Company, MOSL
Exhibit 4: TECHM 1-year forward PB chart
Source: Company, MOSL
Exhibit 5: Comparative valuation Company Mkt cap Rating TP Upside EPS (INR) P/E (x) RoE (%) FY14-17E CAGR (%) (USD b)
(INR) (%) FY15E FY16E FY17E FY15E FY16E FY17E FY15E FY16E FY17E USD rev. EPS
TCS 78.7 Neutral 2750 9.5 110.8 129.9 151.3 22.7 19.3 16.6 35.8 34.4 32.8 15.6 15.7 Infosys 37.9 Buy 2500 20.6 108.7 120.1 137.9 19.1 17.3 15.0 26.2 24.8 24.6 10.4 14.0 Wipro 21.8 Neutral 625 12.9 34.5 39.3 44.6 16.0 14.1 12.4 23.1 22.6 21.9 10.6 12.1 HCL Tech 17.4 Buy 2000 29.4 105.5 114.3 127.8 14.7 13.5 12.1 32.7 29.4 26.6 13.4 12.3 TechM 10.0 Buy 3100 19.4 137.0 172.9 203.4 19.5 15.5 13.2 28.8 28.3 26.8 20.5 18.9 Cognizant 32.9 Not Rated
2.3 2.8 3.3 23.1 19.4 16.1 20.6 19.8 19.6 17.3 18.4
Tier-I Agg 198.9
19.2 16.5 14.2 27.9 26.6 25.4
Source: MOSL, Company
15.8
78.8
16.1 11.2
3.80
20
40
60
80
100
Aug
-06
Jun-
07
Apr
-08
Feb-
09
Dec
-09
Oct
-10
Aug
-11
Jun-
12
Apr
-13
Feb-
14
Dec
-14
PE (x) Peak(x) Avg(x)Median(x) Min(x)
3.9
17.6
4.3
3.01.20.0
5.0
10.0
15.0
20.0
Aug
-06
Jun-
07
Apr
-08
Feb-
09
Dec
-09
Oct
-10
Aug
-11
Jun-
12
Apr
-13
Feb-
14
Dec
-14
PB (x) Peak(x) Avg(x)Median(x) Min(x)
Tech Mahindra
12 January 2015 6
Story in charts
Exhibit 6: Telecom prowess reflected in vertical mix
Source: Company, MOSL
Exhibit 7: Scale and diversity lent by Satyam acquisition
Source: Company, MOSL
Exhibit 8: Active on the acquisition front – building scale and competencies
STANDALONE TECHM Time Valuation
(USD m) Revenue (USD m)
Employees
Mahindra Satyam Apr-09 1,133 481 (FY11) 48,000
Hutchison Global Services Sep-12 67 170 11,500
Comviva Sep-12 95 70 1,500
MAHINDRA SATYAM
Complex IT (Brazil) Feb-13 45 45 500
COMBINED ENTITY
Mahindra Engineering Services Nov-13 121 42 1,300
BASF Business Service Consult Feb-14 NA NA 60
Fix Stream Apr-14 10 NA NA
Lightbridge Communications Corp. Nov-14 240 430 5,700
Sofgen holdings Ltd Jan-15 ~30 45 450
Source: Company, MOSL
Exhibit 9: Strong execution reflected in much improved efficiency
Source: Company, MOSL
Exhibit 10: Incremental Deal TCV keep growth outlook sanguine
Source: Company, MOSL
Telecom, 52
Manufacturing, 18
Tech, Media, Ent,
8
BFSI, 10
Retail,Travel,
Logistics, 6 Others, 6
Vertical mix (%)
985 977 1063 1156 2633 3098 3743
5.4 (0.9) 8.9 8.8
127.7
17.7 20.8
FY09 FY10 FY11 FY12 FY13 FY14 FY15E
Revenue (USD m) YoY Growth (%)
24.5
20.4 16.7
21.4 22.2 19.4
FY10 FY11 FY12 FY13 FY14 FY15E
EBITDA margin (%)
190
500
220270 250 270
1QFY14 2QFY14 3QFY14 4QFY14 1QFY15 2QFY15
Deal TCV (USD m)
Tech Mahindra
12 January 2015 7
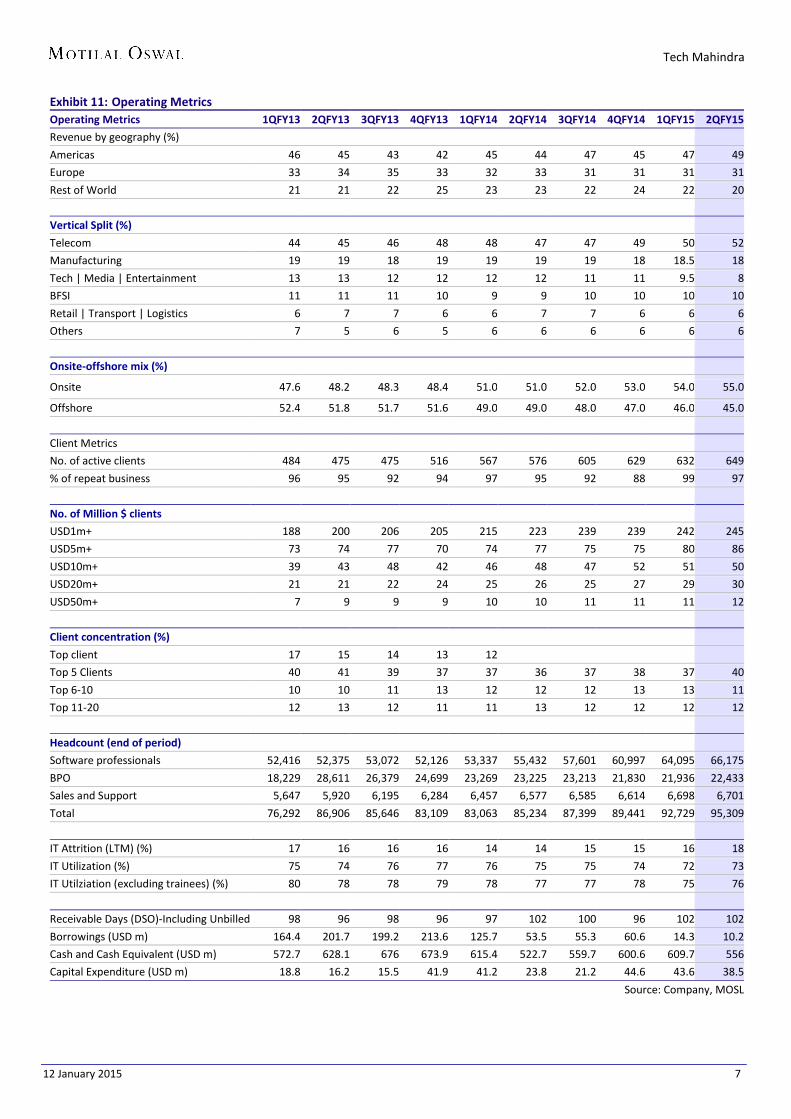
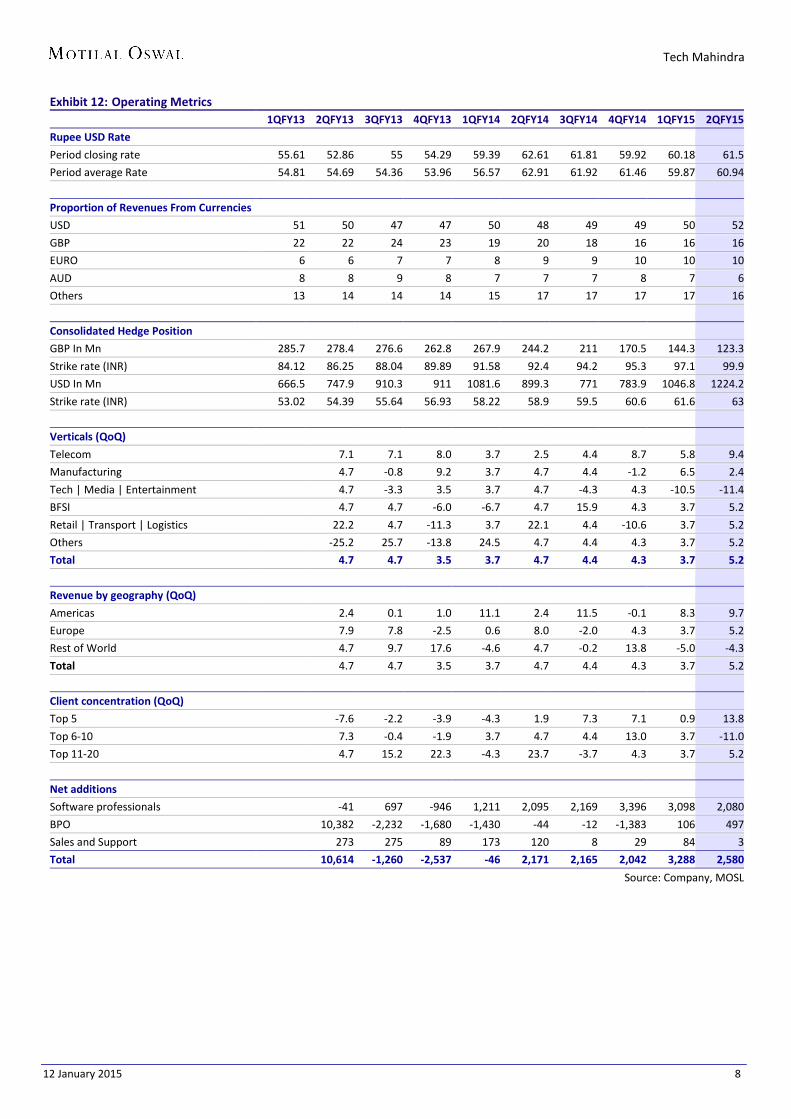
Exhibit 11: Operating Metrics Operating Metrics 1QFY13 2QFY13 3QFY13 4QFY13 1QFY14 2QFY14 3QFY14 4QFY14 1QFY15 2QFY15
Revenue by geography (%)
Americas 46 45 43 42 45 44 47 45 47 49
Europe 33 34 35 33 32 33 31 31 31 31
Rest of World 21 21 22 25 23 23 22 24 22 20
Vertical Split (%)
Telecom 44 45 46 48 48 47 47 49 50 52
Manufacturing 19 19 18 19 19 19 19 18 18.5 18
Tech | Media | Entertainment 13 13 12 12 12 12 11 11 9.5 8
BFSI 11 11 11 10 9 9 10 10 10 10
Retail | Transport | Logistics 6 7 7 6 6 7 7 6 6 6
Others 7 5 6 5 6 6 6 6 6 6
Onsite-offshore mix (%)
Onsite 47.6 48.2 48.3 48.4 51.0 51.0 52.0 53.0 54.0 55.0
Offshore 52.4 51.8 51.7 51.6 49.0 49.0 48.0 47.0 46.0 45.0
Client Metrics
No. of active clients 484 475 475 516 567 576 605 629 632 649
% of repeat business 96 95 92 94 97 95 92 88 99 97
No. of Million $ clients
USD1m+ 188 200 206 205 215 223 239 239 242 245
USD5m+ 73 74 77 70 74 77 75 75 80 86
USD10m+ 39 43 48 42 46 48 47 52 51 50
USD20m+ 21 21 22 24 25 26 25 27 29 30
USD50m+ 7 9 9 9 10 10 11 11 11 12
Client concentration (%)
Top client 17 15 14 13 12
Top 5 Clients 40 41 39 37 37 36 37 38 37 40
Top 6-10 10 10 11 13 12 12 12 13 13 11
Top 11-20 12 13 12 11 11 13 12 12 12 12
Headcount (end of period)
Software professionals 52,416 52,375 53,072 52,126 53,337 55,432 57,601 60,997 64,095 66,175
BPO 18,229 28,611 26,379 24,699 23,269 23,225 23,213 21,830 21,936 22,433
Sales and Support 5,647 5,920 6,195 6,284 6,457 6,577 6,585 6,614 6,698 6,701
Total 76,292 86,906 85,646 83,109 83,063 85,234 87,399 89,441 92,729 95,309
IT Attrition (LTM) (%) 17 16 16 16 14 14 15 15 16 18
IT Utilization (%) 75 74 76 77 76 75 75 74 72 73
IT Utilziation (excluding trainees) (%) 80 78 78 79 78 77 77 78 75 76
Receivable Days (DSO)-Including Unbilled 98 96 98 96 97 102 100 96 102 102
Borrowings (USD m) 164.4 201.7 199.2 213.6 125.7 53.5 55.3 60.6 14.3 10.2
Cash and Cash Equivalent (USD m) 572.7 628.1 676 673.9 615.4 522.7 559.7 600.6 609.7 556
Capital Expenditure (USD m) 18.8 16.2 15.5 41.9 41.2 23.8 21.2 44.6 43.6 38.5
Source: Company, MOSL
Tech Mahindra
12 January 2015 8
Exhibit 12: Operating Metrics
1QFY13 2QFY13 3QFY13 4QFY13 1QFY14 2QFY14 3QFY14 4QFY14 1QFY15 2QFY15
Rupee USD Rate
Period closing rate 55.61 52.86 55 54.29 59.39 62.61 61.81 59.92 60.18 61.5
Period average Rate 54.81 54.69 54.36 53.96 56.57 62.91 61.92 61.46 59.87 60.94
Proportion of Revenues From Currencies
USD 51 50 47 47 50 48 49 49 50 52
GBP 22 22 24 23 19 20 18 16 16 16
EURO 6 6 7 7 8 9 9 10 10 10
AUD 8 8 9 8 7 7 7 8 7 6
Others 13 14 14 14 15 17 17 17 17 16
Consolidated Hedge Position
GBP In Mn 285.7 278.4 276.6 262.8 267.9 244.2 211 170.5 144.3 123.3
Strike rate (INR) 84.12 86.25 88.04 89.89 91.58 92.4 94.2 95.3 97.1 99.9
USD In Mn 666.5 747.9 910.3 911 1081.6 899.3 771 783.9 1046.8 1224.2
Strike rate (INR) 53.02 54.39 55.64 56.93 58.22 58.9 59.5 60.6 61.6 63
Verticals (QoQ)
Telecom
7.1 7.1 8.0 3.7 2.5 4.4 8.7 5.8 9.4
Manufacturing
4.7 -0.8 9.2 3.7 4.7 4.4 -1.2 6.5 2.4
Tech | Media | Entertainment
4.7 -3.3 3.5 3.7 4.7 -4.3 4.3 -10.5 -11.4
BFSI
4.7 4.7 -6.0 -6.7 4.7 15.9 4.3 3.7 5.2
Retail | Transport | Logistics
22.2 4.7 -11.3 3.7 22.1 4.4 -10.6 3.7 5.2
Others
-25.2 25.7 -13.8 24.5 4.7 4.4 4.3 3.7 5.2
Total
4.7 4.7 3.5 3.7 4.7 4.4 4.3 3.7 5.2
Revenue by geography (QoQ)
Americas
2.4 0.1 1.0 11.1 2.4 11.5 -0.1 8.3 9.7
Europe
7.9 7.8 -2.5 0.6 8.0 -2.0 4.3 3.7 5.2
Rest of World
4.7 9.7 17.6 -4.6 4.7 -0.2 13.8 -5.0 -4.3
Total
4.7 4.7 3.5 3.7 4.7 4.4 4.3 3.7 5.2
Client concentration (QoQ)
Top 5
-7.6 -2.2 -3.9 -4.3 1.9 7.3 7.1 0.9 13.8
Top 6-10
7.3 -0.4 -1.9 3.7 4.7 4.4 13.0 3.7 -11.0
Top 11-20
4.7 15.2 22.3 -4.3 23.7 -3.7 4.3 3.7 5.2
Net additions
Software professionals
-41 697 -946 1,211 2,095 2,169 3,396 3,098 2,080
BPO
10,382 -2,232 -1,680 -1,430 -44 -12 -1,383 106 497
Sales and Support
273 275 89 173 120 8 29 84 3
Total
10,614 -1,260 -2,537 -46 2,171 2,165 2,042 3,288 2,580
Source: Company, MOSL
Tech Mahindra
12 January 2015 9
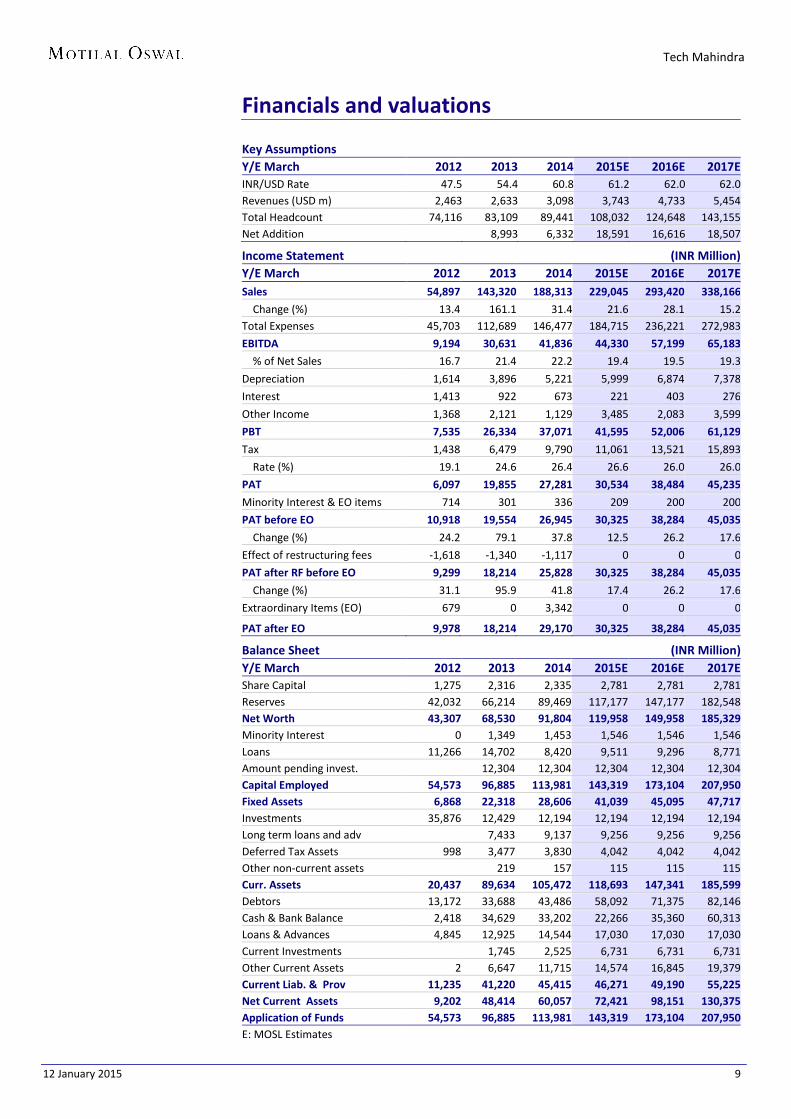
Financials and valuations Key Assumptions
Y/E March 2012 2013 2014 2015E 2016E 2017E INR/USD Rate 47.5 54.4 60.8 61.2 62.0 62.0 Revenues (USD m) 2,463 2,633 3,098 3,743 4,733 5,454 Total Headcount 74,116 83,109 89,441 108,032 124,648 143,155 Net Addition 8,993 6,332 18,591 16,616 18,507
Income Statement (INR Million) Y/E March 2012 2013 2014 2015E 2016E 2017E Sales 54,897 143,320 188,313 229,045 293,420 338,166
Change (%) 13.4 161.1 31.4 21.6 28.1 15.2 Total Expenses 45,703 112,689 146,477 184,715 236,221 272,983
EBITDA 9,194 30,631 41,836 44,330 57,199 65,183
% of Net Sales 16.7 21.4 22.2 19.4 19.5 19.3
Depreciation 1,614 3,896 5,221 5,999 6,874 7,378
Interest 1,413 922 673 221 403 276
Other Income 1,368 2,121 1,129 3,485 2,083 3,599
PBT 7,535 26,334 37,071 41,595 52,006 61,129
Tax 1,438 6,479 9,790 11,061 13,521 15,893
Rate (%) 19.1 24.6 26.4 26.6 26.0 26.0
PAT 6,097 19,855 27,281 30,534 38,484 45,235
Minority Interest & EO items 714 301 336 209 200 200
PAT before EO 10,918 19,554 26,945 30,325 38,284 45,035
Change (%) 24.2 79.1 37.8 12.5 26.2 17.6
Effect of restructuring fees -1,618 -1,340 -1,117 0 0 0
PAT after RF before EO 9,299 18,214 25,828 30,325 38,284 45,035
Change (%) 31.1 95.9 41.8 17.4 26.2 17.6
Extraordinary Items (EO) 679 0 3,342 0 0 0
PAT after EO 9,978 18,214 29,170 30,325 38,284 45,035
Balance Sheet (INR Million) Y/E March 2012 2013 2014 2015E 2016E 2017E Share Capital 1,275 2,316 2,335 2,781 2,781 2,781 Reserves 42,032 66,214 89,469 117,177 147,177 182,548 Net Worth 43,307 68,530 91,804 119,958 149,958 185,329 Minority Interest 0 1,349 1,453 1,546 1,546 1,546 Loans 11,266 14,702 8,420 9,511 9,296 8,771 Amount pending invest. 12,304 12,304 12,304 12,304 12,304 Capital Employed 54,573 96,885 113,981 143,319 173,104 207,950 Fixed Assets 6,868 22,318 28,606 41,039 45,095 47,717 Investments 35,876 12,429 12,194 12,194 12,194 12,194 Long term loans and adv 7,433 9,137 9,256 9,256 9,256 Deferred Tax Assets 998 3,477 3,830 4,042 4,042 4,042 Other non-current assets 219 157 115 115 115 Curr. Assets 20,437 89,634 105,472 118,693 147,341 185,599 Debtors 13,172 33,688 43,486 58,092 71,375 82,146 Cash & Bank Balance 2,418 34,629 33,202 22,266 35,360 60,313 Loans & Advances 4,845 12,925 14,544 17,030 17,030 17,030 Current Investments 1,745 2,525 6,731 6,731 6,731 Other Current Assets 2 6,647 11,715 14,574 16,845 19,379 Current Liab. & Prov 11,235 41,220 45,415 46,271 49,190 55,225 Net Current Assets 9,202 48,414 60,057 72,421 98,151 130,375 Application of Funds 54,573 96,885 113,981 143,319 173,104 207,950 E: MOSL Estimates
Tech Mahindra
12 January 2015 10
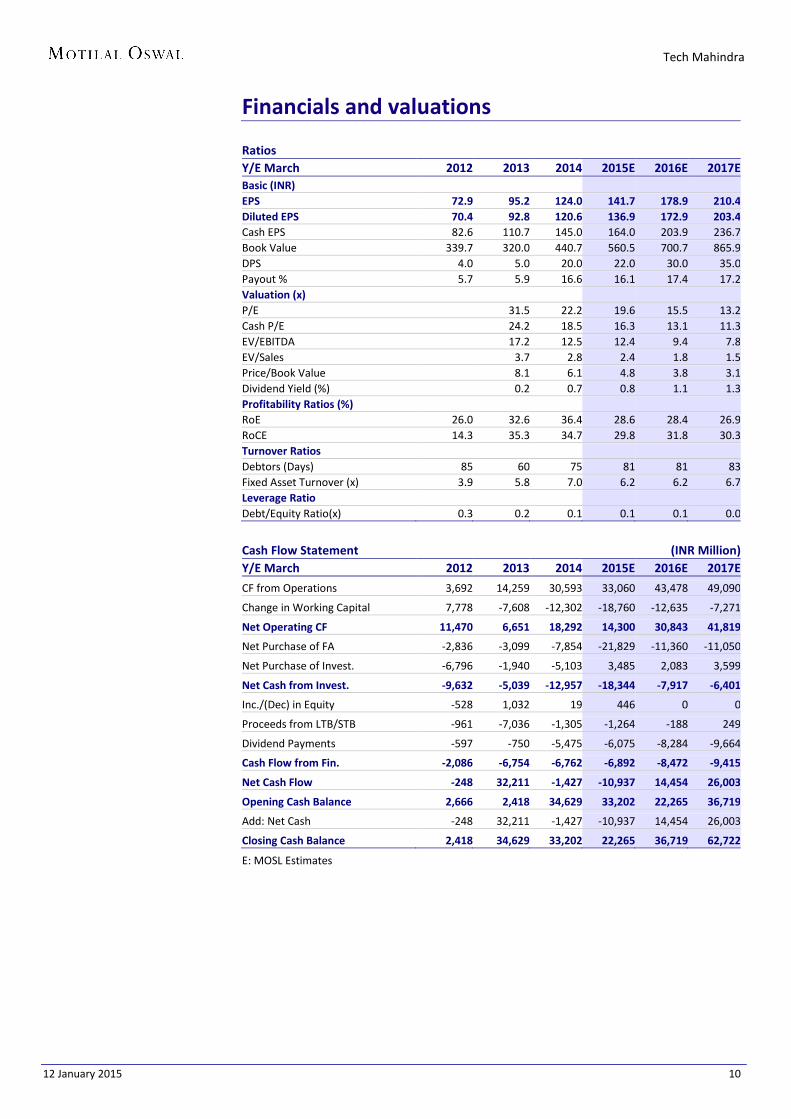
Financials and valuations Ratios Y/E March 2012 2013 2014 2015E 2016E 2017E Basic (INR) EPS 72.9 95.2 124.0 141.7 178.9 210.4 Diluted EPS 70.4 92.8 120.6 136.9 172.9 203.4 Cash EPS 82.6 110.7 145.0 164.0 203.9 236.7 Book Value 339.7 320.0 440.7 560.5 700.7 865.9 DPS 4.0 5.0 20.0 22.0 30.0 35.0 Payout % 5.7 5.9 16.6 16.1 17.4 17.2 Valuation (x) P/E 38.1 31.5 22.2 19.6 15.5 13.2 Cash P/E 32.4 24.2 18.5 16.3 13.1 11.3 EV/EBITDA 37.5 17.2 12.5 12.4 9.4 7.8 EV/Sales 6.3 3.7 2.8 2.4 1.8 1.5 Price/Book Value 7.9 8.1 6.1 4.8 3.8 3.1 Dividend Yield (%) 0.1 0.2 0.7 0.8 1.1 1.3 Profitability Ratios (%) RoE 26.0 32.6 36.4 28.6 28.4 26.9 RoCE 14.3 35.3 34.7 29.8 31.8 30.3 Turnover Ratios Debtors (Days) 85 60 75 81 81 83 Fixed Asset Turnover (x) 3.9 5.8 7.0 6.2 6.2 6.7 Leverage Ratio Debt/Equity Ratio(x) 0.3 0.2 0.1 0.1 0.1 0.0
Cash Flow Statement (INR Million) Y/E March 2012 2013 2014 2015E 2016E 2017E
CF from Operations 3,692 14,259 30,593 33,060 43,478 49,090
Change in Working Capital 7,778 -7,608 -12,302 -18,760 -12,635 -7,271
Net Operating CF 11,470 6,651 18,292 14,300 30,843 41,819
Net Purchase of FA -2,836 -3,099 -7,854 -21,829 -11,360 -11,050
Net Purchase of Invest. -6,796 -1,940 -5,103 3,485 2,083 3,599
Net Cash from Invest. -9,632 -5,039 -12,957 -18,344 -7,917 -6,401
Inc./(Dec) in Equity -528 1,032 19 446 0 0
Proceeds from LTB/STB -961 -7,036 -1,305 -1,264 -188 249
Dividend Payments -597 -750 -5,475 -6,075 -8,284 -9,664
Cash Flow from Fin. -2,086 -6,754 -6,762 -6,892 -8,472 -9,415
Net Cash Flow -248 32,211 -1,427 -10,937 14,454 26,003
Opening Cash Balance 2,666 2,418 34,629 33,202 22,265 36,719
Add: Net Cash -248 32,211 -1,427 -10,937 14,454 26,003
Closing Cash Balance 2,418 34,629 33,202 22,265 36,719 62,722
E: MOSL Estimates

Tech Mahindra
12 January 2015 11
N O T E S
Tech Mahindra
12 January 2015 12
Disclosures This research report has been prepared by MOSt to provide information about the company(ies) and sector(s), if any, covered in the report and may be distributed by it and/or its affiliated company(ies). This report is for personal information of the select recipient and does not construe to be any investment, legal or taxation advice to you. This research report does not constitute an offer, invitation or inducement to invest in securities or other investments and Motilal Oswal Securities Limited (hereinafter referred as MOSt) is not soliciting any action based upon it. This report is not for public distribution and has been furnished to you solely for your general information and should not be reproduced or redistributed to any other person in any form. This report does not constitute a personal recommendation or take into account the particular investment objectives, financial situations, or needs of individual clients. Before acting on any advice or recommendation in this material, investors should consider whether it is suitable for their particular circumstances and, if necessary, seek professional advice. The price and value of the investments referred to in this material and the income from them may go down as well as up, and investors may realize losses on any investments. Past performance is not a guide for future performance, future returns are not guaranteed and a loss of original capital may occur.
We are under the process of seeking registration under SEBI (Research Analyst) Regulations, 2014. There are no disciplinary action that have been taken by any regulatory authority impacting equity research analysis activities.
MOSt and its affiliates are a full-service, integrated investment banking, investment management, brokerage and financing group. We and our affiliates have investment banking and other business relationships with a significant percentage of the companies covered by our Research Department Our research professionals provide important input into our investment banking and other business selection processes. Investors should assume that MOSt and/or its affiliates are seeking or will seek investment banking or other business from the company or companies that are the subject of this material and that the research professionals who were involved in preparing this material may participate in the solicitation of such business. The research professionals responsible for the preparation of this document may interact with trading desk personnel, sales personnel and other parties for the purpose of gathering, applying and interpreting market information. Our research professionals are paid in part based on the profitability of MOSt which include earnings from investment banking and other business. MOSt generally prohibits its analysts, persons reporting to analysts, and members of their households from maintaining a financial interest in the securities or derivatives of any companies that the analysts cover. Additionally, MOSt generally prohibits its analysts and persons reporting to analysts from serving as an officer, director, or advisory board member of any companies that the analysts cover. Our salespeople, traders, and other professionals or affiliates may provide oral or written market commentary or trading strategies to our clients that reflect opinions that are contrary to the opinions expressed herein, and our proprietary trading and investing businesses may make investment decisions that are inconsistent with the recommendations expressed herein. In reviewing these materials, you should be aware that any or all o the foregoing, among other things, may give rise to real or potential conflicts of interest . MOSt and its affiliated company(ies), their directors and employees may; (a) from time to time, have a long or short position in, and buy or sell the securities of the company(ies) mentioned herein or (b) be engaged in any other transaction involving such securities and earn brokerage or other compensation or act as a market maker in the financial instruments of the company(ies) discussed herein or act as an advisor or lender/borrower to such company(ies) or may have any other potential conflict of interests with respect to any recommendation and other related information and opinions.
Unauthorized disclosure, use, dissemination or copying (either whole or partial) of this information, is prohibited. The person accessing this information specifically agrees to exempt MOSt or any of its affiliates or employees from, any and all responsibility/liability arising from such misuse and agrees not to hold MOSt or any of its affiliates or employees responsible for any such misuse and further agrees to hold MOSt or any of its affiliates or employees free and harmless from all losses, costs, damages, expenses that may be suffered by the person accessing this information due to any errors and delays. The information contained herein is based on publicly available data or other sources believed to be reliable. Any statements contained in this report attributed to a third party represent MOSt’s interpretation of the data, information and/or opinions provided by that third party either publicly or through a subscription service, and such use and interpretation have not been reviewed by the third party. This Report is not intended to be a complete statement or summary of the securities, markets or developments referred to in the document. While we would endeavor to update the information herein on reasonable basis, MOSt and/or its affiliates are under no obligation to update the information. Also there may be regulatory, compliance, or other reasons that may prevent MOSt and/or its affiliates from doing so. MOSt or any of its affiliates or employees shall not be in any way responsible and liable for any loss or damage that may arise to any person from any inadvertent error in the information contained in this report. MOSt or any of its affiliates or employees do not provide, at any time, any express or implied warranty of any kind, regarding any matter pertaining to this report, including without limitation the implied warranties of merchantability, fitness for a particular purpose, and non-infringement. The recipients of this report should rely on their own investigations.
Recipients who are not institutional investors should seek advice of their independent financial advisor prior to taking any investment decision based on this report or for any necessary explanation of its contents.
MOSt and/or its affiliates and/or employees may have interests/positions, financial or otherwise in the securities mentioned in this report. To enhance transparency, MOSt has incorporated a Disclosure of Interest Statement in this document. This should, however, not be treated as endorsement of the views expressed in the report.
Disclosure of Interest Statement TECH MAHINDRA Analyst ownership of the stock No
Analyst Certification The views expressed in this research report accurately reflect the personal views of the analyst(s) about the subject securities or issues, and no part of the compensation of the research analyst(s) was, is, or will be directly or indirectly related to the specific recommendations and views expressed by research analyst(s) in this report. The research analysts, strategists, or research associates principally responsible for preparation of MOSt research receive compensation based upon various factors, including quality of research, investor client feedback, stock picking, competitive factors and firm revenues.
Regional Disclosures (outside India) This report is not directed or intended for distribution to or use by any person or entity resident in a state, country or any jurisdiction, where such distribution, publication, availability or use would be contrary to law, regulation or which would subject MOSt & its group companies to registration or licensing requirements within such jurisdictions.
For U.K. This report is intended for distribution only to persons having professional experience in matters relating to investments as described in Article 19 of the Financial Services and Markets Act 2000 (Financial Promotion) Order 2005 (referred to as "investment professionals"). This document must not be acted on or relied on by persons who are not investment professionals. Any investment or investment activity to which this document relates is only available to investment professionals and will be engaged in only with such persons.
For U.S. Motilal Oswal Securities Limited (MOSL) is not a registered broker - dealer under the U.S. Securities Exchange Act of 1934, as amended (the"1934 act") and under applicable state laws in the United States. In addition MOSL is not a registered investment adviser under the U.S. Investment Advisers Act of 1940, as amended (the "Advisers Act" and together with the 1934 Act, the "Acts), and under applicable state laws in the United States. Accordingly, in the absence of specific exemption under the Acts, any brokerage and investment services provided by MOSL, including the products and services described herein are not available to or intended for U.S. persons.
This report is intended for distribution only to "Major Institutional Investors" as defined by Rule 15a-6(b)(4) of the Exchange Act and interpretations thereof by SEC (henceforth referred to as "major institutional investors"). This document must not be acted on or relied on by persons who are not major institutional investors. Any investment or investment activity to which this document relates is only available to major institutional investors and will be engaged in only with major institutional investors. In reliance on the exemption from registration provided by Rule 15a-6 of the U.S. Securities Exchange Act of 1934, as amended (the "Exchange Act") and interpretations thereof by the U.S. Securities and Exchange Commission ("SEC") in order to conduct business with Institutional Investors based in the U.S., MOSL has entered into a chaperoning agreement with a U.S. registered broker-dealer, Motilal Oswal Securities International Private Limited. ("MOSIPL"). Any business interaction pursuant to this report will have to be executed within the provisions of this chaperoning agreement.
The Research Analysts contributing to the report may not be registered /qualified as research analyst with FINRA. Such research analyst may not be associated persons of the U.S. registered broker-dealer, MOSIPL, and therefore, may not be subject to NASD rule 2711 and NYSE Rule 472 restrictions on communication with a subject company, public appearances and trading securities held by a research analyst account.
For Singapore Motilal Oswal Capital Markets Singapore Pte Limited is acting as an exempt financial advisor under section 23(1)(f) of the Financial Advisers Act(FAA) read with regulation 17(1)(d) of the Financial Advisors Regulations and is a subsidiary of Motilal Oswal Securities Limited in India. This research is distributed in Singapore by Motilal Oswal Capital Markets Singapore Pte Limited and it is only directed in Singapore to accredited investors, as defined in the Financial Advisers Regulations and the Securities and Futures Act (Chapter 289), as amended from time to time. In respect of any matter arising from or in connection with the research you could contact the following representatives of Motilal Oswal Capital Markets Singapore Pte Limited: Anosh Koppikar Kadambari Balachandran Email : [email protected] Email : [email protected] Contact : (+65)68189232 Contact : (+65) 68189233 / 65249115 Office Address : 21 (Suite 31),16 Collyer Quay,Singapore 04931
Motilal Oswal Securities Ltd
Motilal Oswal Tower, Level 9, Sayani Road, Prabhadevi, Mumbai 400 025 Phone: +91 22 3982 5500 E-mail: [email protected]