Embed Size (px)
Citation preview
Update on MERPs Guidance
Tyler Fox/Kirk BakerUS EPA/OAQPS/Air Quality Modeling Group
June 5, 2018

Overview: Chapter 5 of Guideline
• Totally new chapter in 2017 revisions to Guideline• Clear distinction between nonattainment planning for NAAQS (multi-
source) vs. permit (single source) modeling recommendations• Outlines a multi-tiered approach for single source permit assessments
that reflects a screening approach with no preferred model• Emphasizes the importance to develop modeling protocols and consult
with the reviewing authority• Emphasis on use of chemical transport models (e.g. photochemical &
Lagrangian models) or techniques that reflect state of science atmospheric chemistry for the less-anticipated situations where a refined assessment is necessary
• Section 5 does not provide a requirement for chemical transport modeling
2
Final Action: Single-Source Impacts on Ozone and Secondary PM2.5
• The EPA believes photochemical grid models are generally most appropriate for addressing ozone and secondary PM2.5, because they provide a spatially and temporally dynamic realistic chemical and physical environment for plume growth and chemical transformation.
• Lagrangian models (e.g. SCICHEM) applied with a realistic 3-dimensional field of chemical species could also be used for single source O3 or PM2.5assessments.
• The EPA has finalized a two-tiered demonstration approach for addressing single-source impacts on ozone and secondary PM2.5.
– Tier 1 demonstrations involve use of technically credible relationships between emissions and ambient impacts based on existing modeling results or studies deemed sufficient for evaluating a project source’s impacts.
– Tier 2 demonstrations would involve case-specific application of chemical transport modeling (e.g., with an Eulerian grid or Lagrangian model).
3
Chemical Transport Models for Permit Related Regulatory Assessments
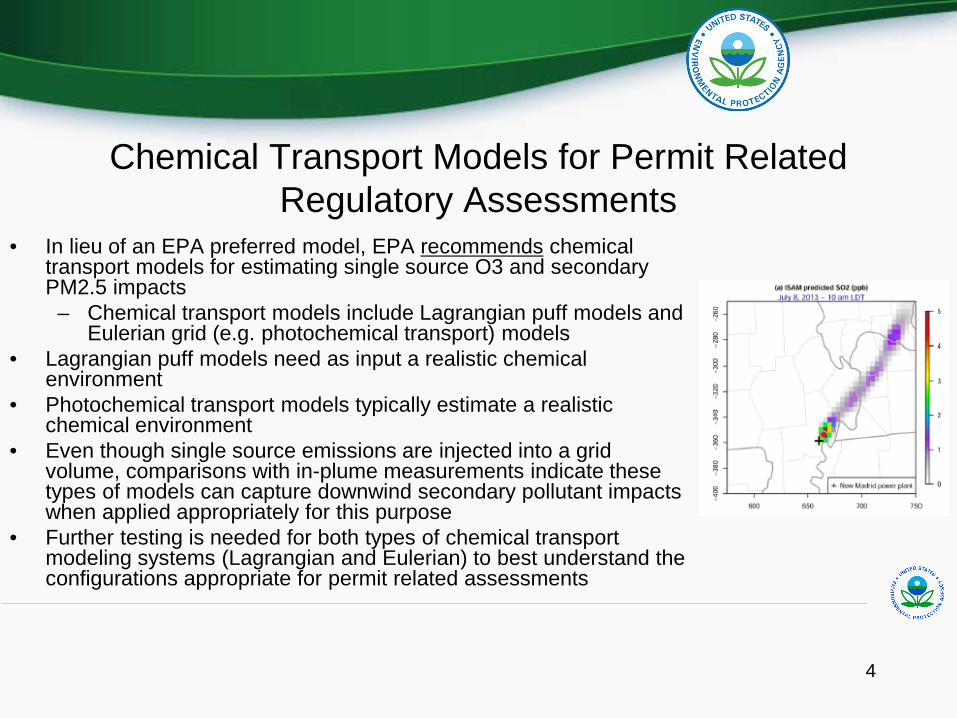
• In lieu of an EPA preferred model, EPA recommends chemical transport models for estimating single source O3 and secondary PM2.5 impacts
– Chemical transport models include Lagrangian puff models and Eulerian grid (e.g. photochemical transport) models
• Lagrangian puff models need as input a realistic chemical environment
• Photochemical transport models typically estimate a realistic chemical environment
• Even though single source emissions are injected into a grid volume, comparisons with in-plume measurements indicate these types of models can capture downwind secondary pollutant impacts when applied appropriately for this purpose
• Further testing is needed for both types of chemical transport modeling systems (Lagrangian and Eulerian) to best understand the configurations appropriate for permit related assessments
4
Tier 1 Assessments• For Tier 1 assessments, EPA generally expects that applicants would
use existing empirical relationships between precursors and secondary impacts based on modeling systems appropriate for this purpose.
• The use of existing credible technical information that appropriately characterize the emissions to air quality relationships will need to be determined on a case-by-case basis.
• Examples of existing relevant technical information that may be used by a permit applicant, in consultation with the appropriate permitting authority, include air quality modeling conducted for the relevant geographic area reflecting emissions changes for similar source types as part of a State Implementation Plan (SIP) demonstration, other permit action, or similar policy assessment as well air quality modeling of hypothetical industrial sources with similar source characteristics and emission rates of precursors that are located in similar atmospheric environments and for time periods that are conducive to the formation of O3 or secondary PM2.5. 5

MERPs as a Tier 1 Demonstration Tool• December 2016, EPA provided draft technical guidance that
provided a framework for development of Tier 1 demonstration tools under Appendix W for PSD permitting.
• MERPs can be viewed as a type of Tier 1 demonstration tool under the PSD permitting program that provides a simple way to relate maximum downwind impacts with an applicable SIL value.
• For PSD, separate MERPs could be developed to relate: – volatile organic compounds (VOCs) and/or nitrogen oxides (NOx) to O3
– sulfur dioxide (SO2) and/or NOX to secondary PM2.5
• Completing updated version for EPA management review that addresses public comments with emphasis on:
– Added Executive Summary – Extended EPA modeling of hypothetical sources– More clarity on use of MERPs at national, regional and local level with more
detail in the examples provided in the guidance6

Definition of MERP value• To derive a MERP value, the model predicted relationship between
precursor emissions from hypothetical sources and their downwind maximum impacts can be combined with the applicable SIL value using the following equation:
MERP = Applicable SIL value * (Modeled emission rate from hypothetical source / Modeled air quality impact from hypothetical source)
• MERPs are expressed as an annual emissions rate in tons per year consistent with the modeled emissions rates that are input to the air quality model to predict a change in pollutant concentrations.
• Based on EPA modeling to inform illustrative MERPs, these values will vary across the nation reflecting different sensitivities of an area’s air quality level to precursor emissions, thereby providing an appropriate basis for evaluating the impacts of these precursors to PM2.5 and ozone formation because they reflect the regional or local atmospheric conditions for particular situations.
7

EPA Single Source Impact Model Assessments
8
DRAFT VERSION UPDATED VERSION
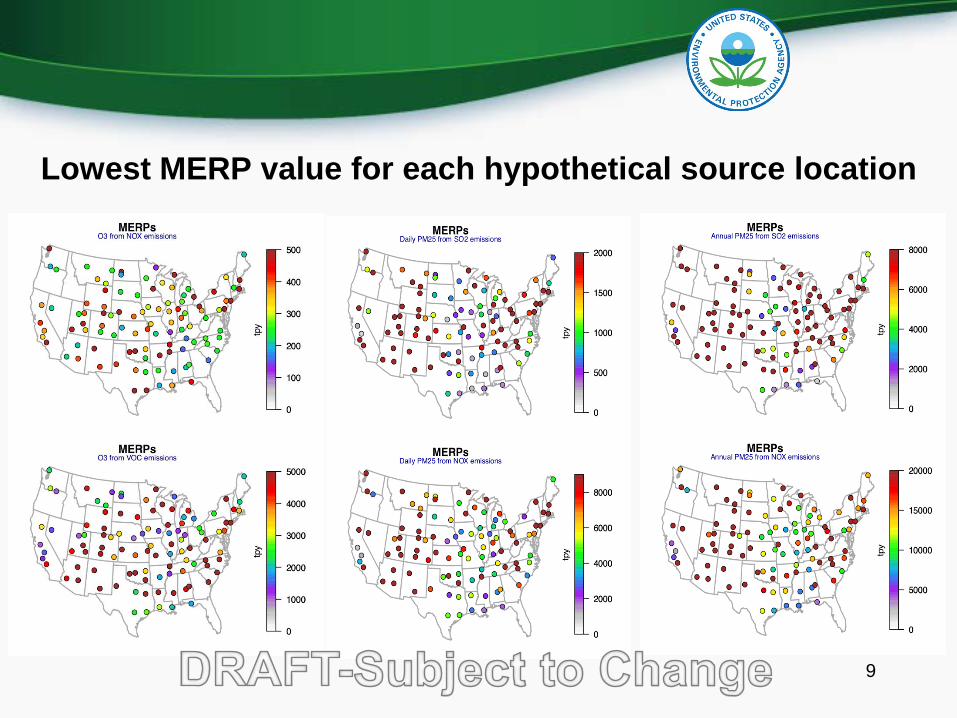
Lowest MERP value for each hypothetical source location
9
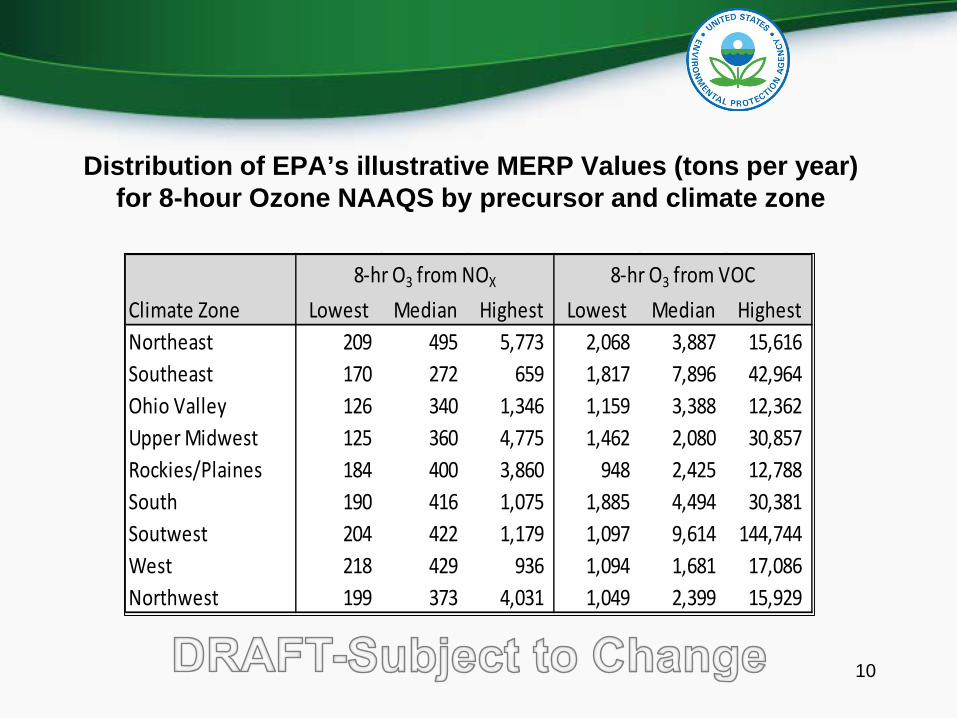
Distribution of EPA’s illustrative MERP Values (tons per year) for 8-hour Ozone NAAQS by precursor and climate zone
10
Climate Zone Lowest Median Highest Lowest Median HighestNortheast 209 495 5,773 2,068 3,887 15,616 Southeast 170 272 659 1,817 7,896 42,964 Ohio Valley 126 340 1,346 1,159 3,388 12,362 Upper Midwest 125 360 4,775 1,462 2,080 30,857 Rockies/Plaines 184 400 3,860 948 2,425 12,788 South 190 416 1,075 1,885 4,494 30,381 Soutwest 204 422 1,179 1,097 9,614 144,744 West 218 429 936 1,094 1,681 17,086 Northwest 199 373 4,031 1,049 2,399 15,929
8-hr O3 from NOX 8-hr O3 from VOC

Distribution of EPA’s illustrative MERP Values (tons per year) for Daily PM2.5 NAAQS by precursor and climate zone
11
Climate Zone Lowest Median Highest Lowest Median HighestNortheast 2,218 16,165 57,564 623 4,137 17,868 Southeast 1,820 8,721 27,451 324 2,547 9,012 Ohio Valley 2,499 10,266 63,597 305 3,001 32,927 Upper Midwest 2,963 10,651 51,920 435 2,821 10,475 Rockies/Plaines 1,925 9,808 60,188 238 3,387 34,381 South 1,693 7,417 39,759 250 1,310 14,727 Soutwest 6,514 26,322 123,170 1,508 9,065 45,857 West 1,073 8,570 34,279 188 2,236 24,596 Northwest 3,003 11,943 20,716 1,203 3,319 8,418
Daily PM2.5 from NOX Daily PM2.5 from SO2
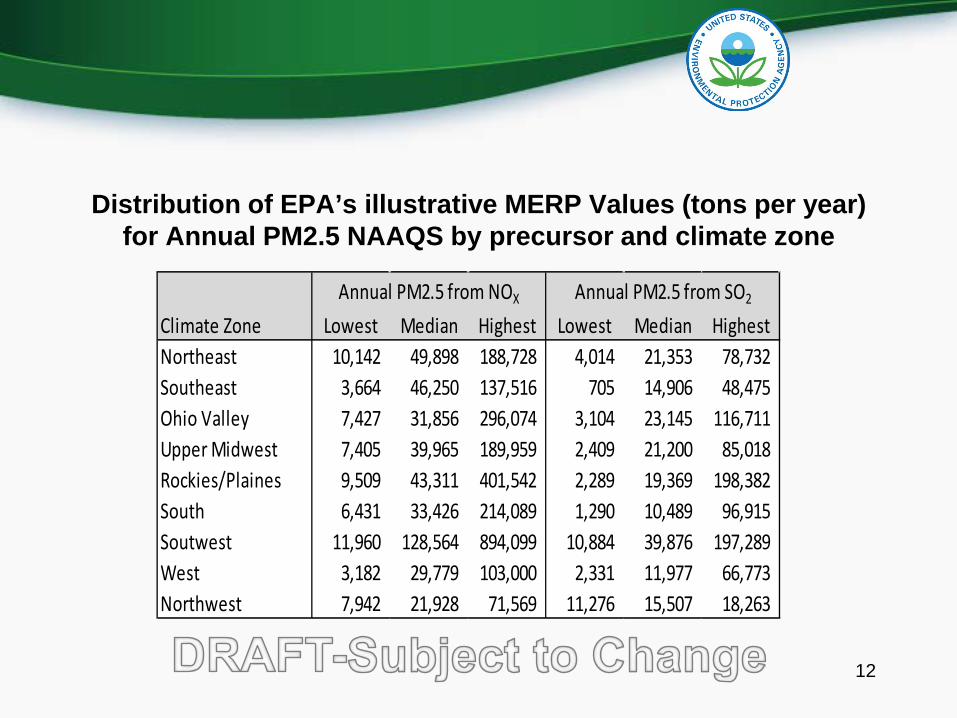
Distribution of EPA’s illustrative MERP Values (tons per year) for Annual PM2.5 NAAQS by precursor and climate zone
12
Climate Zone Lowest Median Highest Lowest Median HighestNortheast 10,142 49,898 188,728 4,014 21,353 78,732 Southeast 3,664 46,250 137,516 705 14,906 48,475 Ohio Valley 7,427 31,856 296,074 3,104 23,145 116,711 Upper Midwest 7,405 39,965 189,959 2,409 21,200 85,018 Rockies/Plaines 9,509 43,311 401,542 2,289 19,369 198,382 South 6,431 33,426 214,089 1,290 10,489 96,915 Soutwest 11,960 128,564 894,099 10,884 39,876 197,289 West 3,182 29,779 103,000 2,331 11,977 66,773 Northwest 7,942 21,928 71,569 11,276 15,507 18,263
Annual PM2.5 from NOX Annual PM2.5 from SO2

Model Input/Output Data Availability• The availability of model inputs and outputs of photochemical
models (i.e., model platform data) allows for development of area/source MERPs (and, if necessary, streamline a Tier 2 demonstration).
• EPA and other organizations have made such model platform data freely available to interested users. For instance, model-ready inputs for both CAMx and CMAQ for the entire year of 2011 are available at http://views.cira.colostate.edu/tsdw/. – EPA is currently working on a 2016 Modeling Platform (Winter
2019)• Further, multi-jurisdictional organizations typically either have
existing photochemical grid model inputs or can direct those interested to other groups/organizations in the same region that may have suitable data.
13

Multi-Jurisdictional OrganizationsOrganization Region of the country Internet site
CENSARA Central U.S. http://www.censara.org/
LADCO Upper Midwest www.ladco.org
MARAMA Mid-Atlantic http://www.marama.org/
NESCAUM Northeast U.S. http://www.nescaum.org/
NW-AIRQUEST Northwestern U.S. http://lar.wsu.edu/airpact/
SESARM Southeast U.S. http://www.metro4-sesarm.org/content/metro-4sesarm-partnership
WRAP Western U.S. https://www.wrapair2.org/
14