Embed Size (px)
Citation preview
Update On High-Resolution Geodetically Controlled LROC Polar Mosaics
by
Brent Archinal1, Ella Lee1,2, Lynn Weller1, Janet Richie1, Ken Edmundson1, Jason Laura1, Mark Robinson3, Emerson Speyerer3,
Aaron Boyd3, Ernest Bowman-Cisneros3, Robert Wagner3, Ara Nefian4
1USGS Astrogeology Science Center, 2255 N. Gemini Drive, Flagstaff, AZ 86004 2Retired 3School of Earth and Space Exploration, Arizona State University, Tempe, AZ 85287 4NASA Ames Research Center, Moffett Field, Mountain View, CA 94035
2015 Annual Meeting of the Lunar Exploration Analysis Group USRA, Columbia, MD 2015 October 20-22
Outline
• Current status of mosaics
• Products/Benefits
• Use for solar illumination mapping
• Registration examples
• In progress – controlling to LOLA
• Addressing LEAG questions
• Summary
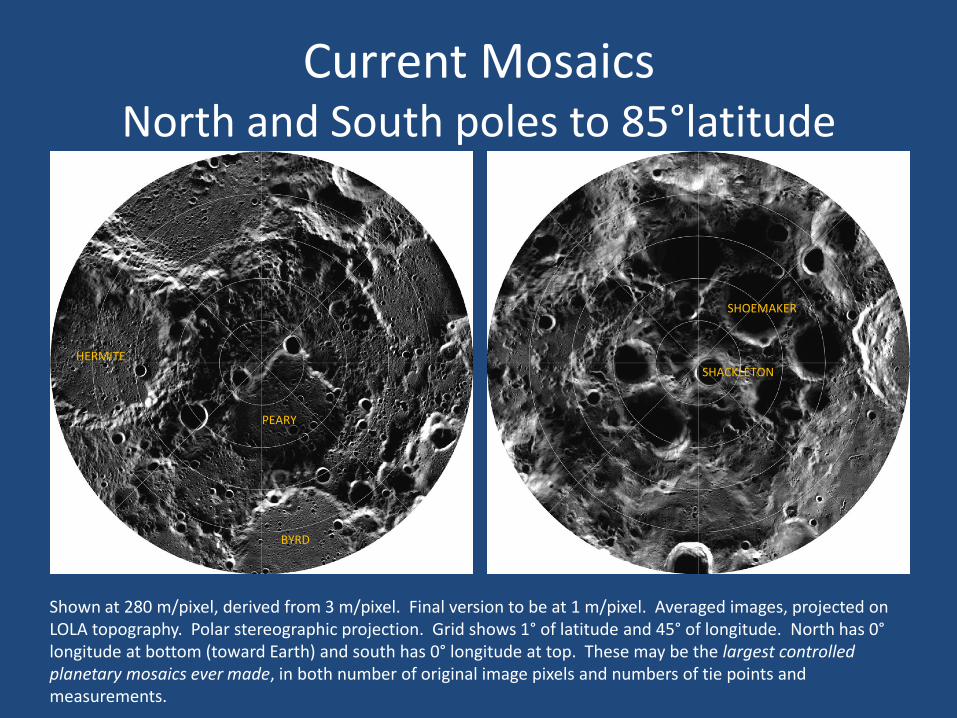
Current Mosaics North and South poles to 85°latitude
Shown at 280 m/pixel, derived from 3 m/pixel. Final version to be at 1 m/pixel. Averaged images, projected on LOLA topography. Polar stereographic projection. Grid shows 1° of latitude and 45° of longitude. North has 0° longitude at bottom (toward Earth) and south has 0° longitude at top. These may be the largest controlled planetary mosaics ever made, in both number of original image pixels and numbers of tie points and measurements.
HERMITE
PEARY
BYRD
SHACKLETON
SHOEMAKER
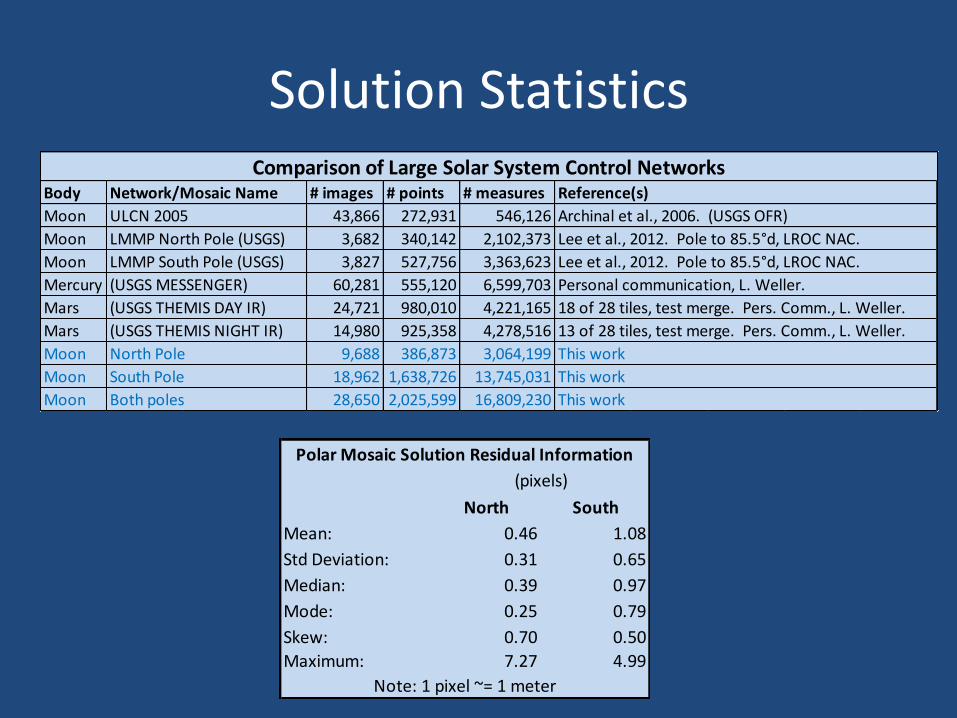
Solution Statistics
North South
Mean: 0.46 1.08
Std Deviation: 0.31 0.65
Median: 0.39 0.97
Mode: 0.25 0.79
Skew: 0.70 0.50
Maximum: 7.27 4.99
Polar Mosaic Solution Residual Information
Note: 1 pixel ~= 1 meter
(pixels)
Body Network/Mosaic Name # images # points # measures Reference(s)
Moon ULCN 2005 43,866 272,931 546,126 Archinal et al., 2006. (USGS OFR)
Moon LMMP North Pole (USGS) 3,682 340,142 2,102,373 Lee et al., 2012. Pole to 85.5°d, LROC NAC.
Moon LMMP South Pole (USGS) 3,827 527,756 3,363,623 Lee et al., 2012. Pole to 85.5°d, LROC NAC.
Mercury (USGS MESSENGER) 60,281 555,120 6,599,703 Personal communication, L. Weller.
Mars (USGS THEMIS DAY IR) 24,721 980,010 4,221,165 18 of 28 tiles, test merge. Pers. Comm., L. Weller.
Mars (USGS THEMIS NIGHT IR) 14,980 925,358 4,278,516 13 of 28 tiles, test merge. Pers. Comm., L. Weller.
Moon North Pole 9,688 386,873 3,064,199 This work
Moon South Pole 18,962 1,638,726 13,745,031 This work
Moon Both poles 28,650 2,025,599 16,809,230 This work
Comparison of Large Solar System Control Networks
What and Why?
• Products – north and south polar averaged
mosaics, from ±85° to ±90° latitude; 1 and 10 m/pixel versions
– mosaics ( x 2) using all useful images – mosaics (x 72) using images from
every 10° of solar longitude – images (all) with Updated geometry – data products (all?) archived to the
PDS – USGS ISIS software improvements – ARC software for LROC NAC to LOLA
track matching – summary paper
• Benefits – identifying small scale permanently
shadowed regions (lunar cold traps) or areas of lengthy solar illumination – ideal sites for future exploration
– providing detailed surface characterization and landing site assessment
– providing base for geological and resource mapping and change detection studies
– eliminating the need for each user to register multiple images at random (polar) sites
– improving tools for tie-pointing and photogrammetric control
– characterizing LRO SPICE data precision, accuracy; instrument boresight offsets
– allowing for improvement of LOLA track relative positions
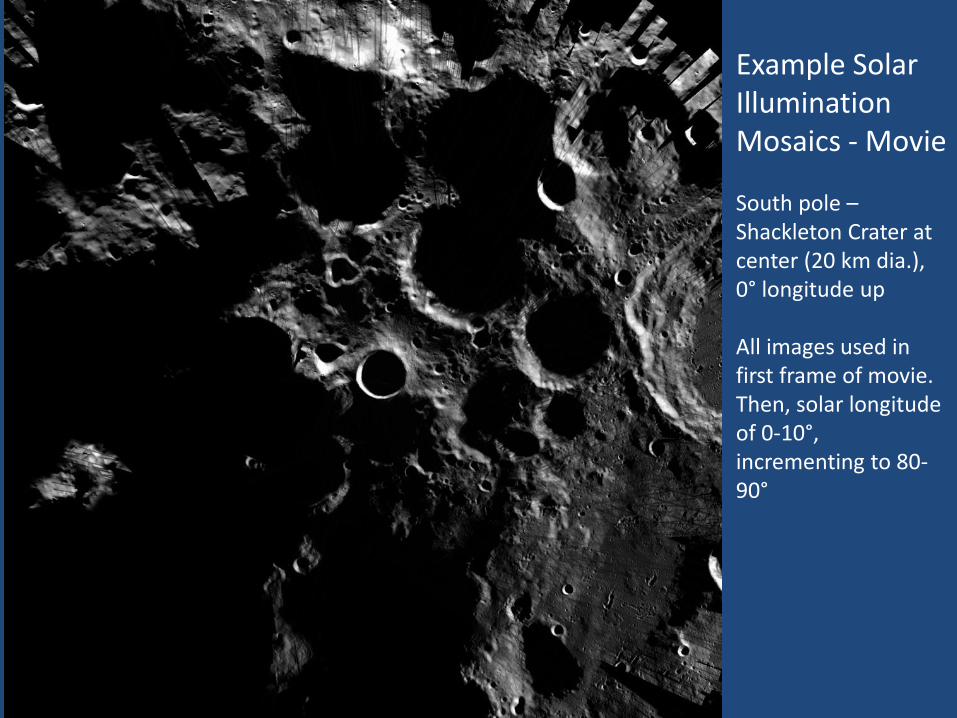
Example Solar Illumination Mosaics - Movie South pole – Shackleton Crater at center (20 km dia.), 0° longitude up All images used in first frame of movie. Then, solar longitude of 0-10°, incrementing to 80-90°
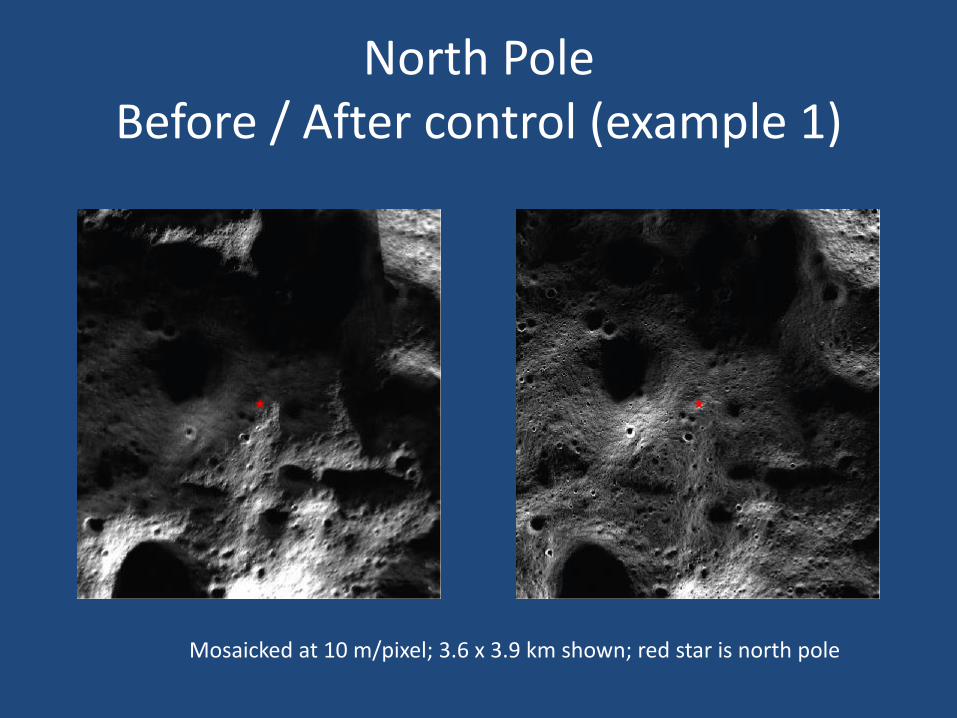
North Pole Before / After control (example 1)
Mosaicked at 10 m/pixel; 3.6 x 3.9 km shown; red star is north pole
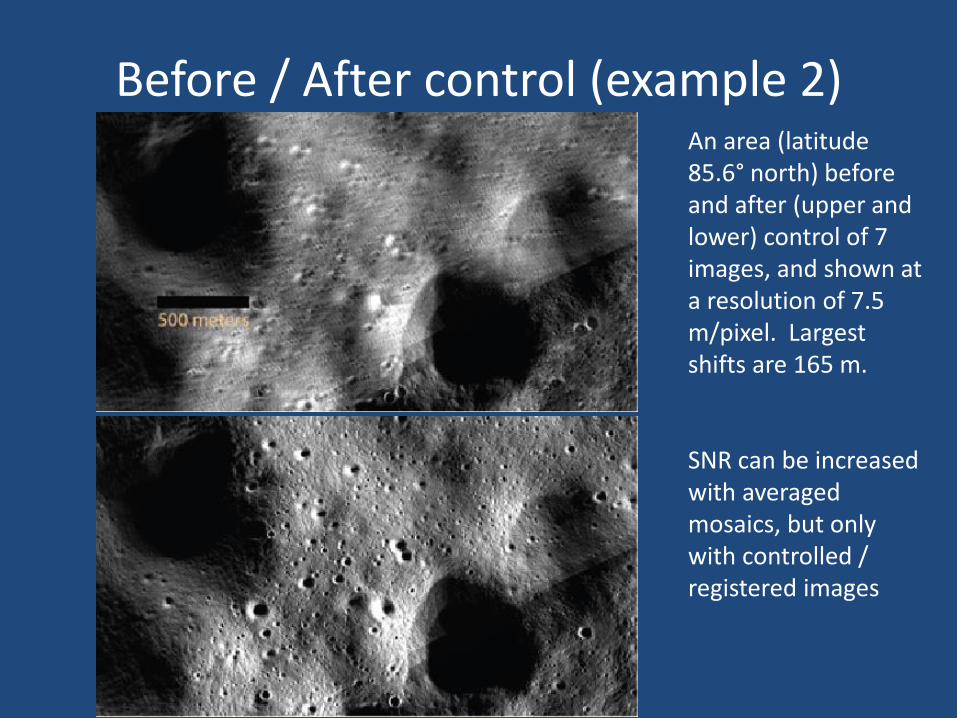
Before / After control (example 2) An area (latitude 85.6° north) before and after (upper and lower) control of 7 images, and shown at a resolution of 7.5 m/pixel. Largest shifts are 165 m. SNR can be increased with averaged mosaics, but only with controlled / registered images
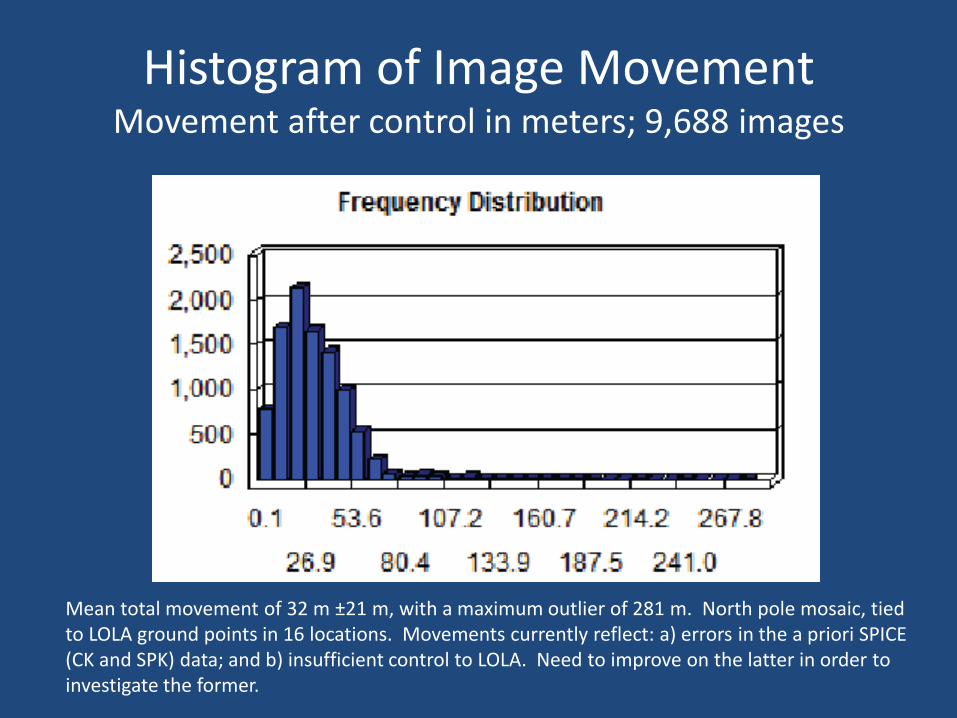
Histogram of Image Movement Movement after control in meters; 9,688 images
Mean total movement of 32 m ±21 m, with a maximum outlier of 281 m. North pole mosaic, tied to LOLA ground points in 16 locations. Movements currently reflect: a) errors in the a priori SPICE (CK and SPK) data; and b) insufficient control to LOLA. Need to improve on the latter in order to investigate the former.
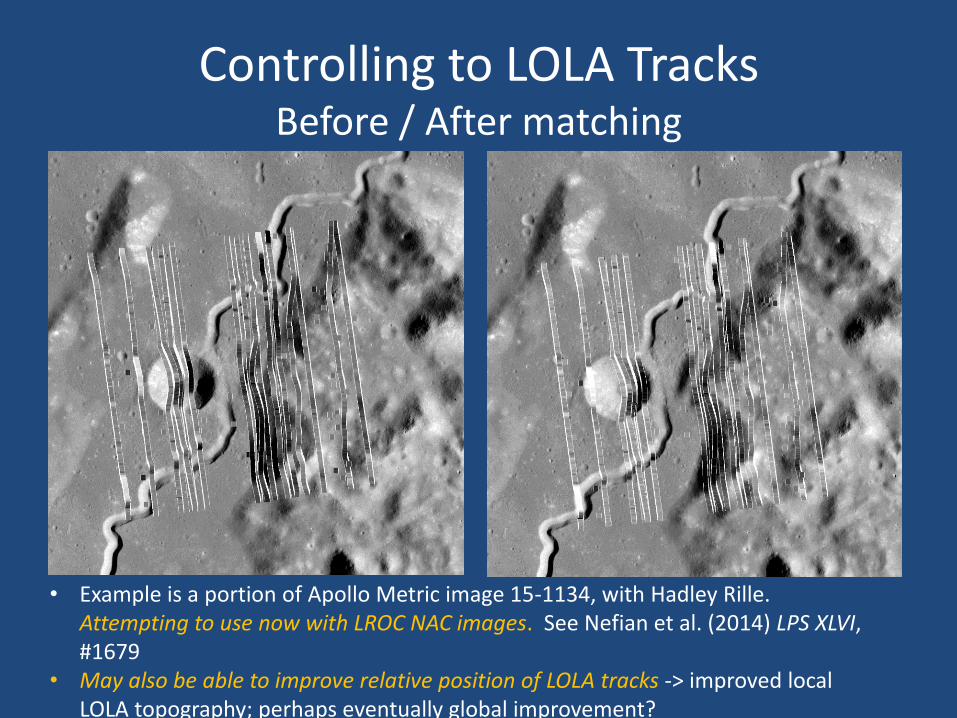
Controlling to LOLA Tracks Before / After matching
• Example is a portion of Apollo Metric image 15-1134, with Hadley Rille. Attempting to use now with LROC NAC images. See Nefian et al. (2014) LPS XLVI, #1679
• May also be able to improve relative position of LOLA tracks -> improved local LOLA topography; perhaps eventually global improvement?

Addressing LEAG Meeting Goals & Themes
“What is our current understanding of the location … of the resources?”
– This study involves developing products for determining polar locations as well as it can currently be done – providing base maps for all polar studies, including ISRU, engineering, and science; other existing and new data will need registered to these products
– Providing ground truth data for “resources” such as permanently shadowed areas and areas of lengthy illumination
“What new technologies are required to make these measurements and answer these questions …?”
– Better mapping technology is needed to map the entire Moon and to handle other missions
– E.g. tie pointing, large photogrammetric solutions, photometric modeling, photoclinometry improvements, sensor models
“What could be the next mission …?”
• Next steps, missions/instruments – Orbital high resolution (e.g. multi-spectral )
mapping for resource identification
– Future mission/instrument to measure landing site scale topography for entire Moon
• For planning landings and surface operations at any location
• For registration and photometric correction of multispectral data for deriving resource mapping at high resolution
Summary
In the works:
• Developing 1 m resolution controlled mosaics of north and south polar caps of the Moon with LROC NAC images
• Developing mosaics using all useable images, as well as creating changing Illumination mosaics
• Working with control to LOLA data having completed relative control to subpixel precision
Usability:
• The data products will be useful for locating permanently shadowed and lengthy solar illumination areas, mission operations, and registration of other datasets
Target Completion Date: • Late 2016
Acknowledgements
This effort is funded by the
• NASA Lunar Advanced Science and Exploration Research (LASER) program,
and builds on earlier funding from the
• LRO Participating Scientist Program, and
• Lunar Mapping and Modeling Project.
We also acknowledge the tremendous work and effort by LRO mission and LROC and LOLA personnel, without which this work would not be possible.

Backup
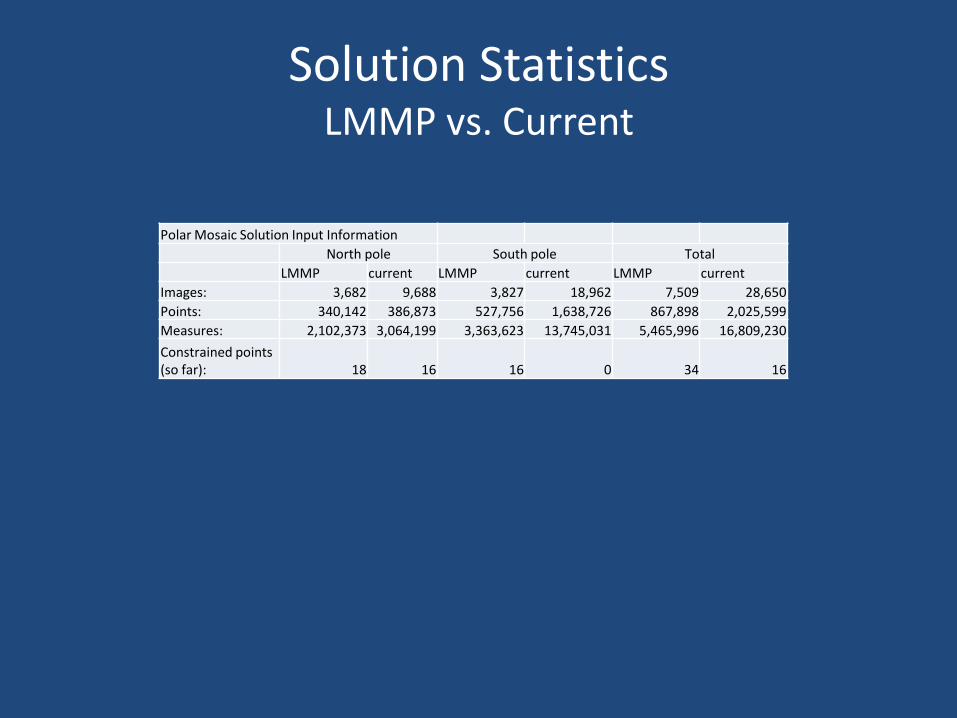
Solution Statistics LMMP vs. Current
Polar Mosaic Solution Input Information
North pole South pole Total
LMMP current LMMP current LMMP current
Images: 3,682 9,688 3,827 18,962 7,509 28,650
Points: 340,142 386,873 527,756 1,638,726 867,898 2,025,599
Measures: 2,102,373 3,064,199 3,363,623 13,745,031 5,465,996 16,809,230
Constrained points (so far): 18 16 16 0 34 16
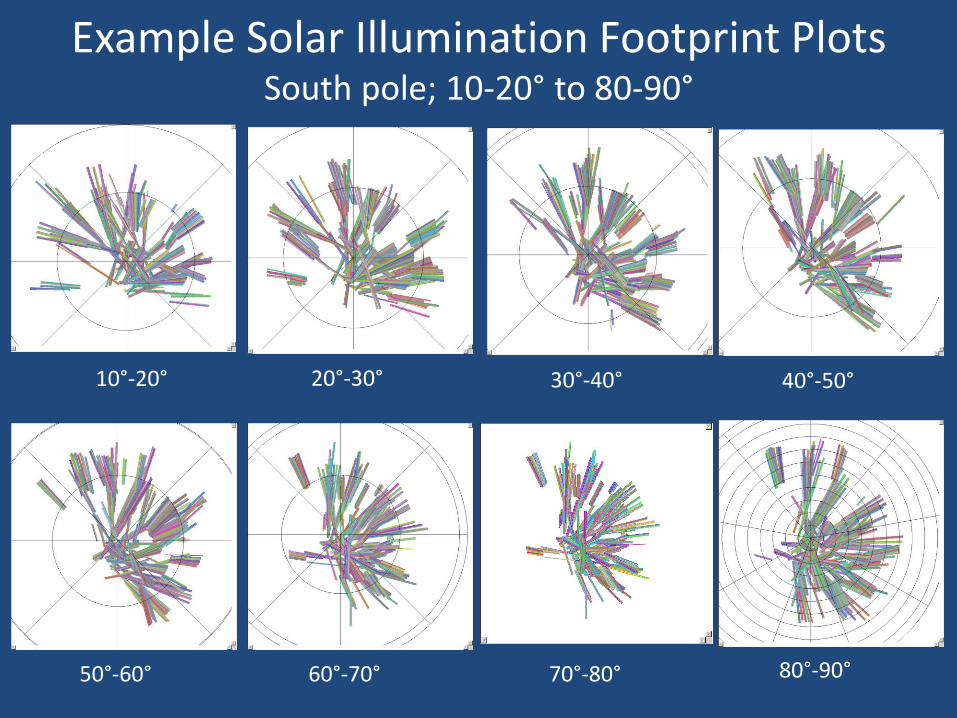
Example Solar Illumination Footprint Plots South pole; 10-20° to 80-90°
10°-20° 20°-30° 30°-40° 40°-50°
50°-60° 60°-70° 70°-80° 80°-90°
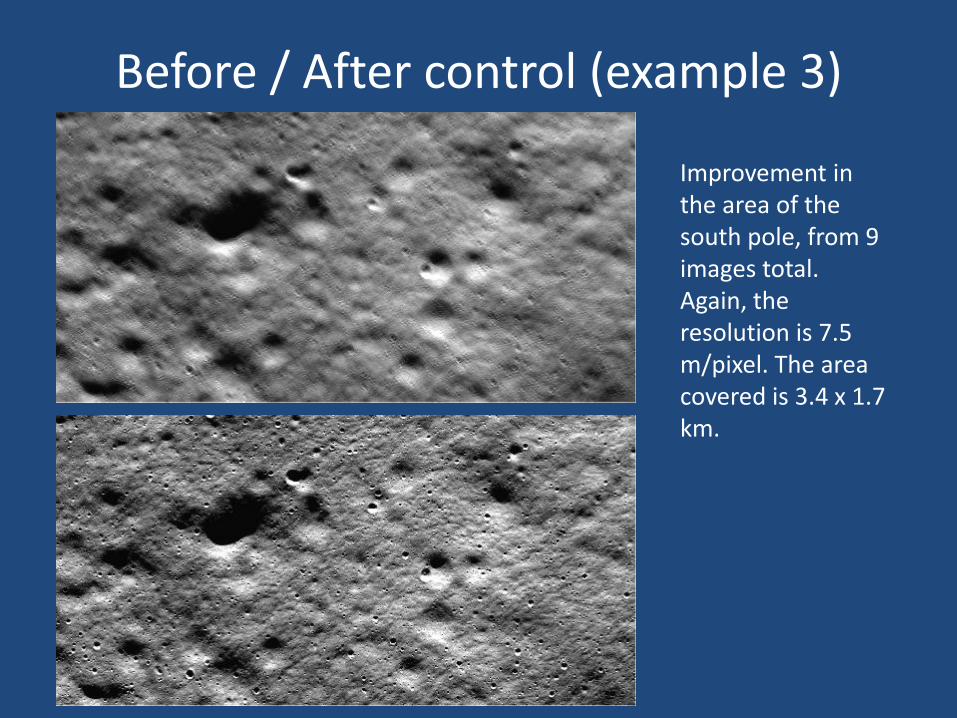
Before / After control (example 3)
Improvement in the area of the south pole, from 9 images total. Again, the resolution is 7.5 m/pixel. The area covered is 3.4 x 1.7 km.
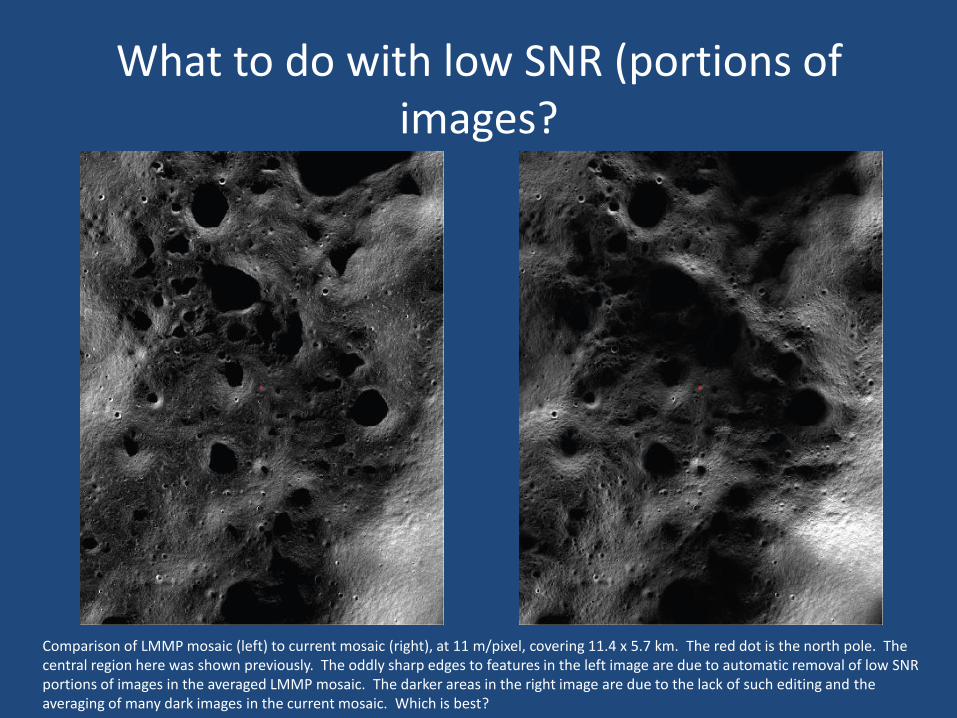
What to do with low SNR (portions of images?
Comparison of LMMP mosaic (left) to current mosaic (right), at 11 m/pixel, covering 11.4 x 5.7 km. The red dot is the north pole. The central region here was shown previously. The oddly sharp edges to features in the left image are due to automatic removal of low SNR portions of images in the averaged LMMP mosaic. The darker areas in the right image are due to the lack of such editing and the averaging of many dark images in the current mosaic. Which is best?
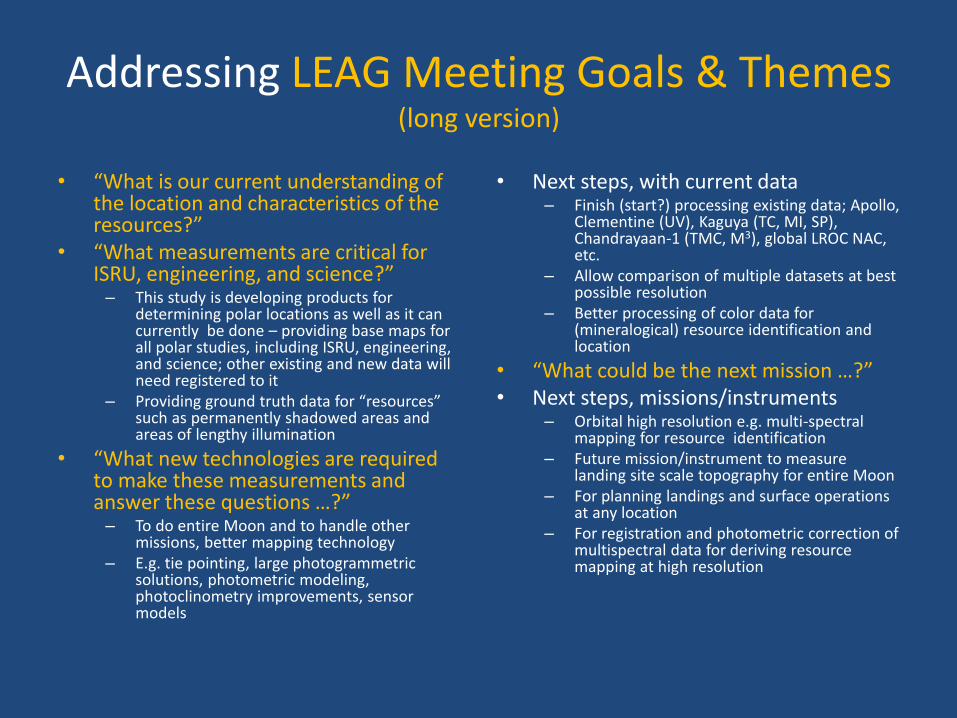
Addressing LEAG Meeting Goals & Themes (long version)
• “What is our current understanding of the location and characteristics of the resources?”
• “What measurements are critical for ISRU, engineering, and science?” – This study is developing products for
determining polar locations as well as it can currently be done – providing base maps for all polar studies, including ISRU, engineering, and science; other existing and new data will need registered to it
– Providing ground truth data for “resources” such as permanently shadowed areas and areas of lengthy illumination
• “What new technologies are required to make these measurements and answer these questions …?” – To do entire Moon and to handle other
missions, better mapping technology – E.g. tie pointing, large photogrammetric
solutions, photometric modeling, photoclinometry improvements, sensor models
• Next steps, with current data – Finish (start?) processing existing data; Apollo,
Clementine (UV), Kaguya (TC, MI, SP), Chandrayaan-1 (TMC, M3), global LROC NAC, etc.
– Allow comparison of multiple datasets at best possible resolution
– Better processing of color data for (mineralogical) resource identification and location
• “What could be the next mission …?” • Next steps, missions/instruments
– Orbital high resolution e.g. multi-spectral mapping for resource identification
– Future mission/instrument to measure landing site scale topography for entire Moon
– For planning landings and surface operations at any location
– For registration and photometric correction of multispectral data for deriving resource mapping at high resolution