Embed Size (px)
Citation preview

12/11/2017
1
Update on GRAV-D andProgress toward a new vertical Datum
NJSPLS SurvCon 2018 February 01, 2018
Dan MartinNortheast Regional Geodetic Advisor
ME, NH, VT, MA, CT, RI, NY, [email protected]
240-676-4762
•Latitude•Longitude•Height
•Scale•Gravity•Orientation
U.S. Department of CommerceNational Oceanic & Atmospheric Administration
National Geodetic Survey
Mission: To define, maintain & provide access to the
National Spatial Reference System (NSRS)
to meet our Nation’s economic, social & environmental needs
National Spatial Reference System
& their time variations
What is a Vertical Datum?
• Strictly speaking, a vertical datum is a surfacerepresenting zero elevation
• Traditionally, a vertical datum is a system for the determination of heights above a zero elevation surface
• Vertical datum comprised of:– Its definition: Parameters
and other descriptors
– Its realization: Its physical method of accessibility
"topographic map." Online Art. Britannica Student Encyclopædia. 17 Dec. 2008 <http://student.britannica.com/ebi/art-53199>
12/11/2017
2
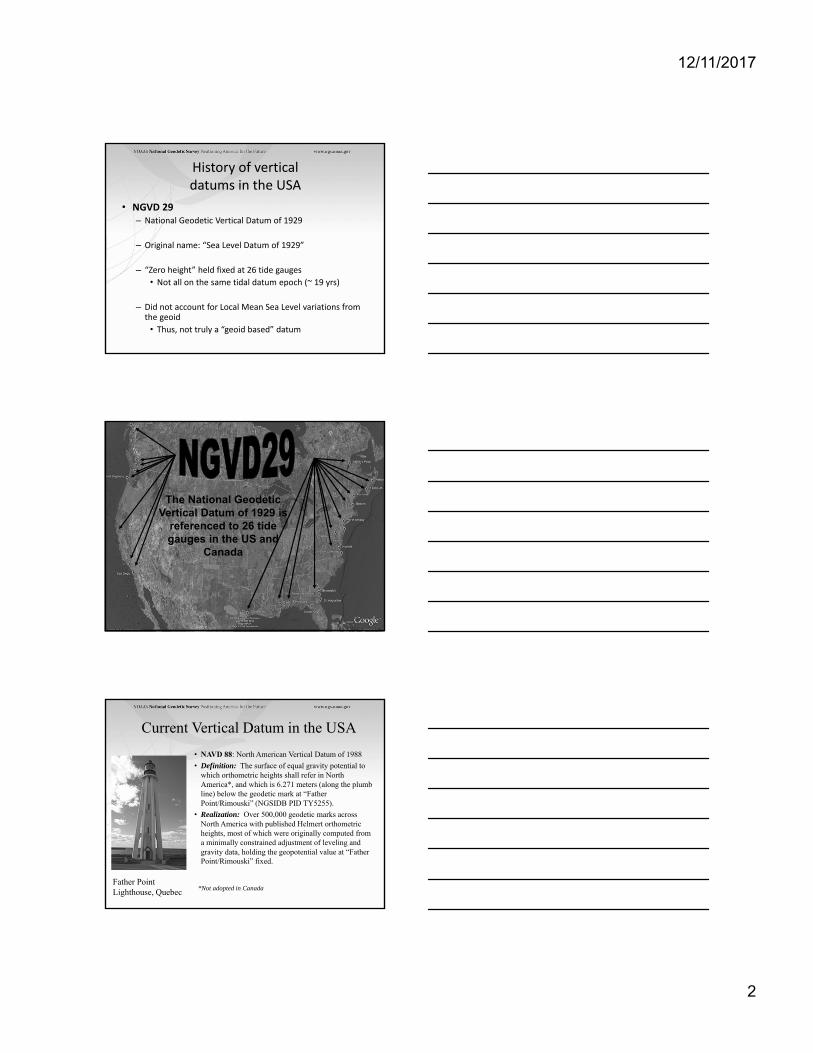
History of vertical datums in the USA
• NGVD 29– National Geodetic Vertical Datum of 1929
– Original name: “Sea Level Datum of 1929”
– “Zero height” held fixed at 26 tide gauges
• Not all on the same tidal datum epoch (~ 19 yrs)
– Did not account for Local Mean Sea Level variations from the geoid
• Thus, not truly a “geoid based” datum
The National Geodetic Vertical Datum of 1929 is
referenced to 26 tide gauges in the US and
Canada
Current Vertical Datum in the USA
• NAVD 88: North American Vertical Datum of 1988
• Definition: The surface of equal gravity potential to which orthometric heights shall refer in North America*, and which is 6.271 meters (along the plumb line) below the geodetic mark at “Father Point/Rimouski” (NGSIDB PID TY5255).
• Realization: Over 500,000 geodetic marks across North America with published Helmert orthometricheights, most of which were originally computed from a minimally constrained adjustment of leveling and gravity data, holding the geopotential value at “Father Point/Rimouski” fixed.
Father Point Lighthouse, Quebec *Not adopted in Canada

12/11/2017
3
History of vertical datums in the USA
• NAVD 88– North American Vertical Datum of 1988
– One height held fixed at “Father Point” (Rimouski, Canada)
– …height chosen was to minimize 1929/1988 differences on USGS topo maps in the eastern U.S.
– Thus, the “zero height surface” of NAVD 88 wasn’t chosen for its closeness to the geoid (but it was close…few decimeters)
History of vertical datums in the USA
• NAVD 88 (continued)
– Use of one fixed height removed local sea level variation problem of NGVD 29
– Use of one fixed height did open the possibility of unconstrained cross‐continent error build up
– But the H=0 surface of NAVD 88 was supposed to be parallel to the geoid…(close again)
Types Uses and History of Geoid Height Models
• Gravimetric (or Gravity) Geoid Height Models
– Defined by gravity data crossing the geoid
– Refined by terrain models (DEM’s)
– Scientific and engineering applications
• Composite (or Hybrid) Geoid Height Models
– Gravimetric geoid defines most regions
– Warped to fit available GPSBM control data
– Defined by legislated ellipsoid (NAD 83) and local vertical datum (NAVD 88, PRVD02, etc.)
– May be statutory for some surveying & mapping applications

12/11/2017
4
GPSBM1996: 2,951total 0 Canada STDEV ≈ 5 cm (2σ)
GPSBM2003: 14,185 total 579 Canada STDEV 4.8 cm (2 σ)
GPSBM1999: 6,169 total 0 Canada STDEV 9.2 cm (2σ)
GPSBM2009: 18,398 STDEV 2.8 cm (2σ)
12/11/2017
5
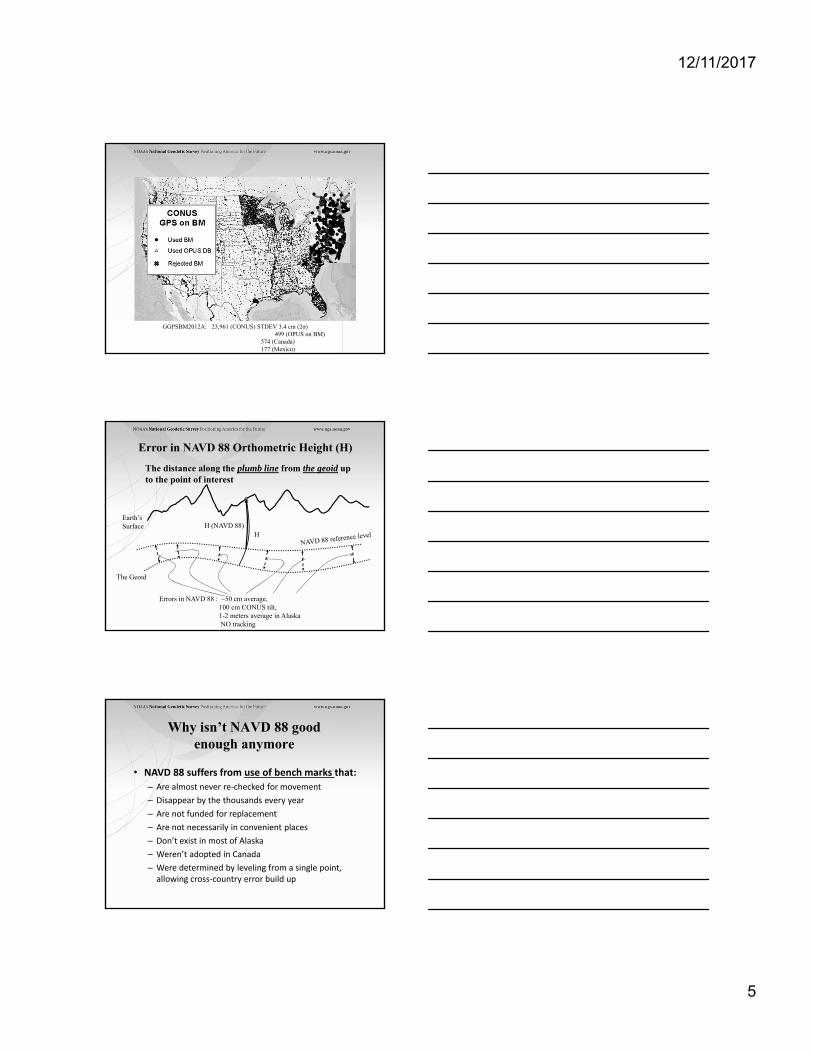
GGPSBM2012A: 23,961 (CONUS) STDEV 3.4 cm (2σ)499 (OPUS on BM)
574 (Canada)177 (Mexico)
Error in NAVD 88 Orthometric Height (H)
The distance along the plumb line from the geoid up to the point of interest
H
Earth’sSurface
The Geoid
H (NAVD 88)
Errors in NAVD 88 : ~50 cm average, 100 cm CONUS tilt, 1-2 meters average in AlaskaNO tracking
• NAVD 88 suffers from use of bench marks that:
– Are almost never re‐checked for movement
– Disappear by the thousands every year
– Are not funded for replacement
– Are not necessarily in convenient places
– Don’t exist in most of Alaska
– Weren’t adopted in Canada
– Were determined by leveling from a single point, allowing cross‐country error build up
Why isn’t NAVD 88 goodenough anymore

12/11/2017
6
The National Geodetic Survey 10 year planMission, Vision and Strategy
2008 – 2018http://www.ngs.noaa.gov/INFO/NGS10yearplan.pdf
• Official NGS policy as of Jan 9, 2008– Modernized agency– Attention to accuracy– Attention to time-changes– Improved products and services– Integration with other fed missions
• 2022 Targets: – NAD 83 and NAVD 88 re-defined– Cm-accuracy access to all
coordinates– Customer-focused agency– Global scientific leadership
Names
The Old:NAVD 88PRVD 02VIVD09ASVD02NMVD03GUVD04IGLD 85IGSN71GEOID12BDEFLEC12B
The New:
The North American-Pacific Geopotential Datum of 2022 (NAPGD2022)
- Will include GEOID2022
April 24, 2017 2017 Geospatial Summit, Silver Spring, MD
OrthometricHeights
NormalOrthometricHeights
DynamicHeights
Gravity
GeoidUndulations
Deflections ofthe Vertical
NAVD 88 is not alone
April 24, 2017 2017 Geospatial Summit 18
• NAVD 88 North American Vertical Datum of 1988
• PRVD02 Puerto Rico Vertical Datum of 2002
• ASVD02 American Samoa Vertical Datum of 2002
• NMVD03 Northern Marianas Vertical Datum of 2003, 3 each
• GUVD04 Guam Vertical Datum of 2004
• VIVD09 Virgin Islands Vertical Datum of 2009, 3 each
• Hawaii … Hawaiian Islands Vertical Datum (coming soon)
• various local datums, as national datum is inaccessible
• IGLD 85 International Great Lakes Datum of 1985
• IGSN71 gravity dataset
• GEOID12B geoid undulations
• DEFLEC12B deflection of the vertical

12/11/2017
7
1. Using GNSS is cheaper, easier than leveling
2. To use GNSS we need a good geoid model
Height Modernization Bottom line
Geoid
Ellipsoid
Earth’sSurface
Coast
From GPS
How “high above‘sea level’ ” am I?(FEMA, USACE,Surveying and Mapping)
From Gravity
OceanSurface
From Satellite Altimetry
How large are hydrodynamic processes?(Coast Survey, CSC,CZM)
Gravity measurements help answer two big questions…
21

12/11/2017
8
Gravity Field Metaphor
Orbit View
Continent-Scale Features:- Mountain
Ranges- Deserts- Large Rivers- Coastlines- Large Islands
Not detailed;Continental
Courtesy of NASA
Gravity Field MetaphorAirplane View
- Individual Peaks- Large Lakes- Human Activity- Mountain Ranges
Regional
Lake Tahoe (CA/NV)
Denali (Mt. McKinley), AK
Gravity Field MetaphorGround View
- Rocks/Boulders- Plants
- Mountains, Valleys, Lakes, etc
Local
Rocky Mountain National Park, Colorado
Acadia National Park, Maine

12/11/2017
9
Image credit:University of Texas Center
for Space Research and NASA
GRACE Gravity Model 01- Released July 2003
Ship gravity
Terrestrial gravity
New Orleans
20-100 km gravity gaps along coast
• Field is not sampled uniformly
• Data range in age and quality, some w/o metadata
• Some surveys have systematic errors
• Data gaps in littoral areas
Problems with Gravity Holdings
• Decades of gravity surveys are inconsistent with one another
• Airborne gravity will provide a baseline for removing these inconsistencies
Problems with Gravity Holdings
%

12/11/2017
10
GRAV‐D Project Overview
• Overall Target: 2 cm accuracy orthometric heights from GNSS and a geoid model
• GRAV‐D Goal: Create gravimetric geoid accurate to 1 cm where possible using airborne gravity data
• GRAV‐D: Two thrusts of the project– Airborne gravity survey of entire
country and its holdings– Long‐term monitoring of geoid
change
• Leveraging partnerships to improve and validate gravity data
February 8, 2017 2017 Geospatial Summit, Silver Spring MD
Data Collection Scope
• Entire U.S. and territories– Total Square Kilometers: 15.6
million
– Initial target area for 2022 deadline
– ~200 km buffer around territory or shelf break if possible
Gravity Survey Plan
• National Scale Part 1
– Predominantly through airborne gravity
– With Absolute Gravity for ties and checks
– Relative Gravity for expanding local regions where airborne shows significant mismatch with existing terrestrial

12/11/2017
11
GRAV-D Expected Coverage
Puerto RicoUS Virgin Is.
Priority‐ Greatest Datum Need• Alaska
• Puerto Rico/US Virgin Islands (PRVI)
• Coastal US and Great Lakes
• Great Lakes
• Gulf of Mexico & FL
• Eastern Seaboard
• Western Seaboard
• Hawaii and Pacific Islands
• Aleutian Islands
• Interior CONUS
• Mountainous areas first
Other Variables to Consider• Time of Year, Need Smooth Air
– Likelihood of Turbulence: Hurricanes, Tornados
– Prevailing winds and weather patterns, especially wintery conditions andthunderstorms
• Aircraft Available
– Differing Capabilities
• Funding
• Areas already completed
• GPRA NOAA TurboCommander atDenver Rocky Mountain AirportSeptember 2012*GPRA = Government Performance and Results Act of 1993

12/11/2017
12
Performance MetricFor Airborne Surveys
• Measure: Percentage of the U.S. and its territories with GRAV‐D data available to support a 1 cm geoid supporting 2 cm orthometric heights.
FY09 Baseline
Targets vs Actual
FY10 FY11 FY12 FY13 FY14 FY15 FY16 FY17 FY18 FY19 FY20 FY21 FY22
6.14% 7.5% 12% 20% 28% 36% 45% 53% 62% 70% 79% 87% 96%100% and Implement
6.14 8% 15% 24% 31% 38% 45% 55% 64%
October 27, 2017
Airborne Gravity Current Coverage
http://www.ngs.noaa.gov/GRAV-D/data_products.shtml
CompleteProcessingCollectingPlanned
Data Block Status
As of Oct 27, 2017
Survey and Block Plans
• Layout rectangular survey 400 x 500 km
• Extends beyond the shelf break
• Block size will reflect the endurance of the aircraft

12/11/2017
13
Survey and Block Plans
• Data lines spaced 10 km apart
• Cross lines spaced 60‐80 km apart
• Flight altitude 20,000 ft
• Nominal speed 220‐250 kts
GRAV‐D Aircraft
Bureau of Land Management Pilatus PC‐12
Fugro Cessna Conquest
Aurora Flight Sciences Centaur Optionally Piloted Aircraft
NOAA P‐3 (background)NOAA Turbo Commander (foreground)
Dynamic Aviation King Air 200T
Naval Research Laboratory King Air RC‐12
Fugro King Air E‐90A
Requirements
• Geodetic quality results require accurate aircraft positions, velocities, and accelerations
• High‐altitude, high‐speed, long baseline flights for gravimetry
INS GPS Antenna
Gravimeter Absolute Gravity Tie

12/11/2017
14
GRAV‐D Instrumentation
Micro‐g LaCosteTAGS Gravimeter
NovAtel SPAN‐SEw/ Honeywell µIRS IMU
• Both instruments include GNSS receivers• SPAN system allows for tightly coupled GPS/IMU solutions
From Measurement to Product
• Airborne Gravity Collection
• GPS and Gravity Data Processing
– Kinematic positioning is critical
– NGS‐developed software
• More info: http://www.ngs.noaa.gov/corbin/class_description/GRAVD_0213.shtml
• Gravity Data Release to Public
• Inclusion in Yearly Experimental Gravimetric Geoid Models
Online Data Portalhttp://www.ngs.noaa.gov/GRAV‐D/data_products.shtml
• Interactive Google Map:
– Up‐to‐date info on all blocks
– 20 blocks released (as of Jan. 2014)
– Clicking a block pops up basic info and a link to the block’s page if data is available

12/11/2017
15
• Data Available Now: – Airborne gravity at altitude
– GIS Images
– .kmls of block extent and data lines
– Two user manuals (one general, one specific to block)
– FGDC metadata
• Future Data: – Experimental geoid products,
similar to USGG official products
– Will incorporate GRAV‐D data
Online Data PortalExample Block Site: http://www.ngs.noaa.gov/GRAV‐D/data_as01.shtml
Validating Geoid Accuracy
“...the gravimetric geoid used in definingthe future vertical datum of the United Statesshould have an absolute accuracy of 1 centimeter at any place and at any time.”
‐‐ The NGS 10 year plan (2008‐2018)
Admirable!...Achievable?
Validating Geoid Accuracy
• NGS planed 3 surveys to validate the accuracy of the gravimetric geoid model
– GSVS11
• 2011; Low/Flat/Simple: Texas; Done; Success!
– GSVS14
• 2014; High/Flat/Complicated: Iowa; Field work Complete
– GSVS17
• 2016 ‐ 2017; High/Rugged/Complicated: Colorado
12/11/2017
16
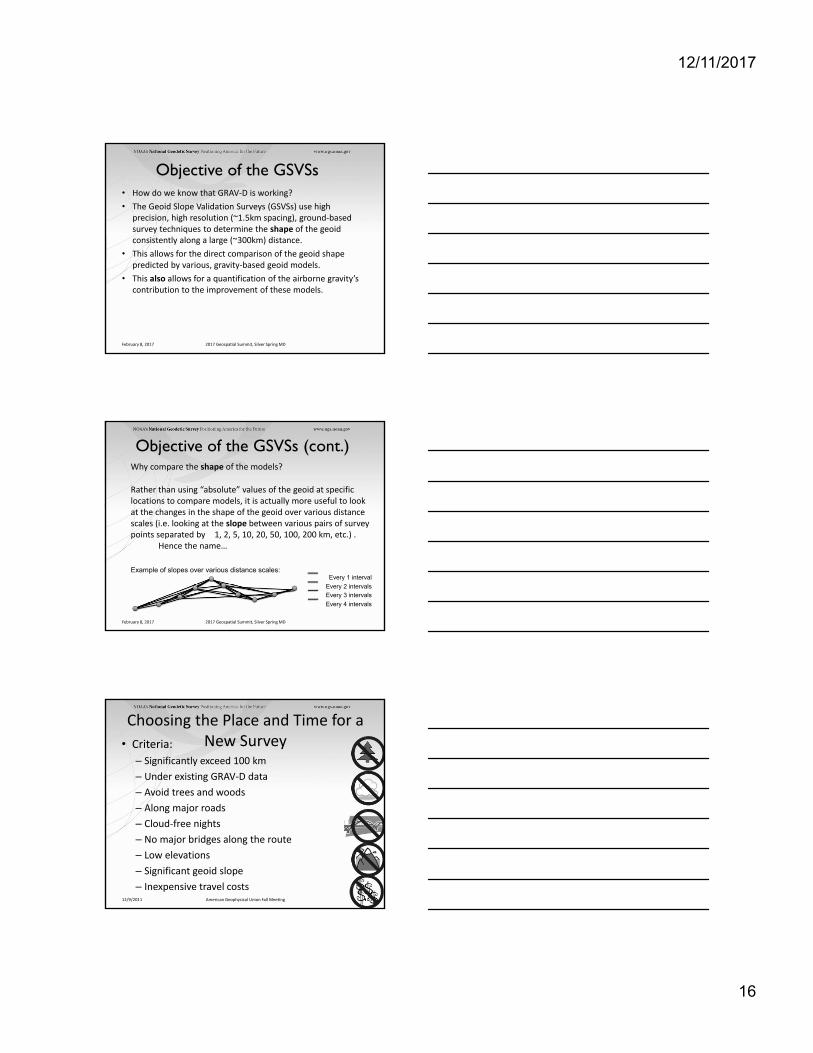
Objective of the GSVSs• How do we know that GRAV‐D is working?
• The Geoid Slope Validation Surveys (GSVSs) use high precision, high resolution (~1.5km spacing), ground‐based survey techniques to determine the shape of the geoid consistently along a large (~300km) distance.
• This allows for the direct comparison of the geoid shape predicted by various, gravity‐based geoid models.
• This also allows for a quantification of the airborne gravity’s contribution to the improvement of these models.
February 8, 2017 2017 Geospatial Summit, Silver Spring MD
Objective of the GSVSs (cont.)Why compare the shape of the models?
Rather than using “absolute” values of the geoid at specific locations to compare models, it is actually more useful to look at the changes in the shape of the geoid over various distance scales (i.e. looking at the slope between various pairs of survey points separated by 1, 2, 5, 10, 20, 50, 100, 200 km, etc.) .
Hence the name…
Example of slopes over various distance scales:Every 1 interval
Every 2 intervals
Every 3 intervals
Every 4 intervals
February 8, 2017 2017 Geospatial Summit, Silver Spring MD
Choosing the Place and Time for a New Survey• Criteria:
– Significantly exceed 100 km
– Under existing GRAV‐D data
– Avoid trees and woods
– Along major roads
– Cloud‐free nights
– No major bridges along the route
– Low elevations
– Significant geoid slope
– Inexpensive travel costs12/9/2011 American Geophysical Union Fall Meeting 48

12/11/2017
17
GSVS Survey Techniques7
• Survey techniques employed:
• Bechmarks installed ~1.5km• Leveling• Absolute/Relative Gravity
• Vertical Gravity Gradient
• Long‐session GPS• Deflection of Vertical
February 8, 2017 2017 Geospatial Summit, Silver Spring MD
The Chosen Line in 2011
12/9/2011 American Geophysical Union Fall Meeting 50
325 km218 points1.5 km spacing
South TexasJuly-October, 2011hot…Hot…HOT!
Leveling and Gravity• The entire line was leveled (double‐run). Geodetic heights
provided at each benchmark.
• Leveling and gravity are both needed for orthometric height determination. Usually gravity is modeled, but in this case was actually measured at every point.
– Relative gravity and vertical gravity gradient at every benchmark
– Absolute gravity (A10 and/or FG5) at ~every 7th benchmark8
February 8, 2017

12/11/2017
18
Geodetic Leveling
Gravity Observations

12/11/2017
19
Long Period GPS
• Calibrated, fixed‐height antennas, all identical models
• In Texas 2011:
– 20 complete sets of equipment (2 parties, 10 sets each)
– Each party observed 10 new stations each day
– 20 hours of observation each day
– Project processed with OPUS Projects9February 8, 2017 2017 Geospatial Summit, Silver Spring MD
• Full antenna recalibration check before survey
• Each fixed height tripod height
measured before and after
• 20 complete sets of equipment ‐
2 parties (10 sets each)
• Each party observe 5 new and 5
repeat stations each day
• 30 observation days
• Project processed with OP
Campaign GPS
ID before after a ‐ b avg.
A 2.0028 2.0029 0.0001 2.0029
B 2.0019 2.0018 ‐0.0001 2.0018
C 2.0005 2.0002 ‐0.0003 2.0004
D 2.0079 2.0079 0.0000 2.0079
E 2.0011 2.0010 ‐0.0001 2.0010
F 1.9999 1.9998 ‐0.0001 1.9998
G 2.0006 2.0009 0.0003 2.0008
H 2.0016 2.0017 0.0001 2.0017
I 2.0020 2.0020 0.0000 2.0020
J 2.0041 2.0041 0.0000 2.0041
K 2.0003 2.0004 0.0001 2.0003
L 2.0010 2.0007 ‐0.0003 2.0008
M 2.0000 2.0002 0.0002 2.0001
N 1.9964 1.9963 ‐0.0001 1.9963
O 2.0005 2.0005 0.0000 2.0005
P 2.0003 2.0002 ‐0.0001 2.0002
Q 2.0024 2.0029 0.0005 2.0027
R 1.9999 1.9999 0.0000 1.9999
S 2.0052 2.0052 0.0000 2.0052
T 2.0026 2.0023 ‐0.0003 2.0024
U 2.0031 2.0031 0.0000 2.0031
V 1.9995 1.9995 0.0000 1.9995
W 2.0002 2.0003 0.0001 2.0003
X 2.0020 2.0022 0.0002 2.0021
Y 2.0053 2.0053 0.0000 2.0053
Z 2.0016 2.0014 ‐0.0002 2.0015
The “Dimple‐ometer”

12/11/2017
20
Deflection of the Vertical (DoV)• Measure the slope of the geoid directly!
• Precision tilt meters provide alignment “level” to the geoid.
• Celestial almanacs provide predicted alignment with star field (relative to ellipsoid).
• The difference between the two vectors (broken into orthogonal components) are the Deflections of the Vertical (or “slopes”).
• In Iowa 2014:– 228 stations (204 official points, 11 redundant
observations, 3 reobservations)
– 31 nights
– 7 stations/night
– Observing with Swiss CODIAC (COmpact DIgital Astrometric Camera)
10February 8, 2017 2017 Geospatial Summit, Silver Spring MD

12/11/2017
21
Field setup with wind-shield
12/11/2017
22
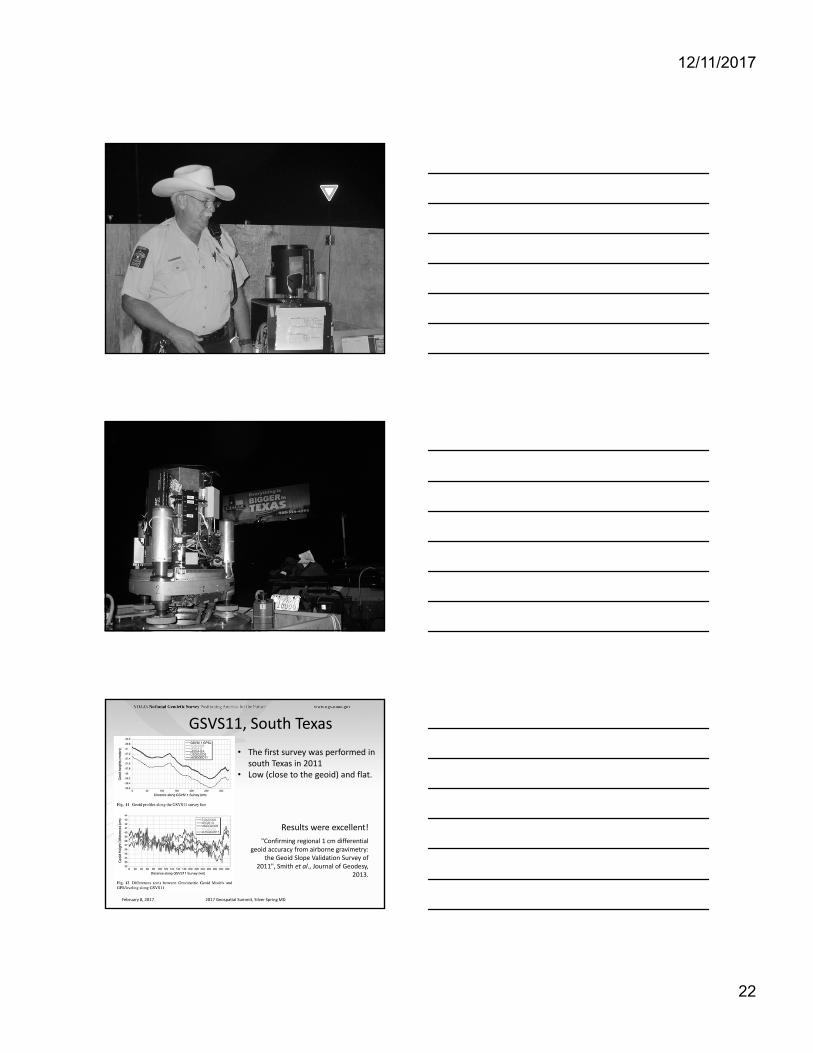
GSVS11, South Texas
• The first survey was performed in south Texas in 2011
• Low (close to the geoid) and flat.
Results were excellent!
"Confirming regional 1 cm differential geoid accuracy from airborne gravimetry:
the Geoid Slope Validation Survey of 2011", Smith et al., Journal of Geodesy,
2013.
February 8, 2017 2017 Geospatial Summit, Silver Spring MD

12/11/2017
23
GSVS14 Iowa• After the success of GSVS11, Iowa was chosen for the next test in
2014.
• Higher elevation and geologically interesting terrain (traversing the Midcontinent Rift System).
• (Very) similar survey techniques were employed.
• Preliminary results again show excellent (<2 cm geoid discrepancy) agreement and noticeable improvement when airborne data are included. March 2017: Accepted for publication in Journal of Geodesy
11February 8, 2017 2017 Geospatial Summit, Silver Spring MD
Central Iowa330 km205 points
The Chosen Line in 2014
• Two crews of 4‐5 people/crew
• 1st order Class II
• 749 km
• 105 crew days
• 7.1 km/day/crew
Geodetic Leveling

12/11/2017
24
Gravity Observations
• 3 1st‐order Class II stations
– Dennison, Ames, Cedar Rapids
• A‐10 Absolute stations (every 7th station)
• Gravity Gradients (every 7th station)
– 2 stations per day, 31 days to observe
• Relative Gravity (205 stations)
– 10 per day, 23 days to observe
DoV
• 228 stations (204 official points, 11 redundant observations, 3 reobservations)
• 31 nights
• 7 stations/night
• Observing with Swiss CODIAC COmpact DIgitalAstrometric Camera
GSVS17 Colorado• The third (and likely final) GSVS will take place along US160, from
Durango to Walsenburg, in southern Colorado.
• High elevation and rugged topography. “Worst case” for geoid modeling.
• Variation from 6,000’ (MSL) to 11,000’, over two passes.
12
February 8, 2017 2017 Geospatial Summit, Silver Spring MD

12/11/2017
25
GSVS17 Colorado (cont.)• 220 benchmark locations (approximately 1 per mile) have been
installed
• The survey will take place in overlapping phases beginning May 2017 and is expected to continue through September.
February 8, 2017 2017 Geospatial Summit, Silver Spring MD
Differences with GSVS17
• Numerous “extra” bench marks had to be installed for leveling accuracy purposes (very steep terrain in some sections).
• Absolute gravity (A10) and quadratic (3 tier) gravity gradients measured at all benchmarks.
• Topographic corrections are being developed to aid in field DoV quality control as well as post-survey geoid modeling.
February 8, 2017 2017 Geospatial Summit, Silver Spring MD
Conclusions – Problems (IA)
• Flooding (access to marks) in June
• One damaged fixed‐height tripod
• Tall grass, ticks, mosquitoes
• Trains, Trains, Trains on Western 1/3rd of line
12/9/2011 American Geophysical Union Fall Meeting 75

12/11/2017
26
Conclusions‐Successes (IA)
• Over a year of planning and preparation
• Two Co‐Project Managers (Scientific/Admin)
• Single Team‐Lead for each activity
• Frequent Team meetings (pre‐deployment)
• Team‐Leads wrote the project instructions
• Field work was successfully completed on time and was of high quality
NEW VERTICAL DATUM(Rationale)
• A move away from differentially leveled passive control as the defining mechanism of the reference surface
• To be consistent with the shift in the geometric reference frame/ellipsoid (2022)
• Improvement in our technical abilities in reference surface realization (geopotential gravimetric reference surface - 1cm accuracy of geoid (GNSS/GRAV-D))
• The new geopotential reference surface will be aligned with the geometric reference frame/ellipsoid (i.e., no hybrid geoid)
NEW VERTICAL DATUM(Rationale)
• The technology to make accurate vertical heights measurements with GNSS technology
• To provide vertical access to formerly prohibitive places
• To allow monitoring of physical or geophysical datum deformation

12/11/2017
27
NEW VERTICAL DATUM(Components)
• Design and adopt new geometric reference frame (Geometric Datum Project)
• Realize new geometric datum with existing passive/active control, i.e., a horizontal (geometric) adjustment
• Definition of the W0 surface as the new datum reference surface
• Build a gravimetric geoid with an overall accuracy of 1 cm (GRAV-D Project)
• Make orthometric heights easily available
Agreement on W0 Value
Experimental Models
Annually update an experimental gravimetric geoid with GRAV‐D data
– Evolution as we move
• from USGG2012 (last non‐GRAV‐D gravimetric geoid)
• through xGG201? (annual experimental geoid)
• to USGG2022 (the final geoid with GRAV‐D)
– Starting 2014: National Ocean Service Requirement

12/11/2017
28
Evolution of the GeoidEGM08
GRACE
GOCE
USGG2012 GEOID12A/B
2012
2008
20142015 2016
xGeoid14B
xGeoid15B
xGeoid16B
+
GRAV-D
GOCO05S
NGAArcticGP
xGeoid2017– First experimental geoid model released June 30, 2014
– Online tools for accessing it (GRAV‐D website)
The effect airborne gravity

12/11/2017
29
• How much will NSRS ellipsoid height change?
– Geometric Datum will be aligned to ITRF
– Approx ‐1.9 m (Puerto Rico) to +2.0 m (Guam)
• How much will NSRS CONUS orthometric height
change?
– Approx +0.1 m (Florida) to ‐1.3 m (Washington)
– More than 2 meters of change in Alaska
How much will heights change?
Metadata is Critical
• Your positional metadata should include:
– datum
– epoch
– source
• These will facilitate transforming from current to new datum
• Maintaining your original survey data will provide more accurate results
How to Plan for the Future• Move to newest realizations
– NAD 83(2011) epoch 2010.00
– USGG12 (gravimetric geoid) / GEOID12A (hybrid geoid)
• Obtain precise ellipsoid heights on NAVD 88 bench marks (OPUS‐DB, contact NGS Geodetic Advisor)– Improves hybrid geoid models and provides “hard points” in new
vertical datum
– Follow new NGS Guidelines when released
• Move off of NGVD 29 to NAVD 88– Understand the accuracy of VERTCON in your area
• Move away from passive marks to GNSS– Especially move off of classical passive control
• Require/provide complete metadata for all mapping contracts– How did they get the positions/heights? Document it!!

12/11/2017
30
Monitoring Geoid Change: Static vs. DynamicFrom Damiani, 2017 Geospatial Summit
Static, except for model updates
Deforms, subsides, uplifts at all length scales
Changes along with large‐scale gravity change (caused by mass movement)
In a changing world, Ḣ ≈ ḣ ‐ Ṅ.
Option 1: Provide a series of static geoids, updated whenever change somewhere in the U.S. reaches 0.5 cm. [Not NGS’ choice]
Option 2: Provide a static geoid (N0) and geoid change over time (Ṅ) so that orthometric heights remain accurate to 1 cm at all times.Ht = ht‐(N0+ Ṅ*t) [NGS’ choice]
h = ellipsoidal height;N = geoid height (undulation);H = orthometric height
In a static world, H ≈ h ‐ N
2022 aim is to achieve 1 cm geoid height accuracy (wherever possible) and 1 cm ellipsoidal height accuracy. 88
Components of a Long‐Term Monitoring Plan
• For all gravity change signals, need to know:
‐ How big (magnitude)? ‐ How big (spatial)?
‐ Other characteristics (constant change, sudden change, etc.)
• Which signals do we monitor to maintain geoid accuracy at the 1 cm level over the next 100 years?
1. What and Where to Monitor
2. How to Monitor in the Near-Term (next 1 to 3 decades)
• Which monitoring methods are available?
• Are they reliable, replaceable (if there’s a failure), and cost effective?
• How much do the signals vary (e.g. seasonality) and how accurately can they be measured, to estimate accumulation of error over time?
• What future technologies may become available for use in monitoring later this decade & this century?
4. Long-Term Program Adaptation
• How do we integrate geoid/vertical datum maintenance for NSRS users?
3. Which Products Need to be Available
89
1. What to Monitor?
Question:What changes affect the geoid in North America?
Three Timescales of Geoid Change
Continuous, Sub-Decadal
Episodic,Cataclysms
Complex, Multi-Decadal
Based on current trends in snowfall, soil moisture, and groundwater withdrawal
Effects from present glaciers and the last glacial cycle
Magnitude 9 thrust earthquakes
Mount St. Helens equivalent or larger eruptions 90

12/11/2017
31
1. Where: Cataclysms
https://earthquake.usgs.gov/earthquakes/browse/
http://eqseis.geosc.psu.edu/~cammon/HTML/Classes/IntroQuakes/Notes/faults.html
(Thrust)
All Recorded Magnitude 8 + Earthquakes, Last 110 Years
11
91
1. Where: Cataclysms
https://www2.usgs.gov/faq/node/2691
Explosive eruptions occur at volcanoes along plate boundaries when gas (often water vapor) is trapped in the magma.
92
1. What is Glacial Isostatic Adjustment?
Wouters, et al., 2014
In North America, the ground (and geoid) are adjusting after the melting of the Laurentide Ice Sheet, which was largest at the Last Glacial Maximum ~21,000 years ago.
Image courtesy of Byrd Polar Research Center, The Ohio State University93

12/11/2017
32
1. Where: Glacial Isostatic Adjustment
Geoid Height Trend (from GIA only)
Jacob, et al., 2012
From the ICE-5G GIA Model Created by Dr. Peltier at the Univ. of Toronto94
1. Where: Present Day Ice Mass Loss
“If these computed geoid trends remain more or less constant into the future, one might expect
a geoid change of 10 mm every 3.5–6.5 years
immediately over the glaciated regions of North America.”
Jacob, et al., 2012
Emphasis added
CanadianArctic2 cm/
decade
SE Alaska3 cm/decade
Greenland 3.5 cm/decade 95
1. What to Monitor?
• Jacob, et al. 2012 considered the next 100 years of change.
• To maintain 1 cm accuracy:– For the next 30 years, only glacial isostatic adjustment
and present-day ice mass loss continuously affect the geoid.
– For the next 30 years, local, episodic adjustments will be needed after cataclysmic disasters, likely only affecting Alaska and the volcanic portions of the Western US.
– From 30-100 years, we must also account for: hydrology and climate-related change, the slow eruptions of Hawaiian volcanos, and global sea level rise.
96

12/11/2017
33
2. How to Monitor?
Possibility 1: Combined Models + Data
1. Identify each significant gravity change source. 2. Use specialized models to estimate mass change, then predict gravity and geoid change
over time from each source. 3. Add results together to get total geoid change over time.4. Validate with terrestrial gravity data, to be sure the models are correct.
Can we do it?
Yes.‐ 6 significant sources already identified from Jacob, et al., 2012.‐ Models exist for 2 near‐term sources (GIA and glacier melting) and can be used to predict geoid change.‐ A validation network for terrestrial gravity can be created with existing technology.
Should we do it?
Maybe.‐ Relies on models created and maintained by others.‐ Could be expensive to set up and maintain a terrestrial gravity network, depending on the size of the network.‐ This is how Canada already monitors geoid change, to upkeep their geoid‐based vertical datum. 97
How Accurate are Glacial Isostatic Adjustment Models?
GRACE and GIA Models are very similar in error.
Using current GIA models (not GRACE) would introduce a 10 mm geoid offset over 18 years, centered mostly in N. Canada.
Geoid Height Trend,ICE‐5G GIA Model Created by Dr. Peltier at Univ. of Toronto
Comparison of GIA Model to Satellite Data, Geoid Height Trend
Jacob, et al., 2012
98
Canadian Geodetic Survey LTM Program
(Veronneau, 2009) New website to access data and time series in the Canadian Gravity System Network.
Enter “CGSN map” into Google.
All Primary CGSN Stations
CACS is the Canadian GNSS Active Control System (similar to NGS’ Continuously Operating Reference Stations (CORS))
All CACS. National (green), Regional (orange), and Local Arrays (red and blue).
99

12/11/2017
34
2. How to Monitor?
1. Estimate most of the geoid change from satellite gravity measurements, which measures total change regardless of the source.
2. Add in “small” gravity signals that the satellites can’t detect but do affect the geoid, from models or data.
3. Create a combined gravity model of change over time and estimate the geoid change over time from that.
Possibility 2: Direct Measurement
Can we do it?
Yes.‐ Satellite gravity from GRACE exists from 2008 – present, but it is at end‐of‐life.‐ Satellite gravity will be provided by GRACE Follow‐On starting in early 2019, if all goes well.‐ We can research which “small” signals are needed; data and models mostly exist.‐ NGS has experts at merging gravity data and making geoid models.
Should we do it?
Very likely.‐ Relies on satellite gravity data that is either freely available or highly‐likely to be available soon.‐ Requires building some in‐house expertise but mostly relies on existing expertise.‐ Only a small portion of the monitoring relies on models or data created outside NGS. 100
Geoid Change Based on Monthly GRACE Solutions 2002‐2014
Annual Change Amplitude in mmTrend in cm
Accumulated Change Over 1 Decade
Images courtesy of Ryan A. Hardy, pers. comm.
AK & W. Canada: Up to .45 cm annual cycleAK: Up to 1 cm per decadeCanada: 1.5 cm per decade
1 to 1.5
0.5 to 1
0 to 0.5‐0.5 to 0
‐1 to ‐0.5 4+
101
2. Mascons: Detailed GRACE Change over Time
• Mascon: “Mass Concentration”
• A different way of displaying local gravity changes from GRACE data; gives better local results, especially for magnitude and extent of change.
• EXAMPLE: http://ccar.colorado.edu/grace/gsfc.html
• This online model removes GIA and other “non‐water” related signals, since the primary product is focused on the gravity change due to water storage.
• For monitoring, NGS will need custom GRACE mascon models that include all gravity signals. 102

12/11/2017
35
GRACE (2002‐present) Mascons, Goddard SFCTrend in Water Equivalent Change
GIA signal is removed.
Mostly reflects changes in groundwater, seasonal snowpack, drought, and glacial melting.
103
Mascon Time Series: Trend and Seasonal SignalsAlaska
• For all locations within this mascon, total loss of ~80 inches of water from glacial ice melting from 2002‐2016.
• Seasonal cycle: ~20‐40 inches accumulated and lost each year. 104
Mascon Time Series: Trend and Seasonal SignalsSW US Drought
105

12/11/2017
36
Future Satellite Gravity Missions
Improvement.~ factor of 5 better than GRACE
Leap Forward.~ factor of 10 better than GRACE
GRACE Follow‐On Mission to launch 12/2017 – 2/2018• 1 satellite built and tested, other very near completion.• Mostly the same mission as GRACE
(microwave ranger, 490 km altitude, 220 km separation)• New: Test a laser ranger; possible 20 – 25x improvement in intersatellite ranging.• 5‐year mission length ends 2023*.
(*GRACE was planned for 5 years and is finally near end‐of‐life after 14 years)
Pail et al., 2015
Plans for GRACE‐2 and beyond:
106
Possible Monitoring Scenarios
Primary Operations (Proposal 2):
For next 30 years: Estimate geoid change rate from GRACE/GRACE‐FO. Add in “small” signals from surface gravity and models. (85% modeling, 15% new campaigns)
Emergency Response Operations:
For cataclysmic events, measure with satellite gravity, surface gravity, and GNSS instruments. (100% new campaigns)
Backup Operations (Proposal 1, if failure of gravity satellites):
Estimate gravity change from 1. mass change models and 2. co‐located vertical velocity measurements (GNSS) and surface gravity measurements. (33% existing data, 33% modeling, 33% new campaigns)
Caveat: With Current Technology!
107
3. Vision for Vertical Datum Products, 2022 +
• In 2022, will release an “S” and “D” geoid models: static and dynamic.
• The “S” static will be a typical geoid model, aimed to capture the 1 cm‐accurate model at a TBD epoch.
• The “D” dynamic will capture the rate of change of the geoid at all places. In 2022, it will capture at least the continuous, permanent change signals such as GIA.
• Both models will be integrated into OPUS, mostly invisible to users. Orthometric heights provided by OPUS will be time‐sensitive, so that they are the combination of the static geoid model plus the geoid rate of change indicated by the dynamic model.
• We’ll provide separate tools to directly access both the “S” and “D” models.
Ht = ht-(N0+ Ṅ*t)
108

12/11/2017
37
4. Future of Monitoring, 2052 and beyond
• NGS plans to re‐evaluate our “S” and “D” models periodically to see if they are meeting our constituents’ needs and maintaining accuracy.
• Future advances in satellite gravimetry, quantum gravimetry, airborne gravimetry/IfSAR, and unmanned vehicles will eventually replace current monitoring technology, necessitating a flexible monitoring plan.
• Monitoring will likely evolve, as understanding of gravity changes and technology also improves.
109
Conclusions• The Geoid Monitoring Service is a new project since January
2017, planned to be operational and produce NGS’ first “D” dynamic geoid by 2022.
• NGS will likely work with satellite gravity experts to build on in‐house NGS expertise and to create the geoid change model.
• We are currently doing research to determine which signals need to be added to the satellite gravity models and how best to estimate/measure those (models or data).
• NGS acknowledges the need to create a realistic plan for geoid emergency response, for response to cataclysmic earthquakes and explosive volcanic eruptions.
• Although all of North America will be monitored, most change occurs in: Alaska, volcanic areas of the Western US, and Canada.110