Embed Size (px)
Citation preview

Update on DOE Better Buildings
Neighborhoods Program
Tuesday, November 6
3pm Eastern
Moderators:
Joel Rogers, Center on Wisconsin Strategy (COWS)
Satya Rhodes-Conway, Center on Wisconsin Strategy (COWS)

Agenda
• Welcome
• Introduction
• Presentation
• Danielle Sass Byrnett, Director, Department of Energy Better Buildings
Neighborhood Program
• Questions and discussion
• Close

1
November 6, 2012
An Update on the Better Buildings Neighborhood Program
Danielle Sass ByrnettProgram Manager

Block by block, neighborhood by neighborhood, we willmake our communities more energy efficient and helpfamilies save money. At the same time, we’ll createthousands of jobs and strengthen our economy.”
—Dr. Steven Chu, Secretary, U.S. Department of Energy2010
11/5/2012 2
Better Buildings Neighborhood Program

Better Buildings Neighborhood Grants
• Leverage $508M in ARRA and FY10 funding to spur nationwide energy efficiency program innovation
• Target urban, suburban, and rural environments• Capitalize on economies of scale • Encourage industry partnerships and investment • Emphasize sustainability beyond the grant • Learn what is effective and replicable
3
The Better Buildings Neighborhood Program is using federal support to promote program innovation and market investment

BBNP Grant Recipient Program Locations
41 grants: $1.4M ‐ $40M eachTiming: mid‐2010 through late 2013 betterbuildings.energy.gov/neighborhoods

What We Will Accomplish
5
Goals to Leverage Grants for the Market• Achieve 15‐30% energy savings from energy efficiency upgrades• Reduce the cost of building upgrade program delivery by 20% or more• Develop sustainable energy efficiency improvement programs
Grant Recipient Goals by Late 2013• Retrofit >100,000 buildings (residential and commercial)• Engage 10,000 to 30,000 contractors in work on energy efficiency upgrades• Save consumers approximately $65 million annually on energy bills • Use the $508 million grants to leverage $1 to $3 billion in additional resources
Vision
A self‐sustaining market for building energy efficiency retrofits that results in economic, environmental, and energy benefits across the United States
PROGRESS
11/5/2012 6

Data through June 30, 2012 (1 of 3)
7
Total Estimated kWh Savings
Total Estimated Source MMBTU Saved
Total Estimated Site MMBTU Saved
79,560,662 1,859,349 1,126,706
Audits~105,000 residential buildings~3,500 commercial buildings
Upgrades26,579 residential buildings1,274 commercial buildings (22 million sq ft)
Building Audits & Upgrades Reported Since Program Launch
≈ CO2 from 10,750 cars

Grantee Summary Data through June 30, 2012for Selection of 11 Programs (2 of 3)
Residential3 Residential + Commercial
No. of Residential Upgrades
Average Residential Invoiced Cost
EstimatedTotal Source
MMBTU Saved
Estimated Total Energy Cost
Savings ($)
Total1 >22,500 $8,281 >1.36 million >$17.99 millionNYSERDA with >5,000 upgrades2 9,394 ~$7,984 319,954 $6,781,103
Six grantees with 1,000 – 5,000 upgrades2 ~1,332 – 2,054 ~$2,195 – $15,229 Average:
153,811Average:
$1,584,323
Four grantees with 500 – 1,000 upgrades2 ~487 – 954 ~$3,822 – $10,541 Average:
29,690Average:$426,657
1 Sub‐total or average of the 11 grantees considered in this table, which have the highest number of upgrades across BBNP.2 Sum of residential and commercial upgrades.3 Residential data includes residential single‐family homes and residential multi‐family units.
NOTE: All data is draft as of reports uploaded on September 8, 2012 and is subject to change. It is known that one grantee in the 1,000 – 5,000 range has underreported upgrades by at least 1,850 at this time due to technical issues.
“Top 10” (11) Most Productive BBNP Grantee Programs: Austin, TX Eagle Co., CO Michigan Portland, ORBoulder Co., CO Los Angeles Co., CA New York Southeast EE Alliance Cincinnati, OH Maine Philadelphia, PA
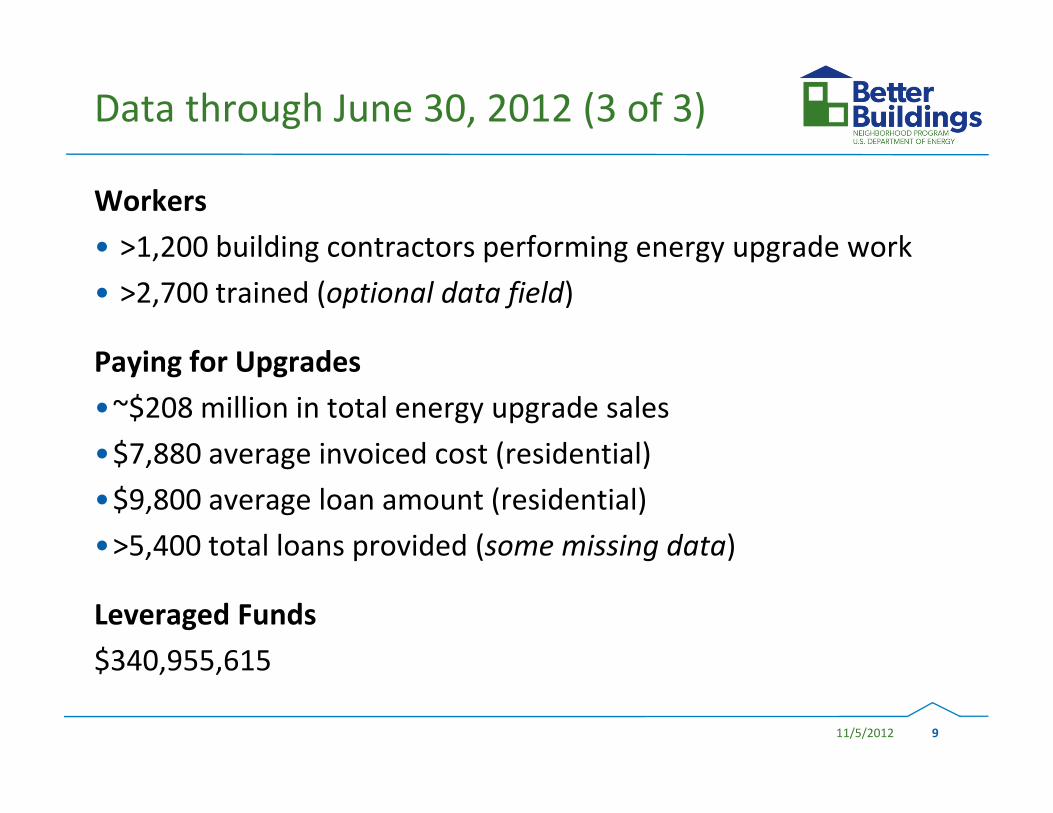
Data through June 30, 2012 (3 of 3)
Workers• >1,200 building contractors performing energy upgrade work • >2,700 trained (optional data field)
Paying for Upgrades•~$208 million in total energy upgrade sales•$7,880 average invoiced cost (residential)•$9,800 average loan amount (residential)•>5,400 total loans provided (some missing data)
Leveraged Funds$340,955,615
11/5/2012 9

Other Highlights
11/5/2012 10
41 Programs Launched in More than 70 Localities to
Test Innovative Models
Shared lessons and challenges in 42 webinars &
54 peer exchange calls
Learned and Shared at 6 Workshops (7th at ACI)
Some programs are seeing 40‐80% of leads come from contractors
Published 11 DOE and 20+ Grantee case
studies
Created More Than 35 Videos

EMERGING LESSONS
11/5/2012 11

Testing Innovative Approaches
11/5/2012 12
Driving Demand
Financing Data and Evaluation
Workforce Development
32Different
Approaches
21Combinations
15Evaluations Being
Performed
12Models Being
Tested

What Do We Call “Lessons Learned”?
New, relatively untested
• Innovation
Anecdotal evidence
• Promising Approach
Qualitative data & multi‐source anecdotal evidence
• Lesson Learned
Mature, fully supported, multi‐source quantitative evidence
• Best Practice
13
Better Buildings Neighborhood Evidence Progression

Getting to Best Practices: Tracking & Analysis
• What tools/approaches were most effective for creating consumer demand? Marketing / outreach (e.g., messaging, communications tactics, delivery venues,
messenger [community organizations, real estate, retailers, etc])? Financial products / incentives? Program delivery models?
• What approaches were most effective for generating energy savings? Contractor qualifications? Audit‐driven vs. pre‐packaged measures? Types of measures (e.g., HVAC, air sealing, lighting, ducts, water heating, etc.)?
• What approaches were the most effective for driving down costs of delivery? Bulk purchasing? Bundling jobs? Contractor experience? Energy advisors? Other?
14

Getting to Best Practices: Data Collection
11/5/2012 15
• Program Data Marketing & outreach – marketing plan; messaging; results of outreach mechanisms Financing – credit enhancements, loan type / repayment, capital source, underwriting criteria Costs – total outlays and obligations by subgrantees, disaggregated program costs (overhead,
marketing & outreach, labor & installation) Market transformation – number of active contractors performing upgrades Job impacts – total job hours worked under ARRA and leveraged funds
• Building Audit / Upgrade Data Completed audits by building sector and by audit type Building location, characteristics Total invoiced cost, rebates, other incentives Installed measures Predicted and actual energy savings (energy consumption / utility bills)
• Financing Information Origination data – loan terms and underwriting criteria Performance data – payment history, charge‐offs, early / prepayment Loan applications rejected

BBNP Commitment to Learning & Sharing
PlanningClarify What We Need to Know
Go
16
Data Collection•Quantitative (reporting)•Qualitative (account management, peer exchange calls, Google Site forum, workshops)
Analysis & Evaluation
Review & Revise What We Know
•Quantitative•Qualitative• Formal Evaluations
What We Know NowWebsite Case Studies Program
Guides & Templates

11/5/2012 17
Major Program Components
Program Design and Customer
Experience
Institutional Design and Business
Model
Data and Impact
Evaluation
Driving Demand
Financing and
Incentives
Workforce and
Contractor Relationships
Who Are You? What Do You Do?How Well Do You
Do It?

Lessons: Institutional Design and Business Model
1. Set geographic boundaries large enough for your customer & contractor base2. Be flexible and embrace change—an entrepreneurial approach is part of the job
description3. Avoid bureaucracy whenever possible4. Engage all stakeholders and develop true partnerships
11/5/2012 18

Lessons: Program Design and Customer Experience
1. Keep the program simple for the customer2. Make sure you are offering something valuable for your contractors that is
worth the time and hassle of being a partner in your program Contractors value leads at $100‐$300 on average
3. Develop process flowcharts that show the necessary steps for each partner: Customer Contractor Financial partner In‐house program staff Call center / support center
4. Be willing to invest in success up front, then scale back for sustainability Get attention from customers Kick‐start the market for contractors Develop early wins to elicit buy‐in from stakeholders
11/5/2012 19

Lessons: Marketing and Driving Demand
1. Identify discrete target audiences; adapt your tactics & messages to their needs2. Offer what people want and value (not necessarily EE)3. Make it easy for homeowners to understand how to participate4. Contractors are your sales team—empower them & give them something to sell5. Leverage “early adopters” and engage trusted messengers to market the program6. Work with your customers’ existing trusted partners for more effective marketing7. Word of mouth is powerful, so give people something to talk about8. Use competitions, time limited offers, and other deadlines to motivate action9. Use language that resonates with your target audience10.Make benefits visible by showcasing completed projects and actual results11.Follow through with customers—one touch is not enough12.Door‐to‐door marketing works better to advertise events than to “make a sale”13.Follow up quickly on leads to take advantage of the “opportunity window”14.Track and evaluate what works (and doesn’t), and adapt your marketing approach
11/5/2012 20

Lessons: Financing and Incentives
1. Focus financing offers on specific gaps and opportunities in the market2. Target financial incentives at desired behaviors and program priorities3. Simplify the process and criteria to help customers qualify for loans quickly4. Work directly with potential partners; make a clear & specific business case5. Leverage financial sector marketing channels and opportunities6. Involve contractors in design to make them champions of financing options 7. Speak like your customer—low payments, low interest rates, more lattes8. Adapt and refine based on feedback from financial partners and others9. Relationships among partners are vital to success; interact regularly10. Design your financing program now in light of long‐term goals11. Provide financing and working capital for contractors, not just customers
11/5/2012 21

Lessons: Workforce & Contractor Relationships
1. Tap existing resources to identify qualified contractors and recruit & train2. Help your contractors drive sales; they can be your most effective sales force3. Start with enough trained contractors to launch, then decide on training4. Help smaller, local contractors enter the market by lowering the cost of entry5. Support in‐field learning and mentoring for newly trained (/ all) workers6. Don’t be afraid to differentiate contractors based on certification or skills7. Create value for contractors through leads & coordination so they give you value8. If you establish a high road agreement, help contractors comply w/requirements9. Listen to your contractors to evaluate and adapt your program10. Ensure program integrity through QA and ongoing feedback from homeowners11. Have clear rules and systems for rewarding contractors and remedying problems12. Help contractors educate customers on effectively using equipment post‐upgrade
11/5/2012 22

Lessons: Using Data to Support Program Administration
1. Identify info needs early and establish a data collection & evaluation plan2. Approach utilities and other potential data partners early in the program3. Choose a system to collect & sort information across partners and activities4. Use systems to streamline the program process for homeowners & contractors5. Develop a program “dashboard” of your most important metrics & track them6. Recognize that data has considerable value—and requires resources7. Provide adequate time and resources to ensure quality data8. Ask & listen to customers and contractors to evaluate your program9. Set realistic expectations about program milestones10. Ensure data collection supports your ability to perform cost‐effectiveness tests
11/5/2012 23

WHERE WE ARE HEADED
11/5/2012 24

BBNP Commitment to Learning & Sharing
PlanningClarify What We Need to Know
Go
25
Decision Tool• Step‐by‐step guidance• Options• Examples• Tools• Templates• Promising approaches,
lessons learned, best practices
Data Collection•Quantitative (reporting)•Qualitative (account management, peer exchange calls, Google Site forum, workshops)
Analysis & Evaluation
Review & Revise What We Know
•Quantitative•Qualitative• Formal Evaluations
What We Know NowWebsite Case Studies Program
Guides & Templates
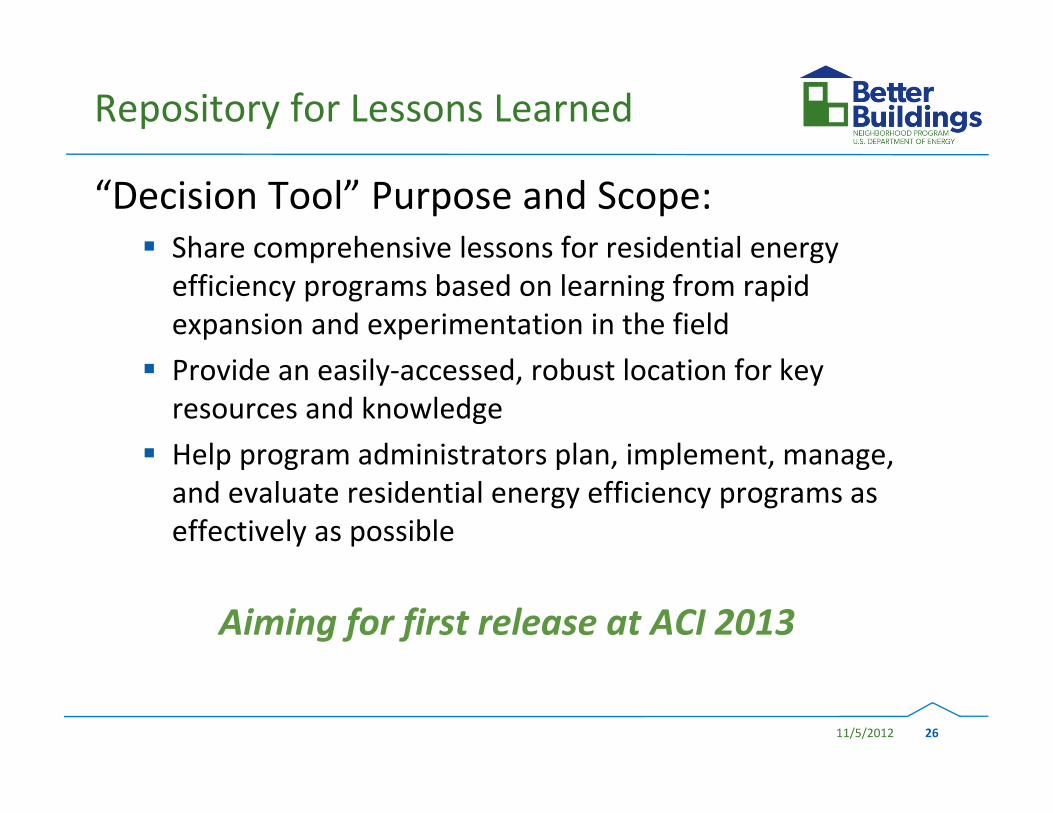
Repository for Lessons Learned
“Decision Tool” Purpose and Scope: Share comprehensive lessons for residential energy efficiency programs based on learning from rapid expansion and experimentation in the field
Provide an easily‐accessed, robust location for key resources and knowledge
Help program administrators plan, implement, manage, and evaluate residential energy efficiency programs as effectively as possible
Aiming for first release at ACI 2013
11/5/2012 26

1⁰ Program Administrators and Implementers – utilities, energy service providers, state energy offices, municipal governments, NGOs
2⁰ Program and Service‐Delivery Partners – contractors, financial institutions, marketing firms
3⁰ Program Evaluators
Decision Tool Audiences
11/5/2012 27

Examples
Promising Approaches, Lessons, and Best Practices
Step‐by‐step Guidance
Case Studies
11/5/2012 28
Templates
Decision Tool Resources
Options
Tools and Guides

Organized Along Major Decision Framework Components
Each component is broken down into consistent strategy‐planning‐implementation & evaluation
phases
Strategy
• A. Assess the Market• B. Set Goals and Objectives• C. Identify Partners• D. Make Design Decisions
Planning
• E. Develop Implementation Plans• F. Develop Process and Impact Evaluation Plans
Implement-ation and
Evaluation
• G. Develop Resources• H. Deliver Program • I. Evaluate and Improve Processes• J. Evaluate and Communicate Program Impacts
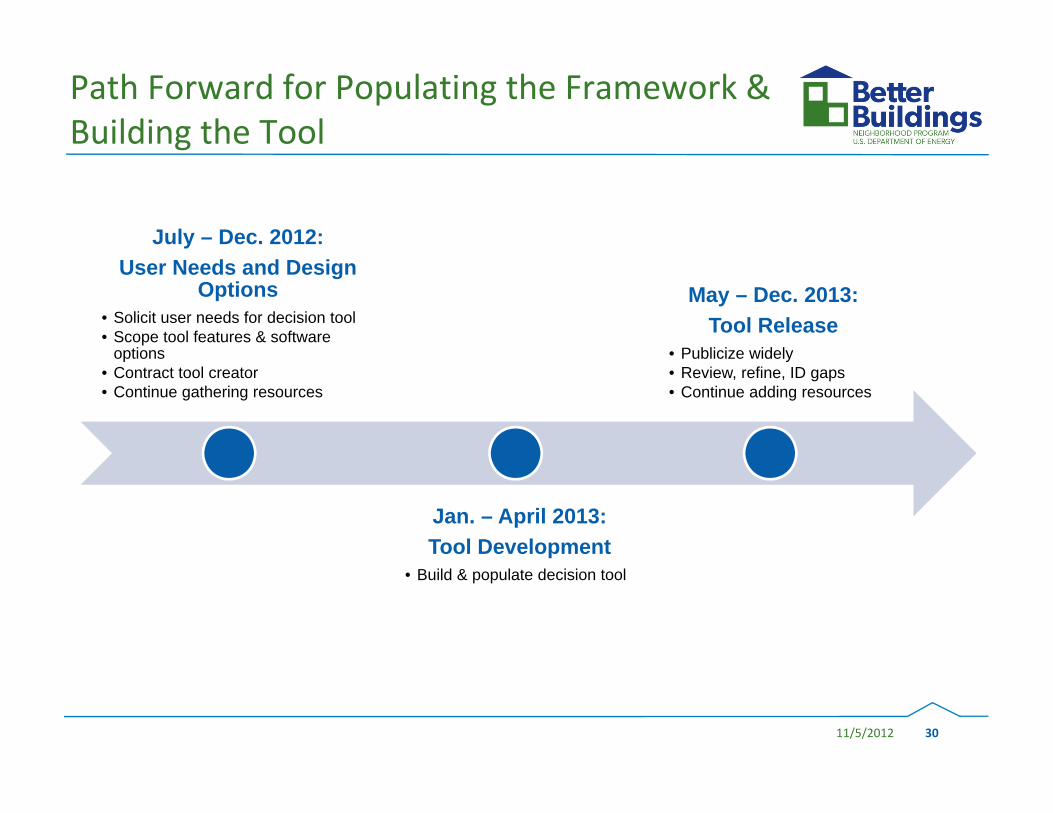
Path Forward for Populating the Framework & Building the Tool
11/5/2012 30
July – Dec. 2012:User Needs and Design
Options• Solicit user needs for decision tool• Scope tool features & software
options• Contract tool creator• Continue gathering resources
Jan. – April 2013:Tool Development
• Build & populate decision tool
May – Dec. 2013:Tool Release
• Publicize widely• Review, refine, ID gaps• Continue adding resources

RIGHT NOW
11/5/2012 31

Learn More
www.betterbuildings.energy.gov/neighborhoods
Resources:– Case Studies– Lessons Learned– Innovations– Webcasts– Conferences and
Workshops– Videos– Tools/Calculators– “Run A Program”

Case Studies
11/5/2012 33
Rutland County, Vermont: How Local Ties Lead to Local Wins
Michigan: Experiment to Find the Right Mix of Incentives
Portland, Oregon: Making the
Program Work for Contractors
Austin, Texas: Best Offer Ever
Produces Upgrades in Record Time
www.betterbuildings.energy.gov/neighborhoods/case_studies.html

11/5/2012
More Lessons Learned & Exampleswww.betterbuildings.energy.gov/neighborhoods/workshops_july_2012.html
34
Refining Lessons Learned: Danielle Sass Byrnett, U.S. DOE
Will Villota, Clean Energy Works Oregon
Roger Smith, CT Neighbor to Neighbor Elizabeth Babcock, City/County of Denver
Jonathan Doochin, U.S. Green Data


Thank you
Danielle Sass ByrnettU.S. Department of Energy
Better Buildings Neighborhood [email protected]
Sign‐Up for the Better Buildings Neighborhood View:www.betterbuildings.energy.gov/neighborhoods/contacts.html
Contact Information for ECN
Administrator - [email protected]
Listserv - [email protected]
Website - www.efficiencycities.org
To Join - www.efficiencycities.org/join-us