Embed Size (px)
DESCRIPTION
Update on Alcohol and Health. Alcohol and Health: Current Evidence September–October 2004. Studies on Alcohol and Health Outcomes. Safer Drinking Recommendations Should Vary by Age and Sex. White IR, et al. Addiction . 2004;99(6):749–756. Objectives/Methods. - PowerPoint PPT Presentation
Citation preview
www.alcoholandhealth.orgwww.alcoholandhealth.org 11
Update on Update on Alcohol and HealthAlcohol and Health
Alcohol and Health: Current EvidenceAlcohol and Health: Current Evidence
September–October 2004September–October 2004
www.alcoholandhealth.orgwww.alcoholandhealth.org 22
Studies on Studies on Alcohol Alcohol
and and Health OutcomesHealth Outcomes
www.alcoholandhealth.orgwww.alcoholandhealth.org 33
Safer Drinking Safer Drinking Recommendations Recommendations
Should Vary Should Vary by Age and Sex by Age and Sex
White IR, et al. Addiction. 2004;99(6):749–756.
www.alcoholandhealth.orgwww.alcoholandhealth.org 44
Objectives/MethodsObjectives/Methods
To quantify deaths attributable to and To quantify deaths attributable to and prevented by various levels of alcohol prevented by various levels of alcohol consumptionconsumption
Age- and sex-specific associations Age- and sex-specific associations between consumption and mortality (from between consumption and mortality (from meta-analyses of observational studies) meta-analyses of observational studies) combined with population survey and combined with population survey and national mortality data from England and national mortality data from England and WalesWales
www.alcoholandhealth.orgwww.alcoholandhealth.org 55
ResultsResults Over the lifespan, mortality attributable to Over the lifespan, mortality attributable to
and prevented by alcohol consumption and prevented by alcohol consumption was relatively balanced.was relatively balanced.
0.8% of all deaths in men were prevented by 0.8% of all deaths in men were prevented by use (95% confidence interval, CI, 0.2% to use (95% confidence interval, CI, 0.2% to 1.3%) and 0.1% of all deaths in women 1.3%) and 0.1% of all deaths in women attributable to use (95% CI, -0.3% to 0.4%).attributable to use (95% CI, -0.3% to 0.4%).
Deaths attributable to alcohol outweighed Deaths attributable to alcohol outweighed those prevented by use for men up to age those prevented by use for men up to age 54 and women up to age 64. 54 and women up to age 64.
www.alcoholandhealth.orgwww.alcoholandhealth.org 66
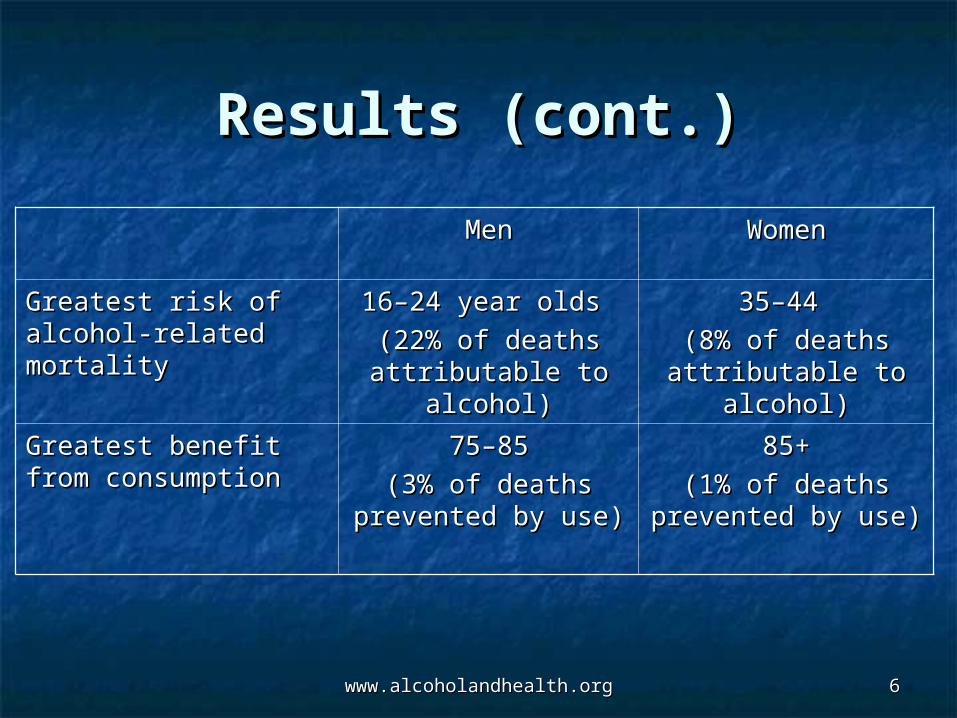
Results (cont.)Results (cont.)
MenMen WomenWomen
Greatest risk of Greatest risk of alcohol-related alcohol-related mortalitymortality
16–24 year olds 16–24 year olds
(22% of deaths (22% of deaths attributable to attributable to
alcohol)alcohol)
35–44 35–44
(8% of deaths (8% of deaths attributable to attributable to
alcohol)alcohol)
Greatest benefit from Greatest benefit from consumptionconsumption
75–8575–85
(3% of deaths (3% of deaths prevented by use)prevented by use)
85+85+
(1% of deaths (1% of deaths prevented by use)prevented by use)
www.alcoholandhealth.orgwww.alcoholandhealth.org 77
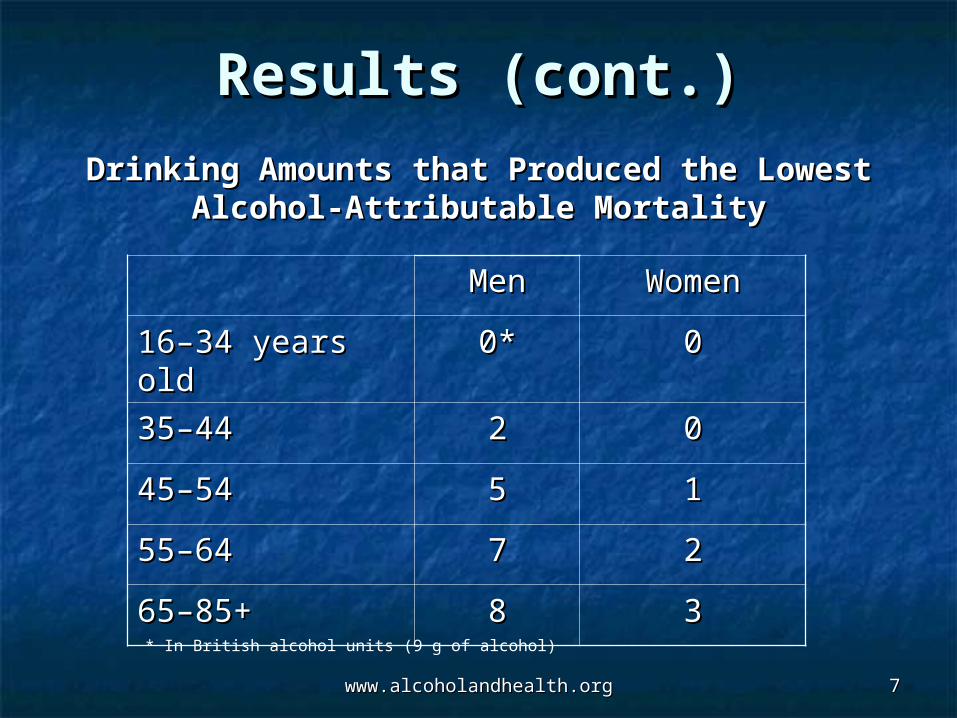
Results (cont.)Results (cont.)
MenMen WomenWomen
16–34 years old16–34 years old 0*0* 00
35–4435–44 22 00
45–5445–54 55 11
55–6455–64 77 22
65–85+65–85+ 88 33
Drinking Amounts that Produced the Drinking Amounts that Produced the Lowest Alcohol-Attributable MortalityLowest Alcohol-Attributable Mortality
* In British alcohol units (9 g of alcohol)
www.alcoholandhealth.orgwww.alcoholandhealth.org 88
Conclusions/CommentsConclusions/Comments
At least in England and Wales, mortality At least in England and Wales, mortality attributable to alcohol varies by age and attributable to alcohol varies by age and sex. sex.
Recommendations of safest limits, which Recommendations of safest limits, which appear to be lower than the often cited appear to be lower than the often cited “drink-a-day” for health, should vary as “drink-a-day” for health, should vary as well. well.
www.alcoholandhealth.orgwww.alcoholandhealth.org 99
Conclusions/Comments Conclusions/Comments (cont).(cont).
Because of their low risk of coronary heart Because of their low risk of coronary heart disease and higher risk of alcohol-related disease and higher risk of alcohol-related traffic accidents,traffic accidents, abstinence is the safest choice for men up to abstinence is the safest choice for men up to
age 34 and women up to age 44.age 34 and women up to age 44.
Although mortality benefits attributable to Although mortality benefits attributable to alcohol increase with age, alcohol increase with age,
a shift from abstinence to moderate a shift from abstinence to moderate consumption among elderly patients would consumption among elderly patients would only have a small effect on overall mortality.only have a small effect on overall mortality.
www.alcoholandhealth.orgwww.alcoholandhealth.org 1010
Alcohol and SeriousAlcohol and Serious Consequences:Consequences:
Risks Increase Even withRisks Increase Even with “ “Moderate Intake”Moderate Intake”
Corrao G, et al. Prev Med. 2004;38(5):613–619.
www.alcoholandhealth.orgwww.alcoholandhealth.org 1111
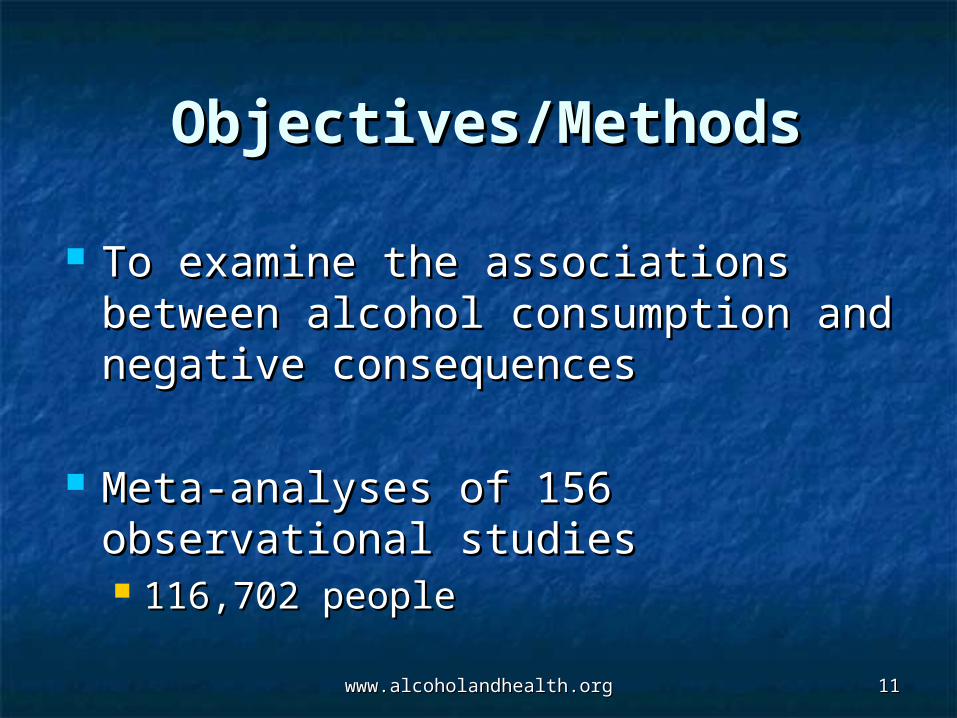
Objectives/MethodsObjectives/Methods
To examine the associations between To examine the associations between alcohol consumption and negative alcohol consumption and negative consequencesconsequences
Meta-analyses of 156 observational Meta-analyses of 156 observational studiesstudies 116,702 people116,702 people
www.alcoholandhealth.orgwww.alcoholandhealth.org 1212
ResultsResults
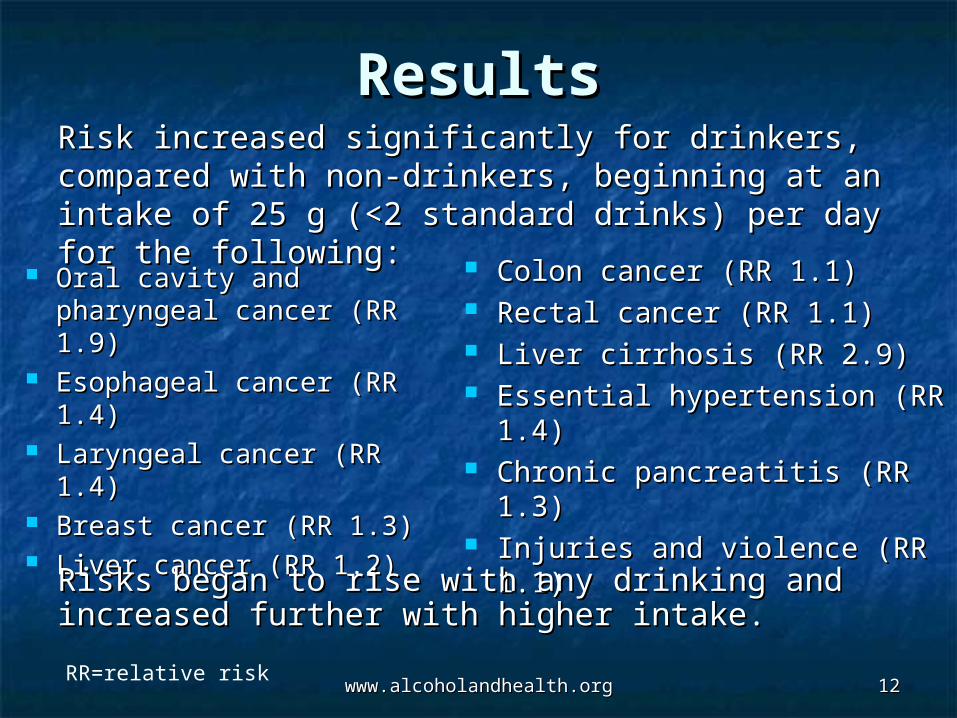
Oral cavity and Oral cavity and pharyngeal cancer (RR pharyngeal cancer (RR 1.9)1.9)
Esophageal cancer (RR Esophageal cancer (RR 1.4)1.4)
Laryngeal cancer (RR 1.4)Laryngeal cancer (RR 1.4) Breast cancer (RR 1.3)Breast cancer (RR 1.3) Liver cancer (RR 1.2)Liver cancer (RR 1.2)
Colon cancer (RR 1.1)Colon cancer (RR 1.1) Rectal cancer (RR 1.1)Rectal cancer (RR 1.1) Liver cirrhosis (RR 2.9)Liver cirrhosis (RR 2.9) Essential hypertension (RR Essential hypertension (RR
1.4)1.4) Chronic pancreatitis (RR 1.3)Chronic pancreatitis (RR 1.3) Injuries and violence (RR Injuries and violence (RR
1.1)1.1)
RR=relative risk
Risk increased significantly for drinkers, compared Risk increased significantly for drinkers, compared with non-drinkers, beginning at an intake of 25 g with non-drinkers, beginning at an intake of 25 g (<2 standard drinks) per day for the following:(<2 standard drinks) per day for the following:
Risks began to rise with any drinking and Risks began to rise with any drinking and increased further with higher intake.increased further with higher intake.
www.alcoholandhealth.orgwww.alcoholandhealth.org 1313
Results (cont.)Results (cont.)
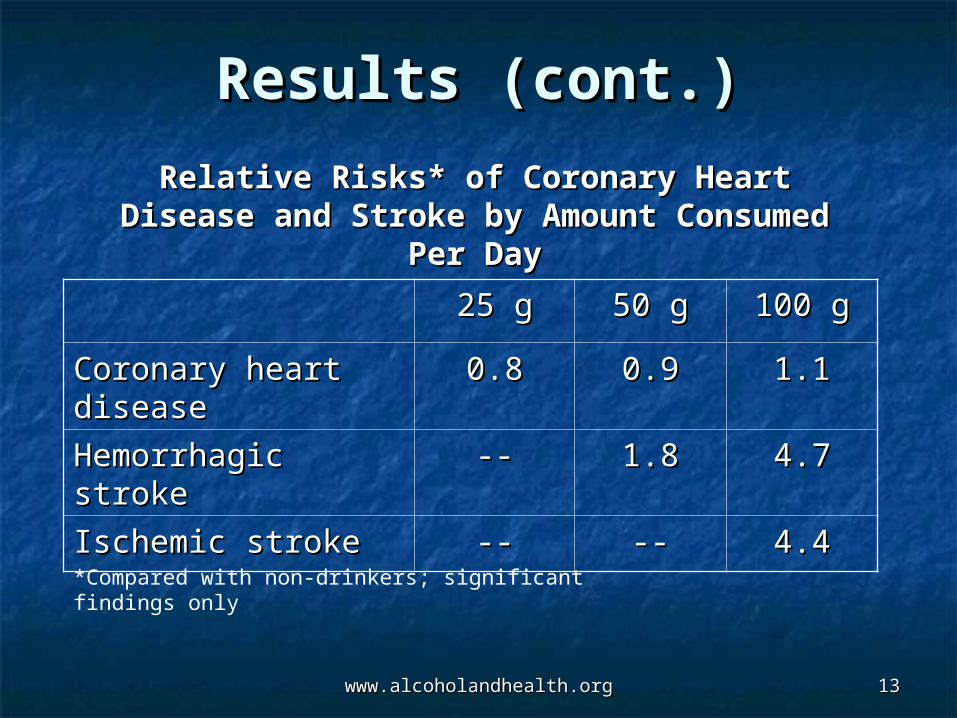
25 g25 g 50 g50 g 100 g100 g
Coronary heart Coronary heart diseasedisease
0.80.8 0.90.9 1.11.1
Hemorrhagic strokeHemorrhagic stroke ---- 1.81.8 4.74.7
Ischemic strokeIschemic stroke ---- ---- 4.44.4
Relative Risks* of Coronary Heart Disease Relative Risks* of Coronary Heart Disease and Stroke by Amount Consumed Per Dayand Stroke by Amount Consumed Per Day
*Compared with non-drinkers; significant findings only
www.alcoholandhealth.orgwww.alcoholandhealth.org 1414
Conclusions/CommentsConclusions/Comments
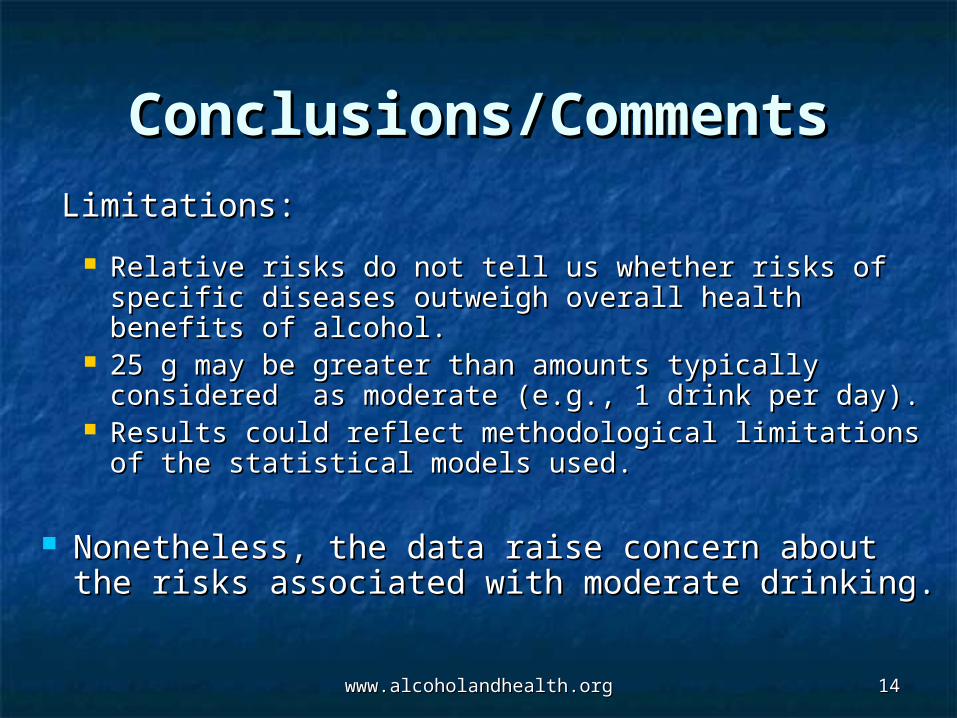
Limitations:Limitations:
Relative risks do not tell us whether risks of specific Relative risks do not tell us whether risks of specific diseases outweigh overall health benefits of alcohol.diseases outweigh overall health benefits of alcohol.
25 g may be greater than amounts typically 25 g may be greater than amounts typically considered as moderate (e.g., 1 drink per day).considered as moderate (e.g., 1 drink per day).
Results could reflect methodological limitations of Results could reflect methodological limitations of the statistical models used. the statistical models used.
Nonetheless, the data raise concern about the Nonetheless, the data raise concern about the
risks associated with moderate drinking.risks associated with moderate drinking.
www.alcoholandhealth.orgwww.alcoholandhealth.org 1515
Alcohol and the Risk of Alcohol and the Risk of Ischemic and Ischemic and
Hemorrhagic StrokeHemorrhagic Stroke
Iso H, et al. Iso H, et al. StrokeStroke. 2004;35(5):1124–1129.. 2004;35(5):1124–1129.
www.alcoholandhealth.orgwww.alcoholandhealth.org 1616
Objectives/MethodsObjectives/Methods
To examine the association between To examine the association between alcohol consumption and risk of alcohol consumption and risk of hemorrhagic and ischemic stroke in hemorrhagic and ischemic stroke in Japanese menJapanese men
19,544 men aged 4019,544 men aged 40––59 followed for 11 years59 followed for 11 years
Analyses adjusted for potential Analyses adjusted for potential confounders (e.g., age, smoking, diabetes, confounders (e.g., age, smoking, diabetes, hypertension)hypertension)
www.alcoholandhealth.orgwww.alcoholandhealth.org 1717
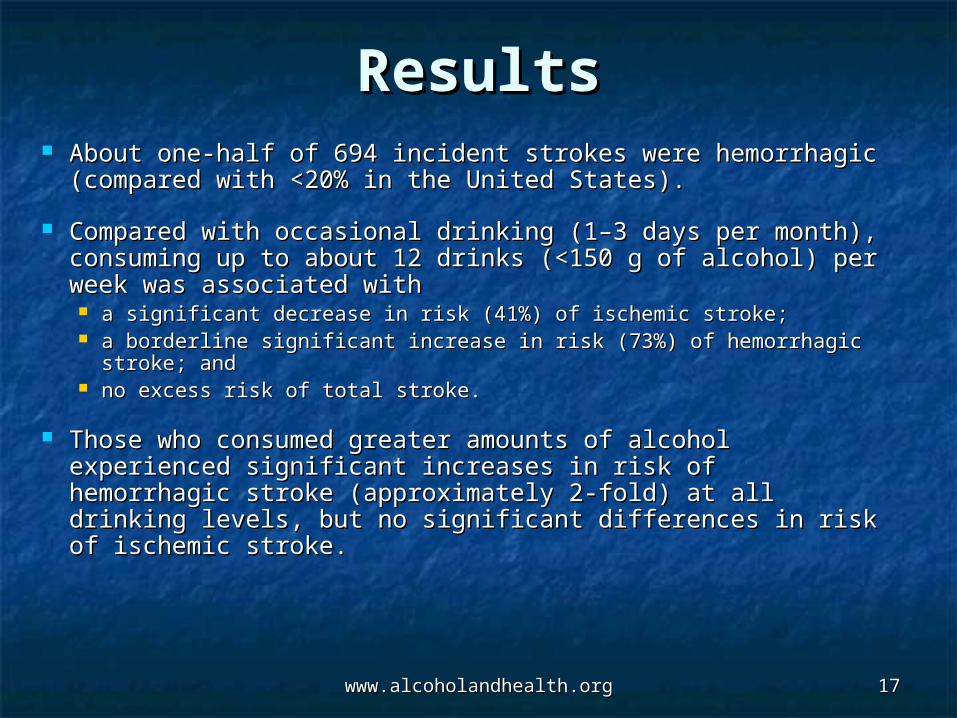
ResultsResults AboutAbout one-half of 694 incident strokes were hemorrhagic one-half of 694 incident strokes were hemorrhagic
(compared with <20% in the United States). (compared with <20% in the United States).
Compared with occasional drinking (1–3 days per month), Compared with occasional drinking (1–3 days per month), consuming up to about 12 drinks (<150 g of alcohol) per consuming up to about 12 drinks (<150 g of alcohol) per week was associated with week was associated with a significant decrease in risk (41%) of ischemic stroke; a significant decrease in risk (41%) of ischemic stroke; a borderline significant increase in risk (73%) of hemorrhagic a borderline significant increase in risk (73%) of hemorrhagic
stroke; and stroke; and no excess risk of total stroke. no excess risk of total stroke.
Those who consumed greater amounts of alcohol Those who consumed greater amounts of alcohol experienced significant increases in risk of hemorrhagic experienced significant increases in risk of hemorrhagic stroke (approximately 2-fold) at all drinking levels, but no stroke (approximately 2-fold) at all drinking levels, but no significant differences in risk of ischemic stroke. significant differences in risk of ischemic stroke.
www.alcoholandhealth.orgwww.alcoholandhealth.org 1818
Conclusions/CommentsConclusions/Comments This study confirms that moderate alcohol consumption This study confirms that moderate alcohol consumption
reduces risk of ischemic stroke.reduces risk of ischemic stroke. However, it found an increased risk of hemorrhagic stroke at However, it found an increased risk of hemorrhagic stroke at
amounts lower than previously reported in the United States amounts lower than previously reported in the United States (>3–5 drinks per day).(>3–5 drinks per day).
This challenges the belief that only heavy drinking increases the risk of This challenges the belief that only heavy drinking increases the risk of hemorrhagic stroke. hemorrhagic stroke.
Because the greater prevalence of hemorrhagic stroke in Asia Because the greater prevalence of hemorrhagic stroke in Asia
has a number of possible etiologies, it is unclear whether has a number of possible etiologies, it is unclear whether alcohol’s impact on stroke will be the same in the United States alcohol’s impact on stroke will be the same in the United States as in Japan.as in Japan.
www.alcoholandhealth.orgwww.alcoholandhealth.org 1919
Does Alcohol Intake Does Alcohol Intake Increase Increase
Colorectal Cancer Risk?Colorectal Cancer Risk?
Cho E, et al. Cho E, et al. Ann Intern MedAnn Intern Med. 2004;140(8):603–. 2004;140(8):603–613.613.
www.alcoholandhealth.orgwww.alcoholandhealth.org 2020
Objectives/MethodsObjectives/Methods
To examine the association between To examine the association between alcohol intake and colorectal canceralcohol intake and colorectal cancer
Pooling of primary data from 8 large Pooling of primary data from 8 large prospective cohort studies in 5 countries prospective cohort studies in 5 countries that reported incident cases of that reported incident cases of colorectal cancercolorectal cancer 4687 cases in a total of 489,979 men and 4687 cases in a total of 489,979 men and
womenwomen
www.alcoholandhealth.orgwww.alcoholandhealth.org 2121
ResultsResults
Consuming >=45 g of alcohol Consuming >=45 g of alcohol (roughly 3 standard drinks) per day, (roughly 3 standard drinks) per day, compared to not drinking, significantly compared to not drinking, significantly increased risk of colorectal cancer increased risk of colorectal cancer (relative risk, RR, 1.4). (relative risk, RR, 1.4).
Consuming 30 g to <45 g per day also Consuming 30 g to <45 g per day also increased risk (RR 1.2) at a borderline increased risk (RR 1.2) at a borderline level of significance.level of significance.
www.alcoholandhealth.orgwww.alcoholandhealth.org 2222
Results (cont.)Results (cont.) Results were consistent Results were consistent
among men and women; among men and women; by type of alcoholic beverage (i.e., beer, wine, liquor); by type of alcoholic beverage (i.e., beer, wine, liquor); regardless of multivitamin use, folate and methionine regardless of multivitamin use, folate and methionine
intake, and smoking; andintake, and smoking; and for all colon cancer sites (regardless of beverage for all colon cancer sites (regardless of beverage
type). type).
Those with a lower body mass index (BMI) who Those with a lower body mass index (BMI) who consumed alcohol had a higher risk of colorectal consumed alcohol had a higher risk of colorectal cancer.cancer.
www.alcoholandhealth.orgwww.alcoholandhealth.org 2323
Conclusions/CommentsConclusions/Comments
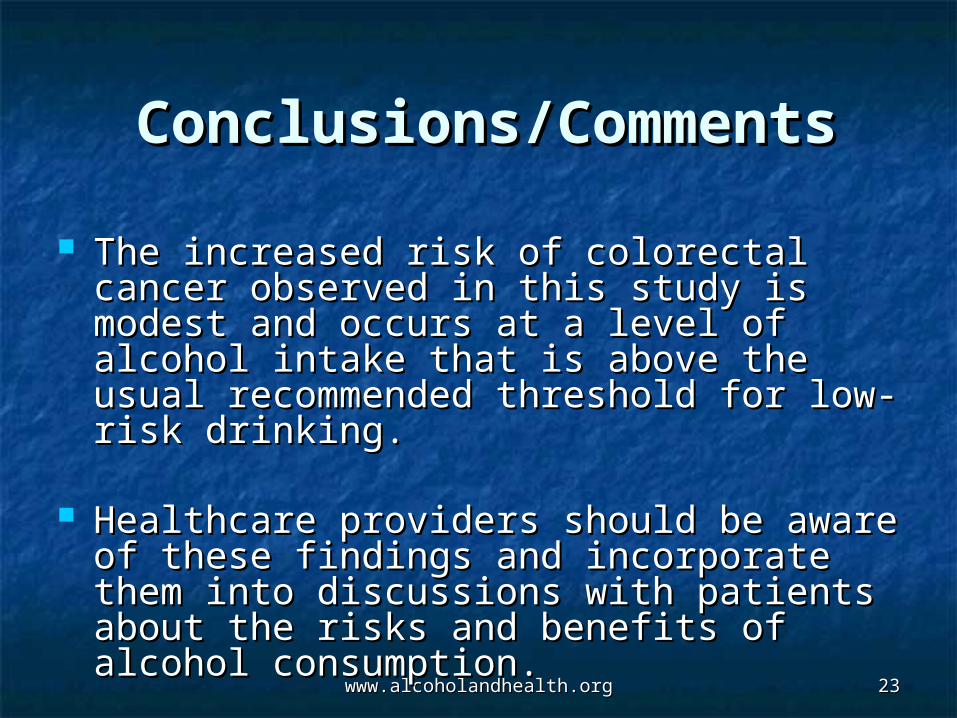
The increased risk of colorectal cancer The increased risk of colorectal cancer observed in this study is modest and observed in this study is modest and occurs at a level of alcohol intake that is occurs at a level of alcohol intake that is above the usual recommended threshold above the usual recommended threshold for low-risk drinking.for low-risk drinking.
Healthcare providers should be aware of Healthcare providers should be aware of
these findings and incorporate them into these findings and incorporate them into discussions with patients about the risks discussions with patients about the risks and benefits of alcohol consumption.and benefits of alcohol consumption.
www.alcoholandhealth.orgwww.alcoholandhealth.org 2424
Cognitive Effects of Cognitive Effects of Moderate Alcohol Moderate Alcohol
ConsumptionConsumption
Britton A, et al. Britton A, et al. Am J EpidemiolAm J Epidemiol. 2004;160(3):240–. 2004;160(3):240–247.247.
www.alcoholandhealth.orgwww.alcoholandhealth.org 2525
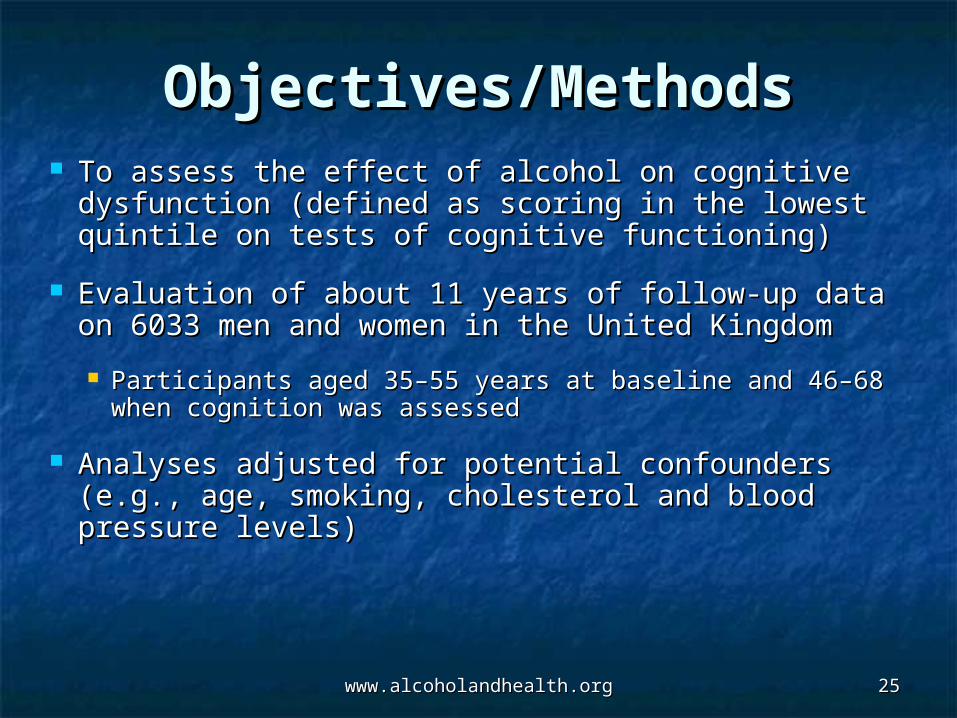
Objectives/MethodsObjectives/Methods To assess the effect of alcohol on cognitive To assess the effect of alcohol on cognitive
dysfunction (defined as scoring in the lowest dysfunction (defined as scoring in the lowest quintile on tests of cognitive functioning)quintile on tests of cognitive functioning)
Evaluation of about 11 years of follow-up data on Evaluation of about 11 years of follow-up data on 6033 men and women in the United Kingdom6033 men and women in the United Kingdom
Participants aged 35–55 years at baseline and 46–68 Participants aged 35–55 years at baseline and 46–68 when cognition was assessedwhen cognition was assessed
Analyses adjusted for potential confounders (e.g., Analyses adjusted for potential confounders (e.g., age, smoking, cholesterol and blood pressure age, smoking, cholesterol and blood pressure levels)levels)
www.alcoholandhealth.orgwww.alcoholandhealth.org 2626
ResultsResults
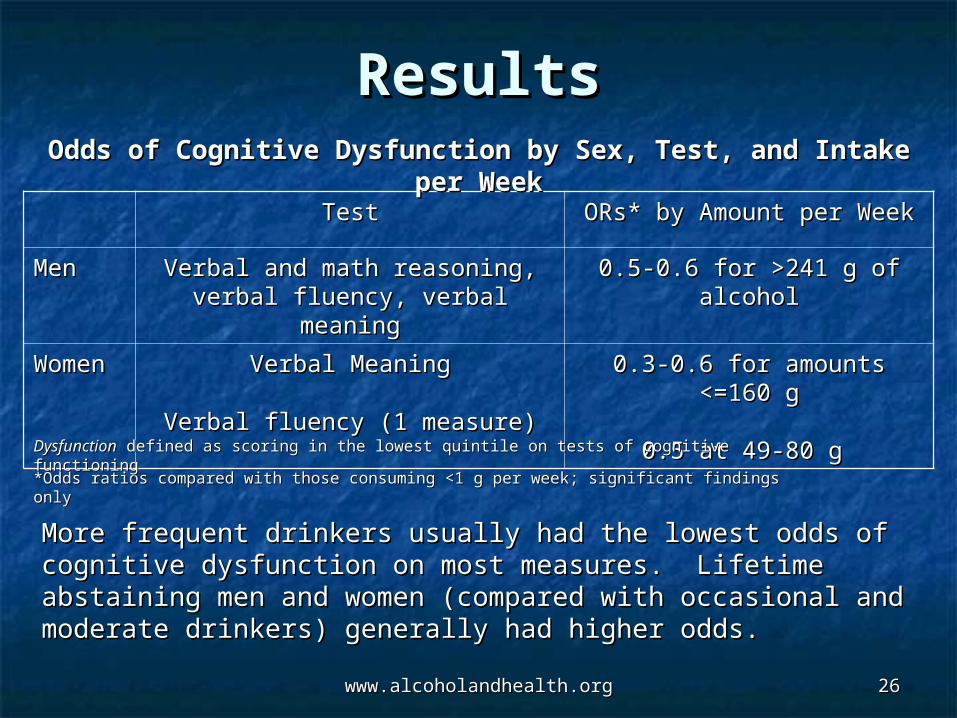
TestTest ORs* by Amount per WeekORs* by Amount per Week
MenMen Verbal and math reasoning, Verbal and math reasoning, verbal fluency, verbal meaningverbal fluency, verbal meaning
0.5-0.6 for >241 g of alcohol0.5-0.6 for >241 g of alcohol
WomenWomen Verbal MeaningVerbal Meaning
Verbal fluency (1 measure)Verbal fluency (1 measure)
0.30.3--0.6 for amounts <=160 0.6 for amounts <=160 gg
0.5 at 490.5 at 49--80 g 80 g
Odds of Cognitive Dysfunction by Sex, Test, and Intake Odds of Cognitive Dysfunction by Sex, Test, and Intake per Weekper Week
*Odds ratios compared with those consuming <1 g per week; significant findings only*Odds ratios compared with those consuming <1 g per week; significant findings only
More frequent drinkers usually had the lowest odds of cognitive More frequent drinkers usually had the lowest odds of cognitive dysfunction on most measures. Lifetime abstaining men and dysfunction on most measures. Lifetime abstaining men and women (compared with occasional and moderate drinkers) women (compared with occasional and moderate drinkers) generally had higher odds.generally had higher odds.
DysfunctionDysfunction defined as scoring in the lowest quintile on tests of cognitive functioning defined as scoring in the lowest quintile on tests of cognitive functioning
www.alcoholandhealth.orgwww.alcoholandhealth.org 2727
Conclusions/CommentsConclusions/Comments
TThis study is consistent with prior studies his study is consistent with prior studies showing the possible benefits of moderate showing the possible benefits of moderate drinking on cognition in middle-aged drinking on cognition in middle-aged adults. adults.
The mechanisms of protection against The mechanisms of protection against cognitive dysfunction are unknown, but cognitive dysfunction are unknown, but may relate to decreased cerebral vascular may relate to decreased cerebral vascular disease and/or increased cerebral blood disease and/or increased cerebral blood flow associated with moderate alcohol flow associated with moderate alcohol consumption. consumption.
www.alcoholandhealth.orgwww.alcoholandhealth.org 2828
Alcohol Worsens Alcohol Worsens HIV Treatment HIV Treatment
AdherenceAdherence
Samet JH, et al. Samet JH, et al. Alcohol Clin Exp ResAlcohol Clin Exp Res. . 2004;28(4):572–577.2004;28(4):572–577.
www.alcoholandhealth.orgwww.alcoholandhealth.org 2929
Objectives/MethodsObjectives/Methods
To determine whether there is an amount of To determine whether there is an amount of alcohol that does not affect adherence to alcohol that does not affect adherence to highly active antiretroviral therapy (HAART)highly active antiretroviral therapy (HAART)
Analysis of interview data from a Analysis of interview data from a prospective cohort of patients with HIV and prospective cohort of patients with HIV and a history of alcohol problemsa history of alcohol problems
Analyses adjusted for potential confounders Analyses adjusted for potential confounders (e.g., sex, race/ethnicity, age)(e.g., sex, race/ethnicity, age)
www.alcoholandhealth.orgwww.alcoholandhealth.org 3030
ResultsResults Among the 267 subjects with HIV who Among the 267 subjects with HIV who
were taking HAART (mostly male and were taking HAART (mostly male and ethnic minorities), ethnic minorities), 40% were currently drinking alcohol, with40% were currently drinking alcohol, with 16% consuming amounts associated with 16% consuming amounts associated with
alcohol-related consequences in the general alcohol-related consequences in the general population population (risky amounts: (risky amounts:
>14 drinks per week or >4 drinks per day for men;>14 drinks per week or >4 drinks per day for men;
>7 drinks per week or >3 drinks per day for women).>7 drinks per week or >3 drinks per day for women).
www.alcoholandhealth.orgwww.alcoholandhealth.org 3131
Results (cont.)Results (cont.)
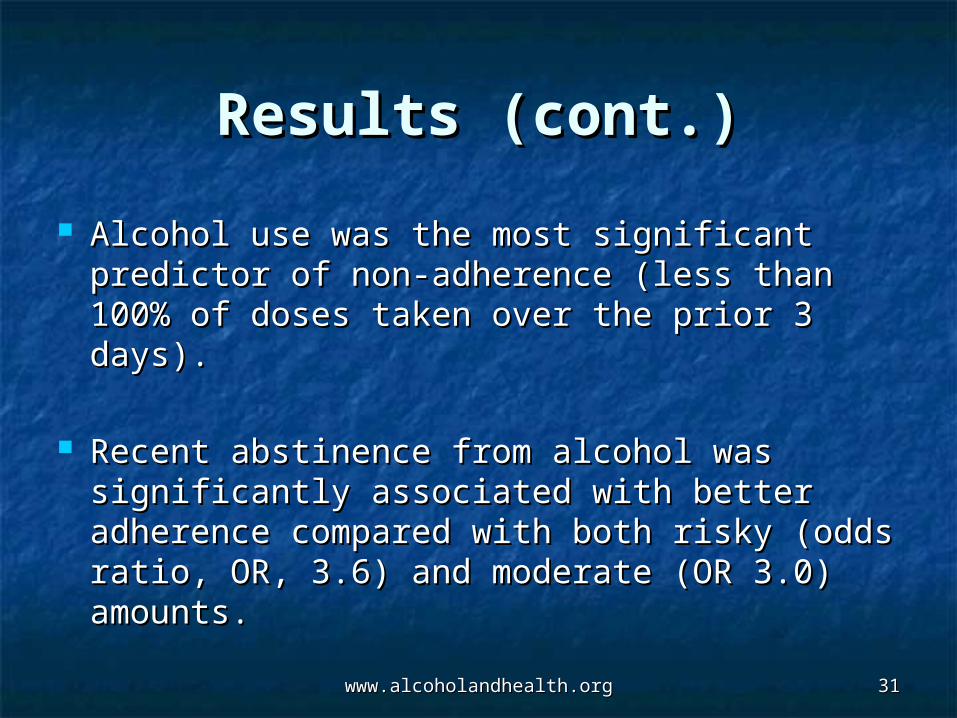
Alcohol use was the most significant Alcohol use was the most significant predictor of non-adherence (less than 100% predictor of non-adherence (less than 100% of doses taken over the prior 3 days). of doses taken over the prior 3 days).
Recent abstinence from alcohol was Recent abstinence from alcohol was
significantly associated with better significantly associated with better adherence compared with both risky (odds adherence compared with both risky (odds ratio, OR, 3.6) and moderate (OR 3.0) ratio, OR, 3.6) and moderate (OR 3.0) amounts.amounts.
www.alcoholandhealth.orgwww.alcoholandhealth.org 3232
Conclusions/CommentsConclusions/Comments
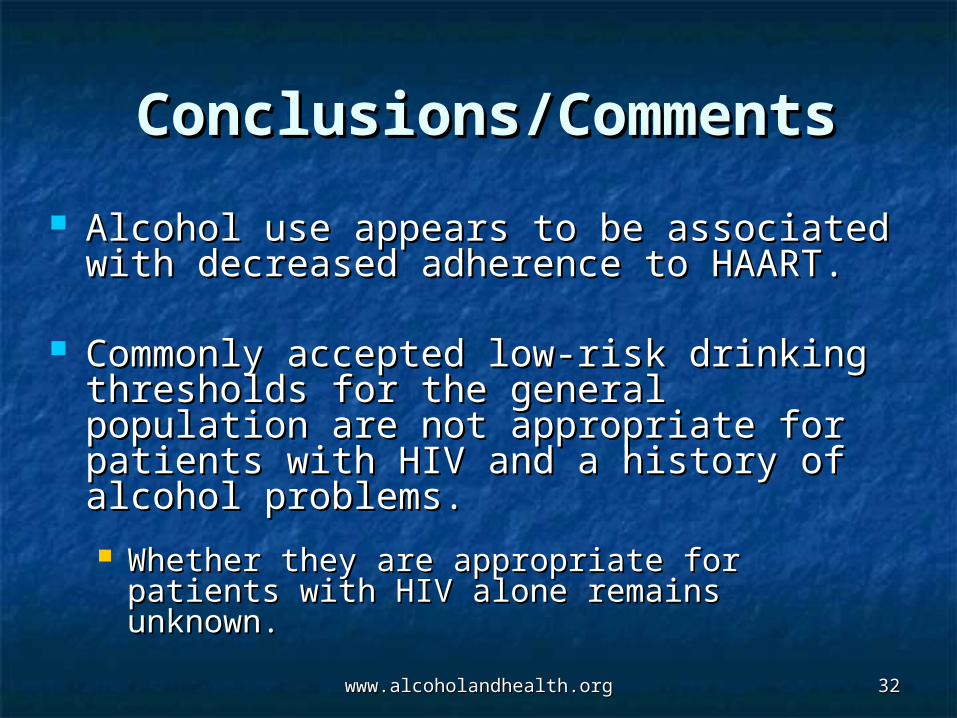
Alcohol use appears to be associated with Alcohol use appears to be associated with decreased adherence to HAART. decreased adherence to HAART.
Commonly accepted low-risk drinking Commonly accepted low-risk drinking thresholds for the general population are thresholds for the general population are not appropriate for patients with HIV and a not appropriate for patients with HIV and a history of alcohol problems. history of alcohol problems. Whether they are appropriate for patients with Whether they are appropriate for patients with
HIV alone remains unknown. HIV alone remains unknown.
www.alcoholandhealth.orgwww.alcoholandhealth.org 3333
Studies on Studies on InterventionsInterventions
www.alcoholandhealth.orgwww.alcoholandhealth.org 3434
Collaborative Care Collaborative Care Reduces Alcohol Reduces Alcohol
Problems and PTSD in Problems and PTSD in Trauma PatientsTrauma Patients
Zatzick D, et al. Zatzick D, et al. Arch Gen PsychiatArch Gen Psychiat. 2004;61(5):498–506.. 2004;61(5):498–506.
www.alcoholandhealth.orgwww.alcoholandhealth.org 3535
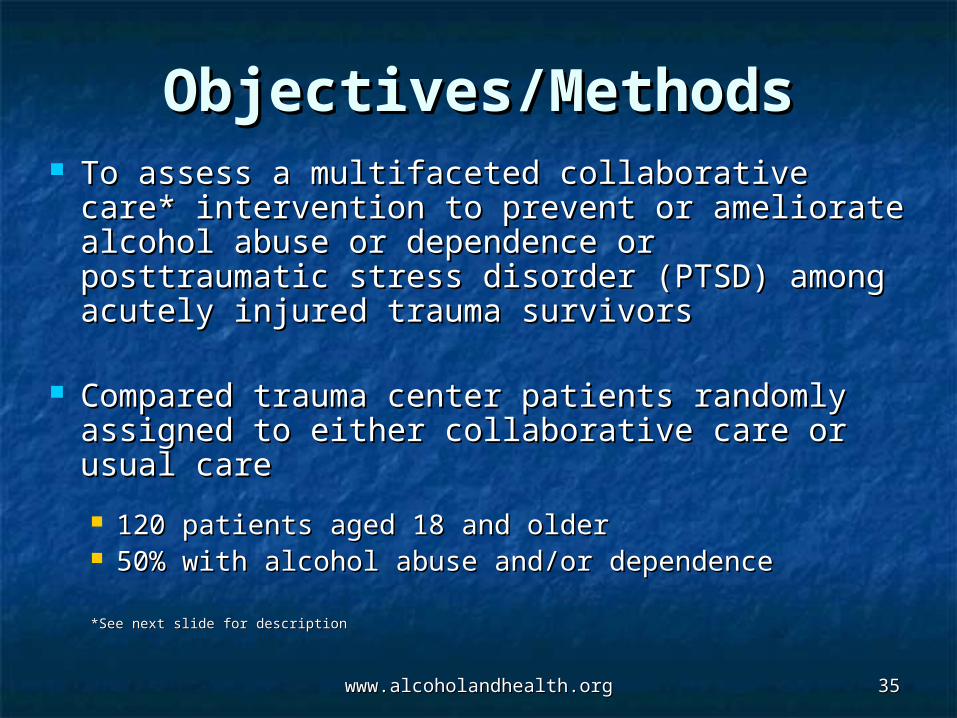
Objectives/MethodsObjectives/Methods To assess a multifaceted collaborative care* To assess a multifaceted collaborative care*
intervention to prevent or ameliorate alcohol intervention to prevent or ameliorate alcohol abuse or dependence or posttraumatic stress abuse or dependence or posttraumatic stress disorder (PTSD) among acutely injured trauma disorder (PTSD) among acutely injured trauma survivorssurvivors
Compared trauma center patients randomly Compared trauma center patients randomly assigned to either collaborative care or usual assigned to either collaborative care or usual carecare
120 patients aged 18 and older 120 patients aged 18 and older 50% with alcohol abuse and/or dependence50% with alcohol abuse and/or dependence
*See next slide for description*See next slide for description
www.alcoholandhealth.orgwww.alcoholandhealth.org 3636
Objectives/Methods Objectives/Methods (cont.)(cont.)
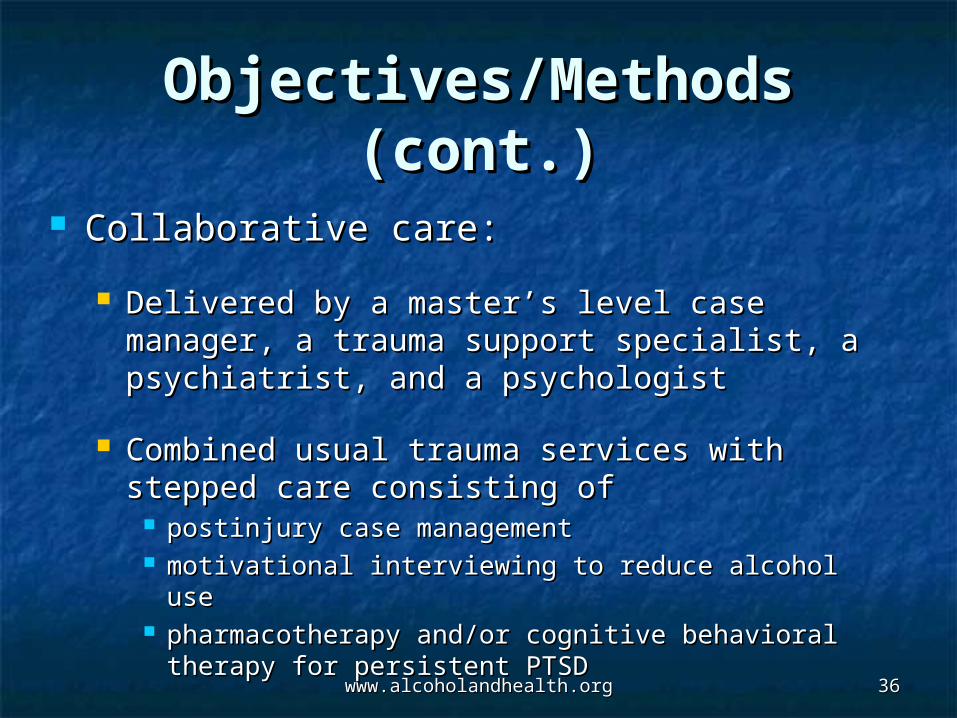
Collaborative care:Collaborative care:
Delivered by a master’s level case manager, a Delivered by a master’s level case manager, a trauma support specialist, a psychiatrist, and a trauma support specialist, a psychiatrist, and a psychologistpsychologist
Combined usual trauma services with stepped Combined usual trauma services with stepped care consisting of care consisting of
postinjury case management postinjury case management motivational interviewing to reduce alcohol use motivational interviewing to reduce alcohol use pharmacotherapy and/or cognitive behavioral pharmacotherapy and/or cognitive behavioral
therapy for persistent PTSDtherapy for persistent PTSD
www.alcoholandhealth.orgwww.alcoholandhealth.org 3737
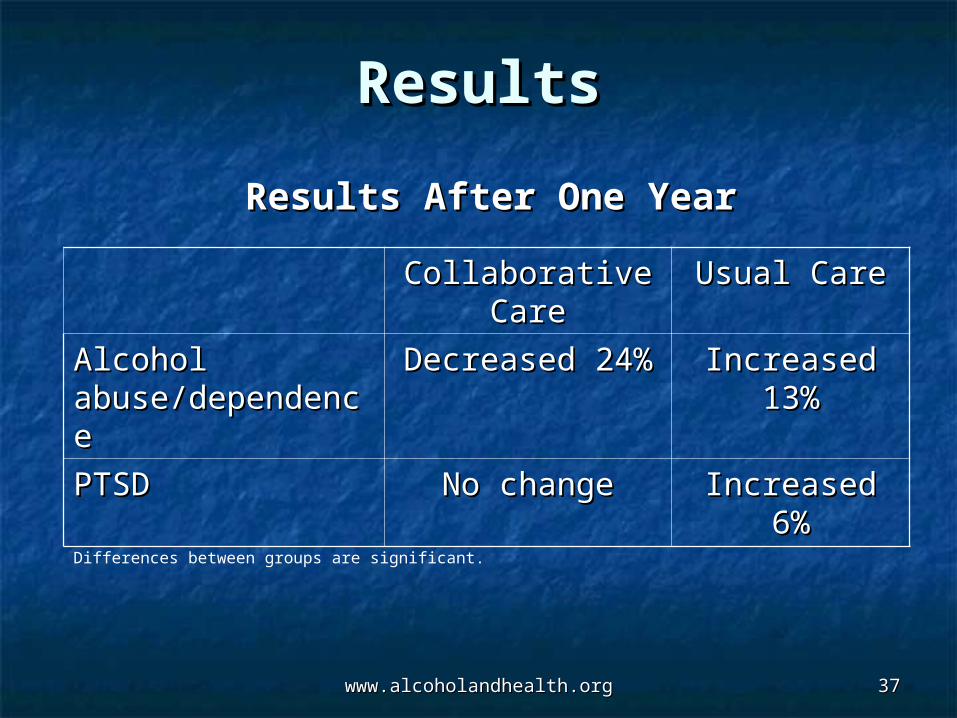
ResultsResults
Collaborative Collaborative CareCare
Usual CareUsual Care
Alcohol Alcohol abuse/dependencabuse/dependencee
Decreased 24%Decreased 24% Increased Increased 13%13%
PTSDPTSD No changeNo change Increased 6%Increased 6%
Results After One YearResults After One Year
Differences between groups are significant.
www.alcoholandhealth.orgwww.alcoholandhealth.org 3838
Conclusions/CommentsConclusions/Comments Integrating mental health and substance Integrating mental health and substance
abuse services into the management of abuse services into the management of trauma appears to decrease alcohol trauma appears to decrease alcohol consequences and even prevent PTSD.consequences and even prevent PTSD.
Health-related quality of life and cost-Health-related quality of life and cost-effectiveness studies are needed. effectiveness studies are needed.
With a growing acceptance of alcohol With a growing acceptance of alcohol screening and intervention by trauma screening and intervention by trauma surgeons, the time is right for the surgeons, the time is right for the dissemination of effective collaborative care dissemination of effective collaborative care models. models.
www.alcoholandhealth.orgwww.alcoholandhealth.org 3939
Naltrexone Underused Naltrexone Underused to Treat Alcohol to Treat Alcohol
DependenceDependence
Harris KM, et al. Harris KM, et al. Psychiatr ServPsychiatr Serv. 2004;55(3):221.. 2004;55(3):221.
www.alcoholandhealth.orgwww.alcoholandhealth.org 4040
Objectives/MethodsObjectives/Methods
To determine the frequency and duration To determine the frequency and duration of naltrexone useof naltrexone use
Analysis of insurance claims of 1.5 million Analysis of insurance claims of 1.5 million health plan members with prescription health plan members with prescription drug and behavioral health benefits to drug and behavioral health benefits to assess filled prescriptions for naltrexone assess filled prescriptions for naltrexone from 2000 to 2002from 2000 to 2002
www.alcoholandhealth.orgwww.alcoholandhealth.org 4141
ResultsResults
Less than 10% of plan members who Less than 10% of plan members who received treatment for alcohol received treatment for alcohol dependence received naltrexone.dependence received naltrexone.
Approximately one-half of the Approximately one-half of the naltrexone prescriptions were naltrexone prescriptions were supplied for 30 days or fewer.supplied for 30 days or fewer.
www.alcoholandhealth.orgwww.alcoholandhealth.org 4242
Conclusions/CommentsConclusions/Comments
Despite demonstrated efficacy, naltrexone Despite demonstrated efficacy, naltrexone is not being prescribed frequently, nor is it is not being prescribed frequently, nor is it being prescribed for adequate courses of being prescribed for adequate courses of treatment. treatment.
Efforts are needed to disseminate proven Efforts are needed to disseminate proven effective treatments for alcohol effective treatments for alcohol dependence, like naltrexone, into clinical dependence, like naltrexone, into clinical practice.practice.
www.alcoholandhealth.orgwww.alcoholandhealth.org 4343
Studies on Studies on Special PopulationsSpecial Populations
www.alcoholandhealth.orgwww.alcoholandhealth.org 4444
Anxiety, Anxiety, Sleep Disturbance, and Sleep Disturbance, and
Alcohol-Related Alcohol-Related ProblemsProblems
Crum RM, et al. Crum RM, et al. Am J PsychiatryAm J Psychiatry. 2004;161(7):1197–. 2004;161(7):1197–1203.1203.
www.alcoholandhealth.orgwww.alcoholandhealth.org 4545
Objectives/MethodsObjectives/Methods
To examine whether sleep loss due to worry To examine whether sleep loss due to worry increases risk of developing alcohol-related increases risk of developing alcohol-related problemsproblems
Analysis of interview data from a population-Analysis of interview data from a population-based sample of 1537 individuals in based sample of 1537 individuals in Baltimore in 1981 and again 12 years laterBaltimore in 1981 and again 12 years later
Analyses adjusted for possible confounders Analyses adjusted for possible confounders (e.g., age, sex, race, education)(e.g., age, sex, race, education)
www.alcoholandhealth.orgwww.alcoholandhealth.org 4646
ResultsResultsCompared with those who reported no sleepCompared with those who reported no sleepdisturbances at baseline,disturbances at baseline,
the risk of developing an alcohol-related the risk of developing an alcohol-related problem was significantly higher among problem was significantly higher among those who reported more-than-usual sleep those who reported more-than-usual sleep loss due to worry. loss due to worry.
Alcohol-related problem Alcohol-related problem was defined as having was defined as having any of the alcohol-related symptoms used to any of the alcohol-related symptoms used to diagnose DSM-III-R abuse or dependence. diagnose DSM-III-R abuse or dependence.
www.alcoholandhealth.orgwww.alcoholandhealth.org 4747
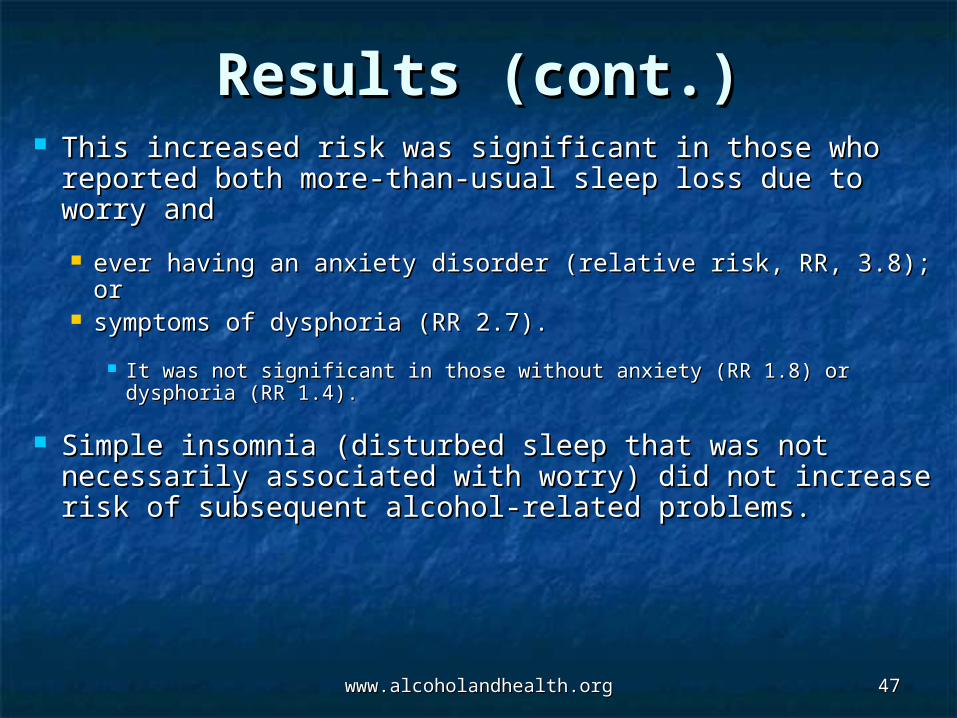
Results (cont.)Results (cont.) This increased risk was significant in those who This increased risk was significant in those who
reported both more-than-usual sleep loss due to reported both more-than-usual sleep loss due to worry and worry and
ever having an anxiety disorder (relative risk, RR, 3.8); or ever having an anxiety disorder (relative risk, RR, 3.8); or symptoms of dysphoria (RR 2.7). symptoms of dysphoria (RR 2.7).
It was not significant in those without anxiety (RR 1.8) or It was not significant in those without anxiety (RR 1.8) or dysphoria (RR 1.4). dysphoria (RR 1.4).
Simple insomnia (disturbed sleep that was not Simple insomnia (disturbed sleep that was not necessarily associated with worry) did not increase necessarily associated with worry) did not increase risk of subsequent alcohol-related problems.risk of subsequent alcohol-related problems.
www.alcoholandhealth.orgwww.alcoholandhealth.org 4848
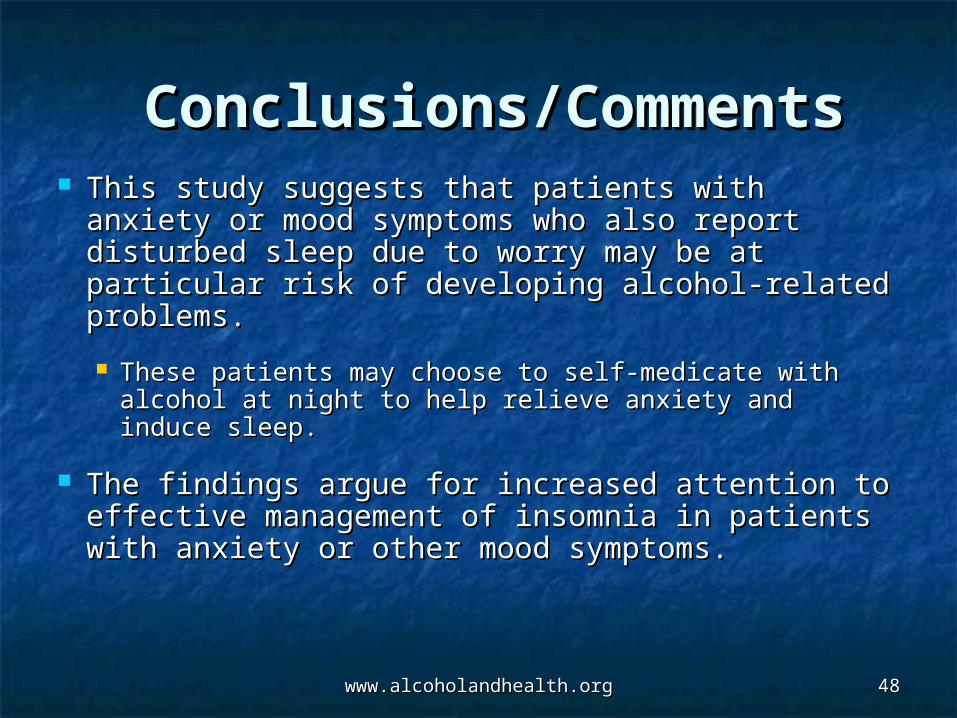
Conclusions/CommentsConclusions/Comments TThis study suggests that patients with anxiety his study suggests that patients with anxiety
or mood symptoms who also report disturbed or mood symptoms who also report disturbed sleep due to worry may be at particular risk of sleep due to worry may be at particular risk of developing alcohol-related problems. developing alcohol-related problems.
These patients may choose to self-medicate with These patients may choose to self-medicate with alcohol at night to help relieve anxiety and induce alcohol at night to help relieve anxiety and induce sleep. sleep.
The findings argue for increased attention to The findings argue for increased attention to effective management of insomnia in patients effective management of insomnia in patients with anxiety or other mood symptoms. with anxiety or other mood symptoms.

www.alcoholandhealth.orgwww.alcoholandhealth.org 4949
Alcohol and Aggression Alcohol and Aggression Experienced by Experienced by College WomenCollege Women
Parks KA, et al. Parks KA, et al. Alcohol Clin Exp ResAlcohol Clin Exp Res. 2004;28(4):625–. 2004;28(4):625–629.629.
www.alcoholandhealth.orgwww.alcoholandhealth.org 5050
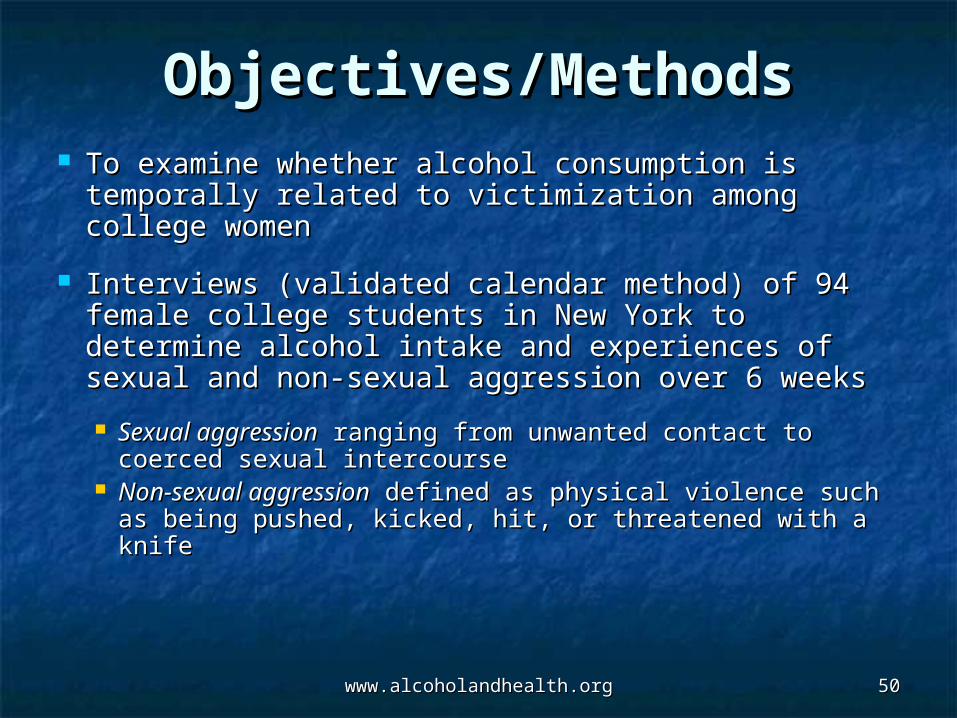
Objectives/MethodsObjectives/Methods To examine whether alcohol consumption is To examine whether alcohol consumption is
temporally related to victimization among college temporally related to victimization among college womenwomen
Interviews (validated calendar method) of 94 Interviews (validated calendar method) of 94 female college students in New York to determine female college students in New York to determine alcohol intake and experiences of sexual and non-alcohol intake and experiences of sexual and non-sexual aggression over 6 weeks sexual aggression over 6 weeks
Sexual aggressionSexual aggression ranging from unwanted contact to ranging from unwanted contact to coerced sexual intercoursecoerced sexual intercourse
Non-sexual aggressionNon-sexual aggression defined as physical violence such defined as physical violence such as being pushed, kicked, hit, or threatened with a knifeas being pushed, kicked, hit, or threatened with a knife
www.alcoholandhealth.orgwww.alcoholandhealth.org 5151
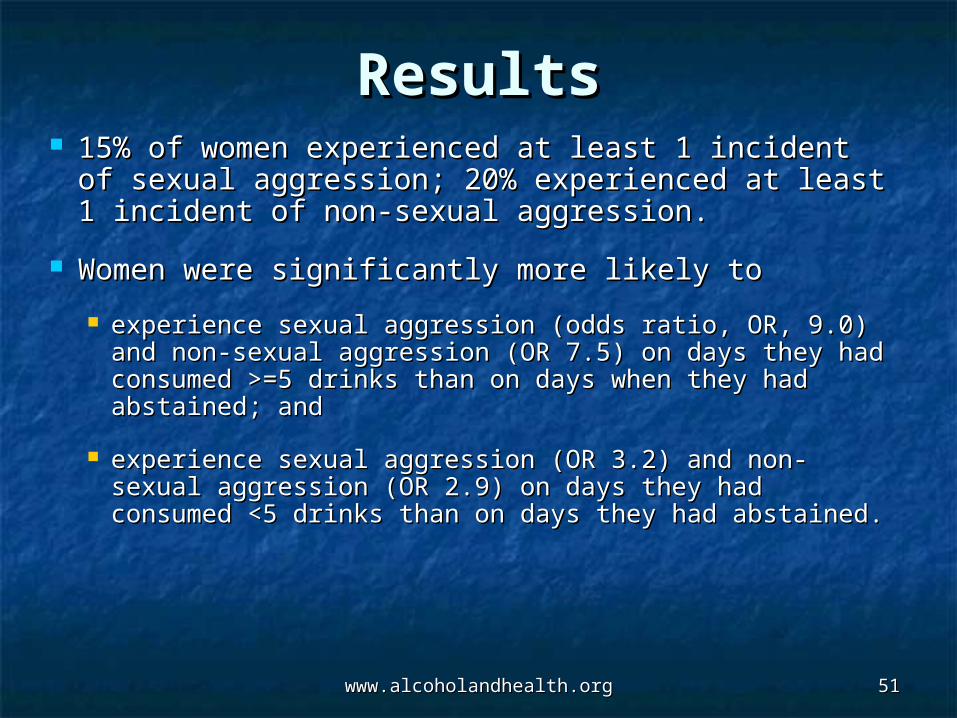
ResultsResults 15% of women experienced at least 1 incident of 15% of women experienced at least 1 incident of
sexual aggression; 20% experienced at least 1 sexual aggression; 20% experienced at least 1 incident of non-sexual aggression.incident of non-sexual aggression.
Women were significantly more likely to Women were significantly more likely to
experience sexual aggression (odds ratio, OR, 9.0) and experience sexual aggression (odds ratio, OR, 9.0) and non-sexual aggression (OR 7.5) on days they had non-sexual aggression (OR 7.5) on days they had consumed >=5 drinks than on days when they had consumed >=5 drinks than on days when they had abstained; andabstained; and
experience sexual aggression (OR 3.2) and non-sexual experience sexual aggression (OR 3.2) and non-sexual aggression (OR 2.9) on days they had consumed <5 aggression (OR 2.9) on days they had consumed <5 drinks than on days they had abstained.drinks than on days they had abstained.
www.alcoholandhealth.orgwww.alcoholandhealth.org 5252
Conclusions/CommentsConclusions/Comments TThis small study provides further evidence his small study provides further evidence
that alcohol increases college women’s risk that alcohol increases college women’s risk of experiencing sexual and non-sexual of experiencing sexual and non-sexual aggression. aggression.
Its findings support efforts on college Its findings support efforts on college campuses to teach female students the campuses to teach female students the dangers of alcohol (especially heavier intake) dangers of alcohol (especially heavier intake) and ways to adopt lower-risk drinking habits. and ways to adopt lower-risk drinking habits.
These efforts must be coupled with initiatives These efforts must be coupled with initiatives that focus on perpetrators and address the that focus on perpetrators and address the role alcohol plays in their violent actions.role alcohol plays in their violent actions.
www.alcoholandhealth.orgwww.alcoholandhealth.org 5353
Alcohol Use and Racial Alcohol Use and Racial and Ethnic Health and Ethnic Health
DisparitiesDisparities
Russo D, et al. Russo D, et al. AlcoholAlcohol. 2004;32(1):37–43.. 2004;32(1):37–43.
www.alcoholandhealth.orgwww.alcoholandhealth.org 5454
Objectives/MethodsObjectives/Methods
Summary of conclusions from a Summary of conclusions from a workshopworkshop
sponsored by the National Institute on sponsored by the National Institute on Alcohol Abuse and Alcoholism Alcohol Abuse and Alcoholism
to examine alcohol use and racial and to examine alcohol use and racial and ethnic health disparitiesethnic health disparities
www.alcoholandhealth.orgwww.alcoholandhealth.org 5555
ResultsResults Interactions between alcohol, genes, and Interactions between alcohol, genes, and
environment contribute to health disparities.environment contribute to health disparities.
Different populations exhibit genetic variations in Different populations exhibit genetic variations in alcohol-metabolizing enzymes. alcohol-metabolizing enzymes.
These variations may contribute to differences in alcohol-These variations may contribute to differences in alcohol-related health outcomes. related health outcomes.
African Americans and Native Americans, compared African Americans and Native Americans, compared with whites, have a greater incidence of fetal alcohol with whites, have a greater incidence of fetal alcohol syndrome and fetal alcohol spectrum disorders, syndrome and fetal alcohol spectrum disorders, possibly due to genetic polymorphisms and nutrition.possibly due to genetic polymorphisms and nutrition.
www.alcoholandhealth.orgwww.alcoholandhealth.org 5656
Results (cont.)Results (cont.)
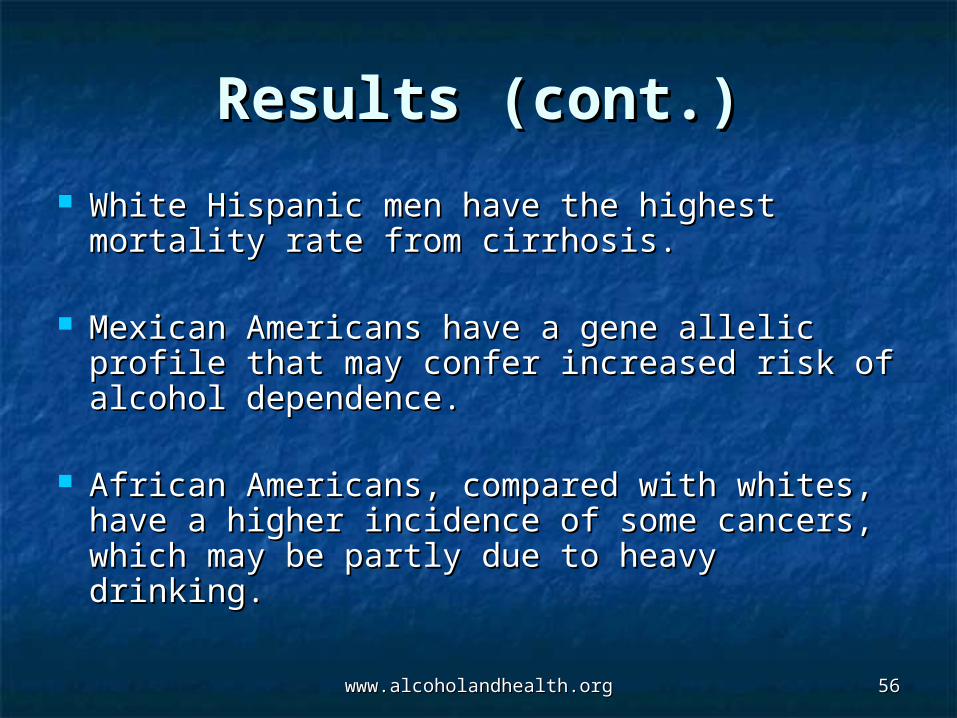
White Hispanic men have the highest White Hispanic men have the highest mortality rate from cirrhosis.mortality rate from cirrhosis.
Mexican Americans have a gene allelic Mexican Americans have a gene allelic profile that may confer increased risk of profile that may confer increased risk of alcohol dependence.alcohol dependence.
African Americans, compared with whites, African Americans, compared with whites, have a higher incidence of some cancers, have a higher incidence of some cancers, which may be partly due to heavy drinking.which may be partly due to heavy drinking.
www.alcoholandhealth.orgwww.alcoholandhealth.org 5757
Conclusions/CommentsConclusions/Comments
This paper confirms that our understanding This paper confirms that our understanding of racial and ethnic disparities in alcohol-of racial and ethnic disparities in alcohol-related health consequences is progressing, related health consequences is progressing, but we still have much to learn. but we still have much to learn.
Through better understanding, we may Through better understanding, we may ultimately develop diagnostic, preventive, ultimately develop diagnostic, preventive, and therapeutic methods to decrease these and therapeutic methods to decrease these disparities.disparities.
www.alcoholandhealth.orgwww.alcoholandhealth.org 5858
Using the AUDIT in a Using the AUDIT in a College SampleCollege Sample
Kokotailo PK, et al. Kokotailo PK, et al. Alcohol Clin Exp ResAlcohol Clin Exp Res. . 2004;28(6):914–920.2004;28(6):914–920.
www.alcoholandhealth.orgwww.alcoholandhealth.org 5959
Objectives/MethodsObjectives/Methods
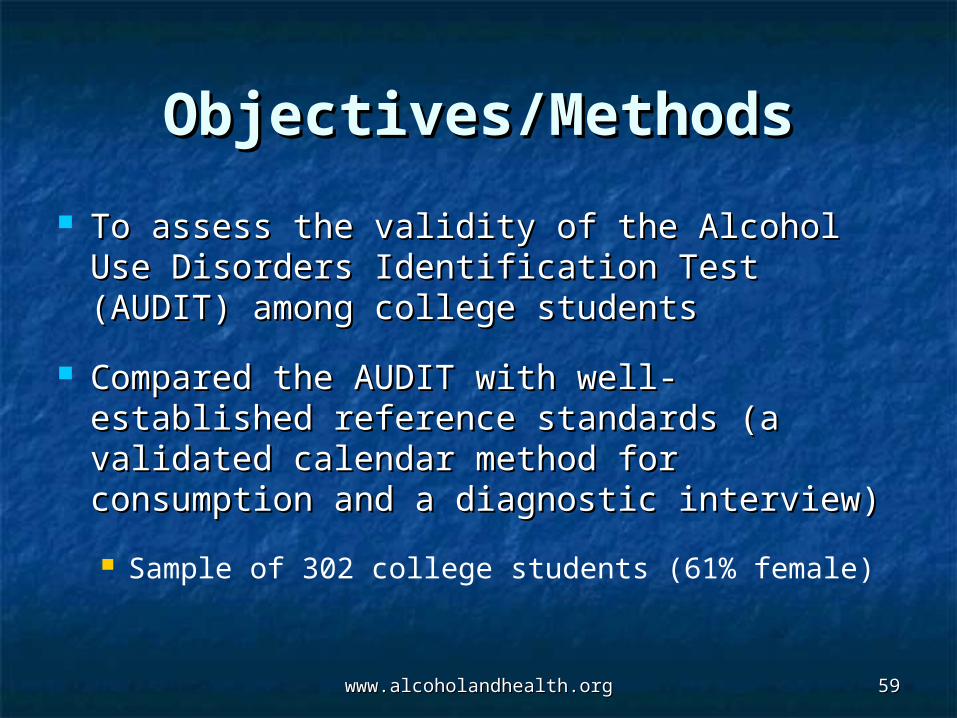
To assess the validity of the Alcohol Use To assess the validity of the Alcohol Use Disorders Identification Test (AUDIT) Disorders Identification Test (AUDIT) among college studentsamong college students
Compared the AUDIT with well-established Compared the AUDIT with well-established reference standards (a validated calendar reference standards (a validated calendar method for consumption and a diagnostic method for consumption and a diagnostic interview)interview)
Sample of 302 college students (61% female)
www.alcoholandhealth.orgwww.alcoholandhealth.org 6060
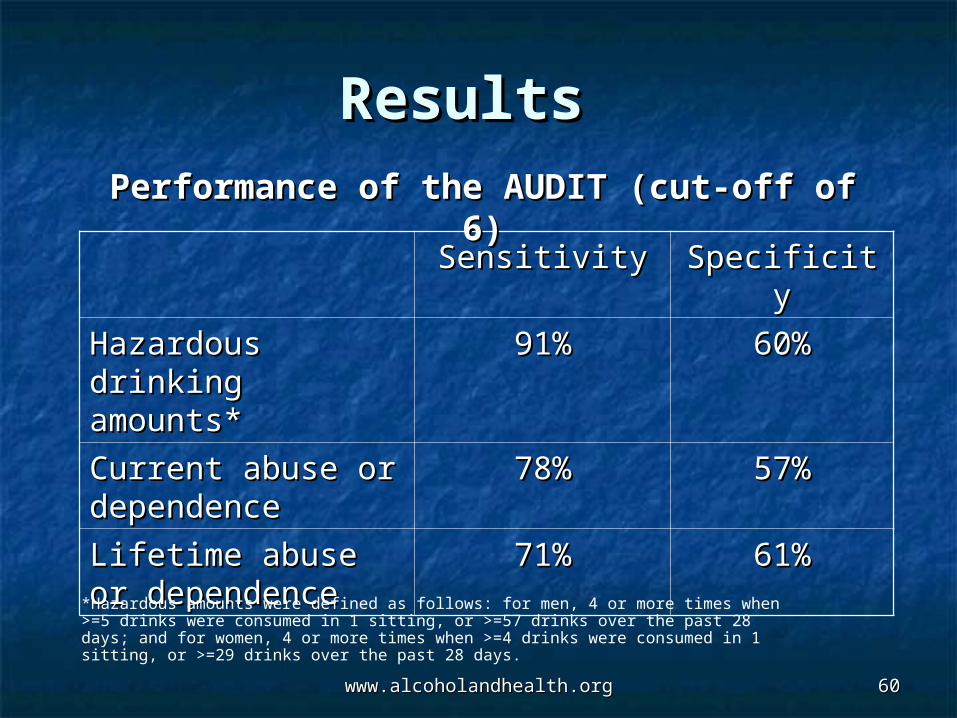
Results Results
SensitivitySensitivity SpecificitySpecificity
Hazardous drinking Hazardous drinking amounts*amounts*
91%91% 60%60%
Current abuse or Current abuse or dependencedependence
78%78% 57%57%
Lifetime abuse or Lifetime abuse or dependencedependence
71%71% 61%61%
*Hazardous amounts were defined as follows: for men, 4 or more times when >=5 drinks were consumed in 1 sitting, or >=57 drinks over the past 28 days; and for women, 4 or more times when >=4 drinks were consumed in 1 sitting, or >=29 drinks over the past 28 days.
Performance of the AUDIT (cut-off of 6)Performance of the AUDIT (cut-off of 6)
www.alcoholandhealth.orgwww.alcoholandhealth.org 6161
Conclusions/CommentsConclusions/Comments Using well-established reference standards, the Using well-established reference standards, the
authors demonstrated that the AUDIT performs authors demonstrated that the AUDIT performs well as a screen for hazardous drinking amounts well as a screen for hazardous drinking amounts and less well for alcohol abuse or dependence in and less well for alcohol abuse or dependence in college students. college students.
Researchers should study ways to improve the Researchers should study ways to improve the sensitivity of the AUDIT in the college population, sensitivity of the AUDIT in the college population, as they have in other groups. as they have in other groups.
But for now, using a lower cut-off on the AUDIT But for now, using a lower cut-off on the AUDIT than is standard for adults seems a reasonable than is standard for adults seems a reasonable approach to early identification of hazardous approach to early identification of hazardous drinking in college students. drinking in college students.
www.alcoholandhealth.orgwww.alcoholandhealth.org 6262
Adolescent Substance Adolescent Substance Abuse in the Abuse in the
US and AustraliaUS and Australia
Beyers JM, et al. Beyers JM, et al. J Adolesc HealthJ Adolesc Health. . 2004;35(1):3–16.2004;35(1):3–16.
www.alcoholandhealth.orgwww.alcoholandhealth.org 6363
Objectives/MethodsObjectives/Methods
To explore potential differences in the To explore potential differences in the prevalence of, and risk and protective factors prevalence of, and risk and protective factors for, adolescent substance use in the United for, adolescent substance use in the United States (US) and Australia that may be States (US) and Australia that may be associated with different national drug control associated with different national drug control policiespolicies
US policy of reducing drug useUS policy of reducing drug use Australia policy of reducing the harms of useAustralia policy of reducing the harms of use
Analysis of survey data from 40,845 Analysis of survey data from 40,845 adolescentsadolescents
www.alcoholandhealth.orgwww.alcoholandhealth.org 6464
ResultsResults
MMore Australian youths reported regular ore Australian youths reported regular cigarette and alcohol use than did US cigarette and alcohol use than did US adolescents.adolescents.
More US youths reported current marijuana More US youths reported current marijuana use. use.
GGenerally, risk and protective factors were enerally, risk and protective factors were similar in both the US and Australia. similar in both the US and Australia.
www.alcoholandhealth.orgwww.alcoholandhealth.org 6565
Results (cont.)Results (cont.) However, community norms, youth attitudes, However, community norms, youth attitudes,
and parental attitudes favorable to drug use and parental attitudes favorable to drug use were more common in Australia. were more common in Australia.
Sensation seeking and possessing stronger Sensation seeking and possessing stronger social skills were more common in the US.social skills were more common in the US.
PPeer/individual risk and protective factors eer/individual risk and protective factors were more strongly related to substance use were more strongly related to substance use in the US; family factors protective against in the US; family factors protective against regular alcohol use were also stronger in the regular alcohol use were also stronger in the US. US.
www.alcoholandhealth.orgwww.alcoholandhealth.org 6666
Conclusions/CommentsConclusions/Comments TThis is an interesting initial effort to understand the his is an interesting initial effort to understand the
implications of differing national drug control implications of differing national drug control strategies on adolescent substance use.strategies on adolescent substance use.
The US-supported abstinence strategy may heighten the risk The US-supported abstinence strategy may heighten the risk of adolescent rebelliousness that may lead to use. of adolescent rebelliousness that may lead to use.
The harm-reduction model of Australia may contribute to The harm-reduction model of Australia may contribute to more tolerant attitudes, which in turn may also increase use. more tolerant attitudes, which in turn may also increase use.
However, these interpretations, which relate observed However, these interpretations, which relate observed
cross-national differences to policy differences, must cross-national differences to policy differences, must be considered speculative, but a useful first step.be considered speculative, but a useful first step.