Embed Size (px)
Citation preview

Update of the 2007 shelf-registration document
UPDATE OF THE 2007
REGISTRATION DOCUMENT
Registration document filed with the Autorité des marchés financiers (AMF) on April 18, 2008 under reference D.08-0261 The present update of the 2007 registration document filed with the Autorité des marchés financiers (AMF) on September 3, 2008 under reference D.08-0261-A01 The English language version of the update of the 2007 registration document is a free translation from the original which was prepared in French. The original language version of the document in French prevails over the translation.

Update of the 2007 shelf-registration document
CONTENTS CHAPTER 2: CORPORATE GOVERNANCE .................... .................................................p.1
2.1 Structure of the governance bodies.......................................................................p.1 2.2 Activities of the governance bodies .......................................................................p.2 2.3 Executive committee .............................................................................................p.4 2.4 Auditors of the company........................................................................................p.4
CHAPTER 6: FINANCIAL DATA .......................... ..............................................................p.5
Risk factors............................................................................................................p.5
6.1 Management report ...............................................................................................p.5
o Introduction ...................................................................................................p.5 o Consolidated results .....................................................................................p.8 o Contribution of the business divisions to the earnings of Natixis ................p.11 o Analysis of the business lines.....................................................................p.12 o Risk management.......................................................................................p.33
� General risk management system � Credit risks � Market risks � Overall interest rate, liquidity and structural exchange rate risk � Operational risk � Insurable risks � Legal risks � Insurance risks
o Introduction of the Basel II reform ..............................................................p.52 o Financial structure and regulatory ratios.....................................................p.54
6.2 Financial data ......................................................................................................p.57
6.3 Statutory auditors’ review report on the condensed H1 consolidated
financial information...........................................................................................p.137
6.4 Recent events....................................................................................................p.139
o Presentation to the Press / Analysts (August 28, 2008) ...........................p.139
o Results as at June 30, 2008 (28 August 2008).........................................p.152 � Specific information on sensitive exposure according to FSF
recommendation
o New strategic orientation ..........................................................................p.178
o Other information ; addenda .....................................................................p.199

Update of the 2007 shelf-registration document
CHAPTER 8: ADDITIONAL INFORMATION .................. ................................................p.202
8.1 Legal information ...............................................................................................p.202
8.2 Additional information ........................................................................................p.202
o Person responsible for the updated shelf registration document o Statement by the person responsible for the updated shelf
registration document o Documents available to the public o Auditors
CROSS-REFERENCE TABLE .............................. ..........................................................p.207

Update of the 2007 shelf-registration document 1
Chapter 2: Corporate Governance
2.1 Structure of the governance bodies
Members of the Supervisory Board
The Supervisory Board took note of the resignation of Alfonso IOZZO, a non-voting member, at its August 27, 2008 meeting. The members of the Supervisory Board at June 30, 2008 are now the following:
Members of the Supervisory Board
Charles Milhaud Chairman of the Natixis Supervisory Board, Chairman of the Executive Board of the Caisse Nationale des Caisses d’Epargne et de Prévoyance
Jean-Louis Tourret Vice-Chairman of the Natixis Supervisory Board, Chairman of the Board of Directors of Banque Populaire Provençale et Corse
Bernard Comolet Vice-Chairman of the Natixis Supervisory Board, Chairman of the Executive Board of Caisse d’Epargne Île-de-France Paris
Banque Fédérale des Banques Populaires
Representative: Philippe Queuille, Deputy Chief Executive Officer of Banque Fédérale des Banques Populaires
Caisse Nationale des Caisses d’Epargne
Representative: Nicolas Merindol, Chief Executive Officer of Caisse Nationale des Caisses d’Epargne
Vincent Bolloré Chairman and Chief Executive Officer of Groupe Bolloré Jean Clochet Chairman of the Board of Directors of the Banque Populaire des Alpes Jean-Claude Créquit Chairman of the Executive Board of Caisse d’Epargne Côte d’Azur Stève Gentili Chairman of the Board of Directors of BRED Banque Populaire Francis Henry Chairman of the Steering and Supervisory Board of Caisse d’Epargne
de Champagne-Ardenne Bernard Jeannin Chief Executive Officer of the Banque Populaire Bourgogne Franche-
Comté Yvan de La Porte du Theil Chief Executive Officer of Banque Populaire Val de France Bruno Mettling Deputy Chief Executive Officer of Banque Fédérale des Banques
Populaires Jean-Charles Naouri Chairman of the Board of Directors of Euris Didier Patault Chairman of the Executive Board of Caisse d’Epargne des Pays de la
Loire Henri Proglio Chairman and Chief Executive Officer of Veolia Environnement Philippe Sueur Chairman of the Steering and Supervisory Board of Caisse d’Epargne
Ile-de-France Nord Robert Zolade Chairman of Elior Non-voting member
Ulrich Brixner

Update of the 2007 shelf-registration document 2
Members of the Executive Board
Following the retirement of François Ladam on May 30, 2008, the members of the Management Board at June 30, 2008 are now the following:
Philippe Dupont Chairman Dominique Ferrero Director General Jean-Pascal Beaufret Director Jean-Marc Moriani Director
2.2 Activities of the governance bodies Since April 17, 2008, the date on which the 2007 reference document was filed with the Autorité des marchés financiers, the Natixis Supervisory Board has held five meetings. Pursuant to its general mission, the Supervisory Board made decisions regarding all matters relating to the strategy and guidance of the company’s business.
• Meeting on May 14, 2008 The Supervisory Board was informed of company business by way of the Management Board’s activity report, and it examined the quarterly financial statements for the first quarter ended t March 31, 2008. As part of its control mission, the Supervisory Board examined the reports on the conditions under which internal control is conducted and on risk measurement and supervision. It also examined and approved: - the transfer of financial services for institutional investors from Natixis to CACEIS; - the complete transfer of Gestritres’ assets and liabilities to Natixis; - the restructuring of Natixis Garanties’ subsidiaries; - the disposal by Natixis of Natixis Consumer Finance securities to Ecrinvest II and GCE Bail securities to Natixis Lease; - various transactions within the scope of Natixis’ normal course of business, relating to capital increases, acquisitions or disposals of securities of, respectively, Natixis Luxembourg, Eiffage and AKA.
Lastly, the Supervisory Board noted the resignation of François Ladam on May 30, 2008, within the context of his retirement, and consequently decided to reduce the number of its members to four. It also authorized, pursuant to the provisions of Article L.225-90-1 of the French Commercial Code, the payment of the stipulated amounts to Mr. Ladam.

Update of the 2007 shelf-registration document 3
• Meeting on June 9, 2008
The Supervisory Board, pursuant to Article 17.2 b) of Natixis’ by-laws and the delegation of powers granted to the Executive Board (Resolution Nine), by the Joint Annual General Meeting of Shareholders on May 22, 2008, authorized the issue of convertible super-subordinated securities for a maximum of 93.75 million shares. The Executive Board is thus fully authorized to set the date of issue (within the term of validity of the authorization conferred by the shareholders’ meeting, i.e., 26 months as of May 22, 2008), the exact amount thereof within the limits set by the same shareholders’ meeting, the price and all the final terms and conditions of issue.
• Meeting on June 26, 2008 The Supervisory Board authorized the signing of an amendment to the shareholders’ advance agreement of May 28, 2008, entered into by Natixis, Banque Fédérale des Banques Populaires (BFBP) and Caisse Nationale des Caisses d’Epargne (CNCE) and concerning an additional one billion euros, half of which was provided by BFBP and the other half by CNCE. This decision was reported in a press release on June 26, 2008.
• Meeting of July 16, 2008 The Supervisory Board took stock of the company, in particular, with regard to asset write-offs and the capital increase plan. In this context, it approved the press release of July 16, 2008.
• Meeting of August 27, 2008 The Supervisory Board was informed of the Management Board’s activity report and examined the individual and consolidated financial statements of Natixis for the first half of 2008. It listened to comments from the audit committee and statutory auditors on both of the above financial statements and approved the August 28, 2008 press release on the consolidated results of Natixis for the first half of 2008. The Supervisory Board also analyzed the company’s plan for a capital increase. It also took stock of the progress of its subsidiaries, in particular, the creation of the joint venture between CMO (Cash Management and Operations) and Natixis Paiements. Last, the Supervisory Board noted the termination, on April 15, 2008, of the contract mandating risk control and assistance for the activities of Groupe CIFG, entered into on December 20, 2007. .

Update of the 2007 shelf-registration document 4
2.3 Executive Committee As at June 30, 2008, the following persons were members of the Executive Committee: Philippe Dupont Chairman of the Executive Board Dominique Ferrero Chief Executive Officer Jean-Marc Moriani Member of the Executive Board Jean-Pascal Beaufret Member of the Executive Board Aline Bec Information Systems François Casassa General Secretary and Director of Human Resources Jérôme Cazes Client Matters Jean Duhau de Berenx Capital investment and private management Bertrand Duval Coverage/Finance and investment banking Jean-Yves Forel Services Nicolas Fourt Markets/Finance and investment banking Christian Gissler Risks and Controls André-Jean Olivier Finances Ramine Rouhani Debt and Financing /Finance and investment banking Pierre Servant Asset management
2.4 Auditors of the company The bank’s financial statements are audited by three independent accounting firms. Their terms will expire with the Annual General Meeting called to approve the 2009 financial statements, as concerns Deloitte & Associés and Salustro Reydel. Mazars et Guérard was appointed by the combined general of November 17, 2006, for a term of six years ending on the general meeting to approve the financial statements for 2012. . Name Address
Deloitte & Associés 185, avenue Charles de Gaulle – 92524 Neuilly-sur-Seine cedex Damien Leurent
Salustro Reydel, member of KPMG International
1, cours Valmy – 92923 Paris La Défense cedex Michel Savioz
Mazars et Guérard
Immeuble Exaltis – 61, rue Henri-Régnault – 92075 La Défense cedex Charles de Boisriou et Michel Barbet-Massin
The substitute auditors are: Name Address BEAS 7-9 Villa Houssay – 92200 Neuilly-sur-Seine François Chevreux 40, rue Guersant – 75017 Paris
Patrick de Cambourg Immeuble Exaltis – 61, rue Henri-Régnault – 92075 La Défense cedex

Update of the 2007 shelf-registration document 5
Chapter 6: Financial Data Update of the section « Risk factors » in the 2007 registration document.
Natixis may not be able to wind down its business activities affected by the financial crisis efficiently.
As part of its strategic plan 2008-2010 (described under “Chapter 6.4”), Natixis intends to phase down certain activities affected by the financial crisis, including corporate and investment banking businesses that involve incurring proprietary risks. The phase-down may include the sale of assets affected by the crisis to the extent market conditions permit. Natixis may find itself unable to phase down these activities as quickly or efficiently as it hopes, either because there are no buyers willing to pay a reasonable price for the relevant assets or activities, or because there is no liquid market for the relevant assets, or because the ongoing obligations of the Group make a sale or phase-down impracticable. If Natixis is unable to wind down these business as planned, then it will not achieve (or will only partially achieve) its objective of reducing its exposure to market volatility and diversifying its revenue and income base. If Natixis does not achieve its financial objectives, the market price of the shares could be significantly
adversely affected.
As part of its strategic plan, Natixis has adopted certain financial objectives that are described under “Chapter 6.4.” While Natixis has adopted these objectives to facilitate its internal planning and resource allocation, and while these objectives depend on a number of assumptions that may turn out not to be true, it is possible that market participants will use these objectives as guidance in their analysis of the future prospects of the Group. If so, then any failure by Natixis to achieve these objectives (whether as a result of assumptions not turning out to be true or for any other reason) may impact the analysis of market participants, and may result in a decline in the market price of the shares. Natixis may be unable to achieve its objectives for numerous reasons, including the occurrence of one or more of the risks described above in this section.
6.1 Management report A presentation of the half-year results of Natixis as at June 30 2008 is provided in section 6.4 ("Recent
Events") of this update. The slides included in part 3 of this presentation contain specific information on
sensitive exposures which comply with the matrices distributed by the Financial Stability Forum. This
information forms an integral part of the half-year report on the activities of Natixis SA as at June 30
2008 and is therefore covered by specific audits, conducted by the Statutory Auditors, of financial
information for the first 6 months of the fiscal year (paragraph 2 of the report).
I. Introduction
� In developing a new business plan for Natixis, a decision was made to slightly modify the scope of activities within the business lines: activities that are predominantly retail in nature, which had formerly been placed under Corporate and Investment Banking, are now attached to the Services division. These include leasing, Pramex (advisory services on international development for Small and Medium-Sized Companies) and Natixis Algérie.
� In addition, a number of conventions used in analytical restatements were modified from those specified in the
2005-2010 business plan:
� Analytical restatements of the businesses’ net banking income
- The interest on corporate equity capital for entities within the business line is cancelled. - The allocated capital appropriated to the business lines carries interest. - The rate of 3.5% was used for these restatements for the entire plan period.

Update of the 2007 shelf-registration document 6
Note: This rule differs from the one used in the 2005-2010 business plan, as well as that used in subsequent financial communications, in which the 3-month Euribor rate was used to cancel out the interest on corporate equity capital, while the rate used for remunerating allocated capital remained fixed at 3.5%. The alignment of these two rates to a fixed rate of 3.5% was motivated by the excessively sensitive changes observed in amounts that were analytically restated in comparison to preceding periods; these changes were based on fluctuations in short-term rates over the last two quarters.
� Analytical restatements of business line expenses
Virtually all overhead costs incurred outside the business lines were rebilled to the business lines based on their total fixed expenses.
Note: This rule differs from the one used in the 2005-2010 business plan and in subsequent financial communications, in which the allocation of overhead costs was calculated based on total costs (fixed and variable of the business lines) using slightly different rates. This change in method was motivated by the excessively sensitive changes observed in amounts that were analytically restated in comparison with preceding periods; these variations arose from significant declines in performance-related compensation in the Corporate and Investment Banking and Asset Management divisions.
� Modification in the appropriation of allocated capital
In accordance with the implementation of Basel II, the rules for appropriating allocated capital to retail banking activities were modified and brought into compliance with new prudential regulations. Allocated capital, which was appropriated on the basis of 6% of weighted risks under Basel I, is now appropriated based on 75% of the amounts deducted from Tier 1 capital subject to CCI certificates holdings. The application of the 75% conventional percentage is consistent with practices for other business lines; the objective is to include the contribution of hybrid capital in calculating the ratio.
Update of the 2007 shelf-registration document 7
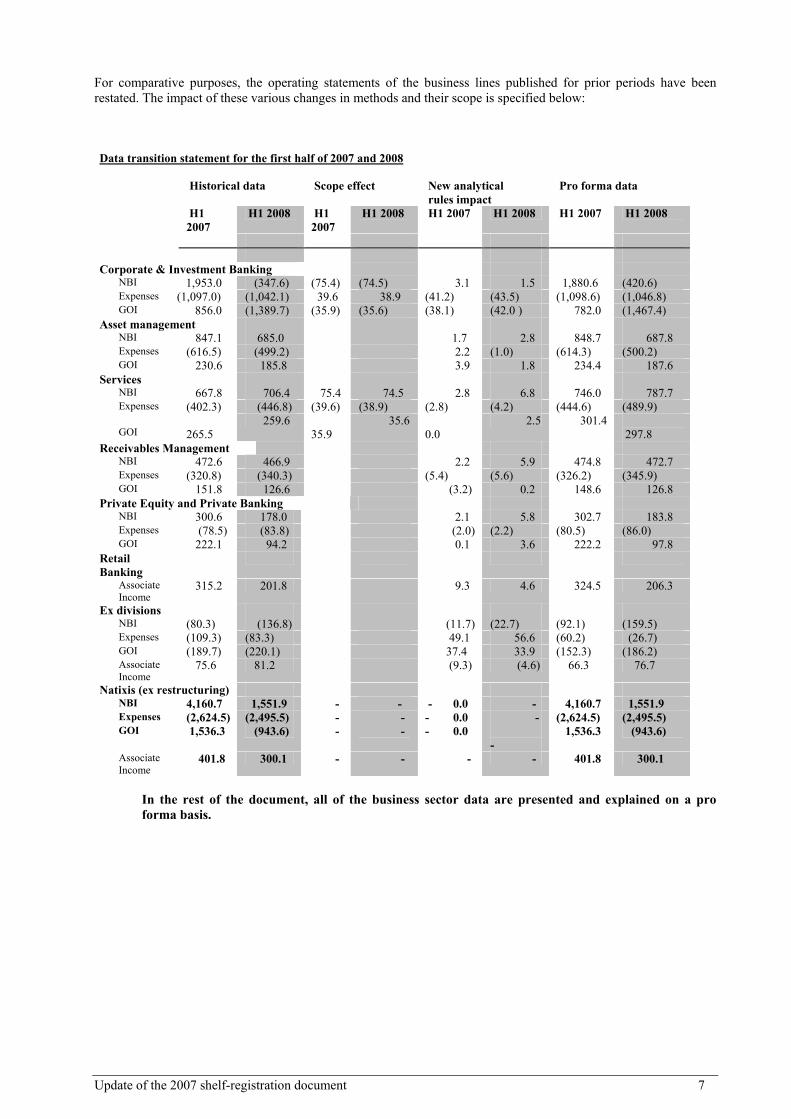
For comparative purposes, the operating statements of the business lines published for prior periods have been restated. The impact of these various changes in methods and their scope is specified below: Data transition statement for the first half of 2007 and 2008 Historical data Scope effect New analytical Pro forma data rules impact H1
2007 H1 2008 H1
2007 H1 2008 H1 2007 H1 2008 H1 2007 H1 2008
Corporate & Investment Banking NBI 1,953.0 (347.6) (75.4) (74.5) 3.1 1.5 1,880.6 (420.6) Expenses (1,097.0) (1,042.1) 39.6 38.9 (41.2) (43.5) (1,098.6) (1,046.8) GOI 856.0 (1,389.7) (35.9) (35.6) (38.1) (42.0 ) 782.0 (1,467.4) Asset management NBI 847.1 685.0 1.7 2.8 848.7 687.8 Expenses (616.5) (499.2) 2.2 (1.0) (614.3) (500.2) GOI 230.6 185.8 3.9 1.8 234.4 187.6 Services NBI 667.8 706.4 75.4 74.5 2.8 6.8 746.0 787.7 Expenses (402.3) (446.8) (39.6) (38.9) (2.8) (4.2) (444.6) (489.9)
GOI 265.5
259.6 35.9
35.6 0.0
2.5 301.4 297.8
Receivables Management NBI 472.6 466.9 2.2 5.9 474.8 472.7 Expenses (320.8) (340.3) (5.4) (5.6) (326.2) (345.9) GOI 151.8 126.6 (3.2) 0.2 148.6 126.8 Private Equity and Private Banking NBI 300.6 178.0 2.1 5.8 302.7 183.8 Expenses (78.5) (83.8) (2.0) (2.2) (80.5) (86.0) GOI 222.1 94.2 0.1 3.6 222.2 97.8 Retail Banking
Associate Income
315.2 201.8 9.3 4.6 324.5 206.3
Ex divisions NBI (80.3) (136.8) (11.7) (22.7) (92.1) (159.5) Expenses (109.3) (83.3) 49.1 56.6 (60.2) (26.7) GOI (189.7) (220.1) 37.4 33.9 (152.3) (186.2) Associate
Income 75.6 81.2 (9.3) (4.6) 66.3 76.7
Natixis (ex restructuring) NBI 4,160.7 1,551.9 - - - 0.0 - 4,160.7 1,551.9 Expenses (2,624.5) (2,495.5) - - - 0.0 - (2,624.5) (2,495.5) GOI 1,536.3 (943.6) - - - 0.0
- 1,536.3 (943.6)
Associate Income
401.8 300.1 - - - - 401.8 300.1
In the rest of the document, all of the business sector data are presented and explained on a pro forma basis.
Update of the 2007 shelf-registration document 8
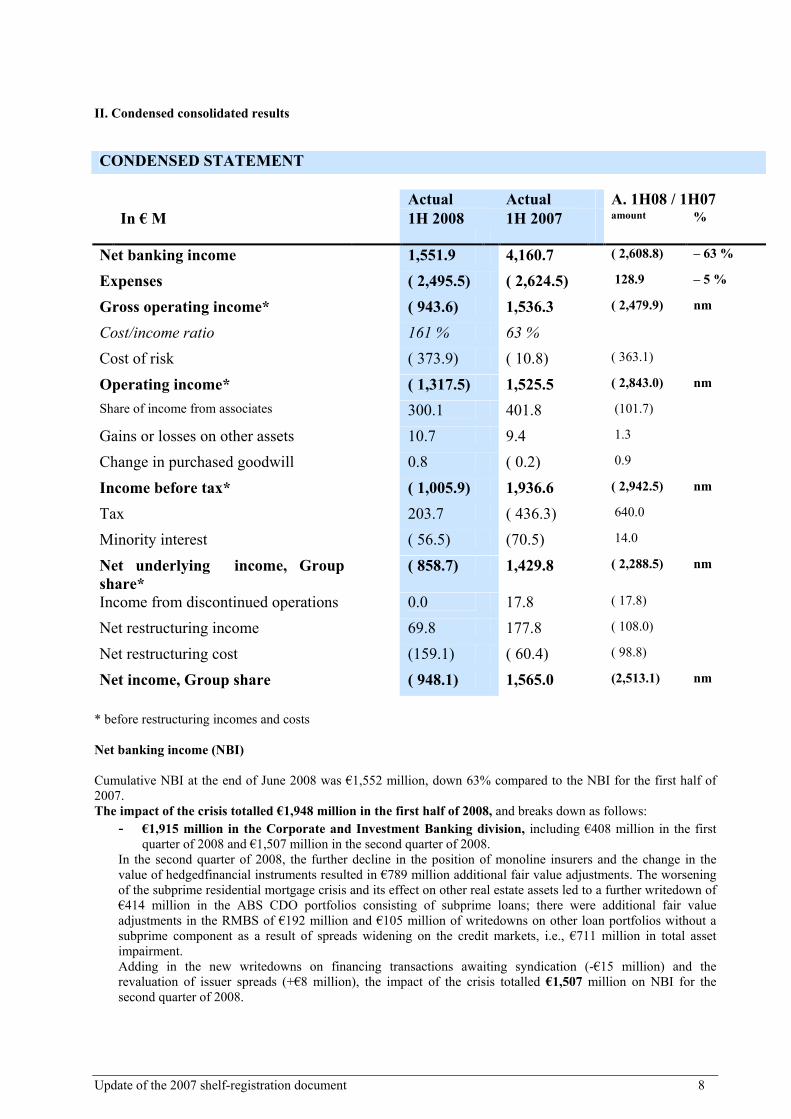
II. Condensed consolidated results CONDENSED STATEMENT Actual Actual A. 1H08 / 1H07 In € M 1H 2008 1H 2007 amount %
Net banking income 1,551.9 4,160.7 ( 2,608.8) – 63 %
Expenses ( 2,495.5) ( 2,624.5) 128.9 – 5 %
Gross operating income* ( 943.6) 1,536.3 ( 2,479.9) nm
Cost/income ratio 161 % 63 %
Cost of risk ( 373.9) ( 10.8) ( 363.1)
Operating income* ( 1,317.5) 1,525.5 ( 2,843.0) nm
Share of income from associates 300.1 401.8 (101.7)
Gains or losses on other assets 10.7 9.4 1.3
Change in purchased goodwill 0.8 ( 0.2) 0.9
Income before tax* ( 1,005.9) 1,936.6 ( 2,942.5) nm
Tax 203.7 ( 436.3) 640.0
Minority interest ( 56.5) (70.5) 14.0
Net underlying income, Group share*
( 858.7) 1,429.8 ( 2,288.5) nm
Income from discontinued operations 0.0 17.8 ( 17.8)
Net restructuring income 69.8 177.8 ( 108.0)
Net restructuring cost (159.1) ( 60.4) ( 98.8)
Net income, Group share ( 948.1) 1,565.0 (2,513.1) nm
* before restructuring incomes and costs Net banking income (NBI) Cumulative NBI at the end of June 2008 was €1,552 million, down 63% compared to the NBI for the first half of 2007. The impact of the crisis totalled €1,948 million in the first half of 2008, and breaks down as follows:
- €1,915 million in the Corporate and Investment Banking division, including €408 million in the first quarter of 2008 and €1,507 million in the second quarter of 2008.
In the second quarter of 2008, the further decline in the position of monoline insurers and the change in the value of hedgedfinancial instruments resulted in €789 million additional fair value adjustments. The worsening of the subprime residential mortgage crisis and its effect on other real estate assets led to a further writedown of €414 million in the ABS CDO portfolios consisting of subprime loans; there were additional fair value adjustments in the RMBS of €192 million and €105 million of writedowns on other loan portfolios without a subprime component as a result of spreads widening on the credit markets, i.e., €711 million in total asset impairment. Adding in the new writedowns on financing transactions awaiting syndication (-€15 million) and the revaluation of issuer spreads (+€8 million), the impact of the crisis totalled €1,507 million on NBI for the second quarter of 2008.

Update of the 2007 shelf-registration document 9
- €33 million in the Asset Management division, including €31.5 million in the first quarter alone. Excluding the impact of the crisis, NBI for the first half of 2008 would have been €3,500 million, down 17% compared to the first half of 2007. The change in the euro/dollar exchange rate was very significant at the end of June 2008, with the dollar averaging 1.53 in the first six months of 2008, compared to 1.33 for the first half of 2007. The negative impact of the exchange rate on NBI for the first half was however largely offset by the effects of the acquisition of custody and fund administration activities from HVB (subsequently renamed Caceis Bank Deutschland) and Olympia at the end of 2007. The contribution of the business lines was €1,711 million, down 60% during the year. � The NBI of the Corporate and Investment Banking division was negative in the first half of 2008, with a loss of
€421 million. Excluding the impact of the crisis, it would have been €1,494 million, down 21% compared to the excellent performance in the first half of 2007 and taking into consideration the persistent weakness in the securitization sector, the slowdown of equity-related business in the first half of 2008, and the losses incurred due to the sharp inversion of the yield curve in June.
� The NBI of the Asset Management division (€688 million) was down 19% (down €161 million) compared to
the first half of 2007. Excluding the negative foreign exchange effect of almost €65 million (8 points of NBI growth), the decline is attributable to a 70% drop in performance commissions compared to the excellent performance of the US alternative and real estate funds in the first half of 2007 and the €32.8 million impact of the crisis in the first half of 2008. At the same time, net positive asset growth (up €13.5 billion) and external acquisitions offset the decline in equity prices; average assets were slightly down by 0.8% on a like-for-like basis over the year with a fairly stable average margin, resulting in a slightly higher recurring NBI.
� With NBI of €788 million, the Services division was up €42 million (+6%) compared to June 2007, with a
significant contribution made by the Securities business to these results. Excluding changes in the scope of consolidation and extraordinary items in 2007 (acquisition of Caceis Bank Deutschland and Olympia, transfer of LCL business), NBI growth was 3% (+€19.5 million).
� At €473 million, the NBI of the Receivables Management division was stable compared to the first half of
2007, after taking into account the contrasting effects of 5.9% growth in revenues and a loss ratio that declined 9.5 points to 55.7%.
� The Private Equity and Private Banking division generated NBI of €184 million at the end of June 2008, down
39% compared to the end of June in 2007. - The NBI of Private Equity was €125 million for the first half of 2008, down 48% compared to an
exceptionally strong first half of 2007. - The NBI of Private Banking was €59 million, down 5% from the first half of 2007 due to financial
conditions that negatively affected commissions on assets (due to the decline in share prices) and commissions on transactions (due to investor wariness).
� The NBI not derived from the business lines (-€160 million in the first half of 2008) declined €67 million
compared to the first half of 2007 primarily due to the lower amount of capital funds available. Expenses and headcount � Current consolidated expenses (excluding restructuring costs) totalled €2,496 million at the end of June 2008,
down 5% compared to the end of June 2007. The positive effects of exchange rates on dollar denominated costs were offset by changes in the scope of consolidation (particularly in the Services sector with the acquisition of Caceis Bank Deutschland and Olympia).
���� Payroll costs were €1,452 million, down 10% compared to June 30, 2007.
Fixed personnel expenses rose 4% over the year. Headcount totalled 22,325 full-time equivalents (FTE) at the end of June 2008, up 1,078 FTE over the year, including almost 400 FTE resulting from the change in scope of consolidation. Since the beginning of 2008, the rise in the number of FTE was only 269, of whom 115 were in Asset Management, 64 in the Services division and 130 in the Receivables Management
Update of the 2007 shelf-registration document 10
division. Corporate and Investment Banking’s employees remained stable over the six months and the number of employees outside the business lines fell (-39 FTE). Performance-related compensation was sharply lower compared to the first half of 2007, both in Corporate and Investment Banking and Asset Management, due to the decline in results.
� Other operating expenses totalled €1,044 million; their growth was controlled at 4% over the first half of
2007. They were stable compared to the first half expenses of the 2007 fiscal year, and it should be noted that cost reductions initiated during the first half of 2008 will begin to have a significant effect in the second half.
Gross operating income (GOI) Gross operating income was a loss of €944 million compared to positive earnings of €1,536 million for the half-year ended June 30, 2007. Excluding the impact of the crisis, GOI would have been €1,005 million, down 35% compared to June 2007. The cost/income ratio would then have been 69%. Income before tax
The cost of risk was €374 million for the half-year ended June 30, 2008, including €214 million for individual risk and €160 million for collective risk. The cost of individual risk was up sharply compared to the first half of 2007 (€3.2 million), mainly due to two significant individual matters totalling €126 million, €63 million of which related to amounts drawn under the CIFG credit line. The €160 million in collective risks includes €184 million of collective provisions for exposure to monoline insurers.
Investments accounted for by the equity method totalled €300 million, down 25% over the year. The network CCIs contributed €283 million (down 28%) to this amount. Current income before taxes was a loss of €1,006 million. Net underlying income Group share After recognizing a tax gain of €204 million, and minority interests of -€57 million, the net underlying income group share was a loss of €859 million for the first half of 2008.
Net income Group share Income from restructuring (€70 million net of taxes) was generated from the sale of Natixis’ institutional custody business to Caceis (owned 50% by the Natixis Group).1 Restructuring costs net of taxes were €159 million, including €85 million in expenses related to the job protection plan. They also included severance pay, IT projects, costs related to the reorganization of the real estate provision and consulting fees.2 Net Income Group share was a loss of €948 million for the half-year ended June 30, 2008. Risk weighted assets at the end of the period totalled €150.8 billion for the half-year ended June 30, 2008, down €2.9 billion compared to December 31, 2007.
1 For the half-year ended June 30, 2007, the €178 million in income from restructuring was comprised of gains generated by the
dilution of the minority shareholder, CNP Assurances, during restructuring operations in the Asset Management division. 2 For the half-year ended June 30, 2007, the €60 million in restructuring costs net of taxes was comprised of severance pay, IT costs, consulting fees and costs related to premises.
Update of the 2007 shelf-registration document 11
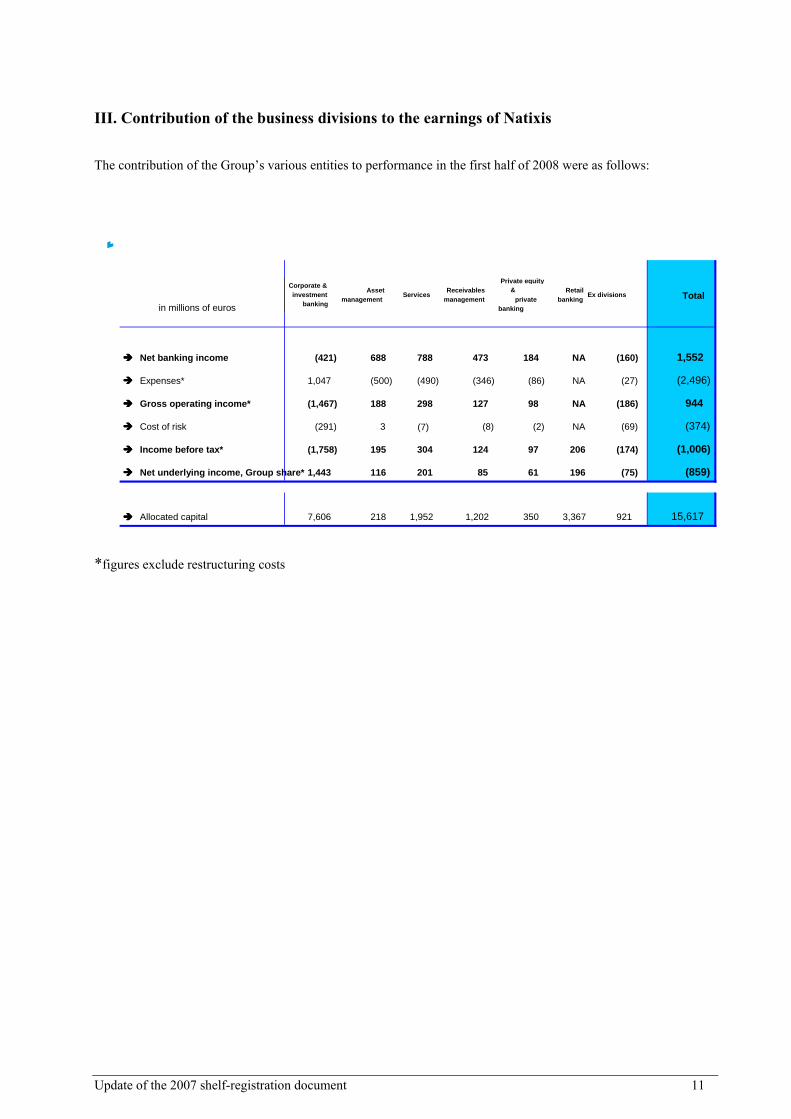
III. Contribution of the business divisions to the earnings of Natixis The contribution of the Group’s various entities to performance in the first half of 2008 were as follows:
*figures exclude restructuring costs
in millions of euros
Corporate & investment
banking Asset
management Services Receivables management
Private equity &
private banking
Retail banking Ex divisions Total
���� Net banking income (421) 688 788 473 184 NA (160) 1,552
���� Expenses* 1,047 (500) (490) (346) (86) NA (27) (2,496)
���� Gross operating income* (1,467) 188 298 127 98 NA (186) 944
���� Cost of risk (291) 3 (7) (8) (2) NA (69) (374)
���� Income before tax* (1,758) 195 304 124 97 206 (174) (1,006)
���� Net underlying income, Group share* 1,443 116 201 85 61 196 (75) (859)
���� Allocated capital 7,606 218 1,952 1,202 350 3,367 921 15,617

Update of the 2007 shelf-registration document 12
IV. Analysis of the business lines 4.1. Corporate and Investment Banking
� For the half-year ended June 30, 2008, the cumulative NBI for the Corporate and Investment Banking
division was negative with a €421 million loss, including €1,915 million from the impact of the crisis.
These effects can be analyzed as follows:
� €953 million of fair value adjustments due to the deterioration in the position of the monoline insurers, combined with a decline in the mark-to-market of underlying assets (including €789 million in the second quarter.);
� €488 million of writedowns in the ABS CDO portfolios consisting of subprime loans (including €414 million in the second quarter of 2008) due to the US residential subprime real estate crisis and its effect on other real estate assets;
� €234 million of fair value adjustments on the valuation of the RMBS subprime portfolio (including €192 million in the second quarter of 2008);
� €232 million of writedowns on loan portfolios without subprime components following the widening of spreads observed in the market.
Added to these items:
� €39 million of net writedowns on financing outstandings awaiting syndication (including €15 million in the second quarter of 2008);
� €126 million of extraordinary trading losses (recognised in the first quarter of 2008)3.
The conservative revaluation of issuer spreads (€157 million) partially offset these negative impacts.
3 These trading losses are related to exchange rate arbitration activities (a consequence of the sudden decision by the FED to lower rates in early January) and to derivative security activites which suffered due to the very strong volatility in the underlying prices in the first half.
CORPORATE AND INVESTMENT BANKING
Actual Actual A. 1H08 / 1H07 In €M 1H 2008 1H 2007 amount %
Allocated capital (average) 7,606 7,314 + 293 + 4 %
Net banking income (420.6) 1,880.6 (2,301.3) nm
Expenses (1,046.8) (1,098.6) + 51.9 – 5 %
Gross operating income (1,467.4) 782.0 (2,249.4) nm
Cost of risk (290.9) 4.3 (295.2) nm
Current income before tax (1,758.3) 787.7 (2,546.0) nm
Net underlying income, Group share (1,443.3) 554.6 (1,997.9) nm
Profitability on allocated capital nm 15.2 % Cost/income ratio nm 58 %

Update of the 2007 shelf-registration document 13
In addition to its impact on the NBI, the group provision for cost of risk totalled €184 million for monoline insurers.
� Excluding the impact of the crisis, (a €1,915 million hit) and extraordinary items (+€79 million), the NBI
for the first half of 2008 amounted to €1,415 million, down 25% compared to the first half of 2007, which represents an unusually high level as a basis for comparison. Despite strong business performance, the slowdown in stock market activities (cash and derivatives), the persistent weakness in securitization activities, the higher cost of liquidity, and trading losses due to the sharp inversion of the yield curve in June 2008 negatively affected the Corporate and Investment Banking division.
� Expenses totalled €1,047 million in the first half of 2008, compared to €1,099 million in the first half of 2007,
a 5% decline compared to June 2007. This decline is primarily attributable to the drop in performance-related compensation. Employees of the Corporate and Investment Banking division totalled 5,660 FTE at June 30, 2008, a stable level compared to the end of 2007. In France, the headcount dropped by 95 FTE, offset by increases internationally (Asia and Europe).
� The Corporate and Investment Banking division thus posted negative GOI of €1,467 million in the first
half of 2008, compared to a profit of €782 million in the first half of 2007.
� After taking into account a €291 million cost of risk and tax income of €321 million, the Net Income Group Share for the Corporate and Investment Banking division was a loss of €1,443 million for the first half of 2008.
� Basel II risk weighted assets were €122.2 billion at the end of June 2008, down €2.8 billion compared to December 31, 2007.
NBI and activity by business line The Corporate and Investment Banking division is structured around three business lines: - Corporate and Institutional Relations, which combines commercial banking (corporate financings and flows), mergers and acquisitions, and coverage; - Debt and Finance, which includes structured finance and commodities, real estate, debt solutions, structured credit, and proprietary credit and principal finance; - Capital Markets, which includes equities and commodities, fixed income distribution & trading, and treasury and arbitrage.
in millions of euros H1 2007 H1 2008 Change
Net banking income 1,880.6
(420.6) - 122 %
Corporate and institutional relations
237.7 257.0 + 8 %
Debt and finance 690.3 (1,168.1) nm
Capital markets 925.0 463.6 – 50 %
Other 27.7 26.9 – 3 % Corporate and Institutional Relations
Update of the 2007 shelf-registration document 14
The “Corporate and Institutional Relations” business line generated NBI of €257 million for the half-year ended June 30, 2008, up 8% compared to the first half of 2007, due to growth in international activity (a 19% increase in the first half of 2008 compared to the first half of 2007), while NBI earned from French customers was slightly up by 1%. � Revenues from Corporate in France rose 2%, due to higher average outstandings; in addition, margins on new
business are significantly higher, both on lines of credit and loans. � The NBI of International Financial Institutions posted strong growth of 16%.
At the headquarters level, credit activity is steady compared to last year due to the increase in margins. Margins are also higher and the volume of activity is strong in the United States and Asia.
� Corporate International business continues its strong growth (+35%) primarily due to dynamic expansion in
southern Europe. Debt and Finance The “Debt and Finance” business posted a negative NBI of €1,168 million for the first half of 2008. Restated for the effects of the crisis, (a negative impact of €1,745 million for this business line alone) the NBI would have been €577 million, down 16% compared to the first half of 2007. Structured financings suffered from the 2007 basis of comparison, which included extraordinary income items, and there was a low volume of activity in the first half of 2008 in LBOs and project financing. The securitisation business remained very slow. Structured Financing and Commodities � In an environment characterised by the credit crisis and liquidity constraints, revenues at the end of June 2008
for Structured Financing and Commodities were down 19% compared to the end of June 2007. Interest margins continued to widen, but commissions fell with the reduction in new business and the absence of early redemptions. The first half saw weaker performance for Leverage Finance and Projects, while Commodities, Aircraft and Financial Engineering performed very well over the period.
New business production at the end of June 2008 was down sharply compared to the previous year, off 69%, but outstandings at the end of the period were up 15% year-on-year.
� Commodities revenues were up 30% at the end of June 2008 compared to the same period in 2007. The first
half of 2008 was marked by higher margins in the Producers business as well as commodity prices, which remained elevated and volatile. Business growth in this area remained strong.
� Leverage Finance revenues at the end of June 2008 were down sharply compared to the end of June 2007 (off
49%). This business line has experienced a sharp slowdown in activity since June 2007 due to sellers’ unwillingness to accept prices that are falling to due the deteriorating economic environment, the contraction of stock market multiples, and the decline in leverage permitted by banks. In addition, the large amount of non-syndicated debt selling at a discount in the secondary markets makes it difficult to place new deals. Large scale transactions have disappeared primarily due to plummeting demand for CLOs. The European Leverage Finance market has fallen 80% in volume and 76% in the number of transactions during the period from January to May.
� Financial Engineering revenues were up 16%. The current environment in which securities are undervalued
allows both corporate and investment fund investors to take positions on listed targets. � Project financing revenues at the end of June 2008 were down 20% compared to those of June 2007. Although
the project financing market is active worldwide and continues to offer attractive business opportunities, particularly in the United States, the business is feeling the effects of the liquidity crisis: delays in the syndication process and the need to modify transactions.
� Aircraft financing did well in the first half of 2008, posting an NBI that was up 43% compared to results at the
end of June 2007.
Update of the 2007 shelf-registration document 15
Due to the rise in oil prices, airlines have been compelled to review their fleets and select aircraft that offer energy economies. The sector is undergoing a complete redefinition of its business due to the impact of recently-created companies in Asia and the Middle East, a significant increase in margins, reduction - and even the disappearance - of financial capacity, and major limitations on underwriting ability.
� At the end of June 2008, Shipping posted revenues that were up 19% compared to the end of June 2007.
The demand for maritime transport capacity has not weakened, and all major segments (except for LNG Carriers) have benefited. All assets, regardless of their age, thus continue to remain attractive values compared to historical averages.
Real Estate Real Estate revenues fell 28% at the end of June 2008 compared to June 2007. New business was down significantly. With no securitisation during the six month period, net banking income from commercial real estate activities was down 35% compared to last year. Debt Solutions
Debt Solutions income was up 39% at the end of June 2008 compared to the same period in 2007. In a market still very much influenced by the financial crisis, the second quarter offered a few opportunities for new issuers. The US Origination / Structuring business was successfully launched and is already generating significant deal-flow. Proprietary global portfolio management and principal finance
Results for this line of business were very poor, with a loss of €1,575 million for the first half of 2008. Proprietary credit activities were hard-hit by monoline fair value adjustments and negative revaluations of the ABS CDOs and the RMBS. Capital markets The Capital Markets NBI was down 50% to €463.6 million. Restated for non-recurring items due to the financial crisis, it would have been down 33% to €622 million, still impacted by the weakness of trading activities and the higher cost of funding (excluding revaluation of the issuer spread). Equities and commodities This sector posted total revenues that were down 22% for the half-year ended June 30, 2008, compared to the end of June 2007, with contrasting performances in the various segments.
� Results of Equity Derivatives & Arbitrage were down considerably compared to the half-year ended June 30, 2007. Stock derivative activities continued to suffer from market volatility, and arbitrage activities resulted in losses on the convertible desk. On the other hand, index and risk arbitrage activities performed well.
� Equity cash revenues were down 25% compared to the first half of 2007, as this business was negatively affected by exchange rates and a decline in capital markets equity transactions both in Europe (Natixis Securities) and the United States (Natixis Bleichroeder Inc).
� Corporate Solutions performed very well and posted revenues up 104% at the end of June 2008 compared to the same period in 2007, due to international growth, particularly with sovereign funds and companies in emerging economies.
� The Structured Assets business was affected by the restructuring of existing operations. Performance for the half-year ended June 30, 2008 was 35% below that of the same period in 2007.
Fixed income distribution & trading
The fixed income sector posted negative revenues for the half-year ended June 30, 2008.

Update of the 2007 shelf-registration document 16
� Despite strong business performance, interest-related business experienced significant losses at the beginning of June due to the inverted yield curve (which affected complex products).
� Credit and correlation trading activities were both negatively affected by monoline provisions and value
adjustments. At the end of June, Natixis was still well ranked (in the top 10 in the Euro League Table with recognised specialties, notably in the Top 3 for French companies, euro agencies, and covered bonds).
� Foreign exchange performed well, with revenues up 66% compared with the first half of 2007. Treasury management and arbitrage � For the half-year ended June 30, 2008, Treasury management and arbitrage revenues fell 62% compared to the
end of June 2007. The Treasury adapted its policies to the financial crisis, reducing its overnight (Eonia) exposure and managing the liquidity gap. However, more systematic refinancing at Libor rates resulted in additional costs due to liquidity spreads paid on term financings. Treasury’s performance was also hurt by losses on interest rate arbitrage activities in the first quarter.
Update of the 2007 shelf-registration document 17
4.2. Asset Management Key events of the first half of 2008
The financial crisis continued throughout the first half of 2008, affecting the business and performance of the Asset Management division. Impact of the crisis on the assets related to credit risks During the second half of 2007, Natixis Asset Management (NAM) has acted as partial counterparty for purchases carried out in UCITS for the cash management activities it handles. The continued deterioration in the credit markets in the first half of 2008 resulted in a €32.8 million overall impact on the Asset Management division’s financial statements. Decline in business activities
The financial crisis related to credit risk spread throughout the entire economy, producing a slowdown in asset growth both in France and the United States. At the same time, the deterioration of stock markets (as demonstrated by the decline in indexes since the beginning of the year : the CAC 40: -21%; the S&P 500: -13%; the Russel 1000: -14.8%) had a major impact on the structure of NGAM assets, with a 3 point drop over six months in the “equity and diversified” segment share in the product combination. Finally, the very high volatility of the financial markets led managers to adopt a defensive policy, thus limiting performance commissions. At the same time, in the second quarter of 2008, Banque Postale began to wind down its life insurance business (Fonds Euro products with the CNP) for an amount of €7.9 billion. Full withdrawal of these amounts will be completed by the end of 2008 for a total of €71 billion4. Recognition
During the first half, NGAM was awarded: Recognition of its global strategy:
- NGAM: Asset Management Firm of the Year (Global Investor) - 3rd fastest-growing AM firm globally (Watson Wyatt) - Fastest-growing fund complex in the USA for 2006-2007 (FRC)
Quality of its management at the subsidiary level:
- Loomis: top fund family for equities (Lipper) - NAM: an array of awards (Trophées Le Revenu, Labels Mieux Vivre, Victoires des Sicav La Tribune,
Grand Prix Le Monde, Lauréat Gestion institutionnelle Option Finance, etc) - Dan FUSS: Fixed income Manager of the year (Morningstar) - Ken HEEBNER of CGM: Best Manager of the year (Smart Money)
Pursuing a targeted acquisition policy NGAM acquired the US asset management company, Gateway Investment Advisors, at the end of the first quarter of 2008, strengthening its position in alternative funds. Activity in the first half of 2008
4 Total amount valued as at June 30, 2008
Update of the 2007 shelf-registration document 18
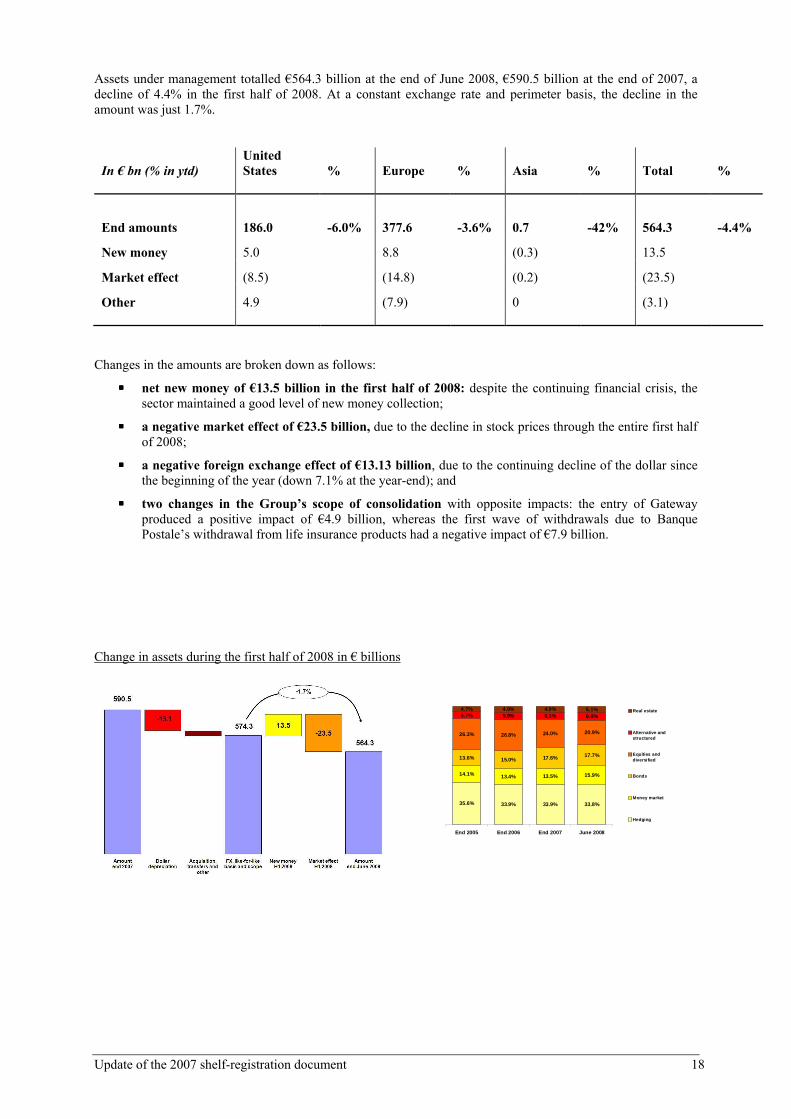
Assets under management totalled €564.3 billion at the end of June 2008, €590.5 billion at the end of 2007, a decline of 4.4% in the first half of 2008. At a constant exchange rate and perimeter basis, the decline in the amount was just 1.7%.
In € bn (% in ytd)
United States % Europe % Asia % Total %
End amounts 186.0 -6.0% 377.6 -3.6% 0.7 -42% 564.3 -4.4%
New money 5.0 8.8 (0.3) 13.5
Market effect (8.5) (14.8) (0.2) (23.5)
Other 4.9 (7.9) 0 (3.1)
Changes in the amounts are broken down as follows:
���� net new money of €13.5 billion in the first half of 2008: despite the continuing financial crisis, the sector maintained a good level of new money collection;
���� a negative market effect of €23.5 billion, due to the decline in stock prices through the entire first half of 2008;
���� a negative foreign exchange effect of €13.13 billion, due to the continuing decline of the dollar since the beginning of the year (down 7.1% at the year-end); and
���� two changes in the Group’s scope of consolidation with opposite impacts: the entry of Gateway produced a positive impact of €4.9 billion, whereas the first wave of withdrawals due to Banque Postale’s withdrawal from life insurance products had a negative impact of €7.9 billion.
Change in assets during the first half of 2008 in € billions
35.6% 33.9% 33.9% 33.8%
14.1% 13.4% 13.5% 15.9%
13.6% 15.0% 17.6% 17.7%
26.3% 26.8% 24.0% 20.9%
5.7% 5.9% 6.1% 6.6%4.7% 4.9% 4.9% 5.1%
End 2005 End 2006 End 2007 June 2008
Real estate
Alternative andstructured
Equities anddiversified
Bonds
Money market
Hedging

Update of the 2007 shelf-registration document 19
Portfolios by asset type
� The NBI for the half-year ended June 30, 2008 totalled €688 million, down 19% (€161 million)
compared to the first half of 2007 (down 11% in constant dollars).
The decline in NBI is primarily attributable to:
� A 70% drop in performance commissions: they represented 4.7% of NBI, compared to 13% in the first half of 2007 and almost 16% of NBI in the full year of 2007. Fiscal 2007 was characterised by excellent performance in the US alternative funds and by significant commissions on real estate funds;
� A €32.8 million negative impact from the crisis (no impact in the first half of 2007); and
� A negative foreign exchange effect of €65 million in the first half, or almost 8 points of NBI growth (the dollar declined 15% between the two halfs).
� At €500.2 million, operating expenses for the Asset Management division were down 19% (€114 million)
compared to first half of 2007. At a constant exchange rate, expenses would have been down 11% or €69 million.
� Payroll costs fell 25%, due to the major drop in performance-related compensation;
� Other operating expenses excluding payroll costs were down 3%.
� Gross operating income for the first half of 2008 was €187.6 million, down 20%. The cost/income ratio
was 72.7%, about the same level as in June 2007.
The dollar’s continuing decline in 2008 (-15% on average) and the effects of the financial crisis (a €32.8 million hit in the first half of 2008) had a major impact on this sector. Disregarding these two factors, average outstandings were stable and the GOI was up 2%, despite the severe drop in equity prices and performance commissions.
� Current income before taxes for the half-year ended June 30, 2008, amounted to €195.2 million, down 20% compared to the same period in 2007.
ASSET MANAGEMENT
Actual Actual A. 1H08 / 1H07 In €M 1H 2008 1H 2007 amount %
Allocated capital (average) 218 196 + 22 + 11 %
Net banking income 687.8 848.7 (160.9) – 19 %
Expenses (500.2) (614.3) + 114.1 – 19 %
Gross operating income 187.6 234.4 (46.8) – 20 %
Cost of risk 2.7 (0.4) + 3.1 nm
Current income before tax 195.2 243.7 (48.5) – 20 %
Net underlying income, Group share 115.7 148.7 (33.0) – 22 %
Profitability on allocated capital 106.0 % 151.8 %
Cost/income ratio 73 % 72 %

Update of the 2007 shelf-registration document 20
� Current net income group share for the Asset Management business was €115.7 million for the half-year ended June 30, 2008, down 22% compared to the first half of 2007. At a constant exchange rate, the decline would have been 14%.
Europe In Europe, assets under management were €377.6 billion at the end of June 2008, a 3.6% decline (down €13.9 billion) compared to the end of 2007 (€ 391.5 billion). New money for the first half of 2008 (€8.8 billion) was more than offset by the negative market effect (down €14.8 billion) and the first wave of withdrawals from Banque Postale’s due to its exit from life insurance activities (€7.9 billion). North America Assets at the end of the period totalled $293.3 billion at the end of June 2008, at about the same level as on December 31, 2007.
o Net new money totalled $7.9 billion in the first half of 2008, down 57% compared to the first half of 2007 ($18.7 billion). $6.5 billion came from the Natixis Global Associates platform (i.e., 83% compared with 71% on average in 2007); the balance was raised directly from subsidiaries.
o The overall market effect was a negative $13.4 billion in the first half of 2008 alone due to the
decline in equity markets. 4.3. Services At the end of June 2008, the Services segment was reorganised, and its product offerings were supplemented by three new businesses:
� lease financing, whose goal is to create and distribute (directly or through network channels) a wide range of lease financings (real estate, equipment, energy, automobiles, etc.);
� advisory services through Natixis Pramex, whose mission is to assist and advise companies on their international strategies; and
� the retail banking activities of Natixis Algérie. The sector is now divided into six business lines:
� Insurance and guarantees: Life Insurance, Term Insurance, Death Insurance for Borrowers and Financial Sureties and Guarantees;
� Specialized Financings, that combine Lease Finance and Consumer Credit;
� Employee Benefits: Employee Savings Plans and Service Vouchers;
� Electronic Banking and Payments: Monetics, checks and exchange systems, services for individuals;
� Securities Services: retail and institutional custody, administrative and accounting management for funds;
� International services: international advisory services and retail banking in Algeria.

Update of the 2007 shelf-registration document 21
� The NBI for the Services segment was €788 million for the half-year ended June 30, 2008, up €42 million
(+6%) compared to the end of June 2007. With NBI up 10% (+€31 million) compared to the first half of 2007, Securities services activities made a significant contribution to overall growth, primarily due to the acquisition of the fund custody and administration activities of Caceis Bank Deutschland (CBD) and Olympia by Caceis. Excluding the changes in the scope of consolidation and non recurring items, NBI rose 3%. NBI by business line
Securities Services
43%
Insurance and Guarantees
25%
Electronic Banking & Payments
10%
Employee benefit planning
7%
International Services
2%
Specialized financing
13%
� Expenses for the Services segment were €490 million, up 10% (+€45.3 million) compared to June 2007, with a significant portion of the increase resulting from the change in the scope of consolidation. On a constant scope of consolidation basis, expense growth was just 2%.
SERVICES
Actual Actual A. 1H08 / 1H07 in €M 1H 2008 1H 2007 amount %
Allocated capital (average) 1,952 1,945 + 7 + 0 %
Net banking income 787.7 746.0 + 41.7 + 6 %
Expenses (489.9) (444.6) (45.3) + 10 %
Gross operating income 297.8 301.4 (3.6) – 1 %
Cost of risk (6.7) (8.1) + 1.4 – 18 %
Net income before tax 303.7 294.7 + 9.0 + 3 %
Net underlying income, Group share 201.2 190.1 + 11.1 + 6 %
Profitability on allocated capital 20.6 % 19.5 %
Cost/income ratio 62 % 60 %

Update of the 2007 shelf-registration document 22
Payroll costs were up 9% in keeping with the increase in number of employees at the end of the period (+ 10%). On a constant scope of consolidation basis, the growth in number of employees was just 2%.
� The Services business segment posted GOI of €298 million at the end of June 2008, a slight decrease (1%) compared to the first half of 2007. The cost/income ratio was 62%, down 2 points. Excluding non-recurring items from 2007 and change in the scope of consolidation in 2008, the GOI was up 3% (up €9.2 million).
� Gains on assets sales were €9.5 million during the first six months, taking into account the entry of BNP Paribas into SLIB’s capital for 33.4% (€5.3 million) and the sale of shares of the subsidiary of Caceis Fastnet House (€4.6 million).
� Underlying net income group share in the Services segment was €201 million in the first half of 2008, up
6% compared to the first half of 2007. Allocated ROE was 20.6%, compared to 19.5% in the first half of 2007, a 1-point drop.
Insurance and Guarantees Insurance
� Natixis Assurances experienced the effects of deterioration in the economic and financial environment. The
inverted yield curve encouraged short-term placements to the detriment of Life Insurance, which also suffered from a sharp drop in share prices and the determination by most institutions to maintain a high level of liquidity; these factors motivated the marketing staff in the networks to focus on other savings products. � Life Insurance gross premiums, €1.85 million for the first six months, were down 17% compared to the
end of June 2007, a change that was in line with results posted by the group of bank-insurers in the market generally. Total assets under management of €31.7 billion were up 7% over the year, primarily because of the portfolio of Group Life Insurance (+56%).
� Term insurance posted premium growth of 32% at €121 million, resulting from the pursuit of business
with the client base of the Banques Populaires and Caisses d’Epargne networks. � The NBI for the Insurance business line was €132 million for the half-year ended June 30, 2008, down 10%,
or €14 million, compared to the half-year ended June 30, 2007. Sureties and Guarantees
� Premiums written in the first half of 2008 totalled €91.8 million, compared to €87.1 million for the half-year
ended June 30, 2007, up 5% compared to the first half of 2007. The small decline in the retail market for individuals was offset by growth in the corporate market due to guarantees provided to businesses.
� Guaranteed outstandings totalled €51.2 billion, up 21% compared to the first half of 2007, with a 20%
increase in the retail market (€43.2 billion). The growth in the portfolio of guarantees was 10% compared to December 31, 2007.
NBI for the half-year ended June 30, 2008, was €68.1 million, up 16% (+€9.2 million) compared to the NBI for the same period in 2007, due primarily to a 7% increase in premiums earned. Specialised Financings Lease financing
� At the end of June 2008, Lease Financing achieved new production that was up sharply compared to the
end of June 2007 (+21%). In a still-challenging competitive environment; liquidity costs remained high, and could not be recovered by market players from their SME clientele. Average outstandings were €7.3 billion compared to €6.9 billion at the end of June 2007.
� NBI for the half-year ended June 30, 2008 was €56 million, down €4.4 million (-7%) in the first half of
2007, after taking into account non-recurring items in the first half of 2007.
Update of the 2007 shelf-registration document 23
Consumer credit
� The commercial dynamics of consumer credit remained strong, both in the revolving credit segment and
personal loans, while the French market experienced a slowdown. � Revolving credit activity was relatively strong during the period despite the difficult economic situation.
The primary growth engine remained the Teoz product of the Caisses d’Epargne, while the Creodis product of the Banques Populaires, introduced at the end of 2007, grew in importance during the second quarter of 2008.
� Personal loan activities continued to grow, with the entire Caisses d’Epargne network now using the Natixis Financement production chain. At the end of June 2008, the number of accounts was almost 236,000, an increase of 25% for the year, and outstandings were €4.8 billion, up €2.5 billion over the year.
� NBI for the half-year ended June 30, 2008 totalled €46 million, up €3.6 million (+8%) over the year. Employee Benefits Planning � Employee Benefits Planning performed well in its first six months of operations due to developments in the
financial and legal environment.
� Employee savings plan assets under management were €16.5 billion, down €2.6 billion over the year (including €2.1 billion since the beginning of the year, taking into account the double effect of unfavourable developments in the financial markets and the success of early release measures for investments under the law favouring “work, employment and purchasing power”). Business continued to grow in the very small and small- and medium-sized business sectors at the Banques Populaires and with the introduction of a product by the Caisses d’Epargne, generating an increase of over 15% in the number of business customers to almost 37,000.
� At the same time, the Voucher Services business continued its growth. The number of vouchers issued (33 million) was up 15%. In addition, the CESU5 launched at the end of 2006 continued its growth with 341,000 checks issued compared with 228,000 at the end of June 2007.
� The NBI of this business line was €53.5 million, up 13% (+€6 million). International Services The NBI of the International Services business line was €19 million, including €12 million generated by Natixis Algérie. Electronic Banking and Payments Electronic Banking and Payments posted an NBI of €82 million for the half-year ended June 30, 2008, up 9% (+€7 million) for the half-year ended June 30, 2008 compared to the first half of 2007. The Electronic Banking business continued strong; the number of cards issued was up 6%, and the number of payment transactions up 5%. Securities Services Assets under custody with Natixis financial services for its institutional clients, as well as all the assets administered by Natixis Investor Servicing, were transferred to Caceis on June 30, 2008 (with no impact on net income).
5 Chèque Emploi Service Universel

Update of the 2007 shelf-registration document 24
For the half-year ended June 30, 2008, the Securities business had €2,665 billion in custodial assets, compared to €2,869 billion at year-end 2007, a decline of 7% (-€204 billion), primarily due to market conditions. in billions of euros 30/06/2008 31/12/2007 2008/2007
Change 2008/2007 Change
% Amounts in custody 2,665 2,869 (204) -7% Natixis financial services 273 493 (220) -45% Gestitres 67 105 (38) -36% Caceis (at 100%) 2,326 2,271 55 2% Caceis France 1,612 1,698 (86) -5% Caceis France contribution
Natixis
185 0 185 N/A
Caceis International 529 574 (45) -8% Managed amounts 1,047 1,095 (48) -4% Natixis Investor Services 0 151 (151) -100% Caceis (at 100%) 1,047 944 103 11% Caceis France 661 681 (21) -3% Caceis France contribution
Natixis
145 0 145 N/A
Caceis International 241 263 (22) -8%
� The NBI of the Securities Services business line was €331.9 million for the half-year ended June 30, 2008, up 10% (+€31.1 million) compared to the first half of 2007. Two matters related to the scope of consolidation should be noted:
- The acquisition of the custody and funds administration businesses of the CBD and Olympia funds at the end of 2007 by Caceis for €41.8 million;
- and the loss of NBI tied to the transfer of the client LCL between the first half of 2008 and the first half of 2007, in the amount of €19.6 million.
Adjusted for the acquisitions of CBD and Olympia and the loss of LCL’s business, the increase in NBI for the Securities Services business line was 3% (+€8.9 million) compared with the first half of 2007.

Update of the 2007 shelf-registration document 25
4.4. Private Equity and Private Banking
Despite a good level of business activity in the first half, the results of Private Equity and Private Banking were affected by the current financial crisis. The Private Equity and Private Banking division generated a NBI of €183.8 million in the first half of 2008, down 39% compared to the first half of 2007 (which represented an exceptionally high NBI level). Cumulative expenses for the division were €86 million in the first half of 2008, compared to €80.5 million for the half-year ended June 30, 2007, a 7% increase. The division’s GOI was €97.8 million for the half-year ended June 30, 2008, down 56% (€124.4 million) compared to the same period in 2007. The sector’s cost/income ratio was 47% at the end of June 2008, a significant increase compared to the end of June 2007 (+27%). Net income group share for the Private Equity and Private Banking division was €60.9 million, down 62%. Private Equity Investments in the first half of 2008 were €415.9 million, compared to €240.7 million at the end of June 2007, a 73% increase. Investments for the proprietary account totalled €259.7 million, 62% of the total. Disposals were €315.5 million for the period, compared to €369.7 million at the end of June 2007, a 15% decline. €238 million were proprietary account investments (76% of the total) with the decline concentrated primarily in disposals on behalf of third parties. Capital under management, which includes funds raised from subscriptions and unrealised capital gains, totalled €4.1 billion, a 12% increase (+ €0.4 billion) compared to year-end 2007. €2 billion of capital managed originated from the company’s own resources, 48% of the total, compared to 46% in the prior year. Except for LBO activities, managed capital grew in all activity segments, with the most marked growth in international (+35% compared to year-end 2007).
PRIVATE EQUITY AND PRIVATE BANKING
Actual Actual A. 1H08 / 1H07 In €M 1H 2008 1H 2007 amount %
Allocated capital (average) 350 328 + 22 + 7 %
Net banking income 183.8 302.7 (118.9) – 39 %
Expenses (86.0) (80.5) (5.5) + 7 %
Gross operating income 97.8 222.2 (124.4) – 56 %
Cost of risk (1.7) (0.2) (1.6)
Current income before tax 97.3 222.2 (124.9) – 56 %
Net underlying income, Group share 60.9 158.8 (98.0) – 62 %
Profitability on allocated capital 34.8 % 97.0 %
Cost/income ratio 47 % 27 %
nm

Update of the 2007 shelf-registration document 26
Managed capital in June 2008
48%52%
Ow n resources
Third-party accounts
The NBI for Private Equity activities was €125.2 million, down 48% compared to the first half of 2007, which represented a very high basis for comparison. Capital gains realized on sales were €158.4 million for the half-year ended June 30, 2008, compared to €124.6 million in the first half of 2007, a 27% increase. However, the variation in total unrealized capital gains was €6.1 million, compared to €111.4 million for the half–year ended June 30, 2007. The revaluations of June 30, 2008, (+€73.6 million) were offset by the realization of amounts previously recorded as unrealized capital gains (-€67.5 million) resulting from high levels of disposals in the first half of 2008. The first half of 2008 was also marked by a significant effort to add to provisions: net allocations to provisions posted a strong increase to €55 million for the half-year ended June 30, 2008, compared to €11 million for the same period in 2007 (and €21 million for the entire 2007 fiscal year). Private Banking Assets under management in the private banking business line were €16 billion for the half-year ended June 30, 2008, down 6% (down €1.1 billion) over the year and 8% since December 31, 2007. Net total new assets for this business line at the end of June 2008 was €439 million, down 48% (down €404 million) compared to the first half of 2007. New business was, however, very strong in wealth management (€383 million in the first half of 2008, up 81% compared to the first half of 2007), despite a challenging market environment Loans outstandings (loans granted to clients) stood at €931.3 million at the end of June 2008, the same level as year-end 2007. Production slowed considerably in the first half of 2008 compared to the full year of 2007. For the half-year ended June 30, 2008, the NBI of Private Banking was €58.6 million, compared to €61.5 million for the same period in 2007, a 5% decline (down €3.3 million). The economic situation weighed heavily on performance. The decline in financial markets impacted outstandings on which a large share of commissions are based. It also led to a reduction of commissions on flows (a decline in stock market orders) and trades were primarily carried out for less well compensated assets (money market Commissions on outstandings and on transactions were lower, with only interest income up in the first half of 2008.
Managed capital in June 2008 18%
41%
26%
15%
Venture International Transmission Development
Update of the 2007 shelf-registration document 27
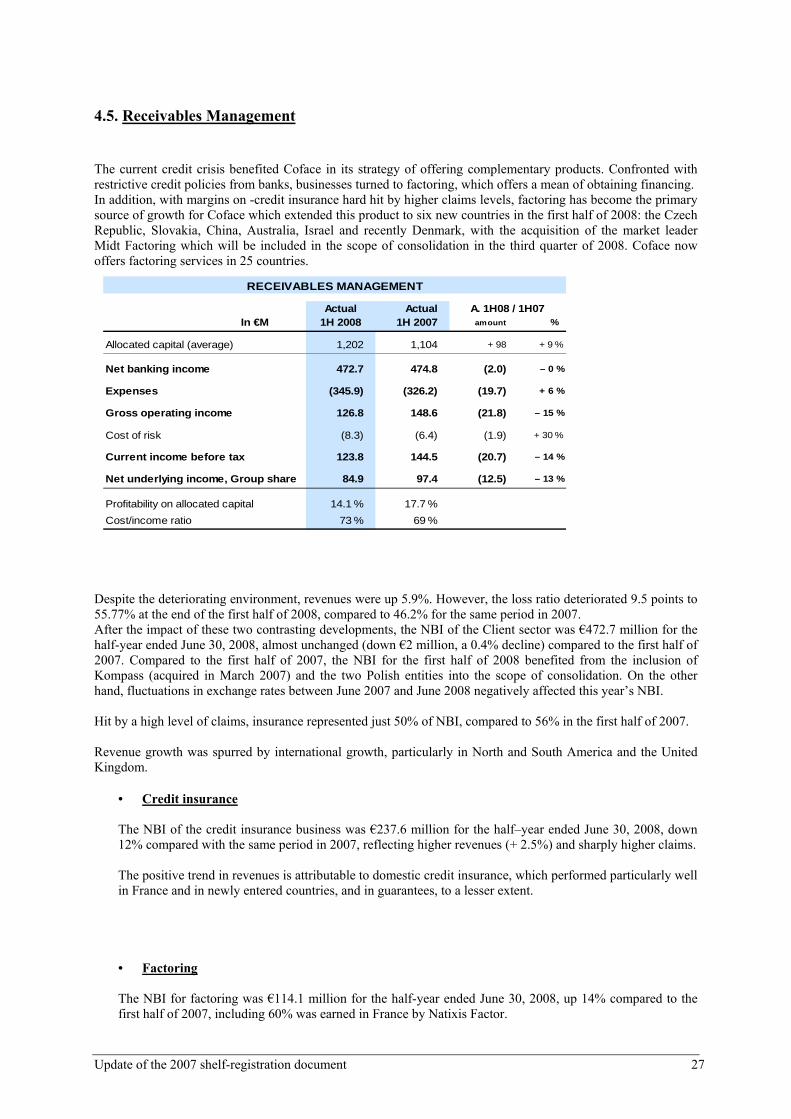
4.5. Receivables Management The current credit crisis benefited Coface in its strategy of offering complementary products. Confronted with restrictive credit policies from banks, businesses turned to factoring, which offers a mean of obtaining financing. In addition, with margins on -credit insurance hard hit by higher claims levels, factoring has become the primary source of growth for Coface which extended this product to six new countries in the first half of 2008: the Czech Republic, Slovakia, China, Australia, Israel and recently Denmark, with the acquisition of the market leader Midt Factoring which will be included in the scope of consolidation in the third quarter of 2008. Coface now offers factoring services in 25 countries.
RECEIVABLES MANAGEMENT
Actual Actual A. 1H08 / 1H07In €M 1H 2008 1H 2007 amount %
Allocated capital (average) 1,202 1,104 + 98 + 9 %
Net banking income 472.7 474.8 (2.0) – 0 %
Expenses (345.9) (326.2) (19.7) + 6 %
Gross operating income 126.8 148.6 (21.8) – 15 %
Cost of risk (8.3) (6.4) (1.9) + 30 %
Current income before tax 123.8 144.5 (20.7) – 14 %
Net underlying income, Group share 84.9 97.4 (12.5) – 13 %
Profitability on allocated capital 14.1 % 17.7 %
Cost/income ratio 73 % 69 %
Despite the deteriorating environment, revenues were up 5.9%. However, the loss ratio deteriorated 9.5 points to 55.77% at the end of the first half of 2008, compared to 46.2% for the same period in 2007. After the impact of these two contrasting developments, the NBI of the Client sector was €472.7 million for the half-year ended June 30, 2008, almost unchanged (down €2 million, a 0.4% decline) compared to the first half of 2007. Compared to the first half of 2007, the NBI for the first half of 2008 benefited from the inclusion of Kompass (acquired in March 2007) and the two Polish entities into the scope of consolidation. On the other hand, fluctuations in exchange rates between June 2007 and June 2008 negatively affected this year’s NBI. Hit by a high level of claims, insurance represented just 50% of NBI, compared to 56% in the first half of 2007. Revenue growth was spurred by international growth, particularly in North and South America and the United Kingdom.
• Credit insurance
The NBI of the credit insurance business was €237.6 million for the half–year ended June 30, 2008, down 12% compared with the same period in 2007, reflecting higher revenues (+ 2.5%) and sharply higher claims.
The positive trend in revenues is attributable to domestic credit insurance, which performed particularly well in France and in newly entered countries, and in guarantees, to a lesser extent.
• Factoring
The NBI for factoring was €114.1 million for the half-year ended June 30, 2008, up 14% compared to the first half of 2007, including 60% was earned in France by Natixis Factor.

Update of the 2007 shelf-registration document 28
The increase in the NBI was driven by international business (up 26%), with the volume of receivables financed up 35%. Germany remained the largest market, but the product is also growing steadily in other countries. Growth in the NBI was more modest in France (up 7%) despite higher volumes, due to the effect of competition on margins. • Credit management Services
The first half NBI for business information services (+14% to €69.5 million) benefited from the acquisition of Kompass and entry into the Polish market. Commercial recovery services posted NBI of €16.6 million, up 2%. Revenues rose 3.7% due to strength in Portugal and Spain.
• Public proceedings management
The NBI for this activity carried out for the French State was €35 million for the half-year ended June 30, 2008, up 21%. It was boosted by the favourable outcome of negotiations on the renewal of the financial agreement with the French State that facilitated an increase in business and also allowed recognition of a positive adjustment of nearly €3 million for the 2007 fiscal year.
Expenses for the division totalled €345.9 million for the half-year ended June 30, 2008, an increase of 6.1% over the first half of 2007. The expense increase is consistent with the continuation of Coface’s worldwide growth plan. Since the beginning of the year, the business’s FTE rose by 4.4% overall; it was stable in France and up 9% in international. The division’s GOI was €126.8 million for the half-year ended June 30, 2008, down 15% (€21.8 million compared to the first half of 2007). After tax, net income group share was €84.9 million, down 13% (€12.5 million) compared to the first half of 2007. 4.6. Retail banking The contribution of the two networks, the Banques Populaires and the Caisses d’Epargne, to the line item “share in net income of associates” was €282.6 million for the first half of 2008, down 28% compared to the first half of 2007 (down €391 million). The cumulative net income of the two networks (100%) totalled €1,216.3 million, down 25%, and two technical issues aggravated the decline in the contribution.

Update of the 2007 shelf-registration document 29
2007 2007 2008 in €M FY H1 H1 % €M
Cumulative income (100%) 2,934.2 1,617.0 1,216.3 -25% (400.8)
o/w Banques Populaires 1,339.6 745.3 660.3 -11% (85.0)
o/w Caisses d'Epargne 1,595.0 872.0 556.0 -36% (316.1)
20% share 586.8 323.4 243.3 -25% (80.1)
Relutive profit 118.6 67.3 58.5 -13% (8.8)
Excess of restated assets on historical cost
(63.1) (19.2)
EM line contribution 642.3 390.8 282.6 -28% (108.4)
o/w Banques Populaires 287.6 178.9 134.7 -25% (44.2) o/w Caisses d'Epargne 354.7 211.9 147.9 -30% (64.0)
CCI Corporate Income Tax (72.6) (38.7) (36.2) -6% 2.5
Contribution to net accounting income 569.7 352.1 246.4 -30% (105.7)
Change H1oH1

Update of the 2007 shelf-registration document 30
The Banques Populaires
BANQUE POPULAIRE NETWORK Actual Actual A. 1H08 / 1H07 In €M 1H 2008 1H 2007 amount %
Net banking income 2,936 2,985 (48) – 2 %
Charges (1,864) (1,806) (58) + 3 %
Gross operating income 1,072 1,179 (107) – 9 %
Cost of risk (200) (183) (17) + 10 %
Income before tax 880 1,056 (176) – 17 %
Net income, Group share 660 745 (85) – 11 %
Equity accounting of CCIs
Equity-accounted share 132.1 149.1 (17) – 11 %
Relutive profit 20.4 29.8 (9) – 31 %
Excess of restated assets on historical cost
(17.8) 0.0 (18) nm
Tax on CCIs (13.6) (18.0) + 4 – 24 %
Contribution to the net income of Natixis
121.1 160.9 (40) – 25 %
On the credit front, the first half of 2008 demonstrated strong growth for the Banques Populaires, with total customer loans outstanding up 12% for the half-year ended June 30, 2008, compared to the same period in 2007, driven by real estate loans in the personal market, and by medium and long term equipment loans in other markets. In the area of savings, on the other hand, monetary resources increased 9% compared to June 2007, driven by deposits at market rates, which were up 41% over 12 months. Financial savings, on the other hand, posted a slight decline of 2.3%, despite the 5% increase in life insurance assets. The NBI of the Banques Populaires for the half-year ended June 30, 2008, was €2,936 million, down slightly by 2%. Excluding home purchase savings, the NBI was up 2.2%, primarily due to good performance in commissions. Operating expenses were €1.864 million for the first half, up 3%. The cost/income ratio was 63.5%, up 3 points. Excluding home purchase savings, it stood at 62.7%, up 0.6 point. The GOI of the Banques Populaires was €1,072 million, a 9% drop. Excluding home purchase savings, it posted a slight increase of 0.4%. The cost of risk was €200 million, up 9% (or €17 million). Compared to weighted outstandings, the cost of risk was 31 basis points, very close to the same level as 2007.

Update of the 2007 shelf-registration document 31
Before tax profits for the Banques Populaires were €880 million, down 17% (€176 million). This decline was aggravated since the financial statements for the first half of 2007 included notably the gain on the sale of the former Polish subsidiary Crédit Coopératif, the bank BISE, for €49 million. Net income of the Banques Populaires was €660 million for the half-year ended June 30, 2008, down 11% (€85 million) compared to the first half of 2007. Excluding home purchase savings and the gain on the bank BISE, it posted a 4% increase. The share of net income attributable to Natixis was €132.1 million, a drop of 11%. It includes an accretion gain of €20.4 million (down 31%), and adjusted down for revaluation adjustments on recyclable assets (the AFS and CFH portfolios) in the amount of €17.8 million. The share of income accounted for by the equity method thus totals €134.7 million before taxes, down 25%. Caisses d’Epargne
As with the Banques Populaires, the first half of 2008 generated good growth for the Caisses d’Epargne on the credit front, with total customer loans outstanding up 9% for the half-year ended June 30, 2008 compared to the same period in 2007. The individual banking market showed strong growth in consumer credit (up 10%) over the year. At the same time, the growth rate was sustained in the savings area, primarily due to strong growth in “Livret A” savings accounts ( interest rate increase), as well as by life insurance. The NBI of the Caisses d’Epargne was €2,931 million for the half-year ended June 30, 2008, down 12% compared to the same period in 2007. Excluding the effect of home purchase savings, there was a 10% decline. Expenses totalled €2,182 million for the first half, up 3%.
The GOI was €749 million, down 38% (down €451 million) compared to the first half of 2007.
CAISSE D’ÉPARGNE NETWORK
Actual Actual A. 1H08 / 1H07 In €M 1H 2008 1h 2007 amount %
Net banking income 2,931 3,318 (387) – 12 %
Expenses (2,182) (2,118) (64) + 3 %
Gross operating income 749 1,200 (451) – 38 %
Cost of risk (98) (25) (73)
Income before tax 652 1,176 (524) – 45 %
Net income, Group share 556 872 (316) – 36 %
Equity-accounting of CCIs
Equity-accounted share 111.2 174.4 (63) – 36 %
Relutive profit 38.1 37.6 + 1 + 1 %
Excess of restated assets on historical cost (1.4) 0.0 (1) nm
Tax on CCIs (22.6) (20.7) (2) + 9 %
Contribution to the net income of Natixis 125.3 191.3 (66) – 34 %

Update of the 2007 shelf-registration document 32
Overall, the net income of the Caisses d’Epargne was €556 million, down 36% (down €316 million). The share of net income attributable to Natixis was €111.2 million, down 36%. It includes an accretion gain of €38 million (unchanged from June 30, 2007.) The share of net income accounted for by the equity method received by Natixis was €147.9 million, down 30%. 4.7. Cost of risk The consolidated cost of risk for Natixis Group (a figure that excludes the two retail networks) was €374 million for the half-year ended June 30, 2008, including €214 million for individual risks and €160 million for group provisions. The increase in the cost of risk compared the first half of 2007 is largely attributable to businesses in the Corporate and Investment Banking division. Group provisions rose during the first half of 2008, primarily due to additional allocations to the sectoral provision for monoline insurers in the current financial crisis (a negative impact of €184 million).
- Change in total cost of risk by division:
- Breakdown for the Corporate and Investment Banking division:
- Change in the individual cost of risk by division:
in millions of euros 1H 2008 IFRS-EU
1H 2007 IFRS-EU
Corporate and investment banking (291) 4 Asset management 3 (0) Private equity and private banking (2) (0) Services (7) (8) Receivables management (8) (7) Other (69) 0 Cost of global risk (374) (11)
in millions of euros 1H 2008 IFRS-EU
1H 2007 IFRS-EU
Corporate and investment banking (135) 9 Asset management 0 (0) Private equity and private banking (2) (0) Services (6) (6) Receivables management (8) (6) Other (63) 0 Cost of individualised risk (214) (3)
in millions of euros 1H 2008 IFRS-EU
1H 2007 IFRS-EU
Corporate and institutional relations 10 (4) International (1) 7 Commodities (26) (20) Structured financings (5) 18 Capital Markets (269) 3 Total (291) 4

Update of the 2007 shelf-registration document 33
- Breakdown of the Corporate and Investment Banking division:
- By region, the individual cost of risk changed as follows:
V. Risk management 5.1. Natixis’ general risk management system Natixis’ risk management system has been implemented in accordance with banking regulations and with Groupe Banque Populaire and Groupe Caisse d’Epargne’s corporate governance principles. The system comes under the supervision of the Natixis Executive Board and is built around three tiers of coordinated control:
• internal control carried out by the operational or functional departments, under the supervision of their line management. Depending on the precise situation and activity, these so-called first-tier controls are conducted either by the line personnel themselves, or by an ad hoc control body such as a middle-office or accounting control body, or, where necessary, by both acting together;
• second-tier controls (as per article 6-a of regulation no. 97-02) are carried out by dedicated bodies which act independently from operational divisions;
• third-tier controls, also known as periodic controls, are carried out by Internal Audit. The senior officer responsible for ensuring the consistency and effectiveness of permanent control (in accordance with article 7-1, sub-point 4 of amended CRBF regulation no. 97-02) is the Chief Executive Officer. The Chairman of the Executive Board chairs the committee that coordinates controls and which brings together all those involved in permanent control, together with the head of IT Systems Security, the Chief Financial Officer and the Corporate Secretary. As announced and in keeping with commitments made to the CECEI, Natixis undertook further efforts geared to reinforcing the effectiveness and transparency of its risk control system which is based upon:
• separation of risk taking and control functions within the Natixis Group, including: o distinction between front- and back-office functions, o the existence of first-tier controls at an operational level;
in millions of euros 1H 2008 IFRS-EU
1H 2007 IFRS-EU
Corporate and institutional relations (12) International (2) 1 Commodities (21) 3 Structured financings (8) 13
Capital Markets (88) 4
Total (135) 9
(16)
in millions of euros 1H 2008 IFRS-EU
1H 2007 IFRS-EU
Africa and Middle East (1) (3) Central and Latin America (22) 6 North America (20) 18 Asia and Oceania (2) (0) Eastern Europe 0 (0) Western Europe (169) (23) Total (214) (3)

Update of the 2007 shelf-registration document 34
• distinction between periodic and permanent controls; • control units within the Natixis Group organised on a worldwide basis so as to ensure the consistency of
internal procedures; • a specific role of supervisory central body, assigned jointly to Groupe Caisse d’Epargne and Groupe
Banque Populaire. Permanent control is the responsibility of the Risk and Compliance departments. Governance of the control system comes under the supervision of the Natixis Executive and Supervisory Boards, with the latter making use of the Audit Committee to carry out its duties. The joint control system, which is aimed at ensuring Natixis’ risks are consolidated and monitored on a consolidated basis by the central bodies, relies on the three permanent confederal Committees set up when Natixis was established at the end of 2006. 5.2. Natixis’ Risk Department Since Natixis was created on November 17, 2006, the Risk department has been based on an organisational structure that unifies Natixis and the former IXIS Corporate & Investment Bank in terms of resources, methodologies and tools. The Risk department draws up a risk policy in accordance with the policies of the two central institutions and proposes it to the Executive Board for validation. It also proposes principles and rules to the Executive Board concerning the following subjects:
• risk acceptance procedures; • delegations; • risk assessment; • risk monitoring.
It plays a key role within Committees, the main components of which are as follows: • a general committee – the Group Risk Committee – which sets out the main tenets of the Group’s risk
policy; • the Natixis Group Credit Committee; • the Market Risk Committee; • the Operational Risk Committee; • the New Products and New Activities Committees; • the Limit Violation committee; • the Counterparty Watch List Committee.
It also plays an active role in Group Provisions Committees and the ALM Committee, which is chaired and organised by the Finance department. Lastly, it reports regularly on its work, analyses and findings to Natixis’ executive and supervisory bodies and to Groupe Caisse d’Epargne and Groupe Banque Populaire. 5.3. Credit Risk 5.3.1. Measuring and managing credit risk Natixis’ credit risk measurement and management system is based on:
• a standardized risk-taking process which is structured via a system of delegations and decision-making Committees;
• independent “contradictory” analyses undertaken by the Risk department and forming part of the credit application review process;
• ratings tools and methods which provide a standardized assessment of the quality of counterparty risks and enable the probability of default within one year to be assessed.

Update of the 2007 shelf-registration document 35
5.3.2. Internal rating system Internal rating forms part of Natixis’ counterparty risk management mechanism, with a system based on:
• a set of methodologies designed to allocate ratings in keeping with Natixis’ risk profile and which is revised on a permanent basis;
• processes, procedures and controls that place internal ratings at the heart of the risk management mechanism, starting with transaction origination and continuing to ex-post analysis of defaulting counterparties;
• a project-mode approach, which involves working with the business lines in which the Risk department plays a decisive role.
This is carried out in keeping with the policies of and in liaison with Groupe Caisse d’Epargne and Groupe Banque Populaire, particularly as regards the targeted rating methodologies defined for each asset class and segment. By virtue of this system, Natixis received permission from the French Commission bancaire to use the IRB Foundation approach to calculate regulatory capital requirements for credit risk purposes from January 2008, for a defined scope of portfolios and entities. 5.3.3. Credit Risk Reduction Techniques Natixis uses credit risk reduction techniques such as set-off agreements, guarantees, collateral and credit default swaps. The principles for identifying credit risk hedging instruments comply with the recommendations of the Basel Committee agreements. For its portfolio of corporate credits (banking book), Natixis carries out credit default swaps and conducts synthetic securitization operations in order to reduce all or part of the credit risk exposure relating to certain assets, by transferring the risk to the market. Credit assets covered by credit default swaps remain on Natixis’ balance sheet but they carry the counterparty risk of credit default sellers (OECD banks). These transactions are subject to the same decision-making and monitoring procedures as those applying to all derivatives. Their accounting treatment complies with ISDA conventions and they are subject to daily margin calls (Credit Support Annex). Credit risk monitoring Credit risk monitoring is based on the accountability of business lines and various control measures, with the whole mechanism overseen by a specialist team within the Risk department. Day-to-day monitoring is carried out by the business lines and the middle-office for financings and by the Risk department for second-tier control. With respect to limit violations, a Committee is held monthly to analyze the situation using indicators (such as number of violations, business lines concerned, etc.), to examine significant violations and to monitor their settlement. Cases presenting a serious level of risk are detected as they occur and reported immediately to the Risk department, the Special Affairs and Disputes department and to the business line concerned, in accordance with specific monitoring procedures and management of alerts. These cases may then be subject to special monitoring under the jurisdiction of the Special Affairs and Disputes department, the Risk department or the appropriate credit committee, depending on the level of exposure. Sensitive cases are reviewed at least once a quarter and are presented to the Counterparty Watch List Committee, which meets on a quarterly basis. Sensitive, doubtful or disputed risks are monitored by the Special Affairs and Disputes department which intervenes in the management of difficult cases when needed and recovers debts in the event of legal proceedings. Monitoring of doubtful and disputed cases and impairment mechanism
• Specific impairments

Update of the 2007 shelf-registration document 36
Provisions Committees are organised once a quarter for each division. They examine all cases likely to give rise to provisions or to adjustments of existing provisions and decide on the level of provisioning necessary. A Group Provisions Committee organised by the Finance department meets once a quarter. It is chaired by the Chief Executive Officer and involves the Risk department, the Special Affairs and Disputes department and the heads of the business lines concerned. The Committee bases its work on the examinations carried out by the Counterparty Watch List Committee, with the same case analysis materials being presented at the meeting.
• Collective impairments In addition to individual provisions, Natixis records provisions for country risk and sector-based risk from three angles:
o ratings for exposures on private individuals and professionals; o sector risk and geographical risk for other counterparties (corporates, sovereigns, etc.).
For the latter, objective impairment indicators are sought using analysis and close monitoring of business sectors and countries. An objective impairment indicator usually comprises a combination of microeconomic or macroeconomic indicators specific to the sector or country concerned. If necessary, an expert is called upon to fine-tune the result obtained. 5.3.4 Credit risk exposure The table below shows the credit risk exposure for all the Natixis Group’s financial assets. This exposure is determined without taking into account guarantees, collateral, credit default swaps, collateral on over-the-counter forward financial instruments, the effect of master set-off agreements and other forms of credit enhancement. It corresponds to the net accounting value of the financial assets recorded in the balance sheet, net of any impairment made (specific or collective).
(in € millions) Performing exposures
Default exposures Impairments
Net exposures 06/30/2008
Net exposures 12/31/2007
Financial assets at fair value through income (excluding variable-rate securities) 200,348 200,348 177,595
Hedging derivatives Available-for-sale financial assets (excluding
variable-rate securities) 761 761 670
Loans and receivables with financial institutions 30,222 (235) 29,987 29,057
Loans and receivables with customers
Held-to-maturity financial assets 97,195 37 (68) 97,164 112,394
Financing commitments given
Financial guarantee commitments given 114,270 1,307 (1,784) 113,793 112,505
TOTAL GROSS EXPOSURE 7,004 7,004 6,501 68,933 175 (15) 69,093 56,142 106,468 45 (21) 106,492 103,719 625,201 1,564 (2,123) 624,642 598,583 *Including collective provisions
“Exposures” correspond to the definition of doubtful receivables in French standards.
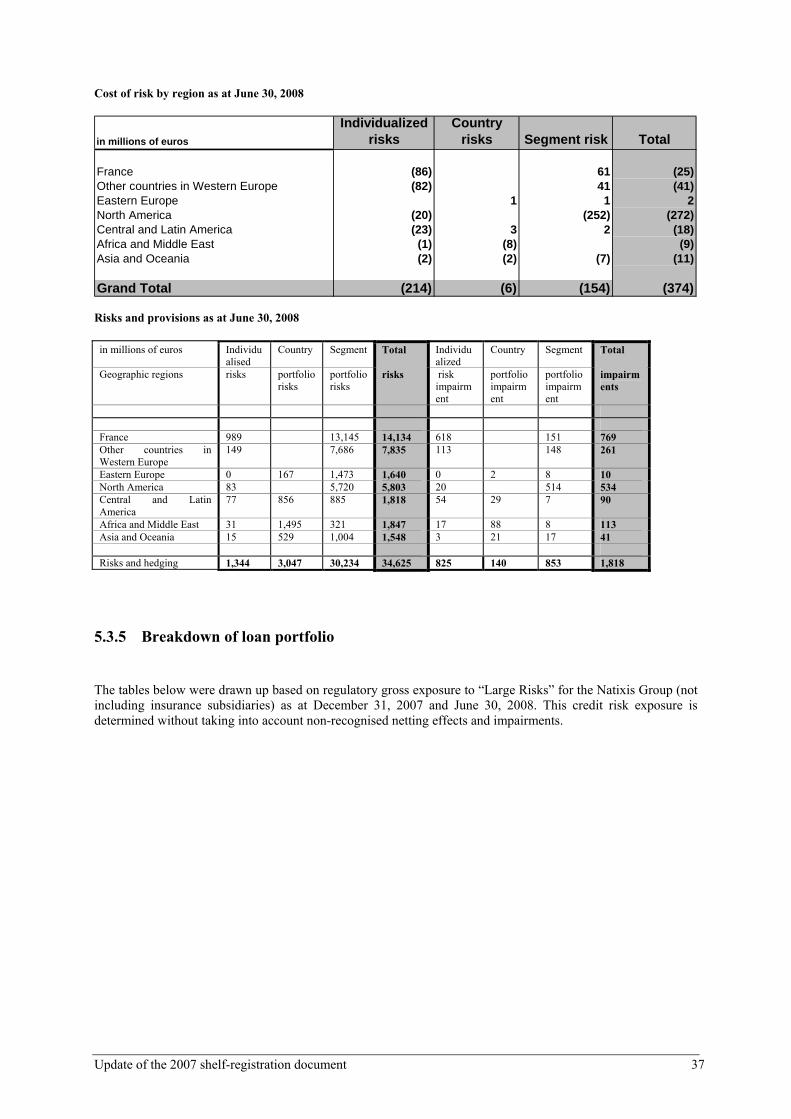
Update of the 2007 shelf-registration document 37
Cost of risk by region as at June 30, 2008
in millions of euros
Individualized risks
Country risks Segment risk Total
France (86) 61 (25)Other countries in Western Europe (82) 41 (41)Eastern Europe 1 1 2North America (20) (252) (272)Central and Latin America (23) 3 2 (18)Africa and Middle East (1) (8) (9)Asia and Oceania (2) (2) (7) (11)
Grand Total (214) (6) (154) (374)
Risks and provisions as at June 30, 2008
in millions of euros Individualised
Country Segment Total Individualized
Country Segment Total
Geographic regions risks portfolio risks
portfolio risks
risks risk impairment
portfolio impairment
portfolio impairment
impairments
France 989 13,145 14,134 618 151 769 Other countries in Western Europe
149 7,686 7,835 113 148 261
Eastern Europe 0 167 1,473 1,640 0 2 8 10 North America 83 5,720 5,803 20 514 534 Central and Latin America
77 856 885 1,818 54 29 7 90
Africa and Middle East 31 1,495 321 1,847 17 88 8 113 Asia and Oceania 15 529 1,004 1,548 3 21 17 41 Risks and hedging 1,344 3,047 30,234 34,625 825 140 853 1,818
5.3.5 Breakdown of loan portfolio The tables below were drawn up based on regulatory gross exposure to “Large Risks” for the Natixis Group (not including insurance subsidiaries) as at December 31, 2007 and June 30, 2008. This credit risk exposure is determined without taking into account non-recognised netting effects and impairments.

Update of the 2007 shelf-registration document 38
Four different breakdowns are presented, i.e. in terms of sector, geographic location, internal rating and Basel II portfolio.
Exposure by economic sector
06/30/2008 12/31/2007
Food 2.8% 1.7% Construction 3.3% 3.1% Consumer goods 1.3% 0.9% Retailing 3.8% 2.5% Energy 4.0% 3.9% Finance and insurance 49.2% 51.3% Holding companies and conglomerates 5.5% 7.3% Tourism, hotels and leisure 0.9% 0.8% Real estate 4.5% 5.9% Media 2.9% 2.1% Basic industries 3.4% 2.9% Mechanical and electrical engineering 2.8% 2.7% International trading, commodities 1.4% 1.9% Pharmaceuticals, healthcare 1.7% 1.3% Services 5.9% 6.4% Technology 1.5% 1.4% Utilities 0.8% 0.9% Government 3.9% 2.8% Other 0.5% 0.2%
TOTAL 100.0% 100.0% The portfolio’s significant weighting in the banking and finance sector reflects the preponderance of CIB business lines. As for the rest of the portfolio, corporate loans are appropriately diversified in a variety of sectors.
Exposure by region
06/30/2008 12/31/2007
France 45.2% 44.4% Other countries in the European Economic Area 27.8% 30.6%
Other countries in Europe 3.6% 2.8%
North America 15.8% 14.2% Latin America 2.6% 3.1% Africa/Middle East 2.0% 1.9% Japan 0.3% 0.2%
Asia and Oceania 2.5% 2.0%
Not provided 0.2% 0.8%
TOTAL 100.0% 100.0%
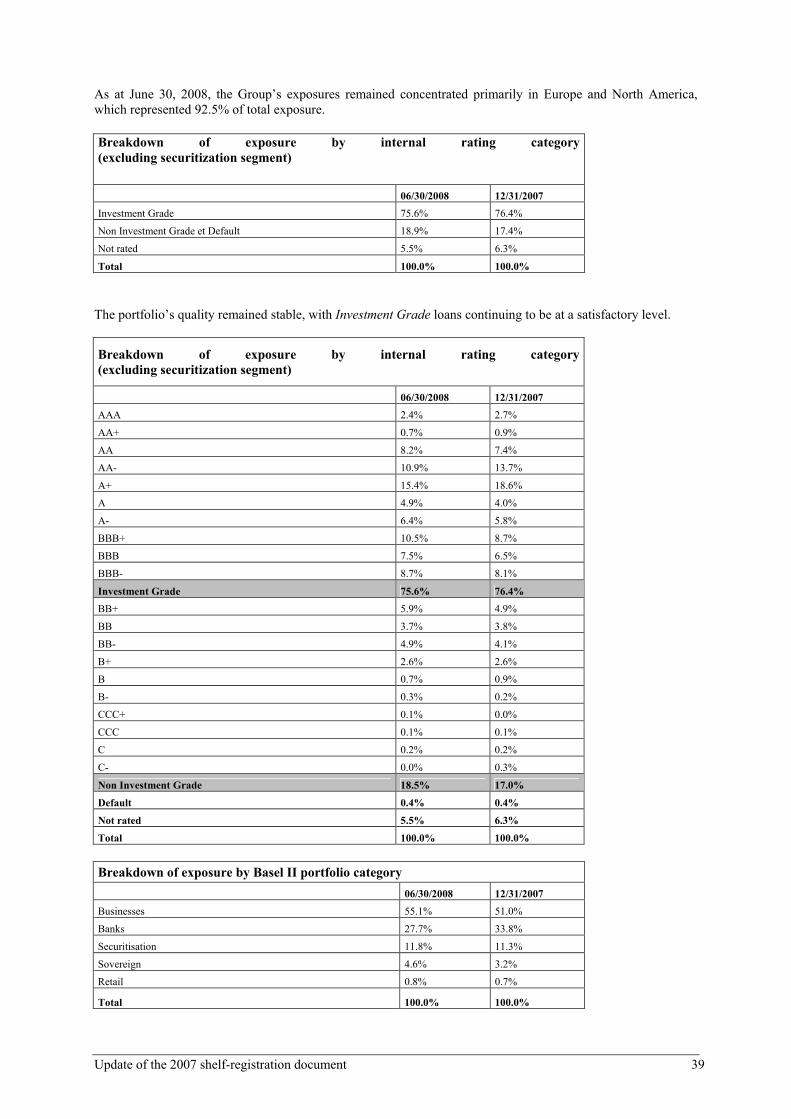
Update of the 2007 shelf-registration document 39
As at June 30, 2008, the Group’s exposures remained concentrated primarily in Europe and North America, which represented 92.5% of total exposure. Breakdown of exposure by internal rating category (excluding securitization segment)
06/30/2008 12/31/2007
Investment Grade 75.6% 76.4%
Non Investment Grade et Default 18.9% 17.4%
Not rated 5.5% 6.3%
Total 100.0% 100.0%
The portfolio’s quality remained stable, with Investment Grade loans continuing to be at a satisfactory level.
Breakdown of exposure by internal rating category (excluding securitization segment)
06/30/2008 12/31/2007
AAA 2.4% 2.7%
AA+ 0.7% 0.9%
AA 8.2% 7.4%
AA- 10.9% 13.7%
A+ 15.4% 18.6%
A 4.9% 4.0%
A- 6.4% 5.8%
BBB+ 10.5% 8.7%
BBB 7.5% 6.5%
BBB- 8.7% 8.1%
Investment Grade 75.6% 76.4%
BB+ 5.9% 4.9%
BB 3.7% 3.8%
BB- 4.9% 4.1%
B+ 2.6% 2.6%
B 0.7% 0.9%
B- 0.3% 0.2%
CCC+ 0.1% 0.0%
CCC 0.1% 0.1%
C 0.2% 0.2%
C- 0.0% 0.3%
Non Investment Grade 18.5% 17.0%
Default 0.4% 0.4%
Not rated 5.5% 6.3%
Total 100.0% 100.0%
Breakdown of exposure by Basel II portfolio category
06/30/2008 12/31/2007
Businesses 55.1% 51.0%
Banks 27.7% 33.8%
Securitisation 11.8% 11.3%
Sovereign 4.6% 3.2%
Retail 0.8% 0.7%
Total 100.0% 100.0%

Update of the 2007 shelf-registration document 40
5.4. Market risks 5.4.1. Organisation of market risk control The Market Risk function independently defines the methodologies for measuring risk, examines limits and monitors all of the market risks within the scope of Natixis. The market risk control system is based on a delegated architecture, in which the Group Risk Committee has overall responsibility and the Market Risk Committee plays an essential role. The Market Risk Committee’s task is to define the Bank’s market risk policy and ensure it is applied correctly. As the operational extension of the Executive Board, the Committee possesses all of the Board’s decision-making powers required to carry out its purpose. The Committee’s market risk policy embraces the following elements:
• definition and review of VaR limits, operational limits and loss-alert limits. This process is carried out in light of budgetary information supplied by front-office managers;
• establishment of delegations for validation purposes; • review of risk exposure; • review of any observed and/or unauthorised limit overruns and the rectifying actions either already
taken or to be taken;
Concerning market models, Natixis’ Risk department validates the models used within the Group and regularly ensures they are appropriate with regard to market developments and best practices. The operational sector of the Market Risk Committee is responsible for:
• analyzing and controlling market risks and producing the corresponding reports; • regularly monitoring positions and their profit/loss; • validating valuation models (pricers); • defining provisioning and fair value adjustment policies (for liquidity risk, risks related to non-
hedgeable parameters, model risks, etc.). 5.4.2. Methodology for measuring market risk Natixis controls its capital markets risk via a methodology for measuring the market risks incurred by the Group’s various entities. Different techniques are used to measure market risk: 1) Synthetic measures of Value-at-Risk (or VaR) are used to identify the potential losses that each activity
may engender, based on pre-determined confidence intervals (e.g. 99%) and assumptions as to the length of time positions are held (e.g. 1 day). These measures are compiled and monitored on a daily basis for all the Group’s trading activities. To this end, a model has been built based on a statistical analysis of the behaviour of all the market parameters affecting the value of the portfolios over a period of 365 days. The Bank’s Scénarisk software currently models more than 4,200 market risk factors. Natixis uses a VaR calculated using simulation techniques based on a Monte Carlo-type method that takes into account the portfolio’s non-linear characteristics with respect to the different factors of risk. These calculation methods are harmonised using a single calculation tool, Scénarisk, which was previously in place at Ixis Corporate & Investment Bank.
2) Operational indicators are used to manage activity on an overall and/or by homogenous activity basis, by focusing on more directly observable criteria (for example: sensitivity to variations in the underlying instrument, sensitivity to variation in volatility or to correlation, diversification indicators). The limits corresponding to these qualitative and quantitative operational indicators thus complement the VaR and loss-alert limits. They are determined consistently with these lasts. All operational limits are subject to day-to-day monitoring by the Market Risk team.
3) Stress tests are also employed to measure the losses potentially sustained by portfolios in extreme market circumstances. These circumstances are developed from market scenarios based on historical

Update of the 2007 shelf-registration document 41
studies (economic scenarios) and from hypothetical, specific or adverse scenarios for each portfolio or on an overall basis.
Adverse stress tests entail “stressing” the different market parameters showing significant sensitivities. The stresses are applied singly (or by consistent group of parameters) and give information on potential variations in P&L, activity by activity. Historical stress tests involve reproducing groups of variations in market parameters observed during previous periods of crisis, over a short time horizon, in order to provide ex-post simulation of the orders of magnitude of variations in recorded P&L. Although these stress scenarios have no predictive power, they allow a judgment of the exposure to known scenarios. Six historical stress scenarios were defined and are calculated daily. Theoretical stress scenarios, also called “overall stress” scenarios, consist in simulating variations in market parameters on all activities using plausible assumptions for the reaction of one market in relation to another, according to the nature of the initial shock. These scenarios are based on economic criteria and geopolitical or other considerations. Four overall stress tests are currently used at Natixis. A global program to relate the stress tests with the current market conditions was initiated in order to implement new theoretical and adverse stress tests, development in front office systems, and the establishment of limits. In relation with the approach used to measure and manage market risk, Natixis has received the authorisation from the French Commission bancaire to use the internal model previously validated for IXIS Corporate & Investment Bank over the equivalent perimeter within Natixis. The extension of the validation of the internal model is close to being confirmed by the French Commission bancaire.

Update of the 2007 shelf-registration document 42
5.4.3. Quantitative data for measuring Natixis’ market risk Changes in the VaR within Natixis The level of 99% 1-day VaR for Natixis’ trading portfolios (€29.4 million as at June 30, 2008) amounted to €19.5 million on average. The maximum level observed was €36 million, resulting in an excess for two days (January 22 and 23) over the limit of €35 million granted to Natixis by the French Commission bancaire. These excesses arose primarily from increased rate sensitivities and updated econometrics. The 75 bp decrease in lending rates by the Federal Reserve on January 22 created extremely volatile conditions and absence of liquidity on the interest rate market, particularly on the futures options market.
Natixis Trading Global VaR(99% 1 day)
0
5
10
15
20
25
30
35
40
29/6
/07
29/7
/07
29/8
/07
29/9
/07
29/1
0/07
29/1
1/07
29/1
2/07
29/1
/08
29/2
/08
29/3
/08
29/4
/08
29/5
/08
29/6
/08
M€
Natixis Trading
Limit
VaR by class of risk
Natixis Trading global VaR 99% 1 day
In € millions
06/30/2008 12/31/2007 Variation Trailing one-year average
NATIXIS
Interest-rate risk 23.6 10.1 13.5 10.4
Equity risk 16.2 6.9 9.3 7.4
Specific equity risk 5.8 3.0 2.8 3.8
Specific interest-rate risk 16.9 10.2 6.7 11.2
Foreign exchange risk 4.1 2.1 2.0 2.3
Total of all risk classes 66.6 32.3 34.3
Effects of offsets (37.3) (13.0) (24.3)
Consolidated VAR 29.4 19.3 10.1 19.5

Update of the 2007 shelf-registration document 43
VaR backtesting The reliability of the VaR indicator is measured regularly by comparing it with daily trading results in order to match the potential loss predicted by the VaR indicator with the profit or loss effectively realized. The chart below shows the results of this exercise for a sliding year.
Backtesting Natixis(regulatory scope)
-60
-40
-20
0
20
40
60
80
100
02/07/2007
16/07/2007
30/07/2007
13/08/2007
27/08/2007
10/09/2007
24/09/2007
08/10/2007
22/10/2007
05/11/2007
19/11/2007
03/12/2007
17/12/2007
31/12/2007
14/01/2008
28/01/2008
11/02/2008
25/02/2008
10/03/2008
24/03/2008
07/04/2008
21/04/2008
05/05/2008
19/05/2008
02/06/2008
16/06/2008
30/06/2008M
€
Delta PL
VaR 1 day, 99%
Five exceptions occurred since January 1, 2008.
The main stress tests executed on positions as at June 30, 2008, furnished the following information as regards impacts on P&L:
• Stress Test 1: Slump in stock-market indices – assumption of a slump in stock market indices accompanied by a modest impact on interest rates: impact: -€351 million;
• Stress Test 2: Increase in interest rates – assumption of a gradual rise in short-term rates and an abrupt rise in long-term rates with an increase in equity-market indices: impact: -€339 million;
• Stress Test 3: Increase in spreads and decline in indices and interest rates – assumption of an increase in credit spreads with a modest impact on interest rates and stock-market indices: impact: -€257 million;
• Stress Test 4: Increase in credit spreads – assumption of an increase in credit spreads: impact: -€217 million.

Update of the 2007 shelf-registration document 44
5.5. Overall interest rate, liquidity and structural exchange rate risk
The Asset-Liability Management Committee (ALM Committee) defines the main approach toward structural balance sheet risks. This committee’s responsibility is to:
• monitor changes in the balance sheet and in off-balance sheet items;
• define the rules for internal refinancing of activities;
• validate overall policy in the areas of refinancing, managing non-operational exchange-rate risk and reinvesting available shareholders’ equity;
• approve the assumptions and conventions chosen for preparing indicators and stress scenarios for liquidity and overall interest rates;
• validate the overall limits applying to indicators of structural balance-sheet risk and procedures for managing liquidity crises.
The ALM Committee’s scope of responsibility covers the banking portfolio for head office, branches and subsidiaries carrying significant structural risks for the balance sheet.
Overall interest rate risk Natixis’ overall interest-rate risk is essentially linear and mainly results from mismatching positions concerning transactions with contractual maturities. Concerning the parent company perimeter, this mismatching is centralised via the use of internal supporting contracts within the Treasury Department (head office, New York and Singapore branches), which is delegated responsibility for operational management by the ALM Committee. Other than the monitoring and the limits of the sensitivity of the economic value of portfolios by yield curve points and by currency, this management is bounded by 99% 1-day VaR limits validated by the ALM Committee and examined daily by the Risk Department. These limits are:
In € millions Short-term cash6 Long-term cash
Sum of 99% 1 day VaR limits%7 5.86 5.0
Because of the specificity of their activities, certain subsidiaries that are credit institutions have had the management of their interest-rate risk delegated to their own ALM Committee or Treasury Committee. The ALM Committee has validated sensitivity limits for the economic value of Natixis Lease and Natixis Factor’s balance sheets of €12.00 million and €4.00 million, respectively, based on a shock of 100 basis points. For the other subsidiaries, which have more modest mismatching positions, the ALM Committee has not yet formally approved the limits set by the subsidiaries.
6 Sum of limits excluding effects of diversification on Paris (including run off portfolios but excluding Singapore and Shanghai trading portfolios). A limit on New York is in the process of being set. 7 Sum of VaR sub-limits by section, excluding the effects of diversification.

Update of the 2007 shelf-registration document 45
Liquidity risk The overall refinancing requirements of Natixis, of its subsidiaries and of the Banques Populaires in the short, medium and long-term over a large number of currencies, are managed operationally by the Treasury department, which is organized around the head office and the New York and Singapore branches. This centralisation continuously optimises the cost of liquidity to the benefit of the entire Group. It also facilitates an issuance policy based on the continuous search for maximum diversification in the placement of Natixis’s debt, both in terms of instruments and geographical area. As a corporate and investment bank, Natixis’s liquidity risk mainly results from mismatching positions concerning transactions with contractual maturities. These involve both the banking portfolio and the trading portfolio where some transactions cannot be quickly unwound. Within the parent company perimeter, this mismatching of the banking portfolio is centralised by the Treasury function via the use of internal supporting contracts managed by the Treasury function. Because of their specific activity, certain subsidiaries are allowed to manage their own mismatching on a delegated basis via their own ALM Committee. The liquidity risk monitoring system is based on determining static liquidity gaps8 and mismatching ratios9 within the Treasury perimeter, which concentrates the main share of Natixis’ risk, and within the consolidated perimeter. These indicators are produced periodically by the Financial department and examined during ALM Committee meetings. In addition, a static interlude of 60 calendar days in daily steps is prepared daily for all portfolios; it allows the forecast of short term refinancing requirements to be monitored. The Treasury function’s management of liquidity mismatching risk for its own banking portfolio is bounded by minimum mismatching ratios10 validated by the ALM Committee. These minimum ratios, which were renewed in 2008, are:
Class of maturity 10 days 1 month 2 months 3 months 4 months 5 months
Minimum ratios 85% 80% 75% 70% 65% 60%
Class of maturity 6 months 7 months 8 months 9 months 10 months 11 months
Minimum ratios 55% 55% 55% 55% 55% 55%
Class of maturity 12 months 2 years 3 years 4 years 5 years 6 years
Minimum ratios 55% 45% 35% 30% 25% 25%
Class of maturity 7 yearrs 8 years 9 years 10 years
Minimum ratios 20% 15% 10% 5%
The ALM Committee has not formally approved limits on subsidiaries that have managerial autonomy for their liquidity mismatching. However, these subsidiaries must comply with their regulatory liquidity coefficients. This system has been supplemented by liquidity stress tests carried out to test Natixis’ ability to cope with a crisis situation. The general principle involves simulating a shock on the daily liquidity gap on a given time-horizon that depends on the type of stress (shock on assets, shock on liabilities related to a specific or systemic crisis). The next step is to identify the additional resources that can be used to obtain liquidity from the ECB (commercial paper or receivables not accepted for repurchasing agreements by the ECB after applying a haircut, etc.) and which thereby enable the Bank to cope with the shock in question before considering either suspending trading activities that consume short-term liquidity or, more generally, divesting assets.
8 It is defined for each class of maturity as the difference between the amouunts remaining due and the uses remaining due. It is calculated excluding assumptions on new production on the basis of notional amounts at the end of the period. 9 The mismatching ratios are defined for each class of maturity as the relationship of residual sources to residual uses. 10 According to these limits, 25% of the uses of the banking portfolio with residual maturity greater than or equal to five years
must be refinanced by resources with more than five years remaining before maturity.

Update of the 2007 shelf-registration document 46
Four stress tests are thus produced:
a. a stress test of strong liquidity demand in a context of normally functioning markets and the absence of a specific crisis affecting Natixis’ reputation
b. a systematic stress test in the absence of a specific crisis affecting Natixis’ reputation
c. a specific stress test regarding Natixis’ reputation in the context of normally functioning markets
d. a stress test combined with a specific stress test on Natixis’ reputation. These stress tests are also aggregated with those carried out by the central institutions for consolidation purposes at their level. A study is in progress concerning the definition of possible limits. An emergency plan has been formulated and approved on a generalised basis by the ALM Committee. It will be coordinated with the tripartite plan in collaboration with the central institutions as part of the liquidity guarantee that they have granted to Natixis.
Structural exchange risk This risk is essentially concentrated on the US dollar and includes:
• exchange-rate risks related to net investments abroad in currencies other than the euro;
• risks related to income and expenditure in currencies other than the euro.
Regarding the first category of risks, the ALM Committee has approved continued use of the practice of refinancing long-term assets via the purchase of foreign currency. The aim is to immunise the Bank’s solvency ratio, bearing in mind that certain risk-weighted exposures are denominated in currencies other than the euro. This policy would be modified in the event that the sensitivity of the tier one ratio to variations in the euro/dollar exchange rate widened, in particular if an overly large portion of the Group’s equity capital was denominated in dollars. Concerning the second category of risks, the ALM Committee has formally instructed that a portion of budgeted gross operating income due to be earned in dollars is hedged by advance sales of the dollar against the euro, with the corresponding repurchases to be made as and when earnings are effectively formed in dollars. This hedging is geared to neutralizing an adverse variation in the average EUR/dollar rate over the year in relation to the average budgeted rate. 5.6. Operational risk General description Operational risk is defined as the risk of loss resulting from shortcomings or defaults attributable to internal procedures, persons and systems or to external events (fires, 100-year floods, fraud, etc.). It includes legal risk, but excludes strategic risk and reputation risk. Shared by all of Natixis’ business lines, the structure for measuring, controlling and managing operational risk is based on consistent regulations, standards and methods defined in the Group’s charter and validated by the Natixis Group’s Risk Committee as well as the central institutions. It is also based on efficient internal reporting and the existence of plans for assistance and continuing business operations. Approach chosen by the Natixis Group Before Natixis was created in November 2006, much work had already been done in the various constituent entities to implement a system for measuring, controlling and managing operational risk.

Update of the 2007 shelf-registration document 47
After Natixis was created, these various systems were harmonised and a mechanism complying with the standard method was put in place. The next step is to create a system to measure, control and mange operational risk that is an effective management tool whose completion will allow Natixis to be eligible for the advanced method (Advanced Measure Approach or AMA). Managing operational risk Natixis’ operational risk management procedure comprises three main types of task:
• recording incidents: OSIRISK is Natixis’ target tool for measuring, controlling and managing operational risks. Incidents are recorded as they occur, from the first euro. Certain incidents that are considered serious, give rise to more exhaustive investigations;
• preparing operational risk maps;
• producing reports:
o at each business line level, ad hoc reports are provided to the operational risk committees so they can take the necessary actions within the business lines;
o consolidated reports at the Group level facilitate the management of the bank’s transversal risks.
Measuring operational risks Natixis currently calculates its regulatory capital requirements using the standard method. 5.7. Insurable risks The insurance delegation, attached to the Corporate Secretary’s office, is charged with analyzing insurable operational risks and implementing the adequate insurance coverage (self insurance/transfer insurance). The main risks analyzed concern internal and external fraud, reduction in the value of property, liability risk (the company’s civil operating liability and professional liability, and also the civil liability of directors and corporate officers), damage to operational assets (buildings and contents, hardware and computerised data) as well as the loss of banking business following such damage. All of the former CNCE companies were integrated into Natixis’ Overall Banking, Operational and Professional, and Managers’ Civil Liability program on 1 July 2007. Since that date therefore, all of the Group’s companies have enjoyed guarantees:
• from a “combined” Overall Banking (Securities & Fraud), operational & professional civil liability insurance program providing coverage of up to €125 million per claim and/or year of insurance;
• from a directors/corporate officers civil liability insurance program providing coverage of up to €100 million per claim and/or year of insurance.
The geographic scope of coverage is worldwide, except for professional civil liability, where the guarantee does not cover permanent establishments in the USA (this coverage is purchased locally by subsidiaries or branches). The effort to combine coverage continued in 2008 in the area of damage insurance: coverage for most of the Group’s office buildings located in France and their contents, IT risks, and interruptions to continuing banking activities are now centralised (primary coverage purchased for reconstruction and/or replacement value with a ceiling of €200 million per claim.) All the policies mentioned above are purchased from insurers recognised by the market as solvent.
Update of the 2007 shelf-registration document 48
All the guarantees mentioned above are purchased with claims excesses (level of withholding accepted) appropriate to Natixis’ capacities. Premiums just for the coverage grouped together on July 1, 2007, and January 1, 2008, were €6.3 million for the full year. 5.8. Legal risks Situation of dependency Natixis has no dependency with regard to any patent or licence, or to any industrial, commercial or financial supply contract. Legal and arbitration proceedings
� Jerry Jones et al. vs. Harris Associates L.P. In August 2004, three shareholders acting in the name of and on behalf of three investment funds (Oakmark Fund, Oakmark Equity and Income Fund and Oakmark Global Fund) filed a complaint against Harris Associates L.P., a 100% subsidiary of Natixis Global Asset Management, before the United States District Court for the Northern District of Illinois. The plaintiffs alleged that Harris Associates L.P. billed services to these three funds in an excessively high amount in light of applicable regulations. These proceedings are among numerous legal claims initiated in recent years against investment advisors. Harris Associates and the plaintiffs have filed a motion for summary judgment. On 27 February 2007, the judge accepted all aspects of the request of Harris Associates, L.P. and rejected that of the plaintiffs. On 20 March 2007, the latter appealed this decision. Both parties filed conclusions and appeared before the Court of Appeal on 10 September 2007. On 19 May 2008, the judgment of the Court of Appeals for the Seventh Circuit confirmed the decision of the District Court in favour of Harris Associates L.P. On 2 June 2008, the plaintiffs requested a new examination of their appeal by the judges of the entire Court of Appeals. On 8 August 2008, the court of appeals rejected the plaintiffs’ request for a new consideration of their appeal.
� Class actions in the United States concerning Municipal Guaranteed Investment Contracts transactions
Since 13 March 2008, Natixis and Natixis Funding were cited among the defendants in connection with multiple class actions, brought by and in the name of a number of American states, counties and municipalities that issued bonds, before the courts of New York, Washington, D.C. and California. The actions pertained to alleged collusion between the suppliers and brokers of derivative municipal products (municipal derivatives) in fixing prices, producing offers and allocation to clients between 1992 and 2006. The various plaintiffs also named over 30 banks and American and European brokers as defendants. The plaintiffs sought the finding that a group that included all governmental entities at the local municipal level and the states, independent government agencies and the private entities that purchased securities from the defendants or brokers from 1992 until the current date should recover damages and interest due to allegedly anticompetitive practices. These class actions were filed under federal antitrust laws that allow judgments imposing the payment of triple damages and interest, as well as reimbursement of attorneys’ fees, in certain cases. All of these claims were combined before the United States District Court for the Southern District of New York under the name In re Municipal Derivatives Antitrust Litigation. Two other claims have also been filed in the California state court, one by the City of Los Angeles and the other by the City of Stockton. These claims are essentially the same as those filed with the federal court, but are based on California’s antitrust laws. These claims have been filed with the state court and pertain only to state law claims; they are apparently grouped with others and will be subject to independent proceedings. The various requests for damages and interest result from investigations that are currently being carried out in the United States by the U.S. Internal Revenue Service (“IRS”), the antitrust division of the Department Of Justice (“DOJ”) and the American financial markets authority (the Securities and Exchange Commission, “SEC”). Although the IRS investigation has not concluded that there was any culpable conduct by Natixis
Update of the 2007 shelf-registration document 49
Funding or Natixis, the DOJ investigations cover a significant proportion of the “Muni GIC” transactions carried out by Natixis Funding since 1998. In addition, the SEC is trying to determine whether there was any failure to provide required information in this regard. Several other banks and financial syndicates that are defendants have received notices from the DOJ that they are targets of a current investigation. These notices do not constitute formal accusations, but do notify the recipient that the DOJ deems it to be particularly and directly concerned by the investigations. Although an employee of Natixis Funding has received such a letter, neither Natixis nor Natixis Funding has received one. A consortium of state attorneys general, led by the Attorney General of the State of New York and the Attorney General of the State of Connecticut (“CTAG”), has undertaken an investigation of the activities of the defendants related to the sale of municipal derivatives) On 26 June 2008, Natixis Funding Corporation received from the CTAG a notice demanding that it produce documents pertaining to sales contracts for guaranteed investment contracts (“GIC”) and other municipal derivatives. The other defendants named in private actions have also received such notices. Natixis Funding submitted to the CTAG a list of GIC transactions and a list of swaps in effect on 24 July 2008. As of the date hereof, the CTAG has taken no further measures.
� Litigation concerning derivatives transactions In a decision dated 27 March 2008, the Commercial Court of Toulouse decided to cancel two swap transactions with notional amounts of €7.5 million and €12.5 million entered into with the Société Patrimoine Languedocienne, an HLM SA, and asserted the joint responsibility of the Caisse d’épargne Midi Pyrénées and Natixis in the establishment of these swaps. The court named an expert to assess the harm, which has already been the subject of a provisional payment. Natixis has appealed this judgment. Based on the considerations underlying this initial judgment, the Société d’Economie Mixte de Construction de la ville de Tarbes (SEMI Tarbes) brought an action against the Caisse d’épargne Midi Pyrénées and Natixis in June 2008 with the aim of cancelling a swap with a notional amount of €20 million and receiving an indemnity for the harm allegedly incurred due to this swap agreement. The swap contracts in question were established to cover the exposure of SPL and SEMI Tarbes to fluctuations in Livret A rates, to which the borrowings of these two companies are indexed, on the understanding that the variability of this rate has been in effect since 2004. Based, in particular, on a notice from Compagnie Nationale des Commissaires aux Comptes respecting the accounting treatement of this type of contract, Tribunal de Commerce de Toulouse decided that the swaps were speculative in nature. The judges ordered a cancellation of the swap contracts challenged legally due to the fact that the CEMP and Natixis neglected their consulting obligations with respect to speculative instruments. There is no other current governmental, legal or arbitrational procedure liable to have a significant impact on Natixis’ financial statements.

Update of the 2007 shelf-registration document 50
5.9. Insurance risks Natixis Assurances As Natixis Assurances essentially markets savings products, the main risks resulting from insurance policies are of financial nature:
� The risk of no longer being able to meet the minimum contractual rate of return in the event of decline in interest rates To deal with this risk, life insurance unit, ABP Vie, has only marketed policies without guaranteed minimum rates of return for the last few years. More than 90% of policies have no guaranteed minimum rate and of those that have, the average guaranteed minimum rate is 0.29%.
� Risk of policy surrenders in the event of an increase in interest rates Natixis Assurances identified the segment of the insured population that presents a high risk of policy surrender, based on the key criteria of age, fiscal seniority and the amount of capital. As a result of this initiative, Natixis Assurances limited the perimeter covered by its Cap policies to about a quarter of its fixed-income assets. It also subscribed to variable-rate bonds with a minimum rate. The liability adequacy test carried out for the financial statements for the half-year ended June 30, 2008, in accordance with IFRS 4 showed that insurance liabilities evaluated under local standards were greater than the fair value of these liabilities after taking into account the surrender option incorporated into policies.
� Financial risk in the event of an increase in interest rates The sensitivity of net equity to variations in interest rates is lessened by the classification of about €6.7 billion of fixed-income securities in the held-to-maturity category. Concerning securities in other categories, the sensitivity analysis carried out at the end of June 2008 showed that a 1-point increase in bond rates has a -€33 million impact on net equity (after taking into account the variation attributable to policyholders and taxation). This corresponds to 3.9% of the equity capital.
� Market risks Natixis Assurances has to deal with variations in the value of its financial assets. The management of financial risks involves defining a strategic asset allocation that takes into account liability commitments, regulatory constraints (particularly in terms of non-concentration) and commercial requirements. This process entails setting allocation ranges for each type of asset. The sensitivity analysis carried out on June 30, 2008, shows that: � a 10% decline in the stock market has a -€11 million impact on net equity (after taking into account the variation attributable to policyholders and taxation), that is 1.4% of the equity capital; � a 10% decline in the real estate market has a -€4.0 million impact on net equity (after taking into account the variation attributable to policyholders and taxation). That is 0.5% of the equity capital.
Natixis Assurances also reinsures 100% of the guaranteed minimum return on unit-linked policies.
� Credit risk Counterparty risk is monitored and managed in compliance with standards and Natixis’ internal limits, as determined by the Credit Risk Committee, as well as with the regulatory constraints imposed on insurance companies. As a result, 94% of the fixed-income portfolio is invested in securities with ratings exceeding A-.
� Provident insurance business Mortality and morbidity risks are limited by the use of a pricing structure tailored to the population insured and the coverage provided, the use of experience tables and by the upstream practice of medical selection of new policyholders. Natixis Assurances employs reinsurance to limit its exposure to capital dispersion risks related to payouts on death benefit policies, policies covering accidents of life and loss of autonomy, and to the frequency of claims for temporary cessation of work, invalidity and loss of autonomy. An epidemic/pandemic reinsurance treaty has been also set up in order to limit exposure to the increase in deaths that might result from such an event. The annual reinsurance plan seeks to diversify reinsurers and to ensure Natixis only deals with parties having a high-quality rating. No reinsurance policy has been signed or renewed with non-investment grade parties. In
Update of the 2007 shelf-registration document 51
practice, the ratings of reinsurers with which Natixis Assurances does business range between A- and AA+ (some reinsurers at a marginal level may not be rated but their shareholders are deemed of high quality.
� Concentration of risks The nature of insured risks combined with reinsurance coverage does not induce any particular exposure to concentration of insurance risks. Coface By virtue of its activities, Coface is exposed to two main types of risk. The first is the technical risk constituted by the risk of losses on Coface’s portfolio of insurance policies. The second is the financial risk related to the risk of loss arising from adverse movements in interest rates, exchange rates or the market value of securities or real-estate investments. Coface has implemented sophisticated tools designed to control these risks rigorously and to ensure they remain within prudent limits. � Technical risk The risk in this area concerns the risk of loss generated by the portfolio of insurance policies. A distinction is traditionally made between frequency risk and peak risk: � Frequency risk represents the risk of a sudden and significant increase in missed payments from a multitude of debtors. This risk is measured for each entity by monitoring the loss ratio (ratio between claims and premiums) by business sector (domestic credit), by country (export credit), and by product line (sureties, single risks). The loss ratios for the various underwriting centres are also monitored at the Group level, as are the amounts and monthly numbers concerning missed payments; � Peak risk represents the risk of abnormally-high losses recorded for the same debtor or group of debtors, or of an accumulation of losses for the same country. As well as monthly monitoring at individual underwriting-centre level, a system exists at the Group level, based on the following components: - centralised declarations of threatened losses liable to exceed a certain amount (currently €1 million for the two main underwriting centres - Coface SA and Coface Kredit – and €0.5 million for all the others). This involves the intervention of a specialist recovery subsidiary (RBI); - the Large Risks Committee, which sets the maximum outstanding risk accepted by Coface on the Group’s 400 largest risks (representing a severity greater than €30 million) or a maximum loss in a stress scenario of €15 million, and which allocates ceilings by emerging country; - a corporate and country risk rating system; - a statistical mechanism for evaluating “severities” (maximum losses that may be recorded in case of loss) by debtor, group of debtors or emerging country. In the context of the financial crisis, vulnerable risks were listed on the basis of Coface ratings and proposals from underwriting centres for specific risks such as highly-leveraged buyouts. All significant risks rated 3, 2 and less (equivalent to BB- in Standard & Poors rating system) are subject to centralised monitoring both by inventory and monthly flows. For frequency risks, populations at risk will be identified via a scoring procedure while more restrictive quotation matrices were implemented in the first half of 2008.
� Diversification of the credit risk portfolio Coface maintains a diversified credit risk portfolio, in order to minimise the risk that a default by a debtor, a slowdown in a particular sector of activity or an adverse event in a given country might exert a disproportionate impact on its overall claims expense. Furthermore, the fact that the great majority of Coface’s risks are short-term allows it to reduce the risk covered for a debtor or a group of debtors relatively quickly after noting a decrease in their solvency.
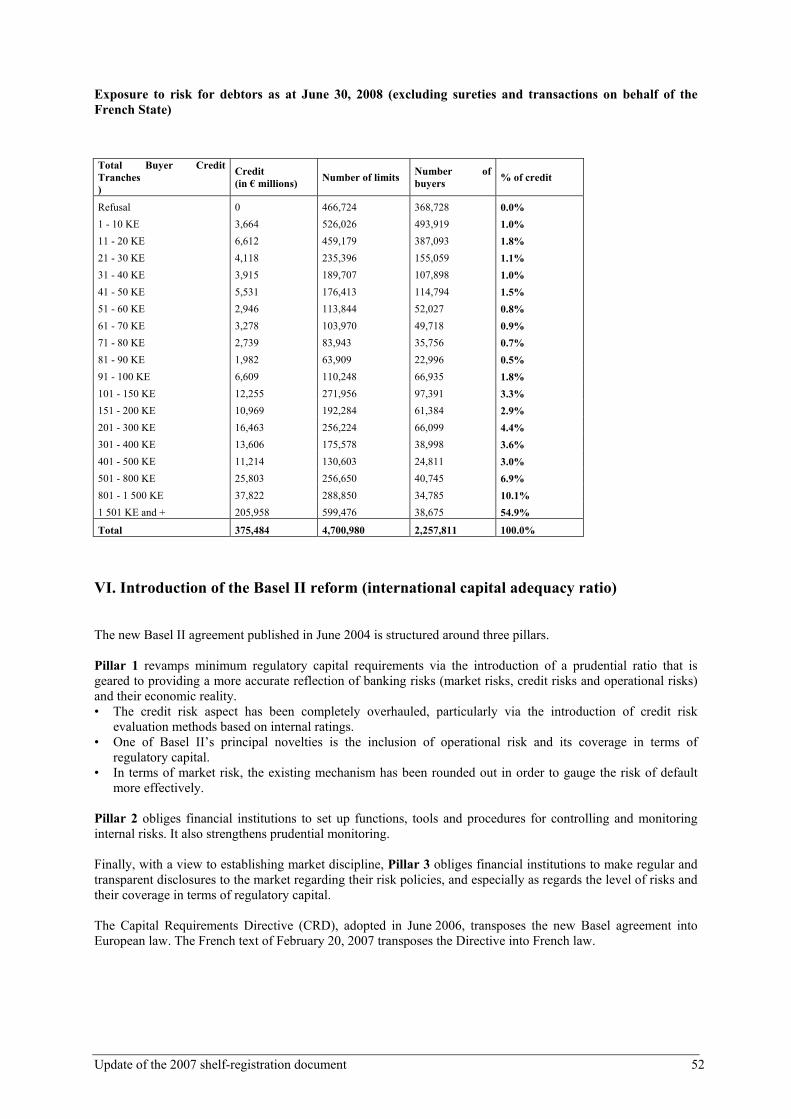
Update of the 2007 shelf-registration document 52
Exposure to risk for debtors as at June 30, 2008 (excluding sureties and transactions on behalf of the French State)
Total Buyer Credit Tranches )
Credit (in € millions)
Number of limits Number of buyers
% of credit
Refusal 0 466,724 368,728 0.0%
1 - 10 KE 3,664 526,026 493,919 1.0%
11 - 20 KE 6,612 459,179 387,093 1.8%
21 - 30 KE 4,118 235,396 155,059 1.1%
31 - 40 KE 3,915 189,707 107,898 1.0%
41 - 50 KE 5,531 176,413 114,794 1.5%
51 - 60 KE 2,946 113,844 52,027 0.8%
61 - 70 KE 3,278 103,970 49,718 0.9%
71 - 80 KE 2,739 83,943 35,756 0.7%
81 - 90 KE 1,982 63,909 22,996 0.5%
91 - 100 KE 6,609 110,248 66,935 1.8%
101 - 150 KE 12,255 271,956 97,391 3.3%
151 - 200 KE 10,969 192,284 61,384 2.9%
201 - 300 KE 16,463 256,224 66,099 4.4%
301 - 400 KE 13,606 175,578 38,998 3.6%
401 - 500 KE 11,214 130,603 24,811 3.0%
501 - 800 KE 25,803 256,650 40,745 6.9%
801 - 1 500 KE 37,822 288,850 34,785 10.1%
1 501 KE and + 205,958 599,476 38,675 54.9%
Total 375,484 4,700,980 2,257,811 100.0%
VI. Introduction of the Basel II reform (international capital adequacy ratio)
The new Basel II agreement published in June 2004 is structured around three pillars. Pillar 1 revamps minimum regulatory capital requirements via the introduction of a prudential ratio that is geared to providing a more accurate reflection of banking risks (market risks, credit risks and operational risks) and their economic reality. • The credit risk aspect has been completely overhauled, particularly via the introduction of credit risk
evaluation methods based on internal ratings. • One of Basel II’s principal novelties is the inclusion of operational risk and its coverage in terms of
regulatory capital. • In terms of market risk, the existing mechanism has been rounded out in order to gauge the risk of default
more effectively. Pillar 2 obliges financial institutions to set up functions, tools and procedures for controlling and monitoring internal risks. It also strengthens prudential monitoring. Finally, with a view to establishing market discipline, Pillar 3 obliges financial institutions to make regular and transparent disclosures to the market regarding their risk policies, and especially as regards the level of risks and their coverage in terms of regulatory capital. The Capital Requirements Directive (CRD), adopted in June 2006, transposes the new Basel agreement into European law. The French text of February 20, 2007 transposes the Directive into French law.

Update of the 2007 shelf-registration document 53
Implementation within Natixis Management of the Basel II project is handled jointly by the Risk and Finance departments and the project’s progress is reviewed by executive management on a quarterly basis. Work began in several areas in order to adapt Natixis’ organisational structure and information system to the new prudential rules and to establish a long-term mechanism for implementing the new Basel rules operationally. Efforts were made to raise the awareness of Natixis staff involved in the initiative, via various training and communication initiatives. Annual reviews are also undertaken by Internal Audit and Compliance in order to ensure continued compliance with minimum operational requirements.
• Concerning operational risk, Natixis applies the standard methodology for operating risks. The next step is to develop a system for measuring, controlling and managing operating risk that is an effective management tool that will allow Natixis to be eligible for the advanced method (known as the Advanced Measurement Approach or AMA),
• Concerning credit risk, at the end of January 2008, Natixis obtained authorisation from the Banking Commission to use the internal ratings method as a basis for calculating regulatory required capital levels.
• For market risk, Natixis uses its VaR internal model to calculate regulatory capital requirements.
As for internal capital, economic capital requirements were calculated throughout the Natixis Group. Efforts are under way to refine the current system.
The calculation process is managed by the Finance department and relies in particular on the Group’s existing risk measurement tools.
Economic capital requirements may be compared not only to regulatory capital requirements, but also to the equity capital that would be available to the Group to cover its funding needs in the event of a crisis (measured from an economic perspective, by analogy with the economic measurement of risks).

Update of the 2007 shelf-registration document 54
VII. Financial structure and regulatory ratios Analysis of the consolidated balance sheet
Assets In € billions 06/30/2008 12/31/2007 Financial assets at fair value through income and hedging derivatives
215.6 198.1
Available for sale financial assets 35.2 34.8 Loans and receivables with financial institutions 46.2 45.4 Loans and receivables with customers 91.0 85.4 Securities held under re-sale agreements 85.0 100,5 Held to maturity financial assets 7.0 6.5 Accruals and other assets 48.0 49.3
TOTAL ASSETS 528.0 520.0
Liabilities
In € billions 06/30/2008 12/31/2007
Financial liabilities at fair value through profit or loss and hedging instruments
209.6 163.3
Debts and payables with financial institutions 74.6 77.7 Debts and payables with customers 26.7 32.0 Securities delivered under repurchase agreements 80.1 95.1 Debt securities 43.8 65.5 Other liabilities and provisions 29.9 24.2 Insurance companies technical reserves 33.8 33.9 Subordinated debt 13.7 10.7 Shareholders’ equity 15.8 17.6
TOTAL LIABILITIES 528.0 520.0
Update of the 2007 shelf-registration document 55
The consolidated balance sheet totalled €528.0 billion as at June 30, 2008, compared to €520.0 billion as at December 31, 2007, an €8 billion or 1.5% increase. This growth is primarily attributable to growth in transactions valued at fair value on the balance sheet, offset largely by a drop in securities resale and repurchase activities. Assets
Assets at fair value through profit or loss and derivative hedging instruments were €215.6 billion, compared to €198.2 billion as at December 31, 2007, an increase of €17.4 billion largely attributable to the increase in the valuation of credit derivatives and rate swaps. These assets at fair value consist in trading instruments for €187.9 billion, instruments recognised at the fair value option for €26.9 billion, and derivative hedging instruments for €0.8 billion.
Available for sale financial assets of €35.2 billion are approximately evenly divided between life insurance investment portfolios, primarily in bonds, and the portfolio of bank placements. The customer loan portfolio – including lease transactions and factoring – was €91.0 billion, up €5.6 billion compared to December 31, 2007, reflecting the growth in financing activities during the first half of 2008 within and outside France
Securities held under resale agreements were €85.0 billion as at June 30, 2008, compared to €100.5 billion as at December 31, 2007; the €15.5 billion drop is primarily due to transactions with financial institutions. These assets are financed on the liability side primarily by securities delivered under repurchase agreements. Liabilities
Activities excluding securities delivered under repurchase agreements were mainly refinanced via an increase in liabilities at fair value through profit or loss (€46.3 billion) together with a decline of €21.7 billion in debt securities.
Shareholders’ equity and regulatory ratios
Registered share capital
Registered share capital increased during the first half of 2008 by 42,342,502 shares through the payment of a share dividend and by 22,500 shares through the exercise of stock options. These transactions increased registered share capital to €2,023,052,314 as at June 30, 2008 composed of 1,264,407,696 shares each with a par value of €1.6. Regulatory capital and capital adequacy ratio
As at June 30, 2008, Natixis’ consolidated regulatory capital (Basel II) was €16.7 billion, compared to €15.2 billion as at December 31, 2007, an increase of €1.5 billion. Tier 1 capital was €12.9 billion as at June 30, 2008, compared to €11.5 billion as at December 31, 2007, a €1.4 billion increase. Notable contributors to this increase was a €2.5 billion advance from shareholders and the issue in March and April 2008 of super-subordinated notes by Natixis for US$1.050 billion and €0.15 billion, partially offset by a decline in shareholders’ equity. Tier 2 capital was stable during the first half of 2008. Basel II risk weighted assets were €150.8 billion as at June 30, 2008, compared to €153.7 billion as at December 31,, 2007, a €2.9 billion decline, primarily due to transactions guaranteeing credit risks, which were offset by a €1.1 billion increase in market risk. This amount of shareholders’ equity and weighted risk resulted in a total solvency ration of 11% and a Tier I Ratio of 8.5%, increased from December 31, 2007 by 120 and 110 points, respectively, under Basel II rules, translating into a stronger financial structure for Natixis. Other regulatory ratios
The liquidity ratio is designed to ensure that liquid assets with a maturity of less than one month are equal to or exceed liabilities due within the same period.

Update of the 2007 shelf-registration document 56
The ratio of liquid assets to liabilities due within one month must therefore be higher than 100%. It stood at 162% as at June 30, 2008. Natixis complies with the prudential rules governing large exposures. In line with banking regulations, no single exposure may exceed 25% of regulatory capital and the cumulative total of individual exposures in excess of 10% of regulatory capital may not exceed eight times regulatory capital.

Update of the 2007 shelf-registration document 57
6.2 CONSOLIDATED FINANCIAL STATEMENTS AND NOTES FOR THE HALF-YEAR
ENDED 30 JUNE 2008
FINANCIAL STATEMENTS ................................................................................................. 58 CONSOLIDATED BALANCE SHEET - ASSETS ............................................................................. 58 CONSOLIDATED BALANCE SHEET – LIABILITIES AND EQUITY ............................................... 59 CONSOLIDATED INCOME STATEMENT ........................................................................................ 60 NET CASH FLOW STATEMENT..................................................................................................... 63 NOTES TO THE FINANCIAL STATEMENTS .................................................................... 64 Note 1. Significant events during the half........................................................................... 64 Note 2. Basis of presentation .............................................................................................. 65 Note 3. Use of estimates ..................................................................................................... 66 Note 4. Scope of consolidation ........................................................................................... 67 Note 5. Impact of the financial crisis on the financial statements .................................... 105 Note 6. Subsequent events after the half-year closing ...................................................... 108 Note 7. Balance Sheet Notes............................................................................................. 108
7.1 Financial assets and liabilities at fair value through profit or loss ................. 108 7.1.1 Financial Assets at Fair Value through profit or loss..................................... 108 7.1.1.1 Conditions for classifying financial assets stated at fair value (fair value option).... 109 7.1.2 Financial liabilities at fair value through profit and loss (fair value option).. 110 7.1.2.1 Conditions for classifying financial liabilities stated at fair value............................... 110
7.2 Financial assets available for sale .................................................................. 111 7.3 Instruments stated on the balance sheets at fair value by source or method of
valuation ......................................................................................................... 111 7.4 Loans and advances........................................................................................ 112
7.4.1 Loans and advances to banks ......................................................................... 112 7.4.2 Loans and advances to clients ........................................................................ 113
7.5 Goodwill......................................................................................................... 113 7.6 Debt securities in issue................................................................................... 114 7.7 Adjustment accounts and other liabilities ...................................................... 115
7.7.1 Restatement of day one P&L ......................................................................... 115 7.8 Provisions and amortisation ........................................................................... 115
7.8.1 Summary of provisions .................................................................................. 115 7.8.2 Provisions for risks and expenses................................................................... 116
7.9 Subordinated debt........................................................................................... 117 Note 8. Notes to the Income Statement............................................................................. 118
8.1 Interest Margin ............................................................................................... 118 8.2 Net Commissions ........................................................................................... 119 8.3 Gains or losses on assets and liabilities at fair value through profit and loss 120 8.4 Gains or losses on financial assets available for sale ..................................... 120 8.5 Other income and expenses............................................................................ 121 8.6 Operating Expenses........................................................................................ 121 8.7 Cost of Risk.................................................................................................... 122 8.8 Share of income from associates (equity method) ......................................... 123 8.9 Reconciliation of the total and theoretical tax expense.................................. 124
Note 9. Segment analysis of results .................................................................................. 125 Note 10. Other information................................................................................................. 127
10.1 Related parties ................................................................................................ 127 10.2 Results of insurance companies ..................................................................... 131 10.3 Share-based payment...................................................................................... 132 10.4 Financing commitments ................................................................................. 135

Update of the 2007 shelf-registration document 58
FINANCIAL STATEMENTS
CONSOLIDATED BALANCE SHEET - ASSETS
In € millions Notes 30 June 2008 31 Dec. 2007 30 June 2007
Cash and balances with central banks and post offices 1,559 961 1,230
Financial assets at fair value through profit or loss 7.1 and 7.3 224,507 202,928 207,864
Derivative hedging instruments 761 670 710
Financial assets available for sale 7.2 and 7.3 35,253 34,761 34,638
Loans and advances to banks 7.4 97,164 112,394 129,947
incl. institutional activities 41 83 125
Customer loans 7.4 113,793 112,505 113,749
incl. institutional activities 399 354 383
Revaluation differences on portfolios hedged against interest rate risk 0 0 35
Financial assets held to maturity 7,004 6,501 7,015
Current tax assets 217 538 258
Deferred tax assets 1,530 939 351
Accrued income, prepaid expenses and other assets 31,883 33,524 28,936
Non-current assets held for sale 0 0 12
Investments in equity-accounted associates 9,323 9,307 9,087
Investment properties 920 992 1,059
Property, plant & equipment 734 697 637
Intangible assets 587 446 408
Goodwill 7.5 2,787 2,844 2,581
TOTAL ASSETS 528,021 520,005 538,516

Update of the 2007 shelf-registration document 59
CONSOLIDATED BALANCE SHEET – LIABILITIES AND EQUITY
In € millions Notes 30 June 2008 31 Dec. 2007 30 June 2007
Due to central banks and post offices 987 1,406 725
Financial liabilities at fair value through profit or loss 7.1 and 7.3 215,141 165,030 153,118
Derivative hedging instruments 250 1,672 463
Deposits from banks 117,785 138,234 161,062
incl. institutional activities 114 155 197
Customer deposits 56,950 61,701 70,479
incl. institutional activities 473 605 455
Debt securities in issue 7.6 43,785 65,530 61,699
Revaluation differences on portfolios hedged against interest rate risk 113 125 0
Current tax liabilities 422 630 448
Deferred tax liabilities 414 325 493
Deferred income and accrued expenses and other liabilities 7.7 28,300 22,618 27,943
incl. institutional activities 47 26 87
Liabilities associated with non-current assets held for sale 0 0 0
Insurance companies’ technical reserves 33,770 33,908 33,033
Provisions 7.8 620 520 495
Subordinated debt 7.9 13,685 10,678 9,873
Equity attributable to equity holders of the parent 15,116 16,885 17,996
- Share capital and reserves 13,499 14,118 14,117
- Retained earnings 3,176 1,611 1,704
- Unrealised or deferred gains or losses (610) 55 610
- Net income (948) 1,101 1,565
Minority interests 683 744 689
TOTAL LIABILITIES AND EQUITY 528,021 520,005 538,516

Update of the 2007 shelf-registration document 60
CONSOLIDATED INCOME STATEMENT
In € millions Notes 30 June 2008 30 June 2007 31 Dec 2007
Interest and similar income 8.1 8,451 8,651 18,460
Interest and similar expenses 8.1 (7,254) (7,909) (17,291)
Fee and commission income 8.2 2,034 2,200 4,460
Fee and commission expense 8.2 (724) (786) (1,541)
Net gains or losses on financial instruments at fair value through profit or loss 8.3 (1,683) 1,480 1,148
Net gains or losses on financial assets available for sale 8.4 14 379 334
Income from other activities 8.5 3,030 3,414 6,620
Expenses from other activities 8.5 (2,315) (3,220) (6,148)
Net banking income 1,552 4,209 6,043
Operating expenses 8.6 (2,635) (2,664) (5,157)
Amortisation, depreciation and impairment of property, plant and equipment and intangible assets (93) (73) (164)
Gross operating income (1,176) 1,471 721
Cost of risk 8.7 (374) (11) (244)
Net operating income (1,550) 1,460 477
Share in income from equity-accounted associates 8.8 300 402 672
Gains or losses on other assets 115 187 538
Change in value of goodwill 1 0 (1)
Income before tax (1,134) 2,049 1,686
Income tax 8.9 242 (414) (97)
Income from discontinued operations (369)
Net income after tax from discontinued operations or those in the process of disposal
Net income for the period (892) 1,636 1,221
including:
- Attributable to equity holders of the parent (948) 1,565 1,101
- Attributable to minority interests 56 70 119
Earnings per share
Consolidated net income - attributable to equity holders of
the parent - per share, calculated on the basis of the
average number of shares over the period excluding
treasury shares (0.78) 1.28 0.90
Diluted earnings per share
Consolidated net income - attributable to equity holders of
the parent - per share, calculated on the basis of the
average number of shares over the period excluding
treasury shares and including potential shares arising from
the exercising of stock option (0.77) 1.28 0.90

Update of the 2007 shelf-registration document 61
CONSOLIDATED STATEMENT OF CHANGE IN SHAREHOLDERS’ EQUITY
Share capital and related reserves Consolidated
Reserves Unrealised or deferred gains
& losses (net of tax)
In € millions
Share capital
Reserves related to
share capital
Elimination of shares held in
treasury Consolidated
Reserves
Related to exchange
differences Changes in fair value of
financial instruments
Net income group share
Equity group share
Equity share of minority
interests Total consolidated
equity
Assets available for
sale
Derivative hedging
instruments
Equity at 1 January 2007 1,952 12,472 0 2,433 (28) 593 55 0 17,477 766 18,243
Capital increase 1 7 8 8
Elimination of treasury shares (14) (14) (14)
Equity component share-based payment plans 4 4 4
2006 dividend paid in 2007 (324) (725) (1,049) (96) (1,145)
Total movements related to relations with shareholders 1 (317) (14) (721) (1,051) (96) (1,147)
Change in fair value of financial instruments through equity (74) 131 58 58
First half 2007 net income 1,565 1,565 70 1,635
Impact of acquisitions and disposals 0 (46) (46)
Changes in exchange differences (67) (67) (5) (73)
Other 14 (5) 5 14 14
Equity at 30 June 2007 1,953 12,155 (14) 1,726 (100) 524 186 1,565 17,996 689 18,685
Capital increase 2 8 10 10
Elimination of treasury shares (96) (96) (96)
Equity component share-based payment plans 5 5 5
2006 dividend paid in 2007 0 14 14
Total movements related to relations with shareholders 2 8 (96) 5 (81) 14 (67)
Change in fair value of financial instruments through equity (290) (51) (341) 4 (337)
Second half 2007 net income (464) (464) 49 (415)
Impact of acquisitions and disposals 0 12 12
Changes in exchange differences (214) (214) (23) (237)
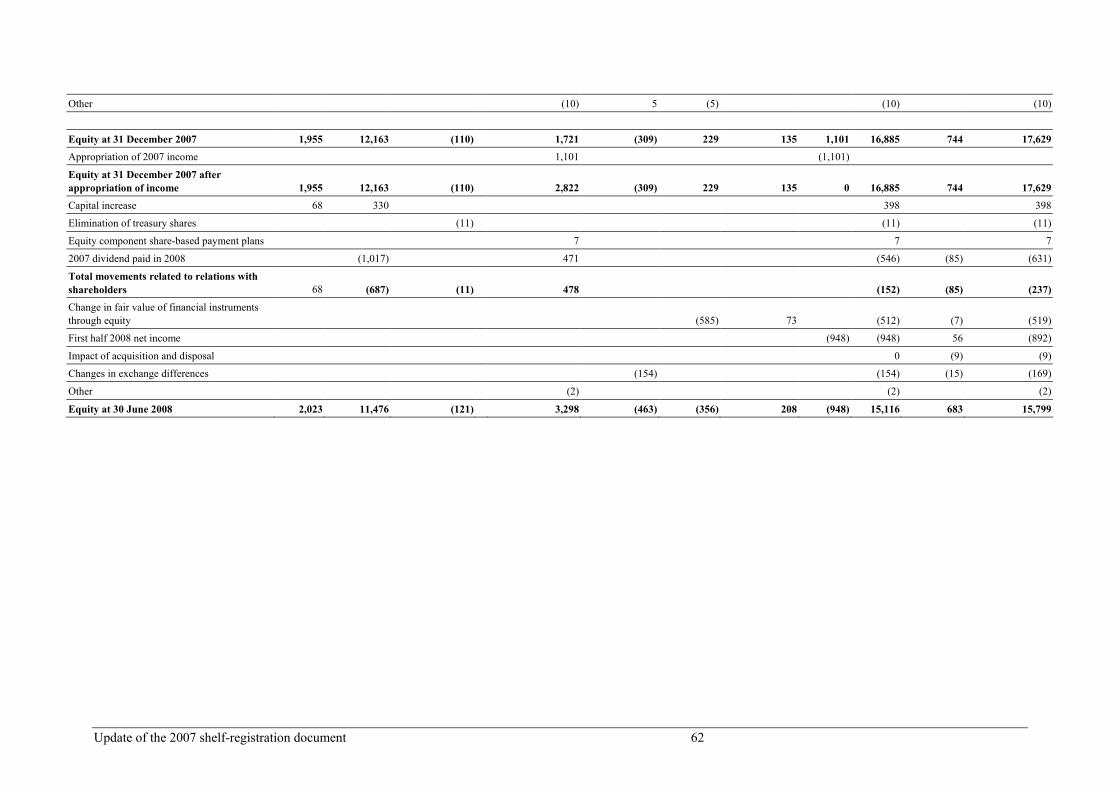
Update of the 2007 shelf-registration document 62
Other (10) 5 (5) (10) (10)
Equity at 31 December 2007 1,955 12,163 (110) 1,721 (309) 229 135 1,101 16,885 744 17,629
Appropriation of 2007 income 1,101 (1,101)
Equity at 31 December 2007 after appropriation of income 1,955 12,163 (110) 2,822 (309) 229 135 0 16,885 744 17,629
Capital increase 68 330 398 398
Elimination of treasury shares (11) (11) (11)
Equity component share-based payment plans 7 7 7
2007 dividend paid in 2008 (1,017) 471 (546) (85) (631)
Total movements related to relations with shareholders 68 (687) (11) 478 (152) (85) (237)
Change in fair value of financial instruments through equity (585) 73 (512) (7) (519)
First half 2008 net income (948) (948) 56 (892)
Impact of acquisition and disposal 0 (9) (9)
Changes in exchange differences (154) (154) (15) (169)
Other (2) (2) (2)
Equity at 30 June 2008 2,023 11,476 (121) 3,298 (463) (356) 208 (948) 15,116 683 15,799

Update of the 2007 shelf-registration document 63
NET CASH FLOW STATEMENT
In € millions 30 June 2008 31 Dec. 200730 June 2007
Income before tax (1,134) 1,686 2,049
+/- Net charge to depreciation and amortisation of property, plant & equipment and intangible assets 93 164 73
+/- Impairment of goodwill and other non-current assets 48 189 14
+/- Net charge to other provisions (including technical reserves) 921 3,500 2,114
+/- Share of income of equity-accounted associates (300) (672) (402)
+/- Net loss/(gain) from investing activities 114 (712) (292)
+/- Net loss/(gain) from financing activities 130 115 62
+/- Other movements (1,584) 5,279 1,929
= Total non-cash items included in income before tax and other adjustments (578) 7,863 3,498
+/- Decrease/(increase) in interbank and money market items 1,276 2,063 (8,737)
+/- Decrease/(increase) in customer items (6,421) (8,444) 187
+/- Decrease/(increase) in other financial assets or liabilities 12,576 9,349 (12,243)
+/- Decrease/(increase) in non-financial assets or liabilities 5,327 (6,053) (4,319)
- Income taxes paid (244) (621) (329)
= Net decrease/(increase) in operating assets and liabilities 12,514 (3,706) (25,442)
Total net cash provided/(used) by operating activities (A) 10,802 5,843 (19,895)
+/- Decrease/(increase) in financial assets and investments in associates (6,448) (6,471) (813)
+/- Decrease/(increase) in investment property 11 108 34
+/- Decrease/(increase) in property, plant & equipment and intangible assets (275) (305) (343)
Total net cash provided/(used) by investing activities (B) (6,712) (6,668) (1,121)
+/- Cash received from/(paid to) shareholders (233) (1,113) (1,137)
+/- Other cash provided/(used) by financing activities 2,914 10,960 12,086
Total net cash provided/(used) by financing activities (C) 2,681 9,847 10,949
Effect of exchange rate changes on cash and cash equivalents (D) (10) (84) (61)
Net increase/(decrease) in cash & cash equivalents (A + B+ C + D) 6,761 8,938 (10,127)
Net cash provided/(used) by operating activities (A) 10,802 5,843 (19,901)
Net cash provided/(used) by investing activities (B) (6,712) (6,668) (1,121)
Net cash provided/(used) by financing activities (C) 2,681 9,847 10,949
Effect of exchange rate changes on cash and cash equivalents (D) (10) (84) (61)
Opening cash and cash equivalents (12,188) (21,126) (21,126)
Cash, central banks, post offices (assets & liabilities) (445) (335) (335)
Interbank balances (11,743) (20,791) (20,791)
Closing cash and cash equivalents (5,427) (12,188) (31,253)
Cash, central banks, post offices (assets & liabilities) 572 (445) 504
Interbank balances (5,999) (11,743) (31,757)
Change in cash and cash equivalents 6,761 8,938 (10,127)

Update of the 2007 shelf-registration document 64
NOTES TO THE FINANCIAL STATEMENTS
Note 1. Significant events during the half year
1.1 Continued integration process for the various entities contributed on 17 November 2006. The continued legal restructuring and integration of businesses conducted in 2007 following the creation of Natixis on 17 November 2006, marked the first half of 2008 as follows:
o within CIB -- by a continued transfer of operations in the target systems; o in the service businesses -- by the reorganisation of:
- the securities businesses through the contribution to CACEIS of the institutional custody services, fund management, and issuer services operations which up to now has been carried out within Natixis and its subsidiary Natixis Investor Servicing. The reorganisation of the “retail” custody platforms with the legal merger of Gestitres and Natixis will take place at the beginning of the second half;
- the consumer credit business, which resulted in the combination of the businesses related to the development of IT credit management tools within Natixis Consumer IT (a wholly-owned subsidiary of Natixis Consumer Finance);
o by the launch of the “performance-based” approach intended to complete the operational integration of the support departments, while improving their operational performance. This approach was integrated in a set of projects started in the second quarter of 2008, and which will start to produce results at the beginning of the second half of the year. It is part of a 2008-2009 cost reduction plan simultaneously aimed at the workforce, outside service providers and general operating expenses. In connection with this (with respect to the work force), an information and consultation process was initiated in early June in relation to a draft plan for the adaptation of employment, the impacts of which were valued and provided for in the financial statements for the half-year ended 30 June 2008.
1.2 Financial crisis The financial crisis triggered in 2007 by the deterioration of the residential real estate sector in the United States and the resulting liquidity crisis which affected the structured instruments from securitisation transactions continued to produce their effects during the first half of 2008. The second quarter in particular was marked by a worsening of the residential real estate crisis in the United States and its spreading to other classes of assets, as well as by the deterioration of the financial position of credit enhancement companies. The seriously damaged environment led Natixis Group to make a new provisioning effort for the most part for the CDOs of the ABS’ and for the exposure to the risk of credit enhancers. The main impacts of the crisis on the financial statements of the Natixis group during the first half are detailed in Note 5.

Update of the 2007 shelf-registration document 65
Note 2. Basis of presentation
The consolidated financial statements of Natixis for the half-year ended 30 June 2008 include a set of condensed financial statements prepared and presented in accordance with the provisions of IAS34 “Interim Financial Reporting”. The condensed financial statements must be read in conjunction with the consolidated financial statements for the year ended 31 December 2007 published in the 2007 registration document filed with the Autorité des Marchés Financiers (AMF) on 18 April 2008. They include a balance sheet, an income statement, a statement of changes in shareholders’ equity, a cash flow statement, and a selection of notes to the financial statements. They are presented with a comparison as at 31 December 2007 and as at 30 June 2007. The accounting principles and methods used in the preparation of the half-year financial statements are the same as those used in the preparation of the consolidated financial statements for the year ended 31 December 2007 prepared in accordance with the IFRS as adopted by the European Union and presented in detail in Note 2 “ Basis of presentation” of the 2007 financial statements, except for those relative to the standards, amendments and interpretations adopted by the European Union and applicable for the first time on or after 1 January 2008. Only interpretation IFRIC 11 “Group and treasury share transactions” adopted by the European Union is to be applied for the first time on or after 1 January 2008. This interpretation addresses two points of the application of IFRS 2 and specifies the accounting treatment of transactions whose payment is based on shares:
� for which the entity chooses or is required to buy its own treasury stock from independent third parties irrespective of the fact that the rights are awarded or determined by the entity itself or by its shareholders;
� which concern several entities from a given group (parent company or other entity from the
same group), in the individual or separate financial statements for each entity of the group which receives the services from beneficiaries of the plan.
This interpretation had no effect on the half-year financial statements of the Natixis group.
Natixis did not elect to apply in advance IFRS8 “Operating segments” adopted by the European Commission on 21 November 2007, with compulsory application as from 1 January 2009. This standard replaces IAS 14 “Segment Reporting”. It modifies the presentation of segment information, prioritising the managerial approach for defining segments. Excluding the various presentation aspects, this standard may have an impact on the amortisation of goodwill, which would be reallocated to new segments. However, this standard is not expected to have any material impact on the Natixis Group’s consolidated financial statements for fiscal year 2009.

Update of the 2007 shelf-registration document 66
Note 3. Use of estimates In preparing its financial statements, Natixis is required to make assumptions and apply estimates in certain areas based on available information that is likely to require expert judgment. These assumptions and estimates constitute sources of uncertainty which may affect the calculation of income and expenses in the income statement, the valuation of balance sheet assets and liabilities, and/or certain disclosures in the notes to the financial statements. Accounting estimates which require assumptions to be made are mainly used to measure the items set out below: - Financial instruments recognised at fair value
The fair value of hybrid market instruments not traded on an active market is calculated using valuation techniques. Valuations produced in this way using valuation models are adjusted, depending on the instruments in question and the associated risks, to take account of the bid and offer price for the net position, risks inherent in the models, counterparty risk and parameter risk. Fair values thus recognised may differ from actual prices at which such transactions might be concluded in the event of a sale on the market. - Impairment of loans and advances
At the balance sheet date, Natixis assesses whether or not there is any objective evidence of impairment in the loans and advances, either on an individual basis or collectively by risk category. In order to detect any signs of impairment, Natixis analyses trends in a number of objective criteria, but also relies on the judgment of its own experts. Similarly, Natixis may use its experts’ judgment to establish the likely timing of future cash flow recoveries (where the aim is to calculate the amount of individual impairment losses) or to adjust the amount of expected losses under the McDonough framework, on which the amount of collective impairment losses is based. - Valuation of unlisted equity instruments classified as “available-for-sale assets” Unlisted equity instruments classified as available-for-sale assets primarily consist of investments in non-consolidated companies. The fair value of unlisted non-consolidated investments is obtained principally by using the P/E (price earnings ratio) and DCF (discounted cash flow) valuation methods. Use of these methods requires certain choices and assumptions to be made in advance (in particular, projected expected future cash flows and discount rates). - Valuation of CGUs
All goodwill is assigned to a CGU so that it may be tested for impairment. The tests conducted by Natixis consist of comparing the carrying amount of each CGU (including goodwill) with its value in use. Value in use is calculated by discounting annual free cash flows to infinity. The use of this method involves the following:
- estimating future cash flows. Natixis has based these estimates on forecasts included in its
business units’ medium-term plans; - projecting cash flows from the latest year to infinity at a rate reflecting the expected
annual growth rate; - discounting cash flows at an expected annual rate of return to infinity from listed stocks in
the relevant sector.

Update of the 2007 shelf-registration document 67
- Employee benefits
Natixis calls on independent actuaries to calculate its principal employee benefits. The discount rates, future salary growth rates and rates of return on plan assets used are based on observed market rates as at the balance sheet date (e.g. yields on French government bonds (OAT) for discount rates). When applied to long-term liabilities, these rates introduce an uncertainty factor into valuations. - Other provisions for contingencies and charges
Provisions recorded in the consolidated balance sheet, other than those relating to financial instruments, employee benefits and insurance policies, primarily consist of provisions for litigation, fines, penalties and tax risks. A provision is recorded where it is likely that an outflow of resources embodying economic benefits will be required to settle an obligation arising from a past event, and where the amount of the obligation can be reliably estimated. In order to calculate this amount, management is required to assess the probability of the risk occurring. Future cash flows are discounted when the impact of doing so is material.
Note 4. Scope of consolidation
Changes in the scope of consolidation during the first half of 2008 The main changes in the scope of consolidation that occured during the first half of 2008 were as follows: 4. 1. Natixis (excluding intermediate tiers)
Entries into scope and changes in ownership interest:
• Entries into scope COFACE division:
- Creation of Coface Poland CMS, the business of which is financial information; - Creation of Poland Factoring, the business of which is factoring. - Creation de Coface Latvia Insurance, a subsidiary of Coface Austria, the business of which is
insurance;
• Change in ownership interest
- Increase in the Natixis Private Banking International ownership interest by 1.19% following a
capital increase fully subscribed by Natixis Private Banking; - Disposal of 33.4% of SLIB
Withdrawals from the scope of consolidation - Deconsolidations:
- Certain entities that were not reaching the consolidation thresholds were deconsolidated:
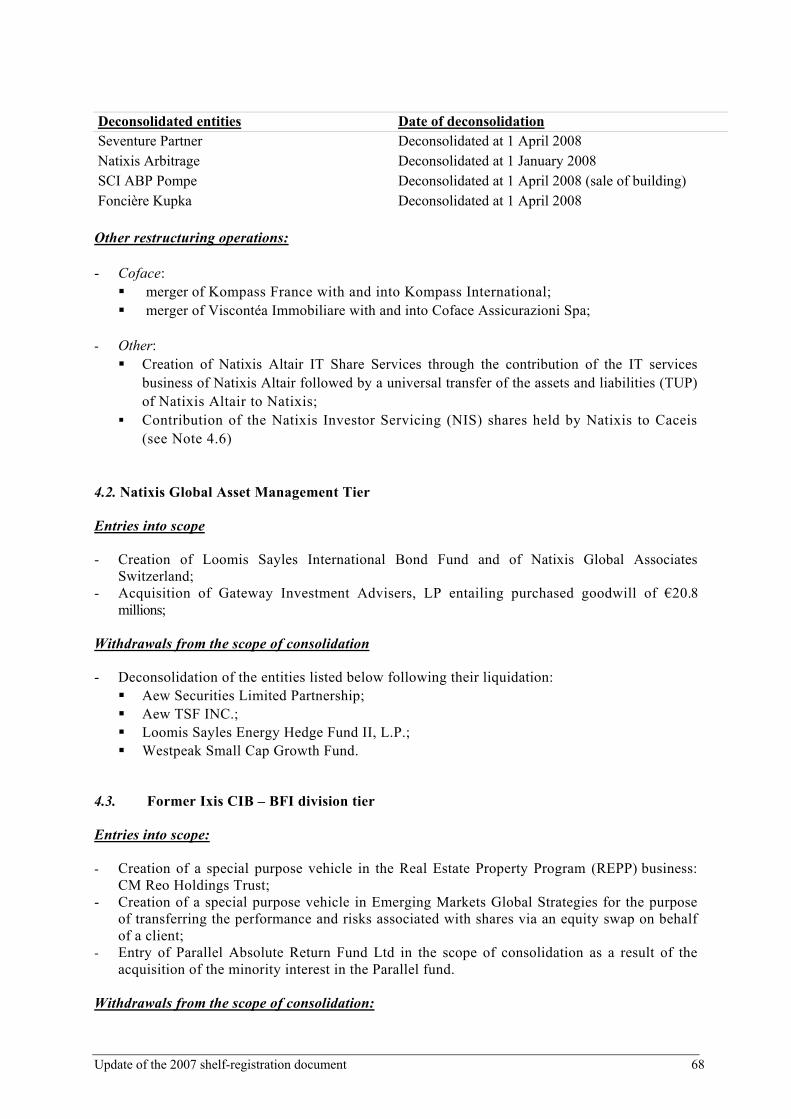
Update of the 2007 shelf-registration document 68
Deconsolidated entities Date of deconsolidation Seventure Partner Deconsolidated at 1 April 2008 Natixis Arbitrage Deconsolidated at 1 January 2008 SCI ABP Pompe Deconsolidated at 1 April 2008 (sale of building) Foncière Kupka Deconsolidated at 1 April 2008
Other restructuring operations:
- Coface:
� merger of Kompass France with and into Kompass International; � merger of Viscontéa Immobiliare with and into Coface Assicurazioni Spa;
- Other: � Creation of Natixis Altair IT Share Services through the contribution of the IT services
business of Natixis Altair followed by a universal transfer of the assets and liabilities (TUP) of Natixis Altair to Natixis;
� Contribution of the Natixis Investor Servicing (NIS) shares held by Natixis to Caceis (see Note 4.6)
4.2. Natixis Global Asset Management Tier Entries into scope - Creation of Loomis Sayles International Bond Fund and of Natixis Global Associates
Switzerland; - Acquisition of Gateway Investment Advisers, LP entailing purchased goodwill of €20.8
millions; Withdrawals from the scope of consolidation
- Deconsolidation of the entities listed below following their liquidation: � Aew Securities Limited Partnership; � Aew TSF INC.; � Loomis Sayles Energy Hedge Fund II, L.P.; � Westpeak Small Cap Growth Fund.
4.3. Former Ixis CIB – BFI division tier Entries into scope:
- Creation of a special purpose vehicle in the Real Estate Property Program (REPP) business: CM Reo Holdings Trust;
- Creation of a special purpose vehicle in Emerging Markets Global Strategies for the purpose of transferring the performance and risks associated with shares via an equity swap on behalf of a client;
- Entry of Parallel Absolute Return Fund Ltd in the scope of consolidation as a result of the acquisition of the minority interest in the Parallel fund.
Withdrawals from the scope of consolidation:
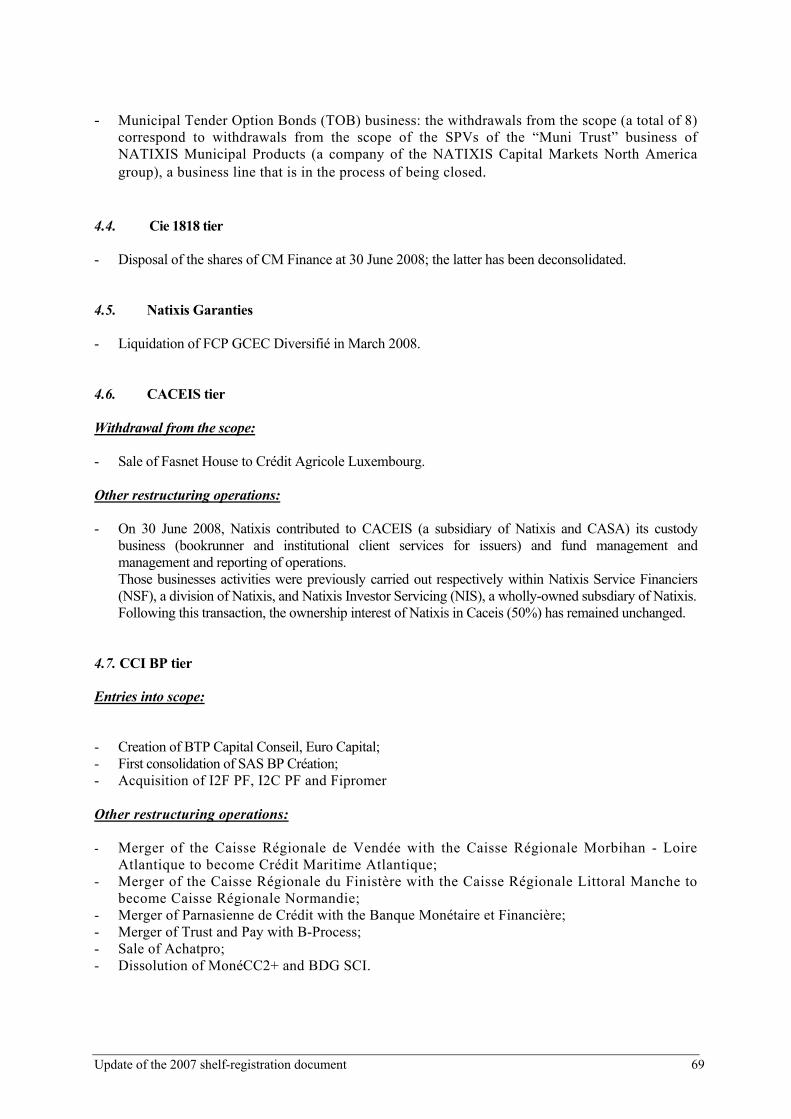
Update of the 2007 shelf-registration document 69
- Municipal Tender Option Bonds (TOB) business: the withdrawals from the scope (a total of 8) correspond to withdrawals from the scope of the SPVs of the “Muni Trust” business of NATIXIS Municipal Products (a company of the NATIXIS Capital Markets North America group), a business line that is in the process of being closed.
4.4. Cie 1818 tier
- Disposal of the shares of CM Finance at 30 June 2008; the latter has been deconsolidated. 4.5. Natixis Garanties - Liquidation of FCP GCEC Diversifié in March 2008. 4.6. CACEIS tier Withdrawal from the scope:
- Sale of Fasnet House to Crédit Agricole Luxembourg. Other restructuring operations:
- On 30 June 2008, Natixis contributed to CACEIS (a subsidiary of Natixis and CASA) its custody
business (bookrunner and institutional client services for issuers) and fund management and management and reporting of operations. Those businesses activities were previously carried out respectively within Natixis Service Financiers (NSF), a division of Natixis, and Natixis Investor Servicing (NIS), a wholly-owned subsdiary of Natixis. Following this transaction, the ownership interest of Natixis in Caceis (50%) has remained unchanged.
4.7. CCI BP tier
Entries into scope:
- Creation of BTP Capital Conseil, Euro Capital; - First consolidation of SAS BP Création; - Acquisition of I2F PF, I2C PF and Fipromer Other restructuring operations:
- Merger of the Caisse Régionale de Vendée with the Caisse Régionale Morbihan - Loire Atlantique to become Crédit Maritime Atlantique;
- Merger of the Caisse Régionale du Finistère with the Caisse Régionale Littoral Manche to become Caisse Régionale Normandie;
- Merger of Parnasienne de Crédit with the Banque Monétaire et Financière; - Merger of Trust and Pay with B-Process; - Sale of Achatpro; - Dissolution of MonéCC2+ and BDG SCI.

Update of the 2007 shelf-registration document 70
4.8. CCI CEP tier - Merger of Caisse d'Epargne De Haute Normandie with Caisse d'Epargne Normandie (formerly Caisse
d'Epargne of Basse Normandie) - Merger of Caisse d'Epargne De Bretagne with Caisse d'Epargne Bretagne-Pays de Loire (formerly Caisse
d'Epargne of Pays de la Loire) - Merger of Caisse d'Epargne Ile de France Ouest et Nord with Caisse d'Epargne Ile de France (formerly
Caisse d'Epargne of Ile de France Paris)
Consolidated subsidiaries
Business Consoli-dation method at 30 June 2008
30 June 2008 %
control interest
31 December 2007 %
control interest
Country
CORPORATE AND INVESTMENT BANKING
NATIXIS
BEDFORD OLIVER FUNDING LLC (1)
Other financial company
FC 100 100 100 100 United States
BLOOM ASSET HOLDINGS FUND PLC (1)
Other financial company
FC 100 100 100 100 Ireland
CALIFANO INVESTMENTS LIMITED
Structured finance
FC 100 100 100 100 Malta
CASANLI Investment company
PC 50 50 50 50 Luxembourg
CDC HOLDING TRUST (1)
Financing on the secondary market
FC 100 100 100 100 United States
CLEA2 (1) Collateralised security entity
FC 100 100 100 100 France
CM REO HOLDINGS TRUST (1) (2)
Financing on the secondary market
FC 100 100 0 0 United States
DUPONT-DENANT CONTREPARTIE
Investment company
FC 50 50 50 50 France
EDF INVESTISSEMENT GROUPE (26)
Investment company
PC 33 33 33 33 Belgium
EMERGING MARKETS GLOBAL STRAGEGIES Ltd (1) (2)
Other financial company
FC 100 100 0 0 Ireland
FILI SA Investment company
FC 100 100 100 100 Luxembourg
GUAVA CDO Ltd (1) Other financial company
FC 100 100 100 100 Jersey
IXIS ALTERNATIVE HOLDING LIMITED
Holding company
FC 100 100 100 100 Great Britain
IXIS CMNA (Australia) (No. 2) LLC (1)
Other financial company
FC 100 100 100 100 United States

Update of the 2007 shelf-registration document 71
IXIS CMNA (Australia) (No. 2) SCA (1)
Other financial company
FC 100 100 100 100 Luxembourg
IXIS CMNA (Australia) ACCEPTANCES (N°1) INC. (1)
Other financial company
FC 100 100 100 100 United States
IXIS CMNA (Australia) ACCEPTANCES (N°2) INC. (1)
Other financial company
FC 100 100 100 100 United States
IXIS CMNA (Australia) FUNDING (N°1) PTY LTD. (1)
Other financial company
FC 100 100 100 100 Australia
IXIS CMNA (Australia) FUNDING (N°2) PTY LTD. (1)
Other financial company
FC 100 100 100 100 Australia
IXIS CMNA (Australia) HOLDINGS (N°2) INC. (1)
Other financial company
FC 100 100 100 100 United States
IXIS CMNA (Australia) HOLDINGS INC. (1)
Other financial company
FC 100 100 100 100 United States
IXIS CMNA (Australia) PARTICIPATIONS (N°1) INC. (1)
Other financial company
FC 100 100 100 100 United States
IXIS CMNA (Australia) PARTICIPATIONS (N°2) INC. (1)
Other financial company
FC 100 100 100 100 United States
IXIS CMNA ACCEPTANCES LLC (1)
Other financial company
FC 100 100 100 100 United States
IXIS CMNA INTERNATIONAL HOLDINGS INC. (1)
Other financial company
FC 100 100 100 100 United States
IXIS CMNA INTERNATIONAL PARTICIPATIONS (N°1) LLC (1)
Other financial company
FC 100 100 100 100 United States
IXIS CMNA PC ASSETS HOLDINGS (LUXEMBOURG) SCA (1)
Other financial company
FC 100 100 100 100 Luxembourg
IXIS HAWAI SPECIAL MEMBER LLC (1)
Financing of commercial property
FC 100 100 100 100 United States
IXIS LOAN FUNDING I LLC (1)
Financing on the secondary market
FC 100 100 100 100 United States
IXIS LT INVESTOR LLC (1)
Other financial company
FC 100 100 100 100 United States
IXIS MANZANO SPECIAL MEMBER LLC (1)
Property financing
FC 100 100 100 100 United States
IXIS MUNICIPAL PRODUCTS INC. SARATOGA SERIES 2004-2 TRUST (1) (8)
Other financial company
0 0 100 100 United States
IXIS MUNICIPAL PRODUCTS INC. SARATOGA SERIES 2004-4 TRUST (1)
Other financial company
FC 100 100 100 100 United States
IXIS MUNICIPAL PRODUCTS INC.
Other financial company
FC 100 100 100 100 United States
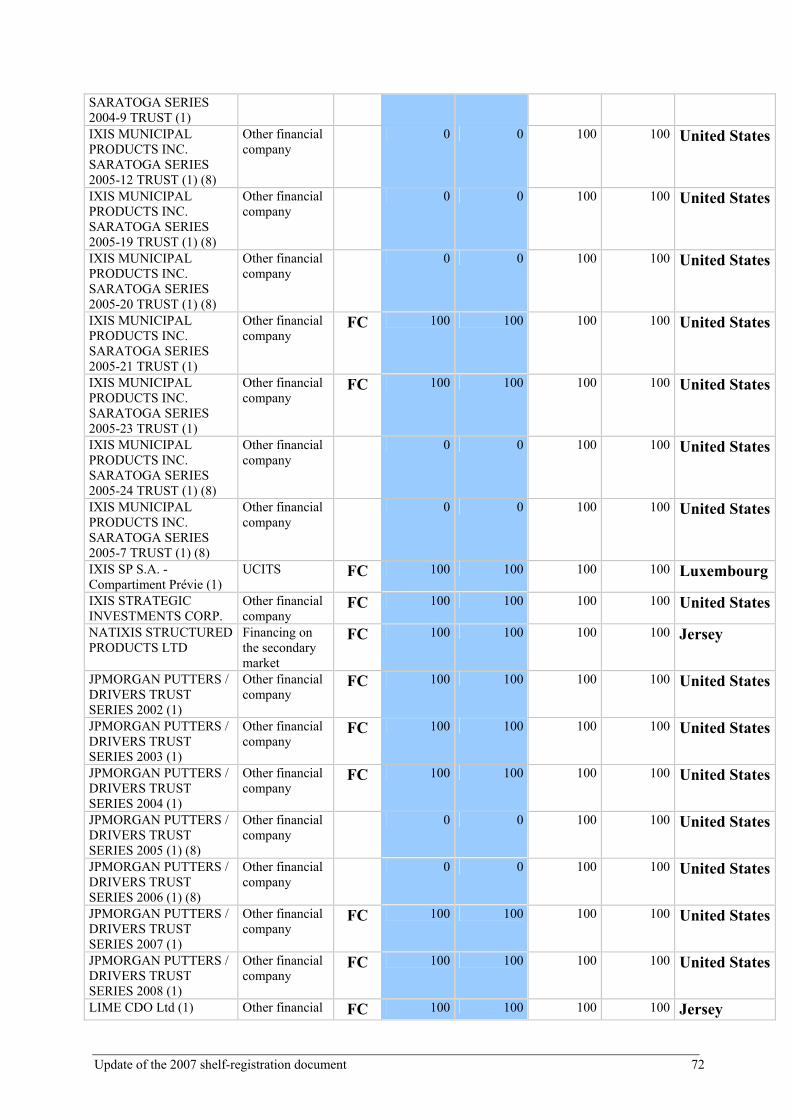
Update of the 2007 shelf-registration document 72
SARATOGA SERIES 2004-9 TRUST (1)
IXIS MUNICIPAL PRODUCTS INC. SARATOGA SERIES 2005-12 TRUST (1) (8)
Other financial company
0 0 100 100 United States
IXIS MUNICIPAL PRODUCTS INC. SARATOGA SERIES 2005-19 TRUST (1) (8)
Other financial company
0 0 100 100 United States
IXIS MUNICIPAL PRODUCTS INC. SARATOGA SERIES 2005-20 TRUST (1) (8)
Other financial company
0 0 100 100 United States
IXIS MUNICIPAL PRODUCTS INC. SARATOGA SERIES 2005-21 TRUST (1)
Other financial company
FC 100 100 100 100 United States
IXIS MUNICIPAL PRODUCTS INC. SARATOGA SERIES 2005-23 TRUST (1)
Other financial company
FC 100 100 100 100 United States
IXIS MUNICIPAL PRODUCTS INC. SARATOGA SERIES 2005-24 TRUST (1) (8)
Other financial company
0 0 100 100 United States
IXIS MUNICIPAL PRODUCTS INC. SARATOGA SERIES 2005-7 TRUST (1) (8)
Other financial company
0 0 100 100 United States
IXIS SP S.A. - Compartiment Prévie (1)
UCITS FC 100 100 100 100 Luxembourg
IXIS STRATEGIC INVESTMENTS CORP.
Other financial company
FC 100 100 100 100 United States
NATIXIS STRUCTURED PRODUCTS LTD
Financing on the secondary market
FC 100 100 100 100 Jersey
JPMORGAN PUTTERS / DRIVERS TRUST SERIES 2002 (1)
Other financial company
FC 100 100 100 100 United States
JPMORGAN PUTTERS / DRIVERS TRUST SERIES 2003 (1)
Other financial company
FC 100 100 100 100 United States
JPMORGAN PUTTERS / DRIVERS TRUST SERIES 2004 (1)
Other financial company
FC 100 100 100 100 United States
JPMORGAN PUTTERS / DRIVERS TRUST SERIES 2005 (1) (8)
Other financial company
0 0 100 100 United States
JPMORGAN PUTTERS / DRIVERS TRUST SERIES 2006 (1) (8)
Other financial company
0 0 100 100 United States
JPMORGAN PUTTERS / DRIVERS TRUST SERIES 2007 (1)
Other financial company
FC 100 100 100 100 United States
JPMORGAN PUTTERS / DRIVERS TRUST SERIES 2008 (1)
Other financial company
FC 100 100 100 100 United States
LIME CDO Ltd (1) Other financial FC 100 100 100 100 Jersey
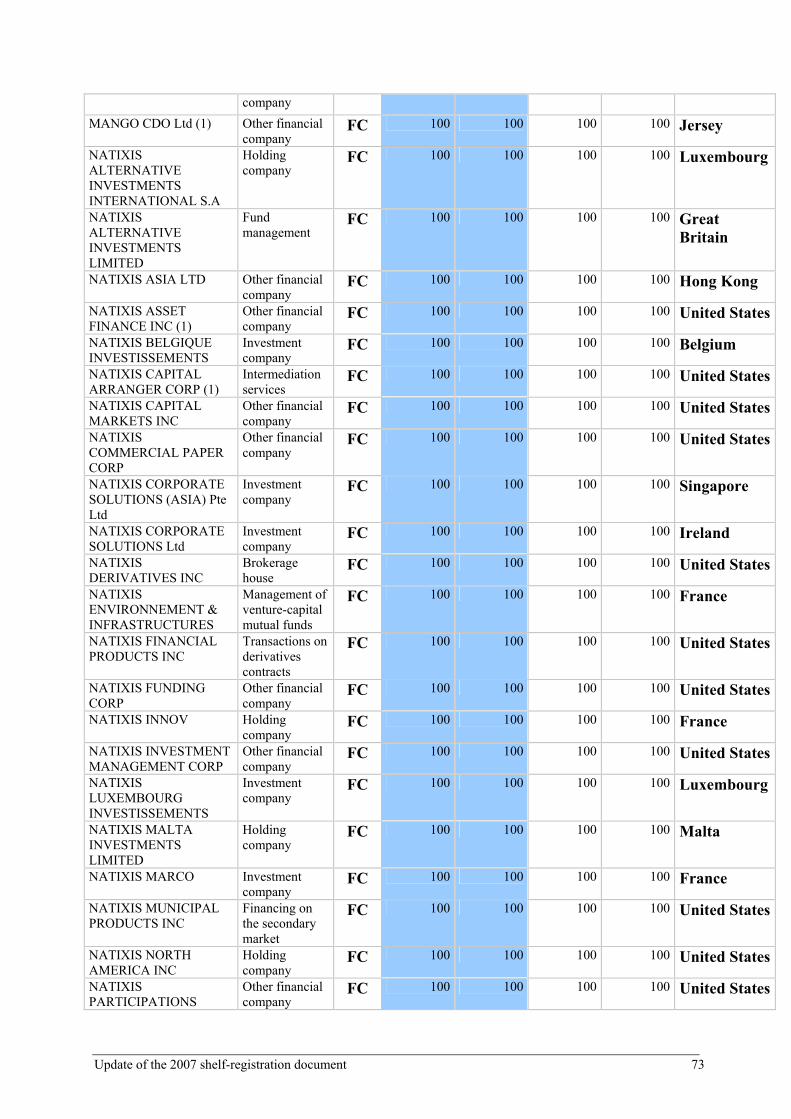
Update of the 2007 shelf-registration document 73
company
MANGO CDO Ltd (1) Other financial company
FC 100 100 100 100 Jersey
NATIXIS ALTERNATIVE INVESTMENTS INTERNATIONAL S.A
Holding company
FC 100 100 100 100 Luxembourg
NATIXIS ALTERNATIVE INVESTMENTS LIMITED
Fund management
FC 100 100 100 100 Great Britain
NATIXIS ASIA LTD Other financial company
FC 100 100 100 100 Hong Kong
NATIXIS ASSET FINANCE INC (1)
Other financial company
FC 100 100 100 100 United States
NATIXIS BELGIQUE INVESTISSEMENTS
Investment company
FC 100 100 100 100 Belgium
NATIXIS CAPITAL ARRANGER CORP (1)
Intermediation services
FC 100 100 100 100 United States
NATIXIS CAPITAL MARKETS INC
Other financial company
FC 100 100 100 100 United States
NATIXIS COMMERCIAL PAPER CORP
Other financial company
FC 100 100 100 100 United States
NATIXIS CORPORATE SOLUTIONS (ASIA) Pte Ltd
Investment company
FC 100 100 100 100 Singapore
NATIXIS CORPORATE SOLUTIONS Ltd
Investment company
FC 100 100 100 100 Ireland
NATIXIS DERIVATIVES INC
Brokerage house
FC 100 100 100 100 United States
NATIXIS ENVIRONNEMENT & INFRASTRUCTURES
Management of venture-capital mutual funds
FC 100 100 100 100 France
NATIXIS FINANCIAL PRODUCTS INC
Transactions on derivatives contracts
FC 100 100 100 100 United States
NATIXIS FUNDING CORP
Other financial company
FC 100 100 100 100 United States
NATIXIS INNOV Holding company
FC 100 100 100 100 France
NATIXIS INVESTMENT MANAGEMENT CORP
Other financial company
FC 100 100 100 100 United States
NATIXIS LUXEMBOURG INVESTISSEMENTS
Investment company
FC 100 100 100 100 Luxembourg
NATIXIS MALTA INVESTMENTS LIMITED
Holding company
FC 100 100 100 100 Malta
NATIXIS MARCO Investment company
FC 100 100 100 100 France
NATIXIS MUNICIPAL PRODUCTS INC
Financing on the secondary market
FC 100 100 100 100 United States
NATIXIS NORTH AMERICA INC
Holding company
FC 100 100 100 100 United States
NATIXIS PARTICIPATIONS
Other financial company
FC 100 100 100 100 United States
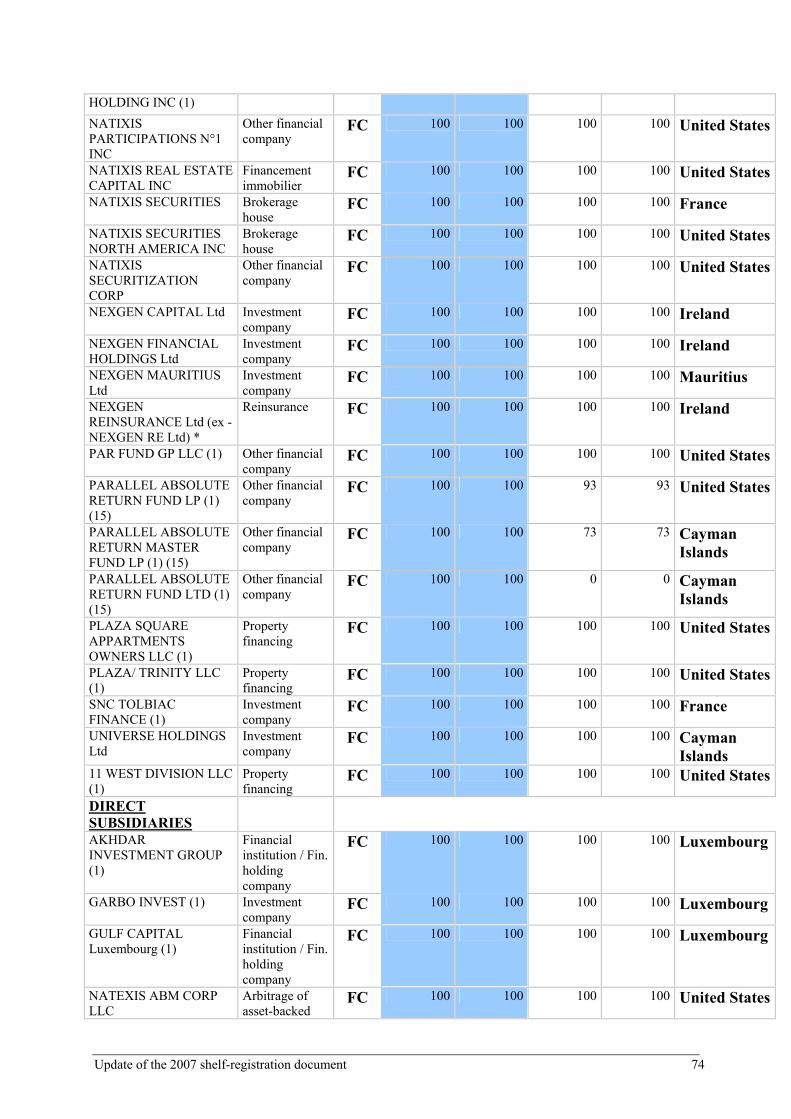
Update of the 2007 shelf-registration document 74
HOLDING INC (1)
NATIXIS PARTICIPATIONS N°1 INC
Other financial company
FC 100 100 100 100 United States
NATIXIS REAL ESTATE CAPITAL INC
Financement immobilier
FC 100 100 100 100 United States
NATIXIS SECURITIES Brokerage house
FC 100 100 100 100 France
NATIXIS SECURITIES NORTH AMERICA INC
Brokerage house
FC 100 100 100 100 United States
NATIXIS SECURITIZATION CORP
Other financial company
FC 100 100 100 100 United States
NEXGEN CAPITAL Ltd Investment company
FC 100 100 100 100 Ireland
NEXGEN FINANCIAL HOLDINGS Ltd
Investment company
FC 100 100 100 100 Ireland
NEXGEN MAURITIUS Ltd
Investment company
FC 100 100 100 100 Mauritius
NEXGEN REINSURANCE Ltd (ex -NEXGEN RE Ltd) *
Reinsurance FC 100 100 100 100 Ireland
PAR FUND GP LLC (1) Other financial company
FC 100 100 100 100 United States
PARALLEL ABSOLUTE RETURN FUND LP (1) (15)
Other financial company
FC 100 100 93 93 United States
PARALLEL ABSOLUTE RETURN MASTER FUND LP (1) (15)
Other financial company
FC 100 100 73 73 Cayman Islands
PARALLEL ABSOLUTE RETURN FUND LTD (1) (15)
Other financial company
FC 100 100 0 0 Cayman Islands
PLAZA SQUARE APPARTMENTS OWNERS LLC (1)
Property financing
FC 100 100 100 100 United States
PLAZA/ TRINITY LLC (1)
Property financing
FC 100 100 100 100 United States
SNC TOLBIAC FINANCE (1)
Investment company
FC 100 100 100 100 France
UNIVERSE HOLDINGS Ltd
Investment company
FC 100 100 100 100 Cayman Islands
11 WEST DIVISION LLC (1)
Property financing
FC 100 100 100 100 United States
DIRECT SUBSIDIARIES
AKHDAR INVESTMENT GROUP (1)
Financial institution / Fin. holding company
FC 100 100 100 100 Luxembourg
GARBO INVEST (1) Investment company
FC 100 100 100 100 Luxembourg
GULF CAPITAL Luxembourg (1)
Financial institution / Fin. holding company
FC 100 100 100 100 Luxembourg
NATEXIS ABM CORP LLC
Arbitrage of asset-backed
FC 100 100 100 100 United States

Update of the 2007 shelf-registration document 75
securities
NATIXIS ABM CORP. Arbitrage of asset-backed securities
FC 100 100 100 100 United States
NATIXIS BLEICHROEDER INC
Investment company
FC 100 100 100 100 United States
NATEXIS COMMODITY MARKETS Ltd
Brokerage of precious metals
FC 100 100 100 100 Great Britain
NATIXIS MOSCOW Foreign banking
FC 100 100 100 100 Russia
NATEXIS US FINANCE CORPORATION
Issue of negotiable debt securities
FC 100 100 100 100 United States
NATIXIS ARBITRAGE (4)
Arbitrage of equities and derivatives
0 0 100 100 France
NATIXIS COFICINE Financial company (audiovisual)
FC 94 94 94 94 France
NATIXIS FINANCE Advisory services for mergers and acquisitions
FC 100 100 100 100 France
NATIXIS FUNDING (1) Secondary debt market maker
FC 100 100 100 100 France
NATIXIS IMMO DEVELOPPEMENT
Property development and renovation
FC 100 100 100 100 France
NATIXIS Luxembourg Bank FC 100 100 100 100 Luxembourg NATIXIS TRANSPORT
FINANCE Bank FC 100 100 100 100 France
OPERA SENTIER SAS Property development and renovation
PC 50 50 50 50 France
SAS VAL A Investment portfolio holding company
FC 100 100 100 100 France
PRIVATE EQUITY AND PRIVATE
BANKING
Cie 1818
ANTEIS EPARGNE Insurance brokerage
FC 51 38 51 38 France
C&M FINANCE (13) UCITS management company
0 0 20 15 France
CENTRE FRANCAIS DU PATRIMOINE
Relationship with business intermediaries
FC 74 74 74 74 France
LA COMPAGNIE 1818 - BANQUIERS PRIVEES
Holding company
FC 74 74 74 74 France
LA COMPAGNIE 1818 - GESTION
UCITS management company
FC 74 74 74 74 France
LA COMPAGNIE 1818 IMMOBILIER
Property operations
FC 74 74 74 74 France

Update of the 2007 shelf-registration document 76
MANTRA GESTION UCITS management company
EM 34 25 34 25 France
DIRECT SUBSIDIARIES
BANQUE PRIVEE ST DOMINIQUE
Private banking FC 100 100 100 100 France
BP DEVELOPPEMENT (27)
Venture capital FC 45 49 42 36 France
BPSD GESTION Private banking FC 100 100 100 100 France DHALIA A SICAR SCA
(1) Investment capital
FC 100 100 100 100 Luxembourg
FINANCIERE NATEXIS SINGAPORE
International investment fund
FC 100 100 100 75 Singapore
FINATEM International investment fund
FC 91 84 100 76 Germany
FNS2 Investment capital
FC 100 100 100 79 Singapore
FNS3 Investment capital
FC 100 100 100 100 Singapore
FNS4 Investment capital
FC 100 83 100 85 Singapore
INITIATIVE ET FINANCE INVESTISSEMENT
Capital transmission
FC 92 72 92 74 France
IXEN Capital transmission
FC 100 89 100 87 France
FCPR IXEN II Capital transmission
FC 100 85 100 75 France
MERCOSUL International investment fund
FC 100 86 100 95 Great Britain
NATEXIS ACTIONS CAPITAL STRUCTURANT
Development capital
FC 62 62 64 64 France
NATEXIS CAPE International investment fund
FC 99 97 98 88 Luxembourg
NATEXIS INDUSTRIE FCPR
Capital transmission
FC 89 78 89 80 France
NATEXIS INVERSIONES SL
International investment fund
FC 100 78 100 52 Spain
NATEXIS INVESTMENT CORP.
Portfolio management
FC 100 100 100 100 United States
NATEXIS PRIVATE EQUITY INTERNATIONAL SINGAPORE
Investment capital holding company
FC 100 100 100 100 Singapore
NATEXIS PRIVATE EQUITY OPPORTUNITIES
Investment capital
FC 100 91 99 94 France
NATIXIS VENTURE SELECTION
Investment fund
FC 100 100 100 100 France
NATIXIS INVESTISSEMENT
Development capital
FC 100 89 100 90 France
NATIXIS PRIVATE BANKING (1)
International wealth management
FC 100 100 100 100 France
NATIXIS PRIVATE International FC 97 97 96 96 Luxembourg

Update of the 2007 shelf-registration document 77
BANKING INTERNATIONAL
wealth management
NATIXIS PRIVATE EQUITY (formerly NATEXIS PRIVATE EQUITY ) *
Investment capital
FC 100 100 100 100 France
NATIXIS PRIVATE EQUITY INTERNATIONAL
Investment capital
FC 100 58 100 21 France
NAXICAP PARTNERS (Ex SPEF DEVELOPPEMENT) *
Management of venture-capital mutual funds
FC 100 100 100 100 France
NEM 2 Asset management company (Investment capital)
FC 100 100 100 100 France
PROVIDENTE SA Acquisition of interest
FC 100 100 100 100 France
SEVENTURE PARTNERS (4)
Management of FCP Innovation mutual fund
0 0 100 100 France
ASSET MANAGEMENT
NATIXIS GLOBAL ASSET MANAGEMENT
AEW ADVISORS, INC. Asset management
FC 89 89 89 89 United States
AEW CAPITAL MANAGEMENT, INC.
Asset management
FC 89 89 89 89 United States
AEW CAPITAL MANAGEMENT, LP
Asset management
FC 89 89 89 89 United States
AEW GLOBAL ADVISORS (Asia) LTD
Asset management
FC 89 89 89 89 Singapore
AEW GLOBAL ADVISORS (EUROPE) LTD
Asset management
FC 89 89 89 89 Great Britain
AEW II CORPORATION Asset management
FC 89 89 89 89 United States
AEW INVESTMENT GROUP, INC.
Asset management
FC 89 89 89 89 United States
AEW MANAGEMENT AND ADVISORS, LP
Asset management
FC 89 89 89 89 United States
AEW PARTNERS III, INC.
Asset management
FC 89 89 89 89 United States
AEW PARTNERS IV, INC.
Asset management
FC 89 89 89 89 United States
AEW PARTNERS V, INC.
Asset management
FC 89 89 89 89 United States
AEW REAL ESTATE ADVISORS, INC.
Asset management
FC 89 89 89 89 United States
AEW SECURITIES LIMITED PARTNERSHIP (7)
Distribution 0 0 89 89 United States
AEW TSF, INC. (7) Asset management
0 0 89 89 United States
AEW VIF INVESTORS, Asset FC 89 89 89 89 United States

Update of the 2007 shelf-registration document 78
INC. management
AEW VIF II INVESTORS, INC.
Asset management
FC 89 89 89 89 United States
ALPHASIMPLEX GROUP LLC
Asset management
FC 89 89 89 89 United States
ALTERNATIVE STRATEGIES GROUP LLC
Asset management
FC 89 89 89 89 United States
ASAHI NVEST INVESTMENT ADVISORY CO, LTD
Distribution EM 49 43 49 43 Japan
CAPITAL GROWTH MANAGEMENT, LP
Asset management
EM 50 44 50 44 United States
CASPIAN CAPITAL MANAGEMENT, LLC
Asset management
FC 51 45 51 45 United States
CGW ASSET MANAGEMENT
Asset management
EM 33 18 33 18 France
COGIM Asset management
FC 89 53 89 53 France
CREA WESTERN INVESTORS I, INC.
Asset management
FC 89 89 89 89 United States
CURZON GLOBAL ADVISORY LTD
Asset management
FC 89 53 89 53 Great Britain
CURZON GLOBAL CC LTD
Asset management
FC 89 53 89 53 Great Britain
CURZON GLOBAL LTD Asset management
FC 89 53 89 53 Great Britain
CURZON GLOBAL PARTNERS
Asset management
FC 89 53 89 53 Great Britain
CURZON GLOBAL UK LTD
Asset management
FC 89 53 89 53 Great Britain
NATIXIS EPARGNE FINANCIERE GESTION (ex -Ecureuil Gestion)*
Asset management
FC 89 89 89 89 France
NATIXIS EPARGNE FINANCIERE GESTION FCP (ex Ecureuil Gestion Fonds Commun Placement)*
Asset management
FC 89 89 89 89 France
EPI SLP LLC Asset management
FC 89 53 89 53 Great Britain
FEDERAL STREET MANAGEMENT, INC.
Asset management
FC 89 89 89 89 United States
GATEWAY INVESTMENT ADVISERS, LP (3)
Asset management
FC 89 89 0 0 United States
HANSBERGER GROUP, INC.
Asset management
FC 88 88 88 88 United States
HANSBERGER GLOBAL INVESTOR, INC
Asset management
FC 89 89 89 89 United States
HANSBERGER GLOBAL (HK) Ltd
Asset management
FC 89 89 89 89 United States
HARRIS ALTERNATIVES HOLDING INC
Holding company
FC 89 89 89 89 United States
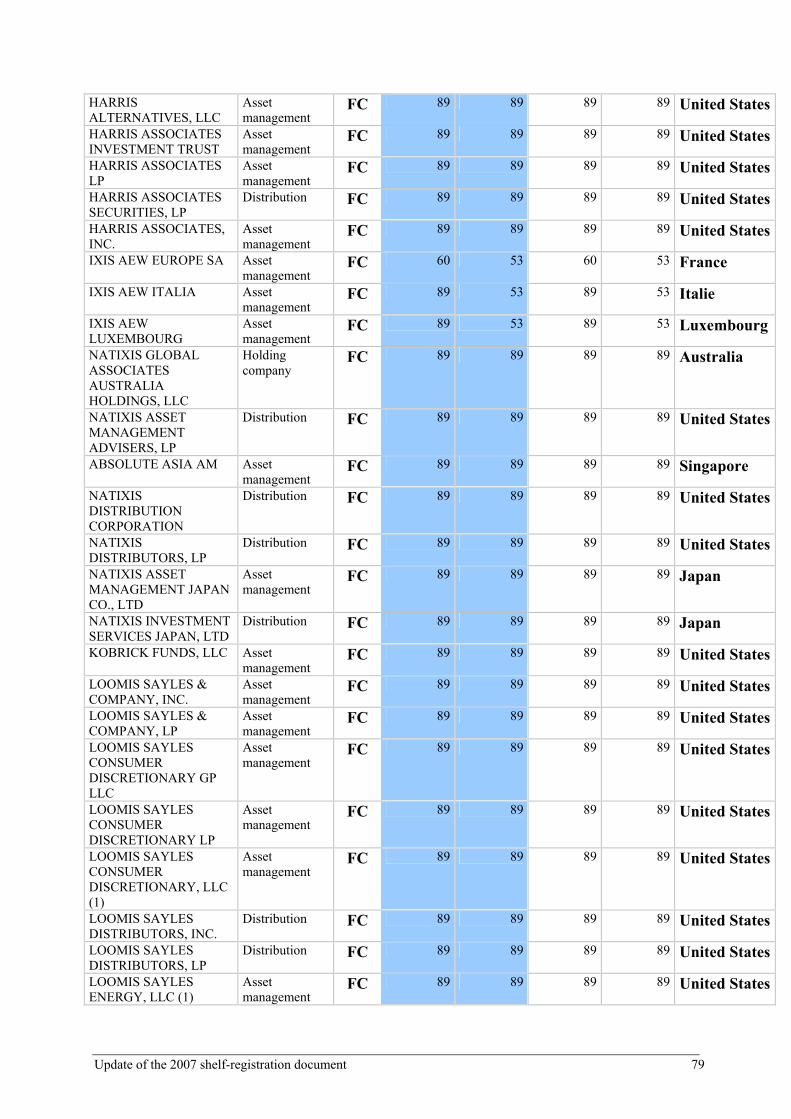
Update of the 2007 shelf-registration document 79
HARRIS ALTERNATIVES, LLC
Asset management
FC 89 89 89 89 United States
HARRIS ASSOCIATES INVESTMENT TRUST
Asset management
FC 89 89 89 89 United States
HARRIS ASSOCIATES LP
Asset management
FC 89 89 89 89 United States
HARRIS ASSOCIATES SECURITIES, LP
Distribution FC 89 89 89 89 United States
HARRIS ASSOCIATES, INC.
Asset management
FC 89 89 89 89 United States
IXIS AEW EUROPE SA Asset management
FC 60 53 60 53 France
IXIS AEW ITALIA Asset management
FC 89 53 89 53 Italie
IXIS AEW LUXEMBOURG
Asset management
FC 89 53 89 53 Luxembourg
NATIXIS GLOBAL ASSOCIATES AUSTRALIA HOLDINGS, LLC
Holding company
FC 89 89 89 89 Australia
NATIXIS ASSET MANAGEMENT ADVISERS, LP
Distribution FC 89 89 89 89 United States
ABSOLUTE ASIA AM Asset management
FC 89 89 89 89 Singapore
NATIXIS DISTRIBUTION CORPORATION
Distribution FC 89 89 89 89 United States
NATIXIS DISTRIBUTORS, LP
Distribution FC 89 89 89 89 United States
NATIXIS ASSET MANAGEMENT JAPAN CO., LTD
Asset management
FC 89 89 89 89 Japan
NATIXIS INVESTMENT SERVICES JAPAN, LTD
Distribution FC 89 89 89 89 Japan
KOBRICK FUNDS, LLC Asset management
FC 89 89 89 89 United States
LOOMIS SAYLES & COMPANY, INC.
Asset management
FC 89 89 89 89 United States
LOOMIS SAYLES & COMPANY, LP
Asset management
FC 89 89 89 89 United States
LOOMIS SAYLES CONSUMER DISCRETIONARY GP LLC
Asset management
FC 89 89 89 89 United States
LOOMIS SAYLES CONSUMER DISCRETIONARY LP
Asset management
FC 89 89 89 89 United States
LOOMIS SAYLES CONSUMER DISCRETIONARY, LLC (1)
Asset management
FC 89 89 89 89 United States
LOOMIS SAYLES DISTRIBUTORS, INC.
Distribution FC 89 89 89 89 United States
LOOMIS SAYLES DISTRIBUTORS, LP
Distribution FC 89 89 89 89 United States
LOOMIS SAYLES ENERGY, LLC (1)
Asset management
FC 89 89 89 89 United States

Update of the 2007 shelf-registration document 80
LOOMIS SAYLES ENERGY HEDGE FUND II, L.P. (1) (7)
Asset management
0 0 89 89 United States
LOOMIS SAYLES FUTURES, LLC
Asset management
FC 89 89 89 89 United States
LOOMIS SAYLES INTERNATIONAL BOND FUND (1) (2)
Asset management
FC 89 89 0 0 United States
LOOMIS SAYLES SOLUTIONS, INC
Asset management
FC 89 89 89 89 United States
LOOMIS SAYLES TRUST COMPANY,LLC
Asset management
FC 89 89 89 89 United States
MC MANAGEMENT, INC.
Holding company
FC 89 89 89 89 United States
MC MANAGEMENT, LP Holding company
FC 89 89 89 89 United States
NATIXIS ASSET MANAGEMENT IMMOBILIER
Property management (SCPI/ Real Estate Investment Fund)
FC 88 53 88 53 France
NATIXIS ASSET MANAGEMENT
Asset management
FC 89 89 89 89 France
NATIXIS ASSET MANAGEMENT PARTICIPATIONS 1
Holding company
FC 89 89 89 89 France
NATIXIS ASSET MANAGEMENT PARTICIPATIONS 2
Holding company
FC 89 89 89 89 France
NATIXIS GLOBAL ASSET MANAGEMENT
Holding company
FC 89 89 89 89 France
NATIXIS GLOBAL ASSET MANAGEMENT CORPORATION
Holding company
FC 89 89 89 89 United States
NATIXIS GLOBAL ASSET MANAGEMENT HOLDINGS, LLC
Holding company
FC 89 89 89 89 United States
NATIXIS GLOBAL ASSET MANAGEMENT PARTICIPATIONS 1
Holding company
FC 89 89 89 89 France
NATIXIS GLOBAL ASSET MANAGEMENT PARTICIPATIONS 2
Holding company
FC 89 89 89 89 France
NATIXIS GLOBAL ASSET MANAGEMENT PARTICIPATIONS 3
Holding company
FC 89 89 89 89 France
NATIXIS GLOBAL ASSET MANAGEMENT PARTICIPATIONS 4
Holding company
FC 89 89 89 89 France
NATIXIS GLOBAL ASSET MANAGEMENT, LLC
Holding company
FC 89 89 89 89 United States
NATIXIS GLOBAL ASSET MANAGEMENT, LP
Holding company
FC 89 89 89 89 United States
NATIXIS GLOBAL ASSOCIATES GERMANY
Distribution FC 89 89 89 89 Germany

Update of the 2007 shelf-registration document 81
NATIXIS GLOBAL ASSOCIATES ITALIA
Asset management
FC 89 89 89 89 Italy
NATIXIS GLOBAL ASSOCIATES LUXEMBOURG
Distribution FC 89 89 89 89 Luxembourg
NATIXIS GLOBAL ASSOCIATES UK
Distribution FC 89 89 89 89 Great Britain
NATIXIS GLOBAL ASSOCIATES, INC
Distribution FC 89 89 89 89 United States
NATIXIS GLOBAL ASSOCIATES, LLC
Distribution FC 89 89 89 89 United States
NATIXIS GLOBAL ASSOCIATES SWITZERLAND (2)
Asset management
FC 89 89 0 0 Switzerland
NATIXIS MULTIMANAGER
Asset management
FC 89 89 89 89 France
NATIXIS OAKMARK GLOBAL LARGE CAP (1)
Asset management
FC 89 89 89 89 United States
PBW REAM Asset management
EM 50 26 50 26 Netherlands
PERCIPIO CAPITAL MANAGEMENT, LLC
Asset management
EM 30 27 30 27 United States
REICH & TANG ASSET MANAGEMENT, LLC
Asset management
FC 89 89 89 89 United States
REICH & TANG DISTRIBUTORS, INC.
Distribution FC 89 89 89 89 United States
REICH & TANG SERVICES, INC.
Asset management
FC 89 89 89 89 United States
SEAPORT SENIOR HOUSING, LLC
Asset management
FC 89 89 89 89 United States
SNYDER CAPITAL MANAGEMENT, INC.
Asset management
FC 89 89 89 89 United States
SNYDER CAPITAL MANAGEMENT, LP
Asset management
FC 89 89 89 89 United States
VAUGHAN NELSON INVESTMENT MANAGEMENT, INC.
Asset management
FC 89 89 89 89 United States
VAUGHAN NELSON INVESTMENT MANAGEMENT, LP
Asset management
FC 89 89 89 89 United States
VAUGHAN NELSON TRUST COMPANY
Asset management
FC 89 89 89 89 United States
WESTPEAK GLOBAL ADVISORS, LP
Asset management
FC 89 89 89 89 United States
WESTPEAK INVESTMENT ADVISORS, INC.
Asset management
FC 89 89 89 89 United States
WESTPEAK SMALL CAP GROWTH FUND (1) (7)
Asset management
0 0 89 89 United States
NATIXIS AXELTIS LTD (Formerly AXELTIS LTD) *
UCITS distribution
FC 100 100 100 100 Great Britain
RECEIVABLES MANAGEMENT
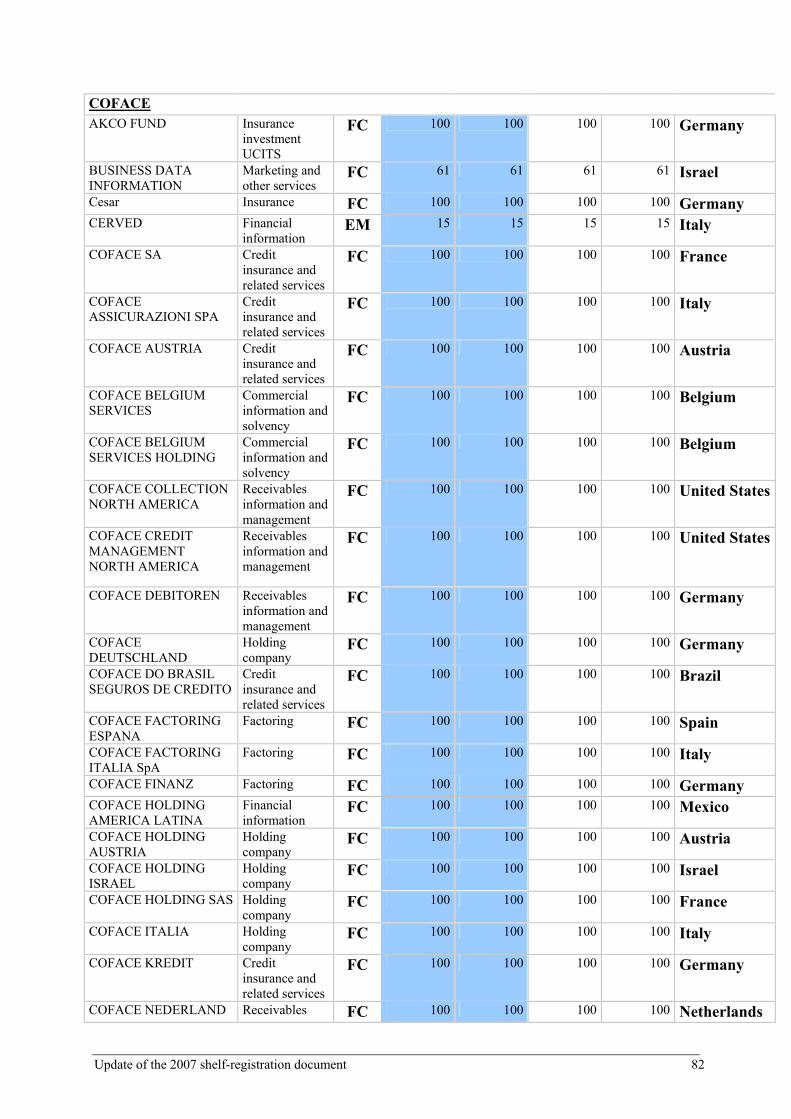
Update of the 2007 shelf-registration document 82
COFACE
AKCO FUND Insurance investment UCITS
FC 100 100 100 100 Germany
BUSINESS DATA INFORMATION
Marketing and other services
FC 61 61 61 61 Israel
Cesar Insurance FC 100 100 100 100 Germany CERVED Financial
information EM 15 15 15 15 Italy
COFACE SA Credit insurance and related services
FC 100 100 100 100 France
COFACE ASSICURAZIONI SPA
Credit insurance and related services
FC 100 100 100 100 Italy
COFACE AUSTRIA Credit insurance and related services
FC 100 100 100 100 Austria
COFACE BELGIUM SERVICES
Commercial information and solvency
FC 100 100 100 100 Belgium
COFACE BELGIUM SERVICES HOLDING
Commercial information and solvency
FC 100 100 100 100 Belgium
COFACE COLLECTION NORTH AMERICA
Receivables information and management
FC 100 100 100 100 United States
COFACE CREDIT MANAGEMENT NORTH AMERICA
Receivables information and management
FC 100 100 100 100 United States
COFACE DEBITOREN Receivables information and management
FC 100 100 100 100 Germany
COFACE DEUTSCHLAND
Holding company
FC 100 100 100 100 Germany
COFACE DO BRASIL SEGUROS DE CREDITO
Credit insurance and related services
FC 100 100 100 100 Brazil
COFACE FACTORING ESPANA
Factoring FC 100 100 100 100 Spain
COFACE FACTORING ITALIA SpA
Factoring FC 100 100 100 100 Italy
COFACE FINANZ Factoring FC 100 100 100 100 Germany COFACE HOLDING
AMERICA LATINA Financial information
FC 100 100 100 100 Mexico
COFACE HOLDING AUSTRIA
Holding company
FC 100 100 100 100 Austria
COFACE HOLDING ISRAEL
Holding company
FC 100 100 100 100 Israel
COFACE HOLDING SAS Holding company
FC 100 100 100 100 France
COFACE ITALIA Holding company
FC 100 100 100 100 Italy
COFACE KREDIT Credit insurance and related services
FC 100 100 100 100 Germany
COFACE NEDERLAND Receivables FC 100 100 100 100 Netherlands

Update of the 2007 shelf-registration document 83
SERVICES information and management
COFACE NORTH AMERICA
Credit insurance and related services
FC 100 100 100 100 United States
COFACE NORTH AMERICA HOLDING COMPANY
Holding company
FC 100 100 100 100 United States
COFACE NORTH AMERICA INSURANCE COMPANY
Credit insurance and related services
FC 100 100 100 100 United States
COFACE POLAND CMS (2)
Information financière
FC 100 75 0 0 Poland
COFACE POLAND FACTORING (2)
Factoring FC 100 100 0 0 Poland
COFACE RECEIVABLE FINANCES
Factoring FC 100 100 100 100 Great Britain
COFACE SERVICE Receivables information and management
FC 100 100 100 100 France
COFACE SERVICE SPA Receivables information and management
FC 100 100 100 100 Italy
COFACE SERVICES AUSTRIA
Receivables information and management
FC 100 100 100 100 Austria
COFACE SERVICES NORTH AMERICA GROUP
Holding company
FC 100 100 100 100 United States
COFACE SERVICIOS ESPANA S.L.
Receivables information and management
FC 100 100 100 100 Spain
COFACE SERVICIOS PORTUGAL
Receivables information and management
FC 100 100 100 100 Portugal
COFACE UK HOLDINGS
Holding company
FC 100 100 100 100 Great Britain
COFACE UK SERVICES LTD
Receivables information and management
FC 100 100 100 100 Great Britain
COFACERATING HOLDING
Receivables information and management
FC 100 100 100 100 Germany
COFACERATING.DE Receivables information and management
FC 100 100 100 100 Germany
COFACREDIT Credit insurance and related services
EM 36 36 36 36 France
PLACEMENTS COFACTIONS 2
Insurance investment UCITS
FC 100 100 100 100 France
COFINPAR Credit insurance and related services
FC 100 100 100 100 France
COFOBLIG Insurance investment UCITS
FC 100 100 100 100 France

Update of the 2007 shelf-registration document 84
COGERI Receivables information and management
FC 100 100 100 100 France
FIMIPAR Debt repurchase
FC 100 100 100 100 France
GRAYDON HOLDING Receivables information and management
EM 28 28 28 28 Netherlands
GROUPE COFACE CENTRAL EUROPE HOLDING
Holding company
FC 75 75 75 75 Austria
KISSELBERG Insurance FC 100 100 100 100 Germany KOMPASS Belgium Marketing and
other services FC 100 100 100 100 Belgium
KOMPASS France (9) Holding company
0 0 100 100 France
KOMPASS INTERNATIONAL NEUENSCHWANDER
Holding company
FC 100 100 100 100 France
LA VISCONTEA IMMOBILIARE (25)
Real estate company
0 0 100 100 Italy
MSL1 FUND Insurance investment UCITS
FC 100 100 100 100 Germany
UNISTRAT COFACE Insurance business broker
FC 100 100 100 100 France
DIRECT SUBSIDIARIES
NATIXIS FACTOR Factoring FC 100 100 100 100 France VR FACTOREM GMBH Factoring PC 51 51 51 51 Germany
SERVICES
CACEIS
BROOKE SECURITIES HOLDINGS INC
Holding company
PC 50 50 50 50 United States
BROOKE SECURITIES INC
Fund management
PC 50 50 50 50 United States
CACEIS BANK Institutional custodian - UCITS trustee bank
PC 50 50 50 50 France
CACEIS BANK LUXEMBOURG
Institutional custodian - UCITS trustee bank
PC 50 50 50 50 Luxembourg
CACEIS BANK DEUTSCHLAND
Securities custody
PC 50 50 50 50 Germany
CACEIS CORPORATE TRUST
Issuer services PC 50 50 50 50 France
CACEIS FASTNET AMERICAN ADMINISTRATION
Holding company
PC 50 50 50 50 France
CACEIS FASTNET Fund management
PC 47 47 47 47 France
CACEIS FASTNET SUISSE
Fund management
PC 50 50 50 50 Switzerland
CACEIS SAS Holding company
PC 50 50 50 50 France

Update of the 2007 shelf-registration document 85
FASTNET Belgium Fund management
PC 26 26 26 26 Belgium
FASTNET IRELAND Fund management
PC 50 50 50 50 Ireland
FASTNET LUXEMBOURG
Fund management
PC 26 26 26 26 Luxembourg
FASTNET PAYS BAS Fund management
PC 26 26 26 26 Netherlands
INVESTOR SERVICES HOUSE
Operating real property
PC 50 50 50 50 Luxembourg
NATIXIS INVESTOR SERVICING (Formerly NATEXIS INVESTOR SERVICING) * (12)
Administrative management of UCITS
PC 50 47 0 0 France
OLYMPIA CAPITAL INC Fund management
PC 50 50 50 50 United States
OLYMPIA CAPITAL ASSOCIATES, LP
Fund management
PC 50 50 50 50 United States
OLYMPIA CAPITAL FINANCIAL SERVICES INC
Fund management
PC 50 50 50 50 Canada
OLYMPIA CAPITAL BERMUDA LTD
Fund management
PC 50 50 50 50 Bermuda
OLYMPIA CAPITAL CAYMAN LTD
Fund management
PC 50 50 50 50 Cayman Islands
OLYMPIA CAPITAL IRELAND LTD
Fund management
PC 50 50 50 50 Ireland
PARTINVEST SA Property operations
PC 50 50 50 50 Luxembourg
THE FASTNET HOUSE (6)
Property operations
0 0 50 50 Luxembourg
WINCHESTER GLOBAL TRUST COMPANY LTD
Fund management
PC 50 50 50 50 Bermuda
WINCHESTER FIDUCIARY SERVICES LTD
Fund management
PC 50 50 50 50 Bermuda
NATIXIS GARANTIES
CEGI Insurance FC 100 100 100 100 France FCP GCEC Diversifié (14) Insurance
investment UCITS
0 0 100 100 France
NATIXIS GARANTIES Credit institution
FC 100 100 100 100 France
SACCEF Insurance FC 100 100 100 100 France SCI CHAMPS-ELYSEES Real property
management FC 100 100 100 100 France
SCI LA BOETIE Real property management
FC 100 100 100 100 France
SCI SACCEF Real property management
FC 100 100 100 100 France
SOCAMAB Insurance FC 100 100 100 100 France DIRECT SUBSIDIARIES
ADIR Property damage insurance
EM 34 34 34 34 Lebanon

Update of the 2007 shelf-registration document 86
ASSURANCES BANQUE POPULAIRE ACTIONS (1)
Insurance investment UCITS
FC 100 99 100 99 France
ASSURANCES BANQUE POPULAIRE CROISSANCE RENDEMENT (1)
Insurance investment UCITS
FC 99 99 99 99 France
ASSURANCES BANQUE POPULAIRE IARD
Property damage insurance
EM 50 50 50 50 France
ASSURANCES BANQUE POPULAIRE MIDCAP (1)
Insurance investment UCITS
FC 100 100 100 100 France
ASSURANCES BANQUE POPULAIRE PREVOYANCE
Provident insurance
FC 100 100 100 100 France
ASSURANCES BANQUE POPULAIRE VIE
Life insurance FC 100 100 100 100 France
FONCIER ASSURANCE Insurance FC 60 60 60 60 France FRUCTIBAIL Financial
leasing FC 100 100 100 100 France
FRUCTIBAIL INVEST Financial leasing
FC 100 100 100 100 France
FRUCTICOMI Financial leasing
FC 100 100 100 100 France
FRUCTIFONCIER (1) Insurance property investment
FC 100 100 100 100 France
GCE BAIL Leasing FC 100 100 100 100 France GESTITRES Securities
custody FC 100 100 100 100 France
NATIXIS ALGERIE Bank FC 100 100 100 100 Algeria NATIXIS ASSURANCES Insurance
companies holding company
FC 100 100 100 100 France
NATIXIS BAIL Financial leasing
FC 100 100 100 100 France
NATIXIS CONSUMER FINANCE * (ex - Ecrinvest 11)
Holding company
FC 100 100 100 100 France
NATIXIS CONSUMER FINANCE IT (Ex - Natixis Consumer Finance)
Consumer credit
FC 100 100 100 100 France
NATIXIS ENERGECO Financial leasing
FC 100 100 100 100 France
NATIXIS FINANCEMENT
Consumer credit
FC 67 67 67 67 France
NATIXIS IMMO EXPLOITATION (1)
Property operations
FC 100 100 100 100 France
NATIXIS INTEREPARGNE
Management of employee savings accounts
FC 100 100 100 100 France
NATIXIS INTERTITRES Services vouchers supply
FC 100 100 100 100 France
NATIXIS INVESTOR Administrative 0 0 100 100 France

Update of the 2007 shelf-registration document 87
SERVICING (Formerly NATEXIS INVESTOR SERVICING) * (12)
management of UCITS
NATIXIS LEASE Financial leasing
FC 100 100 100 100 France
NATIXIS LEASE MADRID
Equipment and property leasing
FC 100 100 100 100 Spain
NATIXIS LEASE MILAN
Equipment and property leasing
FC 100 100 100 100 Italy
NATIXIS LIFE Life insurance FC 100 100 100 100 Luxembourg NATIXIS LLD Long-term
vehicle rental FC 100 100 100 100 France
NATIXIS PAIEMENTS Banking services
FC 100 100 100 100 France
NATIXIS PRAMEX INTERNATIONAL INC - Montréal
International trade operations and promotion
FC 100 99 100 99 Canada
NATIXIS PRAMEX INTERNATIONAL SARLAU - Casablanca
International trade operations and promotion
FC 100 99 100 99 Morocco
NATIXIS PRAMEX INTERNATIONAL - Madrid
International trade operations and promotion
FC 100 99 100 99 Spain
NATIXIS PRAMEX INTERNATIONAL - Milan
International trade operations and promotion
FC 100 95 100 95 Italy
NATIXIS PRAMEX GMBH - Frankfort
International trade operations and promotion
FC 100 99 100 99 Germany
NATIXIS PRAMEX INTERNATIONAL - Tunis
International trade operations and promotion
FC 100 99 100 99 Tunisia
NATIXIS PRAMEX INTERNATIONAL SP ZO.O - Warsow
International trade operations and promotion
FC 100 99 100 99 Poland
NATIXIS PRAMEXRUS - Moscow
International trade operations and promotion
FC 100 99 100 99 Russia
NATIXIS PRAMEX INTERNATIONAL
Holding company
FC 99 99 99 99 France
NATIXIS PRAMEX INTERNATIONAL AP LTD - Hong Kong
International trade operations and promotion
FC 100 99 100 99 Hong Kong
NATIXIS PRAMEX INTERNATIONAL DO BRASIL - Sao Paulo
International trade operations and promotion
FC 100 99 100 99 Brazil
NATIXIS PRAMEX INTERNATIONAL CORP-New York
International trade operations and promotion
FC 100 99 100 99 United States
NATIXIS PRAMEX INTERNATIONAL LTD - London
International trade operations and promotion
FC 100 99 100 99 Great Britain
NATIXIS PRAMEX INTERNATIONAL France - Paris
International trade operations and promotion
FC 100 98 100 98 France
S.C.I. ABP POMPE (1) (11)
Insurance property investment
0 0 100 100 France
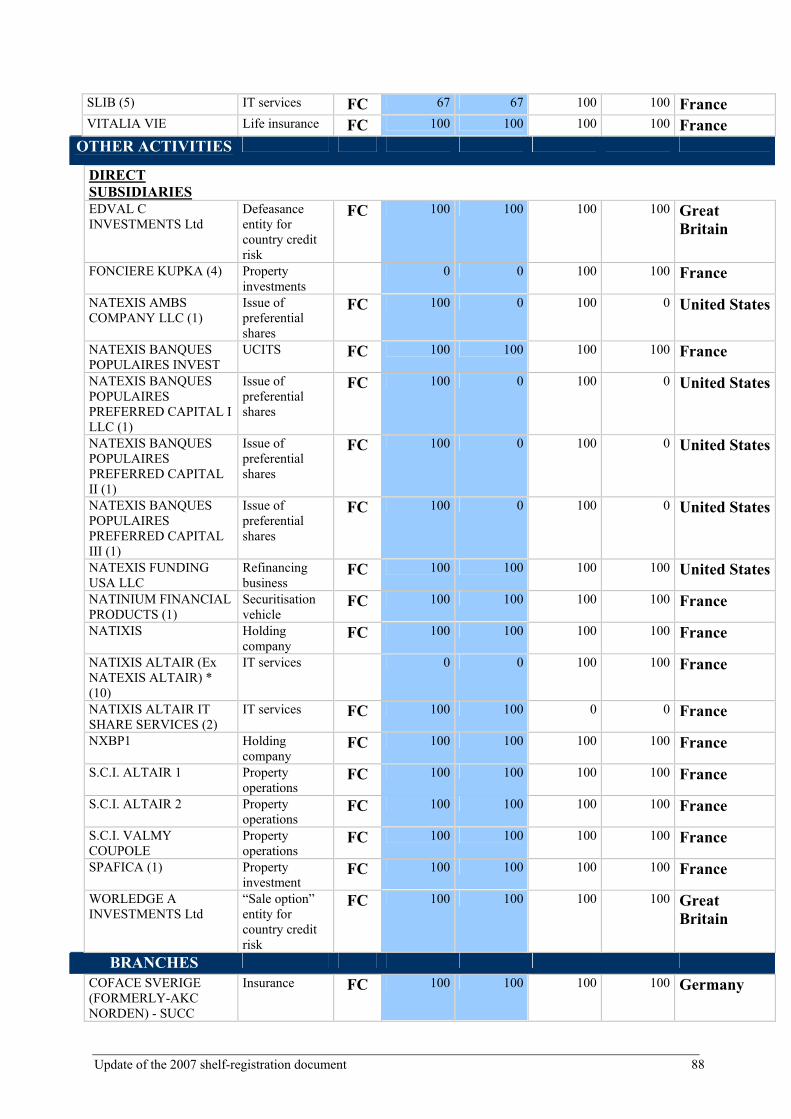
Update of the 2007 shelf-registration document 88
SLIB (5) IT services FC 67 67 100 100 France VITALIA VIE Life insurance FC 100 100 100 100 France OTHER ACTIVITIES
DIRECT SUBSIDIARIES
EDVAL C INVESTMENTS Ltd
Defeasance entity for country credit risk
FC 100 100 100 100 Great Britain
FONCIERE KUPKA (4) Property investments
0 0 100 100 France
NATEXIS AMBS COMPANY LLC (1)
Issue of preferential shares
FC 100 0 100 0 United States
NATEXIS BANQUES POPULAIRES INVEST
UCITS FC 100 100 100 100 France
NATEXIS BANQUES POPULAIRES PREFERRED CAPITAL I LLC (1)
Issue of preferential shares
FC 100 0 100 0 United States
NATEXIS BANQUES POPULAIRES PREFERRED CAPITAL II (1)
Issue of preferential shares
FC 100 0 100 0 United States
NATEXIS BANQUES POPULAIRES PREFERRED CAPITAL III (1)
Issue of preferential shares
FC 100 0 100 0 United States
NATEXIS FUNDING USA LLC
Refinancing business
FC 100 100 100 100 United States
NATINIUM FINANCIAL PRODUCTS (1)
Securitisation vehicle
FC 100 100 100 100 France
NATIXIS Holding company
FC 100 100 100 100 France
NATIXIS ALTAIR (Ex NATEXIS ALTAIR) * (10)
IT services 0 0 100 100 France
NATIXIS ALTAIR IT SHARE SERVICES (2)
IT services FC 100 100 0 0 France
NXBP1 Holding company
FC 100 100 100 100 France
S.C.I. ALTAIR 1 Property operations
FC 100 100 100 100 France
S.C.I. ALTAIR 2 Property operations
FC 100 100 100 100 France
S.C.I. VALMY COUPOLE
Property operations
FC 100 100 100 100 France
SPAFICA (1) Property investment
FC 100 100 100 100 France
WORLEDGE A INVESTMENTS Ltd
“Sale option” entity for country credit risk
FC 100 100 100 100 Great Britain
BRANCHES
COFACE SVERIGE (FORMERLY-AKC NORDEN) - SUCC
Insurance FC 100 100 100 100 Germany
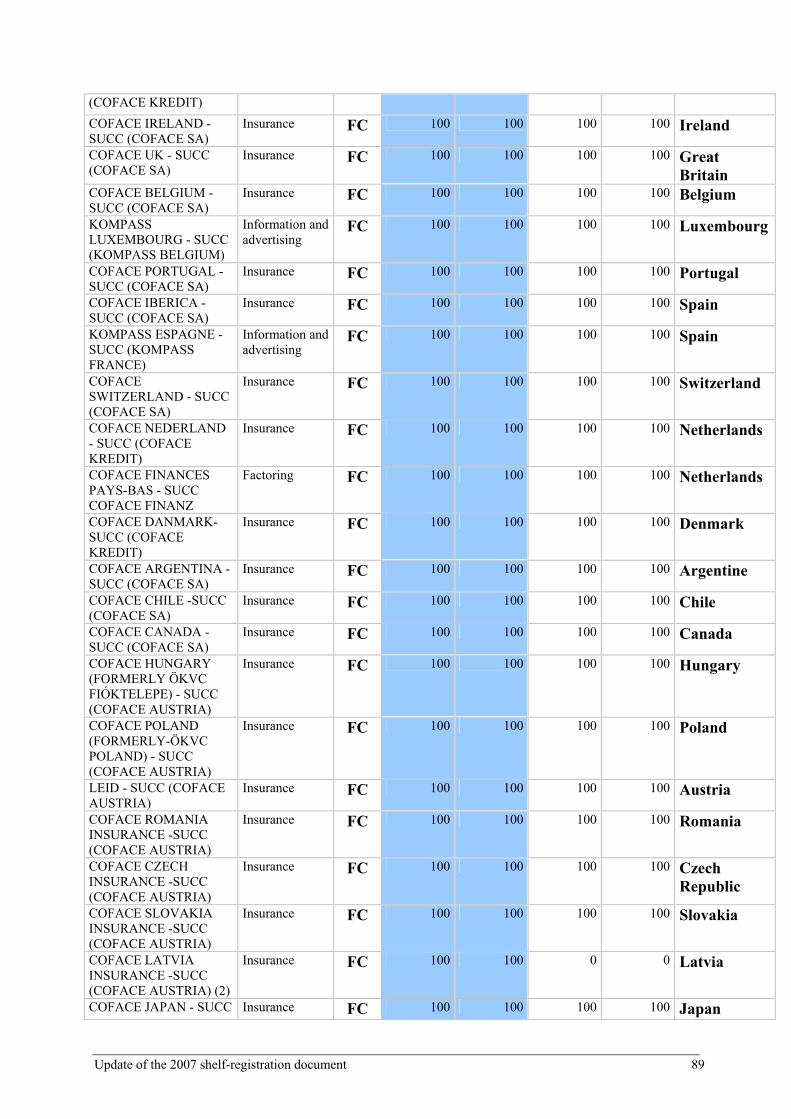
Update of the 2007 shelf-registration document 89
(COFACE KREDIT)
COFACE IRELAND - SUCC (COFACE SA)
Insurance FC 100 100 100 100 Ireland
COFACE UK - SUCC (COFACE SA)
Insurance FC 100 100 100 100 Great Britain
COFACE BELGIUM - SUCC (COFACE SA)
Insurance FC 100 100 100 100 Belgium
KOMPASS LUXEMBOURG - SUCC (KOMPASS BELGIUM)
Information and advertising
FC 100 100 100 100 Luxembourg
COFACE PORTUGAL - SUCC (COFACE SA)
Insurance FC 100 100 100 100 Portugal
COFACE IBERICA -SUCC (COFACE SA)
Insurance FC 100 100 100 100 Spain
KOMPASS ESPAGNE - SUCC (KOMPASS FRANCE)
Information and advertising
FC 100 100 100 100 Spain
COFACE SWITZERLAND - SUCC (COFACE SA)
Insurance FC 100 100 100 100 Switzerland
COFACE NEDERLAND - SUCC (COFACE KREDIT)
Insurance FC 100 100 100 100 Netherlands
COFACE FINANCES PAYS-BAS - SUCC COFACE FINANZ
Factoring FC 100 100 100 100 Netherlands
COFACE DANMARK-SUCC (COFACE KREDIT)
Insurance FC 100 100 100 100 Denmark
COFACE ARGENTINA -SUCC (COFACE SA)
Insurance FC 100 100 100 100 Argentine
COFACE CHILE -SUCC (COFACE SA)
Insurance FC 100 100 100 100 Chile
COFACE CANADA - SUCC (COFACE SA)
Insurance FC 100 100 100 100 Canada
COFACE HUNGARY (FORMERLY ÖKVC FIÓKTELEPE) - SUCC (COFACE AUSTRIA)
Insurance FC 100 100 100 100 Hungary
COFACE POLAND (FORMERLY-ÖKVC POLAND) - SUCC (COFACE AUSTRIA)
Insurance FC 100 100 100 100 Poland
LEID - SUCC (COFACE AUSTRIA)
Insurance FC 100 100 100 100 Austria
COFACE ROMANIA INSURANCE -SUCC (COFACE AUSTRIA)
Insurance FC 100 100 100 100 Romania
COFACE CZECH INSURANCE -SUCC (COFACE AUSTRIA)
Insurance FC 100 100 100 100 Czech Republic
COFACE SLOVAKIA INSURANCE -SUCC (COFACE AUSTRIA)
Insurance FC 100 100 100 100 Slovakia
COFACE LATVIA INSURANCE -SUCC (COFACE AUSTRIA) (2)
Insurance FC 100 100 0 0 Latvia
COFACE JAPAN - SUCC Insurance FC 100 100 100 100 Japan
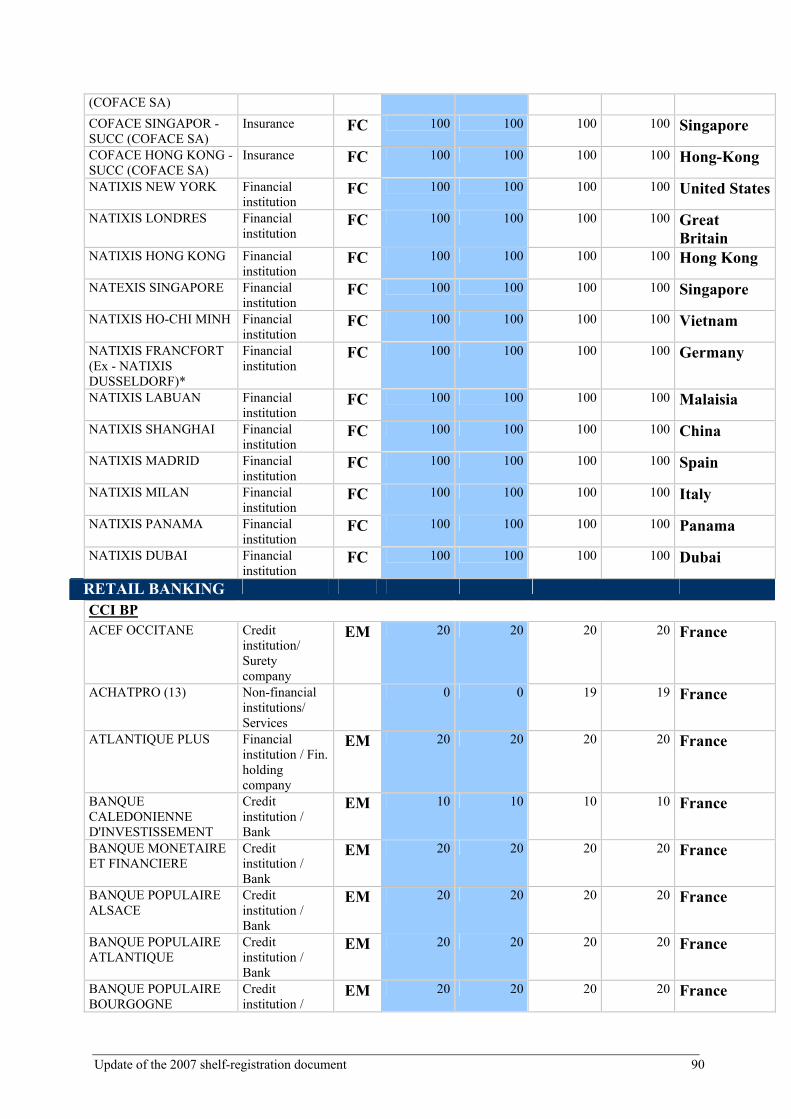
Update of the 2007 shelf-registration document 90
(COFACE SA)
COFACE SINGAPOR -SUCC (COFACE SA)
Insurance FC 100 100 100 100 Singapore
COFACE HONG KONG -SUCC (COFACE SA)
Insurance FC 100 100 100 100 Hong-Kong
NATIXIS NEW YORK Financial institution
FC 100 100 100 100 United States
NATIXIS LONDRES Financial institution
FC 100 100 100 100 Great Britain
NATIXIS HONG KONG Financial institution
FC 100 100 100 100 Hong Kong
NATEXIS SINGAPORE Financial institution
FC 100 100 100 100 Singapore
NATIXIS HO-CHI MINH Financial institution
FC 100 100 100 100 Vietnam
NATIXIS FRANCFORT (Ex - NATIXIS DUSSELDORF)*
Financial institution
FC 100 100 100 100 Germany
NATIXIS LABUAN Financial institution
FC 100 100 100 100 Malaisia
NATIXIS SHANGHAI Financial institution
FC 100 100 100 100 China
NATIXIS MADRID Financial institution
FC 100 100 100 100 Spain
NATIXIS MILAN Financial institution
FC 100 100 100 100 Italy
NATIXIS PANAMA Financial institution
FC 100 100 100 100 Panama
NATIXIS DUBAI Financial institution
FC 100 100 100 100 Dubai
RETAIL BANKING
CCI BP
ACEF OCCITANE Credit institution/ Surety company
EM 20 20 20 20 France
ACHATPRO (13) Non-financial institutions/ Services
0 0 19 19 France
ATLANTIQUE PLUS Financial institution / Fin. holding company
EM 20 20 20 20 France
BANQUE CALEDONIENNE D'INVESTISSEMENT
Credit institution / Bank
EM 10 10 10 10 France
BANQUE MONETAIRE ET FINANCIERE
Credit institution / Bank
EM 20 20 20 20 France
BANQUE POPULAIRE ALSACE
Credit institution / Bank
EM 20 20 20 20 France
BANQUE POPULAIRE ATLANTIQUE
Credit institution / Bank
EM 20 20 20 20 France
BANQUE POPULAIRE BOURGOGNE
Credit institution /
EM 20 20 20 20 France

Update of the 2007 shelf-registration document 91
FRANCHE-COMTE Bank
BANQUE POPULAIRE CENTRE ATLANTIQUE
Credit institution / Bank
EM 20 20 20 20 France
BANQUE POPULAIRE DE LA COTE D'AZUR
Credit institution / Bank
EM 20 20 20 20 France
BANQUE POPULAIRE DE LOIRE ET LYONNAIS
Credit institution / Bank
EM 20 20 20 20 France
BANQUE POPULAIRE DE L'OUEST
Credit institution / Bank
EM 20 20 20 20 France
BANQUE POPULAIRE DES ALPES
Credit institution / Bank
EM 20 20 20 20 France
BANQUE POPULAIRE DU MASSIF CENTRAL
Credit institution / Bank
EM 20 20 20 20 France
BANQUE POPULAIRE DU NORD
Credit institution / Bank
EM 20 20 20 20 France
BANQUE POPULAIRE DU SUD
Credit institution / Bank
EM 20 20 20 20 France
BANQUE POPULAIRE DU SUD-OUEST
Credit institution / Bank
EM 20 20 20 20 France
BANQUE POPULAIRE LORRAINE CHAMPAGNE
Credit institution / Bank
EM 20 20 20 20 France
BANQUE POPULAIRE OCCITANE
Credit institution / Bank
EM 20 20 20 20 France
BANQUE POPULAIRE PROVENCALE ET CORSE
Credit institution / Bank
EM 20 20 20 20 France
BANQUE POPULAIRE RIVES DE PARIS
Credit institution / Bank
EM 20 20 20 20 France
BANQUE POPULAIRE VAL DE FRANCE
Credit institution / Bank
EM 20 20 20 20 France
BATILEASE Etablissement de crédit / Banque
EM 19 19 19 19 France
BATINOREST-BAIL Credit institution / Bank
EM 20 19 20 19 France
BTP CAPITAL CONSEIL (2)
Non-financial institution/ Venture capital
EM 20 20 0 0 France
BCI MER ROUGE Credit institution / Bank
EM 10 10 10 10 France
BDG SCI (7) Non-financial institution / property
0 0 20 20 France
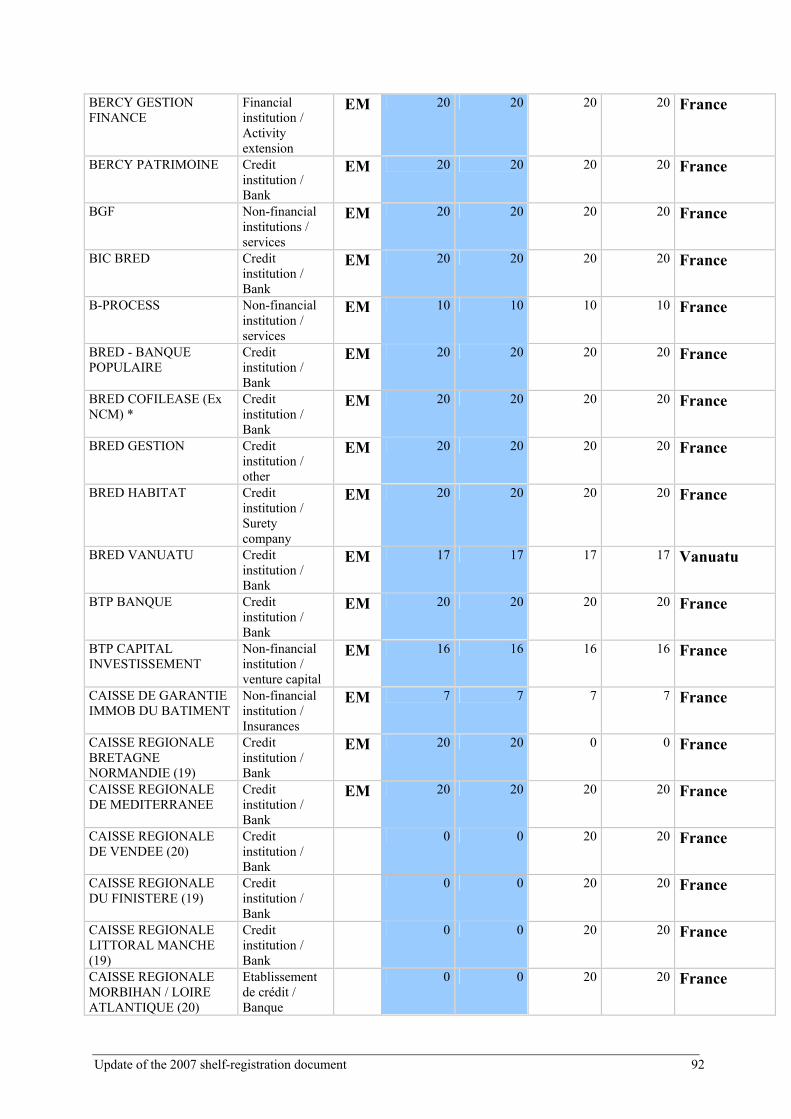
Update of the 2007 shelf-registration document 92
BERCY GESTION FINANCE
Financial institution / Activity extension
EM 20 20 20 20 France
BERCY PATRIMOINE Credit institution / Bank
EM 20 20 20 20 France
BGF Non-financial institutions / services
EM 20 20 20 20 France
BIC BRED Credit institution / Bank
EM 20 20 20 20 France
B-PROCESS Non-financial institution / services
EM 10 10 10 10 France
BRED - BANQUE POPULAIRE
Credit institution / Bank
EM 20 20 20 20 France
BRED COFILEASE (Ex NCM) *
Credit institution / Bank
EM 20 20 20 20 France
BRED GESTION Credit institution / other
EM 20 20 20 20 France
BRED HABITAT Credit institution / Surety company
EM 20 20 20 20 France
BRED VANUATU Credit institution / Bank
EM 17 17 17 17 Vanuatu
BTP BANQUE Credit institution / Bank
EM 20 20 20 20 France
BTP CAPITAL INVESTISSEMENT
Non-financial institution / venture capital
EM 16 16 16 16 France
CAISSE DE GARANTIE IMMOB DU BATIMENT
Non-financial institution / Insurances
EM 7 7 7 7 France
CAISSE REGIONALE BRETAGNE NORMANDIE (19)
Credit institution / Bank
EM 20 20 0 0 France
CAISSE REGIONALE DE MEDITERRANEE
Credit institution / Bank
EM 20 20 20 20 France
CAISSE REGIONALE DE VENDEE (20)
Credit institution / Bank
0 0 20 20 France
CAISSE REGIONALE DU FINISTERE (19)
Credit institution / Bank
0 0 20 20 France
CAISSE REGIONALE LITTORAL MANCHE (19)
Credit institution / Bank
0 0 20 20 France
CAISSE REGIONALE MORBIHAN / LOIRE ATLANTIQUE (20)
Etablissement de crédit / Banque
0 0 20 20 France

Update of the 2007 shelf-registration document 93
CAISSE REGIONALE REGION NORD
Credit institution / Bank
EM 20 20 20 20 France
CAISSE REGIONALE SUD OUEST
Credit institution / Bank
EM 20 20 20 20 France
CAISSE SOLIDAIRE Credit institution / Bank
EM 20 12 20 12 France
CAPI COURT TERME N°1
Financial institution / intermediation
EM 20 20 20 20 France
CASDEN - BANQUE POPULAIRE
Credit institution / Bank
EM 20 20 20 20 France
CLICK AND TRUST Non-financial institution / services
EM 20 20 20 20 France
CMGM Credit institution / Bank
EM 20 1 20 1 France
COFEG Financial institution / activity extension
EM 20 20 20 20 France
COFIBRED Financial institution / Fin. holding company
EM 20 20 20 20 France
CREDIT COOPERATIF Credit institution / Bank
EM 20 20 20 20 France
CREDIT MARITIME ATLANTIQUE (20)
Credit institution / Bank
EM 20 20 0 0 France
CREDIT MARITIME OUTRE MER
Credit institution / Bank
EM 20 20 20 20 France
CREPONORD Non-financial institution / property
EM 20 20 20 20 France
DE PORTZAMPARC Financial institution / other activities
EM 20 14 20 14 France
ECOFI INVESTISSEMENT
Financial institution / Management company
EM 20 20 20 20 France
EDEL Credit institution / Bank
EM 20 7 20 7 France
ESFIN Financial institution / activity extension
EM 8 8 8 8 France
EURO CAPITAL (2) Financial institution / other activities
EM 20 14 0 0 France
EXPANDE INVEST Non-financial EM 20 20 20 20 France

Update of the 2007 shelf-registration document 94
institution / services
FCC AMAREN II Credit institution / other
EM 20 20 20 20 France
FCC CRISTALYS Credit institution / other
EM 20 20 20 20 France
FCC ELIDE Credit institution / other
EM 20 20 20 20 France
FINANCIERE DE LA BP OCCITANE
Credit institution / Bank
EM 20 20 20 20 France
FINANCIERE PARTICIPATION BPS
Credit institution / Bank
EM 20 20 20 20 France
FIPROMER (21) Credit institution / Bank
EM 20 20 0 0 France
FONCIERE DU VANUATU
Credit institution / other
EM 20 20 20 20 Vanuatu
FONCIERE VICTOR HUGO
Financial institution / activity extension
EM 20 20 20 20 France
FOREST MASSIF CENTRAL
Credit institution / Surety company
EM 20 20 20 20 France
FORESTIERS LORRAINE
Credit institution / Surety company
EM 20 20 20 20 France
GARIBALDI CAPITAL DEVELOPPEMENT
Non-financial institution / other
EM 20 20 20 20 France
GEDEX DISTRIBUTION Credit institution / Bank
EM 20 0 20 0 France
GIE USC Non-financial institution / other
EM 20 20 20 20 France
GROUPEMENT DE FAIT
Non-financial instution / other
EM 20 20 20 20 France
HABITAT RIVES DE PARIS
Credit institution / Surety company
EM 20 20 20 20 France
INGENIERIE ET DEVELOPPEMENT
Credit institution / Bank
EM 20 20 20 20 France
IBP INVESTISSEMENT (ex - IBP Développement)
Credit institution / Bank
EM 20 20 20 20 France
INTERCOOP Credit institution / Financial
EM 20 20 20 20 France

Update of the 2007 shelf-registration document 95
leasing of property
I2F NC (21) Credit institution / Bank
EM 20 20 0 0 Nouvelle Calédonie
IFC PF (21) Credit institution / Bank
EM 20 20 0 0 France
L F I Financial institution / Activity extension
EM 20 20 20 20 France
LFI4 Financial institution / other activities
EM 20 20 20 20 France
LUDOVIC DE BESSE Credit institution / Bank
EM 20 20 20 20 France
LUX EQUIP BAIL Credit institution / Financial leasing of property
EM 18 18 18 18 Luxembourg
MONE+CC2 (7) Financial institution / intermediation
0 0 20 20 France
MONINFO Credit institution / Bank
EM 20 7 20 7 France
NJR INVEST Financial institution
EM 20 20 20 20 France
NORD FINANCEMENT Credit institution / Bank
EM 20 0 20 0 France
PARNASSE FINANCES Financial institution / activity extension
EM 20 20 20 20 France
PARNASSIENNE DE CREDIT (22)
Credit institution / other
0 0 18 18 France
PARTICIPATIONS BPSO
Credit institution / Bank
EM 20 20 20 20 France
PLUSEXPANSION Credit institution / Bank
EM 20 20 20 20 France
PREPAR COURTAGE (Ex BERPA) *
Financial institution / other activities
EM 20 20 20 20 France
PREPAR-IARD Non-financial institution / Insurance
EM 20 20 20 20 France
PREPAR-VIE Non-financial institution / Insurance
EM 20 20 20 20 France
PROMEPAR Financial institution / management
EM 20 20 20 20 France

Update of the 2007 shelf-registration document 96
company
SAS BP CREATION (23) Financial institution / activity extension
EM 20 20 0 0 France
SAS PERSPECTIVES ET PARTICIPATIONS
Financial institution / activity extension
EM 20 20 20 20 France
SAS SOCIETARIAT BP LORRAINE CHAMPAGNE
Credit institution / Bank
EM 20 20 20 20 France
SAVOISIENNE Credit institution / Bank
EM 20 20 20 20 France
SBE (Formerly SOGEFIP) *
Spec. Credit/Financing Insitution
EM 20 20 20 20 France
SCI BPSO Non-financial institution / property
EM 20 20 20 20 France
SCI du CREDIT COOPERATIF
Non-financial institution / property
EM 20 20 20 20 France
SCI FAIDHERBE Non-financial institution / property
EM 20 20 20 20 France
SCI SAINT-DENIS Non-financial institution / property
EM 20 20 20 20 France
SEGIMLOR Non-financial institution / other
EM 20 20 20 20 France
SGTI Financial institution / activity extension
EM 20 20 20 20 France
SICOMI COOP Credit instituion / Financial leasing of property
EM 14 14 14 14 France
SIMC Credit institution / Bank
EM 20 20 20 20 France
SMI Industrial and commercial company
EM 20 20 20 20 France
SOCACEF BAS RHIN Credit institution / Surety company
EM 20 20 20 20 France
SOCACEF MASSIF CENTRAL
Credit institution / Surety company
EM 20 20 20 20 France
SOCACEF NORD Credit institution / Surety
EM 20 20 20 20 France

Update of the 2007 shelf-registration document 97
company
SOCAMA ARIEGE Credit institution / Surety company
EM 20 20 20 20 France
SOCAMA ATLANTIQUE
Credit institution / Surety company
EM 20 20 20 20 France
SOCAMA AUDE Credit institution / Surety company
EM 20 20 20 20 France
SOCAMA BAS RHIN Credit institution / Surety company
EM 20 20 20 20 France
SOCAMA BOUCHES DU RHONE
Credit institution / Surety company
EM 20 20 20 20 France
SOCAMA BOURGOGNE FRANCHE COMTE
Credit institution / Surety company
EM 20 20 20 20 France
SOCAMA BRED IDF Credit institution / Surety company
EM 20 20 20 20 France
SOCAMA CENTRE ATLANTIQUE
Credit institution / Surety company
EM 20 20 20 20 France
SOCAMA CHAMPAGNE
Credit institution / Surety company
EM 20 20 20 20 France
SOCAMA CORSE Credit institution / Surety company
EM 20 20 20 20 France
SOCAMA COTE D'AZUR
Credit institution / Surety company
EM 20 20 20 20 France
SOCAMA DES ALPES Credit institution / Surety company
EM 20 20 20 20 France
SOCAMA DU MIDI Credit institution / Surety company
EM 20 20 20 20 France
SOCAMA HAUT RHIN Credit institution / Surety company
EM 20 20 20 20 France
SOCAMA HAUTE GARONNE
Credit institution / Surety
EM 20 20 20 20 France

Update of the 2007 shelf-registration document 98
company
SOCAMA LOIRE ET LYONNAIS
Credit institution / Surety company
EM 20 20 20 20 France
SOCAMA LORRAINE Credit institution / Surety company
EM 20 20 20 20 France
SOCAMA MASSIF CENTRAL
Credit institution / Surety company
EM 20 20 20 20 France
SOCAMA MIDI PYRENEES OUEST
Credit institution / Surety company
EM 20 20 20 20 France
SOCAMA NORD Credit institution / Surety company
EM 20 20 20 20 France
SOCAMA NORMANDIE Credit institution / Surety company
EM 20 20 20 20 France
SOCAMA OCCITANE Credit institution / Surety company
EM 20 20 20 20 France
SOCAMA OUEST Credit institution / Surety company
EM 20 20 20 20 France
SOCAMA RIVES DE PARIS
Credit institution / Surety company
EM 20 20 20 20 France
SOCAMA ROUSSILLON Credit institution / Surety company
EM 20 20 20 20 France
SOCAMA SUD OUEST Credit institution / Surety company
EM 20 20 20 20 France
SOCAMA VAL DE FRANCE
Credit institution / Surety company
EM 20 20 20 20 France
SOCAMA VAUCLUSE Credit institution / Surety company
EM 20 20 20 20 France
SOCAMI ALPES Credit institution / Surety company
EM 20 20 20 20 France
SOCAMI ALSACE Credit institution /
EM 20 20 20 20 France

Update of the 2007 shelf-registration document 99
Surety company
SOCAMI ATLANTIQUE Credit institution / Surety company
EM 20 20 20 20 France
SOCAMI AUDE ARIEGE Credit institution / Surety company
EM 20 20 20 20 France
SOCAMI BOURGOGNE FRANCHE COMTE
Credit institution / Surety company
EM 20 20 20 20 France
SOCAMI CENTRE ATLANTIQUE
Credit institution / Surety company
EM 20 20 20 20 France
SOCAMI COTE D'AZUR Credit institution / Surety company
EM 20 20 20 20 France
SOCAMI DU MIDI Credit institution / Surety company
EM 20 20 20 20 France
SOCAMI DU SUD OUEST
Credit institution / Surety company
EM 20 20 20 20 France
SOCAMI HAUTE GARONNE HABITAT
Credit institution / Surety company
EM 20 20 20 20 France
SOCAMI LOIRE ET LYONNAIS
Credit institution / Surety companyon
EM 20 20 20 20 France
SOCAMI LORRAINE CHAMPAGNE
Credit institution / Surety company
EM 20 20 20 20 France
SOCAMI MASSIF CENTRAL
Credit institution / Surety company
EM 20 20 20 20 France
SOCAMI NORD Credit institution / Surety company
EM 20 20 20 20 France
SOCAMI OCCITANE Credit institution / Surety company
EM 20 20 20 20 France
SOCAMI OUEST Credit institution / Surety company
EM 20 20 20 20 France
SOCAMI PROVENCE Credit EM 20 20 20 20 France
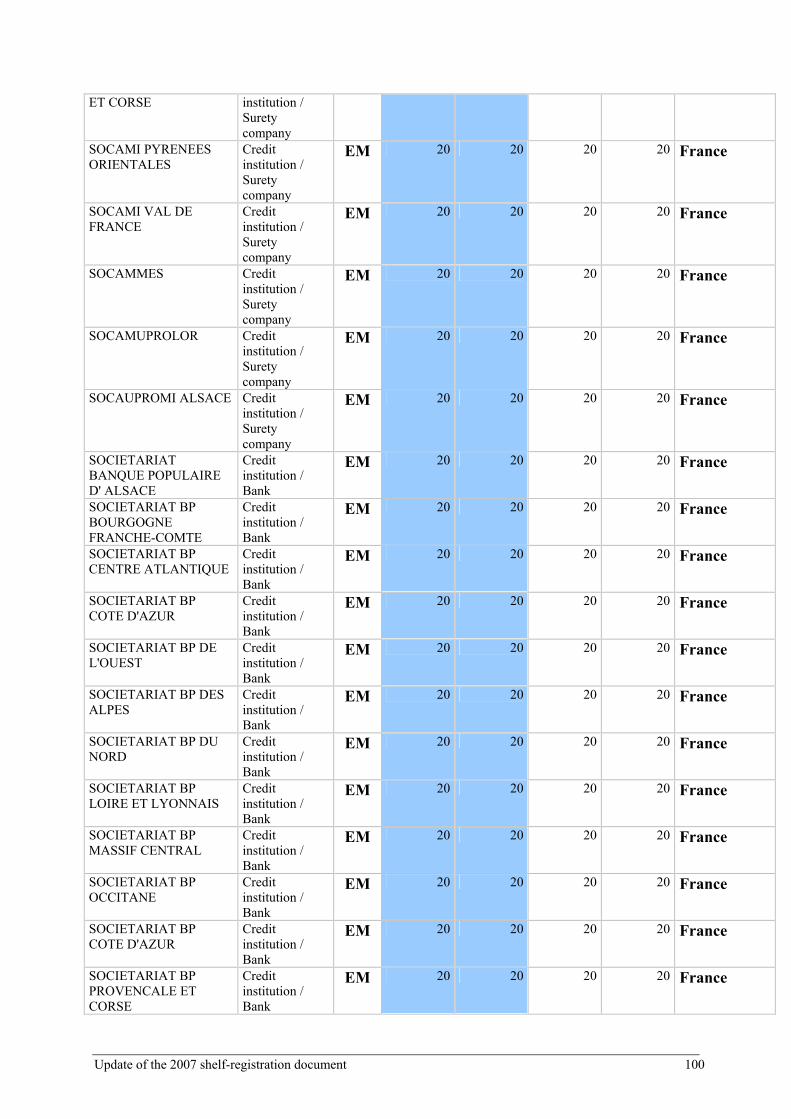
Update of the 2007 shelf-registration document 100
ET CORSE institution / Surety company
SOCAMI PYRENEES ORIENTALES
Credit institution / Surety company
EM 20 20 20 20 France
SOCAMI VAL DE FRANCE
Credit institution / Surety company
EM 20 20 20 20 France
SOCAMMES Credit institution / Surety company
EM 20 20 20 20 France
SOCAMUPROLOR Credit institution / Surety company
EM 20 20 20 20 France
SOCAUPROMI ALSACE Credit institution / Surety company
EM 20 20 20 20 France
SOCIETARIAT BANQUE POPULAIRE D' ALSACE
Credit institution / Bank
EM 20 20 20 20 France
SOCIETARIAT BP BOURGOGNE FRANCHE-COMTE
Credit institution / Bank
EM 20 20 20 20 France
SOCIETARIAT BP CENTRE ATLANTIQUE
Credit institution / Bank
EM 20 20 20 20 France
SOCIETARIAT BP COTE D'AZUR
Credit institution / Bank
EM 20 20 20 20 France
SOCIETARIAT BP DE L'OUEST
Credit institution / Bank
EM 20 20 20 20 France
SOCIETARIAT BP DES ALPES
Credit institution / Bank
EM 20 20 20 20 France
SOCIETARIAT BP DU NORD
Credit institution / Bank
EM 20 20 20 20 France
SOCIETARIAT BP LOIRE ET LYONNAIS
Credit institution / Bank
EM 20 20 20 20 France
SOCIETARIAT BP MASSIF CENTRAL
Credit institution / Bank
EM 20 20 20 20 France
SOCIETARIAT BP OCCITANE
Credit institution / Bank
EM 20 20 20 20 France
SOCIETARIAT BP COTE D'AZUR
Credit institution / Bank
EM 20 20 20 20 France
SOCIETARIAT BP PROVENCALE ET CORSE
Credit institution / Bank
EM 20 20 20 20 France
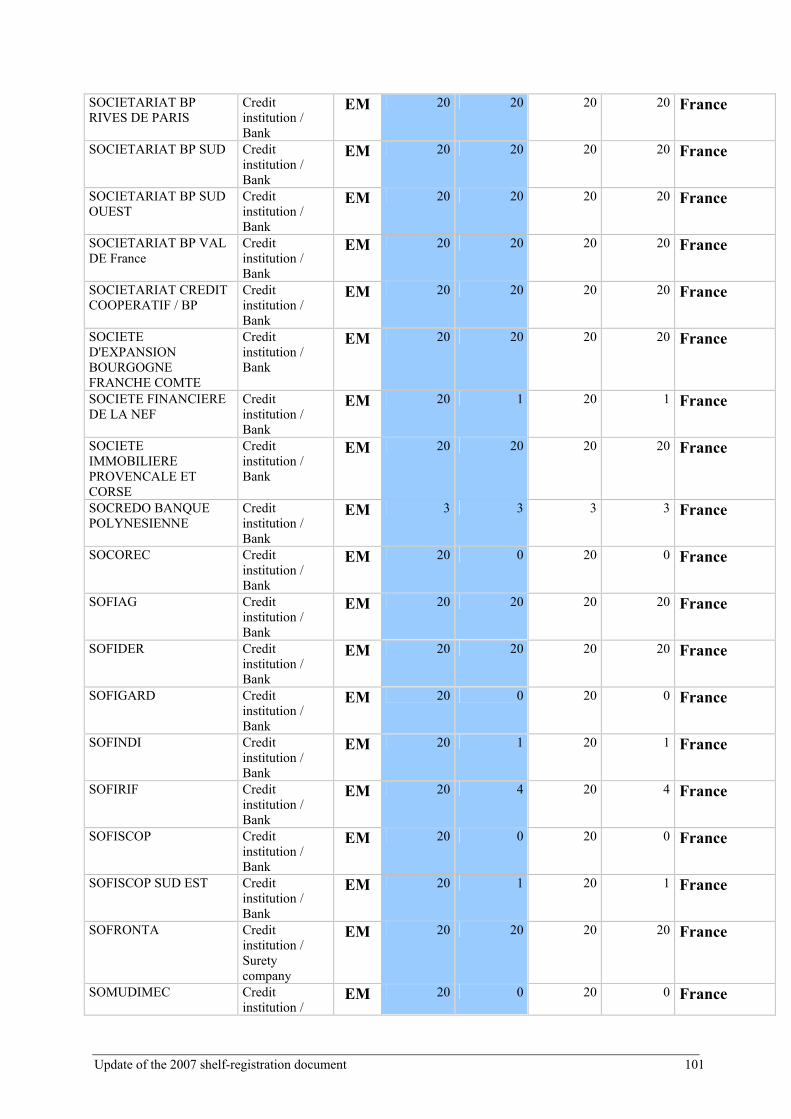
Update of the 2007 shelf-registration document 101
SOCIETARIAT BP RIVES DE PARIS
Credit institution / Bank
EM 20 20 20 20 France
SOCIETARIAT BP SUD Credit institution / Bank
EM 20 20 20 20 France
SOCIETARIAT BP SUD OUEST
Credit institution / Bank
EM 20 20 20 20 France
SOCIETARIAT BP VAL DE France
Credit institution / Bank
EM 20 20 20 20 France
SOCIETARIAT CREDIT COOPERATIF / BP
Credit institution / Bank
EM 20 20 20 20 France
SOCIETE D'EXPANSION BOURGOGNE FRANCHE COMTE
Credit institution / Bank
EM 20 20 20 20 France
SOCIETE FINANCIERE DE LA NEF
Credit institution / Bank
EM 20 1 20 1 France
SOCIETE IMMOBILIERE PROVENCALE ET CORSE
Credit institution / Bank
EM 20 20 20 20 France
SOCREDO BANQUE POLYNESIENNE
Credit institution / Bank
EM 3 3 3 3 France
SOCOREC Credit institution / Bank
EM 20 0 20 0 France
SOFIAG Credit institution / Bank
EM 20 20 20 20 France
SOFIDER Credit institution / Bank
EM 20 20 20 20 France
SOFIGARD Credit institution / Bank
EM 20 0 20 0 France
SOFINDI Credit institution / Bank
EM 20 1 20 1 France
SOFIRIF Credit institution / Bank
EM 20 4 20 4 France
SOFISCOP Credit institution / Bank
EM 20 0 20 0 France
SOFISCOP SUD EST Credit institution / Bank
EM 20 1 20 1 France
SOFRONTA Credit institution / Surety company
EM 20 20 20 20 France
SOMUDIMEC Credit institution /
EM 20 0 20 0 France

Update of the 2007 shelf-registration document 102
Bank
SOMUPACA Credit institution / Bank
EM 20 0 20 0 France
SOPROLIB DES ALPES Credit institution / Surety company
EM 20 20 20 20 France
SOPROLIB FRANCHE COMTE
Credit institution / Surety company
EM 20 20 20 20 France
SOPROLIB LORRAINE Credit institution / Surety company
EM 20 20 20 20 France
SOPROLIB NORD Credit institution / Surety company
EM 20 20 20 20 France
SOPROLIB SUD OUEST Credit institution / Surety company
EM 20 20 20 20 France
SPGRES Credit institution / Bank
EM 20 20 20 20 France
SPIG Financial institution / activity extension
EM 20 20 20 20 France
SUD PARTICIPATION Credit institution / Bank
EM 20 20 20 20 France
TRANSIMMO Non-financial institution / property
EM 20 20 20 20 France
TRUST AND PAY (24) Non-financial institution / services
0 0 9 13 France
VECTEUR Non-financial institution / venture capital
EM 20 20 20 20 France
VIALINK Non-financial institution / services
EM 20 20 20 20 France
CCI CEP
CAISSE D'EPARGNE AQUITAINE POITOU-CHARENTES
Financial and credit institution
EM 20 20 20 20 France
CAISSE D'EPARGNE COTE D'AZUR
Financial and credit institution
EM 20 20 20 20 France
CAISSE D'EPARGNE ALSACE
Financial and credit institutions
EM 20 20 20 20 France
CAISSE D'EPARGNE D'AUVERGNE ET DU
Financial and credit
EM 20 20 20 20 France

Update of the 2007 shelf-registration document 103
LIMOUSIN institution
CAISSE D'EPARGNE NORMANDIE (ex - Caisse d'épargne de Basse-Normandie) (16)*
Financial and credit institution
EM 20 20 20 20 France
CAISSE D'EPARGNE DE BOURGOGNE FRANCHE-COMTE
Financial and credit institution
EM 20 20 20 20 France
CAISSE D'EPARGNE DE BRETAGNE (17)
Financial and credit institution
0 0 20 20 France
CAISSE D'EPARGNE DE HAUTE NORMANDIE (16)
Financial and credit institution
0 0 20 20 France
CAISSE D'EPARGNE LORRAINE CHAMPAGNE-ARDENNE
Financial and credit institution
EM 20 20 20 20 France
CAISSE D'EPARGNE DE MIDI-PYRENEES
Financial and credit institution
EM 20 20 20 20 France
CAISSE D'EPARGNE DE PICARDIE
Financial and credit institution
EM 20 20 20 20 France
CAISSE D'EPARGNE BRETAGNE- PAYS DE LA LOIRE (ex - Caisse d'épargne des Pays de la Loire)*(17)
Financial and credit institution
EM 20 20 20 20 France
CAISSE D'EPARGNE ILE DE FRANCE-NORD (18)
Financial and credit institution
0 0 20 20 France
CAISSE D'EPARGNE ILE DE FRANCE-OUEST (18)
Financial and credit institution
0 0 20 20 France
CAISSE D'EPARGNE ILE DE France (formerly - Caisse d'épargne Ile de France Paris)*(18)
Financial and credit institution
EM 20 20 20 20 France
CAISSE D'EPARGNE LANGUEDOC-ROUSSILLON
Financial and credit institution
EM 20 20 20 20 France
CAISSE D'EPARGNE LOIRE-CENTRE
Financial and credit institution
EM 20 20 20 20 France
CAISSE D'EPARGNE LOIRE DROME ARDECHE
Financial and credit institution
EM 20 20 20 20 France
CAISSE D'EPARGNE NORD FRANCE EUROPE
Financial and credit institution
EM 20 20 20 20 France
CAISSE D'EPARGNE PROVENCE-ALPES-CORSE
Financial and credit institution
EM 20 20 20 20 France
CAISSE D'EPARGNE RHONE ALPES
Financial and credit institution
EM 20 20 20 20 France
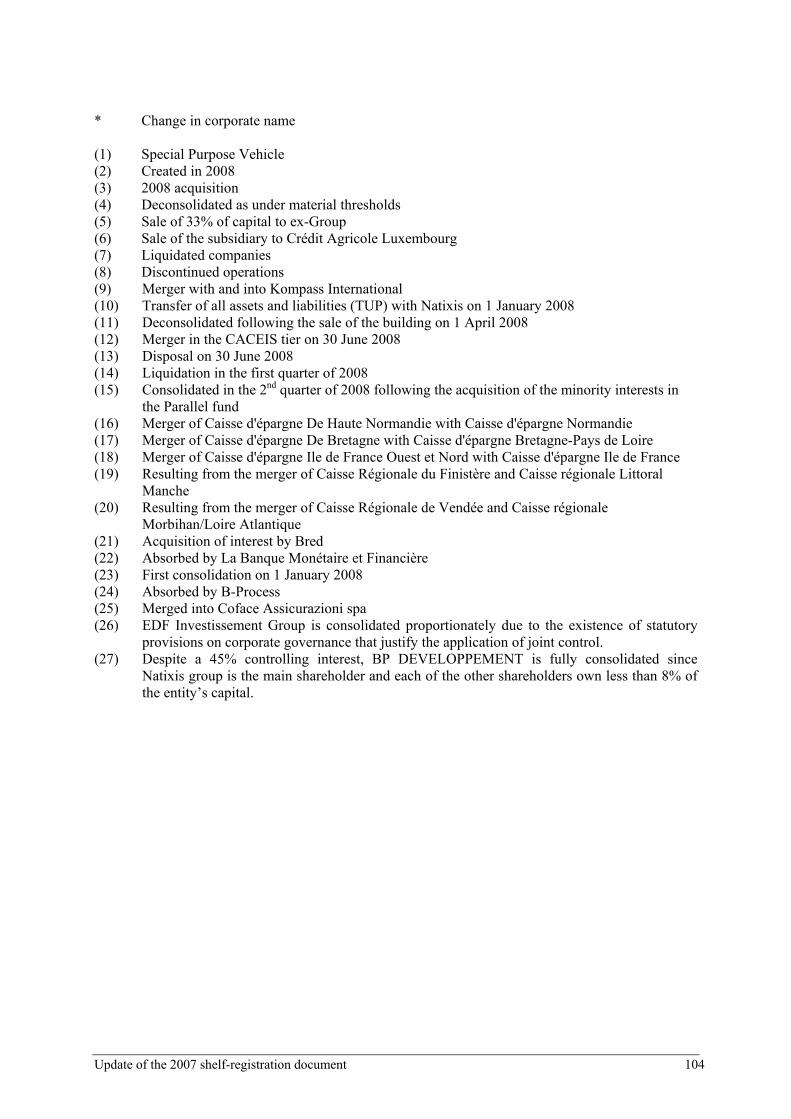
Update of the 2007 shelf-registration document 104
* Change in corporate name (1) Special Purpose Vehicle (2) Created in 2008 (3) 2008 acquisition (4) Deconsolidated as under material thresholds (5) Sale of 33% of capital to ex-Group (6) Sale of the subsidiary to Crédit Agricole Luxembourg (7) Liquidated companies (8) Discontinued operations (9) Merger with and into Kompass International (10) Transfer of all assets and liabilities (TUP) with Natixis on 1 January 2008 (11) Deconsolidated following the sale of the building on 1 April 2008 (12) Merger in the CACEIS tier on 30 June 2008 (13) Disposal on 30 June 2008 (14) Liquidation in the first quarter of 2008 (15) Consolidated in the 2nd quarter of 2008 following the acquisition of the minority interests in
the Parallel fund (16) Merger of Caisse d'épargne De Haute Normandie with Caisse d'épargne Normandie (17) Merger of Caisse d'épargne De Bretagne with Caisse d'épargne Bretagne-Pays de Loire (18) Merger of Caisse d'épargne Ile de France Ouest et Nord with Caisse d'épargne Ile de France (19) Resulting from the merger of Caisse Régionale du Finistère and Caisse régionale Littoral
Manche (20) Resulting from the merger of Caisse Régionale de Vendée and Caisse régionale
Morbihan/Loire Atlantique (21) Acquisition of interest by Bred (22) Absorbed by La Banque Monétaire et Financière (23) First consolidation on 1 January 2008 (24) Absorbed by B-Process (25) Merged into Coface Assicurazioni spa (26) EDF Investissement Group is consolidated proportionately due to the existence of statutory
provisions on corporate governance that justify the application of joint control. (27) Despite a 45% controlling interest, BP DEVELOPPEMENT is fully consolidated since
Natixis group is the main shareholder and each of the other shareholders own less than 8% of the entity’s capital.

Update of the 2007 shelf-registration document 105
Note 5. Impact of the financial crisis on the financial statements 5.1 Subprime risk exposures on the Natixis balance sheet at 30 June 2008 Natixis is exposed to subprime risk either directly or indirectly: • Direct exposure: The pending-securitisation loan portfolio is the only direct exposure of Natixis to subprime loans. This portfolio comes under financial assets at fair value through profit or loss.
30/06/08 31/12/07 Nominal value 243 284
Book value (fair value) 150 201 Fair value as % of nominal value 62% 70%
Writedown 38% 30%
The downgrading in the portfolio’s fair value compared to its face value reflects the continued decrease in residential real estate prices in the United States. Prices are determined from transactions observed on the market and take into account the opinion of experts responsible for valuing the portfolio (i.e., Broker price opinions). • Indirect exposure: Exposure consists of: - RMBS and ABS CDO portfolios held by Natixis Capital Market North America, Natixis and
Natixis’ New York branch. Depending on the entity in question, these assets are classified as belonging to the category of assets at fair value through profit or loss or assets available for sale:
Exposure on 30/06/08 Exposure on 31/12/07
In millions of dollars Nominal Subprime component
Write down of value
Gross impact on income as
at 30/06/08
Nominal Subprime component
Write down of value
Gross impact on income as
at 31/12/07
Portfolios held Assets at fair value through profit or loss
3,676 1,905 (1,515) (791) 2,523 1,491 (625) (625)
Financial assets available for sale
842 842 (332) (115) 855 855 (217) (217)
Total 4,518 2,747 (1,847) (906) 3,378 2,346 (842) (842) In € millions 2,868 1,744 (1,172) (582)* 2,295 1,594 (572) (588) * 1 euro = 1.472 dollars on 31 December 2007 1 euro = 1.5755 dollars on 30 June 2008
(*): for unrealised capital losses on the New York portfolio, the conversion rate used is the annual average rate of €1 = $1.371 on 31 December 2007 and €1 = $1.530885 at 30 June 2008. - exposure carried through securitisation conduits:
Exposure on 30/06/08 Exposure on 12/3107
In millions of dollars Nominal value
Subprime Component
Write down of value
Gross impact on income as
at 30/06/08
Nominal value
Subprime Component
Write down of value
Gross impact on income as
at 31/12/07
Exposure on conduits and structured transactions Direct Funding Conduit 0 0 0 0 1 388 564 (201) (201) SPV and other conduits 1551 393 (376) (240) 1 467 458 (136) (136) Total 1551 393 (376) (240) 2 855 1 022 (337) (337) In € millions 984 250 (239) (153) 1 939 694 (229) (229) 1 euro = 1.472 dollars on 31 December 2007 1 euro = 1.5755 dollars on 30 June 2008

Update of the 2007 shelf-registration document 106
Assets with exposure to this risk are those with a FICO11 score under 660. The valuation of assets represented by this exposure has been established as follows: - using market prices at 30 June 2008 when available, - otherwise, in the absence of any market reference data, using a valuation model. The valuation
technique used is based on calculating an assumed rate of loss for each year in which loans were originated.
In the valuation of this exposure, the assumed loss rates were revised in terms of the one used at 31 December 2007 as follows:
. 25% for loans originated in 2006 and 2007 (compared to 23% at 31 December 2007);
. 10% for loans originated in 2005 (compared to 9% at 31 December 2007);
. 6.25% for loans originated in previous years. Moreover, given the significantly lower rating in the second quarter of some assets, and based on expected lower ratings of their final performance, the valuation model has been adjusted as follows:
. Discounting by 95% the underlying value of collateral assets rated CCC+ or less regardless of the type (residential and non-residential real estate) ;
. Valuation of non-subprime underlying assets held in the structures based on a market-comparables’ discounting grid including types, rating and vintage of the transactions.
Given the poor market conditions at 30 June 2008, adjustments of the model resulted in a significant increase in the writedowns of ABS CDO’s with a subprime component. For directly exposed RMBS collateralised with subprime components, the model was fine tuned by using individual loss levels for each structure from a formula that took into account accrued losses to maturity and defaults recorded at present. The unrealised losses are determined by projecting final losses from estimated losses to date, which in turn arise from the Delinquency Pipeline, the severity of the loss in case of default and losses already incurred and based on assets and pool vintages. Final losses thus obtained are recalibrated in the prices of ABX exchanges. 5.2 Other exposure Valuation models were used to value assets from securitisation transactions, excluding subprime exposure for which no price could be identified: - correlation model (for the CSOs); - structural scoring model (for ABS CDOs and CLOs) defining the level of risk for each entity based
on discriminating criteria calibrated using observable data at 30 June 2008; - for the CLOs, use of a model based on detailed knowledge of transaction characteristic and credit
risk taking into account stress parameters into account. For HELOCs, to take the increasing lack of liquidity into account, Natixis began using a valuation technique based on combining a AAA spread with a monoline spread. With respect to the direct exposures to CMBS, the group used the market price at 30 June 2008 in the same way as previous reporting dates. The unrealised losses recorded in this regard on 30 June 2008 amount to €113 million compared to a net exposure of €1.3 billion classified on the balance sheet mainly under “financial assets at fair value by profit or loss.” 5.3 Exposure to credit enhancers (monoline and CDPC)
11 The FICO score from Fair Isaac is a solvency rating model used by US lenders. The scale goes from 300 (for the highest risk) to 850 (for lower risk).

Update of the 2007 shelf-registration document 107
Risk for economic exposure from credit enhancers was greater due to the combined effect of their lower ratings and the higher spreads of the assets guaranteed by these companies for a total of €2.3 billion (before allowance) compared to €1.3 billion on 31 December 2007. The protections provided by the credit enhancers in the form of Credit Default Swaps were thus further written down. The writedown of the fair value of the CDSs on the basis of counterparty monoline risk represents €953 million in the first half of 2008 recorded as net banking income on the income statement under net gains or losses on financial instruments at fair value through profit or loss. The writedown was reached by using a probability of default for the CDS’s fair value that matched the monoline credit risk and a 10% recovery rate (rates justified by the fact that monolines are not highly capitalised in terms of risk exposure). An additional collective depreciation charge of €162 million was recorded, increasing the industry provision for monolines to € 300 million at as 30 June 2008. Furthermore, the general prudential provision for the Credit Derivatives Product Companies (CDPC) industry was increased with an additional €19.3 million at 30 June 2008. This provision was calculated from the gross economic exposure plus a 20% add-on to principle as well as the probability of default of similar BBB rated counterparties. The total collective provision on CDPC amounts to €53.3 million on 30 June 2008, to be compared with a base for provision of €709 million on 30 June 2008 (€358 million on 31 December 2007), with the increase attributable to the widening of the underlying credit spreads. Moreover, an allowance was recognised on a particular enhancement transaction due to the change in the quality of counterparty credit. On 30 June 2008, the allowance established represented €53 million in connection with an economic exposure of €184 million. 5.4 Individual writedowns of certain shares in SIVs An SIV (Structured Investment Vehicle) is a fund that makes highly leveraged investments in highly-rated medium- or long-term assets. To refinance themselves, SIVs issue commercial papers or medium- or long-term notes. As these issues are rated by rating agencies, SIVs must comply with liquidity ratios and adhere to thresholds linked to the valuation of their portfolios. If these thresholds are reached or exceeded, the fund must liquidate its assets. As at 30 June 2008, taking into account the observed trend in net asset values of SIV shares held by Natixis and the resulting risk of liquidation, an additional €9.7 million impairment charge was recorded against these shares in the category “Loans and advances”, amounting to an overall SIV share write down of €26.7 million as at 30 June 2008. The net amount of SIV shares is €46.3 million at 30 June 2008. 5.5 Recognition of impairment for interests held in syndicated loans intended for sale The liquidity crisis has led to delays in syndication and difficulties in placing on the secondary market that share of syndicated loans initially subscribed for the purpose of short-term resale. Asset financing and LBO’s have been the most affected. Loans outstanding for which the theoretical syndication date had expired as at 30 June 2008 totalling €771 million at 30 June 2008. These loans outstanding have been individually analyzed in order to ensure that the income statement reflects any market discounts observed at the balance sheet date. An additional discount of €39 million was recorded at 30 June 2008. The resulting change in value was recorded under Gains and losses on assets available for sale on the income statement. The writedown provision at that date was €81 million. 5.6 Writedown of interest in IKB capital Since 1993, Natixis has held a very small minority interest in German bank IKB, amounting to 2.5% of its capital. The business relationship between the two companies is essentially focused on financing

Update of the 2007 shelf-registration document 108
medium to large German companies. It does not, either directly or indirectly, concern IKB’s financing and investment activities on European and American property markets. The German bank’s financial difficulties relating to the “subprime” crisis had a negative impact on its share price. A €15.5 million impairment charge was recorded as at 31 December 2007, and an additional writedown of €7.5 million was recorded as at 30 June 2008. The €6 million net amount of these securities is recorded on the balance sheet under financial assets available for sale. 5.7 Impact of valuation of issuer spread on Natixis’ issues at fair value Valuation of issuer spread on Natixis’ issues classified as instruments valued at fair value through profit or loss (fair value option) had a €157.2 million positive impact on the income statement as at 30 June 2008. To determine this valuation, the same methodology used at 31 December 2007 was used: income from the nominal value of issues has been discounted using the net margin representing, for each issue, the difference between the average contractual spread and the replacement spread for a Natixis issue with the same rating.
Note 6. Post balance sheet events
To bring its regulatory ratios in line with those of the best capitalised European banks, Natixis announced plans to undertake a €3.7 billion capital increase with preferential subscriptions rights during September 2008. The Banque Fédérale des Banques Populaires (BFBP) and the Caisse Nationale des Caisses d’Epargne (CNCE), which together held 69.8% of its capital stock, agreed to fully exercise their subscription rights as of right and to subscribe excess shares or those not subscribed as of right by other investors. €2.5 billion of proceeds from the issue are earmarked for repayment of the shareholders’ advance given by BFBP and CNCE in the first half of 2008.
Note 7. Notes to the Balance Sheet
7.1 Financial assets and liabilities at fair value through profit or loss
These assets and liabilities are recognised at fair value at the period-end with the change in value, including coupons, as a profit or loss under net gains or losses on financial instruments at fair value. No impairment is recognised on these assets as the counterparty risk is included in the market value.
7.1.1 Financial Assets at Fair Value through profit or loss
In € millions Notes 30 June 2008 31 Dec. 2007 30 June 2007
Securities held for trading 89,002 93,822 112,902
Securities 89,002 93,822 112,902
Fixed income 69,867 73,083 80,244
Variable income 19,135 20,739 32,658
Reverse repos

Update of the 2007 shelf-registration document 109
Loans and advances related to trading activities/positions 5,536 7,964 6,264
On credit institutions 1,212 4,862 3,956
On clients 4,324 3,102 2,308
Derivative financial instruments held for trading 99,069 72,205 66,188
Securities designated at fair value 7.1.1.1 29,397 26,935 20,045
Securities 19,710 21,498 19,873
Fixed income 14,686 16,904 14,687
Variable income 5,024 4,594 5,186
Reverse repos 9,687 5,437 172
Loans and advances at fair value 7.1.1.1 1,503 2,002 2,465
On credit institutions 409 465 254
On clients 1,094 1,537 2,211
TOTAL 224,507 202,928 207,864
7.1.1.1 Conditions for classifying financial assets at fair value (fair
value option)
Financial assets are recognised at fair value through profit or loss when this choice provides more pertinent information or when these instruments have one or more significant and separate embedded derivatives. Stating at “fair value” is seen as providing more pertinent information in two situations: - in the absence of an accounting match between economically-related assets or liabilities. In particular, this is the case between an asset and a hedging derivative when the conditions for accounting for hedging are not fulfilled; - in the presence of a portfolio of financial assets and liabilities managed and recognised at fair value as part of a documented policy of assets and liabilities management.
In € millions as at 30 June 2008 Carrying amount
Carrying amount of instruments at fair value due to
an accounting mismatch of
related instruments
Carrying amount of instruments at fair
value through profit or loss and included
in a portfolio of financial managed
and recognised through profit or loss
Carrying amount of hybrid instruments stated at fair value through profit or loss because of the
presence of significant and
separate embedded derivatives
Loans and advances to credit institutions 409 409
Loans and advances to customers 1,090 5 1,079 6
Fixed income securities 14,690 10,377 3,656 657

Update of the 2007 shelf-registration document 110
Variable income securities 5,024 734 3,124 1,166
Other assets 9,687 9,687
TOTAL 30,900 11,525 17,546 1,829
7.1.2 Financial liabilities at fair value through profit or loss
In € millions Notes 30 June 2008 31 Dec. 2007 30 June 2007
Instruments at fair value held for trading 130, 206 105,084 108,682
Securities 29,558 33,406 37,213
Pledged securities 0 71
Derivative financial instruments held for trading 98,855 69,774 69,131
Other liabilities 1,793 1,904 2,267
Instruments at fair value 7.1.2.1 84,935 59,946 44,436
Securities 74,818 52,335 44,340
Pledged securities 5,734 3,380 1
Other liabilities 4,382 4,231 95
TOTAL 215,141 165,030 153,118
7.1.2.1 Conditions for classifying financial liabilities at fair value
(fair value option)
Financial liabilities are recognised at fair value through profit or loss when this choice provides more pertinent information or when these instruments have one or more significant and separate embedded derivatives. Recognition at “fair value” is seen as providing more pertinent information in two situations: - in the absence of an accounting match between economically-related assets or liabilities. In particular, recognition at fair value is used when the conditions for accounting for hedging are not fulfilled; there is then a natural offset between the changes in fair value of the instrument hedged and the fair value of the hedging derivative; - in the presence of a portfolio of financial managed assets and liabilities recognised at fair value as part of a documented policy of assets and liabilities management;
In € millions as at 30 June 2008 Carrying amount
Carrying amount of instruments at fair
value due to an accounting mismatch
of related instruments
Carrying amount of instruments at fair
value through profit or loss and included
in a portfolio of financial managed
and recognised through profit or
loss
Carrying amount of hybrid instruments stated at fair value through profit or loss because of the
presence of significant and
separate embedded derivatives
Borrowings from banks 516 516

Update of the 2007 shelf-registration document 111
Borrowings from customers 3,783 3,783
Debt in the form of securities issued 74, 818 72,485 288 2,045
Subordinated debt 83 83
Other liabilities 5,734 5,734
TOTAL 84,935 76,785 6,022 2,128
7.2 Financial assets available for sale
The table below shows Financial Assets Available for Sale by type of instrument (loans outstanding, fixed-income securities, variable-income securities). It gives the gross value before impairment, the impairment, and the net value after impairment. Assets available for sale are subject to a impairment testing at each reporting period ending date (quarterly). When there is objective indication of impairment and a reduction in fair value has previously been recognised in shareholder’s equity, the aggregate loss is removed from shareholder’s equity and recorded in profit or loss.
In € millions 30 June 2008 31 Dec. 2007 30 June 2007
Loans outstanding 365 56 43
- Loans and advances 365 56 43
- Accrued interest 0 0 0
- Other 0 0 0
Securities 35,614 35,221 34,929
- Fixed income 29,406 29,015 28,494
- Variable income 5,758 6,046 5,917
- Accrued interest 450 160 518
Total assets available for sale before impairment 35,979 35,277 34,972
Impairment of assets available for sale (727) (516) (334)
- Loans and advances 0 0 0
- Fixed income securities (234) (175) (18)
- Variable income securities (492) (341) (316)
TOTAL 35,253 34,761 34,638
7.3 Instruments recognised on the balance sheet at fair value by source or method of valuation
IAS 39 establishes a hierarchy in the method of determining fair value: - the best representation of fair value is the price quoted on an active market. A market is considered active if the prices are easily and regularly available from a stock market, a broker, a dealer, a pricing
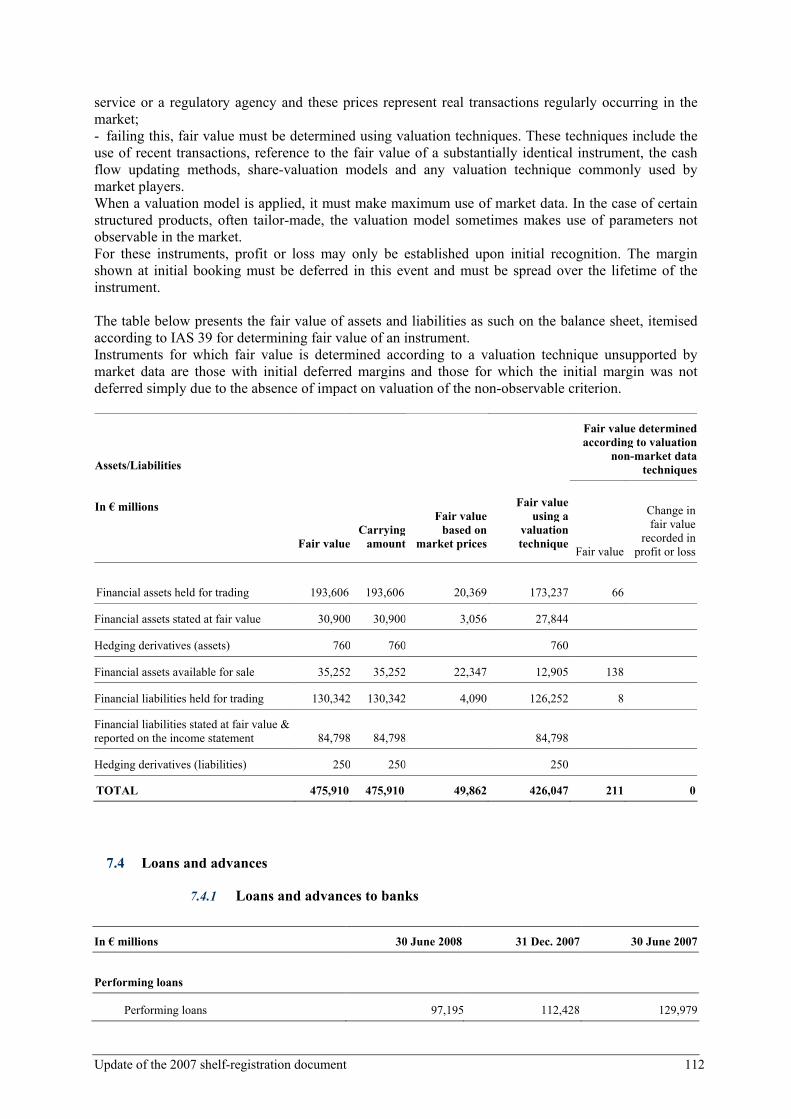
Update of the 2007 shelf-registration document 112
service or a regulatory agency and these prices represent real transactions regularly occurring in the market; - failing this, fair value must be determined using valuation techniques. These techniques include the use of recent transactions, reference to the fair value of a substantially identical instrument, the cash flow updating methods, share-valuation models and any valuation technique commonly used by market players. When a valuation model is applied, it must make maximum use of market data. In the case of certain structured products, often tailor-made, the valuation model sometimes makes use of parameters not observable in the market. For these instruments, profit or loss may only be established upon initial recognition. The margin shown at initial booking must be deferred in this event and must be spread over the lifetime of the instrument. The table below presents the fair value of assets and liabilities as such on the balance sheet, itemised according to IAS 39 for determining fair value of an instrument. Instruments for which fair value is determined according to a valuation technique unsupported by market data are those with initial deferred margins and those for which the initial margin was not deferred simply due to the absence of impact on valuation of the non-observable criterion.
Fair value determined according to valuation
non-market data techniques Assets/Liabilities
In € millions
Fair valueCarrying amount
Fair value based on
market prices
Fair value using a
valuation technique
Fair value
Change in fair value
recorded in profit or loss
Financial assets held for trading 193,606 193,606 20,369 173,237 66
Financial assets stated at fair value 30,900 30,900 3,056 27,844
Hedging derivatives (assets) 760 760 760
Financial assets available for sale 35,252 35,252 22,347 12,905 138
Financial liabilities held for trading 130,342 130,342 4,090 126,252 8
Financial liabilities stated at fair value & reported on the income statement 84,798 84,798 84,798
Hedging derivatives (liabilities) 250 250 250
TOTAL 475,910 475,910 49,862 426,047 211 0
7.4 Loans and advances
7.4.1 Loans and advances to banks
In € millions 30 June 2008 31 Dec. 2007 30 June 2007
Performing loans
Performing loans 97,195 112,428 129,979

Update of the 2007 shelf-registration document 113
Collective provisions (46) (49) (59)
Net 97,149 112,379 129,920
Non-performing loans
Non-performing loans 37 37 50
Specific provisions (22) (22) (23)
Net (1) 14 15 27
NET TOTAL 97,164 112,394 129,947
(1) The coverage rate for non-performing loans to banks on 30 June 2008 and 31 December 2007 is 60%.
7.4.2 Loans and advances to clients
In € millions 30 June 2008 31 Dec. 2007 30 June 2007
Performing loans
Performing loans 114,270 112,888 113,934
Collective provisions (1) (947) (793) (612)
Writedown provisions (35) (35) (30)
Net 113,289 112,060 113,293
Non-performing loans
Non-performing loans 1,307 1,148 1,138
Individual Provisions (802) (703) (682)
Net (2) 505 445 456
NET TOTAL 113,793 112,505 113,749
(1) Comprising €353 million as at 06/30/2008 for the overall risk related to increased loans and €172 million as at 12/31/2007. (2) The coverage rate for non-performing loans to clients on 30 June 2008 and 31 December 2007 is 61%.
7.5 Goodwill
In € millions 1 Jan. 2008
30 June 2008
Opening- period value
Acquisitions during the period
Divestiture
Change in
amortisation
Conversion
Reclassification Closing value
Net value per unit
Groupe IXIS AM 1,556 21 (70) 1,507
Groupe Coface 489 1 (1) 489
Groupe CACEIS 516 1 (2) (7) 508
Natexis Assurances 96 96
Groupe Ixis CIB 56 56

Update of the 2007 shelf-registration document 114
Natexis Interépargne 31 31
Natexis Private Equity and subsidiaries 22
22
Coficiné 10 10
Groupe Natixis Garanties 12
12
Natixis Consumer Finance 8
8
Natexis Intertitres 6 6
Natixis Consumer Finance IT 2
2
Groupe Cie 1818 1 1
Other 37 37
TOTAL 2,844 23 (2) 0 (78) 2,787
7.6 Debt securities in issue Debt securities in issue (interest-bearing notes, interbank market instruments, etc.), are allocated by type, excluding subordinated debt which is recorded as a separate line item. These debt securities are initially recognised at fair value, which is the issue price less transaction costs, and then stated at amortised cost, using the effective interest rate method to defer issuance costs over the life of the securities.
In € millions 30 June 2008 31 Dec. 2007 30 June 2007
Interbank market instruments 3 3 1
Money market instruments 25,428 50,014 42,962
BMTN 4,205 3,450 2,870
CDN 21,223 46,654 40,092
Bonds 15,676 11,378 12,859
Other debt securities in issue 2,322 3,488 5,291
Accrued interest 356 557 586
TOTAL 43,785 65,530 61,699

Update of the 2007 shelf-registration document 115
7.7 Adjustment accounts and other liabilities
In € millions Notes 30 June 2008 31 Dec. 2007 30 June 2007
Deferred day one margin (day one P&L) 7.7.1 185 204
Other adjustment accounts- liabilities 12,024 7,409 11,352
Other liabilities 16,091 15,005 16,591
Net total 28,300 22,618 27,943
7.7.1 Restatement of day one P&L
The table shows the deferred margin on day one of the instrument valued using techniques with non-observable parameters (or non-recognised market models): at the beginning and end of the period, and the changes during the period. Revenue from shares represent the family of products which contribute the most to the outstanding stock of deferred margin at 30 June 2008 considering the non-observable nature of share correlation and share long-term volatility parameters
In € millions 30 June 2008 31 Dec. 2007
Opening margin outstanding 204 251
Margin for new transactions 19 65
Instalments over the first half 2008 (35) (79)
Other changes (1) (4) (33)
Close margin outstanding 184 204
(1) Other changes refer to products whose classification changed during the fiscal period (moving from non-observable to observable).
7.8 Provisions and amortisation
7.8.1 Summary of provisions
In € millions 1 Jan. 2008 Increase Use Unused
Reversals Exchange
differences
Changes in scope of
consolidation Other30 June
2008
Provisions deducted from assets 2,165 713 (144) (121) (24) 16 13 2,618
Provisions for performing loans 842 251 0 (91) (9) 0 0 993
Provisions for non-performing loans 743 200 (87) (30) (4) 0 7 828
Amortisation 64 14 (12) 0 0 (3) 6 69
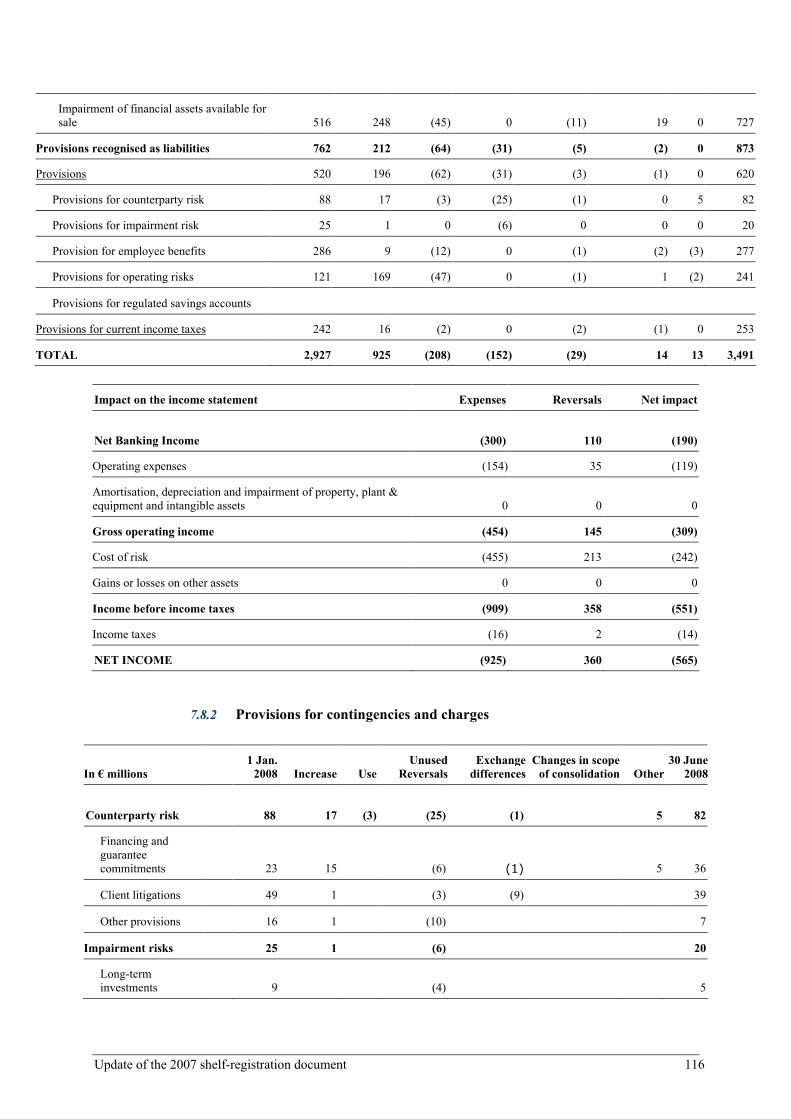
Update of the 2007 shelf-registration document 116
Impairment of financial assets available for sale 516 248 (45) 0 (11) 19 0 727
Provisions recognised as liabilities 762 212 (64) (31) (5) (2) 0 873
Provisions 520 196 (62) (31) (3) (1) 0 620
Provisions for counterparty risk 88 17 (3) (25) (1) 0 5 82
Provisions for impairment risk 25 1 0 (6) 0 0 0 20
Provision for employee benefits 286 9 (12) 0 (1) (2) (3) 277
Provisions for operating risks 121 169 (47) 0 (1) 1 (2) 241
Provisions for regulated savings accounts
Provisions for current income taxes 242 16 (2) 0 (2) (1) 0 253
TOTAL 2,927 925 (208) (152) (29) 14 13 3,491
Impact on the income statement Expenses Reversals Net impact
Net Banking Income (300) 110 (190)
Operating expenses (154) 35 (119)
Amortisation, depreciation and impairment of property, plant & equipment and intangible assets 0 0 0
Gross operating income (454) 145 (309)
Cost of risk (455) 213 (242)
Gains or losses on other assets 0 0 0
Income before income taxes (909) 358 (551)
Income taxes (16) 2 (14)
NET INCOME (925) 360 (565)
7.8.2 Provisions for contingencies and charges
In € millions 1 Jan. 2008 Increase Use
Unused Reversals
Exchange differences
Changes in scope of consolidation Other
30 June 2008
Counterparty risk 88 17 (3) (25) (1) 5 82
Financing and guarantee commitments 23 15 (6) (1) 5 36
Client litigations 49 1 (3) (9) 39
Other provisions 16 1 (10) 7
Impairment risks 25 1 (6) 20
Long-term investments 9 (4) 5

Update of the 2007 shelf-registration document 117
Real estate development 0 0
Other provisions 16 (2) 15
Employee benefits 286 9 (12) (1) (2) (3) 277
Operating risks 121 169 (47) (1) (1) (2) 241
Restructuring (1) 15 129 (10) (1) 133
Other provisions 106 40 (37) (1) (1) 1 108
TOTAL 520 196 (62) (31) (3) 1 0 620
1) of which €127.8 million for the plan for the adaptation of employment
7.9 Subordinated debt
Subordinated debts differ from advances and bonds issued as they will be repaid only after all the senior and unsecured creditors, but before the repayment of participating loans and securities and super-subordinated notes. They are recorded according to the amortised cost method. Preferred shares may be classified as debt or equity depending on contract analysis. All preferred shares issued by Natixis are recorded as subordinated debts.
In € millions 30 June 2008 31 Dec. 2007 30 June 2007
Dated subordinated debt 10,415 9,751 8,910
Super-subordinated bonds 8,956 8,261 7,425
Other subordinated debt 1,459 1,491 1,485
Perpetual subordinated debt (1) 3,021 721 800
Including preferred shares 422 626 665
Mutual guarantee deposits 0 0 0
Accrued interest payable 249 206 163
TOTAL 13,685 10,678 9,873
(1) Perpetual subordinated debt includes €2.5 billion advances to the shareholders’ current account made during the first six months of 2008 by the Caisse Nationale des Caisses d’Epargne and the Banque Fédérale des Banques Populaires to strengthen Natixis equity.
Changes in subordinated debt over the period
In € millions 1 Jan. 2008 Issue (1) Redemption (2) Exchange
differences
Scope Change
(3) Other (4)
30 June 2008
Dated subordinated debt 9,751 841 (71) (20) (10) (77) 10,415
Subordinated loans and securities 8,261 841 (50) (20) 0 (76) 8,956
Other 1,491 0 (21) 0 (10) (1) 1,459
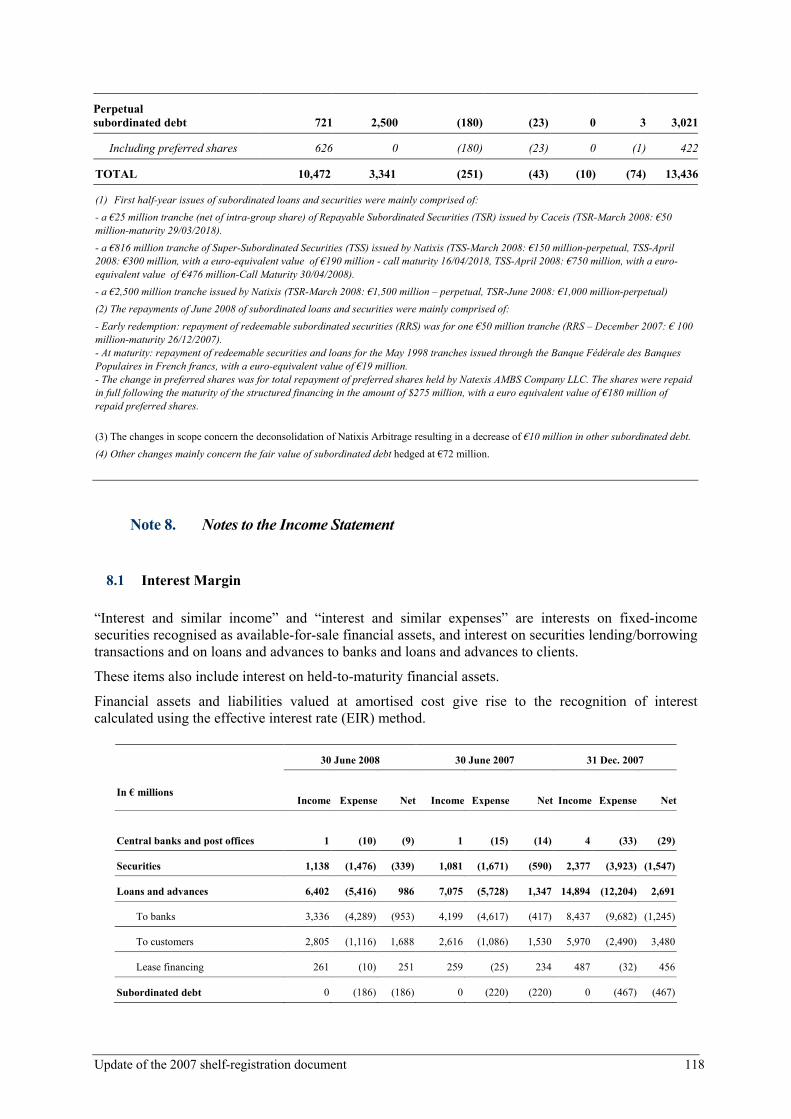
Update of the 2007 shelf-registration document 118
Perpetual subordinated debt 721 2,500 (180) (23) 0 3 3,021
Including preferred shares 626 0 (180) (23) 0 (1) 422
TOTAL 10,472 3,341 (251) (43) (10) (74) 13,436
(1) First half-year issues of subordinated loans and securities were mainly comprised of:
- a €25 million tranche (net of intra-group share) of Repayable Subordinated Securities (TSR) issued by Caceis (TSR-March 2008: €50
million-maturity 29/03/2018).
- a €816 million tranche of Super-Subordinated Securities (TSS) issued by Natixis (TSS-March 2008: €150 million-perpetual, TSS-April
2008: €300 million, with a euro-equivalent value of €190 million - call maturity 16/04/2018, TSS-April 2008: €750 million, with a euro-
equivalent value of €476 million-Call Maturity 30/04/2008).
- a €2,500 million tranche issued by Natixis (TSR-March 2008: €1,500 million – perpetual, TSR-June 2008: €1,000 million-perpetual)
(2) The repayments of June 2008 of subordinated loans and securities were mainly comprised of:
- Early redemption: repayment of redeemable subordinated securities (RRS) was for one €50 million tranche (RRS – December 2007: € 100
million-maturity 26/12/2007).
- At maturity: repayment of redeemable securities and loans for the May 1998 tranches issued through the Banque Fédérale des Banques
Populaires in French francs, with a euro-equivalent value of €19 million.
- The change in preferred shares was for total repayment of preferred shares held by Natexis AMBS Company LLC. The shares were repaid
in full following the maturity of the structured financing in the amount of $275 million, with a euro equivalent value of €180 million of
repaid preferred shares.
(3) The changes in scope concern the deconsolidation of Natixis Arbitrage resulting in a decrease of €10 million in other subordinated debt.
(4) Other changes mainly concern the fair value of subordinated debt hedged at €72 million.
Note 8. Notes to the Income Statement
8.1 Interest Margin
“Interest and similar income” and “interest and similar expenses” are interests on fixed-income securities recognised as available-for-sale financial assets, and interest on securities lending/borrowing transactions and on loans and advances to banks and loans and advances to clients.
These items also include interest on held-to-maturity financial assets.
Financial assets and liabilities valued at amortised cost give rise to the recognition of interest calculated using the effective interest rate (EIR) method.
30 June 2008 30 June 2007 31 Dec. 2007
In € millions Income Expense Net Income Expense Net Income Expense Net
Central banks and post offices 1 (10) (9) 1 (15) (14) 4 (33) (29)
Securities 1,138 (1,476) (339) 1,081 (1,671) (590) 2,377 (3,923) (1,547)
Loans and advances 6,402 (5,416) 986 7,075 (5,728) 1,347 14,894 (12,204) 2,691
To banks 3,336 (4,289) (953) 4,199 (4,617) (417) 8,437 (9,682) (1,245)
To customers 2,805 (1,116) 1,688 2,616 (1,086) 1,530 5,970 (2,490) 3,480
Lease financing 261 (10) 251 259 (25) 234 487 (32) 456
Subordinated debt 0 (186) (186) 0 (220) (220) 0 (467) (467)

Update of the 2007 shelf-registration document 119
Other (4) 0 (4) 10 0 10 231 0 231
Hedging instruments 911 (166) 745 479 (275) 204 952 (664) 288
Expiry of hedging relationship (CFH) 231 (149) 82 0 0 0 15 (15) 0
Accrued interest 680 (18) 662 479 (275) 204 937 (649) 288
Impaired loans, including restructured loans 3 0 3 5 0 5 2 0 2
TOTAL 8,451 (7,254) 1,197 8,651 (7,909) 743 18,460 (17,291) 1,169
8.2 Net Commissions
The method of accounting for fees and commissions received in respect of services or financial instruments depends on the ultimate purpose of the services rendered and the method of accounting for the financial instruments to which the service relates. Fees and commissions for one-off services, such as business-provider commission, are recognised in income immediately when the service is provided. Fees and commissions for ongoing services such as guarantee commissions or management fees are spread over the service period.
Fiduciary or similar fees and commissions are those that result in assets being held or invested on behalf of personal customers, pension schemes or other institutions. In particular, trust transactions cover asset management and custody activities performed on behalf of third parties.
Fees and commissions that form an integral part of the effective yield of an instrument such as commitment fees or loan set-up fees are recognised as an adjustment to the effective interest rate over the estimated term of the loan. In application of IFRS standards, as adopted by the European Union, these fees and commissions are recognised as interest income rather than fees and commissions.
30 June 2008 30 June 2007 31 Dec. 2007
In € millions Income
Expense Net IncomeExpense Net Income Expense Net
Interbank transactions 1 (11) (10) 14 (12) 2 6 (24) (18)
Customer transactions 325 (216) 109 309 (206) 103 643 (398) 245
Securities transactions 146 (71) 75 242 (75) 168 333 (104) 229
Payment services 104 (29) 75 106 (30) 76 217 (62) 155
Financial services 188 (107) 81 308 (138) 170 396 (280) 116
Fiduciary operations 1,193 (277) 916 1,141 (288) 853 2,679 (611) 2,068
Financing, guarantee, securities, derivatives commitments 59 (12) 47 61 (35) 26 146 (58) 88
Other 18 (3) 15 16 (2) 14 39 (4) 35
TOTAL 2,034 (724) 1,310 2,200 (786) 1,414 4,460 (1,541) 2,919

Update of the 2007 shelf-registration document 120
8.3 Gains or losses on assets and liabilities at fair value through profit or loss
This item includes gains and losses on financial assets and liabilities at fair value through profit or loss, including interest.
Hedging instruments include changes in the fair value of fair value hedges, including interest, plus the symmetrical revaluation of items hedged. It also includes the ineffective portion of cash flow hedges.
In € millions 30 June 2008 30 June 2007 31 Dec. 2007
Net gains on financial assets & liabilities excl. hedging instruments (1,659)
1,438 1,137
Net gains on financial assets and liabilities held for trading (1) (1,210)
1,763 3,202
o/w derivatives excl.hedging instruments (887) (371) 176
Net gains on other financial assets & liabilities stated at fair value 802
5 (1,971)
Other (1,251) (330) (94)
Hedging instruments and revaluation of hedges (24)
42 11
Ineffectiveness of the cash flow hedge (CFH) (6) 2 6
Ineffectiveness of the fair value hedge (FVH) (18) 40 5
Change in fair value hedge (39) 6 127
Revaluation of the hedged items 21 34 (122)
TOTAL (1,683) 1,480 1,148
(1) “Net gains on financial assets and liabilities held for trading” includes:
- writedowns of the fair value of CDSs entered into with monolines, as explained in Note 5.3, in the amount of €953 million on 30 June 2008.
- losses, arising from the valuation of CDO ABSs with a subprime component, in the amount of, €502 million on 30 June 2008 (See Note 5.1).
- losses, arising from the valuation of RMBS with a subprime component, in the amount of €158 million on 30 June 2008 (See Note 5.1).
8.4 Gains or losses on financial assets available for sale
Net gains or losses on available-for-sale financial assets principally comprise gains or losses on sale of securities and impairment losses on variable-income securities (long-term amortisation). Variable-income securities classified as available-for-sale are tested for impairment and an impairment loss is recognised when the carrying amount is higher than their recoverable value.
Impairment in fixed income securities is recognised under the cost of risk.
This line item also includes dividends received from variable-income securities
Loans outstanding with a theoretical syndication date expired as of 30 June 2008 were individually analysed in order to take any market discount observed at the closing date into account under income.
This item also shows dividends on variable income securities.

Update of the 2007 shelf-registration document 121
In € millions 30 June 2008 30 June 2007 31 Dec. 2007
Dividends 152 126 241
Gains or losses on sale 115 278 421
Impairment losses on variable income securities (1) (214) (25) (285)
Discounts on syndicated loans (39) 0 (43)
TOTAL 14 379 334
(1) Impairment losses on variable income securities include the amortisation amounts recorded for RMBS with a subprime component of €75 million on 30 June 2008.
8.5 Other income and expenses
Income and expenses from other activities comprises mainly income and expenses relating to lease financing and investment property. This item also includes income and expenses relating to insurance activities, in particular life insurance premium income, paid benefits and claims and changes in insurance liabilities.
30 June 2008 30 June 2007 31 Dec. 2007 In € millions Income Expense Net Income Expense Net Income Expense Net
Finance leases 36 (92) (56) 51 (112) (61) 156 (235) (79)
Operating leases 30 (21) 9 23 (20) 3 51 (42) 9
Investment property 67 (28) 39 61 0 61 111 0 111
Other non-operating assets 0 (1) 0 1 (1) 0 1 (2) (1)
Sub-total real estate activities 133 (141) (9) 136 (134) 3 319 (279) 40
Net charge to/reversal of insurance companies’ technical reserves 0 (133) (133) (1) (967) (968) 0 (1,764) (1,764)
Other insurance income and expense 2,578 (1,851) 727 2,905 (1,933) 972 5,590 (3,759) 1,831
Sub-total insurance 2,578 (1,983) 595 2,904 (2,900) 4 5,590 (5,523) 67
Other related income and expenses 320 (191) 129 373 (186) 187 711 (346) 365
TOTAL 3,030 (2,315) 715 3,414 (3,220) 194 6,620 (6,148) 472
8.6 Operating Expenses
Operating expenses comprise mainly payroll costs, including wages and salaries net of rebilled expenses, social security expenses and employee benefits such as pensions (defined benefit plans) and expenses relating to share-based payments in accordance with IFRS 2. This item also includes all administrative expenses and external services. The estimated cost of the employment adaptation plan, €127.8 million was fully funded in the accounts for the first six-months of 2008. The amount is recorded under Personnel Expenses – other in the table below.

Update of the 2007 shelf-registration document 122
In € millions 30 June 2008 30 June 2007 31 Dec. 2007
Payroll costs
Wages and salaries (1) (1,084) (1,119) (2,147)
(1) including share-based payments (7) (4) (9)
Post-retirement and other benefits (70) (70) (130)
Social security expenses (223) (232) (443)
Incentive and profit-sharing plans (47) (149) (253)
Payroll-based taxes (63) (68) (110)
Other (134) (1) (5)
Total payroll costs (1,622) (1,640) (3,088)
Other operating expenses
Taxes other than on income (67) (82) (147)
External services (958) (957) (1,949)
Other 12 14 27
Total Other operating expenses (1,013) (1,025) (2,069)
TOTAL (2,635) (2,664) (5,157)
8.7 Cost of Risk
This item comprises mainly cost of risk for credit transactions: expenses net of reversals of specific and collective provisions, receivables written off during the period and recoveries on bad debts written off. “Write-offs of individual receivables” includes securities classified as “Loans and advances”. The collective provision for credit enhancers created since the beginning of the financial crisis is under Provisions for performing loans.
30 June 2008
30 June 2007
31 Dec. 207
In € millions Expenses Net
reversals
Write-offs not
covered by
provisions
Recoveries of bad debts
written off Net Expenses Net
reversals
Write-offs not
covered by
provisions
Recoveries of bad debts
written off Net Net
Provisions (17) 23 6 (16) 7 (9) 1
Financing commitments (15) 4 (11) (8) 3 (5) 1
Other (2) 19 17 (8) 4 (4)
Financial assets at amortised cost
Loans and advances (436) 120 (67) 4 (379) (146) 142 (3) 5 (2) (230)
Write-offs of
individual
receivables (186) 30 (67) 4 (219) (46) 49 (3) 5 5 (40)
Collective provisions (251) 91 (160) (100) 92 (8) (190)

Update of the 2007 shelf-registration document 123
for performing loans
Available-for-sale financial assets (1) 1 (1) 2 2 (1)
Other 1 (2) 1 (1) (16)
Cost of risk (454) 144 (67) 4 (374) (165) 152 (3) 5 (11) (244)
including
Reversals of surplus
provisions 144
Reversals used 70
Sub-total reversals: 214
Write-offs covered by
provisions (70)
Total net reversals 144
8.8 Share of income from associates (equity method)
30 June 2008 30 June 2007 31 Dec. 2007
In € millions Value Income Value Income Value Income
Financial companies 9,283 295 9,044 398 9,265 663
Other companies 40 5 43 4 42 9
TOTAL 9,323 300 9,087 402 9,307 672

Update of the 2007 shelf-registration document 124
8.9 Reconciliation of the total and theoretical tax expense
In € millions 30 June 2008 30 June 2007 31 Dec. 2007
+ Net income attributable to equity holders of the parent
(948) 1,565 1,101
+ Net income attributable to minority interests 56 70 119
+ Income tax charge (242) 414 97
+ Income from discontinued activities 0 0 369
+ Goodwill amortisation 0 0 1
- Share of income of associates (300) (402) (672)
= Consolidated net income before tax, goodwill amortisation and share of income of associates
(1,434) (1,647) (1,015)
+/- Permanent timing differences (1) (200) (445) (928)
= Consolidated taxable income (1,634) 1,202 87
x Standard rate 33% 33% 33%
= Theoretical tax charge 545 (401) (29)
+ Contributions and minimum annual tax expenses 7 (5) (5)
+ Income taxed at reduced rates (5) (5) (39)
+ Losses for the period, restated conservatively (289) (3) (9)
+ Impact of group tax relief 18 17 (7)
+ Differences in foreign tax rates 5 (4) 47
+ Tax reassessments (20) (2) (33)
+ Tax credits (20) (12) 21
+ CCI distribution tax (36) (38) (73)
+ Impact of annualizing the tax charge
+ Other items (2) 37 15 30
= Tax charge for the period 242 (414) (97)
including: current (213) (329) (484)
Deferred 455 (85) 387
(1) The main deductions in respect of permanent timing differences concern the tax-exempt net income of
venture capital subsidiaries. Foreign deductions include fiscal amortisation of goodwill and tax-exempt income
from subsidiaries in Luxembourg and the United States.
(2) At 30 June 2008, other items include €38 million of extraordinary income in the USA, €12 million in
income as previous loss write offs.
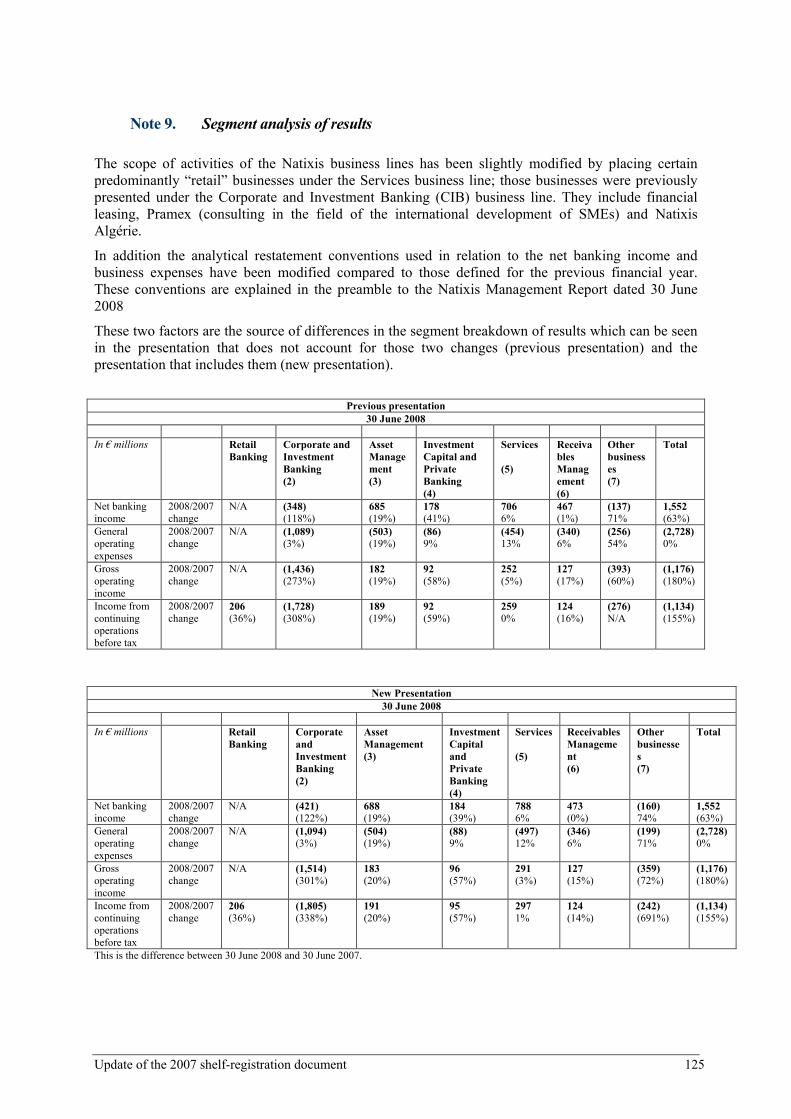
Update of the 2007 shelf-registration document 125
Note 9. Segment analysis of results
The scope of activities of the Natixis business lines has been slightly modified by placing certain predominantly “retail” businesses under the Services business line; those businesses were previously presented under the Corporate and Investment Banking (CIB) business line. They include financial leasing, Pramex (consulting in the field of the international development of SMEs) and Natixis Algérie.
In addition the analytical restatement conventions used in relation to the net banking income and business expenses have been modified compared to those defined for the previous financial year. These conventions are explained in the preamble to the Natixis Management Report dated 30 June 2008
These two factors are the source of differences in the segment breakdown of results which can be seen in the presentation that does not account for those two changes (previous presentation) and the presentation that includes them (new presentation).
Previous presentation
30 June 2008 In € millions Retail
Banking Corporate and Investment Banking (2)
Asset Management (3)
Investment Capital and Private Banking (4)
Services (5)
Receivables Management (6)
Other businesses (7)
Total
Net banking income
2008/2007 change
N/A (348) (118%)
685 (19%)
178 (41%)
706 6%
467 (1%)
(137) 71%
1,552 (63%)
General operating expenses
2008/2007 change
N/A (1,089) (3%)
(503) (19%)
(86) 9%
(454) 13%
(340) 6%
(256) 54%
(2,728) 0%
Gross operating income
2008/2007 change
N/A (1,436) (273%)
182 (19%)
92 (58%)
252 (5%)
127 (17%)
(393) (60%)
(1,176) (180%)
Income from continuing operations before tax
2008/2007 change
206 (36%)
(1,728) (308%)
189 (19%)
92 (59%)
259 0%
124 (16%)
(276) N/A
(1,134) (155%)
New Presentation 30 June 2008
In € millions Retail
Banking Corporate and Investment Banking (2)
Asset Management (3)
Investment Capital and Private Banking (4)
Services (5)
Receivables Management (6)
Other businesses (7)
Total
Net banking income
2008/2007 change
N/A (421) (122%)
688 (19%)
184 (39%)
788 6%
473 (0%)
(160) 74%
1,552 (63%)
General operating expenses
2008/2007 change
N/A (1,094) (3%)
(504) (19%)
(88) 9%
(497) 12%
(346) 6%
(199) 71%
(2,728) 0%
Gross operating income
2008/2007 change
N/A (1,514) (301%)
183 (20%)
96 (57%)
291 (3%)
127 (15%)
(359) (72%)
(1,176) (180%)
Income from continuing operations before tax
2008/2007 change
206 (36%)
(1,805) (338%)
191 (20%)
95 (57%)
297 1%
124 (14%)
(242) (691%)
(1,134) (155%)
This is the difference between 30 June 2008 and 30 June 2007.

Update of the 2007 shelf-registration document 126
The key interim statement lines shown above are broken down into six business segments, reflecting the six business lines identified in Natixis’ organisation chart.
- Retail banking [1] combines the Banque Populaire and Caisse d’Epargne activities, which are accounted for by Natixis through its 20% shareholding.
- Corporate and Investment Banking [2] houses the financing and capital markets activities serving large corporate customers.
- Asset Management [3] holds the asset management activities performed by various subsidiaries, including NGAM.
- Private Equity and Private Banking [4] comprises private equity (Natixis Private Equity) and wealth management (Banque Privée Saint Dominique, Compagnie 1818-Banquiers Privés and Natexis Private Banking Luxembourg).
- Services business [5] houses the remaining activities: Securities with Retail custody (EuroTitres) and Investor services (CACEIS), Payments, Insurance and Guarantees (Natixis Assurances and Natixis Garanties), Employee benefits planning (Natixis Interépargne), and Specialised Financing with Consumer credit (Natixis Financement) and Financial leasing and International Banking services (Pramex and Natixis Algérie).
- Receivables Management [6] combines the credit insurance and credit management services provided by Coface and the factoring businesses of Natixis Factor and VR Factorem.
- Other businesses [7] are a category housing Natixis activities that are not directly operational, especially its own holding company activities serving its direct subsidiaries. Net banking income comes from the management of its corporate treasury, real estate income and institutional activities performed on behalf of the French State. General operating expenses reflect overheads not allocated to the individual business lines. The Other businesses category also includes certain consolidation adjustments that cannot be assigned to business segments.

Update of the 2007 shelf-registration document 127
Note 10. Other information
10.1 Related parties
Relations between the group’s consolidated companies.
The principal transactions of Natixis with related parties (the Banque Populaire Group including Banque Fédérale and its subsidiaries, Banques Populaires and their subsidiaries, the Caisse d’Epargne Group including CNCE and its subsidiaries and the Caisses d’Epargne banks and their subsidiaries, proportionally consolidated investments with respect to the portion not eliminated for consolidation purposes and all equity-accounted associates) are described below:
In € millions 30 June 2008 30 June 2007 31 Dec. 2007
Banque
Populaire
Group
(incl. BP
CCIs)
Caisse
d’Epargne
Group
(incl. CEP
CCIs)
Proportionally
consolidated
companies)
Associates
(excl. BP
and CEP
CCIs
Banque
Populaire
Group
(incl. BP
CCIs)
Caisse
d’Epargne
Group
(incl. CEP
CCIs)
Proportionall
y
consolidated
companies)
Associate
s (excl.
BP and
CEP
CCIs
Banque
Populair
e Group
(incl. BP
CCIs)
Caisse
d’Epargne
Group
(incl. CEP
CCIs)
Proportionall
y consolidated
companies
Associate
s (excl.
BP and
CEP
CCIs)
ASSETS
Assets at fair value
through profit or loss 2,375 2,199 2,986 2,096 2 3,877 2,407 42
Financial assets available
for sale 395 737 4,364 424 4,175 55
Due from banks 22,871 8,849 150 14,846 8,874 736 16,960 10,087 2,337
Customer loans 618 83 1,099 7 482 6
Financial assets held to
maturity 19 161 162
LIABILITIES
Financial liabilities at
fair value through profit
or loss 1,336 1,250 628 474 2,278 (12) 949 3,769 252
Deposits from banks 5,869 4,399 518 7,292 12,615 2 7,230 9,546 491
Customer deposits 91 2 865 47 1
Debt securities in issue 1,587 82 712 1 2,060 3 571
Subordinated debt 2,066 2,261 881 1,577 827 1,539
INCOME
Interest and similar
income 843 232 5 384 168 13 925 397 22
Interest and similar
expenses (211) (189) (4) (170) (235) (5) (412) (397) (12)

Update of the 2007 shelf-registration document 128
Net fee and commission
income (115) 25 (6) (93) (45) (2) (242) 58 (11)
Net gains or losses on
financial instruments at
fair value through profit
or loss 81 (86) (23) (21) (340) 103 (957) 6
Net gains/(losses) on
financial assets available
for sale 1 1
Income and expenses
from other activities 39 5 34 (17) 45 (31)
Operating expenses (14) (4) (15) (4) (13) (32) (5)
Commitments
Commitments given 1,094 41,804 2,534 38,554 394 38,723 80
Commitments received 4,513 3,335 3,838 5,342 3,943 2,318 40
Condensed financial information regarding the affiliates
In € millions 30 June 2008 30 June 2007 31 Dec. 2007 30 June 2008 30 June 2007 31 Dec. 2007
BALANCE SHEET – ASSETS Banque Populaire
CCI Banque
Populaire CCIBanque Populaire
CCICaisse
d’Epargne CCI Caisse
d’Epargne CCICaisse
d’Epargne CCI
Cash and balances with central banks and post offices 3,621 2,207 3,092 902 856 1,061
Financial assets at fair value through profit and loss 7,944 10,258 8,712 6,384 6,169 6,474
Hedging instruments 330 194 258 559 307 373
Financial assets available for sale 17,389 15,197 16,330 33,008 36,773 34,098
Due from banks 8,264 7,834 9,272 126,670 117,492 122,136
Customer loans 129,068 114,978 122,997 127,131 117,286 122,168
Revaluation differences on portfolios hedged against interest rate risk 4 1 1 83 66 46
Financial assets held to maturity 2,078 2,243 2,169
Current tax assets, deferred tax assets 656 543 655 778 832 899
Accrued income, prepaid expenses and other assets 7,589 6,798 7,375 3,496 4,427 4,433
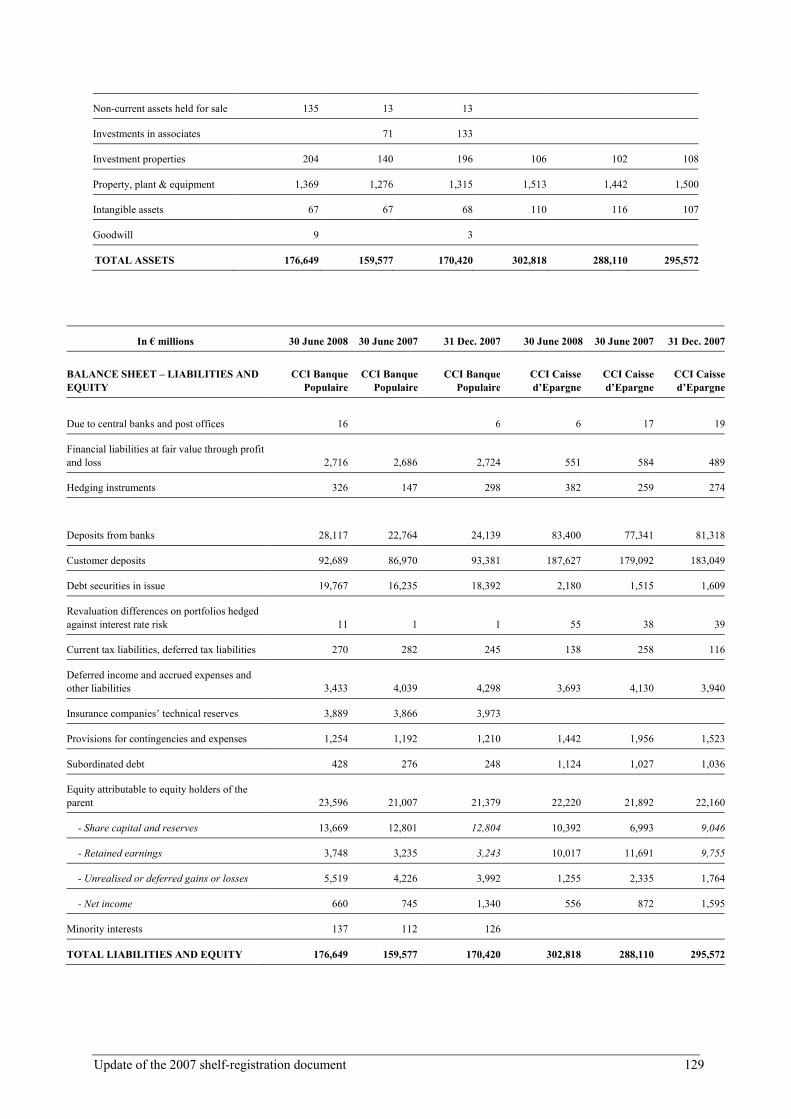
Update of the 2007 shelf-registration document 129
Non-current assets held for sale 135 13 13
Investments in associates 71 133
Investment properties 204 140 196 106 102 108
Property, plant & equipment 1,369 1,276 1,315 1,513 1,442 1,500
Intangible assets 67 67 68 110 116 107
Goodwill 9 3
TOTAL ASSETS 176,649 159,577 170,420 302,818 288,110 295,572
In € millions 30 June 2008 30 June 2007 31 Dec. 2007 30 June 2008 30 June 2007 31 Dec. 2007
BALANCE SHEET – LIABILITIES AND EQUITY
CCI Banque Populaire
CCI Banque Populaire
CCI Banque Populaire
CCI Caisse d’Epargne
CCI Caisse d’Epargne
CCI Caisse d’Epargne
Due to central banks and post offices 16 6 6 17 19
Financial liabilities at fair value through profit and loss 2,716 2,686 2,724 551 584 489
Hedging instruments 326 147 298 382 259 274
Deposits from banks 28,117 22,764 24,139 83,400 77,341 81,318
Customer deposits 92,689 86,970 93,381 187,627 179,092 183,049
Debt securities in issue 19,767 16,235 18,392 2,180 1,515 1,609
Revaluation differences on portfolios hedged against interest rate risk 11 1 1 55 38 39
Current tax liabilities, deferred tax liabilities 270 282 245 138 258 116
Deferred income and accrued expenses and other liabilities 3,433 4,039 4,298 3,693 4,130 3,940
Insurance companies’ technical reserves 3,889 3,866 3,973
Provisions for contingencies and expenses 1,254 1,192 1,210 1,442 1,956 1,523
Subordinated debt 428 276 248 1,124 1,027 1,036
Equity attributable to equity holders of the parent 23,596 21,007 21,379 22,220 21,892 22,160
- Share capital and reserves 13,669 12,801 12,804 10,392 6,993 9,046
- Retained earnings 3,748 3,235 3,243 10,017 11,691 9,755
- Unrealised or deferred gains or losses 5,519 4,226 3,992 1,255 2,335 1,764
- Net income 660 745 1,340 556 872 1,595
Minority interests 137 112 126
TOTAL LIABILITIES AND EQUITY 176,649 159,577 170,420 302,818 288,110 295,572

Update of the 2007 shelf-registration document 130
In € millions 30 June 2008 30 June 2007 31 Dec. 2007 30 June 2008 30 June 2007 31 Dec. 2007
INCOME STATEMENT
Banque Populaire
CCI
Banque Populaire
CCI
Banque Populaire
CCI
Caisse d’Epargne
CCI
Caisse d’Epargne
CCI
Caisse d’Epargne
CCI
Interest and similar income 4,056 3,568 7,340 6,423 5,506 11,408
Interest and similar expenses (2,620) (1,942) (4,304) (4,998) (4,011) (8,513)
Fee and commission income 1,233 1,210 2,391 1,263 1,250 2,491
Fee and commission expense (162) (182) (341) (210) (218) (434)
Net gains or losses on financial instruments at fair value through profit or loss 80 42 192 18 130 177
Net gains or losses on financial assets available for sale 306 264 515 420 628 1,252
Income from other activities 553 502 999 82 89 185
Expenses from other activities (510) (477) (953) (67) (56) (131)
Net banking income 2,936 2,985 5,839 2,931 3,318 6,435
Operating expenses (1,760) (1,705) (3,449) (2,076) (2,018) (4,096)
Amortisation, depreciation and impairment of property, plant and equipment and intangible assets (104) (101) (209) (106) (100) (213)
Gross operating income 1,072 1,179 2,181 749 1,200 2,126
Cost of risk (200) (183) (388) (98) (25) (118)
Net operating income 872 996 1,793 651 1,175 2,008
Share of income of associates 6 4 8
Gains or losses on other assets 2 55 63 1 1 (3)
Income before tax 880 1,055 1,864 652 1,176 2,005
Income tax (215) (306) (515) (96) (304) (410)
Net income 665 749 1,349 556 872 1,595
Minority interests (5) (4) (9)
Net income attributable to equity holders of the parent 660 745 1,340 556 872 1,595
Net income attributable to equity holders of the parent for the CCI at 20% 132 149 268 111 174 319
Consolidation restatements:
- Profit for the increase in the share in income 21 30 38 38 38 80
- Other restatements (18) (18) (1) (44)
Share of income in Natixis’ accounts 135 179 288 148 212 355

Update of the 2007 shelf-registration document 131
10.2 Results of insurance companies
The companies within Natixis’ scope using the insurance format are: Coface and its subsidiaries (credit insurance, business information and debt management services), Natixis Assurances and its subsidiaries (life insurance, personal risk insurance, non-life insurance).
The following table shows the transition from the financial statements of insurance businesses and how these financial statements translate into the financial statements in the banking format.
It also shows the consolidated contribution made by insurance companies in the banking format.
The main reclassifications concern general operating expenses, which are analysed by destination in the insurance format and by nature in the banking format.
At net banking income level, insurance income and expenses that are similar to banking income and expenses (principally interest and fees) are reclassified under related line items in the banking format, in the interests of consistency. Movements in technical reserves and loss expenses are deducted from net banking income and not as impairment losses.
Reclassifications on the balance sheet were not very significant. Most of the balance sheet line items specific to insurance companies are shown under “insurance company investments” on the asset side and under “insurance companies’ technical reserves” on the liabilities side. Accrued interest receivables and payables, which are shown under accrued income and prepaid expenses and/or deferred income and accrued expenses in the insurance format, is reclassified on the same lines as the principal in the banking format.
INCOME STATEMENT
30 June 2008 30 June 2008
Insurance format Banking format
In € millions
Description Net banking income
General operating expenses
Gross operating
income TaxOther items Net income
Premium income 2,554 2,554 2,554 2,554
Change in unearned premium income (32) (32) (32) (32)
Premium income 2,522 2,522 2,522 2,522
Banking operating income 41 41 41 41
Income or revenues from other activities 142 142 142 142
Other operating income 34 34 34 34
Investment income 683 684 (2) 683 683
Investment expenses (60) (47) (13) (60) (60)
Capital gains and losses on sale of
investments (net of reversals of
amortisation and impairment) 111 111 111 111
Change in fair value of investments
carried at fair value through profit or
loss (366) (365) (365) (365)
Change in impairment on investments (116) (116) (116) (116)
Investment income (net of expenses) 252 268 (16) 253 253

Update of the 2007 shelf-registration document 132
Policy benefit expenses (2,236) (2,200) (36) (2,236) (2,236)
Reinsurance transfer income 139 139 139 139
Reinsurance transfer expenses (147) (147) (147) (147)
Income or expenses net of reinsurance transfers (9) (9) (9) (9)
Banking operating expenses (14) (14) (14) (14)
Expenses on other activities (92) (1) (91) (92) (92)
Policy acquisition costs (187) (127) (60) (187) (187)
Amortisation of portfolio values and related
Administration costs (213) (83) (130) (213) (213)
Other current operating income and expenses (36) (29) (29) (7) (36)
Other operating income and expenses 1 1 1 1
Operating income 206 545 (332) 213 (7) 206
Financing expense (22) (22) (22) (22)
Share in income of affiliates 10 10 10
Income tax (60) (60) (60)
Income after tax on discontinued activities
Minority interests 1
CONSOLIDATED NET INCOME 134 524 (332) 192 (60) 3 134
10.3 Share-based payment
� Natixis stock options plans Natixis grants stock options to some of its employees. The options are exercisable over a period of three years after a lock-up period of four years. As required by IFRS 2, stock options granted after 7 November 2002, which have not vested at the balance sheet date, are measured at fair value on the grant date using the Black & Scholes model. The fair value is expensed in payroll costs over the vesting period with a corresponding entry in equity. Fair value is reviewed on each balance sheet date and adjusted if subsequent information indicates a change to the initial estimation of vested rights. The expense is then adjusted for the current and future years. Natixis is affected by the application of IFRS 2 for four plans on which the grant date is after 7 November 2002 in accordance with the interim provisions of that standard and for which rights have not yet been vested at 1 January 2008.

Update of the 2007 shelf-registration document 133
Stock-option plan:
Plan Year Allocation date
Number of
options
granted
Number of
options
granted –
Natixis scope
Exercisable as
of Expiry date
Exercise
price
Options
outstanding at
30 June 2008
Fair
value
Share price on
allocation date
2004 Plan 17/11/2004 4,277,500 2,543,000 17/11/2008 16/11/2011 8,910 4,143,000 1.33 9.54
2005 Plan 15/11/2005 4,970,000 2,970,000 15/11/2009 14/11/2012 11,924 4,915,500 2.46 13.00
2007 Plan 29/01/2007 9,999,300 4,999,300 29/01/2011 28/01/2014 22,150 9,877,400 5.03 21.97
2008 Plan 21/01/2008 9,740,800 4,845,800 21/01/2012 20/01/2015 12,740 4,845,800 1.69 10.63
No stock option plan was granted for 2006.
2004 Plan 2005 Plan 2007 Plan 2008 Plan
Number of options at 1 January 2008 4,143,000 4,920,500 9,948,900
• Awarded in the first half of 2008 9,740,800
• Forfeited in the first half of 2008 (5,000) (71,500)
• Expired in the first half of 2008
• Exercised in the first half of 2008
Number of options at 30 June 2008 4,143,000 4,915,500 9,877,400 9,740,800
Main assumptions used for valuing Natixis stock option plans:
2004 Plan 2005 Plan 2007 Plan 2008 Plan
Valuation method Black & Scholes
Black & Scholes
Black & Scholes
Black & Scholes
Risk-free interest rate (1) 4% 3% 4% 4%Share’s future volatility (2) 21% 20% 33% 43%Dividend payment rate (3) 5.28% per year3.54% per year 4.75% per year4.23% per yearRate for loss of entitlements 2% 2% 2% 2%
(1) The risk-free rate is the standard curve rate of the bank, i.e., the interbank swap rate curves (2) The volatility of the options has been estimated based on the historical volatility of the Natixis share price and by comparing the historical and implied volatilities of companies with a similar profile. (3) The dividend payment rate corresponds in general to the latest dividend paid with no increase in the future and no change from the latest level.
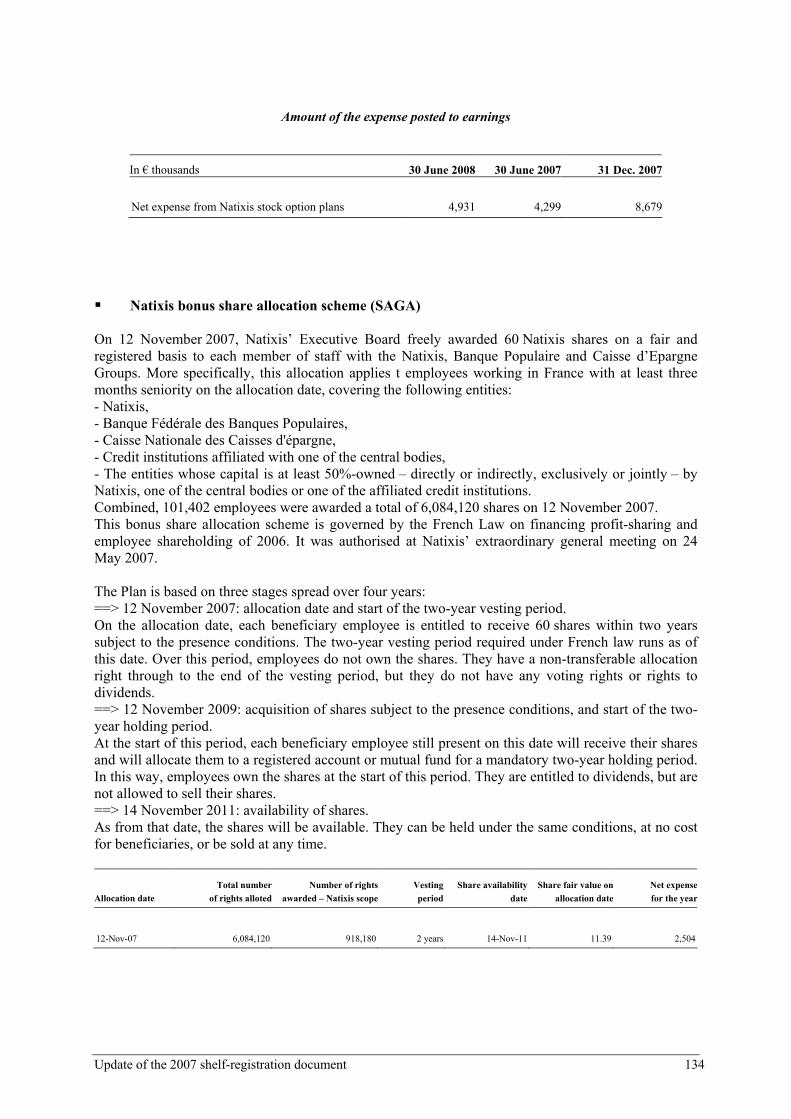
Update of the 2007 shelf-registration document 134
Amount of the expense posted to earnings
In € thousands 30 June 2008 30 June 2007 31 Dec. 2007
Net expense from Natixis stock option plans 4,931 4,299 8,679
� Natixis bonus share allocation scheme (SAGA) On 12 November 2007, Natixis’ Executive Board freely awarded 60 Natixis shares on a fair and registered basis to each member of staff with the Natixis, Banque Populaire and Caisse d’Epargne Groups. More specifically, this allocation applies t employees working in France with at least three months seniority on the allocation date, covering the following entities: - Natixis, - Banque Fédérale des Banques Populaires, - Caisse Nationale des Caisses d'épargne, - Credit institutions affiliated with one of the central bodies, - The entities whose capital is at least 50%-owned – directly or indirectly, exclusively or jointly – by Natixis, one of the central bodies or one of the affiliated credit institutions. Combined, 101,402 employees were awarded a total of 6,084,120 shares on 12 November 2007. This bonus share allocation scheme is governed by the French Law on financing profit-sharing and employee shareholding of 2006. It was authorised at Natixis’ extraordinary general meeting on 24 May 2007. The Plan is based on three stages spread over four years: ==> 12 November 2007: allocation date and start of the two-year vesting period. On the allocation date, each beneficiary employee is entitled to receive 60 shares within two years subject to the presence conditions. The two-year vesting period required under French law runs as of this date. Over this period, employees do not own the shares. They have a non-transferable allocation right through to the end of the vesting period, but they do not have any voting rights or rights to dividends. ==> 12 November 2009: acquisition of shares subject to the presence conditions, and start of the two-year holding period. At the start of this period, each beneficiary employee still present on this date will receive their shares and will allocate them to a registered account or mutual fund for a mandatory two-year holding period. In this way, employees own the shares at the start of this period. They are entitled to dividends, but are not allowed to sell their shares. ==> 14 November 2011: availability of shares. As from that date, the shares will be available. They can be held under the same conditions, at no cost for beneficiaries, or be sold at any time.
Allocation date
Total number
of rights alloted
Number of rights
awarded – Natixis scope
Vesting
period
Share availability
date
Share fair value on
allocation date
Net expense
for the year
12-Nov-07 6,084,120 918,180 2 years 14-Nov-11 11.39 2,504

Update of the 2007 shelf-registration document 135
� Stock option plans of unlisted subsidiaries unsettled in cash An unlisted company from the group has also allocated shares to its staff and its executive officers. That company is NGAM:
Plan Year Grant date
Number of
options
granted Vesting date Availability date
Share
value
Shares
“outstanding” at
31 Dec. 2007
* Fair value of
liability at 31
Dec. 2007 (€K)
* Change in fair
value of liability
over the year (€K)
2004 Plan IAM 1,345,000 24/08/2004
24/08/2007 (1) 47.9 47,000 1,637.0 (292.0)
2004 Plan
Natixis
Multimanager
(Formerly IPCM) 57,298 15/03/2004 15/03/2008 35.2 - - (682.0)
(1) 24/08/2007 for US beneficiaries and 24/08/2008 for European beneficiaries
Various options have been exercised ahead of the theoretical date
Amount of the expense posted to earnings
In € thousands 30 June 2008 30 June 2007 31 Dec. 2007
Net expense/net income on stock option plans for other
unlisted Group companies 657 1,502 (180)
10.4 Financing commitments
In accordance with IAS 39 (§ 2), financing commitments outside the scope of IAS 39 are recognised in accordance with IAS 37, “Provisions, contingent liabilities and contingent assets”.
The following financing commitments fall within the scope of IAS 39:
- commitments classified as financial liabilities at fair value through profit or loss. If an entity has a practice of reselling or securitising loans just after they are issued, these loans are subject to IAS 39 from the commitment phase;
- those which are subject to settlement (i.e., disposal); - those which result in a loan below market conditions.
Other financing commitments are covered by IAS 37.
A financing commitment given is a contingent liability, defined by IAS 37 as:
- a possible obligation arising from past events whose existence will be confirmed only by the occurrence or non-occurrence of one or more uncertain future events not wholly within the control of the enterprise;
or - a present obligation arising from past events but which is not recognised because:
o it is not probable that an outflow of economic benefits will be required to settle the obligation
or

Update of the 2007 shelf-registration document 136
o a reliable estimate of the amount of the obligation cannot be made.
In € millions 30 June 2008 30 June 2007 31 Dec. 2007
Financing commitments given
To banks 14,637 8,255 2,899
To customers 54,471 50,396 53,242
Documentary credits 3,994 2,096 2,728
Other confirmed lines of credit 43,176 41,523 43,603
Other commitments 7,301 6,778 6,911
Total financing commitments given 69,108 58,651 56,142
Financing commitments received
financial institutions 23,116 15,247 2,927
customers 0 0 0
Total financing commitments received 23,116 15,247 2,927

Update of the 2007 shelf-registration document 137
6.3 STATUTORY AUDITORS ’ REVIEW REPORT ON THE CONDENSED H1 CONSOLIDATED FINANCIAL INFORMATION
DELOITTE & ASSOCIES
185, avenue Charles de Gaulle 92524 Neuilly sur Seine
Cedex
MAZARS & GUERARD
61, rue Henri Régnault 92075 Paris La Défense
Cedex
SALUSTRO REYDEL Member of KPMG International
1, cours Valmy
92923 Paris La Défense Cedex
Natixis
Société Anonyme
30, avenue Pierre Mendès-France
75013 PARIS
_________
Statutory auditors’ review report on the condensed first half-year consolidated financial information
Period from January 1, 2008 to June 30, 2007
_________
This is a free translation into English of the statutory auditors’ review report issued in French and is provided solely for the convenience of English speaking readers. This report should be read in conjunction with, and construed in accordance with, French law and professional auditing standards applicable in France.
To the Shareholders,
In accordance with the mandate received by Natixis Shareholders’ Meeting and in accordance with the requirements of article L 232-7 of the French Commercial Law (the Code de commerce) and L.451-1-2 III of the French Monetary and Financial Law (Code monétaire et financier), we hereby report to you on:
- the review of the accompanying condensed half-year consolidated financial statements of Natixis, for the period from January 1 to June 30, 2008; and
- the verification of information contained in the half-year management report.
These condensed half-year consolidated financial statements are the responsibility of the Executive Board. Our role is to express a conclusion on these financial statements based on our review.

Update of the 2007 shelf-registration document 138
1. Our conclusion
We conducted our review in accordance with professional standards applicable in France. A review of interim financial information consists of making inquiries, primarily of persons responsible for financial and accounting matters, and applying analytical. A review is substantially less in scope than an audit conducted in accordance with professional standards applicable in France and consequently we can only obtain a moderate assurance that we would become aware of all significant matters that might be identified in audit.
Based on our review, nothing has come to our attention that causes us to believe that the accompanying condensed half-year consolidated financial statements are not prepared, in all material respects, in accordance with IAS 34 – standard of the IFRSs as adopted by the European Union applicable to Interim financial information. 2. Specific verification We have also verified the information given in the interim half-year financial report commenting the condensed half-year consolidated financial statements subject to our review. We have no matters to report as to its fair presentation and consistency with the condensed half-year consolidated financial statements.
Neuilly-sur-Seine and Paris La Défense, August 28, 2008
The statutory auditors,
DELOITTE & ASSOCIES
Damien LEURENT
MAZARS & GUERARD
Michel BARBET-MASSIN
Charles de BOISRIOU
SALUSTRO REYDEL Member of KPMG International
Michel SAVIOZ

Update of the 2007 shelf-registration document 139
6.4 RECENT EVENTS
2
Disclaimer
This presentation may contain objectives and comments relating to the objectives and strategy of Natixis. Any such objectives inherently depend on assumptions, project considerations, objectives and expectations linked to future events, transactions, products and services as well as on suppositions regarding future performance and synergies.
No assurance can be given that such objectives will be realized. They are subject to inherent risks and uncertainties and are based on assumptions relating to Natixis, its subsidiaries and associates and the business development thereof; trends in the sector; future acquisitions and investments; macroeconomic conditions and conditions in Natixis' principal local markets; competition and regulation. Occurrence of such events is not certain, and outcomes may prove different from current expectations, significantly affecting expected results. Actual results may differ significantly from those implied by such objectives. Natixis shall in no event have any obligation to publish modifications or updates of such objectives.
Information in this presentation relating to parties other than Natixis or taken from external sources has not been subject to independent verification, and Natixis makes no warranty as to the accuracy, fairness or completeness of the information or opinions in this presentation. Neither Natixis nor its representatives shall be liable for any errors or omissions or for any harm resulting from the use of this presentation, the content of this presentation, or any document or information referred to in this presentation.
Presentation to the Press/AnalystsAugust 28, 2008
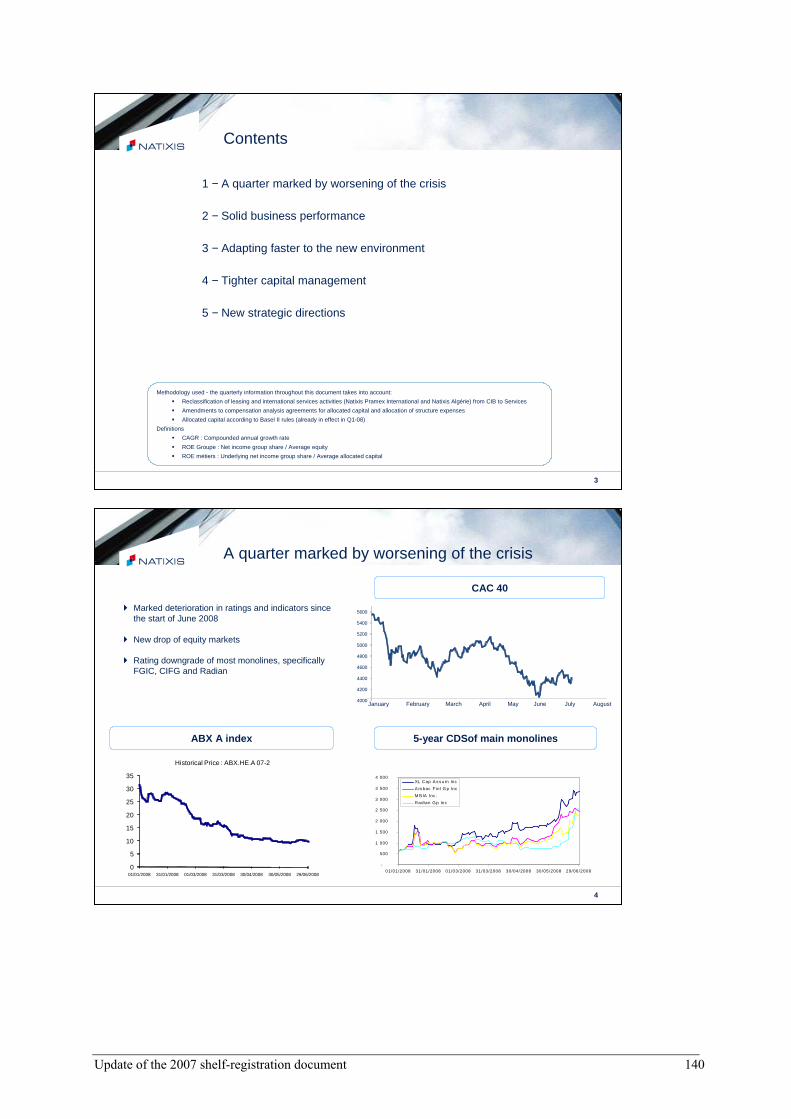
Update of the 2007 shelf-registration document 140
4
A quarter marked by worsening of the crisis
� Marked deterioration in ratings and indicators sincethe start of June 2008
� New drop of equity markets
� Rating downgrade of most monolines, specificallyFGIC, CIFG and Radian
5-year CDSof main monolines
4000
4200
4400
4600
4800
5000
5200
5400
5600
CAC 40
ABX A index
January February March April May June July August
-
500
1 000
1 500
2 000
2 500
3 000
3 500
4 000
01/01/2008 31/01/2008 01/03/2008 31/03/2008 30/04/2008 30/05/2008 29/06/2008
XL Cap A s s urn Inc
A m bac F inl G p Inc
M B IA Inc .
Radian Gp Inc
0
5
10
15
20
25
30
35
01/01/2008 31/01/2008 01/03/2008 31/03/2008 30/04/2008 30/05/2008 29/06/2008
Historical Price : ABX.HE.A 07-2
3
Contents
1 − A quarter marked by worsening of the crisis
2 − Solid business performance
3 − Adapting faster to the new environment
4 − Tighter capital management
5 − New strategic directions
Methodology used - the quarterly information throughout this document takes into account:
� Reclassification of leasing and international services activities (Natixis Pramex International and Natixis Algérie) from CIB to Services
� Amendments to compensation analysis agreements for allocated capital and allocation of structure expenses
� Allocated capital according to Basel II rules (already in effect in Q1-08)
Definitions
� CAGR : Compounded annual growth rate
� ROE Groupe : Net income group share / Average equity
� ROE métiers : Underlying net income group share / Average allocated capital

Update of the 2007 shelf-registration document 141
6
� Conservative valuation projections� Conservative definition of the “Subprime” category (FICO limit below 660)
� Monolines: drop to as low as 62% of true covered value
� CDO of undiversified ABS with exposure to the U.S. housing market: downgrade 80%
881Residual counterparty risk exposure on monolines
-300Collective provisions
-1,146Value adjustments
2,327Fair protection value before adjustments to value
June 30, 08In millions of euros
A quarter marked by worsening of the crisis
Residual exposure to monolines
Worsening of the crisis calling for acceleratedreduction in the Natixis risk profile
5
� €1.5 billion in NBI, of which:� €789 million refers to monolines� €414 million refers to ABS CDOs
containing subprime� €192 million refers to RMBS
� €172 million in cost of risk on credit enhancers
-1,017
-123*
70
0
-964
-36
209
-1,136
2
193
-1,332
-281
-1,052
-1,238
186
1,509
1,695
Q2-08
1,014
-41
178
11
866
-50
-231
1,147
8
251
889
18
870
-1,357
2,227
18
2,245
Q2-07
4,1963,500NBI before impact of the crisis
351,948Impact of the crisis
1,565-948Net income, Group share
-60-159*Net restructuring expenses
17870Net restructuring income
180Income from discontinued operations
1,430-859Underlying net income, Group share
-70-57Minority interests
-436204Taxes
1,937-1,006Income before taxes
911Gains or losses on other assets
402300Equity method
1,525-1,318Operating income
-11-374Cost of risk
1,536-944Gross operating income
-2,624-2 496Expenses
4,1611,552NBI
H1-07H1-08In millions of euros
A quarter marked by worsening of the crisis
� Income:� NBI: -63% vs. H1-07
� Slowdown in investment banking NBI
� Good volume of business in other areas
� Decrease in expenses:� -9% vs. Q2-07
� -5% vs. H1-07
� Net underlying income: -€859 million in H1-08
� Non-operating items* which compensate each other for the most part
* Specifically including an expense related to the job adaptation plan (gross provision of €127 millio n)
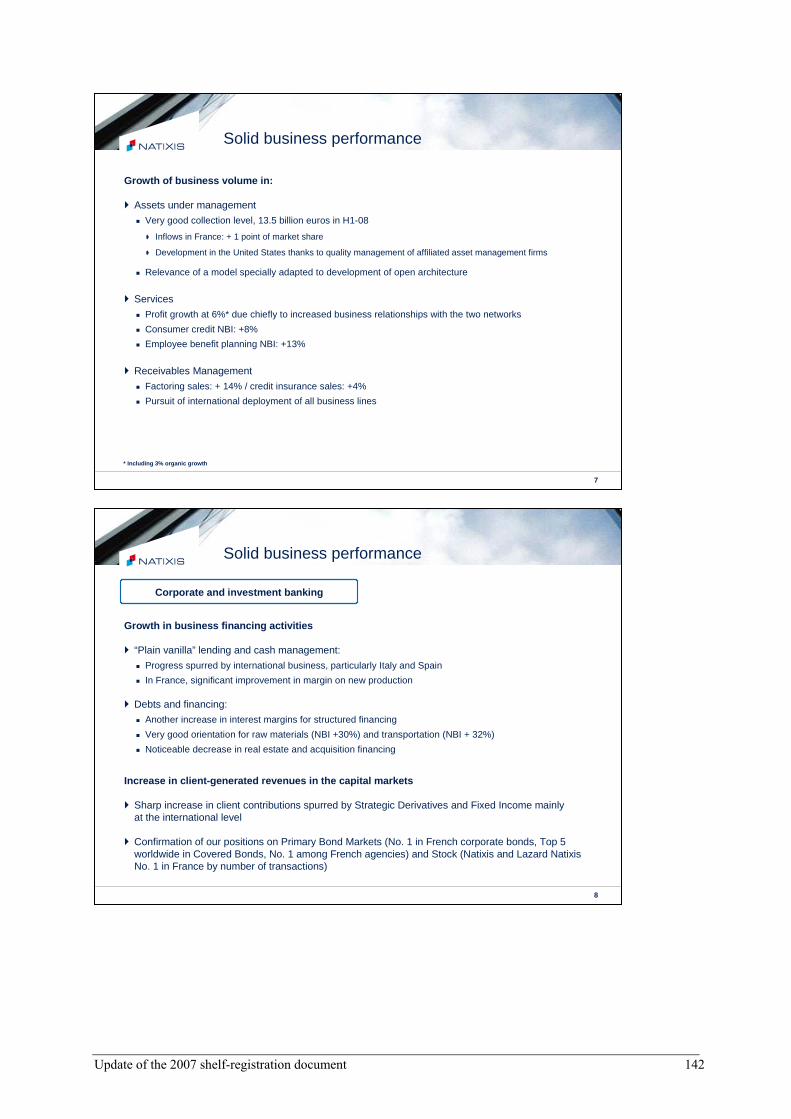
Update of the 2007 shelf-registration document 142
8
Solid business performance
Growth in business financing activities
� “Plain vanilla” lending and cash management:
� Progress spurred by international business, particularly Italy and Spain
� In France, significant improvement in margin on new production
� Debts and financing:
� Another increase in interest margins for structured financing
� Very good orientation for raw materials (NBI +30%) and transportation (NBI + 32%)
� Noticeable decrease in real estate and acquisition financing
Increase in client-generated revenues in the capita l markets
� Sharp increase in client contributions spurred by Strategic Derivatives and Fixed Income mainly at the international level
� Confirmation of our positions on Primary Bond Markets (No. 1 in French corporate bonds, Top 5 worldwide in Covered Bonds, No. 1 among French agencies) and Stock (Natixis and Lazard Natixis No. 1 in France by number of transactions)
Corporate and investment banking
7
Solid business performance
Growth of business volume in:
� Assets under management
� Very good collection level, 13.5 billion euros in H1-08
� Inflows in France: + 1 point of market share
� Development in the United States thanks to quality management of affiliated asset management firms
� Relevance of a model specially adapted to development of open architecture
� Services
� Profit growth at 6%* due chiefly to increased business relationships with the two networks
� Consumer credit NBI: +8%
� Employee benefit planning NBI: +13%
� Receivables Management
� Factoring sales: + 14% / credit insurance sales: +4%
� Pursuit of international deployment of all business lines
* Including 3% organic growth

Update of the 2007 shelf-registration document 143
10
Adapting faster to the new environment
Strong action on cost reduction…
� Drop in operating expenses, associated with a reduction in variable compensation at CIB and Asset Management:
� H1-08: -5% vs. H1-07
� Q2-08: -9% vs. Q2-07
� First effects of the sequential decrease of expenses: -2% vs Q1-08
� CIB: Staff reductions in France (-95 FTEs in 6 months)
� Implementation of the job adaptation plan starting in September 2008:
� 800 internal job reduction+ 850 outside service providers (-300 already completed in Q2-08)
� Gross funding of €127 million recorded in Q2-08
Making further productivity improvements possible
9
Solid business performance
� Private Equity: good performance maintained with control led risks
� 10% rise (over 6 months) in capital under management
� Recognized team expertise and good understanding of trade cycles
� Ability to renew reserves in hidden capital gains in a more exacting environment
� underlying capital gains reserves*: €341 million (at June 30, 08)
Business performance which confirmed Natixis’ solid client-related activities
* Note: Under IFRS standards, changes in underlying capital gains are included in the net banking inco me

Update of the 2007 shelf-registration document 144
12
New strategic directions
11
Tighter capital management
--9.710.5Operating risks
15.819.618.816.3Market risks
125.5124.8128.4124.0Credit risks
141.3144.4156.9150.8Weighted risks period end
Dec. 31, 07*March 31, 08March 31, 08June 30, 08in billions of euros
Bâle IBâle II
Solid financial structure
Stabilization of weighted outstandings and downturn in Q2 -08 (-4% vs. Q1-08)
Strong support by majority shareholders: � Advance by shareholders: €1.5 billion in March 08
€1 billion in June 08
Tier One ratio at June 30, 08: 8.5%
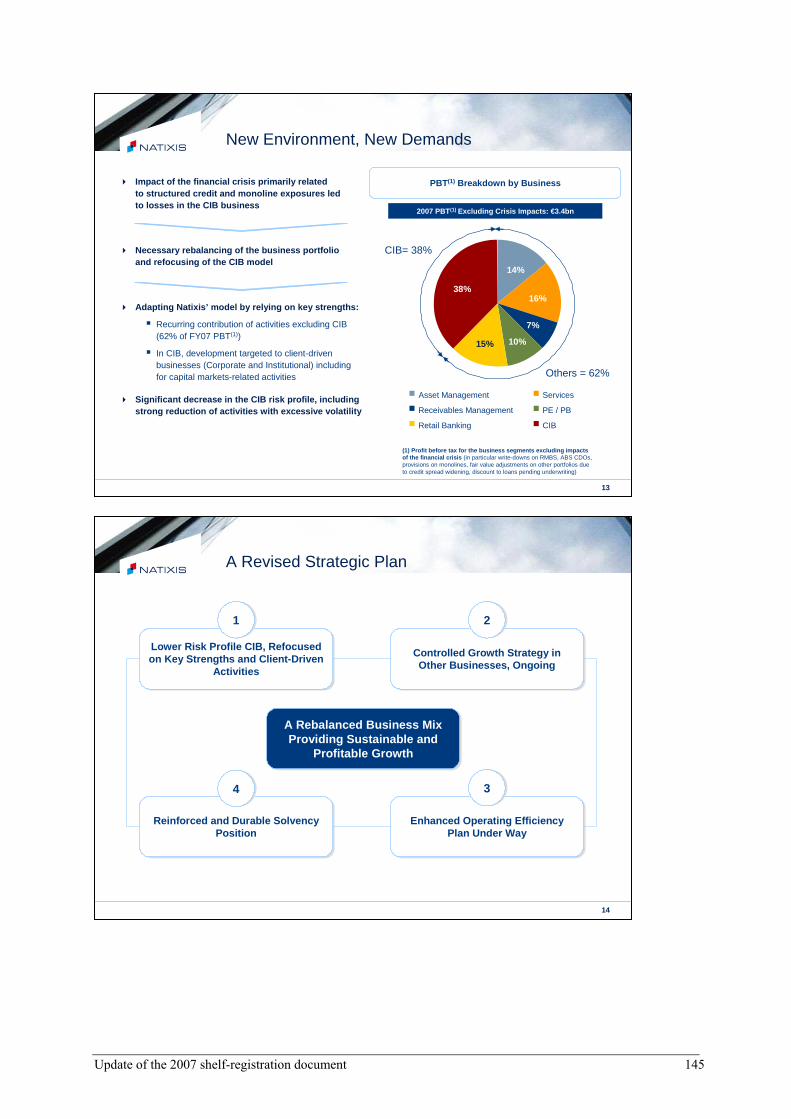
Update of the 2007 shelf-registration document 145
14
A Revised Strategic Plan
Lower Risk Profile CIB, Refocusedon Key Strengths and Client-Driven
Activities
Lower Risk Profile CIB, Refocusedon Key Strengths and Client-Driven
Activities
Enhanced Operating EfficiencyPlan Under Way
Enhanced Operating EfficiencyPlan Under Way
Controlled Growth Strategy in Other Businesses, Ongoing
Controlled Growth Strategy in Other Businesses, Ongoing
Reinforced and Durable SolvencyPosition
Reinforced and Durable SolvencyPosition
3344
11 22
A Rebalanced Business Mix Providing Sustainable and
Profitable Growth
A Rebalanced Business Mix Providing Sustainable and
Profitable Growth
13
Asset Management Services
Receivables Management PE / PB
Retail Banking CIB
New Environment, New Demands
� Impact of the financial crisis primarily related to structured credit and monoline exposures led to losses in the CIB business
� Necessary rebalancing of the business portfolio and refocusing of the CIB model
� Adapting Natixis’ model by relying on key strengths :
� Recurring contribution of activities excluding CIB (62% of FY07 PBT(1))
� In CIB, development targeted to client-driven businesses (Corporate and Institutional) including for capital markets-related activities
� Significant decrease in the CIB risk profile, inclu ding strong reduction of activities with excessive volat ility
PBT(1) Breakdown by Business
(1) Profit before tax for the business segments exclu ding impacts of the financial crisis (in particular write-downs on RMBS, ABS CDOs, provisions on monolines, fair value adjustments on other portfolios due to credit spread widening, discount to loans pending underwriting)
CIB= 38%
Others = 62%
14%
16%
7%
10%15%
38%
2007 PBT(1) Excluding Crisis Impacts: €3.4bn
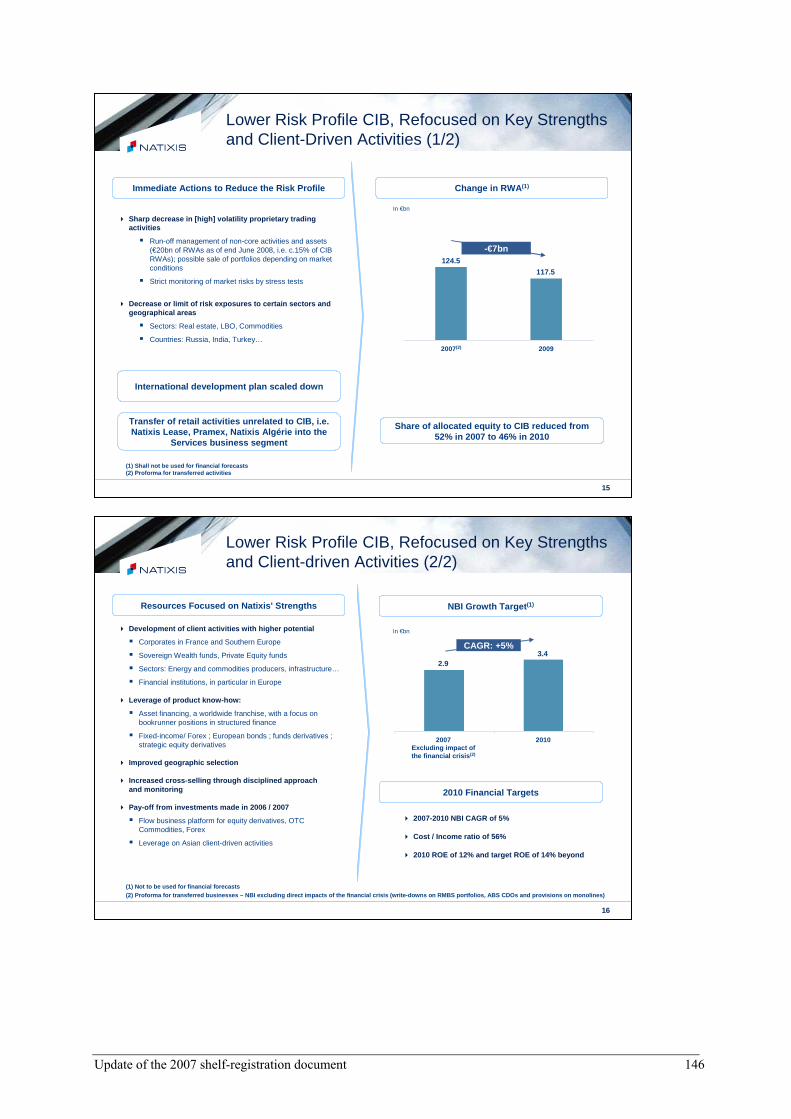
Update of the 2007 shelf-registration document 146
16
NBI Growth Target (1)
� Development of client activities with higher potent ial
� Corporates in France and Southern Europe
� Sovereign Wealth funds, Private Equity funds
� Sectors: Energy and commodities producers, infrastructure…
� Financial institutions, in particular in Europe
� Leverage of product know-how:
� Asset financing, a worldwide franchise, with a focus on bookrunner positions in structured finance
� Fixed-income/ Forex ; European bonds ; funds derivatives ; strategic equity derivatives
� Improved geographic selection
� Increased cross-selling through disciplined approac h and monitoring
� Pay-off from investments made in 2006 / 2007
� Flow business platform for equity derivatives, OTC Commodities, Forex
� Leverage on Asian client-driven activities
Resources Focused on Natixis' Strengths
2010 Financial Targets
� 2007-2010 NBI CAGR of 5%
� Cost / Income ratio of 56%
� 2010 ROE of 12% and target ROE of 14% beyond
Lower Risk Profile CIB, Refocused on Key Strengthsand Client-driven Activities (2/2)
(1) Not to be used for financial forecasts(2) Proforma for transferred businesses – NBI excludin g direct impacts of the financial crisis (write-dow ns on RMBS portfolios, ABS CDOs and provisions on m onolines)
In €bn
2007 2010
2.93.4
CAGR: +5%
2007Excluding impact of the financial crisis (2)
2010
15
Lower Risk Profile CIB, Refocused on Key Strengthsand Client-Driven Activities (1/2)
� Sharp decrease in [high] volatility proprietary tra ding activities
� Run-off management of non-core activities and assets (€20bn of RWAs as of end June 2008, i.e. c.15% of CIB RWAs); possible sale of portfolios depending on market conditions
� Strict monitoring of market risks by stress tests
� Decrease or limit of risk exposures to certain sect ors and geographical areas
� Sectors: Real estate, LBO, Commodities
� Countries: Russia, India, Turkey…
Change in RWA (1)
In €bn
Immediate Actions to Reduce the Risk Profile
(1) Shall not be used for financial forecasts(2) Proforma for transferred activities
Share of allocated equity to CIB reduced from 52% in 2007 to 46% in 2010
Transfer of retail activities unrelated to CIB, i.e . Natixis Lease, Pramex, Natixis Algérie into the
Services business segment
International development plan scaled down
2007 2009
-€7bn124.5
117.5
2007(2) 2009

Update of the 2007 shelf-registration document 147
18
� Leading French/US asset manager (# 1 in France, amo ng Top 15 globally (2)) basedon an original open architecture development model
� Strategy:
� Grow in all key markets globally and increase synergies with other Natixis businesses
� 2010(1) Target:
� 2007-2010 AuM CAGR of 7% (excluding La Poste impact)
� 2007-2010 GOI CAGR of 7%
Services
Asset Management
� Recognized expertise with leading positions in seve ral business lines
� Employee benefits (#1 in France), Institutional Custody / CACEIS (#1 in France), Retail Custody / CACEIS (#2 in France), Mortgage guarantees for retail clients (#2 in France), Real estate leasing (#2 in France)
� Strategy:
� Increase synergies with retail networks and diversify the client base
� 2010(1) Target:
� 2007-2010 NBI CAGR 5%
� 2010 ROE > 17%
Controlled Growth Strategy in Other Businesses, Ongoing (2/4)
(1) Not to be used for financial forecasts(2) At December 31, 2007
17
Controlled Growth Strategy in Other Businesses, Ongoing (1/4)
Increase Natixis’ International
Reach
� Develop Natixis Global Asset Management distributio n platform abroad (Europe, Middle-East, Asia…)
� Continue the international and integrated growth of the Receivables Management business line, already present in 65 countries
� Build on the good track record achieved since 2006 (consumer finance, leasing, factoring, group insurance, employee benefits)
� Expand Natixis’ product offering through the retail networks
� Offer mortgage guarantees
� Roll-out the BtoB platform in Private Banking
� Bolster the distribution channel of mutual funds through Natixis Epargne Financière
� Increase cross-selling to CIB clients (e.g. Asset Management)
Continue Client Base
Diversification
� Roll-out multi-network platforms in the Services bu siness segment
� Reinforce the open architecture model in Asset Mana gement
� Strengthen global product offering in Receivables M anagement
Deliver Revenue Synergies within
the Group and the Networks

Update of the 2007 shelf-registration document 148
20
Contribution to Natixis through CCI certificates
Recurring contribution from two leading retail bank ing networks in France (2)Recurring contribution from two leading retail bank ing networks in France (2)
BanquesPopulaires
� Strategy: � Raise client equipment rate, specifically savings products and in the area of protection of
goods and people� Integrate regional banks acquired from HSBC� Improve operational efficiency and pooling of processes (common IT platform)
Caisses d’Epargne
� Strategy:� Improve equipment rates and increase market share notably in consumer finance
and wealth management � Ongoing development of the professionals and SME segment� Achievement of €300m to €400m savings by 2012
� 2010(1) Target:
� 2007-2010 CAGR of net income contribution of 2%
� Product provider to retail and SME customers to Ban ques Populaires and Caisses d’Epargne
� Service provider to retail banks for their own need s and the ones of their customers
Operating links between Natixis
and the distribution
networks
Controlled Growth Strategy in Other Businesses, Ongoing (4/4)
(1) Not to be used for financial forecasts(2) By number of clients
19
Receivables Management
� A global leader in Receivables Management (#3 in Credit Insurance, # 6 in factoring)
� Strategy:
� Expand internationally all businesses, with a focus on growth for factoring and on the development outside Europe for credit insurance
� 2010(1) Target:
� 2007-2010 NBI CAGR 8%
� 2010 ROE 16%
� Leading position in Private Equity and unique relat ionship with 3 networks in Private Banking
� Strategy:
� Private Equity: Maintain a balanced business model (proprietary investment / third party funds; Development / LBO / Venture / Fund of funds; France / International)
� Private Banking: leverage asset gathering potential within the client bases from Natixis, the shareholders’ networks and wealth management advisors
� 2010(1) Target:
� 2007-2010 AuM CAGR in Private Banking: 13%
Private Equity and Private
Banking
Controlled Growth Strategy in Other Businesses, Ongoing (3/4)
(1) Not to be used for financial forecasts

Update of the 2007 shelf-registration document 149
22
A Durably Reinforced Solvency Position
A Strengthened Capital Structure
�Natixis amongst the best capitalised European banks
�Solvency position as of 30 June proforma for the capital increase:
� Core Tier 1 ratio of 7.8%
� Tier 1 ratio of 9.3%
�Target Tier 1 ratio of c.9%
One of the Highest Tier 1 Ratios (1) in Europe
Prudent Management of Risk-Weighted Assets
�By 2010
� Stability of risk-weighted assets
� Reduced in CIB risk-weighted assets through reallocation of resources into client-driven activities
Source: Company data as of 30 June 2008(1) Pro forma of €3.7bn capital increase(2) As of 31 March 2008
11.6%
11.3%(2)
10.2%
9,3%(1)
9.3%
9.3%
9.1%
8.6%
8.6%
8.5%(2)
8.2%
8.2%
7.9%
7.9%
7.7%
7.6%
7.4%
6.7%(2)
6.5%
UBS
Dexia
CS
Natixis
DB
KBC
Fortis
HBOS
RBS
CASA
ING
SG
Barclays
Santander
BBVA
BNPP
Commerzbank
ISP
UCI
21
Enhanced Operating Efficiency Plan Under Way
� Implementation of the announced restructuring plan
� Primarily aimed at supporting functions and CIB activities impacted by the crisis
� €400m cost reduction with full effect in 2009 and first benefits already in H2 08
�Enhancement of management efficiency
� Cost-cutting through resource sharing (new life-insurance platform, sharing of Receivables Management’s tools…)
� Improvement of tools and processes aimed at developing cross-selling and enhancing sales productivity
� Additional cost-cutting effects from the refocusing of CIB activities
Operational Efficiency Plan
Decrease of external staff (850 FTEs)
Organisational optimisation
Significant decrease in the activities
impacted by the financial crisis
(800 FTEs)
-6% Decrease in PurchasingExpenses
Day-to-dayManagement
Savings
Breakdown of the Savings by Nature of Costs: €400m
Purchasing13%
External staff38%
EmployeeCosts
29%
Real Estate5%
Other15%
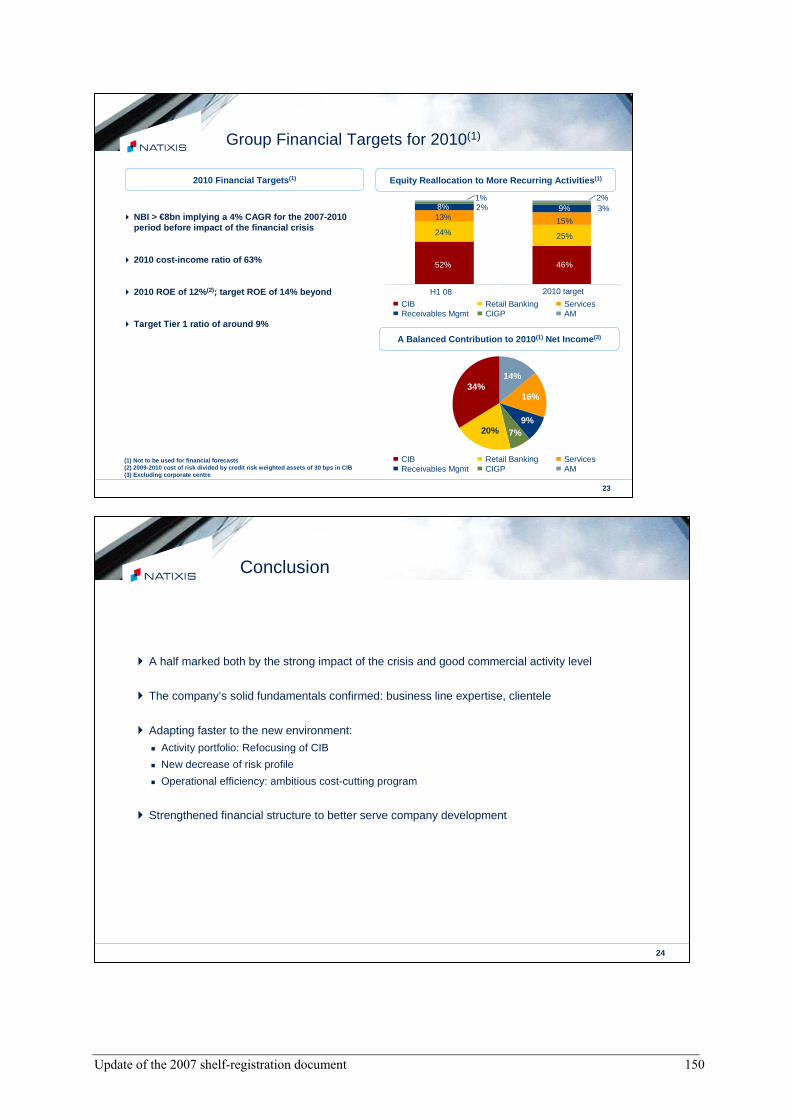
Update of the 2007 shelf-registration document 150
24
Conclusion
� A half marked both by the strong impact of the crisis and good commercial activity level
� The company’s solid fundamentals confirmed: business line expertise, clientele
� Adapting faster to the new environment:
� Activity portfolio: Refocusing of CIB
� New decrease of risk profile
� Operational efficiency: ambitious cost-cutting program
� Strengthened financial structure to better serve company development
23
Group Financial Targets for 2010(1)
2010 Financial Targets (1) Equity Reallocation to More Recurring Activities (1)
� NBI > €8bn implying a 4% CAGR for the 2007-2010 period before impact of the financial crisis
� 2010 cost-income ratio of 63%
� 2010 ROE of 12% (2); target ROE of 14% beyond
� Target Tier 1 ratio of around 9%
H1 08 2010 target
52%
24%
13%8% 2%
1%
46%
25%
15%
9% 3%2%
A Balanced Contribution to 2010 (1) Net Income (3)
CIB Retail Banking ServicesReceivables Mgmt CIGP AM
34%14%
16%
20% 7%9%
CIB Retail Banking ServicesReceivables Mgmt CIGP AM
(1) Not to be used for financial forecasts(2) 2009-2010 cost of risk divided by credit risk weight ed assets of 30 bps in CIB(3) Excluding corporate centre
Update of the 2007 shelf-registration document 151
Half-year results as at June 30, 2008 The following presentation summarizes the key points of the half-year results of Natixis as at June 30,
2008. This presentation contains specific information, particularly in part 3, on sensitive exposures which
comply with the matrices distributed by the Financial Stability Forum.
This information forms an integral part of the half-year report on the activities of Natixis SA as at June
30 2008 and is therefore covered by specific audits, conducted by the Statutory Auditors, of financial
information for the first 6 months of the fiscal year (paragraph 2 of the report).
Update of the 2007 shelf-registration document 152
2
Disclaimer
This presentation may contain objectives and comments relating to the objectives and strategy of Natixis. Any such objectives inherently depend on assumptions, project considerations, objectives and expectations linked to future events, transactions, products and services as well as on suppositions regarding future performance and synergies.
No assurance can be given that such objectives will be realized. They are subject to inherent risks and uncertainties and are based on assumptions relating to Natixis, its subsidiaries and associates and the business development thereof; trends in the sector; future acquisitions and investments; macroeconomic conditions and conditions in Natixis' principal local markets; competition and regulation. Occurrence of such events is not certain, and outcomes may prove different from current expectations, significantly affecting expected results. Actual results may differ significantly from those implied by such objectives. Natixis shall in no event have any obligation to publish modifications or updates of such objectives.
Information in this presentation relating to parties other than Natixis or taken from external sources has not been subject to independent verification, and Natixis makes no warranty as to the accuracy, fairness or completeness of the information or opinions in this presentation. Neither Natixis nor its representatives shall be liable for any errors or omissions or for any harm resulting from the use of this presentation, the content of this presentation, or any document or information referred to in this presentation.
Results as at June 30, 2008

Update of the 2007 shelf-registration document 153
4Group results
� €1.5 billion in NBI, of which:� €789 million refers to monolines� €414 million refers to ABS CDOs
containing subprime� €192 million refers to RMBS
� €172 million in cost of risk on credit enhancers
-1,017
-123*
70
0
-964
-36
209
-1,136
2
193
-1,332
-281
-1,052
-1,238
186
1,509
1,695
Q2-08
1,014
-41
178
11
866
-50
-231
1,147
8
251
889
18
870
-1,357
2,227
18
2,245
Q2-07
4,1963,500NBI before impact of the crisis
351,948Impact of the crisis
1,565-948Net income, Group share
-60-159*Net restructuring expenses
17870Net restructuring income
180Income from discontinued operations
1,430-859Underlying net income, Group share
-70-57Minority interests
-436204Taxes
1,937-1,006Income before taxes
911Gains or losses on other assets
402300Equity method
1,525-1,318Operating income
-11-374Cost of risk
1,536-944Gross operating income
-2,624-2 496Expenses
4,1611,552NBI
H1-07H1-08In millions of euros
Consolidated income statement
� Income:� NBI: -63% vs. H1-07
� Slowdown in investment banking NBI
� Good volume of business in other areas
� Decrease in expenses:� -9% vs. Q2-07
� -5% vs. H1-07
� Net underlying income: -€859 million in H1-08
� Non-operating items* which compensate each other for the most part
* Specifically including an expense related to the job adaptation plan (gross provision of €127 million)
3
Contents
1 −−−− Group results
2 −−−− Results of divisions
3 −−−− Specific information on sensitive exposure(FSF recommendations)
4 −−−− Quarterly series
5 −−−− Miscellaneous
� Methodology used - the quarterly information through out this document takes into account:
� Reclassification of leasing and international services activities (Natixis Pramex International and Natixis Algérie) from CIB to Services
� Amendments to compensation analysis agreements for allocated capital and allocation of structure expenses
� Allocated capital according to Basel II rules (already in effect in Q1-08)
� See bridge tables on pages 46, 47, 48
� Definitions
� ROE Groupe : Net income group share / Average equity
� ROE métiers : Underlying net income group share / Average allocated capital
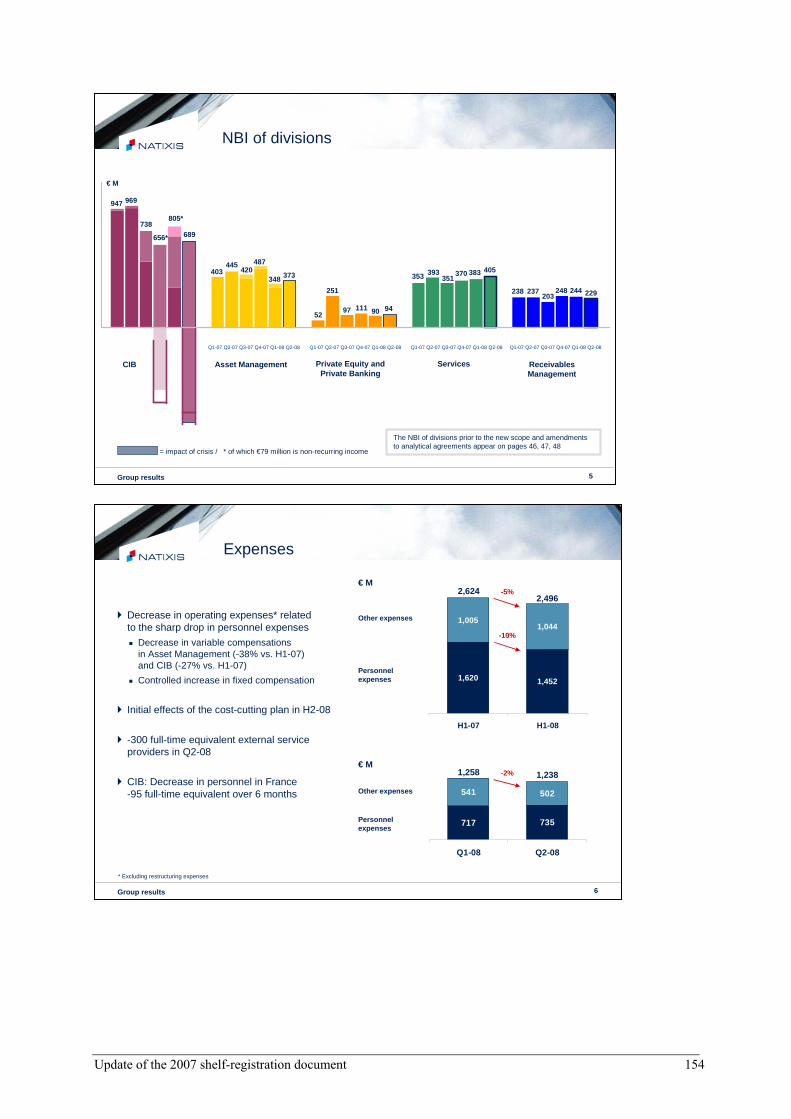
Update of the 2007 shelf-registration document 154
6
Expenses
� Decrease in operating expenses* related to the sharp drop in personnel expenses
� Decrease in variable compensations in Asset Management (-38% vs. H1-07) and CIB (-27% vs. H1-07)
� Controlled increase in fixed compensation
� Initial effects of the cost-cutting plan in H2-08
� -300 full-time equivalent external service providers in Q2-08
� CIB: Decrease in personnel in France -95 full-time equivalent over 6 months
Group results
€ M
Other expenses
1,4521,620
1,0441,005
H1-07 H1-08
Personnel expenses
-10%
-5%2,6242,496
* Excluding restructuring expenses
€ M
Other expenses
735
502
717
541
Q1-08 Q2-08
Personnel expenses
-2%1,258 1,238
5
NBI of divisions
Q1-07 Q2-07 Q3-07 Q4-07 Q1-08 Q2-08
Asset Management ServicesPrivate Equity and Private Banking
Receivables Management
CIB
= impact of crisis / * of which €79 million is non-recurring income
€ M
Q1-07 Q2-07 Q3-07 Q4-07 Q1-08 Q2-08 Q1-07 Q2-07 Q3-07 Q4-07 Q1-08 Q2-08 Q1-07 Q2-07 Q3-07 Q4-07 Q1-08 Q2-08
Group results
The NBI of divisions prior to the new scope and amendments to analytical agreements appear on pages 46, 47, 48
947 969
738
656*
805*
689
403445
420487
348 373
52
251
97 111 90 94
353 393351
370 383 405
238 237203
248 244 229
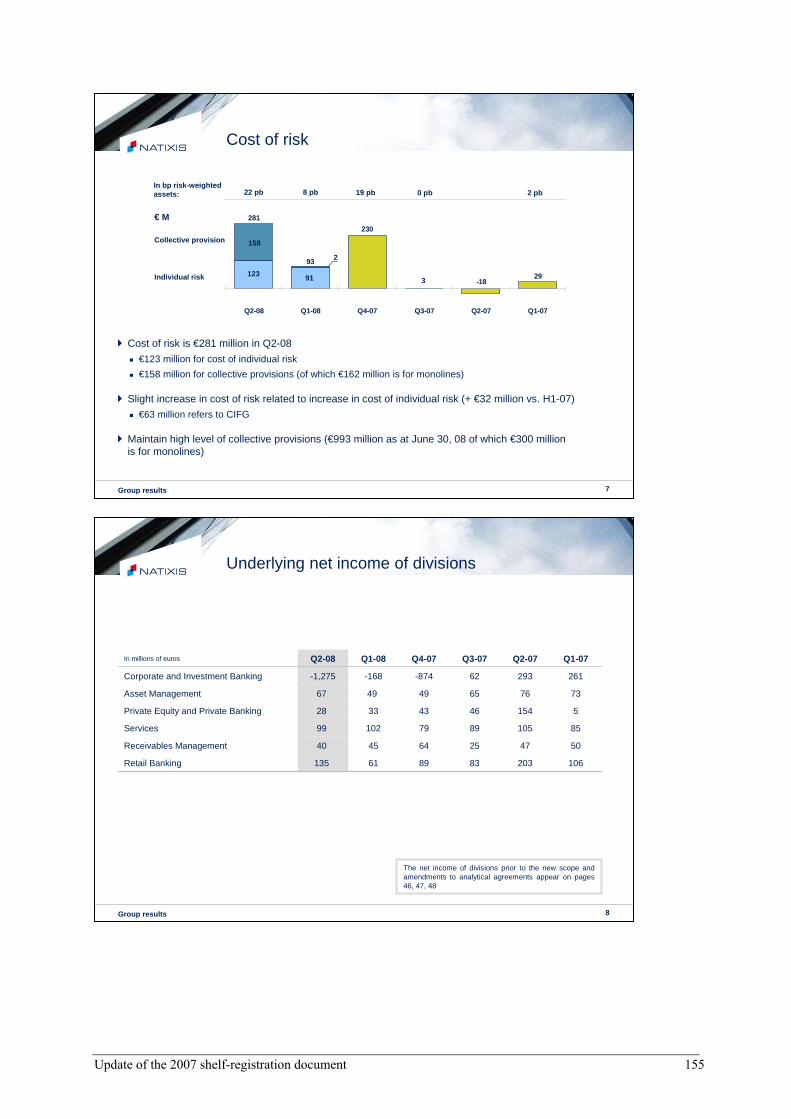
Update of the 2007 shelf-registration document 155
8
Underlying net income of divisions
Group results
106203838961135Retail Banking
504725644540Receivables Management
85105897910299Services
515446433328Private Equity and Private Banking
737665494967Asset Management
26129362-874-168-1,275Corporate and Investment Banking
Q1-07Q2-07Q3-07Q4-07Q1-08Q2-08In millions of euros
The net income of divisions prior to the new scope and amendments to analytical agreements appear on pages 46, 47, 48
7
Cost of risk
� Cost of risk is €281 million in Q2-08
� €123 million for cost of individual risk
� €158 million for collective provisions (of which €162 million is for monolines)
� Slight increase in cost of risk related to increase in cost of individual risk (+ €32 million vs. H1-07)
� €63 million refers to CIFG
� Maintain high level of collective provisions (€993 million as at June 30, 08 of which €300 million is for monolines)
Group results
3
281
93
230
-1829
Q2-08 Q1-08 Q4-07 Q3-07 Q2-07 Q1-07
22 pb 8 pb 19 pb 0 pb 2 pbIn bp risk-weightedassets:
123
158
91Individual risk
Collective provision
2
€ M
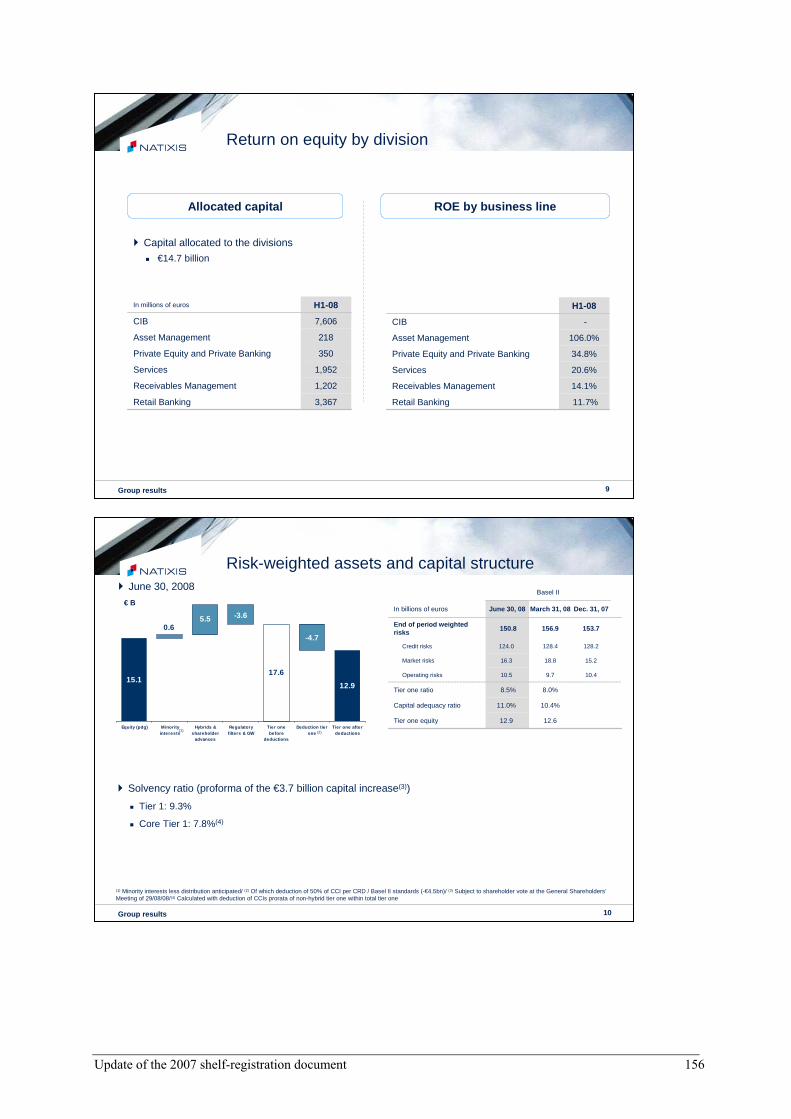
Update of the 2007 shelf-registration document 156
10
Risk-weighted assets and capital structure
� Solvency ratio (proforma of the €3.7 billion capital increase(3))
� Tier 1: 9.3%
� Core Tier 1: 7.8%(4)
12.915.1
17.6
0.65.5
-4.7
-3.6
Equity (pdg) Minorityinterests
Hybrids &shareholder
advances
Regulatoryfilters & GW
Tier onebefore
deductions
Deduction tierone
Tier one afterdeductions
€ B
(1) Minority interests less distribution anticipated/ (2) Of which deduction of 50% of CCI per CRD / Basel II standards (-€4.5bn)/ (3) Subject to shareholder vote at the General Shareholders’ Meeting of 29/08/08/(4) Calculated with deduction of CCIs prorata of non-hybrid tier one within total tier one
Group results
10.4
15.2
128.2
153.7
Dec. 31, 07
156.9150.8End of period weighted risks
128.4124.0Credit risks
18.816.3Market risks
9.710.5Operating risks
12.612.9Tier one equity
10.4%11.0%Capital adequacy ratio
8.0%8.5%Tier one ratio
March 31, 08June 30, 08 In billions of euros
Basel II
(1) (2)
� June 30, 2008
9
Return on equity by division
� Capital allocated to the divisions
� €14.7 billion
Allocated capital ROE by business line
3,367Retail Banking
1,202Receivables Management
1,952Services
350Private Equity and Private Banking
218Asset Management
7,606CIB
H1-08In millions of euros
11.7%
14.1%
20.6%
34.8%
106.0%
-
H1-08
Retail Banking
Receivables Management
Services
Private Equity and Private Banking
Asset Management
CIB
Group results
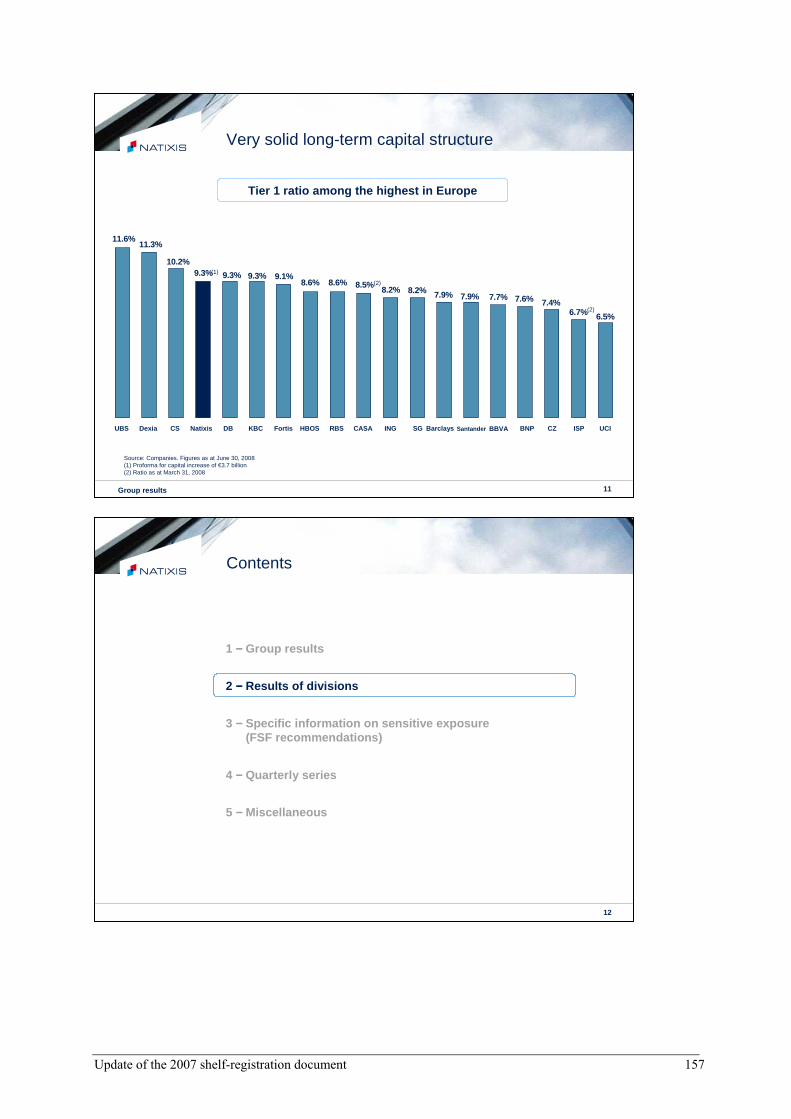
Update of the 2007 shelf-registration document 157
12
Contents
1 −−−− Group results
2 −−−− Results of divisions
3 −−−− Specific information on sensitive exposure(FSF recommendations)
4 −−−− Quarterly series
5 −−−− Miscellaneous
11
11.6%11.3%
10.2%9.3% 9.3% 9.3% 9.1%
8.6% 8.6% 8.5%8.2% 8.2% 7.9% 7.9% 7.7% 7.6% 7.4%
6.7% 6.5%
Very solid long-term capital structure
Tier 1 ratio among the highest in Europe
Source: Companies. Figures as at June 30, 2008(1) Proforma for capital increase of €3.7 billion (2) Ratio as at March 31, 2008
(1)
(2)
(2)
Group results
UBS Dexia CS Natixis DB KBC Fortis HBOS RBS CASA ING SG Barclay s BBVASantander BNP CZ ISP UCI
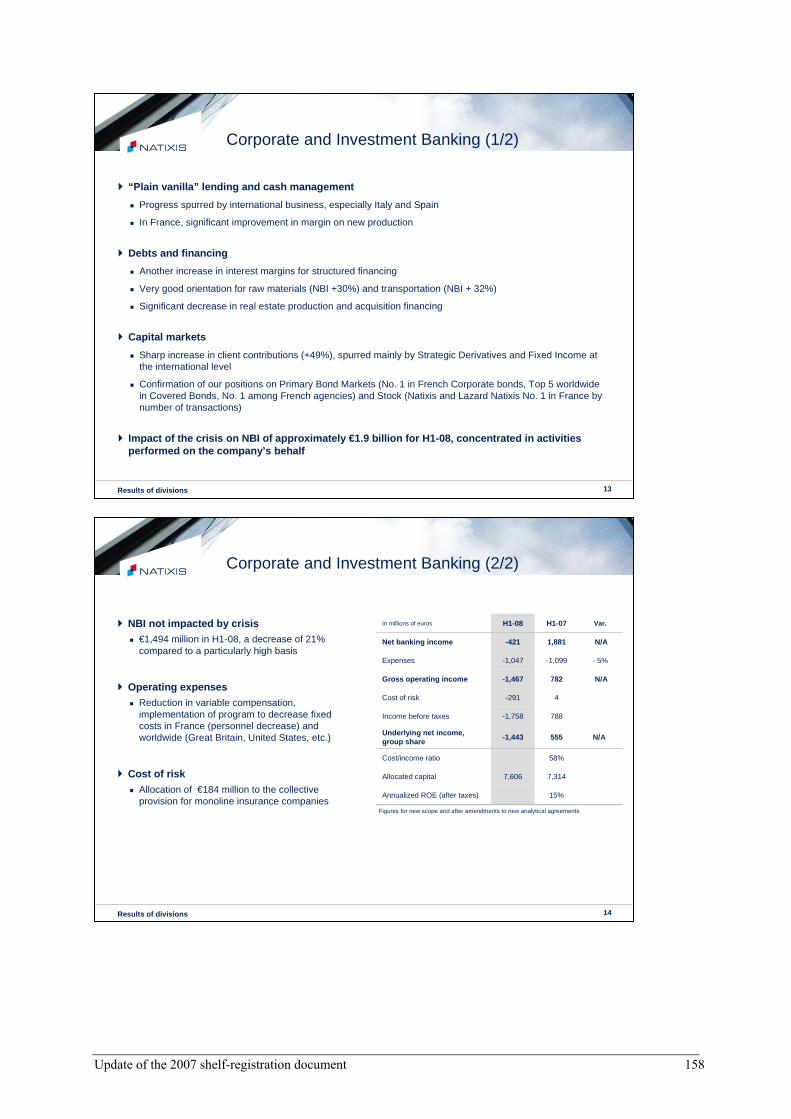
Update of the 2007 shelf-registration document 158
14
Corporate and Investment Banking (2/2)
15%Annualized ROE (after taxes)
7,3147,606Allocated capital
58%Cost/income ratio
N/A555-1,443Underlying net income, group share
788-1,758Income before taxes
4-291Cost of risk
N/A782-1,467Gross operating income
- 5%-1,099-1,047Expenses
N/A1,881-421Net banking income
Var.H1-07H1-08In millions of euros
Results of divisions
� NBI not impacted by crisis� €1,494 million in H1-08, a decrease of 21%
compared to a particularly high basis
� Operating expenses� Reduction in variable compensation,
implementation of program to decrease fixedcosts in France (personnel decrease) and worldwide (Great Britain, United States, etc.)
� Cost of risk� Allocation of €184 million to the collective
provision for monoline insurance companiesFigures for new scope and after amendments to new analytical agreements
13
Corporate and Investment Banking (1/2)
Results of divisions
� “Plain vanilla” lending and cash management
� Progress spurred by international business, especially Italy and Spain
� In France, significant improvement in margin on new production
� Debts and financing
� Another increase in interest margins for structured financing
� Very good orientation for raw materials (NBI +30%) and transportation (NBI + 32%)
� Significant decrease in real estate production and acquisition financing
� Capital markets
� Sharp increase in client contributions (+49%), spurred mainly by Strategic Derivatives and Fixed Income atthe international level
� Confirmation of our positions on Primary Bond Markets (No. 1 in French Corporate bonds, Top 5 worldwidein Covered Bonds, No. 1 among French agencies) and Stock (Natixis and Lazard Natixis No. 1 in France by number of transactions)
� Impact of the crisis on NBI of approximately €1.9 bil lion for H1-08, concentrated in activitiesperformed on the company’s behalf

Update of the 2007 shelf-registration document 159
16
Asset Management (2/2)
152%106%Annualized ROE (after taxes)
196218Allocated capital
72%73%Cost/income ratio
-14%-22%149116Underlying net income, group share
-20%244195Income before taxes
03Cost of risk
-13%-20%234188Gross operating income
-19%-614-500Expenses
-11%-19%849688Net banking income
Var. constant exchange
rates
Var.H1-07H1-08In millions of euros
Results of divisions
� NBI: -11% at constant exchange rates
� Impact of the crisis: - €33 million
� Drop in performance fees in relation to an increased basis in the H1-07 in alternative funds and real estate funds
� Slight decrease in average AuM (-0.8%) at constant exchange rates
� Slight increase in GOI before impact of crisis, at constant exchange rates: +2%
� Decrease in expenses (-11% at constant exchange rates) due to the sharp drop in variable compensation
Figures for new scope and after amendments to new analytical agreements
15
23%
3%
17%
35%12%
11%
18%
21%
16%
34%
7% 5%
Asset Management (1/2)
� Very good level of new money in the six-month period, despite persistent financial crisis: €13.5 billion
� Assets managed: €564 billion with a limited decrease of 1.7% vs. end of 2007 managed assets, on a comparable basis, despite a very negative market effect (- €23.5 billion)
� Europe: €378 billion in assets managed� Net new money: €9 billion
� Assets under management: a decrease of 3.6% due to market effect and LBPAM’s return to managing assets under CNP life insurance contracts sold by Banque Postale(1st tranche of €7.9 billion in April ‘08 and balance of €63 billion in December ‘08)
� United States: assets increased to US$293 billion� Net new money: US$8 billion
� Integration of Gateway strengthening the position de NGAM in alternative funds (US$7.7 billion)
� NGAM well rewarded in its ratings, especially:� For its global strategy: NGAM asset management firm
of the year (Global Investor)
� For the quality of management by affiliates: Loomis top fund family equities (Lipper), numerous distinctions for NAM (especially 2 Le Revenu awards)
Assets under Management
By asset class
Results of divisions
Bonds
Equitiesand diversified
Insurancemandates
Real estate
Money market
Alternativeand structured
* Including - €7.9 billion LBPAM
By distribution channel
Insurance
Direct distribution Europe
Direct distribution US
Employeesavings
Parent companynetworks
Externaldistributors
590.5
564.3
-23.513.5-13.3
-2.9* 574.3
Outstanding31/12/07
FOREXeffect
Consolid.effect
New moneyH1-08
MarketeffectH1-08
Outstanding30/6/08

Update of the 2007 shelf-registration document 160
18
29.7
31.7
3.45.9
541569
Services (1/2)
� Insurance: 7% increase in Life Insurance assets and pursuit of BP and CEP network client equipment for personal risk insurance activity, within the generalcontext of a decrease in turnover of banking and insurance providers
� Sureties and guarantees: Dynamics of the corporate market provided by sureties to companies
� Leasing: distinct increase in new production, NBI decreased by 7% due to exceptional elements in H1-07
� Consumer credit: commercial dynamics maintainedon both networks, NBI increased by 8%
� Employee benefit planning: good increase in income(+13%) due to commercial dynamics, despite measuresto release profit sharing
� Payments: NBI +9%, continued developmentof e-money transactions
Life insurance
Consumer finance
E-money transactions
+7%Outstanding€ B
Outstanding€ B +74%
Number of transactionsMillions +5%
Results of business lines
June 30, 08June 30, 07
June 30, 08June 30, 07
H1-08H1-07
17
Private Equity and Private Banking
� Private Equity
� NBI: €125 million
� Capital gains realized: €158 million, of which €137 million is in Q2-08
� Increase in net allocations to provisions
� AuM: €4.1 billion, a 12% increase vs. end of 2007
� 48% in own funds, 52% third-party funds
� Private Banking
� NBI: €59 million, a 5% decrease but a clear improvement in Q2-08 (+12% vs. Q1-08)
� AuM: €16 billion, a decrease of 6% vs. end of June 2007
� Good dynamics of new wealth management funds despite difficult market environment
97%35%Annualized ROE (after taxes)
328350Allocated capital
27%47%Cost/income ratio
-62%15961Underlying net income, group share
-56%22297Income before taxes
0-2*Cost of risk
-56%22298Gross operating income
+7%-81-86Expenses
-39%303184Net banking income
Var.H1-07H1-08In millions d'euros
Results of business lines
Figures for new scope and after amendments to new analytical agreements
* For Private Banking
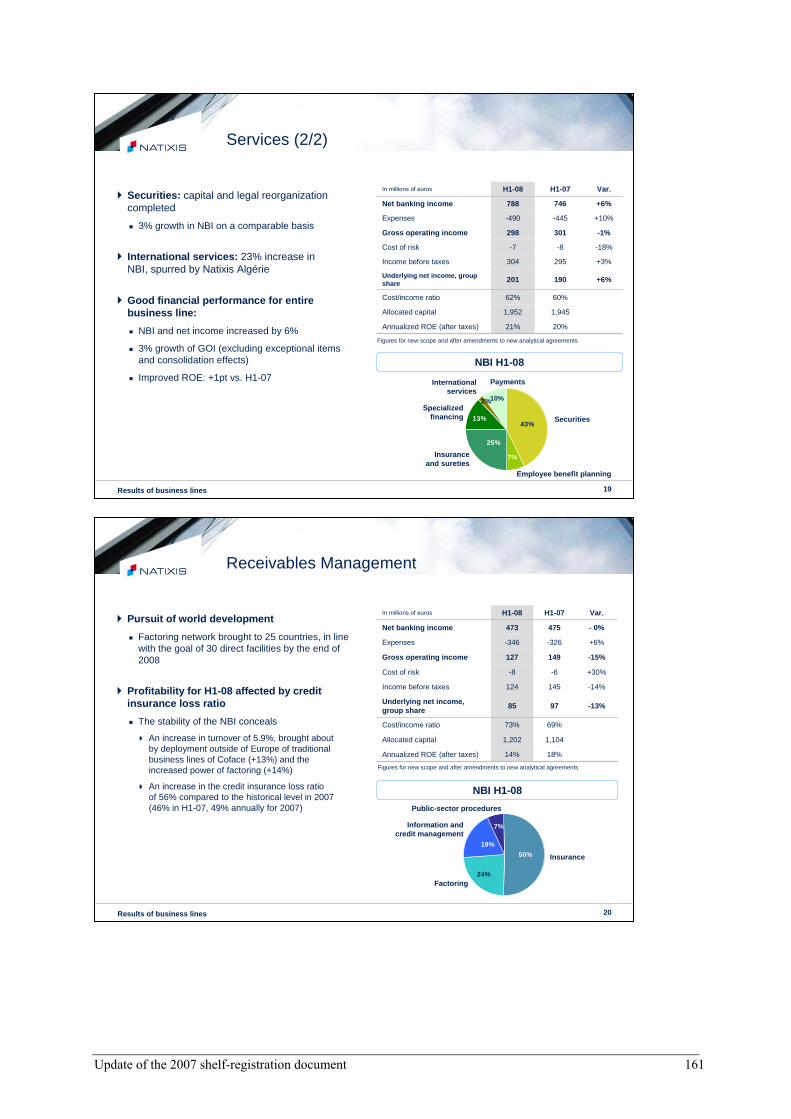
Update of the 2007 shelf-registration document 161
20
Receivables Management
18%14%Annualized ROE (after taxes)
1,1041,202Allocated capital
69%73%Cost/income ratio
-13%9785Underlying net income, group share
-14%145124Income before taxes
+30%-6-8Cost of risk
-15%149127Gross operating income
+6%-326-346Expenses
- 0%475473Net banking income
Var.H1-07H1-08In millions of euros
Factoring
Information andcredit management
Insurance
Public-sector procedures
19%
7%
24%
50%
Results of business lines
� Pursuit of world development
� Factoring network brought to 25 countries, in line with the goal of 30 direct facilities by the end of 2008
� Profitability for H1-08 affected by creditinsurance loss ratio
� The stability of the NBI conceals
� An increase in turnover of 5.9%, brought about by deployment outside of Europe of traditionalbusiness lines of Coface (+13%) and the increased power of factoring (+14%)
� An increase in the credit insurance loss ratio of 56% compared to the historical level in 2007 (46% in H1-07, 49% annually for 2007)
NBI H1-08
Figures for new scope and after amendments to new analytical agreements
19
25%
13%
7%
43%
2%10%
Services (2/2)
� Securities: capital and legal reorganizationcompleted
� 3% growth in NBI on a comparable basis
� International services: 23% increase inNBI, spurred by Natixis Algérie
� Good financial performance for entirebusiness line:
� NBI and net income increased by 6%
� 3% growth of GOI (excluding exceptional itemsand consolidation effects)
� Improved ROE: +1pt vs. H1-07
20%21%Annualized ROE (after taxes)
1,9451,952Allocated capital
60%62%Cost/income ratio
+6%190201Underlying net income, group share
+3%295304Income before taxes
-18%-8-7Cost of risk
-1%301298Gross operating income
+10%-445-490Expenses
+6%746788Net banking income
Var.H1-07H1-08In millions of euros
Insuranceand sureties
Specializedfinancing Securities
Payments
Employee benefit planning
Internationalservices
Results of business lines
Figures for new scope and after amendments to new analytical agreements
NBI H1-08

Update of the 2007 shelf-registration document 162
22
Banques Populaires (cumulative)
� NBI excluding PEL/CEL: +2.2% at €2,973 million
� Net increase in fees of +5.8%, brought about by the development of services and insurance
� Stable interest margin in a very demanding market environment
� Stable cost of risk vs. H1-07, at 31 bpof risk-weighted assets
� Good commercial performance in a difficult market:
� Pursuit of the dynamics of new business, with 81,000 additional individual clients during the six-month period
� Sustained growth of asset and liability savings of+9.1% to €102 billion with a sharp increase in time deposits of +40.7%
� Financial savings marked by an unfavorable stock market: -2.3% to €68 billion
� Savings managed: +4.2%, to €170 billion
� Vigorous progression of loans:� Individuals: +12.2% to €69 billion
� Companies: +12.5% to €60 billion
-11%
-17%
+9%
-9%
+3%
-2%
Var.
62.7%61%63%Cost/income ratio
745660Net income, Group share
1,056880Income before taxes
-183-200Cost of risk
+0.4%1,1791,072Gross operating income
-1,806-1,864Expenses
+2.2%2,9852,936Net banking income
Var.*H1-07H1-08In millions of euros
Results of business lines
Acquisition of 7 Regional Banks from HSBC France in July 2008
� Strengthening of the network in southern France with :
� 2,950 employees� 400 branches� servicing 425,000 individual clients
and 62,000 business clients
* Variation excluding PEL / CEL effect
21
Caisses d’Epargne (cumulative)
64%74%Cost/income ratio
- 36%872556Net income, group share
- 45%1,176652Income before taxes
- 25- 98Cost of risk
- 38%1,200749Gross operating income
+ 3%- 2,118- 2,182Expenses
- 12%3,3182,931Net banking income
Var.H1-07H1-08In millions of euros
� Very good commercial performance in a difficulteconomic environment:� Record money inflows in the first half, already in excess
of 2007 inflows (a very dynamic year)
� Sales dynamics: 174,000 new packages and more than 313,000 new cards
� Loans: 8.8% asset increase and margin rate preserved
� Tight control over management costs: 2% decreasein recurring data, including the restatement of restructuringexpenses (merger of the Caisses d’Epargne banks and migration toward a single information system platform)
� Cost of risk contained at a low level compared with client loans (H1-07 reference atypical as it includes exceptionalprovision reversals)
� Excluding effects on financial portfolios*, NBI sligthlydown: 1%
� Audited NBI is down 12%, affected by the financialcontext:� On financial portfolios** and the increase in the price
of resources
� On client behavior (risk aversion combined with attractive remuneration on liquid products both translate in a decreasein sale of new life insurance contracts or mutual funds)
Results of divisions
* Represent a liquidity reserve of more than €20 billion at June 30, 2008** Negative effect which should strongly decrease in H2-08 / H1-08
Recurring data
Audited data
- 2%1,009989Income before taxes
24%- 55- 68Cost of risk
- 0.2 pt 66.8%66.6%Cost/income ratio
- 1%1,0641,057Gross operating income
+ 2%- 2,144- 2,111Expenses
- 1%3,2083,168Net banking income
in %H1-07Recurring
H1-08Recurring
In millions of euros

Update of the 2007 shelf-registration document 163
24
Contents
1 −−−− Group results
2 −−−− Results of divisions
3 −−−− Specific information on sensitive exposure(FSF recommendations)
4 −−−− Quarterly series
5 −−−− Miscellaneous
23
Retail Banking (contribution)
Results of business lines
745660From Banques Populaires
872556From Caisses d’Epargne
179135From Banques Populaires
212148From Caisses d’Epargne
-28%391283Contribution to equity accounting line
-25%1,6171,216Cumulative income (100%)
-30%352246Contribution to Natixis net income
-6% -39-36Tax on CCIs
--19Reevaluation surpluses
-13%6759Accretion profit
-25%323243QP equity method accounting
Var.H1-07H1-08In millions of euros

Update of the 2007 shelf-registration document 164
26
CDOs (1/3)
� Net exposure of CDOs� Writedown rate on non-diversified CDOs: 80%� Writedown rate on diversified CDOs: 15%
Non-diversified
CDOs
DiversifiedCDOs
1,135
1,334
19
81.4%
-82
-82
3.1%
6.3%
70.8%
12.9%
83.7%
80%
Mezzanine
Trading
Supersenior
101
#8
197
963
TOTAL
111342441352132034Net exposure (as at 30/06/08)
34.1%9.0%13.3%21.9%94.9%92.2%81.7%total % writedowns of CDOs (as at 30/06/08)
-57-28-68-70-152-14-11with change in value in H1-08
-57-34-68-98-238-235-154Cumulative losses in value and writedowns (as at 30 June 2008)
Writedowns
10.9%3.0%2.4%4.5%10.0%10.6%1.2%% prime assets
0.5%1.7%1.6%0.6%5.9%8.4%1.5%% Alt-A assets
8.0%4.2%5.8%3.0%14.9%31.8%78.0%2006 & 2007
62.7%8.5%12.1%16.6%40.7%37.6%14.3%= 2005
70.7%12.7%17.9%19.6%55.6%69.4%92.3%% subprime assets
Underlying assets
42.0%13.5%20.0%0.2%60.3%20 CDOs
Aver.: 28%/Min: 10%
28.6%Point of attachment
MezzanineHigh GradeHigh GradeHigh GradeMezzanineMezzanineMezzanineNature of underlying assets
TradingFair Value OptionTradingTradingTradingTradingTradingAccounting portfolio
Supersenior
376
#6
Supersenior
251
#3
Superseniorfor 87%
508
#5
Superseniorfor 86%
450
#4
Mezzanine
255
#2
Supersenior
168
#7
Supersenior
for 91%Nature of tranche
Qualitative data
188Gross nominal exposure(as at 30/06/08)
#1In millions of euros
* not hedged Diversified CDOs
Specific information on sensitive exposure
ABS CDOs* exposed to U.S. housing market
25
ContentsSpecific information on sensitive exposure
� CDO
� ABS CDOs exposed to U.S. housing market
� Assumptions of valuations and sensitivities
� Other CDOs
� Protection purchased (from monolines and other counterparties)
� Monolines
� Residual exposure to counterparty risk of monoline insurers
� Valuation methodology
� CMBS and CRE CDO
� RMBS
� Securitization and conduits
� LBO Financing
Specific information on sensitive exposure

Update of the 2007 shelf-registration document 165
28
17%11%
68%
CDOs (3/3)
� Value adjustments: €75 million in H1-08 in income
� Residual exposure: €2,626 millionof which CLO is 69%
� Breakdown of residual exposure by rating:
Specific information on sensitive exposure
BBB / 3%BB / 1%
AA
AAA
A96% A or better68% AAA
Exposure to other CDOs (not exposed to U.S. housing mar ket)
27
CDOs (2/3)
� Methodology used� Conservative definition of “subprime” category (FICO score of 660)
� Subprime: 25% loss rates used for 2006/2007 vintages and 10% for 2005 vintage
� Alt-A: correlation at 55% (of loss rate assumptions used for subprime)
� Allocation to operations integrated in collateral rated CCC+ or less with a loss of 95%
� Valuation of non-subprime underlying assets based upon a writedown grid including the type, rating and vintage of the operations
25%25%10%as at June 30, ‘08
23%
2006
23%9%as at December 31, ‘07
20072005
� Sensitivity analysis of the fair market value of CDOs: change in cumulative loss rates of 27.5% for 2006/2007 and 11% for 2005
- €47 millionChange in cumulative loss rates
Potential impact on NBI
Specific information on sensitive exposure
Production in ‘06 & ‘07
-87%
-91%
A and +
-95%N/AABX
-95%-51%Natixis
BBB and -Production in 2005
Assumptions for valuation and sensitivities
� Writedown rate of subprime assets included in ABS CDOs
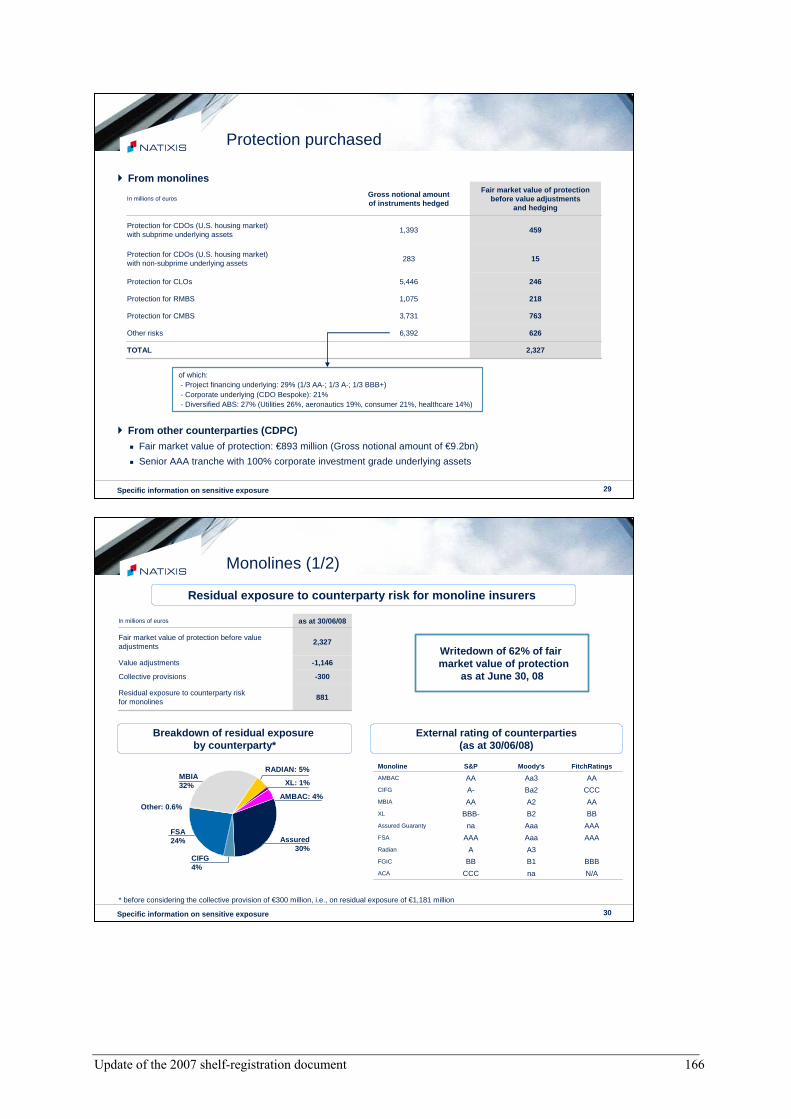
Update of the 2007 shelf-registration document 166
30
Monolines (1/2)
* before considering the collective provision of €300 million, i.e., on residual exposure of €1,181 million
881Residual exposure to counterparty riskfor monolines
-300Collective provisions
-1,146Value adjustments
2,327Fair market value of protection before value adjustments
as at 30/06/08In millions of euros
Writedown of 62% of fair market value of protection
as at June 30, 08
Breakdown of residual exposureby counterparty*
External rating of counterparties(as at 30/06/08)
N/AnaCCCACA
BBBB1BBFGIC
A3ARadian
AAAAaaAAAFSA
AAAAaanaAssured Guaranty
BBB2BBB-XL
AAA2AAMBIA
CCCBa2A-CIFG
AAAa3AAAMBAC
FitchRatingsMoody'sS&PMonoline
Specific information on sensitive exposure
Residual exposure to counterparty risk for monoline ins urers
Assured30%
CIFG4%
FSA24%
Other: 0.6%
MBIA32%
RADIAN: 5%
XL: 1%
AMBAC: 4%
29
Protection purchased
� From monolines
2,327TOTAL
6266,392Other risks
7633,731Protection for CMBS
2181,075Protection for RMBS
2465,446Protection for CLOs
15283Protection for CDOs (U.S. housing market) with non-subprime underlying assets
4591,393Protection for CDOs (U.S. housing market) with subprime underlying assets
Fair market value of protection before value adjustments
and hedging
Gross notional amountof instruments hedged
In millions of euros
� From other counterparties (CDPC)� Fair market value of protection: €893 million (Gross notional amount of €9.2bn)
� Senior AAA tranche with 100% corporate investment grade underlying assets
Specific information on sensitive exposure
of which:- Project financing underlying: 29% (1/3 AA-; 1/3 A-; 1/3 BBB+)- Corporate underlying (CDO Bespoke): 21%- Diversified ABS: 27% (Utilities 26%, aeronautics 19%, consumer 21%, healthcare 14%)

Update of the 2007 shelf-registration document 167
32
BBB+Not rated /2%
CMBS and CRE CDO
1,166-1131,280Total
445-33478AFS portfolio
130-7137Fair value option portfolio
591-74665Trading portfolio
dt H1-08
Net exposure (net of losses in value) as at 30/06/08
Losses in value and/or writedownsGross exposure (before losses in
value/writedowns) as at 30/06/08In millions of euros
(1) Not hedged / (2) on net exposure
Breakdown of CMBS (2) by
8%13%
61%
15%
AA A
AAA
12%
15%
23%
49%
United States
Europe
� CRE CDO� €100 million (of which 60% is included in the table of ABS CDOs exposed to the U.S. housing market)
Specific information on sensitive exposure
Germany
UK
� CMBS(1)
31
Monolines (2/2)
� Fair market value of protection before value adjustmen ts� The economic exposure of ABS CDOs containing subprime was determined by using the method
detailed in chart 27
� The economic exposure of other types of assets was determined by using either Mark-to-Market or Mark-to-Model
� Value adjustments� Three monoline groups are differentiated according to their credit rating and level of market spreads.
They are therefore allocated different probabilities of default (PD)
� Regardless of the group, Recovery in case of default (R) is fixed at 10%
� The specific provision is defined as the Mark-to-Market (or Mark-to-Model) amount multipliedby the expected loss (Expected loss = PD x (1-R) ) in each monoline
� A collective provision is also allocated
CIFG, FGIC, XL, ACA100%Group 3
MBIA, AMBAC, RADIAN50%Group 2
FSA, Assured guaranty15%Group 1
MonolinePD
Specific information on sensitive exposure
Valuation methodology

Update of the 2007 shelf-registration document 168
34
RMBS (2/2)
� Other RMBS (1): €1.2 billion (Netherlands 35%, Italy 31% and Portugal 13%)
-70
-54
-5
-11
Cumulative
899
511
159
230
Gross exposure(before losses in
value/writedowns) as at 30/06/08
845-54TOTAL
-9%6%23%62%469-41AFS portfolio
8%4%4%85%155-4Fair market value option portfolio
-5%--95%221-9Trading portfolio
Non IGBBBAAAAAAdt H1-08
RatingsNet exposure(net of losses in value)
as at 30/06/08
Losses in value and/or writedowns
In millions of euros
Specific information on sensitive exposure
� RMBS UK (1)
� RMBS Spain (1)
-57
-27
-11
-18
Cumulative
927
402
78
447
Gross exposure(before losses in value/writedowns)
as at 30/06/08
883-44TOTAL
-2%--98%379-23AFS portfolio
-24%37%3%37%74-4Fair market value option portfolio
--2%-98%430-17Trading portfolio
Non IGBBBAAAAAAdt H1-08
RatingsNet exposure(net of losses in value)
as at 30/06/08
Losses in value and/or writedowns
In millions of euros
(1) Not hedged
33
68%
13%
11%
RMBS (1/2)
Subprime
Prime
US Agencies
-628
-30
-598
-253
-
-345
Cumulative
1,795-3192,114SUB-TOTAL
3,849-203,869US Agencies
5,644-3395,983TOTAL
725
33
1,356
Gross exposure (beforelosses in value/writedowns)
as at 30/06/08
628-97AFS portfolio
33-Loans & receivables portfolio
1 134-222Trading portfolio
dt H1-08
Net exposure(net of losses in value)
as at 30/06/08
Losses in value and/or writedowns
In millions of euros
Breakdown of RMBS (2)
Alt-A
Specific information on sensitive exposure
� RMBS US (1)
8%
(1) Not hedged / (2) on net exposure
9% 5%
73%
AA
AAA
ABBB : 5%
Non IG : 8%

Update of the 2007 shelf-registration document 169
36
LBO Financing (1/2)
� Average outstanding� Final shares: €15 million� U.S. final shares: €11 million
� Senior shares: 98%
� Collective provision: €350 million
6,0836,305TOTAL
602537Commitments (booked)
3428Number of files
Shares to be sold
5,4815,768Commitments (booked)
358374Number of files
Final shares
Dec. 31, 07June 30, 08In millions of euros
6,305280-30-7086816,083TOTAL
537602Shares to be sold
5,7685,481Final shares
LBO Exposure
Net exposure -writedowns/
losses in valueas at 30/05/08
Other activity(including forex
effect) in H1-08
Losses in value/writedows
in H1-08
Sales/ transfersin H1-08
New exposurein H1-08
Exposurenet of
writedowns/losses in valueas at 31/12/2007
In millions of euros
Specific information on sensitive exposure
Exposure relative to leveraged operations
Evolution of exposure relative to leveraged operation s
35
Securitization and conduits
� Securitization for Natixis: €166 million (of which 88% is CLO)
� Conduits
� Lines extended to conduits sponsored only by third parties: none
Conduits sponsored by Natixis
-14%--Corporate loans
----Non investment grade
6%6%--Not rated (implied investment grade)
----BBB
4%23%--A
66%33%30%100%AA
24%38%70%-AAA
Breakdown of assets by external rating16%-82%*100%**Others
--18%-France
4%5%--United Kingdom
80%95%--United States
Breakdown of assets by geographic origin (in %)
100%78%83%-Over 12 months
-13%--6-12 months
-9%17%100%0-6 months
Age of assets (weighted average) - (in %)73%28%46%-Pre-financing of institutional investors and others
-14%--CLOs and CBOs
4%-24%-RMBS non-U.S.
-3%--RMBS U.S.7%16%--Consumer credit
16%3%30%100%Business loans
-22%--Automobile loans
Breakdown by type of asset32000drawn down
3,3173,3050505Liquidity lines extended (€ M)
3,3003,2401,344238Amount of assets financed (€ M)
France/United StatesUnited StatesFranceFranceIssuing country
Co-sponsoredconduits
VersaillesDirect FundingElixirAs at June 30, 08
Specific information on sensitive exposure
* Europe, of which 40% refers to Italy / ** 100% Europe

Update of the 2007 shelf-registration document 170
38
Contents
1 −−−− Group results
2 −−−− Results of divisions
3 −−−− Specific information on sensitive exposure(FSF recommendations)
4 −−−− Quarterly series
5 −−−− Miscellaneous
37
LBO Financing (2/2)
Breakdown of final shares of leveragedoperations by industry
Breakdown of final shares of leveragedoperations by geographic area
2%2%
2%
2%
2%3%
3%
3%
3%
4%
4%
4%4%
4%
4%
4%5%
6%
6%
7%7%
10%
11%
Aeronautics
Tourism
Utilities
Restaurants
Consumer goods
M edia
Infrastructure
Automotive industry
Publishing
Leisure
Paper/Packaging
Directories
M anufacturing industry
Construction
Chemicals
Construction materials
Food & agriculture
Other
Healthcare
Telecommunications
Pharmaceutical industry
Services
Distribution
5%6%
7%8%
6%
36%
33%
France
Others
United States
United Kingdom Italy
Germany
Spain
Specific information on sensitive exposure

Update of the 2007 shelf-registration document 171
40
Contribution of divisions to consolidated net income Q2-08
Consolidated income statement
-5913540992867-1,275-964Underlying net income, group share
-1201425815551117-1,538-1,136Income before taxes
-70--4-5-14-203-281Cost of risk
-96-5915852110-1,335-1,052Gross operating income
0--170-247-43-261-518-1,238Expenses
-96-22940594371-818186Net banking income
Corporate center
BdD(economic
contribution)
Receivables Management
ServicesCIGPAsset
ManagementCIBGroupIn millions of euros
Quarterly series
39
Consolidated income statement
Quarterly series
13.7%21.8%8.4%-2.6%Current ROE (after taxes)
130**136137141157151End of period CAD/CRD assets (in € B)*
16,42015,86216,16415,05216,17515,059Average equity
66%61%77%-92%Cost/income ratio
5511,014437-90069-1,017Net income, group share
-20-41-35-30-37-123Net restructuring expenses
017823156070Net restructuring income
711-100-28700Income from discontinued operations
564866340-639105-964Underlying net income, group share
-21-50-13-28-20-36Minority interests
-205-231-113458-5209Taxes
7901,147466-1,069130-1,136Income before taxes
00-1001Change in value of goodwill
18-2-392Gains or losses on other assets
151251126144107193Equity accounting method
637889342-1,21015-1,332Operating income
-2918-3-231-93-281Cost of risk
666870345-979108-1,052Gross operating income
-1,267-1,357-1,135-1,382-1,258-1,238Expenses
1,9752,2781,5645061,430282NBI of divisions
1,9332,2271,4804021,366186Net banking income
Q1-07Q2-07Q3-07Q4-07Q1-08Q2-08In millions of euros
* CAD assets (Basel I) until Q4-07 and CRD (Basel II) from Q1-08 / ** on an estimated basis

Update of the 2007 shelf-registration document 172
42
Asset Management
Income statement of divisions: quarterly data (2/5)
154.8%n148.9%134.4%85.1%88.1%124.6%Annualized ROE (after taxes)
188204193231222215Allocated capital
71%73%74%79%76%70%Cost/income ratio
737665494967Underlying net income, group share
1191241029778117Income before taxes
000-3-14Cost of risk
1161181009777110Gross operating income
-287-327-292-372-240-261Expenses
403445392469317371Net banking income
Q1-07Q2-07Q3-07Q4-07Q1-08Q2-08In millions of euros
Quarterly series
41
Corporate and Investment Banking
Income statement of divisions: quarterly data (1/5)
15.0%15.4%3.4%---Annualized ROE (after taxes)
6,9937,6357,3287,4827,4637,749Allocated capital
58%58%78%---Cost/income ratio
26129362-874-168-1,275Underlying net income, group share
367420107-1,401-220-1,538Income before taxes
-2024-5-219-88-203Cost of risk
387395113-1,184-132-1,335Gross operating income
-542-556-408-492-529-518Expenses
1612193767-40Miscellaneous
46046522356256207Capital Markets
343347147-923-52-1,116Debts and financing
111127133138125132Coverage
930951521-692397-818NBI after impact of crisis
-17-18-217-1,348-408-1,507Impact of crisis
947969738656805689NBI before impact of crisis
Q1-07Q2-07Q3-07Q4-07Q1-08Q2-08In millions of euros
Quarterly series

Update of the 2007 shelf-registration document 173
44
Services
Income statement of divisions: quarterly data (4/5)
17.6%21.5%18.6%17.3%20.8%20.4%Annualized ROE (after taxes)
1,9301,9611,9201,8361,9591,946Allocated capital
62%58%60%69%64%61%Cost/income ratio
85105897910299Underlying Net income, group share
131164138112149155Income before taxes
-5-3-3-4-1-5Cost of risk
135167140116139158Gross operating income
-218-227-211-254-243-247Expenses
7889810International services
138162135139167165Securities
373839484339Payments
212619252430Employee benefits planning
554851524854Specialized financing
95111999692108Insurance and sureties
353393351370383405Net banking income
Q1-07Q2-07Q3-07Q4-07Q1-08Q2-08In millions of euros
Quarterly series
43
Private Equity and Private Banking
Income statement of divisions: quarterly data (3/5)
7.0%167.2%67.0%49.6%41.5%29.3%Annualized ROE (after taxes)
287368273349316384Allocated capital
76%16%44%43%48%45%Cost/income ratio
515446433328Underlying net income, group share
1221059654651Income before taxes
00710-1Cost of risk
1221054634652Gross operating income
-39-41-43-48-43-43Expenses
313131342831Private Banking
2122066776263Private Equity
52251971119094Net banking income
Q1-07Q2-07Q3-07Q4-07Q1-08Q2-08In millions of euros
Private Equity: assets under management
1,6331,7431,7431,9331,9332,124AuM (own funds)
668752752848Transfer at sales price
2838125978670Investment
Third-party funds
1,5171,5931,5761,7041,7011,964AuM (own funds)
56161958838200Transfer at sales price
27147856899161Investment
Own funds
March 31, 07June 30, 07Sept. 30, 07Dec. 31, 07March 31, 08June 30, 08In millions of euros
Quarterly series

Update of the 2007 shelf-registration document 174
46
Bridge tables (1/3)
Quarterly series
Asset Management
Corporate and Investment Banking
-
-
-
B
1
1
1
C
115
-288
403
A
Q1-07
-
-
-
B
3
2
1
C
118
-327
445
D
116
-287
403
D
-
-
-
B
3
1
1
C
100
-292
392
D
-
-
-
B
3
1
2
C
97
-372
469
D
-
-
-
B
1
2
1
C
78
-237
316
A
Q1-08
AAADDCBA
110
-261
371
Q2-07Q3-07Q4-07Q2-08In millions of euros
-
-
-
3
1
2
116989477108GOI
-329-294-373240-262Expenses
444391467317369Net bankingincome
-24
18
-42
B
-18
-19
1
C
429
-542
970
A
Q1-07
-12
21
-33
B
-20
-22
2
C
395
-556
951
D
387
-542
930
D
-17
19
-35
B
-20
-23
3
C
113
-408
521
D
-18
26
-43
B
-22
-23
1
C
-1,184
-492
-692
D
-13
21
-34
B
-19
-21
2
C
-100
-529
429
A
Q1-08
AAADDCBA
-1,335
-518
-818
Q2-07Q3-07Q4-07Q2-08In millions of euros
-22
18
-40
-23
-23
-1
428150-1144-132-1,290GOI
-555-404-494-529-513Expenses
983554-649397-777Net bankingincome
A – Initial figuresB – Consolidation effect
C – Impact of new analytical agreementsD – Pro forma figures
45
Receivables Management
Income statement of divisions: quarterly data (5/5)
17.8%17.5%8.8%21.7%15.1%13.2%Annualized ROE (after taxes)
1,1241,0831,1271,1751,1801,225Allocated capital
68%69%79%73%72%74%Cost/income ratio
504725644540Underlying net income, group share
747039696658Income before taxes
-3-3-4-4-4-4Cost of risk
757343666859Gross operating income
-162-164-160-182-176-170Expenses
151415171619Public-sector procedures
403739454640Information and credit management
485252615559Factoring
13413496125127111Credit insurance
238237203248244229Net banking income
Q1-07Q2-07Q3-07Q4-07Q1-08Q2-08In millions of euros
Quarterly series

Update of the 2007 shelf-registration document 175
48
Retail Banking
Bridge tables (3/3)
Quarterly series
-
B
5
C
110
A
T1-07
-
B
4
C
209
D
115
D
-
B
5
C
88
D
-
B
4
C
93
D
-
B
4
C
61
A
T1-08
AAADDCBA
142
T2-07T3-07T4-07T2-08In millions of euros
- 0 205839065141Equity method
-6020--80-9317--110-10414--118-13816--153-9018--108-9616--112GOI
-
-
-
B
-5
24
-4
C
35
-42
-38
A
T1-07
-
-
-
B
-4
25
-8
C
36
-43
-50
D
30
-18
-42
D
-
-
-
B
-5
27
-12
C
33
-21
-84
D
-
-
-
B
-4
28
-13
C
37
-34
-103
D
-
-
-
B
-4
29
-11
C
39
-55
-53
A
T1-08
AAADDCBA
42
0
-96
T2-07T3-07T4-07T2-08In millions of euros
-
-
-
0
27
-12
4038413443Equity method
-67-47-63-26-28Expenses
-43-71-91-64-84Net banking income
Corporate Center
47
Receivables Management
Bridge tables (2/3)
Quarterly series
-
-
-
B
-2
-3
1
C
77
-160
237
A
Q1-07
-
-
-
B
-1
-3
2
C
73
-164
237
D
75
-162
238
D
-
-
-
B
0
-3
2
C
43
-160
203
D
-
-
-
B
0
-3
3
C
66
-182
248
D
-
-
-
B
0
-3
3
C
68
-173
241
A
Q1-08
AAADDCBA
59
-170
229
Q2-07Q3-07Q4-07Q2-08In millions of euros
-
-
-
1
-3
3
7443666859GOI
-161-157-179-176-167Expenses
235200245244226Net banking income
24
-18
42
B
-1
-2
1
C
112
-198
310
A
Q1-07
12
-21
33
B
1
-1
2
C
167
-227
393
D
135
-218
353
D
17
-19
35
B
2
-1
3
C
140
-211
351
D
18
-26
43
B
2
-2
4
C
116
-254
370
D
13
-21
35
B
1
-2
3
C
125
-220
345
A
Q1-08
AAADDCBA
158
-247
405
Q2-07Q3-07Q4-07Q2-08In millions of euros
22
-18
40
2
-2
4
15312196139135GOI
-205-191-226-243-226Expenses
358312322383361Net banking income
Services
Private Equity and Private Banking
-
-
-
B
0
-1
1
C
13
-38
51
A
Q1-07
-
-
-
B
0
-1
1
C
210
-41
251
D
12
-39
52
D
-
-
-
B
2
-1
3
C
54
-43
97
D
-
-
-
B
2
-1
3
C
63
-48
111
D
-
-
-
B
1
-1
2
C
45
-42
87
A
Q1-08
AAADDCBA
52
-43
94
Q2-07Q3-07Q4-07Q2-08In millions of euros
-
-
-
2
-1
3
21052624649GOI
-40-42-47-43-42Expenses
250941089091Net banking income

Update of the 2007 shelf-registration document 176
50
Contents
1 −−−− Group results
2 −−−− Results of divisions
3 −−−− Specific information on sensitive exposure(FSF recommendations)
4 −−−− Quarterly series
5 −−−− Miscellaneous
49
Quarterly data (Balance sheet)
Doubtful debts: quarterly series
Capital structure: quarterly series
64%60%62%61%60%61%Coverage rate excl. collective prov.
644 M612 M604 M793 M797 M947 MCollective provisions
706 M682 M676 M703 M685 M802 MIndividual provisions
1.4%1.4%1.3%1.3%1.3%1.4%Share of doubtful debts*
1.11 B1.14 B1.09 B1.15 B1.14 B1.31 BDoubtful debts
March 31, 07June 30, 07Sept. 30, 07Dec. 31, 07March 31, 08June 30, 08In euros
Basel I Rules (with anticipated deduction of 50% of CCIs)Basel II Rules
459539520549.6549.6528.0Total assets
125.1136.4141.3144.4156.9150.8End of period weighted risks
17.51816.916.316.315.1Equity, group share
11.211.611.712.812.6 12.9Tier one equity
10.6%10.6%10.2%11.0%10.3%11.0%Capital adequacy ratio
8.9%8.5%8.3%8.8%8.0%8.5%Tier one ratio
Dec. 31, 06June 30, 07Dec. 30, 07March 31, 08*March 31, 08June 30, 08In billions of euros
Quarterly series
* Calculated on balance sheet receivables from clients
* Estimated basis

Update of the 2007 shelf-registration document 177
51
1.0%
1.7%
1.8%
2.5%
2.8%
3.0%
3.3%
5.4%
5.6%
5.6%
6.5%
6.7%
7.4%
7.7%
7.7%
8.9%
10.9%
11.6%
Divers
Services aux collectivités
Tourisme, hôtellerie, loisirs
Biens de consommation
Commerce international MP*
Technologies
Pharmacie, santé
Agro-alimentaire
Constr. mécanique et élec.
Communication
BTP
Industrie de base
Distribution, commerce
Energie
Administration
Immobilier
Holding et groupes diversif iés
Services
(1) Outstanding loans (on- and off-balance sheet) as at 03/31/08: €286 billion(2) Outstanding loans (on- and off-balance sheet) excl. finance and insurance as at 03/31/08: €145 billion * RM: raw materials
Sector breakdown ofoutstanding corporate loans (2)
Geographic breakdown of global outstandings (1)
Miscellaneous
Diversified credit risks
16%
4%
28%3%
3%
45% France
Latin AmericaAsia Pacific
Other EU countries
Other European countries
Miscellaneous / 0.2%
North America
Africa/Middle East / 2%
Other
Institutional services
Tourism, hotels, leisure
Consumer goods
International trade/RM*
Technologies
Pharmaceuticals/healthcare
Food & agric. products
Mech. & electr. Construction
Communications
Public works
Basic industries
Distribution, trade
Energy
Administration
Real estate
Holding co. & divers. groups
Services

Update of the 2007 shelf-registration document 178
New strategic orientation
2
Disclaimer
� This presentation may contain forward-looking statements and comments relating to the objectives and strategy of Natixis. Any such projections inherently depend on assumptions, project considerations, objectives and expectations linked to future events, transactions, products and services as well as on suppositions regarding future performance and synergies.
� No assurance can be given that such forecasts will be realized. They are subject to inherent risks and uncertainties and are based on assumptions relating to Natixis, its subsidiaries and associates and the business development thereof; trends in the sector; future acquisitions and investments; macroeconomic conditions and conditions in Natixis' principal local markets; competition and regulation. Occurrence of such events is not certain, and outcomes may prove different from current expectations, significantly affecting expected results. Actual results may differ significantly from those projected or implied by such forecasts. Natixis shall in no event have any obligation to publish modifications or updates of such forecasts.
� Information in this presentation relating to parties other than Natixis or taken from external sources has not been subject to independent verification, and Natixis makes no warranty as to the accuracy, fairness or completeness of the information or opinions in this presentation. Neither Natixis nor its representatives shall be liable for any errors or omissions or for any harm resulting from the use of this presentation, the content of this presentation, or any document or information referred to in this presentation.
� All the information relating to 2010 financial targets of the group are not to be used for any results forecasts.
� This document is not an offer of securities in the United States or any other jurisdiction. Securities may not be offered or sold in the United States absent registration or an exemption from registration under the U.S. Securities Act of 1933, as amended. Natixis does not intend to register any portion of the planned offer in the United States or to conduct a public offering of securities in the United States.
©N
atix
is 2
007
–F
rede
ric C
irou
/ Pho
toA
ltoThe Revised Strategic Plan
4 September 2008

Update of the 2007 shelf-registration document 179
4
H1 08 Financial Results
3
Agenda
� H1 08 Financial Results
� The Revised Strategic Plan
� Appendices
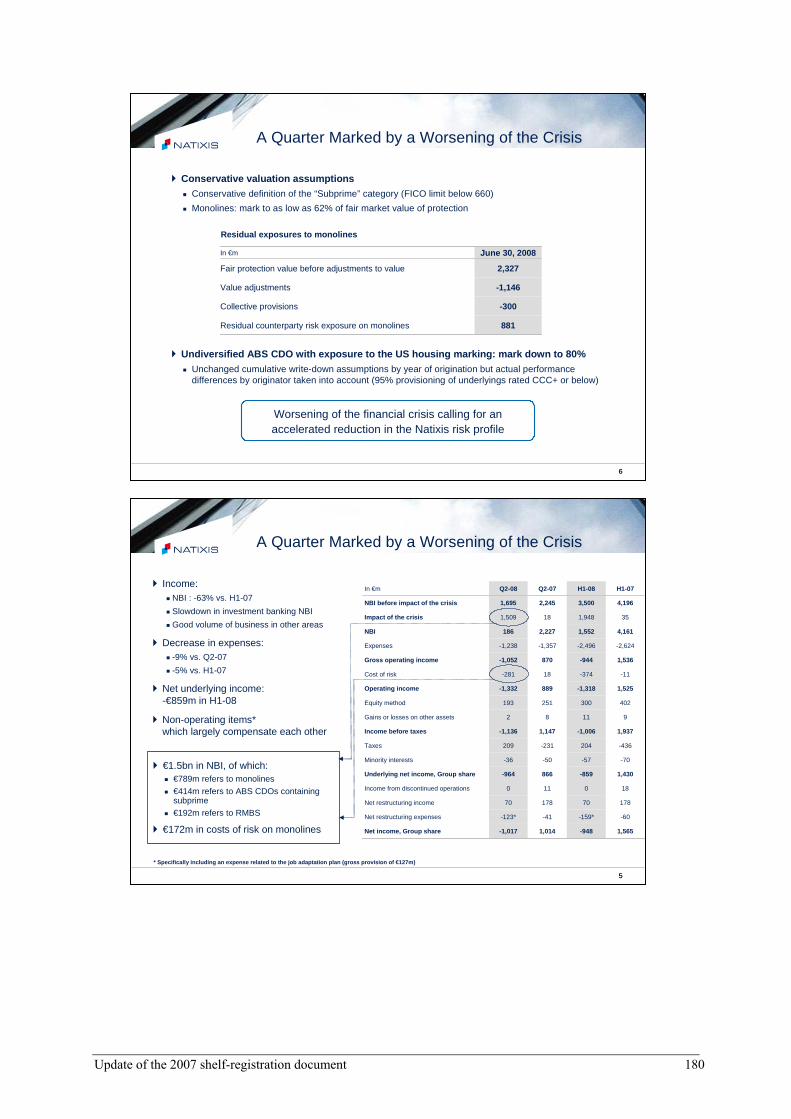
Update of the 2007 shelf-registration document 180
6
A Quarter Marked by a Worsening of the Crisis
� Conservative valuation assumptions� Conservative definition of the “Subprime” category (FICO limit below 660)
� Monolines: mark to as low as 62% of fair market value of protection
� Undiversified ABS CDO with exposure to the US housi ng marking: mark down to 80%� Unchanged cumulative write-down assumptions by year of origination but actual performance
differences by originator taken into account (95% provisioning of underlyings rated CCC+ or below)
881Residual counterparty risk exposure on monolines
-300Collective provisions
-1,146Value adjustments
2,327Fair protection value before adjustments to value
June 30, 2008In €m
Residual exposures to monolines
Worsening of the financial crisis calling for an accelerated reduction in the Natixis risk profile
5
A Quarter Marked by a Worsening of the Crisis
� €1.5bn in NBI, of which:� €789m refers to monolines
� €414m refers to ABS CDOs containingsubprime
� €192m refers to RMBS
� €172m in costs of risk on monolines -1,017
-123*
70
0
-964
-36
209
-1,136
2
193
-1,332
-281
-1,052
-1,238
186
1,509
1,695
Q2-08
1,014
-41
178
11
866
-50
-231
1,147
8
251
889
18
870
-1,357
2,227
18
2,245
Q2-07
4,1963,500NBI before impact of the crisis
351,948Impact of the crisis
1,565-948Net income, Group share
-60-159*Net restructuring expenses
17870Net restructuring income
180Income from discontinued operations
1,430-859Underlying net income, Group share
-70-57Minority interests
-436204Taxes
1,937-1,006Income before taxes
911Gains or losses on other assets
402300Equity method
1,525-1,318Operating income
-11-374Cost of risk
1,536-944Gross operating income
-2,624-2,496Expenses
4,1611,552NBI
H1-07H1-08In €m� Income:
� NBI : -63% vs. H1-07
� Slowdown in investment banking NBI
� Good volume of business in other areas
� Decrease in expenses:� -9% vs. Q2-07
� -5% vs. H1-07
� Net underlying income: -€859m in H1-08
� Non-operating items* which largely compensate each other
* Specifically including an expense related to the job adaptation plan (gross provision of €127m)

Update of the 2007 shelf-registration document 181
8
Receivables Management
On-goinginternational expansion
Receivables Management
On-goinginternational expansion
H1 08 NBI:€473m
H1 08 Net profit : €85m
H1 08 NBI:€473m
H1 08 Net profit : €85m
� On-going international expansion :
� Factoring network expanded to 25 countries, in line with the target of 30 direct local branches by year end 2008
� Profitability negatively impacted by increased losses in credit insurance
� Factoring turnover: +14%
� Credit insurance turnover: +4%
� Stable NBI due to the increase in the loss ratio to 56% (from the historically low 2007 level)
Private Equity & Private Banking
Good performance in a challengingenvironment
Private Equity & Private Banking
Good performance in a challengingenvironment
H1 08 NBI:€184m
H1 08 Net profit : €61m
AuM as of 30/6/08:€16bn
Invested Capital as of 30/6/08: €4.1bn
H1 08 NBI:€184m
H1 08 Net profit : €61m
AuM as of 30/6/08:€16bn
Invested Capital as of 30/6/08: €4.1bn
� Private equity:� Good performance with controlled risks� Growth in third party managed funds (+10% over 6 months)� Unrealized capital gains: €341m (as of 30/6/08)
� Private banking:� Good dynamics of new money despite difficult market environment� NBI decreased 5% over the half-year but picked up in Q2 08
Strong Commercial Performance
Retail BankingRecurring
contribution
Retail BankingRecurring
contribution
H1 08 Contribution to Net Profit:
€196m
H1 08 Contribution to Net Profit:
€196m
� Caisses d’Epargne :� Very strong commercial performance (record half-year inflows, loan
portfolio increased 8.8%)� Banques Populaires :
� NBI excluding PEL/CEL : +2.2% (increase in commissions, stable interestmargin)
� Caisses d’Epargne :� Very strong commercial performance (record half-year inflows, loan
portfolio increased 8.8%)� Banques Populaires :
� NBI excluding PEL/CEL : +2.2% (increase in commissions, stable interestmargin)
7
Corporate & Investment
BankingGrowth in client-driven revenues despite impact of
the crisis
Corporate & Investment
BankingGrowth in client-driven revenues despite impact of
the crisis
H1 08 NBI beforeimpact of the crisis:
€1,494m
H1 08 PNB after impact of the crisis:
-€421m
H1 08 Net profit : -€1,443m
H1 08 NBI beforeimpact of the crisis:
€1,494m
H1 08 PNB after impact of the crisis:
-€421m
H1 08 Net profit : -€1,443m
� Impact of the crisis on NBI of €1.9bn in H1 08, concentrated in proprietarytrading activities
� Increase of client-driven activities:� Plan vanilla and flow financing: progress spurred by international
business, especially Italy and Spain� Debt and financing: very good momentum in Commodities (NBI +30%)
and Transportation (NBI +32%)� Capital markets: sharp increase in client-driven business (NBI +49%), in
particular in Strategic Derivatives and Fixed Income outside France� Costs under control : reduction in variable compensation and implementation of
the cost reduction plan
Asset Management
Very strong inflows
Asset Management
Very strong inflows
� Very good level of new money during the half-year despite the persistent financialcrisis: +€9bn in Europe, +$8bn in the US
� NBI down 11% at constant exchange rate (impact of the crisis, drop in performance fees from historically high 2007 level, drop in average AuM)
� Slight increase in GOI by 2% (before impact of the crisis and at constant exchange rates) due to the drop in expenses
H1 08 NBI:€688m
H1 08 Net profit : €116m
AuM as of 30/6/08: €564.3bn (net 1H 08 inflows: +€13.5bn)
H1 08 NBI:€688m
H1 08 Net profit : €116m
AuM as of 30/6/08: €564.3bn (net 1H 08 inflows: +€13.5bn)
Strong Commercial Performance
ServicesBusiness momentum
confirmed
ServicesBusiness momentum
confirmed
� 6% revenue growth (of which 3% organically) due to increased business with the 2 networks:
� Consumer credit: NBI +8%
� Employee benefits: NBI +13% despite government measures to free up profit sharing
� Insurance: 7% increase in Life insurance assets over the last year to €31.7bn
� 6% revenue growth (of which 3% organically) due to increased business with the 2 networks:
� Consumer credit: NBI +8%
� Employee benefits: NBI +13% despite government measures to free up profit sharing
� Insurance: 7% increase in Life insurance assets over the last year to €31.7bn
H1 08 NBI:€788m
H1 08 net profit : €201m
H1 08 NBI:€788m
H1 08 net profit : €201m

Update of the 2007 shelf-registration document 182
10
New Environment, New Demands
Asset Management ServicesReceivables Management PE / PBRetail Banking CIB
� Impact of the financial crisis primarily related to structured credit and monoline exposures led to losses in the CIB business
� Necessary rebalancing of the business portfolio and refocusing of the CIB model
� Adapting Natixis’ model by relying on key strengths:
� Recurring contribution of activities excluding CIB (62% of FY07 PBT(1))
� In CIB, development targeted to client-driven businesses (Corporate and Institutional) including for capital markets-related activities
� Significant decrease in the CIB risk profile, including strong reduction of activities with excessive volatility
PBT(1) Breakdown by Business
(1) Profit before tax for the business segments exclu ding impacts of the financial crisis (in particular write-downs on RMBS, ABS CDOs, provisions on monolines, fair value adjustments on other portfolios due to credit spreadwidening, discount to loans pending underwriting)
CIB= 38%
Others = 62%
14%
16%
7%
10%15%
38%
2007 PBT (1) Excluding Crisis Impacts: €3.4bn
9
The Revised Strategic Plan

Update of the 2007 shelf-registration document 183
12
Lower Risk Profile CIB, Refocused on Key Strengths and
Client-Driven Activities
Lower Risk Profile CIB, Refocused on Key Strengths and
Client-Driven Activities
Enhanced Operating EfficiencyPlan Underway
Enhanced Operating EfficiencyPlan Underway
Controlled Growth Strategy in Other Businesses, Ongoing
Controlled Growth Strategy in Other Businesses, Ongoing
Reinforced and Durable Solvency Position
Reinforced and Durable Solvency Position
3344
11 22
A Rebalanced Business Mix Providing Sustainable and
Profitable Growth
A Rebalanced Business Mix Providing Sustainable and
Profitable Growth
11
A Revised Strategic Plan
Lower Risk Profile CIB, Refocused on Key Strengths and
Client-Driven Activities
Lower Risk Profile CIB, Refocused on Key Strengths and
Client-Driven Activities
Enhanced Operating Efficiency Plan Underway
Enhanced Operating Efficiency Plan Underway
Controlled Growth Strategy in Other Businesses, Ongoing
Controlled Growth Strategy in Other Businesses, Ongoing
Reinforced and Durable Solvency Position
Reinforced and Durable Solvency Position
3344
11 22
A Rebalanced Business Mix Providing Sustainable and
Profitable Growth
A Rebalanced Business Mix Providing Sustainable and
Profitable Growth

Update of the 2007 shelf-registration document 184
14
CIB: Accelerating Cost Reduction, While Increasing Risk Control
� Run-off of credit proprietary trading activities wh ich borne most of write-downs
� Reduction of exposures which had a negative impact on results (barrier-option intensive activities, equity convertibles)
� Reduction of average VaR level at €25m, which will b e used at cruise speed and increasedmonitoring of market risks using stress test scenar ios
� More systematic reduction of a share of exposures, via hedging and syndication, in particular for equity strategic derivatives and fund derivatives
Better Risk Profile Monitoring
Operating Improvement
Measures
� Significant increase in support functions’ efficien cyOne tool by business sub-segment, merger of financi ng/capitalmarket back offices
� Implementation of the final merger-related initiati vesCash equity, Fixed income, combination of internati onal entities
� Impact of termination or reduction of activities Securitisation, Proprietary Trading, Structured Cre dit
� On-going reduction of costs beyond already announce dmeasures
� Improvement in efficiency of front offices (targete d growth of NBI / front office)
Decrease in cost-income ratio from 68% in 2007 (excl. crisis) down to 56% in 2010
13
CIB: Immediate Measures to Sharply Reduce the Risk Profile
Decrease or Limit of Risk-Weighted Assets on Certain
Industries / Geographical
Areas
�Industries (decrease by €4.3bn in risk-weighted ass ets over the duration of the plan)
� Decrease in exposures to European real estate
� Decrease in exposures to commodities, in particular to mid-size brokers and junior mining companies
� Stability of LBO portfolio
�Geographical areas (decrease by €2.5bn in risk-weig hted assets over the duration of the plan)
� Limit of exposures on certain emerging countries (Russia, India, Turkey…)
� Vanilla financing in non-strategic countries stopped
Significant Decrease in the
Weight of Proprietary
Trading Activities
� Dedicated run-off management of non-core assets and businesses:
� Proprietary trading activities (mainly proprietary trading on credit and structured credit products)
� €20bn of risk-weighted assets (as of end June 2008), equivalent to 15% of CIB RWAs
� Possible acceleration of portfolio sales, depending on market conditions (not included in the business plan at this stage)
� Sharp reduction of most complex derivative activiti es

Update of the 2007 shelf-registration document 185
16
Focusing Resources on CIB Key Strengths (2/2)
Intensification of Cross-Selling
� Full impact of the Coverage function roll-out
� Cross-selling target of €75m for capital markets excluding strategic derivatives
Pay-Off from Investments Made
in 2006 / 2007
�Flow business platform for equity derivatives, OTC Commo dities, Forex
�Development build-up in Asia around strategic activities (Equity derivatives, Rates, Forex, Structured finance, Strategic derivatives…)
Improved Geographic
Focusand Scaled Down
International Development
Plans
�In Europe, focus on France and Southern Europe:
� Higher selectivity on corporates in France, depending on cross-selling potential
� Maintaining our strong position in France
� Development in Southern Europe, especially in Italy
� Termination of coverage of corporate clients in the UK and in Northern Europe as well as large multi-national firms in Germany
�In the US, termination of certain financing activities (mu lti-national firms, movie industry financing)
�Closing of non-strategic offices/subsidiaries (Düsseldorf, L os Angeles, Panama, Bogota, Teheran)
�Postponed development projects in emerging countries (B rasil, India in particular)
Transfer of Activities
�Transfer of retail and small-entreprise activities unrelated to CIB, i.e. Natixis Lease, Pramex, Natixis Algeria into the Services business segment (€5.5bn o f risk-weighted assets)
15
Focusing Resources on CIB Key Strengths (1/2)
�Structured finance in which Natixis is a world-class player
� Priority to bookrunner positions
� Acceleration in balance sheet turnaround (reinforcement of distribution capacities, especially in the US and Asia ; minimization of final takes)
�Development and refocus of Fixed Income, Forex and Equity d erivatives activities: on-going investments in flow business platforms
� Low volatility activities (intermediation), obvious add-on to financing activities
� Access to new customer bases (third party distribution, opening of BtoC platforms)
�Controlled development of strategic equity derivatives
� Maintaining annual NBI around €400m and high profitability
�Reinforcement of our positions as a leader in European bon ds (France, Covered bonds, European financial institutions)
Priority Allocation of Resources to Strategic Clients
Leverage of Product
Know-How
�Increase in activities with higher potential clients
� Corporates in France and Southern Europe (large companies and family-owned SMEs)
� Sovereign Wealth Funds, Private Equity funds
� Industries in which Natixis has a worldwide valuable expertise (Energy and Commodities producers, Infrastructures,...)
� Financial institutions, especially in Europe
Constant growth of the share of client-related activitie s within CIB since 2006Constant growth of the share of client-related activities w ithin CIB since 2006

Update of the 2007 shelf-registration document 186
18
CIB: Realistic Growth Forecasts (2/4)
Coverage: Quasi-Stability
�Overall stability of “plain-vanilla” lending volumes over the period (France and International), with focus on high-priority clients
�Slowly-increasing NBI due to higher margins on new production
�Increase of international financing activities with a selective approach, reflecting focus of RWA onto high-priority areas: Southern Europe and Asia
�Development of the coverage function and strong increase of cross-selling, activities accounted for in the other CIB business lines (Capital Markets, Debts and Financing) and in other Natixis divisions (AM, Services,…)
Constraints on Capital
�Slight decrease in flow business activities due to strategic choices on the regional network’s rationalization
Optimization of Regional Network
in France
Increased Geographic Selectivity
Cross-selling Development
2010 Financial Targets
�2007-2010 NBI CAGR of 3% �2010 NBI: €0.55bn
17
CIB: Realistic Growth Forecasts (1/4)
Outlook for CIB Activities
�Target 2010 NBI in line with 2006 level (slightly below €3.4bn)
�Increase of revenue synergies until 2010 especially on corpo rate clients (impact remains limited in 2007 since teams merged at the end of H1 07)
�Full benefit from the investments realized since the merger: fl ow business platforms, FX, OTC commodities
�Extension of geographic coverage (2006-2008 investments) in Asi a and in Southern Europe
(1) Not adjusted for the indirect impacts of the financial crisis, i.e. €379m, including €266m for the Debts and Financing business(2) Mostly the impact of the Credit Portfolio Management
7%Debts and FinancingCoverage
Cross-divisional andMiscellaneous
Capital Markets
27%
4%
26%
43%
2010 Target: RWA of €118.3bnNBI (€bn)2007 Excl. Crisis (1) 2010
Coverage 0.51 0.55
Debts and Financing 0.97(1) 1.31
Capital Markets 1.37 1.65
Cross-divisional and Miscellaneous 0.08 (0.10)
Total CIB 2.93 3.41

Update of the 2007 shelf-registration document 187
20
CIB: Realistic Growth Forecasts (4/4)
Capital Markets: 20% Increase Over the Period
�Rebound vs. 2007 and back to 2006 level for equity derivatives (flow business platforms, non-recurring trading losses…)
� Impact over the period of OTC commodities investmen ts (no NBI in 2007, 2010 target >€60m)
�Decrease of NBI for Cash Equities vs. a high 2007 b asis
� Increase in alternative assets activities vs. a low level in 2007; back to level reached in 2006
�Slight increase on strategic derivatives vs. 2007 w ith a 2010 target lower than current level
Equities and Commodities:
Limited Increase
2010 Financial Targets
�2007-2010 NBI CAGR: > 6 % �2010 NBI: €1.65bn
�Strong increase in targeted NBI vs. 2007 (+75%) but more limited compared to 2006 (+14%)
�Absence of non-recurring trading and market making losses from 2007/2008
� Increase in cross-selling (rates, FX): +€75m over t he period
� Investments on platforms
Strong Rebound for Fixed Income / Forex
Activities
Decline of Arbitrage and
Treasury
�Arbitrage: limited contribution due to volontary red uction of positions
�Treasury: 2010 NBI target significantly lower than 2006-2007 due to the continuation of unfavourable conditions on the monetary market
19
CIB: Realistic Growth Forecasts (3/4)
Debts and Financing: Enhancement of Structuring and Distribution Capacities
�Impact of the decision to cap or decrease exposure to real estate in Europe and leverage finance on new business and NBI
�Stable NBI of commodities financing between 2007 an d 2010, after a strong increase in 2008 vs. 2007 (expected decrease in assets offse t by positive margin effect)
�Increase of aircraft financing activities and proje ct finance
�Enhancement of syndication teams (new hires in Asia and US) in order to take advantage of the market recovery expected in 2010
�Reallocation of structured credit activities (focus ed on the asset classes less impacted by the financial crisis) and build up of o rigination and structuration teams (private placements of asset-structured financing i n the US)
Limited Increase in Structured Financing
and Real Estate Activities
Investments in Structuring and
Distribution Capacities:
NBI targets of €200m in 2010 vs. €100m in
2007
2010 Financial Targets
�2007-2010 NBI CAGR of 11 % � 2010 NBI: €1.31bn
� Of which structured financing and real estate: €0.90bn (€0.87bn in 2007)
(1)
(1) 2% based on 2007 NBI excluding direct and indirect i mpacts of the crisis

Update of the 2007 shelf-registration document 188
22
Lower Risk Profile CIB, Refocused on Key Strengths and
Client-Driven Activities
Lower Risk Profile CIB, Refocused on Key Strengths and
Client-Driven Activities
Enhanced Operating EfficiencyPlan Underway
Enhanced Operating EfficiencyPlan Underway
Controlled Growth Strategy in Other Businesses, Ongoing
Controlled Growth Strategy in Other Businesses, Ongoing
Reinforced and Durable Solvency Position
Reinforced and Durable Solvency Position
3344
11 22
A Rebalanced Business Mix Providing Sustainable and
Profitable Growth
A Rebalanced Business Mix Providing Sustainable and
Profitable Growth
21
Lower Risk Profile CIB, Refocused on Key Strengths and Client-Driven Activities
2007 2009
2007 2010
NBI Growth Target
2.9
3.4
in €bnCAGR : +5%
�2007-2010 NBI CAGR target: 5% excluding direct impacts of the financial crisis (write-downs on RMBS, ABS CDO portfolios and provisions on monolines)
�2010 cost-income ratio: 56%
�2010 ROE of 12% and 14% target thereafter
Decrease in Risk-Weighted Assets Thanks to Short Term Initiatives
in €bn
-€7bn
2007 Excl. Crisis (1)(2)
124.5117.5
2010 Financial Targets
(1)
(1) Proforma for transferred activities (2) NBI excluding direct impacts of the crisis (writ e-downs on RMBS and ABS CDOs portfolios, and provisi ons on monolines)
�Decrease in risk-weighted assets by 2009:? Decrease in the weight of proprietary trading
activities
? Decrease in the cap of risk-weighted assets on certain industries / geographical areas
? Controlled development on targeted customers
? /? Impacts of regulatory changes
�Selective reallocation of risk-weighted assets starting in 2010
�Share of allocated equity to CIB reduced from 52% in 2007 to 46% in 2010

Update of the 2007 shelf-registration document 189
24
583 591520
632
2006 2007 2007 2010
Asset Management: Goal to Become a Global Leader Reaffirmed
AuM Outlook (1)
2010 Financial Targets
� 2007-2010 AuM CAGR: +2% (+7% excl. La Poste)
� Cost-income ratio: 67%
� 2007-2010 GOI CAGR: 7%
�Enhanced competitiveness on core products (Euro products, Fixed income)
�Strengthened position on selected expertise and high margin products
� Growth equity, structured management, SRI (Socially Responsible Investment), absolute return
� Quantitative and alternative management (Alpha Simplex, Caspian Private Equity with NPE, hedged equity with Gateway acquired in 2007…)
�Growth strategy on all key markets globally
� Reinforced international distribution platform for the institutional client base
� Development of strategic alliances with market leaders (Merrill Lynch, UBS,…)
� Strengthened distribution in Asia
Despite poor market conditions, revenues bolstered by:
Optimised use of the various development tools
US Europe
CAGR: +7%
1
2
�Targeted acquisitions and partnerships in production or distribution, especially in Asia (joint venture with China Investment bank)
�Use of internal resources (seed money) for affiliates or new teams
Excl. La Poste
68% 66%62%
61%
32% 34% 38%39%
CAGR: +2%
Billions euros
(1) AuM by production, at constant exchange rate
23
2003 2004 2005 2006 2007 M arket impact
Change in
scope
H1 08 co llecte
H1 2008
Asset Management: A Leading Player with a Well-Suited Business Model
Bond
Cash
Alternative and structured
Real estateEquity &
diversified
�Natixis Global Asset Management : #1 French bank in Asset Management and among top 15 globally(1)
� Broad range of asset classes with innovative and performing management styles
� Recognized brands (NAM, Loomis Sayles & Co, Harris Associates, AEW)
A French/US Leader …
�A multi-specialist/multi-affiliates model well-suited to open architecture
�An adjustable distribution platform to tap markets with high growth potential (Europe, Asia, Middle-East)
�A strong retail expertise in both domestic markets (French & US) to be replicated internationally
�An ability to attract and retain best management teams and build on expertise
… with a Competitive Business Model
Total Assets under Management (AuM) (2)
(1) As of December 2007(2) AuM by production, at constant exchange rate
CAGR: +9%
AuM Breakdown by Asset Class (30 June 2008)
38%
42%
4%
10%6%
31% 30% 32% 32% 34% 33%
69%70%
68%68% 66% 67%
386
450
534
591583 564
In €bn
AuM historical growth demonstrates the competitivene ss of the model
-37 -3
+13
(3)Change in scope
H1 08 net
inflows
(4)
US Europe
(3) Including currency effect(4) Of which €8bn related to La Poste AuM exit

Update of the 2007 shelf-registration document 190
26
Services: Profitable Growth Strategy On-Going
�Expand product distribution within the shareholders’ networks (€75m additional NBI by 2010): e.g. consumer credit (14% 2007-2010 CAGR target) ; mortgage guarantee and ADE within BFBP group
�Establish a dedicated specialized financing business line: leasing and consumer credit
�Strengthen international services offering: Pramex
2010 Financial Targets
� 2007-2010 NBI CAGR : +5%
� Cost-income ratio: 62%
� 2010 ROE > 17%
2007-2010 NBI Growth Target
Maintaining high productivity
�Organizational and IT project to be achieved (insurance and consumer credit)
�Synergies from Securities platforms merger (for both retail and institutional)
CAGR : +5%
1
2
1,5
1,7
Billions euros
3
Strong NBI growth driven by:
�Development of new products: medical insurance, “chèque-emploi” offering (CESU)
�Expand client base:
� Natixis: multi-channel approach in life insurance
� Shareholders’ networks in France (former regional banks of HSBC in particular in consumer finance and life insurance) or abroad
� Together with the Coverage function (employee benefit, securities…)
Reinforced product range for retail client networks
Securities
Specialized Financing
International ServicesPayments
Employee Benefit
Insurance & Guarantees
2007 Proforma
2010
Assurances et Cautions Ingénierie SocialePaiements Titres
Financements Spécialisés Services à l'international
27%
11%
28%
10%
2%
4%
39%37%
6%6%
14%14%
25
Services: Six Business Lines for Bank Networks and Institutional Clients
Assurances et Cautions
27%
Services à l'international
2%
Paiements11%
Titres39%
Ingénierie sociale
6%
�Develop competitive and innovative products for retail banking networks
� Specialized financing (leasing, consumer credit)
� Insurance and guarantee (life, personal protection, property/casualty, borrowers’ insurance)
� Employee benefit (employee saving plan, group insurance, special payment vouchers)
� International services (Pramex, Algeria)
�Offer extensive and performing technological solutions to banks and institutional investors
� Securities (custody, fund administration…)
� Payments (cash flows, electronic banking)
A Twofold Expertise
�Securities: N°2 in retail custody in France, N°1 in institutional custody with Caceis
�Guarantees: N°2 in borrowers’ insurance (SACCEF)
�Employee benefit: N°1 in France in employee saving s
�Leasing: N°2 in real estate leasing in France
Leading Positions
2007 Proforma NBI Breakdown
�Roll-out of product offering within Caisses d’Epargne and Banques Populaires networks: 7% NBI growth since 2006
�Strong potential of own (example: life insurance) and third party customer base (example: custody)
�Open platforms: securities services and/or payments outsourcing for third party banking networks (Barclays, HSBC…)
Cclient Base to Be Expanded
Specialized Financing6% + 8%
2007 NBI: €1.5bn
Transfer from CIB of retail-oriented business lines:
Specialized financing (leasing, 8%)International services (Pramex + Natixis Algeria, 2%)
Securities39%
Payments11%
EmployeeBenefit
6%
Insurance & Guarantees
27%
International Services
2%

Update of the 2007 shelf-registration document 191
28
2007 2010
Credit insurance Factoring Services
Receivables Management: An Untapped Growth Potential
A division with strong growth potential despite challenging short-term market conditions
1
2
3
2007-2010 NBI Growth Target
53%
23%
24%
46%
31%
23%
CAGR : +8%
(1)
in €bn
0.9
1.2
(1) Business information, trade receivables manageme nt and public export guarantees
2010 Financial Targets
�2007-2010 NBI CAGR: 8%
�Cost-income ratio: 67%
�2010 ROE > 16%
Ambition: Become the Global Leader by 2015
Completion of the tool-sharing plan
�Activities driven by global economic growth over the long term
�Strong development potential in the US and Asian markets
�Expected increase in the loss ratio (2008-2009) with an improvement expected by 2010
�Lesser pressure on prices
Identified development orientations
�Development of factoring, the fastest growing business within the segment (2007-2010 CAGR around 20%)
�International expansion for all business lines, with a priority for credit insurance outside Europe
�Tighter cost control: further development of business lines’ IT platforms
�Further realisation of synergies between the different businesses (risk management, data processing, cross-divisional salespeople)
27
Receivables Management: A Leader in its Businesses
An Expert in Receivables Management A Comprehensive Service Offering
� A global leader in Receivables Management � #3 in credit insurance with leading positions in emerging
markets (#1 in Asia and Latin America)� #6 in factoring (#1 in Germany, #3 in France, present in 25
countries)
� Real competitive advantages� A wider and more diversified product range than
competitors
� Access to a broader client base, in particular through factoring
� Density of the global distribution network (direct presence in 65 countries)
� Proven control in the global credit cycle management
� A demonstrated profitable growth � Top-line growth higher than peers since 2004� 2004-2007 CAGR of net income and revenues of 34% and
8% respectively� Strong increase in the penetration rate within the group:
� Retail networks
� Other group business segments (notably CIB)
Business Information
� Information on financial situation and marketing
� #5 worldwide
Public Export Guarantees
� Management of public procedures for export guarantees (e.g. hedging export risk, exchange risk hedging…)
Trade Receivables Management
� Recovery service
� #5 worldwide
Credit Insurance
� Protects companies against default risk from their customers
� #3 worldwide
Factoring
� Enables companies to finance customer account receivables
� #6 worldwide

Update of the 2007 shelf-registration document 192
30
Retail Banking: Pursued Investments within the two Networks
Caisses d’EpargneBanques Populaires
� Strategic plan� Development strategy
� Major effort to increase equipment rates
� Market share increase in consumer credit, wealth management and with professionals
� Double-digit CAGR 2007-10 for revenues with SMEs
� Increase in NBI by 2010 more than compensate the widespread distribution of the Livret A (estimated impact of €300m)
� Increase in productivity� Cost savings ranging from €300m to €400m in 2012, of which
€150m by end 2010� Synergies from the merger of Caisses d’Epargne
� Reduction from 3 to 1 IT platform (impact on CIR: -2 pts)
� Centralisation of non-strategic functions such as purchasing
� Reduction of 3,500 FTEs by 2012
� Strategic plan� Revenue consolidation following a period of strong commercial
expansion
� A strong growth potential in clients’ equipment rates� Focus on deposits and savings products, and property and casualty
insurance
� High growth in wealth management, leveraging on the group’s strong position with SMEs: double-digit annual growth of number of clients
� Continued development of consumer credit
� Development potential reinforced by the recent external growth operations� Acquisition from HSBC of its regional banks in the South of France
on 2nd July 2008 (total NBI 2007 of €440m)
� Revenues synergies with Foncia (mortgage loans, insurance, etc.)
� Increase in productivity� Enhanced operating performance and productivity mainly
thanks to resources sharing and full leveraging of the common IT platform
29
PE / PB: On-Going Dynamic
2006 2007 2010
Asset Under Management Growth Target –Private Banking / Wealth Management
Average yearly AuM ; in €bn
�Private Banking / Wealth management:
� 2007-2010 AuM CAGR: 13%
�Private Equity:
� 10-year target ROE maintained > 50% - consistent with historical performances of this activity
2010 Financial Targets
Maintain leading positions in private equity1
2
CAGR : +13%
�Maintain leading position in the small caps segment
�Development in the mid-caps segment (€150m-€500m)
�Increased revenue base diversification:
� France/ International
� Proprietary / Third party funds
� Capital Development / LBO / Venture / Fund of funds
�Unrealized gains as of end H1 08: €341m
�Confirmed threefold business model: Wealth management (especially work with Natixis), BtoB to well-off customers of retail networks (Banques Populaires and Caisses d’Epargne) and CGPI with CFP
� Increase in inflows from each of the division’s development axes
�Development of international activity with foreign customers of the retail networks and with Natixis
�Streamlining of the business line (merger of French entities) and implementation of synergies
Private banking / Wealth management: tap inflow potential from unique positioning around 3 networks
24.0
16.714.8
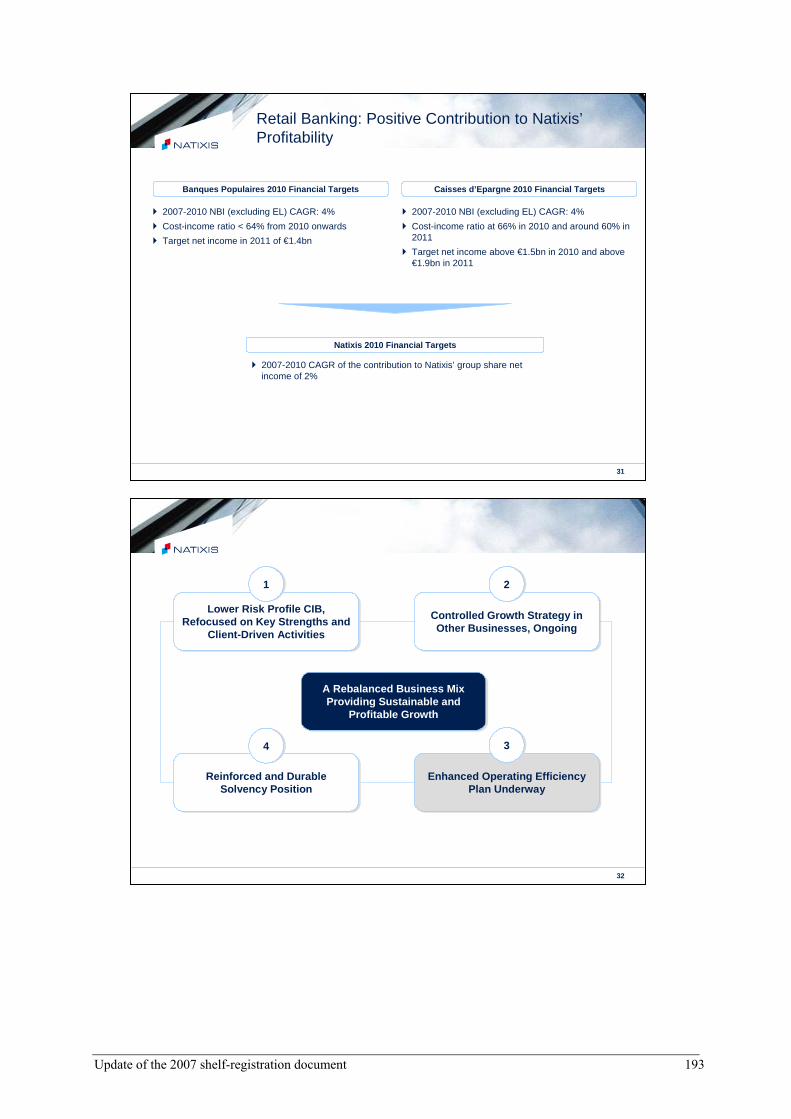
Update of the 2007 shelf-registration document 193
32
Lower Risk Profile CIB, Refocused on Key Strengths and
Client-Driven Activities
Lower Risk Profile CIB, Refocused on Key Strengths and
Client-Driven Activities
Controlled Growth Strategy in Other Businesses, Ongoing
Controlled Growth Strategy in Other Businesses, Ongoing
11 22
A Rebalanced Business Mix Providing Sustainable and
Profitable Growth
A Rebalanced Business Mix Providing Sustainable and
Profitable Growth
Enhanced Operating EfficiencyPlan Underway
Enhanced Operating EfficiencyPlan Underway
Reinforced and Durable Solvency Position
Reinforced and Durable Solvency Position
3344
31
Retail Banking: Positive Contribution to Natixis’ Profitability
Caisses d’Epargne 2010 Financial TargetsBanques Populaires 2010 Financial Targets
� 2007-2010 NBI (excluding EL) CAGR: 4%
� Cost-income ratio < 64% from 2010 onwards
� Target net income in 2011 of €1.4bn
� 2007-2010 NBI (excluding EL) CAGR: 4%
� Cost-income ratio at 66% in 2010 and around 60% in 2011
� Target net income above €1.5bn in 2010 and above €1.9bn in 2011
Natixis 2010 Financial Targets
� 2007-2010 CAGR of the contribution to Natixis’ group share net income of 2%

Update of the 2007 shelf-registration document 194
34
Lower Risk Profile CIB, Refocused on Key Strengths and
Client-Driven Activities
Lower Risk Profile CIB, Refocused on Key Strengths and
Client-Driven Activities
Enhanced Operating EfficiencyPlan Underway
Enhanced Operating EfficiencyPlan Underway
Controlled Growth Strategy in Other Businesses, Ongoing
Controlled Growth Strategy in Other Businesses, Ongoing
Reinforced and Durable Solvency Position
Reinforced and Durable Solvency Position
3344
11 22
A Rebalanced Business Mix Providing Sustainable and
Profitable Growth
A Rebalanced Business Mix Providing Sustainable and
Profitable Growth
33
Enhanced Operating Efficiency Plan Underway
� Implementation of the announced restructuring plan� Primarily aimed at supporting functions and CIB activities
impacted by the crisis � €400m cost reduction with full effect in 2009 and first benefits
already in H2 08 (see chart on the right hand side)
� Enhancement of management efficiency� Cost-cutting through resource sharing (new life-insurance
platform, sharing of Receivables Management’s tools…)
� Improvement of tools and processes aimed at developing cross-selling and enhancing sales productivity
� Additional cost-cutting effects from the refocusing of CIB activities� 56% 2010 cost-income ratio target (vs. 68% in 2007 excl.
Impact of the crisis)
Operational Efficiency Plan
Decrease of external staff (850 FTEs)
Organisational optimisation
Significant decrease in the
activities impacted by the
financial crisis(800 FTEs)
6% Decrease in Purchasing Expenses
Day-to-day Management
Savings
Breakdown of the Savings by Type of Costs: €400m (1)
[Graphique à définir – Natixis]
Purchasing
13%
External staff38%
EmployeeCosts
29%
Real Estate5%
Other15%
(1) Based on type by type estimates of savings

Update of the 2007 shelf-registration document 195
36
Group Financial Targets for 2010(1)
2010 Financial Targets (1) Equity Reallocation to More Recurring Activities (1)
� NBI > €8bn implying a 4% CAGR for the 2007-2010 period before impact of the financial crisis
� 2010 cost-income ratio of 63%
� 2010 ROE of 12%(2); target ROE of 14% beyond
� Target Tier 1 ratio of around 9% H1 08 2010 target
52%
24%
13%8% 2%
1%
46%
25%
15%
9% 3%2%
(1) Not to be used for financial forecasts(2) 2009-2010 cost of risk divided by credit risk w eighted assets of 30 bps in CIB(3) Excluding corporate centre
A Balanced Contribution to 2010 (1) Net Income (3)
CIB Retail Banking ServicesReceivables Mgmt CIGP AM
34%14%
16%
20% 7%9%
CIB Retail Banking ServicesReceivables Mgmt CIGP AM
35
A Durably Reinforced Solvency Position
A Strengthened Capital Structure
� Natixis amongst the best capitalised European banks
� Solvency position as of 30 June pro forma for the capital increase: � Core Tier 1 ratio of 7.8%
� Tier 1 ratio of 9.3%
� Target Tier 1 ratio of around 9%
One of the Highest Tier 1 Ratios (1) in Europe
Prudent Management of Risk-Weighted Assets
� By 2010� Stability of risk-weighted assets
� Reduced in CIB risk-weighted assets through reallocation of resources into client-driven activities
Source: Company data as of 30 June 2008(1) Pro forma of €3.7bn capital increase
(1)
10.2%
9.3%
9.3%
9.3%
9.1%
8.9%
8.6%
8.6%
8.2%
8.2%
7.9%
7.9%
7.7%
7.6%
7.4%
6.6%
6.5%
11.4%
11.6%UBS
Dexia
CS
Natixis
DB
KBC
Fortis
CASA
HBOS
RBS
ING
SG
Barclays
Santander
BBVA
BNPP
Commerzbank
ISP
UCI

Update of the 2007 shelf-registration document 196
38
Appendices
37
Some Strategic Moves to Tackle With the New Environment
Lower Risk Profile CIB, Refocused on Key Strengths and
Client-Driven Activities
Lower Risk Profile CIB, Refocused on Key Strengths and
Client-Driven Activities
Enhanced Operating Efficiency Plan Underway
Enhanced Operating Efficiency Plan Underway
Controlled Growth Strategy in Other Businesses, Ongoing
Controlled Growth Strategy in Other Businesses, Ongoing
Reinforced and Durable Solvency Position
Reinforced and Durable Solvency Position
3344
11 22
NBI > €8bn by 2010Cost / Income ratio: 63% by 20102010 ROE of 12% ; target of 14%
Normative allocated equity of CIB reduced from 52% to 46%
NBI > €8bn by 2010Cost / Income ratio: 63% by 20102010 ROE of 12% ; target of 14%
Normative allocated equity of CIB reduced from 52% to 46%

Update of the 2007 shelf-registration document 197
40
Key Financial Assumptions of the Strategic Plan
� Interest income from actual shareholders’ equity within each business segment is cancelled out
� Allocated equity for each business segment is interest-earning
� The interest for these two adjustments is 3.5 %
NBI
� CIB’s cost of risk is calculated based on 30bps of credit risk weighed assetsCost of Risk
� Unchanged methodology for all business segments except Retail Banking
� As per Basel II, the allocated equity of Retail Banking (formerly 6% of risk-weighted assets underBasel I requirements) is now equal to 75% of Tier 1 capital deductions due to CIC ownership(thus accounted for hybrid capital)
Allocation of Equity
� Most operating expenses related to the Corporate Center are billed to the business segments through an agreed tax based on each segment’s fixed costs. Applied rates are match the group organisation
� Stability of the contribution of the Corporate Center to net profit, group share
Allocation of Corporate Center
Expenses
(1) Average values over the year
MacroeconomicAssumptions (1)
Natixis Forecasts
2008 2009 2010
EUR / USD 1.55 1.55 1.62
EUR / GBP 0.80 0.79 0.78
CAC 40 4,400 4,700 5,100
S&P 500 1,390 1,500 1,630
3-month Euribor 4.75% 3.60% 4.00%
3-month US Libor 2.65% 3.15% 4.10%
10-year CMS 4.80% 4.60% 4.70%
10-year US Swap 4.60% 4.70% 4.50%
39
Key Definitions
� CAGR: Compounded Annual Growth Rate� Cost-income ratio: Operating expenses / Net banking income (NBI)� ROE (Return On Equity):
� Natixis ROE: Net Income Group Share / Average Shareholders’ Equity� Division ROE: Recurring Net Income / Average Allocated Equity
� Tier 1 Ratio : Solvency ratio that equals Tier 1 capital as defined by current regulatory definition (mainly shareholders’ equity + minority interests - goodwill and other intangibles + hybrids – miscellaneous deductions including 50% of CIC) divided by Basel 2 risk weighted assets
� Core Tier 1 Ratio: The numerator of the Core Tier 1 ratio excludes hybrid capital (among others the €2.5bn shareholder advances as of 30 June 2008) included in Tier 1 capital. However hybrid capital being partly used to offset the deduction of CIC from total Tier 1 capital, the CIC are only deducted from the numerator of the Core Tier 1 ratio for the pro rata share of non-hybrid capital in total Tier 1 capital (hence a 68% deduction of CIC vs. a 100% deduction in the Tier 1 ratio as of 30 June 2008)
� BtoC (Business to Customer): corresponds to transactions from corporates to individual customers as opposed to Business to Business transactions involving corporates only
� Retail: used in reference to retail banking activities� Growth Equity: Management strategy focusing on companies with high growth potential� Value Equity: Management strategy focusing on undervalued stock based on fundamentals (revenues, net income…)� Hedged Equity: Management strategy searching to maximise return on equity capital markets while reducing risk and
volatility on the markets by selling and purchasing call and put options� Alternative Management: Active management strategies (as opposed to passive strategies) seeking absolute return, often
uncorrelated, upwards or downwards, to the markets� Quantitative Management: Management strategy based on the use of quantitative models – often mathematical – based
mainly on databases� FTE: Full-time equivalent employees

Update of the 2007 shelf-registration document 198
42
Retail Banking: Background Information on Market Positioning
�Natixis has access to two networks which have unique combined strengths:
� #2 network by number of branches
� #2 network by number of customers
� #2 network by net banking income
� #2 network by net income
� #2 network by cost-income ratio
� Strong profitability by agency and by client
Market Positioning in France
Data as of 31/12/2007 Banques Populaires (2) Caisses d'Epargne BP+CE (2) Leader Average
Metrics Rank Metrics Rank Metrics Rank Metrics
Branches (1) 3,193 #4 4,352 #3 7,545 #2 9,224
Clients (millions) 8.1 #6 11.2 #3 19.3 #2 26.0
Savings and deposits (€bn) (3) 172 #7 305 #3 476 #2 635
Customer loans (€bn) 126 #4 116 #5 242 #3 396
NBI (€bn) 6.1 #5 6.4 #4 12.5 #2 16.3
Net income (€bn) 1.4 #4 1.6 #2 3.0 #2 3.2
Cost-income ratio 62.7% #2 67.0% #5 65.0% #2 62.2% 68.5%
NBI / branch (€m) 1.9 #3 1.5 #5 1.7 #4 2.7 1.9
NBI / client (€) 752 #2 574 #5 648 #3 968 658
Source: Public information
(1) Ranking excluding La Banque Postale
(2) Banques Populaires including the integration of HSBC' 6 Regional Banks (excl. SMC), except for the GOI CAGR
(3) Balance sheet and Off-balance sheet (life insurance, mutual funds, etc.)
Note: clients of Caisses d'Epargne excluding those having only a "Livret A"
41
Access Mechanism to Retail Banking
20 BanquesPopulaires (3)
17 Caisses d’Epargne
Through CCI , access to 20% of the net income of: 20 BanquesPopulaires, and17 Caisses d’Epargne
Products & services provided to the Caisses d’Epargne network and to its clients
Products & services
provided to the Banques
Populairesnetwork and to its clients
CCI (20%)
CCI (20%)
Retail Banking: Major Contribution to Natixis’ Activity
(1) Economic contribution amount pro forma of the n ew analytical rules’ impact (corresponding to the €4 69m published in the 2007 accounts)(2) In the Banques Populaires network solely(3) Excluding the 6 regional banks acquired from HS BC in July 2008
� A major contributor to Natixis’ net income� Through CIC, integration of 20% of the net income of the
2nd largest retail banking network in France by number of branches and by number of clients
� CIC contribution to Natixis 2007 net income excl. impact of the crisis: €480m(1)
� Operational links between Natixis and BP & CE distribution networks� Products offered to the networks’ clients including
individuals and small & mid-size businesses� Examples: consumer credit, leasing, employee savings
planning, asset management, factoring, credit management, sureties and financial guarantees, life-insurance(2)
� Services provided to meet retail banking networks and their clients’ needs � Examples: securities, payments, ALM

Update of the 2007 shelf-registration document 199
Other information ; addenda 1/ RMBS sensitivity Sensitivity to a 10% increase of loss rate applied to subprime RMBS portfolios valued using a valuation technique is of €89 million. 2/ The accounting portfolio of exposures related to LBO financing is "loans and receivables". 3/ Fair value of instruments hedged by operations with monolines is equal to the fair value of protections. 4/ Restructuring proceeds of €70 million, net of tax, result from the transfer of Natixis’ institutional custody business to Caceis. 5/ Sensitivity of value adjustments made to monoline exposures to: � A 10% increase in combined losses on underlying assets containing subprimes and � A 10% change in default probability from monoline insurers
is of –€88 million. 6/ Day 1 P&L sensitivity:
� A reduction in the maturity of 1-year operations would have an impact on results of +€56.5 million
� A reduction in the maturity of 5-year operations would have an impact on results of +€144.1 million.
7/ Slide 15 page 159: Bridge table for Assets under Management should read -€13.1 billion instead of -€13.3 billion for FOREX effect and -€3.1 billion instead of -€2.9 billion for consolidation effect. 8/ Slide 11 page 157: Dexia’s Tier one ratio (11.3%) is as at March 31, 2008. 9/ Slide 28 page 165: residual exposure to “other CDOs” totals €3,328 million at June 30, 2008 with value adjustments of €97 million in H1-08. 10/ Definition of Core Tier 1 ratio: The Core Tier 1 ratio excludes hybrid capital (including the 2.5 billion euros shareholder advances at June 30, 2008) included in the Tier 1 capital. However, as the issue of hybrid capital offsets the deduction of CCI certificates from the global Tier 1, the hybrid capital is deducted from Natixis’ Core Tier 1 ratio prorata of non-hybrid capital (i.e. a deduction of CCIs up to 68% versus 100% in the Tier 1 ratio as at June 30, 2008)." 11/ Slides 33 and 34 (RMBS) of the “Results as at June 30, 2008” presentation page 168, "Gross exposure (before losses in value/writedowns) as at 30/06/08” should read "Net exposure as at 31/12/07". 12/ CIFG Restructuring On August 28, 2008, the principal counterparties under credit default swaps in respect of ABS CDOs written by the CIFG group signed a memorandum of understanding (MOU) relating to a restructuring of CIFG Holding, the parent of the CIFG group, and its subsidiaries. The ABS CDO counterparties entering into this MOU, which include Natixis, represent approximately 75% of CIFG’s credit default swap counterparties and insured bondholders in respect of ABS CDO exposures and certain CRE CDO exposures. The MOU is a non-binding document and the closing of the restructuring transaction

Update of the 2007 shelf-registration document 200
is subject to a number of conditions, including obtaining the agreement of CIFG’s remaining counterparties to its terms, and the issuance of satisfactory ratings of CIFG following the restructuring. The restructuring, if implemented, would involve the cancellation of the approximately $12 billion in CIFG’s notional ABS CDO and CRE CDO exposures, in exchange for which the counterparties would receive distributions of cash and CIFG Holding equity. Natixis would receive a share of the cash and equity in its capacity as a credit default swap counterparty. As a result of the equity distribution, BFBP and CNCE would no longer control CIFG (both BFBP and CNCE are parties to the MOU). Upon closing of the restructuring, CIFG Holding would draw the remaining unused portion of its credit facility with Natixis (US$101.5 million, or approximately €70 million), and Natixis would cancel all obligations of CIFG under the credit facility. If the restructuring takes place on the terms contemplated in the MOU, Natixis believes that its net impact on its consolidated income statement should be neutral or slightly positive, taking into account the cash and equity that Natixis will receive, the drawdown and cancellation of the credit facility, and existing accounting provisions. The actual impact will depend on factors that will not be known until the restructuring is implemented, including the amount of cash and the value of the equity that Natixis will receive in connection with the transaction. 13/ Five year summary of financial data (see table next page)

Update of the 2007 shelf-registration document 201
Five-year summary of financial data
Pursuant to Art. 133, 135 and 148 of the Comm ercial Companies Decree
CATEGORY 2003 2004 2005 2006 2007
Financial position at year end
Share capital 768 722 224,00 772 095 392,00 783 927 680,00 1 951 782 928,00 1 955 268 310,40Number of shares issued 48 045 139 48 255 962 48 995 480 1 219 864 330 1 222 042 694Number of bonds redeemable in shares 0 0 0 0 0Number of convertible bonds 0 0 0 0 0
Results of operations
Operating revenue net of tax 10 423 289 253,40 11 705 235 507,71 12 725 811 668,81 24 125 749 761,01 36 243 060 348,21Income before tax, depreciation and provisions 213 068 968,00 280 959 662,75 457 665 461,91 677 795 500,73 852 134 041,69Corporate income tax 29 916 523,44 (28 338 400,20) (99 996 625,19) (55 322 327,37) 141 132 997,05Income after tax, depreciation, amortization and provisions 200 728 250,83 213 582 296,25 459 177 494,14 744 399 468,97 (467 183 610,92)Dividend paid 120 112 847,50 159 244 674,60 244 977 400,00 1 049 083 323,80 549 919 212,30
Per share data
Income after tax, but before depreciation, amortization and provisions 5,06 5,24 7,30 0,51 0,81Income after tax, depreciation, amotization and provisions 4,18 4,43 9,37 0,61 (0,38)Dividend 2,50 3,30 5,00 0,86 0,45
Workforce information
Number of employees 4 701 4 754 4 748 5 072 6 820Total payroll costs 273 353 038,75 295 556 511,38 331 173 385,69 415 344 933,38 668 942 830,46Social security, pension costs and other employee benefits 144 067 570,23 166 610 951,72 193 645 949,43 233 880 070,04 269 404 568,47

Update of the 2007 shelf-registration document 202
CHAPTER 8: ADDITIONAL INFORMATION
8.1 Legal information
Amendment to the shareholders’ agreement On September 3, 2008, BFBP and CNCE agreed to amend their shareholders’ agreement dated November 17, 2006 (as amended by an initial amendment dated August 7, 2007) which provides for certain technical adjustments without changing the general equilibrium of the agreement (and particularly the essential element of an ownership threshold of 34% of capital for BFBP and CNCE on a fully diluted basis.)
8.2 Additional information
General information about the capital stock Capital stock: Capital was increased by 42,365,002 shares during the first half of 2008, through the exercise of stock options and the payment of dividends in the form of shares. These transactions increased the capital as at June 30, 2008 to 2,023,052,313.60 euros, divided into 1,264,407,696 shares with a face value of 1.60 euros each. It is important to remember that the General Shareholders’ Meeting of May 22, 2008, decided to give each shareholder the opportunity to receive payment in the form of shares for the full amount of the dividend associated with the shares owned. The issue price for the newly issued shares, with an interest-bearing date of January 1, 2008, was set at 90% of the average initial price quoted over the twenty trading days preceding the date of this General Shareholders’ Meeting, minus the net amount of the dividend. If the amount of the dividend to which a shareholder was entitled did not correspond to a whole number of shares, the shareholder could opt to receive either:
- the number of shares immediately below the total, plus payment of a cash balance, - or the number of shares immediately above the total, with the remittance of an additional cash
amount.
The option for payment of the dividend in shares was initiated on May 30, 2008, i.e., two days after the date of detachment of the coupon and ended at close of business on June 18, 2008. Unless this option was exercised within this timeframe, it was stipulated that the shareholders would receive the dividend due, in cash, on June 27 2008. The General Shareholders’ Meeting fully authorized the Management Board to account for the number of shares issued and the resulting capital increase and to consequently amend the text of Article 3 of the Bylaws.
As a result, on June 27, 2008, the Chief Executive Officer duly noted the issue of 42,342,502 new shares for the payment of the dividend in shares, i.e., a nominal amount of 67,748,003.20 euros plus an issue premium of 329,424,665.50 euros.
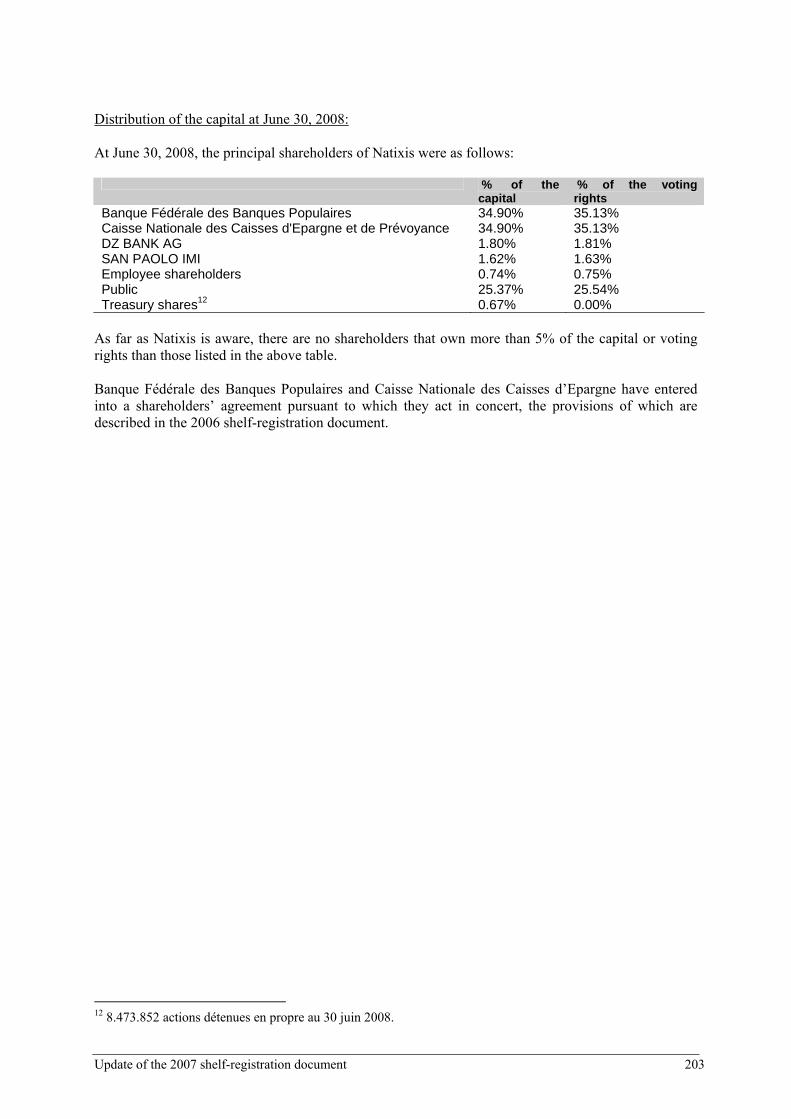
Update of the 2007 shelf-registration document 203
Distribution of the capital at June 30, 2008: At June 30, 2008, the principal shareholders of Natixis were as follows:
% of the capital
% of the voting rights
Banque Fédérale des Banques Populaires 34.90% 35.13% Caisse Nationale des Caisses d'Epargne et de Prévoyance 34.90% 35.13% DZ BANK AG 1.80% 1.81% SAN PAOLO IMI 1.62% 1.63% Employee shareholders 0.74% 0.75% Public 25.37% 25.54% Treasury shares12 0.67% 0.00%
As far as Natixis is aware, there are no shareholders that own more than 5% of the capital or voting rights than those listed in the above table. Banque Fédérale des Banques Populaires and Caisse Nationale des Caisses d’Epargne have entered into a shareholders’ agreement pursuant to which they act in concert, the provisions of which are described in the 2006 shelf-registration document.
12 8.473.852 actions détenues en propre au 30 juin 2008.

Update of the 2007 shelf-registration document 204
Person responsible for the shelf-registration docum ent Philippe Dupont Executive Chairman of Natixis Statement by the person responsible for the shelf-r egistration document “To the best of my knowledge, the information contained in this shelf-registration document
update is true and accurate, and contains no omissions liable to impair its significance.
To the best of my knowledge, the financial statements were prepared in accordance with
applicable accounting standards, and the information on the balance sheet, the financial
situation and the income of the company and the companies entering in the scope of
consolidation is true and accurate, and the attached half year report reflects exactly the
major events of the first half and their impact on the results, the major transactions occurred
between related parties and a description of the major risks and uncertainties for the second
half..
I have obtained a letter from the statutory auditors certifying the completion of their work, in
which they indicate that they have verified the information relating to the financial situation
and the accounts given in this report and have read the whole of the report.”
Philippe Dupont

Update of the 2007 shelf-registration document 205
Documents available to the public Documents relating to Natixis (deeds of incorporation, bylaws, reports, letters and other documents, historical parent company and consolidated financial information for each of the financial years preceding the publication of this document) are partially included in this document and may be consulted at the Company’s head office, preferably by appointment. This update of the shelf-registration document is available on the website of the Autorité des marchés financiers (www.amf-france.org) and under the heading “Shareholders and investors” on the company’s institutional website at www.natixis.com. Any person wishing to obtain additional information about Natixis can request documents free of charge and without obligation: • by letter, from: Natixis Global Communications department Investor Relations Immeuble Arc-de-Seine 30, avenue Pierre Mendès-France 75013 Paris • by telephone, from: (33) 1 58 19 26 34 or (33) 1 58 32 06 94

Update of the 2007 shelf-registration document 206
Auditors The bank’s financial statements are audited by three independent accounting firms. Their terms will expire with the Annual General Meeting called to approve the 2009 financial statements, as concerns Deloitte & Associés and Salustro Reydel. Mazars et Guérard was appointed by the combined general of November 17, 2006, for a term of six years ending on the general meeting to approve the financial statements for 2012. • Deloitte & Associés – 185, avenue Charles-de-Gaulle – 92524 Neuilly-sur-Seine Cedex.
Damien Leurent. • Salustro Reydel, member of KPMG International – 1, cours Valmy – 92923 Paris La Défense
Cedex. Michel Savioz. • Mazars et Guérard, Immeuble Exaltis – 61, rue Henri-Régnault – 92075 Paris La Défense Cedex.
Charles de Boisriou and Michel Barbet-Massin. The substitute auditors are: • BEAS, 7-9, Villa Houssay – 92200 Neuilly-sur-Seine; • François Chevreux – 40, rue Guersant - 75017 Paris; • Patrick de Cambourg, Immeuble Exaltis – 61, rue Henri-Régnault – 92075 Paris La Défense
Cedex.

Update of the 2007 shelf-registration document 207
CROSS-REFERENCE TABLE
Heading
Registration document
page number
First update
1. Persons responsible 428 204
2. Statutory auditors 60 4-206
3. Selected financial information
3.1. Selected historical financial information regarding the issuer for each financial year 6 – 7 N.A
3.2. Selected historical financial information for interim periods N.A. N.A
4. Risk factors 126 – 135 5
5. Information about the issuer
5.1 History and development of the issuer 426 – 427 N.A
5.2 Investments 62 – 70; 74–- 75 N.A
6. Business overview
6.1. Principal activities 60 – 86 12-32 ;125
6.2. Principal markets 301 – 304 38
6.3. Exceptional factors N.A.
6.4. Extent to which the issuer is dependent on patents or licenses, industrial, commercial or financial contracts or new manufacturing processes 168 – 169 N.A
6.5. The basis for any statements made by the issuer regarding its competitive position 60 – 86 N.A
7. Organizational structure
7.1. Brief description of the Group 1 N.A
7.2. List of significant subsidiaries 8 N.A
8. Property, plant and equipment
8.1. Existing or planned material tangible fixed assets 255 – 256 N.A
8.2. Environmental issues that may affect the issuer’s utilization of the tangible fixed assets 120 – 124 N.A
9. Operating and financial review
9.1. Financial condition 173 – 174 58-60 ; 61-62
9.2. Operating results 137 – 138 8-10; 201
10. Capital resources
10.1. Information concerning the issuer’s capital resources 174; 184 – 185 55;61-62
10.2. Sources and amounts of the issuer’s cash flows 186 63
10.3. Information on the issuer’s borrowing requirements and funding structure 174 – 175 N.A
10.4. Information regarding any restrictions on the use of capital resources that have materially affected, or could materially affect, the issuer’s operations N.A. N.A
10.5. Information regarding the anticipated sources of funds needed to fulfill commitments referred to in items 5.2. and 8.1 173 – 174 N.A
11. Research and development, patents and licenses N.A. N.A
12. Trend information 180 182-198
N.A 5
14. Administrative, management, and supervisory bod ies and senior management
14.1. Administrative bodies 20 – 25 1-3
14.2. Administrative, management, and supervisory bodies and senior management conflicts of interests 58 N.A
15. Remuneration and benefits

Update of the 2007 shelf-registration document 208
Heading
Registration document
page number
First update
15.1. Amount of remuneration and benefits 53 – 57 N.A
15.2. Total amounts set aside or accrued by the issuer or its subsidiaries to provide pension, retirement or similar benefits 54 N.A
16. Board practices
16.1. Date of expiration of current term of office 21 – 23 N.A
16.2. Service contracts with members of the administrative bodies 58 N.A
16.3. Information about the issuer’s audit committee and compensation committee 52 N.A
16.4. Whether or not the issuer complies with the corporate governance regime(s) in its country of incorporation 21 – 25 N.A
17. Employees
17.1. Number of employees 91; 92; 108 201
17.2. Directors’ shareholdings and stock options 54; 312; 413 –-414 132-134
17.3 Arrangements for involving employees in the issuer’s capital 417; 401 –-402 134-135
18. Major shareholders
18.1. Shareholders owning more than 5% of the share capital or voting rights 416 203
18.2. Different voting rights 398 203
18.3. Control over the issuer 418 203
18.4. Arrangements, known to the issuer, the operation of which may at a subsequent date result in a change in control 418 N.A
19. Related-party transactions 308 –313; 343 – 349;
372 – 376 127-130
20. Financial information concerning the issuer’s a ssets and liabilities, financial position and profits and losses
20.1. Historical financial information 181 – 315; 318 – 369;
431 58-60
20.2. Pro forma financial information 244 – 245 N.A
20.3. Financial statements 181 – 315; 318 – 369 58-60
20.4. Auditing of historical annual financial information 316 – 317; 370 – 371;
372 – 376 137-138
20.5. Age of latest financial information 181 58-60
20.6. Interim financial information N.A. N.A
20.7. Dividend policy 14; 419 N.A
20.8. Legal and arbitration proceedings 168 – 169 48-49
20.9. Significant change in the issuer’s financial position 177 N.A
21. Additional information
21.1. Share capital 12; 412 – 413 202-203
21.2. Memorandum and articles of association 408 – 411 N.A
22. Material contracts 422 – 425 N.A
23. Third party information and statement by expert s and declarations of any interest N.A. N.A
24. Documents on display 428 205
25. Information on holdings 8; 202 – 242; 343 –
349 67-104

Update of the 2007 shelf-registration document 209
Pursuant to article 28 of Commission regulation No. (EC) 809/2004 of April 29, 2004, the following information is incorporated by reference: • the consolidated financial statements for the year ended December 31, 2007, presented on Pages
181 to 315, the statutory auditors’ report thereon, Pages 316 to 317, and the Group management report, on Pages 136 to 178 of the shelf-registration document filed with the AMF on April 18, 2007 under number D.08-0261,
• the consolidated financial statements for the year ended December 31, 2006, presented on
Pages 102 to 205, the statutory auditors’ report thereon, Pages 206 to 207, and the Group management report, on Pages 69 to 95 of the registration document filed with the AMF on April 17, 2007 under number D.07-0337.
All other chapters of reference documents D.08-0231 and D.07-0337 and are either of no material interest to investors or covered elsewhere in this registration document.