Embed Size (px)
Citation preview

Update of Stats SA Building Statistics
Dr Johan Snyman
Medium-Term Forecasting Associates
STELLENBOSCH
20 January 2012
MEDIUM-TERM FORECASTING ASSOCIATESBuilding Economists Tel: (021) 881-3887 PO Box 7119 Fax: (021) 881-3887STELLENBOSCH, 7599 E-mail: [email protected]
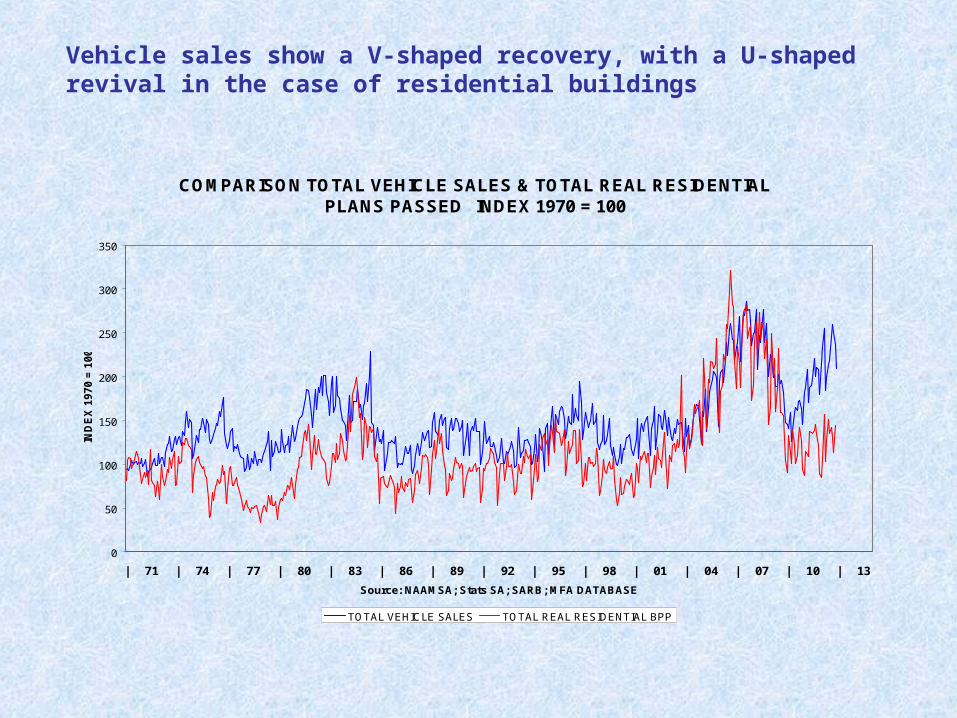
Vehicle sales show a V-shaped recovery, with a U-shaped revival in the case of residential buildings
COMPARISON TOTAL VEHICLE SALES & TOTAL REAL RESIDENTIAL PLANS PASSED INDEX 1970 = 100
0
50
100
150
200
250
300
350
| 71 | 74 | 77 | 80 | 83 | 86 | 89 | 92 | 95 | 98 | 01 | 04 | 07 | 10 | 13
Source: NAAMSA; Stats SA; SARB; MFA DATABASE
IND
EX
19
70 =
10
0
TOTAL VEHICLE SALES TOTAL REAL RESIDENTIAL BPP

The trend in the cyclical movements correspond closely; vehicle sales are almost 17% higher than a year ago, with residential only 1% higher. This indicates a much weaker revival in the case of dwelling houses, flats and townhouses
TOTAL VEHICLE SALES & TOTAL REAL RESIDENTIAL PLANS PASSED ANNUAL PERCENTAGE CHANGE
-60
-40
-20
0
20
40
60
80
100
| 71 | 74 | 77 | 80 | 83 | 86 | 89 | 92 | 95 | 98 | 01 | 04 | 07 | 10 | 13
Source: NAAMSA; STATS SA; SARB, MFA DATABASE (Economic upswings shaded)
AN
NU
AL
PE
RC
EN
TA
GE
CH
AN
GE
TOTAL VEHICLE SALES TOTAL RESIDENTIAL BPP
Shaded areas represent theupswing phases of the business cycle

Two blows struck the private housing industry in 2007/08 … and the recession was severe. The year-on-year improvement in the annual percentage change of the number of houses (left-hand scale) is currently only 3.3%, pointing to a modest revival
PRIME RATE COMPARED TO BPP NUMBER OF HOUSES (>80m²) BPP ANNUAL PERCENTAGE CHANGE
-60
-40
-20
0
20
40
60
80
| 81 | 84 | 87 | 90 | 93 | 96 | 99 | 02 | 05 | 08 | 11 |
Source: Stats SA; SARB; MFA DATABASE
BP
P H
OU
SE
S A
NN
UA
L P
ER
CE
NT
AG
E
CH
AN
GE
8
10
12
14
16
18
20
22
24
26
28
PR
IME
RA
TE
(INV
ER
TE
D)
BPP NO OF HOUSES PRIME RATE
Introduction of National Credit ActBanks' stricter lending criteria applied
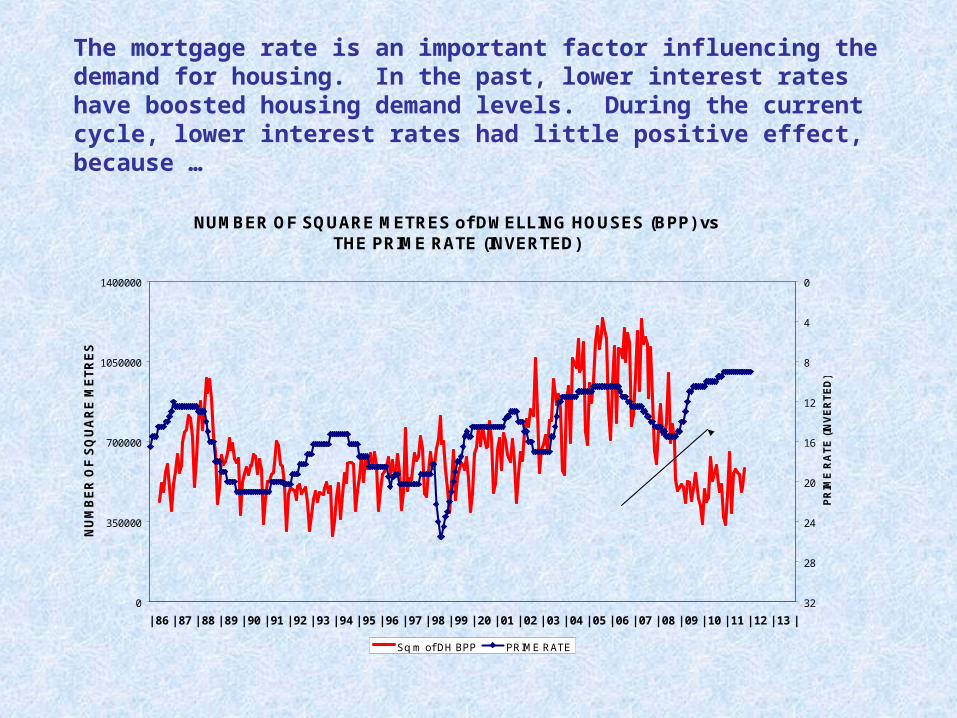
The mortgage rate is an important factor influencing the demand for housing. In the past, lower interest rates have boosted housing demand levels. During the current cycle, lower interest rates had little positive effect, because …
NUMBER OF SQUARE METRES of DWELLING HOUSES (BPP) vs THE PRIME RATE (INVERTED)
0
350000
700000
1050000
1400000
| 86 | 87 | 88 | 89 | 90 | 91 | 92 | 93 | 94 | 95 | 96 | 97 | 98 | 99 | 20 | 01 | 02 | 03 | 04 | 05 | 06 | 07 | 08 | 09 | 10 | 11 | 12 | 13 |
NU
MB
ER
OF
SQ
UA
RE
ME
TR
ES
0
4
8
12
16
20
24
28
32
PR
IME
RA
TE
(IN
VE
RT
ED
)
Sq m of DH BPP PRIME RATE
This unusual gap reflects poor housing demand

… the availability of housing finance was curtailed by the National Credit Act that was implemented in July 2007
THE COST AND AVAILABLITY OF MORTGAGE FINANCE FOR NEW HOUSES(with the Prime Interest Rate inverted)
0
1000
2000
3000
4000
5000
6000
| 80 | 81 | 82 | 83 | 84 | 85 | 86 | 87 | 88 | 89 | 90 | 91 | 92 | 93 | 94 | 95 | 96 | 97 | 98 | 99 | 00 | 01 | 02 | 03 | 04 | 05 | 06 | 07 | 08 | 09 | 10 | 11 |
Source: Stats SA; SARB; MFA DATABASE
Rm
pe
r m
on
th a
t c
on
sta
nt
20
10
pri
ce
s
0
5
10
15
20
25
30
Inte
res
t ra
te p
er
ce
nt
INV
ER
TE
D
Building loans granted Prime interest rate
THIS UNUSUAL GAP HAS WORSENED THE DOWNTURN IN HOMEBUILDING

In terms of numbers, private house plans approved are slowly improving
BPP & BC: NUMBER of DWELLING HOUSES LARGER THAN 80m² 3 MONTH MOVING AVERAGE
0
1000
2000
3000
4000
5000
| 80 | 81 | 82 | 83 | 84 | 85 | 86 | 87 | 88 | 89 | 90 | 91 | 92 | 93 | 94 | 95 | 96 | 97 | 98 | 99 | 00 | 01 | 02 | 03 | 04 | 05 | 06 | 07 | 08 | 09 | 10 | 11 | 12 | 13 |
Source: Stats SA; MFA DATABASE
NU
MB
ER
OF
DW
EL
LIN
G H
OU
SE
S
BPP BC
Historical Peak4502
Lowest Point1000
LONG TERM MONTHLYAVERAGE2100 housesapproved

In terms of square metres, dwelling houses are moving sideways
BUILDING PLANS PASSED DWELLING HOUSES NUMBER OF SQUARE METRES
0
200000
400000
600000
800000
1000000
1200000
1400000
| 86 | 87 | 88 | 89 | 90 | 91 | 92 | 93 | 94 | 95 | 96 | 97 | 98 | 99 | 20 | 01 | 02 | 03 | 04 | 05 | 06 | 07 | 08 | 09 | 10 | 11 | 12 | 13 |
Source: Stats SA; MFA DATABASE
NU
MB
ER
OF
SQ
UA
RE
ME
TR
ES

Data of townhouses and flats also show signs of a U-shaped revival
BUILDING PLANS PASSED TOWNHOUSES AND FLATS NUMBER OF SQUARE METRES
0
100000
200000
300000
400000
500000
600000
700000
800000
| 86 | 87 | 88 | 89 | 90 | 91 | 92 | 93 | 94 | 95 | 96 | 97 | 98 | 99 | 20 | 01 | 02 | 03 | 04 | 05 | 06 | 07 | 08 | 09 | 10 | 11 | 12 | 13 |
Source: Stats SA; MFA DATABASE
NU
MB
ER
OF
SQ
UA
RE
ME
TR
ES

Up till recently, there seems to be a gradual improvement in the sizes of townhouses and flats. Now this indicator is dropping once again
AVERAGE SIZE OF TOWNHOUSES & FLATS SQUARE METRES (SMOOTHED)
0
20
40
60
80
100
120
140
160
180
| 86 | 87 | 88 | 89 | 90 | 91 | 92 | 93 | 94 | 95 | 96 | 97 | 98 | 99 | 20 | 01 | 02 | 03 | 04 | 05 | 06 | 07 | 08 | 09 | 10 | 11 | 12 | 13 |
Source: Stats SA; MFA DATABASE
AV
ER
AG
E S
IZE
SQ
UA
RE
ME
TR
ES
CURRENTLY DROPPING FROM 106 to 96SQUARE METRES

The building cost of townhouses and flats is currently about R508 000 per unit
AVERAGE BUILDING COST OF TOWNHOUSES & FLATS RAND (DATA SMOOTHED)
0
100000
200000
300000
400000
500000
600000
| 86 | 87 | 88 | 89 | 90 | 91 | 92 | 93 | 94 | 95 | 96 | 97 | 98 | 99 | 20 | 01 | 02 | 03 | 04 | 05 | 06 | 07 | 08 | 09 | 10 | 11 | 12 | 13 |
Source: Stats SA; MFA DATABASE
CO
ST
IN
RA
ND
CURRENTLY ABOUT R508 000 PER UNIT(on average)

A sideways trend is evident in the case of residential renovations data
BPP: RESIDENTIAL ADDITIONS & ALTERATIONS NUMBER OF SQUARE METRES
0
200000
400000
600000
800000
| 86 | 87 | 88 | 89 | 90 | 91 | 92 | 93 | 94 | 95 | 96 | 97 | 98 | 99 | 20 | 01 | 02 | 03 | 04 | 05 | 06 | 07 | 08 | 09 | 10 | 11 | 12 | 13 |
Source: Stats SA, MFA DATABASE
SQ
UA
RE
ME
TR
ES
RES ADD & ALT 13mma

It seems as if the lower turning point in offices has been recorded …
OFFICES BUILDING PLANS PASSED: SQUARE METRES
0
40000
80000
120000
160000
200000
| 86 | 87 | 88 | 89 | 90 | 91 | 92 | 93 | 94 | 95 | 96 | 97 | 98 | 99 | 20 | 01 | 02 | 03 | 04 | 05 | 06 | 07 | 08 | 09 | 10 | 11 | 12 | 13 |
Source: Stats SA; MFA DATABASE
SQ
UA
RE
ME
TR
ES

… despite higher office vacancy levels (vacancies line inverted)
OFFICE VACANCIES & BUILDING PLANS PASSED OFFICES
0
50000
100000
150000
200000
| 92 | 93 | 94 | 95 | 96 | 97 | 98 | 99 | 20 | 01 | 02 | 03 | 04 | 05 | 06 | 07 | 08 | 09 | 10 | 11 | 12 | 13 |
Source: SARB; Stats SA; RODE DATABASE; SAPOA; MFA DATABASE
BP
P S
QU
AR
E M
ET
RE
S (
3 M
MA )
2
3
4
5
6
7
8
9
10
11
12
13
14
15
16
17
% N
AT
ION
AL
OF
FIC
E V
AC
AN
CIE
S
(IN
VE
RT
ED
)
BPP OFFICES VACANCIES
BPP
VACANCIESINVERTED(RIGHT HANDSCALE)

Since the low point recorded in April 2011, only a marginal improvement is evident
SHOPPING SPACE BUILDING PLANS PASSED: SQUARE METRES
0
40000
80000
120000
160000
200000
240000
| 86 | 87 | 88 | 89 | 90 | 91 | 92 | 93 | 94 | 95 | 96 | 97 | 98 | 99 | 20 | 01 | 02 | 03 | 04 | 05 | 06 | 07 | 08 | 09 | 10 | 11 | 12 | 13 |
Source: Stats SA; MFA DATABASE
SQ
UA
RE
ME
TR
ES

It seems that the industrial sector is recovering
INDUSTRIAL & WAREHOUSING BUILDING PLANS PASSED: SQUARE METRES
0
50000
100000
150000
200000
250000
300000
| 86 | 87 | 88 | 89 | 90 | 91 | 92 | 93 | 94 | 95 | 96 | 97 | 98 | 99 | 20 | 01 | 02 | 03 | 04 | 05 | 06 | 07 | 08 | 09 | 10 | 11 | 12 | 13 |
Source: Stats SA; MFA DATABASE
SQ
UA
RE
ME
TR
ES

… nevertheless, industrial vacancies remain relatively high (vacancies line inverted, right-hand scale)
INDUSTRIAL VACANCIES & INDUSTRIAL BUILDING PLANS PASSED
0
50000
100000
150000
200000
250000
300000
| 90 | 91 | 92 | 93 | 94 | 95 | 96 | 97 | 98 | 99 | 20 | 01 | 02 | 03 | 04 | 05 | 06 | 07 | 08 | 09 | 10 | 11 | 12 | 13 |
Source: RODE; STATS SA; SARB; MFA DATABASE
IND
US
TR
IAL
BB
P S
QU
AR
E M
ET
RE
S (
3m
ma
)
0.0
0.5
1.0
1.5
2.0
2.5
3.0
3.5
4.0
4.5
5.0
HIG
HE
R
<
VA
CA
NC
Y R
AT
E
>
LO
WE
R(I
NV
ER
TE
D)
INDUSTRIAL BPP INDUSTRIAL VACANCIES
VACANCIES INVERTEDRIGHT HAND SCALE
BPP

Still in the doldrums … with a slight rise in the residential sector being negated by a weaker non-residential sector
TOTAL BUILDING PLANS PASSED (SQUARE METRES)
0
750000
1500000
2250000
3000000
3750000
| 86 | 87 | 88 | 89 | 90 | 91 | 92 | 93 | 94 | 95 | 96 | 97 | 98 | 99 | 20 | 01 | 02 | 03 | 04 | 05 | 06 | 07 | 08 | 09 | 10 | 11 | 12 | 13 |
Source: Stats SA; MFA DATABASE
SQ
UA
RE
ME
TR
ES
TOTAL BPP 13mma

This comparison shows the relative performance of the various market segments since 1987. Long-term trends seem to suggest a bottoming out of the downward movements
COMPARISON: DWELLING HOUSES, TOWNHOUSES & FLATS, OFFICES, SHOPS, INDUSTRIAL SQUARE METRES (13 mma SMOOTHED) INDEX JAN 1987 = 100
0
100
200
300
400
500
600
700
| 87 | 88 | 89 | 90 | 91 | 92 | 93 | 94 | 95 | 96 | 97 | 98 | 99 | 20 | 01 | 02 | 03 | 04 | 05 | 06 | 07 | 08 | 09 | 10 | 11 | 12 | 13 |
Source: STATS SA; SARB; MFA DATABASE
SQ
UA
RE
ME
TR
ES
SM
OO
TH
ED
IN
DE
X J
AN
19
87
= 1
00
DH TH & FLATS OFFICES SHOPS INDUSTRIAL
Offices
Houses
Shops
Industrial
Townhouses& Flats
BUILDING PLANSPASSED

This comparison of long term trends shows the lagged pattern (residential is forming a trough, whilst it seems as if the non-residential sector is also approaching a trough – compare the cyclical movements in 1993)
COMPARISON TO ILLUSTRATE THE LAG BETWEEN RESIDENTIAL & NON-RESIDENTIAL BUILDING PLANS PASSED. INDEX Jan 1987 = 100
0
50
100
150
200
250
| 87 | 88 | 89 | 90 | 91 | 92 | 93 | 94 | 95 | 96 | 97 | 98 | 99 | 20 | 01 | 02 | 03 | 04 | 05 | 06 | 07 | 08 | 09 | 10 | 11 | 12 | 13 |
Source: Stats SA; SARB; MFA DATABASE
IND
EX
Ja
n 1
98
7 =
10
0
RESIDENTIAL BPP NON-RESIDENTIAL
33 MONTH LAG
18 MONTH LAG
26 MONTH LAG
30 MONTH LAG
NON-RESIDENTIAL LAGS RESIDENTIAL BY 27 MONTHS, ON AVERAGE, OR BY JUST MORE THAN 2 YEARS
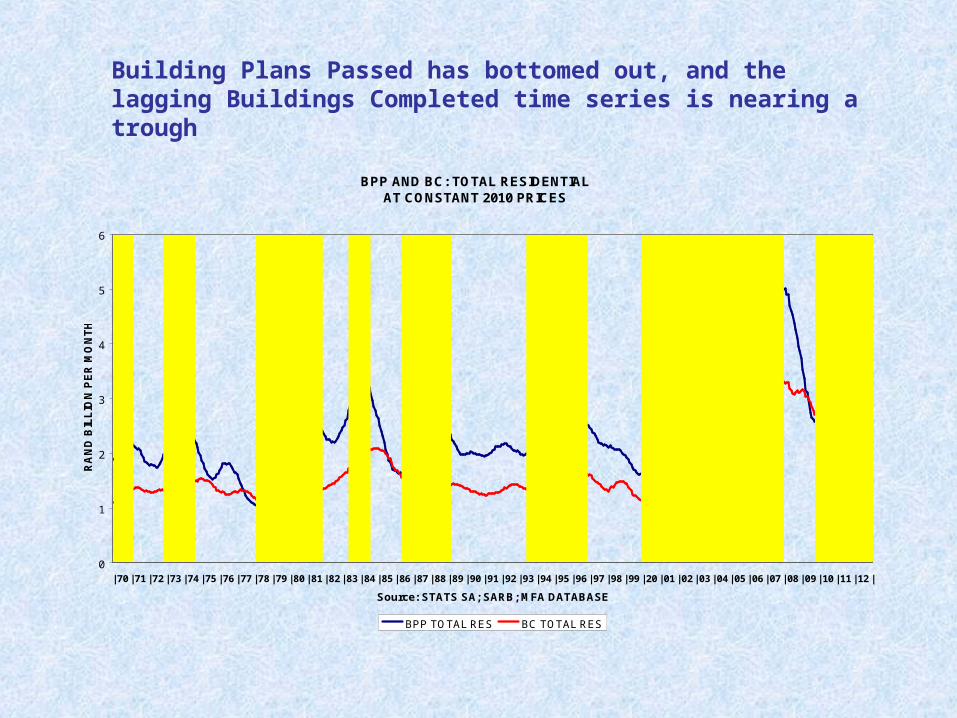
Building Plans Passed has bottomed out, and the lagging Buildings Completed time series is nearing a trough
BPP AND BC: TOTAL RESIDENTIALAT CONSTANT 2010 PRICES
0
1
2
3
4
5
6
| 70 | 71 | 72 | 73 | 74 | 75 | 76 | 77 | 78 | 79 | 80 | 81 | 82 | 83 | 84 | 85 | 86 | 87 | 88 | 89 | 90 | 91 | 92 | 93 | 94 | 95 | 96 | 97 | 98 | 99 | 20 | 01 | 02 | 03 | 04 | 05 | 06 | 07 | 08 | 09 | 10 | 11 | 12 |
Source: STATS SA; SARB; MFA DATABASE
RA
ND
BIL
LIO
N P
ER
MO
NT
H
BPP TOTAL RES BC TOTAL RES

The BPP indicator is improving, but the lagging BC series could fall further
BPP AND BC: TOTAL NON-RESIDENTIAL AT CONSTANT 2010 PRICES
0
1
1
2
2
3
| 70 | 71 | 72 | 73 | 74 | 75 | 76 | 77 | 78 | 79 | 80 | 81 | 82 | 83 | 84 | 85 | 86 | 87 | 88 | 89 | 90 | 91 | 92 | 93 | 94 | 95 | 96 | 97 | 98 | 99 | 00 | 01 | 02 | 03 | 04 | 05 | 06 | 07 | 08 | 09 | 10 | 11 | 12 |
Source: STATS SA; SARB; MFA DATABASE
RA
ND
BIL
LIO
N P
ER
MO
NT
H
BPP TOTAL NON-RES BC TOTAL NON-RES

A haphazard sideways movement is evident, with both indicators sliding downward
BPP AND BC: TOTAL ADDITIONS AND ALTERATIONS AT CONSTANT 2010 PRICES
0
1
1
2
2
3
3
| 70 | 71 | 72 | 73 | 74 | 75 | 76 | 77 | 78 | 79 | 80 | 81 | 82 | 83 | 84 | 85 | 86 | 87 | 88 | 89 | 90 | 91 | 92 | 93 | 94 | 95 | 96 | 97 | 98 | 99 | 00 | 01 | 02 | 03 | 04 | 05 | 06 | 07 | 08 | 09 | 10 | 11 | 12 |
Source: STATS SA; SARB; MFA DATABASE
RA
ND
BIL
LIO
N P
ER
MO
NT
H
BPP TOTAL ADD & ALT BC TOTAL ADD & ALT

Total BPP and BC seem to be in the initial stages of forming a trough, i.e. the movement is sideways in both cases
TOTAL BUILDING PLANS PASSED AND BUILDINGS COMPLETED AT CONSTANT 2010 PRICES
0
2
4
6
8
10
12
| 70 | 71 | 72 | 73 | 74 | 75 | 76 | 77 | 78 | 79 | 80 | 81 | 82 | 83 | 84 | 85 | 86 | 87 | 88 | 89 | 90 | 91 | 92 | 93 | 94 | 95 | 96 | 97 | 98 | 99 | 00 | 01 | 02 | 03 | 04 | 05 | 06 | 07 | 08 | 09 | 10 | 11 | 12 |
Source: STATS SA; SARB; MFA DATABASE
RA
ND
BIL
LIO
N P
ER
MO
NT
H
BPP TOTAL BC TOTAL

Cement sales is about 6% higher than a year ago, with the average of BPP & BC just about on the zero line
Comparison: CEMENT SALES and AVERAGE of TOTAL BPP & BCAnnual Percentage Change
-30
-20
-10
0
10
20
30
40
50
60
|70|71|72|73|74|75|76|77|78|79|80|81|82|83|84|85|86|87|88|89|90|91|92|93|94|95|96|97|98|99|00|01|02|03|04|05|06|07|08|09|10|11|12|
AN
NU
AL
PE
RC
EN
TA
GE
CH
AN
GE
AVERAGE BPP & BC Cement Sales