Embed Size (px)
Citation preview
EPA/600/R-17/384F September 2017
Update for Chapter 5 of the Exposure Factors Handbook
Soil and Dust Ingestion
National Center for Environmental Assessment Office of Research and Development
U.S. Environmental Protection Agency Washington, DC 20460
Update for Chapter 5 of the Exposure Factors Handbook
Chapter 5—Soil and Dust Ingestion
September 2017 Page 5-ii
DISCLAIMER
This document has been reviewed in accordance with U.S. Environmental Protection
Agency policy and approved for publication. Mention of trade names or commercial products
does not constitute endorsement or recommendation for use.
Update for Chapter 5 of the Exposure Factors Handbook
Chapter 5—Soil and Dust Ingestion
September 2017 Page 5-iii
TABLE OF CONTENTS
LIST OF TABLES ............................................................................................................................................. 5-vi LIST OF FIGURES ......................................................................................................................................... 5-vii
5. SOIL AND DUST INGESTION ............................................................................................................... 5-15.1. INTRODUCTION ........................................................................................................................ 5-1 5.2. RECOMMENDATIONS .............................................................................................................. 5-3 5.3. KEY AND RELEVANT STUDIES ............................................................................................ 5-10
5.3.1. Methodologies Used in Key Studies ............................................................................. 5-10 5.3.1.1. Tracer Element Methodology ..........................................................................5-10 5.3.1.2. Biokinetic Model Comparison Methodology ..................................................5-12 5.3.1.3. Activity Pattern Methodology .........................................................................5-12
5.3.2. Key Studies of Primary Analysis .................................................................................. 5-12 5.3.2.1. Vermeer and Frate (1979)—Geophagia in Rural Mississippi: Environmental
and Cultural Contexts and Nutritional Implications ........................................5-13 5.3.2.2. Calabrese et al. (1989)—How Much Soil Do Young Children Ingest: An
Epidemiologic Study/Barnes (1990)―Childhood Soil Ingestion: How Much Dirt Do Kids Eat?/Calabrese et al. (1991)—Evidence of Soil Pica Behavior and Quantification of Soil Ingested .................................................................5-13
5.3.2.3. Davis et al. (1990)—Quantitative Estimates of Soil Ingestion in Normal Children between the Ages of 2 and 7 Years: Population-Based Estimates Using Aluminum, Silicon, and Titanium as Soil Tracer Elements...................5-14
5.3.2.4. Calabrese et al. (1997a)—Soil Ingestion Estimates for Children Residing on a Superfund Site ..............................................................................................5-14
5.3.2.5. Stanek et al. (1998)—Prevalence of Soil Mouthing/Ingestion among Healthy Children Aged One to Six/Calabrese et al. (1997b)—Soil Ingestion Rates in Children Identified by Parental Observation as Likely High Soil Ingesters ..........................................................................................................5-15
5.3.2.6. Davis and Mirick (2006)—Soil Ingestion in Children and Adults in the Same Family ..............................................................................................................5-16
5.3.3. Key Studies of Secondary Analysis .............................................................................. 5-16 5.3.3.1. Calabrese and Stanek (1995)—Resolving Intertracer Inconsistencies in Soil
Ingestion Estimation ........................................................................................5-17 5.3.3.2. Stanek and Calabrese (1995a)—Soil Ingestion Estimates for Use in Site
Evaluations Based on the Best Tracer Method ................................................5-17 5.3.3.3. Hogan et al. (1998)—Integrated Exposure Uptake Biokinetic Model for
Lead in Children: Empirical Comparisons with Epidemiologic Data .............5-18 5.3.3.4. Özkaynak et al. (2011)—Modeled Estimates of Soil and Dust Ingestion
Rates for Children ...........................................................................................5-19 5.3.3.5. Wilson et al. (2013)—Revisiting Dust and Soil Ingestion Rates Based on
Hand-to-Mouth Transfer ..................................................................................5-20 5.3.3.6. Von Lindern et al. (2016)—Estimating Children’s Soil/Dust Ingestion Rates
through Retrospective Analyses of Blood Lead Biomonitoring from the Bunker Hill Superfund Site in Idaho ...............................................................5-21
5.3.4. Relevant Studies of Primary Analysis ........................................................................... 5-22 5.3.4.1. Dickins and Ford (1942)—Geophagy (Dirt Eating) among Mississippi
Negro School Children ....................................................................................5-22 5.3.4.2. Ferguson and Keaton (1950)—Studies of the Diets of Pregnant Women in
Mississippi: II Diet Patterns ............................................................................5-22 5.3.4.3. Cooper (1957)—Pica: A Survey of the Historical Literature as Well as
Reports from the Fields of Veterinary Medicine and Anthropology, the Present Study of Pica in Young Children, and a Discussion of Its Pediatric and Psychological Implications .......................................................................5-23
5.3.4.4. Barltrop (1966)—The Prevalence of Pica .......................................................5-23
Update for Chapter 5 of the Exposure Factors Handbook
Chapter 5—Soil and Dust Ingestion
September 2017 Page 5-iv
TABLE OF CONTENTS (Continued)
5.3.4.5. Bruhn and Pangborn (1971)—Reported Incidence of Pica among Migrant Families ...........................................................................................................5-23
5.3.4.6. Robischon (1971)—Pica Practice and Other Hand-Mouth Behavior and Children’s Developmental Level .....................................................................5-23
5.3.4.7. Bronstein and Dollar (1974)—Pica in Pregnancy ...........................................5-23 5.3.4.8. Hook (1978)—Dietary Cravings and Aversions during Pregnancy .................5-24 5.3.4.9. Binder et al. (1986)—Estimating Soil Ingestion: The Use of Tracer Elements
in Estimating the Amount of Soil Ingested by Young Children .......................5-24 5.3.4.10. Clausing et al. (1987)—A Method for Estimating Soil Ingestion by Children
....................................................................................................................5-25 5.3.4.11. Van Wïjnen et al. (1990)—Estimated Soil Ingestion by Children ...................5-25 5.3.4.12. Calabrese et al. (1990)—Preliminary Adult Soil Ingestion Estimates:
Results of a Pilot Study ...................................................................................5-26 5.3.4.13. Cooksey (1995)—Pica and Olfactory Craving of Pregnancy: How Deep Are
the Secrets? ......................................................................................................5-26 5.3.4.14. Smulian et al. (1995)—Pica in a Rural Obstetric Population ..........................5-27 5.3.4.15. Grigsby et al. (1999)—Chalk Eating in Middle Georgia: A Culture-Bound
Syndrome of Pica? ...........................................................................................5-27 5.3.4.16. Ward and Kutner (1999)—Reported Pica Behavior in a Sample of Incident
Dialysis Patients ..............................................................................................5-27 5.3.4.17. Simpson et al. (2000)—Pica During Pregnancy in Low-Income Women
Born in Mexico ................................................................................................5-28 5.3.4.18. Obialo et al. (2001)—Clay Pica Has No Hematologic or Metabolic Correlate
to Chronic Hemodialysis Patients ....................................................................5-28 5.3.4.19. Klitzman et al. (2002)—Lead Poisoning among Pregnant Women in New
York City: Risk Factors and Screening Practices ............................................5-28 5.3.4.20. Doyle et al. (2012)—A Soil Ingestion Pilot Study of a Population Following
a Traditional Lifestyle Typical of Rural or Wilderness Areas ..........................5-28 5.3.4.21. Irvine et al. (2014)—Soil Ingestion Rate Determination in a Rural
Population in Alberta, Canada Practicing a Wilderness Lifestyle ...................5-29 5.3.4.22. Lumish et al. (2014)—Gestational Iron Deficiency is Associated with Pica
Behaviors in Adolescents ................................................................................5-29 5.3.4.23. Jang et al. (2014)—General Factors of the Korean Exposure Factors
Handbook ........................................................................................................5-29 5.3.4.24. Chien et al. (2015)—Soil Ingestion Rates for Children under 3 Years Old in
Taiwan .............................................................................................................5-30 5.3.4.25. Wang et al. (2015)—Quantification of Soil/Dust (SD) on the Hands of
Children from Hubei Province, China Using Hand Wipes ..............................5-31 5.3.4.26. Lin et al. (2015)—Pica during Pregnancy among Mexican-Born Women: A
Formative Study ..............................................................................................5-31 5.3.4.27. Ma et al. (2016)—Estimation of the Daily Soil/Dust (SD) Ingestion Rate of
Children from Gansu Province, China via Hand-to-Mouth Contact Using Tracer Elements ...............................................................................................5-32
5.3.5. Relevant Studies of Secondary Analysis and Other Relevant Information ................... 5-32 5.3.5.1. Wong (1988)—The Role of Environmental and Host Behavioral Factors in
Determining Exposure to Infection with Ascaris lumbricoides and Trichuris trichiura/Calabrese and Stanek (1993)―Soil Pica: Not a Rare Event .............5-33
5.3.5.2. Calabrese and Stanek (1992b)—What Proportion of Household Dust is Derived from Outdoor Soil? ............................................................................5-33
5.3.5.3. Stanek and Calabrese (1995b)—Daily Estimates of Soil Ingestion in Children ...........................................................................................................5-33
Update for Chapter 5 of the Exposure Factors Handbook
Chapter 5—Soil and Dust Ingestion
September 2017 Page 5-v
TABLE OF CONTENTS (Continued)
5.3.5.4. Calabrese et al. (1996)—Methodology to Estimate the Amount and Particle Size of Soil Ingested by Children: Implications for Exposure Assessment at Waste Sites.......................................................................................................5-34
5.3.5.5. Stanek et al. (1999)—Soil Ingestion Estimates for Children in Anaconda Using Trace Element Concentrations in Different Particle Size Fractions ......5-34
5.3.5.6. Stanek and Calabrese (2000)—Daily Soil Ingestion Estimates for Children at a Superfund Site...........................................................................................5-34
5.3.5.7. Stanek et al. (2001a)—Biasing Factors for Simple Soil Ingestion Estimates in Mass Balance Studies of Soil Ingestion ......................................................5-35
5.3.5.8. Stanek et al. (2001b)—Soil Ingestion Distributions for Monte Carlo Risk Assessment in Children ...................................................................................5-35
5.3.5.9. Von Lindern et al. (2003)—Assessing Remedial Effectiveness through the Blood Lead:Soil/Dust Lead Relationship at the Bunker Hill Superfund Site in the Silver Valley of Idaho ............................................................................5-35
5.3.5.10. Layton and Beamer (2009)—Migration of Contaminated Soil and Airborne Particulates to Indoor Dust ..............................................................................5-36
5.3.5.11. Gavrelis et al. (2011)—An Analysis of the Proportion of the U.S. Population That Ingests Soil or Other Non-Food Substances ............................................5-36
5.3.5.12. Stanek et al. (2012a)—Meta-Analysis of Mass-Balance Studies of Soil Ingestion in Children .......................................................................................5-37
5.3.5.13. Wilson et al. (2015)—Estimation of Sediment Ingestion Rates Based on Hand-to-Mouth Contact and Incidental Surface Water Ingestion ....................5-37
5.3.5.14. Wilson et al. (2016)—Estimation of Dust Ingestion Rates in Units of Surface Area per Day Using a Mechanistic Hand-to-Mouth Model .............................5-38
5.3.5.15. Fawcett et al. (2016)—A Meta-Analysis of the Worldwide Prevalence of Pica during Pregnancy and the Postpartum Period ..........................................5-38
5.4. LIMITATIONS OF STUDY METHODOLOGIES .................................................................... 5-39 5.4.1. Tracer Element Methodology ....................................................................................... 5-39 5.4.2. Biokinetic Model Comparison Methodology ............................................................... 5-42 5.4.3. Activity Pattern Methodology ...................................................................................... 5-43 5.4.4. Environmental and Household Interventions ................................................................ 5-44 5.4.5. Key Studies: Representativeness of the U.S. Population .............................................. 5-44
5.5. DERIVATION OF RECOMMENDED SOIL AND DUST INGESTION VALUES .................. 5-46 5.5.1. Central Tendency Soil and Dust Ingestion Recommendations ..................................... 5-47 5.5.2. Upper Percentile, Soil Pica, and Geophagy Recommendations .................................... 5-49
5.6. REFERENCES FOR CHAPTER 5 ............................................................................................. 5-52
APPENDIX A .................................................................................................................................................... A-1 APPENDIX B ..................................................................................................................................................... B-1 APPENDIX C .................................................................................................................................................... C-1 APPENDIX D .................................................................................................................................................... D-1
Update for Chapter 5 of the Exposure Factors Handbook
Chapter 5—Soil and Dust Ingestion
September 2017 Page 5-vi
LIST OF TABLES
Table 5-1. Recommended Values for Daily Soil, Dust, and Soil + Dust Ingestion (mg/day) ......................... 5-7 Table 5-2. Confidence in Recommendations for Ingestion of Soil and Dust ................................................. 5-8 Table 5-3. Soil, Dust, and Soil + Dust Ingestion Estimates for Amherst, MA Study Children
(1 to <4 Years) ............................................................................................................................. 5-58 Table 5-4. Amherst, MA Soil Pica Child’s Daily Ingestion Estimates by Tracer and by Week (mg/day) .... 5-59 Table 5-5. Estimated Soil Ingestion for Sample of Washington State Children (2–7 years; N = 101) ......... 5-59 Table 5-6. Soil Ingestion Estimates for 64 Anaconda Children (Ages 1–4 Years) ....................................... 5-60 Table 5-7. Soil Ingestion Estimates for Massachusetts Child Displaying Soil-Pica Behavior (mg/day) ..... 5-60 Table 5-8. Average Daily Soil and Dust Ingestion Estimate for Children 1–3 Years (mg/day) ................... 5-61 Table 5-9. Mean and Median Soil Ingestion (mg/day) by Family Members ................................................ 5-61 Table 5-10. Positive/Negative Error (Bias) in Soil Ingestion Estimates in Calabrese et al. (1989) Study:
Effect on Mean Soil Ingestion Estimate (mg/day) ...................................................................... 5-62 Table 5-11. Comparison of Soil Ingestion Estimates (mg/day) from Two Sites ............................................ 5-63 Table 5-12. Predicted Soil and Dust Ingestion Rates for Children Age 3 to <6 Years (mg/day) .................... 5-64 Table 5-13. Age-Dependent Probability Density Functions Used to Estimate Dust and Soil Ingestion
Rates via the Activity Pattern Modeling Approach ..................................................................... 5-65 Table 5-14. Soil and Dust Ingestion Rates, Estimated Using a Probabilistic Activity Pattern Modeling
Approach ..................................................................................................................................... 5-66 Table 5-15. Age-Specific Central Tendency Soil/Dust Ingestion Rates for Four Scenarios That Best
Predict Observed Blood Lead Levels (mg/day) .......................................................................... 5-66 Table 5-16. Age-Specific Distributions of Soil and Dust Intake Rates for the Four Partition Scenarios
(mg/day) ...................................................................................................................................... 5-67 Table 5-17. Estimated Daily Soil Ingestion for East Helena, MT Children Ages 1–3 years (N = 59) ........... 5-68 Table 5-18. Estimated Soil Ingestion for Sample of Dutch Nursery School Children, Ages 2–4 Years ......... 5-69 Table 5-19. Estimated Soil Ingestion for Sample of Dutch Hospitalized, Bedridden Children, Ages 2–4
Years............................................................................................................................................ 5-70 Table 5-20. Van Wïjnen et al. (1990) Limiting Tracer Method (LTM) Soil Ingestion Estimates for
Sample of Dutch Children ........................................................................................................... 5-70 Table 5-21. Estimated Geometric Mean Limiting Tracer Method (LTM) Soil Ingestion Values of
Children Attending Daycare Centers According to Age, Weather Category, and Sampling Period .......................................................................................................................................... 5-71
Table 5-22. Items Ingested by Low-Income Mexican-Born Women (Ages 18–42 Years) Who Practiced Pica during Pregnancy While in the United States (N = 46) ....................................... 5-72
Table 5-23. Soil Ingestion Rates for the Four Most Reliable Tracers (Aluminum, Silicon, Lanthanum, and Cerium), Aluminum and Silicon Combined, and All Four Tracers Combined (mg/day) ..... 5-72
Table 5-24. Soil Ingestion Rates for Aluminum, Silicon, and the Four Most Reliable Tracers (Aluminum, Silicon, Lanthanum, and Cerium) Combined (mg/day) .......................................... 5-73
Table 5-25. Estimated Soil Ingestion for Six Jamaican Children Displaying Soil Pica ................................. 5-73 Table 5-26. Distribution of Average (Mean) Daily Soil Ingestion Estimates per Child for 64 Children,
Ages 1 to <4 Years (mg/day) ....................................................................................................... 5-74 Table 5-27. Estimated Distribution of Individual Mean Daily Soil Ingestion Based on Data for 64 Subjects
(Ages 1 to <4 Years) Projected over 365 Days ........................................................................... 5-74 Table 5-28. Distribution of Daily Soil Ingestion (mg/day) Over 7 Days, 64 Children (1−4 years) from
Anaconda, MT ............................................................................................................................ 5-75 Table 5-29. Prevalence of Nonfood Consumption by Substance from NHANES I and NHANES II ............ 5-76 Table 5-30. Results of Meta-Analysis on Soil Ingestion (mg/day) ................................................................ 5-77 Table 5-31. Age-Dependent Probability Density Functions Used to Estimate Sediment Ingestion Rates
Using an Activity Pattern Modeling Approach ........................................................................... 5-78 Table 5-32. Estimated Sediment Ingestion Rates (mg/hour) Using an Activity Pattern Modeling
Approach ..................................................................................................................................... 5-79 Table 5-33. Dust Ingestion Rates at Residential Settings Based on an Activity Pattern Modeling
Approach ..................................................................................................................................... 5-79
Update for Chapter 5 of the Exposure Factors Handbook
Chapter 5—Soil and Dust Ingestion
September 2017 Page 5-vii
LIST OF TABLES (CONTINUED)
Table 5-34. Summary of Estimates of Soil and Dust Ingestion by General Population Children and Adults from Key Studies Using the Tracer Study, Biokinetic Modeling, and Activity Pattern Methodologies (mg/day) ................................................................................................. 5-80
Table A-1. Terms Used in Literature Searches ............................................................................................... A-1 Table B-1. Distributions of Soil Ingestion Rates (mg/day) Based on Different Methods of Analyzing
Data from the Tracer Studies......................................................................................................... B-1 Table C-1. Key Soil Ingestion Studies Used in Developing Soil + Dust Ingestion Recommendation for
Use in Risk Assessment ................................................................................................................ C-1 Table D-1. Studies on the Prevalence of Ingesting Soil, Dust, or Other Nonfood Substances ....................... D-1
Update for Chapter 5 of the Exposure Factors Handbook
Chapter 5—Soil and Dust Ingestion
September 2017 Page 5-viii
LIST OF FIGURES
Figure 5-1. Prevalence of Nonfood Substance Consumption by Age, NHANES I and NHANES II. ........... 5-83 Figure 5-2. Prevalence of Nonfood Substance Consumption by Race, NHANES I and NHANES II. ......... 5-84 Figure 5-3. Prevalence of Nonfood Substance Consumption by Income, NHANES I (1971–1975) and .............
NHANES II (1976–1980). .......................................................................................................... 5-85
Update for Chapter 5 of the Exposure Factors Handbook
Chapter 5—Soil and Dust Ingestion
September 2017 Page 5-1
5. SOIL AND DUST INGESTION5.1. INTRODUCTION
This document is an update to Chapter 5 (Soil and Dust Ingestion) of the Exposure Factors Handbook: 2011 Edition. New information that has become available since 2011 has been added, and the recommended values have been revised, as needed, to reflect the additional information. The chapter includes a comprehensive review of the scientific literature through 2016. The new literature was identified via formal literature searches conducted by EPA library services as well as targeted internet searches conducted by the authors of this chapter. Appendix A provides a list of the key terms that were used in the literature searches. Revisions to this chapter have been made in accordance with the approved quality assurance plan for the Exposure Factors Handbook.
The ingestion of soil and dust is a potential route of exposure to environmental chemicals for both adults and children. Children, in particular, may ingest significant quantities of soil and dust due to their tendency to play on the floor indoors and on the ground outdoors and their tendency to mouth objects or their hands. For example, children may ingest soil and dust through deliberate hand-to-mouth movements, or unintentionally by eating food or mouthing objects that have dropped on the floor. Adults may also ingest soil or dust particles that adhere to food, cigarettes, or their hands. Other vulnerable populations may include pregnant women and populations engaging in wilderness and traditional rural lifestyles. Thus, understanding soil and dust ingestion patterns is an important part of estimating overall exposures to environmental chemicals.
Currently, knowledge of soil and dust ingestion patterns within the United States is limited. Only a few researchers have attempted to quantify soil and dust ingestion patterns in U.S. adults or children.
This chapter explains the concepts of soil and dust ingestion, soil pica, and geophagy; defines these terms for the purpose of this handbook’s exposure factors; and presents available data from the literature on the amount of soil and dust ingested.
The Centers for Disease Control and Prevention’s Agency for Toxic Substances and Disease Registry (ATSDR) held a workshop in June 2000 in which a panel of soil ingestion experts developed definitions for soil ingestion, soil pica, and geophagy to distinguish aspects of soil ingestion patterns that are important from a research perspective (ATSDR, 2001). This chapter uses the
definitions developed by participants in that workshop:
Soil ingestion is the consumption of soil. This may result from various behaviors including, but not limited to, mouthing, contacting dirty hands, eating dropped food, or consuming soil directly.
Soil pica is the recurrent ingestion of unusually high amounts of soil (i.e., on the order of 1,000−5,000 mg/day or more).
Geophagy is the intentional ingestion of earths and is usually associated with cultural practices.
Some studies are of a behavior known as “pica,” and the subset of “pica” that consists of ingesting soil. A general definition of the concept of pica is that of ingesting nonfood substances, or ingesting large quantities of certain particular foods. Definitions of pica often include references to recurring or repeated ingestion of these substances. Soil pica is specific to ingesting materials that are defined as soil, such as clays, yard soil, and flower-pot soil. Although soil pica has been observed among children and adults, information about the prevalence of pica behavior is limited. Gavrelis et al. (2011) reported that the prevalence of nonfood substance consumption varies by age, race, and income level. The behavior was most prevalent among children 1 to <3 years (Gavrelis et al., 2011). Geophagy, on the other hand, is an extremely rare behavior, especially among children, as is soil pica among adults. One distinction between geophagy and soil pica that may have public health implications is the fact that surface soils generally are not the main source of geophagy materials. Instead, geophagy is typically the consumption of clay from known, uncontaminated sources, whereas soil pica involves the consumption of surface soils, usually the top 2−3 inches (ATSDR, 2001).
Researchers in many different disciplines have hypothesized motivations for human soil pica or geophagy behavior, including alleviating hunger, nutritional deficiencies, or gastrointestinal distress (Young, 2010), a desire to remove toxins or self-medicate (Starks and Slabach, 2012), and other physiological or cultural influences (Danford, 1982). Bruhn and Pangborn (1971) and Harris and Harper (1997) suggest a religious context for certain geophagy or soil ingestion practices. Geophagy is characterized as an intentional behavior, whereas soil pica should not be limited to intentional soil ingestion, primarily because children can consume large amounts of soil from their typical behaviors
Update for Chapter 5 of the Exposure Factors Handbook
Chapter 5—Soil and Dust Ingestion
September 2017 Page 5-2
and because differentiating intentional and unintentional behavior in young children is difficult (ATSDR, 2001). Some researchers have investigated populations that may be more likely than others to exhibit soil pica or geophagy behavior on a recurring basis. These populations might include pregnant women who exhibit soil pica behavior (Simpson et al., 2000), adults and children who practice geophagy (Vermeer and Frate, 1979), institutionalized children (Wong, 1988), and children with developmental delays (Danford, 1983), autism (Kinnell, 1985), or celiac disease (Korman, 1990). However, identifying specific soil pica and geophagy populations remains difficult due to limited research on this topic. ATSDR (2001) has estimated that 33% of children ingest more than 10 grams of soil 1 or 2 days a year. No information was located regarding the prevalence of geophagy behavior.
Because some soil and dust ingestion may be a result of hand-to-mouth behavior, soil properties that relate to adherence to the skin may be important. For example, soil particle size, organic matter content, moisture content, and other soil properties may affect the amount of soil that adheres to the skin and is available for ingestion. Soil particle sizes range from 50−2,000 µm for sand, 2−50 µm for silt, and are <2 µm for clay (USDA, 1999), while typical atmospheric dust particle sizes are in the range of 0.001−30 µm (U.S. OSHA, 1987). Studies on particle size have indicated that finer soil particles (generally <63 µm in diameter) tend to be adhered more efficiently to human hands, whereas adhered soil fractions are independent of organic matter content or soil origin (Choate et al., 2006; Yamamoto et al., 2006). For soils with higher moisture content, a greater number of large particles have been shown to adhere to the skin (Choate et al., 2006). Ikegami et al. (2014) found that approximately 90% of the particles of playground soil that adhered to children’s hands were less than 100 µm in size. Beamer et al. (2012) and Bergstrom et al. (2011) found that concentrations of contaminants (e.g., metals) in soil may differ according to particle size. Cao et al. (2012) also described the importance of considering particle size when evaluating exposures to indoor settled dust.
In this handbook, soil, indoor settled dust, and outdoor settled dust are defined generally as the following:
Soil. Particles of unconsolidated mineral and/or organic matter from the earth’s surface that are
located outdoors, or are used indoors to support plant growth. It includes particles that have settled onto outdoor objects and surfaces (outdoor settled dust).
Indoor Settled Dust. Particles in building interiors that have settled onto objects, surfaces, floors, and carpeting. These particles may include soil particles that have been tracked or blown into the indoor environment from outdoors, as well as organic matter.
Outdoor Settled Dust. Particles that have settled onto outdoor objects and surfaces due to either wet or dry deposition. Note that it may not be possible to distinguish between soil and outdoor settled dust because outdoor settled dust generally is present on the uppermost surface layer of soil.
For the purposes of this handbook, soil ingestion includes both soil and outdoor settled dust, and dust ingestion includes indoor settled dust only.
Several methodologies related to soil and dust ingestion are represented in the literature. Two methodologies combine biomarker measurements with measurements of the biomarker substance’s presence in environmental media. An additional methodology offers modeled estimates of soil/dust ingestion from activity pattern data from observational studies (e.g., videography) or from the responses to survey questionnaires about children’s activities, behaviors, and locations.
The first of the biomarker methodologies is the “tracer element” methodology. This method uses measured quantities of specific elements present in feces, urine, food and medications, yard soil, house dust, and sometimes community soil and dust. This information is used in combination with certain assumptions about the elements’ behavior in the gastrointestinal tract to produce estimates of soil and dust quantities ingested (Davis et al., 1990).
The second biomarker methodology is the “biokinetic model comparison” methodology. This method compares results from a biokinetic model of lead exposure and uptake that predicts blood lead levels, with biomarker measurements of lead in blood (Von Lindern et al., 2003). The model predictions are made using assumptions about ingested soil and dust quantities that are based, in part, on results from early versions of the first methodology. Therefore, the comparison with actual measured blood lead levels serves to confirm, to some extent, the assumptions about ingested soil and dust quantities used in the biokinetic model. Lead isotope ratios have also been used as a biomarker to
Update for Chapter 5 of the Exposure Factors Handbook
Chapter 5—Soil and Dust Ingestion
September 2017 Page 5-3
study sources of lead exposures in children. This technique involves measurements of different lead isotopes in blood and/or urine, food, water, and house dust and compares the ratio of different lead isotopes to infer sources of lead exposure that may include dust or other environmental exposures (Manton et al., 2000). However, application of lead isotope ratios to derive estimates of dust ingestion by children has not been attempted. Therefore, it is not discussed any further in this chapter.
The third, “activity pattern” methodology, combines information from hand-to-mouth and object-to-mouth behaviors with microenvironment data (i.e., time spent at different locations) to derive estimates of soil and dust ingestion. Behavioral information often comes from data obtained using videography techniques or from responses to survey questions obtained from adults, caregivers, and/or children. Surveys often include questions about hand-to-mouth and object-to-mouth behaviors, soil and dust ingestion behaviors, frequency, and sometimes quantity (Barltrop, 1966). Moya and Phillips (2014) provide a review of these three methodologies used to estimate soil and dust ingestion.
A fourth methodology uses assumptions regarding ingested quantities of soil and dust that are based on a general knowledge of human behavior, and potentially supplemented or informed by data from other methodologies (Hawley, 1985; Kissel et al., 1998a; Wong et al., 2000). This methodology is not discussed in this chapter because it yields rudimentary estimates of soil ingestion.
Another approach used to estimate soil/dust ingestion consists of measurements of soil/dust loadings on surfaces (mass per surface area) and concentrations of contaminants on those surfaces. Estimates of soil/dust ingestion can be made by making assumptions about children’s hand-to-mouth and object-to-mouth behavior, surfaces contacted, fraction of soil/dust transferred, exposure time, saliva extraction efficiency, and assumptions about the amount of soil/dust reloading on skin or surfaces. This approach results in a different metric of soil/dust ingestion in units of area contacted/day, which can then be used with corresponding contaminant concentrations of soil/dust per surface area. This approach is described in more detail by Wilson et al. (2016).
The recommendations for soil, dust, and soil + dust ingestion rates are provided in the next section, along with a summary of the confidence ratings for these recommendations. The recommended values are based on key studies identified by the U.S. Environmental Protection
Agency (U.S. EPA) for this factor. As described in Chapter 1 of the Exposure Factors Handbook: 2011 Edition (U.S. EPA, 2011), key studies represent the most up-to-date and scientifically sound for deriving recommendations for exposure factors, whereas other studies are designated "relevant," meaning applicable or pertinent, but not necessarily the most important. For example, studies that provide supporting data or information related to the factor of interest (e.g., pica prevalence), or have study designs or approaches that make the data less applicable to the population of interest (e.g., studies not conducted in the United States) have been designated as relevant rather than key. Key studies were selected based on the general assessment factors described in Chapter 1 of the Handbook.
Following the recommendations, a description of the three methodologies used to estimate soil and dust ingestion is provided, followed by a summary of key and relevant studies. Because strengths and limitations of each one of the key and relevant studies relate to the strengths and limitations inherent of the methodologies themselves, they are discussed at the end of the key and relevant studies.
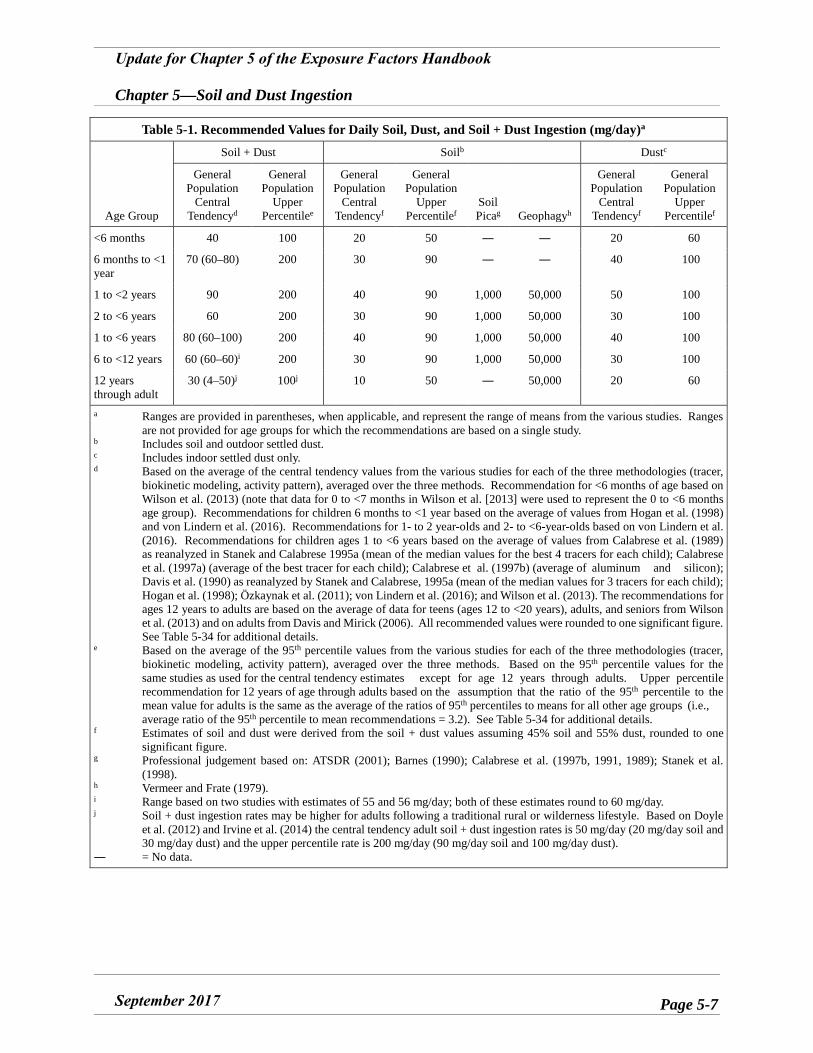
5.2. RECOMMENDATIONS Table 5-1 provides the recommended soil and
dust ingestion rates for use in human health risk assessments. The soil ingestion recommendations in Table 5-1 are intended to represent ingestion of a combination of soil and outdoor settled dust, without distinguishing between these sources. The source of the soil in these recommendations could be outdoor soil, indoor containerized soil used to support growth of indoor plants, or a combination of both outdoor soil and containerized indoor soil. The inhalation and subsequent swallowing of soil particles is accounted for in these recommended values; therefore, this pathway does not need to be considered separately. These recommendations are called “soil.” The dust ingestion recommendations in Table 5-1 include soil tracked into the indoor setting, indoor settled dust, and air-suspended particulate matter that is inhaled and swallowed. “Dust” recommendations are provided in the event that assessors need recommendations for an indoor or inside a transportation vehicle scenario in which dust, but not outdoor soil, is the exposure medium of concern. The soil + dust recommendations would include soil, either from outdoor or containerized indoor sources, dust that is a combination of outdoor settled dust, indoor settled dust, and air-suspended particulate matter that is inhaled, subsequently trapped in mucous and moved from the respiratory
Update for Chapter 5 of the Exposure Factors Handbook
Chapter 5—Soil and Dust Ingestion
September 2017 Page 5-4
system to the gastrointestinal tract, and a soil-origin material located on indoor floor surfaces that was tracked indoors by building occupants.
Many of the key studies predated the age groups recommended for children by U.S. EPA (2005) and were performed on groups of children of varying ages. As a result, central tendency and upper percentile recommendations could only be developed for some combined age categories, as shown in Table 5-1. Published estimates from the key studies have been rounded to one significant figure in Table 5-1.
An important factor to consider when using the recommended values described in the following sections is that they are limited to estimates of soil and dust quantities ingested. The scope of this chapter is limited to quantities of soil and dust taken into the gastrointestinal tract, and does not extend to issues regarding bioavailability of environmental contaminants present in that soil and dust. Information from other sources is needed to address bioavailability. In addition, as more information becomes available regarding gastrointestinal absorption of environmental contaminants, adjustments to the soil and dust ingestion exposure equations may need to be made to better represent the direction of movement of those contaminants within the gastrointestinal tract.
To place the recommended values into context, it may be useful to compare the soil ingestion rates to common measurements. For example, the central tendency recommendation of 40 mg/day or 0.040 g/day of either soil only or dust only for general population children 1 to <6 years old would be equivalent to approximately 1/8 of an aspirin tablet per day because the average aspirin tablet is approximately 325 mg. Likewise, the central tendency recommendation of 80 mg/day or 0.080 g/day, for soil and dust combined, would be equivalent to approximately 1/4 of an aspirin tablet. The 50 g/day ingestion rate recommended to represent geophagy behavior would be roughly equivalent to 150 aspirin tablets per day.
5.2.1 General Population Soil and Dust Ingestion Rates
The key studies described in Sections 5.3.2 and 5.3.3 were used to recommend values for soil and dust ingestion for adults and children in the general population. Table 5-1 shows the central tendency and upper percentile recommendations for daily ingestion of soil + dust, soil only, and dust only in mg/day. Section 5.5 and Table 5-34 provide additional details on the derivation of these recommended values. The recommended values for
soil ingestion only and dust ingestion only are based on the assumption that 45% of the soil + dust ingestion can be attributed to soil and 55% can be attributed to dust. This assumption is based on the defaults used in EPA’s Integrated Exposure and Uptake Biokinetic (IEUBK) model (U.S. EPA, 1994a). According to U.S. EPA (1994a), the assumption is based on the relative likelihood of contact with soil/dust in indoor and outdoor locations and “represents [EPA’s] best judgement of a properly weighted ratio for this purpose.” All recommended values have been rounded to one significant figure due to data limitations.
In general, the “central tendency” recommendations reflect an arithmetic mean (average) of estimated values within a study, across studies within a methodology, and across the three methodologies. However, in some of the tracer studies, (Stanek and Calabrese, 1995a), the central tendency value used was the average of the median values for the four best tracer elements or the average of the median of three tracers (see Section 5.3.3.2). For others (Calabrese et al., 1997a; 1997b) the central tendency value represents the average of the best tracer or the average based on aluminum and silicon. Upper percentile recommendations for daily ingestion are also provided in mg/day. Note that there is considerably more uncertainty related to the upper percentile soil and dust ingestion rate estimates than for the average estimates. Biases due to the errors (e.g., sampling errors, measurement errors, analytical errors) are more likely to affect the upper percentile estimates than the average estimates. Upper percentile recommendations for the general population are provided for soil, dust, and soil + dust ingestion. These values are based on the 95th percentile values from the key studies.
The recommended central tendency soil + dust ingestion estimate for general population infants 0 to <6 months old is 40 mg/day, and the central tendency estimate for 6 months to <1 year of age is 70 mg/day. If a central tendency estimate is needed for soil or dust only, the recommended values are both 20 mg/day for infants 0 to <6 months (i.e., 18 mg/day soil and 22 mg/day dust, both rounded to one significant figure is 20 mg/day). For infants 6 months to <1 year, the recommended soil only estimate is 30 mg/day and the dust only estimate is 40 mg/day.
For risk assessment involving children 1 to <2 and 2 to <6 years of age, the recommended central tendency soil + dust ingestion rates are 90 mg/day and 60 mg/day, respectively. For soil only, the recommended central tendency values are 40 mg/day for 1- to <2-year-olds and 30 mg/day for
Update for Chapter 5 of the Exposure Factors Handbook
Chapter 5—Soil and Dust Ingestion
September 2017 Page 5-5
2- to <6-year-olds, respectively. For dust only, the recommended central tendency values are 50 mg/day and 30 mg/day for the two age groups, respectively.
When assessing risks for children 1 to <6 years of age who are not expected to exhibit soil pica or geophagy behavior, the recommended central tendency soil + dust ingestion estimate is 80 mg/day. If an estimate for soil only or indoor dust only is needed, the recommendation is 40 mg/day.
For children 6 to <12 years old without pica, the recommended central tendency soil + dust ingestion rate is 60 mg/day. For either soil or dust alone, the estimate is 30 mg/day. For children 12 to <20 years and adults, the recommended central tendency values for use in risk assessment is 30 mg/day, rounded to one significant figure. This recommendation is based on data for adults from Davis and Mirick (2006) and data from Wilson et al. (2013) that indicated that central tendency soil + dust ingestion rates ages 12 to <20 years and adults are similar. For soil only, the recommended value is 10 mg/day, and for dust only, the recommended value is 20 mg/day.
The upper percentile recommendations for soil + dust ingestion among the general population, are based on the 95th percentile values obtained from key studies as shown in Table 5-1, rounded to one significant figure. The recommended values: are 100 mg/day for infants 0 to <6 months (50 mg/day soil and 60 mg/day dust), and 200 mg/day for children 6 months to <1 year, 1 to <2 years, 2 to <6 years, 1 to <6 years, and 6 to <12 years (90 mg/day soil and 100 mg/day dust). For ages 12 years through adults, the recommended upper percentile value is 100 mg/day (50 mg/day soil and 60 mg/day dust).
5.2.2. Soil Pica and Geophagy Ingestion rates for “soil pica,” and for individuals
who exhibit “geophagy” are also provided in Table 5-1. The soil-pica and geophagy recommendations are likely to represent an acute high soil ingestion episode or behavior. The soil pica ingestion estimate in the literature for children up to age 6 years ranges from 1,000 to 6,000 mg/day, averaged over the study period (ATSDR, 2001; Barnes, 1990; Calabrese et al., 1989, 1991, 1997b; Stanek et al., 1998). Due to the short-term nature of these studies and the limited amount of data available for children exhibiting pica behavior, the lower end of this range of 1,000 mg/day is recommended for soil pica for children 1 to <6 years old. However, it is important to note that soil ingestion for these children exhibiting soil pica behavior has been reported as high as 20 to
25 g/day on any given day (Calabrese et al., 1997b). Note too that the recommended soil pica value may be more appropriate for acute exposures. Currently, no data are available for soil pica behavior for children less than 12 months or in children ages 6 to <21 years. Because pica behavior may occur among some children ages ~1 to 21 years old (Hyman et al., 1990), it is prudent to assume that, for some children, soil pica behavior may occur at any age up to 21 years. While pica may also occur among adults, no key studies were available for developing recommended intake rates for adults who exhibit pica.
The recommended geophagy soil estimate is 50,000 mg/day (50 grams) for both adults and children (Vermeer and Frate, 1979). It is important to note that this value may be more representative of acute exposures. Risk assessors should use this value for soil ingestion in for individuals or populations known to exhibit geophagy behaviors.
5.2.3. Wilderness or Traditional Rural Lifestyles Information on soil ingestion among special
populations, such as those engaging in wilderness lifestyles in Canada, are presented as relevant studies in Sections 5.3.4 (Doyle et al., 2012; Irvine et al., 2014). Data from these studies may be appropriate for high soil contact scenarios. For rural populations following traditional rural or wilderness lifestyles as described in these studies, adult soil ingestion rates may be somewhat higher than those of the general population. Based on these two studies the adult mean soil + dust ingestion rate is 50 mg/day and the upper percentile soil + dust ingestion rate is 200 mg/day. Based on personal communication with the authors of these two studies, the 95th percentile of the combined data sets was calculated to be 239 mg/day for aluminum and silicon (for all four tracers the value would be 243 mg/day) (personal communication between M. Stifelman, EPA, and J. Doyle, University of Ottawa, Canada). Rounding to one significant figure, the upper percentile value would also be 200 mg/day. Assuming that soil represents 45% and dust represents 55% of the soil + dust value, the mean and upper percentile soil only values would be 20 mg/day and 90 mg/day, respectively. The mean and upper percentile dust only values would be 30 mg/day and 100 mg/day, respectively.
5.2.4. Confidence Ratings Section 5.4 gives a detailed explanation of the
limitations of the various study methodologies, which are reflected in the confidence ratings for the recommendations shown in Table 5-2. Individual
Update for Chapter 5 of the Exposure Factors Handbook
Chapter 5—Soil and Dust Ingestion
September 2017 Page 5-6
evaluations of the quality of studies are provided in the specific discussions for each of the individual studies. The confidence ratings are low due to the relatively limited data on which the recommendations are based and the limitations and uncertainties associated with tracer studies described in Section 5.4.1, and the assumptions needed to develop quantitative estimates using the biokinetic modeling (see Section 5.4.2) and activity pattern modeling approaches (see Section 5.4.3). Other uncertainties pertain to the representativeness of the
populations studied. A more detailed discussion about the general assessment factors used to evaluate the confidence in the recommendations is provided in Chapter 1 of the Handbook. For the estimates of soil only and dust only, an additional uncertainty pertains to the assumption that the proportion of soil + dust represented by soil only (45%) and dust only (55%) is the same for all age groups.
Update for Chapter 5 of the Exposure Factors Handbook
Chapter 5—Soil and Dust Ingestion
September 2017 Page 5-7
Table 5-1. Recommended Values for Daily Soil, Dust, and Soil + Dust Ingestion (mg/day)a
Age Group
Soil + Dust Soilb Dustc
General Population
Central Tendencyd
General Population
Upper Percentilee
General Population
Central Tendencyf
General Population
Upper Percentilef
Soil Picag Geophagyh
General Population
Central Tendencyf
General Population
Upper Percentilef
<6 months 40 100 20 50 ― ― 20 60
6 months to <1 year
70 (60–80) 200 30 90 ― ― 40 100
1 to <2 years 90 200 40 90 1,000 50,000 50 100
2 to <6 years 60 200 30 90 1,000 50,000 30 100
1 to <6 years 80 (60–100) 200 40 90 1,000 50,000 40 100
6 to <12 years 60 (60–60)i 200 30 90 1,000 50,000 30 100
12 years through adult
30 (4–50)j 100j 10 50 ― 50,000 20 60
a Ranges are provided in parentheses, when applicable, and represent the range of means from the various studies. Ranges are not provided for age groups for which the recommendations are based on a single study.
b Includes soil and outdoor settled dust. c Includes indoor settled dust only. d Based on the average of the central tendency values from the various studies for each of the three methodologies (tracer,
biokinetic modeling, activity pattern), averaged over the three methods. Recommendation for <6 months of age based on Wilson et al. (2013) (note that data for 0 to <7 months in Wilson et al. [2013] were used to represent the 0 to <6 months age group). Recommendations for children 6 months to <1 year based on the average of values from Hogan et al. (1998) and von Lindern et al. (2016). Recommendations for 1- to 2 year-olds and 2- to <6-year-olds based on von Lindern et al. (2016). Recommendations for children ages 1 to <6 years based on the average of values from Calabrese et al. (1989) as reanalyzed in Stanek and Calabrese 1995a (mean of the median values for the best 4 tracers for each child); Calabrese et al. (1997a) (average of the best tracer for each child); Calabrese et al. (1997b) (average of aluminum and silicon); Davis et al. (1990) as reanalyzed by Stanek and Calabrese, 1995a (mean of the median values for 3 tracers for each child); Hogan et al. (1998); Özkaynak et al. (2011); von Lindern et al. (2016); and Wilson et al. (2013). The recommendations for ages 12 years to adults are based on the average of data for teens (ages 12 to <20 years), adults, and seniors from Wilson et al. (2013) and on adults from Davis and Mirick (2006). All recommended values were rounded to one significant figure. See Table 5-34 for additional details.
e Based on the average of the 95th percentile values from the various studies for each of the three methodologies (tracer, biokinetic modeling, activity pattern), averaged over the three methods. Based on the 95th percentile values for the same studies as used for the central tendency estimates except for age 12 years through adults. Upper percentile recommendation for 12 years of age through adults based on the assumption that the ratio of the 95th percentile to the mean value for adults is the same as the average of the ratios of 95th percentiles to means for all other age groups (i.e., average ratio of the 95th percentile to mean recommendations = 3.2). See Table 5-34 for additional details.
f Estimates of soil and dust were derived from the soil + dust values assuming 45% soil and 55% dust, rounded to one significant figure.
g Professional judgement based on: ATSDR (2001); Barnes (1990); Calabrese et al. (1997b, 1991, 1989); Stanek et al. (1998).
h Vermeer and Frate (1979). i Range based on two studies with estimates of 55 and 56 mg/day; both of these estimates round to 60 mg/day.j Soil + dust ingestion rates may be higher for adults following a traditional rural or wilderness lifestyle. Based on Doyle
et al. (2012) and Irvine et al. (2014) the central tendency adult soil + dust ingestion rates is 50 mg/day (20 mg/day soil and 30 mg/day dust) and the upper percentile rate is 200 mg/day (90 mg/day soil and 100 mg/day dust).
― = No data.
Update for Chapter 5 of the Exposure Factors Handbook
Chapter 5—Soil and Dust Ingestion
September 2017 Page 5-8
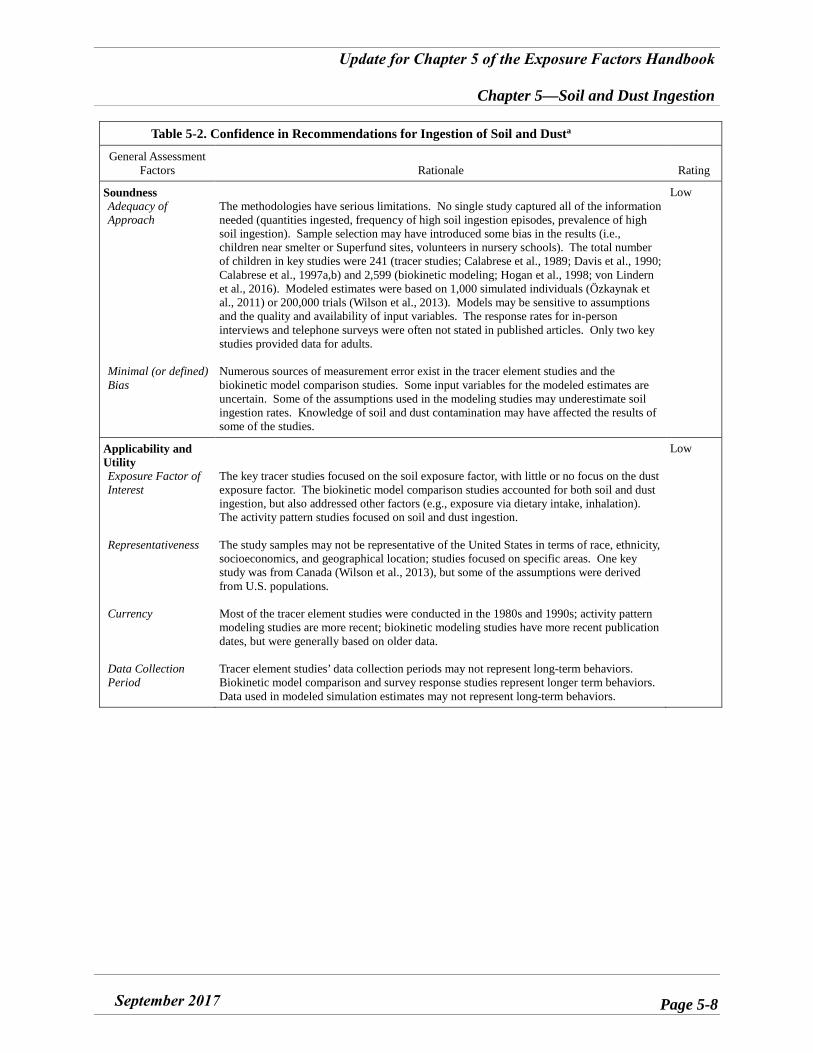
Table 5-2. Confidence in Recommendations for Ingestion of Soil and Dusta
General Assessment Factors Rationale Rating
Soundness Adequacy of Approach
Minimal (or defined) Bias
The methodologies have serious limitations. No single study captured all of the information needed (quantities ingested, frequency of high soil ingestion episodes, prevalence of high soil ingestion). Sample selection may have introduced some bias in the results (i.e., children near smelter or Superfund sites, volunteers in nursery schools). The total number of children in key studies were 241 (tracer studies; Calabrese et al., 1989; Davis et al., 1990; Calabrese et al., 1997a,b) and 2,599 (biokinetic modeling; Hogan et al., 1998; von Lindern et al., 2016). Modeled estimates were based on 1,000 simulated individuals (Özkaynak et al., 2011) or 200,000 trials (Wilson et al., 2013). Models may be sensitive to assumptions and the quality and availability of input variables. The response rates for in-person interviews and telephone surveys were often not stated in published articles. Only two key studies provided data for adults.
Numerous sources of measurement error exist in the tracer element studies and the biokinetic model comparison studies. Some input variables for the modeled estimates are uncertain. Some of the assumptions used in the modeling studies may underestimate soil ingestion rates. Knowledge of soil and dust contamination may have affected the results of some of the studies.
Low
Applicability and Utility Exposure Factor of Interest
Representativeness
Currency
Data Collection Period
The key tracer studies focused on the soil exposure factor, with little or no focus on the dust exposure factor. The biokinetic model comparison studies accounted for both soil and dust ingestion, but also addressed other factors (e.g., exposure via dietary intake, inhalation). The activity pattern studies focused on soil and dust ingestion.
The study samples may not be representative of the United States in terms of race, ethnicity, socioeconomics, and geographical location; studies focused on specific areas. One key study was from Canada (Wilson et al., 2013), but some of the assumptions were derived from U.S. populations.
Most of the tracer element studies were conducted in the 1980s and 1990s; activity pattern modeling studies are more recent; biokinetic modeling studies have more recent publication dates, but were generally based on older data.
Tracer element studies’ data collection periods may not represent long-term behaviors. Biokinetic model comparison and survey response studies represent longer term behaviors. Data used in modeled simulation estimates may not represent long-term behaviors.
Low
Update for Chapter 5 of the Exposure Factors Handbook
Chapter 5—Soil and Dust Ingestion
September 2017 Page 5-9
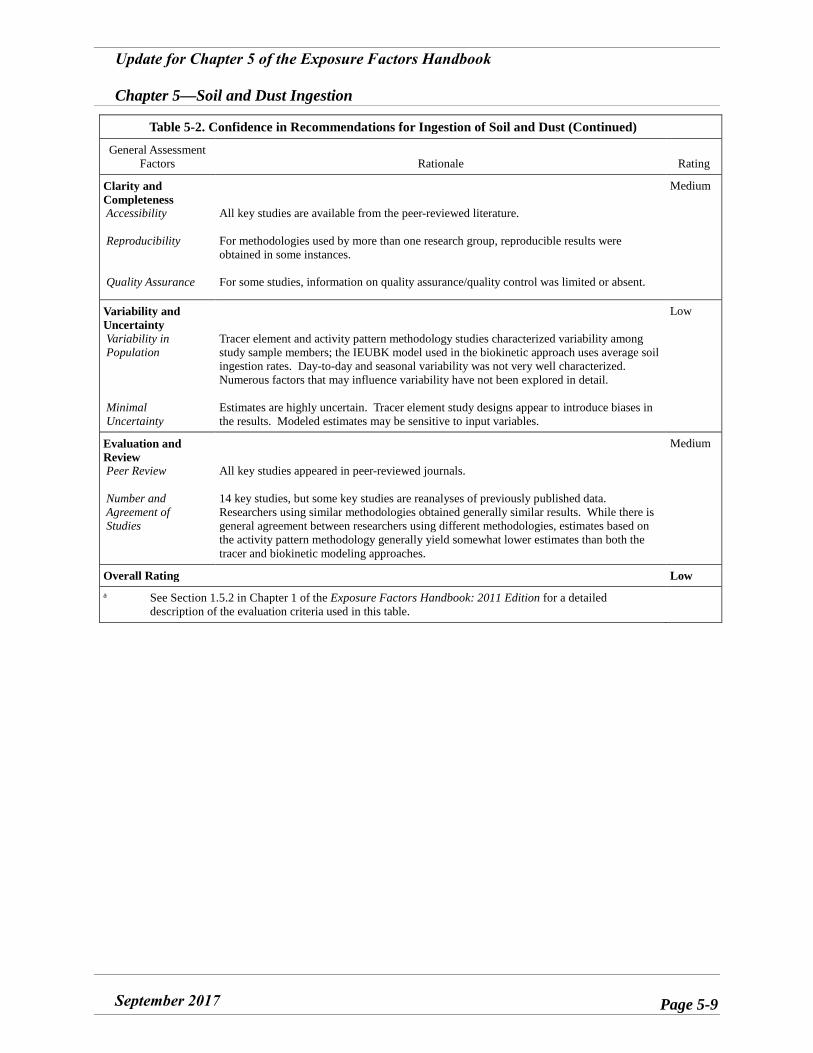
Table 5-2. Confidence in Recommendations for Ingestion of Soil and Dust (Continued)
General Assessment Factors Rationale Rating
Clarity and Completeness Accessibility
Reproducibility
Quality Assurance
All key studies are available from the peer-reviewed literature.
For methodologies used by more than one research group, reproducible results were obtained in some instances.
For some studies, information on quality assurance/quality control was limited or absent.
Medium
Variability and Uncertainty Variability in Population
Minimal Uncertainty
Tracer element and activity pattern methodology studies characterized variability among study sample members; the IEUBK model used in the biokinetic approach uses average soil ingestion rates. Day-to-day and seasonal variability was not very well characterized. Numerous factors that may influence variability have not been explored in detail.
Estimates are highly uncertain. Tracer element study designs appear to introduce biases in the results. Modeled estimates may be sensitive to input variables.
Low
Evaluation and Review Peer Review
Number and Agreement of Studies
All key studies appeared in peer-reviewed journals.
14 key studies, but some key studies are reanalyses of previously published data. Researchers using similar methodologies obtained generally similar results. While there is general agreement between researchers using different methodologies, estimates based on the activity pattern methodology generally yield somewhat lower estimates than both the tracer and biokinetic modeling approaches.
Medium
Overall Rating Low a See Section 1.5.2 in Chapter 1 of the Exposure Factors Handbook: 2011 Edition for a detailed
description of the evaluation criteria used in this table.
Update for Chapter 5 of the Exposure Factors Handbook
Chapter 5—Soil and Dust Ingestion
September 2017 Page 5-10
5.3. KEY AND RELEVANT STUDIES The key tracer element, biokinetic model
comparison, and survey response studies are summarized in the following sections. Certain studies were considered “key” and were used as a basis for developing the recommendations, using judgment about the study’s design features, applicability, and utility of the data to U.S. soil and dust ingestion rates, clarity and completeness, and characterization of uncertainty and variability in ingestion estimates. Because the studies often were performed for reasons unrelated to developing long-term soil and dust ingestion recommendations, their attributes that were characterized as “limitations” in this chapter might not be limitations when viewed in the context of the study’s original purpose. However, when studies are used for developing a soil or dust ingestion recommendation, EPA has categorized some studies’ design or implementation as preferable to others. In general, EPA chose studies designed either with a census or randomized sample approach over studies that used a convenience sample, or other nonrandomized approach, as well as studies that more clearly explained various factors in the study’s implementation that affect interpretation of the results. However, in some cases, studies that used a nonrandomized design contain information that is useful for developing exposure factor recommendations (e.g., if they are the only studies of children in a particular age category), and thus may have been designated as “key” studies. Other studies were considered “relevant” but not “key” because they provide useful information for evaluating the reasonableness of the data in the key studies or provide supporting information, but in EPA’s judgment they did not meet the same level of soundness, applicability and utility, clarity and completeness, and characterization of uncertainty and variability that the key studies did or they may not be representative of the U.S. general population. In addition, studies that did not contain information that can be used to develop a specific recommendation for mg/day soil and dust ingestion were classified as relevant rather than key. However, some studies classified as “relevant” may be used as the basis for recommendations for particular exposure settings (e.g., Doyle et al., 2012, Irvine et al., 2014 for populations engaging in rural or wilderness lifestyles).
Some studies are reanalyses of previously published data. For this reason, the sections that follow are organized into key and relevant studies of primary analysis (i.e., studies in which researchers
have developed primary data pertaining to soil and dust ingestion) and key and relevant studies of secondary analysis (i.e., studies in which researchers have interpreted previously published results, or data that were originally collected for a different purpose).
The three methodologies described in this chapter to derive soil and dust ingestion rates have limitations. Because some of these limitations apply equally to all the studies within each methodology, they are discussed in more detail in Section 5.4 separately from the study summaries. Additional limitations specific to each study are described within each study summary. The discussion of limitations does not imply that the studies were conducted inappropriately, rather they are limitations inherent in these methodologies.
5.3.1. Methodologies Used in Key Studies
5.3.1.1. Tracer Element Methodology The tracer element methodology attempts to
quantify the amounts of soil ingested by analyzing samples of soil and dust from residences and/or children’s play areas, and feces or urine. The soil, dust, fecal, and urine samples are analyzed for the presence and quantity of tracer elements―typically, aluminum, silicon, titanium, and other elements. A key underlying assumption is that these elements are not metabolized into other substances in the body or absorbed from the gastrointestinal tract in significant quantities, and thus their presence in feces and urine can be used to estimate the quantity of soil ingested by mouth. Although they are sometimes called mass balance studies, none of the studies attempt to quantify amounts excreted in perspiration, tears, glandular secretions, or shed skin, hair, or finger- and toenails, nor do they account for tracer element exposure via the dermal or inhalation routes, and thus they are not a complete “mass balance” methodology. Early studies using this methodology did not always account for the contribution of tracer elements from nonsoil substances (food, medications, and nonfood sources such as toothpaste) that might be swallowed. U.S. studies using this methodology in or after the mid to late 1980s account for, or attempt to account for, tracer element contributions from these nonsoil sources. Some study authors adjust their soil ingestion estimate results to account for the potential contribution of tracer elements found in household dust as well as soil.
Empirical estimates of soil ingestion rates in children have been made by back-calculating the
Update for Chapter 5 of the Exposure Factors Handbook
Chapter 5—Soil and Dust Ingestion
September 2017 Page 5-11
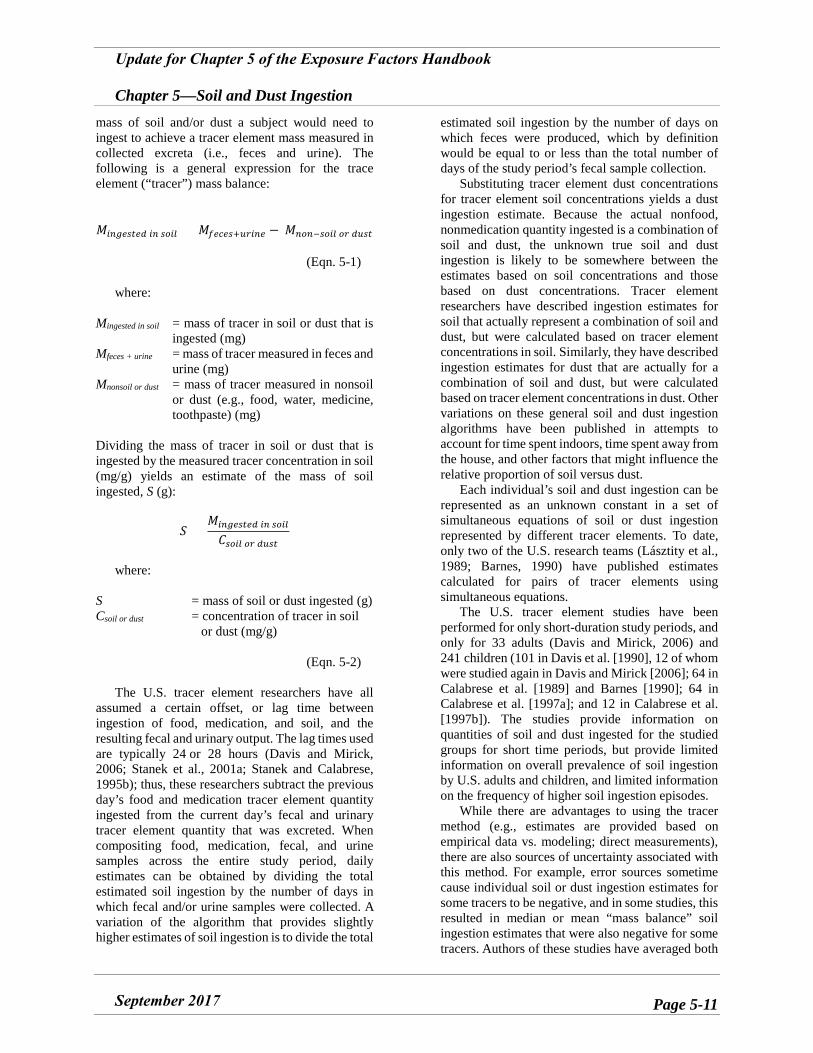
mass of soil and/or dust a subject would need to ingest to achieve a tracer element mass measured in collected excreta (i.e., feces and urine). The following is a general expression for the trace element (“tracer”) mass balance:
𝑀𝑀𝑖𝑖𝑖𝑖𝑖𝑖𝑖𝑖𝑖𝑖𝑖𝑖𝑖𝑖𝑖𝑖 𝑖𝑖𝑖𝑖 𝑖𝑖𝑠𝑠𝑖𝑖𝑠𝑠 = 𝑀𝑀𝑓𝑓𝑖𝑖𝑓𝑓𝑖𝑖𝑖𝑖+𝑢𝑢𝑢𝑢𝑖𝑖𝑖𝑖𝑖𝑖 − 𝑀𝑀𝑖𝑖𝑠𝑠𝑖𝑖−𝑖𝑖𝑠𝑠𝑖𝑖𝑠𝑠 𝑠𝑠𝑢𝑢 𝑖𝑖𝑢𝑢𝑖𝑖𝑖𝑖
(Eqn. 5-1)
where:
Mingested in soil = mass of tracer in soil or dust that is ingested (mg)
Mfeces + urine = mass of tracer measured in feces and urine (mg)
Mnonsoil or dust = mass of tracer measured in nonsoil or dust (e.g., food, water, medicine, toothpaste) (mg)
Dividing the mass of tracer in soil or dust that is ingested by the measured tracer concentration in soil (mg/g) yields an estimate of the mass of soil ingested, S (g):
𝑆𝑆 = 𝑀𝑀𝑖𝑖𝑖𝑖𝑖𝑖𝑖𝑖𝑖𝑖𝑖𝑖𝑖𝑖𝑖𝑖 𝑖𝑖𝑖𝑖 𝑖𝑖𝑠𝑠𝑖𝑖𝑠𝑠
𝐶𝐶𝑖𝑖𝑠𝑠𝑖𝑖𝑠𝑠 𝑠𝑠𝑢𝑢 𝑖𝑖𝑢𝑢𝑖𝑖𝑖𝑖
where:
S = mass of soil or dust ingested (g) Csoil or dust = concentration of tracer in soil
or dust (mg/g)
(Eqn. 5-2)
The U.S. tracer element researchers have all assumed a certain offset, or lag time between ingestion of food, medication, and soil, and the resulting fecal and urinary output. The lag times used are typically 24 or 28 hours (Davis and Mirick, 2006; Stanek et al., 2001a; Stanek and Calabrese, 1995b); thus, these researchers subtract the previous day’s food and medication tracer element quantity ingested from the current day’s fecal and urinary tracer element quantity that was excreted. When compositing food, medication, fecal, and urine samples across the entire study period, daily estimates can be obtained by dividing the total estimated soil ingestion by the number of days in which fecal and/or urine samples were collected. A variation of the algorithm that provides slightly higher estimates of soil ingestion is to divide the total
estimated soil ingestion by the number of days on which feces were produced, which by definition would be equal to or less than the total number of days of the study period’s fecal sample collection.
Substituting tracer element dust concentrations for tracer element soil concentrations yields a dust ingestion estimate. Because the actual nonfood, nonmedication quantity ingested is a combination of soil and dust, the unknown true soil and dust ingestion is likely to be somewhere between the estimates based on soil concentrations and those based on dust concentrations. Tracer element researchers have described ingestion estimates for soil that actually represent a combination of soil and dust, but were calculated based on tracer element concentrations in soil. Similarly, they have described ingestion estimates for dust that are actually for a combination of soil and dust, but were calculated based on tracer element concentrations in dust. Other variations on these general soil and dust ingestion algorithms have been published in attempts to account for time spent indoors, time spent away from the house, and other factors that might influence the relative proportion of soil versus dust.
Each individual’s soil and dust ingestion can be represented as an unknown constant in a set of simultaneous equations of soil or dust ingestion represented by different tracer elements. To date, only two of the U.S. research teams (Lásztity et al., 1989; Barnes, 1990) have published estimates calculated for pairs of tracer elements using simultaneous equations.
The U.S. tracer element studies have been performed for only short-duration study periods, and only for 33 adults (Davis and Mirick, 2006) and 241 children (101 in Davis et al. [1990], 12 of whom were studied again in Davis and Mirick [2006]; 64 in Calabrese et al. [1989] and Barnes [1990]; 64 in Calabrese et al. [1997a]; and 12 in Calabrese et al. [1997b]). The studies provide information on quantities of soil and dust ingested for the studied groups for short time periods, but provide limited information on overall prevalence of soil ingestion by U.S. adults and children, and limited information on the frequency of higher soil ingestion episodes.
While there are advantages to using the tracer method (e.g., estimates are provided based on empirical data vs. modeling; direct measurements), there are also sources of uncertainty associated with this method. For example, error sources sometime cause individual soil or dust ingestion estimates for some tracers to be negative, and in some studies, this resulted in median or mean “mass balance” soil ingestion estimates that were also negative for some tracers. Authors of these studies have averaged both
Update for Chapter 5 of the Exposure Factors Handbook
Chapter 5—Soil and Dust Ingestion
September 2017 Page 5-12
negative and positive numbers together in their estimation of soil ingestion rates. For soil and dust ingestion estimates based on each particular tracer, or averaged across tracers, the net impact of competing upward and downward sources of error is unclear. Other sources of error can influence the estimates in an upward direction (e.g., not accounting for all nonsoil/dust sources of the tracer elements). A more detailed discussion of the uncertainties and limitations associated with the tracer method is provided in Section 5.4.1.
5.3.1.2. Biokinetic Model Comparison Methodology
The Biokinetic Model Comparison methodology compares direct measurements of a biomarker, such as blood or urine levels of a toxicant, with predictions from a biokinetic model of oral, dermal, and inhalation exposure routes with air, food, water, soil, and dust toxicant sources. An example is to compare measured children’s blood lead levels with predictions from the IEUBK model. Where environmental contamination of lead in soil, dust, and drinking water has been measured and those measurements can be used as model inputs for the children in a specific community, the model’s assumed soil and dust ingestion values can be evaluated by comparing the model’s predictions of blood lead levels with those children’s measured blood lead levels. It should be noted, however, that such confirmation of the predicted blood lead levels would be confirmation of the net impact of all model inputs, and not just soil and dust ingestions. Under the assumption that (actual) blood lead levels of various groups of children studied were accurately measured, and those measured blood lead levels are consistent with biokinetic model predictions for those groups of children, then the model’s default assumptions may correspond to the central tendency, or typical, children in an assessed group of children. Nevertheless, the model’s default assumptions for biokinetics and intake rates can be useful for predicting outcomes for highly exposed children if the higher exposure occurs as increased concentrations in the relevant media, and if the default population variability is relevant for the group of children under consideration. Use of the IEUBK in this way assumes that blood lead can be used as a suitable biomarker for soil and dust ingestion. An advantage of this method is that it can be used to indirectly estimate long-term soil and dust intake. A detailed discussion on the limitations and uncertainties associated with this method is provided in Section 5.4.2.
5.3.1.3. Activity Pattern Methodology The activity pattern methodology combines
information on hand-to-mouth and object-to-mouth activities (microactivities) and time spent at various locations (microenvironments) with assumptions about transfer parameters (e.g., soil-to-skin adherence, saliva removal efficiency) and other exposure factors (e.g., frequency of hand washing) to derive estimates of soil and dust ingestion. This methodology has been used in U.S. EPA’s stochastic human exposure and dose simulation (SHEDS) model. The SHEDS model is a probabilistic model that can simulate cumulative (multiple chemicals) or aggregate (single chemical) residential exposures for a population of interest over time via multiple routes of exposure for different types of chemicals and scenarios, including those involving soil ingestion (U.S. EPA, 2010).
The activity pattern methodology includes observational studies as well as surveys of adults, children’s caretakers, or children themselves, via in-person or mailed questionnaires that ask about mouthing behavior and ingestion of various nonfood items and time spent in various microenvironments. There are three general approaches to gather data on children’s mouthing behavior: real-time hand recording, in which trained observers manually record information (Davis et al., 1995); video-transcription, in which trained videographers tape a child’s activities and subsequently extract the pertinent data manually or with computer software (Black et al., 2005); and questionnaire, or survey response, techniques (Stanek et al., 1998).
An advantage of this method is that it does not require collection of biologic samples. Also, soil and dust ingestion can be estimated separately. One of the limitations of this approach includes the availability and quality of the input variables. Özkaynak et al. (2011) found that the model is most sensitive to dust loadings on carpets and hard floor surfaces, soil-to-skin adherence factors, hand mouthing frequency, and hand washing frequency (Özkaynak et al., 2011). A detailed discussion of the limitations and uncertainties associated with this method is provided in Section 5.4.3.
5.3.2. Key Studies of Primary Analysis The sections that follow provide summaries of
key studies in which researchers have developed primary data pertaining to soil and dust ingestion.
Update for Chapter 5 of the Exposure Factors Handbook
Chapter 5—Soil and Dust Ingestion
September 2017 Page 5-13
5.3.2.1. Vermeer and Frate (1979)—Geophagia in Rural Mississippi: Environmental and Cultural Contexts and Nutritional Implications
Vermeer and Frate (1979) performed a survey response study in Holmes County, MS in the 1970s (date unspecified). Questions about geophagy (defined as regular consumption of clay over a period of weeks) were asked of household members (N = 229 in 50 households; 56 were women, 33 were men, and 140 were children or adolescents) of a subset of a random sample of nutrition survey respondents. Caregiver responses to questions about 115 children under 13 years old indicate that geophagy was likely to be practiced by a minimum of 18 (16%) of these children; however, 16 of these 18 children were 1 to 4 years old, and only 2 of the 18 were older than 4 years. Of the 56 women, 32 (57%) reported eating clay. There was no reported geophagy among 33 men or 25 adolescent study subjects questioned.
In a separately administered survey, geophagy and pica data were obtained from 142 pregnant women over a period of 10 months. Geophagy was reported by 40 of these women (28%), and an additional 27 respondents (19%) reported other pica behavior, including the consumption of laundry starch, dry powdered milk, and baking soda.
The average daily amount of clay consumed was reported to be about 50 grams, for the adult and child respondents who acknowledged practicing geophagy. Quantities were usually described as either portions or multiples of the amount that could be held in a single, cupped hand. Clays for consumption were generally obtained from the B soil horizon, or subsoil rather than an uppermost layer, at a depth of 50 to 130 cm.
5.3.2.2. Calabrese et al. (1989)—How Much Soil Do Young Children Ingest: An Epidemiologic Study/Barnes (1990)―Childhood Soil Ingestion: How Much Dirt Do Kids Eat?/Calabrese et al. (1991)—Evidence of Soil Pica Behavior and Quantification of Soil Ingested
Calabrese et al. (1989) and Barnes (1990) studied soil ingestion among children using eight tracer elements―aluminum, barium, manganese, silicon, titanium, vanadium, yttrium, and zirconium. A nonrandom sample of 1-, 2-, and 3-year-olds (30 males and 34 females) from the greater Amherst, MA area was studied, presumably in 1987. The children were predominantly from two-parent households where the parents were highly educated.
The study was conducted over a period of 8 days spread over 2 weeks. During each week, duplicate samples of food, beverages, medicines, and vitamins were collected on Monday through Wednesday, while excreta, excluding wipes and toilet paper, were collected for four 24-hour cycles running from Monday/Tuesday through Thursday/Friday. Soil and dust samples were also collected from the children’s homes and play areas. Study participants were supplied with toothpaste, baby cornstarch, diaper rash cream, and soap with low levels of most of the tracer elements. Quality control of the analysis yielded recoveries between 88.1% and 100.2% for all tracers except zirconium, which had a low recovery.
Table 5-3 shows the published mean soil ingestion estimates ranging from −294 mg/day based on manganese to 459 mg/day based on vanadium, median soil ingestion estimates ranging from −261 mg/day based on manganese to 96 mg/day based on vanadium, and 95th percentile estimates ranged from 106 mg/day based on yttrium to 1,903 mg/day based on vanadium. Maximum daily soil ingestion estimates ranged from 1,391 mg/day based on zirconium to 7,281 mg/day based on manganese. Dust ingestion estimates calculated using tracer concentrations in dust were often, but not always, higher than soil ingestions calculated using tracer concentrations in soil.
Data for the uppermost 23 subject-weeks (the highest soil ingestion estimates, averaged over the 4 days of excreta collection during each of the 2 weeks) were published in Calabrese et al. (1991). One child’s soil pica behavior was estimated in Barnes (1990) using both the subtraction/division algorithm and the simultaneous equations method. On two particular days during the second week of the study period, the child’s aluminum-based soil ingestion estimates were 19 g/day (18,700 mg/day) and 36 g/day (35,600 mg/day), silicon-based soil ingestion estimates were 20 g/day (20,000 mg/day) and 24 g/day (24,000 mg/day), and simultaneous-equation soil ingestion estimates were 20 g/day (20,100 mg/day) and 23 g/day (23,100 mg/day) (Barnes, 1990). By tracer, averaged across the entire week, this child’s estimates ranged from approximately 10 to 14 g/day during the second week of observation, excluding zirconium, which presented limitations with the analytical protocol (Calabrese et al., 1991, see Table 5-4), and averaged 6 g/day across the entire study period. Additional information about this child’s apparent ingestion of soil versus dust during the study period was published in Calabrese and Stanek (1992a).
Update for Chapter 5 of the Exposure Factors Handbook
Chapter 5—Soil and Dust Ingestion
September 2017 Page 5-14
5.3.2.3. Davis et al. (1990)—Quantitative Estimates of Soil Ingestion in Normal Children between the Ages of 2 and 7 Years: Population-Based Estimates Using Aluminum, Silicon, and Titanium as Soil Tracer Elements
Davis et al. (1990) used a tracer element technique to estimate soil ingestion among children. In this study, 104 children between the ages of 2 and 7 years were randomly selected from a three-city area in southeastern Washington State. Soil and dust ingestion was evaluated by analyzing soil and house dust, feces, urine, and duplicate food, dietary supplement, medication, and mouthwash samples for aluminum, silicon, and titanium. Data were collected for 101 of the 104 children during July, August, or September 1987. In each family, data were collected over a 7-day period, with 4 days of excreta sample collection. Dried soil samples were passed successively through a 20- and 60-mesh (850 and 250 µm, respectively; ASTM, 2017) stainless steel sieve. Participants were supplied with toothpaste with known tracer element content. In addition, information on dietary habits and demographics was collected to identify behavioral and demographic characteristics that influence soil ingestion rates among children. The amount of soil ingested on a daily basis was estimated using Equation 5-3:
S =ei,soilE
fdEfdDWuEfEpDWfDW )()2))((( ×−+×+
(Eqn. 5-3) where:
Si,e = soil ingested for child i based on tracer e (grams)
DWf = feces dry weight (grams) DWp = feces dry weight on toilet
paper (grams) Ef = tracer concentration in feces (µg/g) Eu = tracer amount in urine (µg) DWfd = food dry weight (grams) Efd = tracer concentration in food (µg/g) Esoil = tracer concentration in soil (µg/g)
The tracer amount in urine (Eu) was multiplied by a factor of 2 to account for the fact that parents were asked to collect half of the total daily urine output. The soil ingestion rates were corrected by adding the amount of tracer in vitamins and
medications to the amount of tracer in food and adjusting the food, fecal, and urine sample weights to account for missing samples. Food, fecal, and urine samples were composited over a 4-day period, and estimates for daily soil ingestion were obtained by dividing the 4-day composited tracer quantities by 4. Davis et al. (1990) reported that recoveries for most analyses were within the quality control limits, ±20% for laboratory samples and ±25% for the matrix spiked samples.
Soil ingestion rates were highly variable, especially those based on titanium. Mean daily soil ingestion estimates were 38.9 mg/day for aluminum, 82.4 mg/day for silicon, and 245.5 mg/day for titanium (see Table 5-5). Median values were 25.3 mg/day for aluminum, 59.4 mg/day for silicon, and 81.3 mg/day for titanium. The investigators also evaluated the extent to which differences in tracer concentrations in house dust and yard soil impacted estimated soil ingestion rates. The value used in the denominator of the soil ingestion estimate equation was recalculated to represent a weighted average of the tracer concentration in yard soil and house dust based on the proportion of time the child spent indoors and outdoors, using an assumption that the likelihood of ingesting soil outdoors was the same as that of ingesting dust indoors. The adjusted mean soil/dust ingestion rates were 64.5 mg/day for aluminum, 160.0 mg/day for silicon, and 268.4 mg/day for titanium. Adjusted median soil/dust ingestion rates were 51.8 mg/day for aluminum, 112.4 mg/day for silicon, and 116.6 mg/day for titanium. The authors also investigated whether nine behavioral and demographic factors could be used to predict soil ingestion. They found family income less than $15,000/year and swallowing toothpaste to be predictors with silicon-based estimates, residing in one of the three cities to be a significant predictor with aluminum-based estimates, and washing the face before eating significant for titanium-based estimates.
5.3.2.4. Calabrese et al. (1997a)—Soil Ingestion Estimates for Children Residing on a Superfund Site
Calabrese et al. (1997a) estimated soil ingestion rates for children residing on a Superfund site using a methodology in which eight tracer elements were analyzed. The methodology used in this study is similar to that employed in Calabrese et al. (1989), except that rather than using barium, manganese, and vanadium as three of the eight tracers, the researchers replaced them with cerium, lanthanum,
Update for Chapter 5 of the Exposure Factors Handbook
Chapter 5—Soil and Dust Ingestion
September 2017 Page 5-15
and neodymium. A total of 64 children ages 1 to 4 years (36 males, 28 females) were selected for this study of the Anaconda, MT area. The study was conducted for seven consecutive days during September or September and October, apparently in 1992, shortly after soil was removed and replaced in some residential yards in the area. Duplicate samples of meals, beverages, and over-the-counter medicines and vitamins were collected over the 7-day period, along with fecal samples. In addition, soil and dust samples were collected from the children’s home and play areas. Soil samples were sieved through a 2-mm nylon mesh. A subsample was ground and sieved using a 200-mesh (75 µm; ASTM, 2017) screen. Dust samples were sieved to separate fine dust from larger pieces. Toothpaste containing nondetectable levels of the tracer elements, with the exception of silica, was provided to all of the children. Infants were provided with baby cornstarch, diaper rash cream, and soap, which were found to contain low levels of tracer elements.
Because of the high degree of intertracer variability, Calabrese et al. (1997a) also derived estimates based on the “best tracer methodology” (BTM). This BTM uses food:soil (F:S) tracer concentration ratios in order to correct for errors caused by misalignment of tracer input and outputs, ingestion of nonfood sources, and nonsoil sources (Stanek and Calabrese, 1995a). A low F:S ratio is desired because it minimizes transit time errors. The BTM did not use the results from cerium, lanthanum, and neodymium despite these tracers having low F:S ratios because the soil concentrations for these elements were found to be affected by particle size and more susceptible to source errors. Calabrese et al. (1997a) noted that estimates based on aluminum, silicon, and yttrium in this study may result in lower soil ingestion estimates than the true value because the apparent residual negative errors found for these three tracers for a large majority of subjects. It was noted that soil ingestion estimates for this population may be lower than estimates found by previous studies in the literature because of families’ awareness of contamination from the Superfund site, which may have resulted in altered behavior.
Soil ingestion estimates were also examined based on various demographic characteristics. There were no statistically significant differences in soil ingestion based on age, sex, birth order, or house yard characteristics (Calabrese et al., 1997a). Although not statistically significant, soil ingestion rates were generally higher for females, children with lower birth number, children with parents employed as laborers, service professionals,
homemakers, unemployed, and children with pets (Calabrese et al., 1997a).
Table 5-6 shows the estimated soil and dust ingestion by each tracer element and by the BTM. Based on the best tracer, the mean soil ingestion rate was 65.5 mg/day.
5.3.2.5. Stanek et al. (1998)—Prevalence of Soil Mouthing/Ingestion among Healthy Children Aged One to Six/Calabrese et al. (1997b)—Soil Ingestion Rates in Children Identified by Parental Observation as Likely High Soil Ingesters
Stanek et al. (1998) conducted a survey response study using in-person interviews of parents of children attending well visits at three western Massachusetts medical clinics in August, September, and October of 1992. Of 528 children ages 1 to 7 years with completed interviews, parents reported daily mouthing or ingestion of sand and stones in 6%, daily mouthing or ingestion of soil and dirt in 4%, and daily mouthing or ingestion of dust, lint. and dustballs in 1%. Parents reported more than weekly mouthing or ingestion of sand and stones in 16%, more than weekly mouthing or ingestion of soil and dirt in 10%, and more than weekly mouthing or ingestion of dust, lint and dustballs in 3%. Parents reported more than monthly mouthing or ingestion of sand and stones in 27%, more than monthly mouthing or ingestion of soil and dirt in 18%, and more than monthly mouthing or ingestion of dust, lint, and dustballs in 6%.
Calabrese and colleagues performed a follow-up tracer element study (Calabrese et al., 1997b) for a subset (N = 12) of the Stanek et al. (1998) children (ages 1 to 3) whose caregivers had reported daily sand/soil ingestion (N = 17). The time frame of the follow-up tracer study relative to the original survey response study was not stated; the study duration was 7 days. Of the 12 children in Calabrese et al. (1997b), one exhibited behavior that the authors believed was clearly soil pica; Table 5-7 shows estimated soil ingestion rates for this child during the study period. Estimates ranged from –10 mg/day to 7,253 mg/day depending on the tracer. The mean soil ingestion rate for the pica child, using aluminum and silicon as tracers, is approximately 1,000 mg/day (rounded to one significant figure).
Table 5-8 presents the estimated average daily soil and dust ingestion estimates for the 12 children studied. Estimates calculated based on soil tracer element concentrations only for the 12 subjects ranged from –15 to 1,783 mg/day based on aluminum, −46 to 931 mg/day based on silicon, and
Update for Chapter 5 of the Exposure Factors Handbook
Chapter 5—Soil and Dust Ingestion
September 2017 Page 5-16
–47 to 3,581 mg/day based on titanium. Estimatedaverage daily dust ingestion estimates ranged from −39 to 2,652 mg/day based on aluminum, −51 to 3,145 mg/day based on silicon, and −98 to 3,632 mg/day based on titanium. Quantities for soil and dust are presented separately and assume that the entire quantity of residual fecal tracers originates entirely from soil or dust. Calabrese et al. (1997b) questioned the validity of retrospective caregiver reports of soil pica on the basis of the tracer element results.
5.3.2.6. Davis and Mirick (2006)—Soil Ingestion in Children and Adults in the Same Family
Davis and Mirick (2006) calculated soil ingestion for children and adults in the same family using a tracer element approach. Data were collected one year after the Davis et al. (1990) study was conducted. Samples were collected and prepared for laboratory analysis and then stored for a 2-year period prior to tracer element quantification with laboratory analysis. Analytical recovery values for spiked samples were within the quality control limits of ±25%. The 20 families in this study were a nonrandom subset of the 104 families who participated in the soil ingestion study by Davis et al. (1990). Data collection issues resulted in sufficiently complete data for only 19 of the 20 families consisting of a child participant from the Davis et al. (1990) study ages 3 to 7, inclusive, and a female and male parent or guardian living in the same house. Duplicate samples of all food and medication items consumed, and all feces excreted, were collected for 11 consecutive days. Urine samples were collected twice daily for 9 of the 11 days; for the remaining 2 days, attempts were made to collect full 24-hour urine specimens. Soil and house dust samples were also collected. Soil and dust samples were passed successively through a 20- and 60-mesh (850 and 250 µm, respectively, ASTM, 2017) stainless steel sieves. Only 12 children had sufficiently complete data for use in the soil and dust ingestion estimates.
Tracer elements for this study included aluminum, silicon, and titanium. Toothpaste was supplied for use by study participants. In addition, parents completed a daily diary of activities for themselves and the participant child for 4 consecutive days during the study period.
Table 5-9 shows soil ingestion rates for all three family member participants. The mean and median estimates for children for all three tracers ranged from 36.7 to 206.9 mg/day and 26.4 to 46.7 mg/day, respectively, and fall within the range of those
reported by Davis et al. (1990). Adult soil ingestion estimates ranged from 23.2 to 624.9 mg/day for mean values and from 0 to 259.5 mg/day for median values. This is based on 33 adults with complete food, excreta, and soil data. Adult soil ingestion estimates were more variable than those of children in the study regardless of the tracer. The authors believed that this higher variability may have indicated an important occupational contribution of soil ingestion in some, but not all, of the adults. As in previous studies, the soil ingestion estimates were the highest for titanium. Although toothpaste is a known source of titanium, the titanium content of the toothpaste used by study participants was not determined.
Only three of a number of behaviors examined for their relationship to soil ingestion were found to be associated with increased soil ingestion in this study:
Reported eating of dirt (for children), Occupational contact with soil (for adults),
and Hand washing before meals (for both
children and adults).
Several typical childhood behaviors, however, including thumb-sucking, furniture licking, and carrying around a blanket or toy were not associated with increased soil ingestion for the participating children. Among both parents and children, neither nail-biting nor eating unwashed fruits or vegetables was correlated with increased soil ingestion. However, because duplicate food samples were used to “correct” for dietary intake of tracers, accounting for soil ingestion from eating unwashed fruits or vegetables was not possible. Although eating unwashed fruits or vegetables was not reflected in the soil ingestion estimates in this study, the authors noted that it is a behavior that could lead to soil ingestion. When investigating correlations within the same family, a child’s soil ingestion was not found to be associated with either parent’s soil ingestion, nor did the mother and father’s soil ingestion appear to be correlated.
5.3.3. Key Studies of Secondary Analysis The following sections provide summaries of
key studies of secondary analysis (i.e., studies in which researchers have interpreted previously published results, or data that were originally collected for a different purpose).
Update for Chapter 5 of the Exposure Factors Handbook
Chapter 5—Soil and Dust Ingestion
September 2017 Page 5-17
5.3.3.1. Calabrese and Stanek (1995)—Resolving Intertracer Inconsistencies in Soil Ingestion Estimation
Calabrese and Stanek (1995) explored sources and magnitude of positive and negative errors in soil ingestion estimates for children on a subject-week and trace element basis. Calabrese and Stanek (1995) identified possible sources of positive errors as follows:
Ingestion of high levels of tracers before the start of the study and low ingestion during the study period and
Ingestion of element tracers from a nonfood or nonsoil source during the study period.
Possible sources of negative bias were identified as follows:
Ingestion of tracers in food that are not captured in the fecal sample either due to slow lag time or not having a fecal sample available on the final study day and
Sample measurement errors that result in diminished detection of fecal tracers, but not in soil tracer levels.
The authors developed an approach that attempted to reduce the magnitude of error in the individual trace element ingestion estimates. Results from a previous study conducted by Calabrese et al. (1989) were used to quantify these errors based on the following criteria: (1) a lag period of 28 hours was assumed for the passage of tracers ingested in food to the feces (this value was applied to all subject-day estimates), (2) a daily soil ingestion rate was estimated for each tracer for each 24-hour day a fecal sample was obtained, (3) the median tracer-based soil ingestion rate for each subject-day was determined, and (4) negative errors due to missing fecal samples at the end of the study period were also determined. Also, upper- and lower-bound estimates were determined based on criteria formed using an assumption of the magnitude of the relative standard deviation presented in another study conducted by Stanek and Calabrese (1995b). Daily soil ingestion rates for tracers that fell beyond the upper and lower ranges were excluded from subsequent calculations, and the median soil
ingestion rates of the remaining tracer elements were considered the best estimate for that particular day. The magnitude of positive or negative error for a specific tracer per day was derived by determining the difference between the value for the tracer and the median value.
Table 5-10 presents the estimated magnitude of positive and negative error for six tracer elements in the children’s study (conducted by Calabrese et al., 1989). The original nonnegative mean soil ingestion rates (see Table 5-3) ranged from a low of 21 mg/day based on zirconium to a high of 459 mg/day based on vanadium. The adjusted mean soil ingestion rate after correcting for negative and positive errors ranged from 97 mg/day based on yttrium to 208 mg/day based on titanium. Calabrese and Stanek (1995) concluded that correcting for errors at the individual level for each tracer element provides more reliable estimates of soil ingestion.
5.3.3.2. Stanek and Calabrese (1995a)—Soil Ingestion Estimates for Use in Site Evaluations Based on the Best Tracer Method
Stanek and Calabrese (1995a) recalculated soil ingestion rates for adults and children from two previous studies using data for eight tracers from Calabrese et al. (1989) and three tracers from Davis et al. (1990). Recalculations were performed using the BTM. This method selected the “best” tracer(s), by dividing the total amount of tracer in a particular child’s duplicate food sample by tracer concentration in that child’s soil sample to yield a (F:S) ratio. The F:S ratio was small when the tracer concentration in food was low compared to the tracer concentration in soil. Small F:S ratios were desirable because they lessened the impact of transit time error (the error that occurs when fecal output does not reflect food ingestion, due to fluctuation in gastrointestinal transit time) in the soil ingestion calculation.
For adults, Stanek and Calabrese (1995a) used data for eight tracers from the Calabrese et al. (1989) study to estimate soil ingestion by the BTM. The lowest F:S ratios were zirconium and aluminum and the element with the highest F:S ratio was manganese. For soil ingestion estimates based on the median of the lowest four F:S ratios, the tracers contributing most often to the soil ingestion estimates were aluminum, silicon, titanium, yttrium, vanadium, and zirconium. Using the median of the soil ingestion rates based on the best four tracer elements, the average adult soil ingestion rate was estimated to be 64 mg/day with a median of 87 mg/day. The 95th percentile soil ingestion
Update for Chapter 5 of the Exposure Factors Handbook
Chapter 5—Soil and Dust Ingestion
September 2017 Page 5-18
estimate was 142 mg/day. These estimates are based on 18 subject weeks for the 6 adult volunteers described in Calabrese et al. (1989).
The BTM used a ranking scheme of F:S ratios to determine the best tracers for use in the ingestion rate calculation. To reduce the impact of biases that may occur as a result of sources of fecal tracers other than food or soil, the median of soil ingestion estimates based on the four lowest F:S ratios was used to represent soil ingestion.
Using the lowest four F:S ratios for each individual child, calculated on a per-week (“subject-week”) basis, the median of the soil ingestion estimates from the Calabrese et al. (1989) study most often included aluminum, silicon, titanium, yttrium, and zirconium. Table 5-11 presents the soil ingestion estimates based on the median values for aluminum, silicon, and titanium for each child; the median of the best four tracers for each child, and the best tracer for each child. Based on the median of soil ingestion estimates from the best four tracers, the mean soil ingestion rate for children was 132 mg/day and the median was 33 mg/day. The 95th percentile value was 154 mg/day.
For the 101 children in the Davis et al. (1990) study, the mean soil ingestion rate was 69 mg/day and the median soil ingestion rate was 44 mg/day (see Table 5-11). The 95th percentile estimate was 246 mg/day. These data are based on the three tracers (i.e., aluminum, silicon, and titanium) from the Davis et al. (1990) study. When the results for the 128 subject-weeks in Calabrese et al. (1989) and 101 children in Davis et al. (1990) were combined, soil ingestion for children was estimated to be 104 mg/day (mean); 37 mg/day (median); and 217 mg/day (95th percentile), using the BTM.
5.3.3.3. Hogan et al. (1998)—Integrated Exposure Uptake Biokinetic Model for Lead in Children: Empirical Comparisons with Epidemiologic Data
Hogan et al. (1998) used the IEUBK model, to compare model predictions of blood lead levels with epidemiological data to serve as one component of the model validation. Environmental lead measurement data from 478 children (38 were 0.5 to <1 year; 440 were 1 to <7 years) across three epidemiological studies were used as input to the IEUBK model. Model results were compared to blood lead levels from the same children. These children were a subset of the entire population of children living in three historic lead smelting communities (Palmerton, PA; Madison County, IL;
and southeastern Kansas/southwestern Missouri), whose environmental lead exposures (soil and dust lead levels) had been studied as part of public health evaluations in these communities. The study populations were, in general, random samples of children 6 months to 7 years of age. Children who had lived in their residence for less than 3 months or those reported by their parents to be away from home more than 10 hours per week (>20 hours/week for the Pennsylvania data set) were excluded due to lack of information regarding lead exposure at the secondary location. The nature of the soil and dust exposures for the residential study population were typical, with the sample size considered sufficiently large to ensure that a wide enough range of children’s behavior would be spanned by the data. Comparisons were made for a number of exposure factors, including age, location, time spent away from home, time spent outside, and whether or not children took food outside to eat.
The IEUBK model is a biokinetic model for predicting children’s blood lead levels that uses measurements of lead content in house dust, soil, drinking water, food, and air. Model users use default assumptions for the lead contents and intake rates for each exposure medium (including soil) when they do not have specific information for each child.
Hogan et al. (1998) compared children’s measured blood lead levels with biokinetic model predictions (IEUBK version 0.99d) of blood lead levels, using the children’s measured drinking water, soil, and dust lead contamination levels together with default IEUBK model inputs for soil and dust ingestion, relative proportions of soil and dust ingestion, lead bioavailability from soil and dust, and other model parameters. Thus, the default soil and dust ingestion rates, and other default assumptions in the model, were tested by comparing measured blood lead levels with the model’s predictions for those children’s blood lead levels. Most IEUBK model kinetic and intake parameters were drawn independently from published literature (White et al., 1998; U.S. EPA, 1994b). Elimination parameters in particular had relatively less literature to draw upon (few data in children) and were fixed through a calibration exercise using a data set with children’s blood lead levels paired with measured environmental lead exposures in and around their homes, while holding the other model parameters constant.
Results for all community-wide children 6 months to 7 years of age were as follows: for Palmerton, PA (N = 34), the geometric mean measured blood lead levels (6.8 µg/dL) were slightly over-predicted by the model (7.5 µg/dL); for
Update for Chapter 5 of the Exposure Factors Handbook
Chapter 5—Soil and Dust Ingestion
September 2017 Page 5-19
southeastern Kansas/southwestern Missouri (N = 111), the blood lead levels (5.2 µg/dL) were slightly under-predicted (4.6 µg/dL), and for Madison County, IL (N = 333), the geometric mean measured blood lead levels matched the model predictions (5.9 µg/dL measured and predicted), with very slight differences in the 95% confidence interval. Geometric mean model predictions were within 1 µg/dL of the observed geometric mean blood lead levels in the three populations studied. Hogan et al. (1998) noted that results may vary depending on the ability to identify children’s playing areas and the use of different environmental sampling methods. In addition, interactions between socioeconomic status, race, and sex can vary across communities and make generalizations of results difficult. For 31 children 6 to 12 months old in the Madison County, IL site only, Hogan et al. (1998) reported a predicted geometric mean blood lead level 1.4-fold higher than the geometric mean blood lead levels observed.
Default soil and dust ingestion rates used in this version of the IEUBK model were: 135 mg/day for 1-, 2-, and 3-year-olds; 100 mg/day for 4-year-olds; 90 mg/day for 5-year-olds; and 85 mg/day for 6-year-olds (U.S. EPA 1994b, 2007). These values represent mean soil and dust ingestion rates; distributional data are not used in the model. The time-averaged daily soil + dust ingestion rate for these 6 years of life was 113 mg/day. Hogan et al. (1998) did not provide information on the particle sizes of the soil analyzed for this study. Because particle size may be an important factor in estimating the concentrations of elements in soil, this adds uncertainties to the results. Regardless of this and other uncertainties, these results suggest that the combination of assumptions used as model input parameters, including soil and dust ingestion rates, are roughly accurate for 440 1- to <7-year-old children in the three locations studied.
5.3.3.4. Özkaynak et al. (2011)—Modeled Estimates of Soil and Dust Ingestion Rates for Children
Özkaynak et al. (2011) developed soil and dust ingestion rates for children 3 to <6 years of age using U.S. EPA’s SHEDS model for multimedia pollutants (SHEDS-Multimedia). The authors had two main objectives for this research: (1) to demonstrate an application of the SHEDS model while identifying and quantifying the key factors contributing to the predicted variability and uncertainty in the soil and dust ingestion exposure estimates and (2) to compare the modeled results to existing tracer-element field
measurements. The SHEDS model is a physically based probabilistic exposure model, which combines diary information on sequential time spent in different locations and activities drawn from EPA’s Consolidated Human Activity Database (CHAD), with micro-activity data (e.g., hand-to-mouth frequency, hand-to-surface frequency), surface/object soil or dust loadings, and other exposure factors (e.g., soil-to-skin adherence, saliva removal efficiency). The SHEDS model generates simulated individuals, who are then followed through time, generally up to one year. The model computes changes to their exposure at the diary event level.
For this study, an indirect modeling approach was used in which soil and dust were assumed to first adhere to the hands and remain until washed off or ingested by mouthing. The object-to-mouth pathway for soil/dust ingestion was also addressed. For this application of the SHEDS model, however, other avenues of soil/dust ingestion were not considered. Outdoor matter was designated as “soil” and indoor matter as “dust.” Estimates for the distributions of exposure factors such as activity, time outdoors, environmental concentrations, soil-skin and dust-skin transfer, hand washing frequency and efficiency, hand-mouthing frequency, area of object or hand mouthed, mouthing removal rates, and other variables were obtained from the literature. These input variables were used in this SHEDS model application to generate estimates of soil and dust ingestion rates for a simulated population of 1,000. Both sensitivity and uncertainty analyses were conducted. Based on the sensitivity analysis, the model results are the most sensitive to dust loadings on carpet and hard floor surfaces, soil-skin adherence factor, hand mouthing frequency, and mean number of hand washes per day. Based on 200 uncertainty simulations that were conducted, the modeling uncertainties were seen to be asymmetrically distributed around the 50th (median) or the central variability distribution.
Table 5-12 shows the predicted soil and dust ingestion rates. Mean total soil and dust ingestion was predicted to be 68 mg/day, with approximately 60% originating from soil ingestion, 30% from dust on hands, and 10% from dust on objects. It is important to note that this is different from the assumptions used in the IEUBK model of 55% dust and 45% soil. Hand-to-mouth soil ingestion was found to be the most important pathway, followed by hand-to-mouth dust ingestion, then object-to-mouth dust ingestion. The authors noted that these modeled estimates were found to be consistent with other soil/dust ingestion values in the literature, but
Update for Chapter 5 of the Exposure Factors Handbook
Chapter 5—Soil and Dust Ingestion
September 2017 Page 5-20
slightly lower than the central tendency value of 100 mg/day recommended in EPA’s Child-Specific Exposure Factors Handbook (U.S. EPA, 2008).
The SHEDS methodology can be applied to specific study populations of interest, a wide range of input parameters, and can generate a full range of distributions. One advantage of this methodology is that it produced both ingestion of soil and ingestion of dust. However, data for some of the input variables are lacking. Data needs include additional information on the activities and environments of children in younger age groups, including children with high hand-to-mouth, object-to-mouth, and pica behaviors, and information on skin adherence and dust loadings on indoor objects and floors, and information to evaluate temporal variability. Assumptions used, particularly for the transfer of dust from both bare floors and carpets to hands and soil loadings to hands while playing outdoors, may be considered low for these parameters compared to other experimental data available. The model also assumes that the same hand area is mouthed on each occasion, which may lead to lower dust intake rates. In addition, other age groups of interest were not included because of lack of data for some of the input variables.
5.3.3.5. Wilson et al. (2013)—Revisiting Dust and Soil Ingestion Rates Based on Hand-to-Mouth Transfer
Wilson et al. (2013) provided estimates of the ingestion rates of indoor dust and outdoor soil for Canadians using both deterministic and probabilistic methods. An indirect modeling approach was used. Based on data from multiple studies, Wilson et al. (2013) estimated dust and soil ingestion using measures of particle loading to indoor surfaces, the fraction transferred to the hands, hand surface areas, the fraction of hand surface area that may be mouthed or contact food, the frequency of hand-to-mouth contacts, the amount dissolved in saliva, and the exposure time. The following equations were used to estimate indoor dust and outdoor soil ingestion, respectively:
DIG = DSL × FTSS × SAhand × FSAfingers × FQ × SE × ET
(Eqn. 5-4) and
SIR = SLhands × SAhand × FSAfingers × FQ × SE × ET
(Eqn. 5-5) where:
DIG = dust ingestion rate (mg/day) DSL = dust surface loading
(mg/cm2) ET = exposure time (hours/day) FQ = frequency of hand-to-mouth
events (events/hour) FSAfingers = fractional surface area of hand
mouthed FTSS = fraction of dust transferred from
surfaces to the skin SAhand = surface area of one hand (cm2) SE = saliva extraction factor (unitless) SIR = soil ingestion rate (mg/day) SLhands = soil loading (mass of soil
adhering to hands) (mg/cm2)
The input parameters used in these equations are provided in Table 5-13. For FTSS, it was assumed that contact occurred with hard surfaces (e.g., nonporous floor surfaces such as tile or hardwood, countertops, tables, window sills) 50% of the time and with soft surfaces (e.g., carpets, sofas, beds) 50% of the time, except for infants for whom contact was assumed to occur with soft surfaces only (i.e., 100% of the time). In addition, it was assumed that the front surface of the four fingers and the thumb of one hand was the area mouthed.
Mean dust ingestion rates were similar within age groups when using either the deterministic or probabilistic approach based on 200,000 trials (see Table 5-14), ranging from 2.2 mg/day for teenagers (ages 12 to 19 years) to 41 mg/day for toddlers (ages 7 months to 4 years). Mean soil ingestion rates ranged from 1.2 mg/day for seniors (ages 60+ years) to 23 mg/day for children (ages 5 to 11 years) using the probabilistic approach (see Table 5-14). Mean soil ingestion rates using the deterministic approach were similar. Combined dust and soil ingestion rates ranged from 3.7 mg/day for teenagers (ages 12 to 19 years) to 61 mg/day for toddlers (ages 7 months to 4 years). The 95th percentile combined soil and dust ingestion rates ranged from 12.6 mg/day for teenagers to 204 mg/day for toddlers.
Ingestion rates were estimated for a wide range of age groups, and separate ingestion estimates were provided for both dust and soil. However, the study used input values from multiple studies to generate the dust and soil ingestion rates, and each individual study is expected to have its own shortcomings, which also apply to this analysis. Some of these limitations include uncertainties with regard to the methodologies for dust collection in hard and soft surfaces in the studies selected for the analysis,
Update for Chapter 5 of the Exposure Factors Handbook
Chapter 5—Soil and Dust Ingestion
September 2017 Page 5-21
assumptions of a single hand contact with surfaces, assumptions about the parts of the hand mouthed, and not accounting for effects of soil and hand moisture on soil and dust loadings on the skin. Also, the model does not account for object-to-mouth contact. Many of these assumptions used by Wilson et al. (2013) in the model would tend to underestimate amount of soil and dust ingested.
5.3.3.6. Von Lindern et al. (2016)—Estimating Children’s Soil/Dust Ingestion Rates through Retrospective Analyses of Blood Lead Biomonitoring from the Bunker Hill Superfund Site in Idaho
Von Lindern et al. (2016) conducted an analysis to estimate age-specific soil/dust ingestion rates using the IEUBK model for lead in children and soil and house dust lead bioavailability data from the Bunker Hill Mining and Metallurgical Complex Superfund Site in Idaho. A total of 271 soil/dust samples archived during 1986−2002, including 193 house dust samples, 73 yard soil samples, and 5 quality control samples, were retrieved from storage. The samples were matched with blood lead data and information on the child’s age and sex, home location, and property remediation status. After sieving to 80-mesh (180 µm; ASTM, 2017), they were analyzed for total lead and in vitro bioaccessibility. In vivo relative and absolute bioavailability was calculated from in vitro bioaccessibility results. A total of 2,176 records of blood/soil/dust/lead concentrations were available.
Structural equations modeling (SEM), which is a statistical multivariate methodology, was used to determine soil and dust partitions, age-specific soil and dust intake rates, and lead uptake from sources other than soil and dust (i.e., air, diet, and water). Von Lindern et al. (2016) calculated the total lead uptake by dividing the measured blood lead levels (μg/L) by the age-specific biokinetic slope factors in the IEUBK model. Total lead uptake is the sum of the uptakes from the four components: air, water, diet, and soil/dust. Soil and dust intake rates were calculated by assigning partition coefficients (i.e., fractional contributions to total soil/dust ingestion by each source) using Equation 5-6.
𝐼𝐼𝐼𝐼𝑖𝑖𝑖𝑖 = 1,000 × �𝑈𝑈𝑈𝑈𝑖𝑖𝑖𝑖/�(𝐶𝐶𝑖𝑖 × 𝑈𝑈𝑃𝑃𝑖𝑖 × 𝐴𝐴𝐴𝐴𝑆𝑆𝑖𝑖) +�𝐶𝐶𝑦𝑦𝑖𝑖 × 𝑈𝑈𝑃𝑃𝑦𝑦𝑖𝑖 × 𝐴𝐴𝐴𝐴𝑆𝑆𝑦𝑦𝑖𝑖� + (𝐶𝐶𝑓𝑓𝑖𝑖 × 𝑈𝑈𝑃𝑃𝑓𝑓𝑖𝑖 × 𝐴𝐴𝐴𝐴𝑆𝑆𝑓𝑓𝑖𝑖) +(𝐶𝐶𝑖𝑖𝑖𝑖 × 𝑈𝑈𝑃𝑃𝑖𝑖𝑖𝑖 × 𝐴𝐴𝐴𝐴𝑆𝑆𝑖𝑖𝑖𝑖)��
(Eqn. 5-6)
where:
IRsd = soil/dust intake rate (mg/day) UPsd = uptake from soil/dust (μg/day) C = concentration from the various
sources (i.e., d = dust; ys = yard soil; cs = community soil; ns = neighborhood soil) (mg/kg)
PT = partition coefficient for the various sources (unitless)
ABS = absolute bioavailability for the various sources (unitless)
Soil and dust intake rates were calculated for four source partition (PT) scenarios: (1) the IEUBK model default of 55% dust and 45% soil (55/45); (2) the original Bunker Hill Superfund Site model of 40% dust, 30% yard soil, and 30% geometric mean community soil (40/30/30GM); (3) the same partition as in scenario 2, but using the arithmetic mean (40/30/30AM); and (4) the SEM using 50% dust, 25% yard soil, 10% neighborhood soil, and 15% community soil (50/25/10/15). Mean soil and dust absolute bioavailability (ABS) was estimated to be 33% (SD ± 4%) and 28% (SD ± 6%), respectively. These values are similar to the 30% value recommended in the IEUBK model as a default.
Central tendency age-specific soil and dust intake rates for the four partition scenarios were estimated using Equation 5-5, and are presented in Table 5-15. All partition scenarios produced similar central tendency intake rates (von Lindern et al., 2016). For children ages 0.5 to 9 years, the mean soil and dust ingestion rates ranged from 47 mg/day to 100 mg/day. Among the age groups evaluated, children ages 1 to <2 years had the highest mean soil and dust ingestion rates (i.e., 89‒100 mg/day), and children older than 2 years, had estimated soil and dust ingestion rates averaging approximately 60 mg/day. Age-specific distributions of soil and dust intake rates for the four partition scenarios are shown in Table 5-16. The 95th percentile soil and dust intake rates ranged from 120 mg/day to 493 mg/day. The 55/45 partition scenario consistently produced higher 95th percentile soil and dust intake rates compared to the other scenarios. These age specific soil/dust intake rates were input to the IEUBK model to compare predicted and observed blood lead levels (von Lindern et al., 2016). Linear regression analyses indicated that the 50/25/10/15 and the 40/30/30 average intake rates were the partition scenarios that best fit the blood lead levels predicted by the IEUBK model to the observed blood lead levels. The data from these two
Update for Chapter 5 of the Exposure Factors Handbook
Chapter 5—Soil and Dust Ingestion
September 2017 Page 5-22
partition scenarios were used in developing the recommended soil and dust ingestion values shown in Tables 5-1 and 5-34.
This study provides soil and dust intake rates for various age groups including very young children. Blood lead data were collected for a number of consecutive years. The strengths of this study are that the soil and dust ingestion estimates are based on a large number of samples, and that the estimates represent long-term exposures. One of the limitations of this study is that partition coefficients that were derived may not be representative of all age groups, all neighborhoods in the study, or other populations. Partition of soil and dust materials contributing to an individual child’s lead uptake can be expected to vary strongly among residences and among children. The authors also acknowledged that education and intervention programs may have resulted in children’s temporary reduction in soil/dust ingestion rates at this site (von Lindern et al., 2016). Increased knowledge and concern about lead exposure may lead to residents taking steps to reduce their child’s lead exposure through more frequent hand washing, more household vacuuming, and changing the areas where children play. This is evidenced by a decline in the estimated average ingestion rates from 1988 to 2002 when the analysis was performed for the different partition scenarios by year. Other uncertainties include not accounting for the variability in the children’s blood lead levels with time, a limited number of soil and dust measurements, the representativeness of the soil and dust measurements of the children’s play areas, and measurement error. In addition, the equations derived by von Lindern et al. (2016) for the analysis would be highly sensitive to low lead media concentrations and less sensitive to higher lead concentrations.
5.3.4. Relevant Studies of Primary Analysis
The following studies are classified as relevant rather than key. They either do not provide a quantitative estimate of soil ingestion, or they are estimates generated for a population that may not be representative of the U.S. general population. Studies that provide data for special populations such as those engaging in wilderness lifestyles in Canada (Doyle et al., 2012; Irvine et al., 2014) are presented in this section. Data from these studies may be appropriate for high soil contact scenarios. The general population tracer element studies described in this section are not designated as key because the methodology to account for nonsoil
tracer exposures (e.g., food, medicine) was not as well developed as the methodology in the U.S. tracer element studies described in Sections 5.3.2 and 5.3.3. However, the method of Clausing et al. (1987) and data of van Wïjnen et al. (1990) were used in developing biokinetic model default soil and dust ingestion rates (U.S. EPA, 1994a) used in the Hogan et al. (1998) study and von Lindern et al. (2016), which were designated as key. In most cases, the survey response studies were of a nonrandomized design, provided insufficient information to determine important details regarding study design, or provided no data to allow quantitative estimates of soil and/or dust ingestion rates.
5.3.4.1. Dickins and Ford (1942)—Geophagy (Dirt Eating) among Mississippi Negro School Children
Dickins and Ford (1942) conducted a survey response study of rural Black school children (4th grade and above) in Oktibbeha County, MS in September 1941. A total of 52 of 207 children (18 of 69 boys and 34 of 38 girls) studied gave positive responses to questions administered in a test-taking format regarding having eaten dirt in the previous 10 to 16 days. The authors stated that the study sample likely was more representative of the higher socioeconomic levels in the community because older children from lower socioeconomic levels sometimes left school in order to work and because children in the lower grades, who were more socioeconomically representative of the overall community, were excluded from the study. Clay was identified as the predominant type of soil eaten.
5.3.4.2. Ferguson and Keaton (1950)—Studies of the Diets of Pregnant Women in Mississippi: II Diet Patterns
Ferguson and Keaton (1950) conducted a survey response study of a group of 361 pregnant women receiving health care at the Mississippi State Board of Health, who were interviewed regarding their diet, including the consumption of clay or starch. All of the women were from the lowest economic and educational level in the area, and 92% were Black. Of the Black women, 27% reported eating clay and 41% eating starch. In the group of White women, 7 and 10% reporting clay- and starch-eating, respectively. The amount of starch eaten ranged from 2−3 small lumps to 3 boxes (24 ounces) per day. The amount of clay eaten ranged from one tablespoon to one cup per day.
Update for Chapter 5 of the Exposure Factors Handbook
Chapter 5—Soil and Dust Ingestion
September 2017 Page 5-23
5.3.4.3. Cooper (1957)—Pica: A Survey of the Historical Literature as Well as Reports from the Fields of Veterinary Medicine and Anthropology, the Present Study of Pica in Young Children, and a Discussion of Its Pediatric and Psychological Implications
Cooper (1957) conducted a nonrandomized survey response study in the 1950s of children age 7 months or older referred to a Baltimore, MD mental hygiene clinic. For 86 out of 784 children studied, parents or caretakers gave positive responses to the question, “Does your child have a habit, or did he ever have a habit, of eating dirt, plaster, ashes, etc.?” and identified dirt, or dirt combined with other substances, as the substance ingested. Cooper (1957) described a pattern of pica behavior, including ingesting substances other than soil, being most common between ages 2 and 4 or 5 years, with one of the 86 children ingesting clay at age 10 years and 9 months.
5.3.4.4. Barltrop (1966)—The Prevalence of Pica Barltrop (1966) conducted a randomized survey
response study of children born in Boston, MA between 1958 and 1962, inclusive, whose parents resided in Boston and who were neither illegitimate nor adopted. A stratified random subsample of 500 of these children was contacted for in-person caregiver interviews, in which a total of 186 families (37%) participated. A separate stratified subsample of 1,000 children was selected for a mailed survey in which 277 (28%) of the families participated. Interview-obtained data regarding caregiver reports of pica (in this study is defined as placing nonfood items in the mouth and swallowing them) behavior in all children ages 1 to 6 years in the 186 families (N = 439) indicated 19 had ingested dirt (defined as yard dirt, house dust, plant-pot soil, pebbles, ashes, cigarette ash, glass fragments, lint, and hair combings) in the preceding 14 days. These data do not appear to have been corrected for unequal selection probability in the stratified random sample, nor were they corrected for nonresponse bias. Interviews were conducted in the March/April time frame, presumably in 1964. Mail-survey obtained data regarding caregiver reports of pica in the preceding 14 days indicated that 39 of 277 children had ingested dirt, presumably using the same definition as above. Barltrop (1966) mentions several possible limitations of the study, including nonparticipation bias and respondents’ memory, or recall, effects.
5.3.4.5. Bruhn and Pangborn (1971)—Reported Incidence of Pica among Migrant Families
Bruhn and Pangborn (1971) conducted a survey among 91 low income families of migrant agricultural workers in California in May through August 1969. Families in two labor camps (Madison camp, 10 miles west of Woodland, and Davis camp, 10 miles east of Davis) were of Mexican descent, and families in one camp (Harney Lane camp 17 miles north of Stockton) were “Anglo.” Participation was 34 of 50 families at the Madison camp, 31 of 50 families at the Davis camp, and 26 of 26 families at the Harney Lane camp. Respondents for the studied families (primarily wives) gave positive responses to open-ended questions such as “Do you know of anyone who eats dirt or laundry starch?” Bruhn and Pangborn (1971) apparently asked a modified version of this question pertaining to the respondents’ own or relatives’ families. They reported 18% (12 of 65) of Mexican families’ respondents as giving positive responses for consumption of “dirt” among children within the Mexican respondents’ own or relatives’ families. They reported 42% (11 of 26) of “Anglo” families’ respondents as giving positive responses for consumption of “dirt” among children within the Anglo respondents’ own or relatives’ families.
5.3.4.6. Robischon (1971)—Pica Practice and Other Hand-Mouth Behavior and Children’s Developmental Level
A survey response sample of 19- to 24-month-old children examined at an urban well-child clinic in the late 1960s or 1970 in an unspecified location indicated that 48 of the 130 children whose caregivers were interviewed, exhibited pica behavior (defined as “ate nonedibles more than once a week”). The specific substances eaten were reported for 30 of the 48 children. All except 2 of the 30 children habitually ate more than one nonedible substance. The soil and dust-like substances reported as eaten by these 30 children were: ashes (17), “earth” (5), dust (3), fuzz from rugs (2), clay (1), and pebbles/stones (1). Caregivers for some of the study subjects (between 0 and 52 of the 130 subjects, exact number not specified) reported that the children “ate nonedibles less than once a week.”
5.3.4.7. Bronstein and Dollar (1974)—Pica in Pregnancy
The frequency and effects of pica behavior was investigated by Bronstein and Dollar (1974) in 410 pregnant, low-income women from both urban
Update for Chapter 5 of the Exposure Factors Handbook
Chapter 5—Soil and Dust Ingestion
September 2017 Page 5-24
(N = 201) and rural (N = 209) areas in Georgia. The women selected were part of the Nutrition Demonstration Project, a study investigating the effect of nutrition on the outcome of the pregnancy, conducted at the Eugene Talmadge Memorial Hospital and University Hospital in Augusta, GA. During their initial prenatal visit, each patient was interviewed by a nutrition counselor who questioned her food frequency, social and dietary history, and the presence of pica. Patients were categorized by age, parity, and place of residence (rural or urban).
Of the 410 women interviewed, 65 (16%) stated that they practiced pica. A variety of substances were ingested, with laundry starch being the most common. There was no significant difference in the practice of pica between rural and urban women, although older rural women (20−35 years) showed a greater tendency to practice pica than younger rural or urban women (<20 years). The number of previous pregnancies did not influence the practice of pica. The authors noted that the frequency of pica among rural patients had declined from a previous study conducted 8 years earlier, and attributed the reduction to a program of intensified nutrition education and counseling provided in the area. No specific information on the amount of pica substances ingested was provided by this study, and the data are more than 30 years old.
5.3.4.8. Hook (1978)—Dietary Cravings and Aversions during Pregnancy
Hook (1978) conducted interviews of 250 women who had each delivered a live infant at two New York hospitals; the interviews took place in 1975. The mothers were first asked about any differences in consumption of seven beverages during their pregnancy, and the reasons for any changes. They were then asked, without mentioning specific items, about any cravings or aversions for other foods or nonfood items that may have developed at any time during their pregnancy.
Nonfood items reportedly ingested during pregnancy were ice, reported by three women, and chalk from a river clay bank, reported by one woman. In addition, one woman reported an aversion to nonfood items (specific nonfood item not reported). No quantity data were provided by this study.
5.3.4.9. Binder et al. (1986)—Estimating Soil Ingestion: The Use of Tracer Elements in Estimating the Amount of Soil Ingested by Young Children
Binder et al. (1986) used a tracer technique modified from a method previously used to measure soil ingestion among grazing animals to study the ingestion of soil among children 1 to 3 years of age who wore diapers. The children were studied during the summer of 1984 as part of a larger study of residents living near a lead smelter in East Helena, MT. Fecal samples from diapers were collected over a 3-day period from 65 children (42 males and 23 females), and composited samples of soil were obtained from the children’s yards. Both excreta and soil samples were analyzed for aluminum, silicon, and titanium. These elements were found in soil but were thought to be poorly absorbed in the gut and to have been present in the diet only in limited quantities. Excreta measurements were obtained for 59 of the children. Soil ingestion by each child was estimated on the basis of each of the three tracer elements using a standard assumed fecal dry weight of 15 g/day, and the following Equation 5-7:
Ti,e = ei
i
SFf ei
,
, × (Eqn. 5-7)
where:
Ti,e = estimated soil ingestion for child i based on element e (g/day)
fi,e = concentration of element e in fecal sample of child i (mg/g)
Fi = fecal dry weight (g/day) Si,e = concentration of element e in child i’s
yard soil (mg/g)
The analysis assumed that (1) the tracer elements were neither lost nor introduced during sample processing, (2) the soil ingested by children originates primarily from their own yards, and (3) that absorption of the tracer elements by the children occurred in only small amounts. The study did not distinguish between ingestion of soil and house dust, nor did it account for the presence of the tracer elements in ingested foods or medicines.
The arithmetic mean quantity of soil ingested by the children in the Binder et al. (1986) study was estimated to be 181 mg/day (range 25 to 1,324) based on the aluminum tracer, 184 mg/day (range 31
Update for Chapter 5 of the Exposure Factors Handbook
Chapter 5—Soil and Dust Ingestion
September 2017 Page 5-25
to 799) based on the silicon tracer, and 1,834 mg/day (range 4 to 17,076) based on the titanium tracer (see Table 5-17). The overall mean soil ingestion estimate, based on the minimum of the three individual tracer estimates for each child, was 108 mg/day (range 4 to 708). The median values were 121 mg/day, 136 mg/day, and 618 mg/day for aluminum, silicon, and titanium, respectively. The 95th percentile values for aluminum, silicon, and titanium were 584 mg/day, 578 mg/day, and 9,590 mg/day, respectively. The 95th percentile value based on the minimum of the three individual tracer estimates for each child was 386 mg/day.
The authors were not able to explain the difference between the results for titanium and for the other two elements, but they speculated that unrecognized sources of titanium in the diet or in the laboratory processing of stool samples may have accounted for the increased levels. The frequency distribution graph of soil ingestion estimates based on titanium in the Binder et al. (1986) paper (not provided here) shows that a group of 21 children had particularly high titanium values (i.e., >1,000 mg/day). The remainder of the children showed titanium ingestion estimates at lower levels, with a distribution more comparable to that of the other elements.
5.3.4.10. Clausing et al. (1987)—A Method for Estimating Soil Ingestion by Children
Clausing et al. (1987) conducted a soil ingestion study with Dutch children using a tracer element methodology. The study measured aluminum, titanium, and acid-insoluble residue (AIR) contents of fecal samples from children aged 2 to 4 years attending a nursery school, and for samples of playground dirt at that school. Over a 5-day period, 27 daily fecal samples were obtained for 18 children. Soil samples from the direct surroundings of the nursery school were sieved through a 250 µm screen. Using the average soil concentrations present at the school, and assuming a standard fecal dry weight of 10 g/day, soil ingestion was estimated for each tracer. Six hospitalized, bedridden children served as a control group, representing children who had very limited access to soil; eight daily fecal samples were collected from the hospitalized children.
Recoveries from analytical analyses ranged from 54–89% for titanium and aluminum. Without correcting for the tracer element contribution from background sources, represented by the hospitalized children’s soil ingestion estimates, the aluminum-based soil ingestion estimates for the school children in this study ranged from 23 to
979 mg/day, the AIR-based estimates ranged from 48 to 362 mg/day, and the titanium-based estimates ranged from 64 to 11,620 mg/day. As in the Binder et al. (1986) study, a fraction of the children (6/18) showed titanium values above 1,000 mg/day, with most of the remaining children showing substantially lower values. Calculating an arithmetic mean quantity of soil ingested based on each fecal sample yielded 232 mg/day for aluminum; 129 mg/day for AIR, and 1,431 mg/day for titanium (see Table 5-18). Based on the limiting tracer method (LTM) and averaging across each fecal sample, the arithmetic mean soil ingestion was estimated to be 105 mg/day with a population standard deviation of 67 mg/day (range 23 to 362 mg/day); geometric mean soil ingestion was estimated to be 90 mg/day. Use of the LTM assumed that "the maximum amount of soil ingested corresponded with the lowest estimate from the three tracers” (Clausing et al., 1987).
The hospitalized children’s arithmetic mean aluminum-based soil ingestion estimate was 56 mg/day; titanium-based estimates included estimates for three of the six children that exceeded 1,000 mg/day, with the remaining three children in the range of 28 to 58 mg/day (see Table 5-19). AIR measurements were not reported for the hospitalized children. Using the LTM method, the mean soil ingestion rate was estimated to be 49 mg/day with a population standard deviation of 22 mg/day (range 26 to 84 mg/day). The geometric mean soil ingestion rate was 45 mg/day. The hospitalized children’s data suggested a major nonsoil source of titanium for some children and a background nonsoil source of aluminum. However, conditions specific to hospitalization (e.g., medications) were not considered.
Clausing et al. (1987) estimated that the average soil ingestion of the nursery school children was 56 mg/day, after subtracting the mean LTM soil ingestion for the hospitalized children (49 mg/day) from the nursery school children’s mean LTM soil ingestion (105 mg/day), to account for background tracer intake from dietary and other nonsoil sources.
5.3.4.11. Van Wïjnen et al. (1990)—Estimated Soil Ingestion by Children
In a tracer element study by Van Wïjnen et al. (1990), soil ingestion among Dutch children ranging in age from 1 to 5 years was evaluated using a tracer element methodology. Van Wïjnen et al. (1990) measured three tracers (titanium, aluminum, and AIR) in soil and feces. The authors estimated soil ingestion based on the LTM, which assumed that soil
Update for Chapter 5 of the Exposure Factors Handbook
Chapter 5—Soil and Dust Ingestion
September 2017 Page 5-26
ingestion could not be higher than the lowest value of the three tracers. LTM values represented soil ingestion estimates that were not corrected for dietary intake. Recoveries for aluminum and titanium from soil materials mixed with fecal samples were 94 and 97%, respectively.
An average daily feces dry weight of 15 grams was assumed. A total of 292 children attending daycare centers were studied during the first of two sampling periods and 187 children were studied in the second sampling period; 162 of these children were studied during both periods (i.e., at the beginning and near the end of the summer of 1986). A total of 78 children were studied at campgrounds. Soil samples were sieved through a 2-mm mesh. The authors reported geometric mean LTM values because soil ingestion rates were found to be skewed and the log-transformed data were approximately normally distributed. Geometric mean LTM values were estimated to be 111 mg/day for children in daycare centers and 174 mg/day for children vacationing at campgrounds (see Table 5-20). For the 162 daycare center children studied during both sampling periods the arithmetic mean LTM was 162 mg/day, and the median was 114 mg/day. For the 78 children at the campgrounds, the overall arithmetic mean LTM was 213 mg/day and the median was 160 mg/day.
Fifteen hospitalized children were studied and used as a control group. These children’s LTM soil ingestion estimates were 74 (geometric mean), 93 (mean), and 110 (median) mg/day. The authors assumed the hospitalized children’s soil ingestion estimates represented dietary intake of tracer elements, and used rounded 95% confidence limits on the arithmetic mean, 70 to 120 mg/day (midpoint 95 mg/day), to correct the daycare and campground children’s LTM estimates for dietary intake of tracers. Although the authors suggested that corrections should be made to the soil ingestion values obtained from the daycare and campground subjects by subtracting values obtained from the hospitalized children (i.e., background), they do not appear to have made these adjustments to the arithmetic means. These corrections would result in soil ingestion rates of 67 mg/day (162 mg/day minus 95 mg/day) for daycare children and 118 mg/day (213 mg/day minus 95 mg/day) for campers. Van Wïjnen et al. (1990) showed corrected geometric mean soil ingestion to range from 0 to 90 mg/day, with a 90th percentile value of up to 190 mg/day for the various age categories within the daycare group and 30 to 200 mg/day, with a 90th percentile value of up to 300 mg/day for the various age categories within the camping group.
AIR was the limiting tracer in about 80% of the samples. Among children attending daycare centers, soil ingestion was also found to be higher when the weather was good (i.e., <2 days/week precipitation) than when the weather was bad (i.e., >4 days/week precipitation) (see Table 5-21).
5.3.4.12. Calabrese et al. (1990)—Preliminary Adult Soil Ingestion Estimates: Results of a Pilot Study
Calabrese et al. (1990) studied six adults to evaluate the extent to which they ingest soil. This adult study was originally part of the children soil ingestion study (Calabrese et al., 1989) and was used to validate part of the analytical methodology used in the children’s study. The participants were six healthy adults, three males and three females, 25−41 years old. Each volunteer ingested one empty gelatin capsule at breakfast and one at dinner Monday, Tuesday, and Wednesday during the first week of the study. During the second week, they ingested 50 mg of sterilized soil within a gelatin capsule at breakfast and at dinner (a total of 100 mg of sterilized soil per day) for 3 days. For the third week, the participants ingested 250 mg of sterilized soil in a gelatin capsule at breakfast and at dinner (a total of 500 mg of soil per day) during the 3 days. Duplicate meal samples (food and beverage) were collected from the six adults. The sample included all foods ingested from breakfast Monday, through the evening meal Wednesday during each of the 3 weeks. In addition, all medications and vitamins ingested by the adults were collected. Total excretory output was collected from Monday noon through Friday midnight over three consecutive weeks.
Data obtained from the first week, when empty gelatin capsules were ingested, were used to estimate soil intake by adults. On the basis of recovery values, aluminum, silicon, yttrium, and zirconium were considered the most valid tracers. The mean values for these four tracers were: aluminum, 110 mg/day; silicon, 30 mg/day; yttrium, 63 mg/day; and zirconium, 134 mg/day. A limitation of this study is the small sample size. Thus, this study was classified as relevant.
5.3.4.13. Cooksey (1995)—Pica and Olfactory Craving of Pregnancy: How Deep Are the Secrets?
Postpartum interviews were conducted between 1992 and 1994 of 300 women at a mid-western hospital, to document their experiences of pica behavior. The majority of women were Black and low-income, and ranged in age from 13 to 42 years.
Update for Chapter 5 of the Exposure Factors Handbook
Chapter 5—Soil and Dust Ingestion
September 2017 Page 5-27
In addition to questions regarding nutrition, each woman was asked if during her pregnancy she experienced a craving to eat ice or other things that are not food.
Of the 300 women, 194 (65%) described ingesting one or more pica substances during their pregnancy, and the majority (78%) ate ice/freezer frost alone or in addition to other pica substances. Reported quantities of items ingested on a daily basis were three to four 8-pound bags of ice, two to three boxes of cornstarch, two cans of baking powder, one cereal bowl of dirt, five quarts of freezer frost, and one large can of powdered cleanser.
5.3.4.14. Smulian et al. (1995)—Pica in a Rural Obstetric Population
In 1992, Smulian et al. (1995) conducted a survey response study of pica in a convenience sample of 125 pregnant women in Muscogee County, GA, who ranged in age from 12 to 37 years. Of these, 73 were Black, 47 were White, 4 were Hispanic, and 1 was Asian. Interviews were conducted at the time of the first prenatal visit, using nondirective questionnaires to obtain information regarding substances ingested as well as patterns of pica behavior and influences on pica behavior. Only women ingesting nonfood items were considered to have pica. Ingestion of ice was included as a pica behavior only if the ice was reported to be ingested multiple times per day, if the ice was purchased solely for ingestion, or if the ice was obtained from an unusual source such as freezer frost.
The overall prevalence of pica behavior in this study was 14.4% (18 of 125 women), and was highest among Black women (17.8%). There was no significant difference between groups with respect to age, race, weight, or gestational age at the time of enrollment in the study. The most common form of pica was ice eating (pagophagia), reported by 44.4% of the patients. Nine of the women reported information on the frequency and amount of the substances they were ingesting. Of these women, 66.7% reported daily consumption and 33.3% reported pica behavior three times per week. Soap, paint chips, or burnt matches were reportedly ingested 3 days per week. One patient ate ice 60 times per week. Women who ate dirt or clay reported ingesting 0.5−1 pound per week. The largest amount of ice consumed was five pounds per day.
5.3.4.15. Grigsby et al. (1999)—Chalk Eating in Middle Georgia: A Culture-Bound Syndrome of Pica?
Grigsby et al. (1999) investigated the ingestion of kaolin, also known as white dirt, chalk, or white clay, in the central Georgia Piedmont area as a culture-bound syndrome. A total of 21 individuals who consumed kaolin at the time or had a history of consuming kaolin were interviewed, using a seven-item, one-page interview protocol. All of those interviewed were Black, ranging in age from 28 to 88 years (mean age of 46.5 years), and all were female except for one.
Reasons for eating kaolin included liking the taste, being pregnant, craving it, and to gain weight. Eight respondents indicated that they obtained the kaolin from others, five reported getting it directly from the earth, four purchased it from a store, and two obtained it from a kaolin pit mine. The majority of the respondents reported that they liked the taste and feel of the kaolin as they ate it. Only three individuals reported knowing either males or White persons who consumed kaolin. Most individuals were not forthcoming in discussing their ingestion of kaolin and recognized that their behavior was unusual.
The study suggests that kaolin-eating is primarily practiced by Black women who were introduced to the behavior by family members or friends, during childhood or pregnancy. The authors concluded that kaolin ingestion is a culturally transmitted form of pica, not associated with any other psychopathology. Although information on kaolin eating habits and attitudes were provided by this study, no quantitative information on consumption was included, and the sample population was small and nonrandom.
5.3.4.16. Ward and Kutner (1999)—Reported Pica Behavior in a Sample of Incident Dialysis Patients
Structured interviews were conducted with a sample of 226 dialysis patients in the metropolitan Atlanta, GA area from September 1996 to September 1997. Interviewers were trained in nutrition data collection methods, and patients also received a 3-day diet diary that they were asked to complete and return by mail. If a subject reported a strong past or current food or nonfood craving, a separate form was used to collect information to determine whether this was a pica behavior.
Pica behavior was reported by 37 of the dialysis patients studied (16%), and most of these patients (31 of 37) reported that they were currently practicing some form of pica behavior. The patients’
Update for Chapter 5 of the Exposure Factors Handbook
Chapter 5—Soil and Dust Ingestion
September 2017 Page 5-28
race and sex were significantly associated with pica behavior, with Black patients and women making up 86% and 84% of those reporting pica, respectively. Those reporting pica behavior were also younger than the remainder of the sample, and two patients described a persistent craving for ice. Other pica items reportedly consumed included starch, dirt, flour, or aspirin.
5.3.4.17. Simpson et al. (2000)—Pica During Pregnancy in Low-Income Women Born in Mexico
Simpson et al. (2000) interviewed 225 Mexican-born women, aged 18−42 years (mean age of 25 years), using a questionnaire administered in Spanish. Subjects were recruited by approaching women in medical facilities that served low-income populations in the cities of Ensenada, Mexico (N = 75), and Santa Ana, Bakersfield and East Los Angeles, CA (N = 150). Criteria for participation were that the women had to be Mexican-born, speak Spanish as their primary language, and be pregnant or have been pregnant within the past year. Only the data for the women in the United States are included in this handbook.
Pica behavior was reported in 31% of the women interviewed in the United States. Table 5-22 shows the items ingested and the number of women reporting the pica behavior. Of the items ingested, only ice was said to be routinely eaten outside of pregnancy, and was only reported by U.S. women, probably because none of the low-income women interviewed in Mexico owned a refrigerator. Removing the 12 women who reported eating only ice from the survey lowers the percentage of U.S. women who reported pica behavior to 23%. Women said they engaged in pica behavior because of the taste, smell, or texture of the items, for medicinal purposes, or because of advice from someone, and one woman reported eating clay for religious reasons. Magnesium carbonate, a pica item not found to be previously reported in the literature, was reportedly consumed by 17% of women. The amount of magnesium carbonate ingested ranged from a quarter of a block to five blocks per day; the blocks were approximately the size of a 35-mm film box. No specific quantity information on the amounts of pica substances ingested was provided in the study.
5.3.4.18. Obialo et al. (2001)—Clay Pica Has No Hematologic or Metabolic Correlate to Chronic Hemodialysis Patients
A total of 138 dialysis patients at the Morehouse School of Medicine, Atlanta, GA, were interviewed about their unusual cravings or food habits. The patients were Black and ranged in age from 37 to 78 years. Obialo et al. (2001) suggested that the stress caused by end-stage renal disease may provide a stimulus for pica, especially for those with cultural predispositions.
Thirty of the patients (22%) reported some form of pica behavior, while 13 patients (9.4%) reported clay pica. The patients with clay pica reported daily consumption of 225−450 g of clay.
5.3.4.19. Klitzman et al. (2002)—Lead Poisoning among Pregnant Women in New York City: Risk Factors and Screening Practices
Klitzman et al. (2002) interviewed 33 pregnant women whose blood lead levels were >20 µg/dL as reported to the New York City Department of Health between 1996 and 1999. The median age of the women was 24 years (range of 15 to 43 years), and the majority were foreign born. The women were interviewed regarding their work, reproductive, and lead exposure history. A home visit was also conducted and included a visual inspection and a colorimetric swab test; consumable items suspected to contain lead were sent to a laboratory for analysis.
Thirteen women (39%) reported pica behavior during their current pregnancies. Of these, 10 reported eating soil, dirt, or clay; 2 reported pulverizing and eating pottery; and 1 reported eating soap. One of the women reported eating approximately one quart of dirt daily from her backyard for the past three months. No other quantity data were reported.
5.3.4.20. Doyle et al. (2012)—A Soil Ingestion Pilot Study of a Population Following a Traditional Lifestyle Typical of Rural or Wilderness Areas
Doyle et al. (2012) conducted a pilot study to estimate soil ingestion among a Canadian Aboriginal community living in a wilderness area. The study was conducted over a 3-week period during 2011 in the Nemiah Valley of British Columbia. The study was conducted on traditional lands in cooperation with the Xeni Gwet’in First Nation. Seven adults were recruited, and four of these adults were members of the Xeni Gwet’in community. During the study, the subjects participated in traditional
Update for Chapter 5 of the Exposure Factors Handbook
Chapter 5—Soil and Dust Ingestion
September 2017 Page 5-29
daily activities (e.g., fishing, clearing, scouting, hiking, cutting firewood, etc.). Soil ingestion was estimated using a mass balance tracer methodology. The tracers used for this study were aluminum, barium, cerium, lanthanum, manganese, silicon, thorium, titanium, uranium, vanadium, yttrium, and zirconium. Daily soil ingestion was calculated for each subject based on tracer concentrations in fecal and soil samples, assuming a 24-hour transit time. Soil ingestion rates were corrected for tracers ingested via the diet and in medications. Participants recorded their food and medicine intake in daily logs. Soil, food, water, and fecal samples were analyzed at a commercial laboratory.
Soil ingestion rates calculated for the four most reliable tracers (aluminum, cerium, lanthanum, silicon) are shown in Table 5-23. The most reliable tracers were considered those that are poorly absorbed in the gastrointestinal tract and those with the lowest food:soil ratios. For all four tracers combined, the mean, median, and 90th percentile soil ingestion rates were 75, 50, and 211 mg/day, respectively. This study provides quantitative soil ingestion estimates for an adult Canadian population following a traditional wilderness lifestyle. However, as a pilot study, the sample population was very small, and is not expected to be representative of the U.S. population.
5.3.4.21. Irvine et al. (2014)—Soil Ingestion Rate Determination in a Rural Population in Alberta, Canada Practicing a Wilderness Lifestyle
Irvine et al. (2014) estimated soil ingestion rates among a group of First Nations people inhabiting a wilderness area of Alberta, Canada using the mass balance tracer method. The study was conducted over a 3-week period in August 2012. Nine adults within the Cold Lake First Nations Reserve who practiced traditional activities (e.g., hunting, fishing, and gathering) participated in the study. The tracers used for this study were aluminum, barium, cerium, lanthanum, manganese, silicon, thorium, titanium, uranium, vanadium, yttrium, and zirconium. Soil were sieved into multiple particle size fractions to separate soil particles of <63 µm. Daily soil ingestion was calculated for each subject based on tracer concentrations in fecal and soil samples. A 24-hour transit time was assumed, and soil ingestion rates were corrected for tracers ingested via the diet. Four tracers were considered to be the most reliable (aluminum, cerium, lanthanum, and silicon) because of their low food:soil ratios, but aluminum and silicon had lower coefficients of variance. Table 5-24
provides the estimated soil ingestion rates based on aluminum and silicon, and on all four of the most reliable tracers (aluminum, cerium, lanthanum, and silicon combined). Mean soil ingestion rates for these tracers ranged from 32 to 68 mg/day for this adult population; 90th percentile values ranged from 152 to 231 mg/day. This study provides quantitative soil ingestion estimates for an adult Canadian population following a traditional wilderness lifestyle. However, as a pilot study, the sample population was very small, and is not expected to be representative of the U.S. population.
5.3.4.22. Lumish et al. (2014)—Gestational Iron Deficiency is Associated with Pica Behaviors in Adolescents
Lumish et al. (2014) examined pica behavior and iron status among 158 pregnant adolescents (<18 years of age) receiving prenatal care at a health clinic in Rochester, NY in 2006−2009. The women were mostly African-American (two-thirds) and about 25% were Hispanic. At each visit, the women were asked whether they craved any nonfood items, and were asked to provide detailed information on the items that they craved or ate. A total of 18 different items were reported to have been ingested, including: ice; raw starches (flour and cornstarch); powder (dust, vacuum powder from vacuum cleaner bags, and baby powder); soap (soap, bar soap, laundry soap, and powdered cleansers); plastic/foam (stuffing from pillows/sofas and sponges); paper (writing paper, toilet paper, and tissues); baking soda/powder; and other (dirt and chalk). Overall, 46% of the teens reported ingesting one or more of these items. Ice was the nonfood item most often consumed (37% of all the pregnant adolescents), while only 1.3% of the teens reported ingestion of dirt/chalk. Lumish et al. (2014) also observed that a significantly larger proportion of African-American teens reported pica behavior than Caucasian teens. This study provides prevalence data for a population of pregnant adolescents. These data may not be entirely representative of the U.S. population as a whole or of pregnant women in general. Also, the study provides prevalence data only. No information on the quantity of substance ingested is provided.
5.3.4.23. Jang et al. (2014)—General Factors of the Korean Exposure Factors Handbook
Jang et al. (2014) reported on a soil ingestion study that was conducted in Seoul, South Korea. Feces samples were collected from 63 children, ages 0 to 7 years and analyzed for the following tracer elements: aluminum, barium, manganese, silicon,
Update for Chapter 5 of the Exposure Factors Handbook
Chapter 5—Soil and Dust Ingestion
September 2017 Page 5-30
titanium, vanadium, yttrium, and zirconium. Soil samples collected from the areas where the children spent most of their time were analyzed for the same tracer elements. Five children who spent no time outdoors were used as controls to account for exposures to tracer elements from sources other than soil (e.g., food, medicine). Using the LTM, aluminum was used to estimate soil ingestion rates. Jang et al. (2014) reported that, after adjusting for the environmental background levels based on the control group, the estimated arithmetic mean soil ingestion rate was 118 mg/day, and the geometric mean was 29 mg/day. The 90th percentile value was 286 mg/day and the 95th percentile value was 898 mg/day. This study provides quantitative data for a study population in South Korea. While it does not appear that tracer elements in food or medicines were accounted for, a control population was used to adjust for exposures from sources other than soil. A limitation of this study is that the study population may not be representative of children in the United States.
5.3.4.24. Chien et al. (2015)—Soil Ingestion Rates for Children under 3 Years Old in Taiwan
Chien et al. (2015) conducted a soil ingestion tracer study of 66 children (33 boys and 33 girls) under 3 years of age recruited from health centers from northern, central, southern, and eastern Taiwan from May 2011 to November 2012. Duplicate 24-hour food and liquid samples were collected for each child on Day one. All feces were collected beginning on Day 2 through Day 4 of the study. Diapers were collected for those children who wore diapers and feces were removed in the laboratory. Urine samples were not collected. Outdoor soil samples from the top 0‒5 cm of soil were collected from typical play areas. Household dust samples were collected from the living room, bedroom, and kitchen floors using a handheld vacuum cleaner. Both soil and household dust samples were sieved using a 100-mesh (150 µm; ASTM, 2017) screen. Samples were analyzed for titanium and silicon. Soil ingestion rates were calculated using Equation 5-7 adapted from Davis and Mirick (2006).
𝑆𝑆𝑖𝑖,𝑖𝑖 = �𝐴𝐴𝑓𝑓−𝐴𝐴𝑓𝑓𝑓𝑓𝑓𝑓𝑓𝑓𝐸𝐸𝑠𝑠𝑓𝑓𝑠𝑠𝑠𝑠
� (Eqn. 5-8)
where:
Si,e = amount of soil ingested (mg/day)
Af = daily concentration of tracer element in the feces (μg/day)
Afood = daily concentration of tracer element in the foods (μg/day)
Esoil = concentration of tracer elements in soils (g/kg)
The following equation was used to adjust the daily fecal tracer concentration to account for missing fecal samples.
𝐴𝐴𝑓𝑓 = �𝐶𝐶𝑓𝑓,2 ×𝐷𝐷𝐷𝐷𝑓𝑓,2
𝐷𝐷𝐷𝐷𝑓𝑓,2 + 𝐷𝐷𝐷𝐷𝑓𝑓,3 + 𝐷𝐷𝐷𝐷𝑓𝑓,4+ 𝐶𝐶𝑓𝑓,3
×𝐷𝐷𝐷𝐷𝑓𝑓,3
𝐷𝐷𝐷𝐷𝑓𝑓,2 + 𝐷𝐷𝐷𝐷𝑓𝑓,3 + 𝐷𝐷𝐷𝐷𝑓𝑓,4+ 𝐶𝐶𝑓𝑓,4
×𝐷𝐷𝐷𝐷𝑓𝑓,4
𝐷𝐷𝐷𝐷𝑓𝑓,2 + 𝐷𝐷𝐷𝐷𝑓𝑓,3 + 𝐷𝐷𝐷𝐷𝑓𝑓,4�
× 𝐷𝐷𝐷𝐷𝑓𝑓,𝑎𝑎𝑎𝑎𝑖𝑖
(Eqn. 5-9) where:
Cf,2 = concentration of tracer element in the feces on Day 2 (μg/day)
Cf,3 = concentration of tracer element in the feces on Day 3 (μg/day)
Cf,4 = concentration of tracer element in the feces on Day 4 (μg/day)
DWf,2 = dry weight of the feces on Day 2 (g) DWf,3 = dry weight of the feces on Day 3 (g) DWf,4 = dry weight of the feces on Day 4 (g) DWf,ave = average dry weight of the feces on
Day 2 through Day 4 (g)
Activity pattern data were also collected by videotaping each child for 2 hours and by administering a questionnaire to parents or caregivers. Most of the children spent more than four times a week outdoors. About half of the children spent under one hour a day outdoors. Children washed their hands and took a bath or shower an average of 3.98 and 1.24 times a day, respectively.
Recoveries for the analyses were 100 ± 20%. The soil intake rates ranged from 0‒82.6 mg/day for silicon and 36.4−1,850 mg/day for titanium, with an average of 9.6 mg/day (SD = 19.2 mg/day) and 957.1 mg/day (SD = 477 mg/day) for silicon and titanium, respectively (Chien et al., 2015). These estimates excluded children with soil intake rates that were considered outliers. Negative soil intake rate values were replaced by 0 mg/day in the
Update for Chapter 5 of the Exposure Factors Handbook
Chapter 5—Soil and Dust Ingestion
September 2017 Page 5-31
estimation of the average soil intake rates. Soil intake rates based on silicon were positively correlated with the total hand-to-mouth frequency for both indoors and outdoors. Soil intake rates for children with hand-to-mouth contact ≥15 contacts/hr was estimated to be 15.9 mg/day compared to 5.46 mg/day for children with <15 contacts/hour. Soil intake rates were also statistically significantly greater for children with higher hand washing frequency (≥4 events/day, mean = 17.4 mg/day) compared to children with less hand washing frequency (<4 events/day, mean = 5.6 mg/day). While not suggested as an explanation for this observation by Chien et al. (2015), this may due to re-loading of soil on hands and subsequent ingestion. Chien et al. (2015) found no significant difference between children’s age and gender and the estimated soil intake rates. The authors stated that titanium may not be a suitable tracer for estimating soil intake rates in the study because other sources of titanium were not considered, including: peeling paint chips, toothpaste, and candy. They also noted that soil intake rates estimated in this study are lower than those in the United States. This may be due to several factors. The authors stated that dust loadings in the Taiwanese homes are lower than those in U.S. homes. As in most other Asian countries, the Taiwanese remove their shoes before entering the house, therefore, reducing the amount of household dust. The authors also found that the cleaning frequency in the study homes was higher than those found in studies performed in the United States. This study found correlations between soil intake rates and hand-to-mouth frequency behavior. The results, however, may not be representative of children’s behavior in the United States. Another limitation is that the sources of tracer elements, other than food, were not accounted for in estimating of soil intake rates.
5.3.4.25. Wang et al. (2015)—Quantification of Soil/Dust (SD) on the Hands of Children from Hubei Province, China Using Hand Wipes
Wang et al. (2015) estimated soil and dust ingestion for three age ranges of children: kindergarten (ages 3 to <7 years), primary school (7 to <13 years), and middle school (13 to <17 years) in Hubei Province in Central China. Hand wipe samples and background area soil samples were both analyzed for three tracer elements (cerium, vanadium, and yttrium). Age-specific estimates of soil/dust adhering to the hands (in mg) were calculated as the amount of tracer element on the
hand (in ng) divided by the amount of tracer element in the soil (in mg/kg). Based on the three tracer elements, the amount of soil/dust on the hands was estimated to range from 0.59–0.64 ng for kindergarten-aged children, 1.42–1.64 ng for primary school children, and 1.04–1.52 ng for middle school children. Wang et al. (2015) used these hand soil/dust estimates, along with assumptions about the number of hand-to-mouth contacts that occur over a 12-hour period, the proportion of the hand area that contacts the mouth, and the efficiency at which soil/dust is transferred from the hand to the mouth to estimate soil/dust ingestion rates. Hand-to-mouth contact was assumed to occur 15, 7, and 2 times per hour for kindergarten, primary, and middle school children, respectively. The proportion of the hand that contacts the mouth was assumed to be 0.1 (10%), and the transfer efficiency was assumed to be 0.159. The mean rates of hand soil/dust ingestion were estimated to be 1.79, 2.12, and 0.49 mg/day for kindergarten, primary, and middle school children, respectively. This study provides a novel method for estimating the amount of hand soil/dust ingested. However, these soil/dust ingestion estimates do not account for soil/dust ingested from other pathways (e.g., object-to-mouth contact, food-to-soil contact), and the population evaluated in this study may not be representative of the U.S. population. Additional limitations relate to the uncertainties associated with the input parameters for estimating soil/dust intake (e.g., transfer efficiency, proportion of the hand contacting the mouth).
5.3.4.26. Lin et al. (2015)—Pica during Pregnancy among Mexican-Born Women: A Formative Study
Lin et al. (2015) formed nine focus groups involving 76 Mexican-born pregnant or ≤2-year postpartum women. Three of the focus groups were in central California (N = 23), and six were held in Mexico (N = 53). The aim of the focus group discussions was to obtain information on the frequency and types of pica behavior among the women. Pica was defined as “eating items that were not food.” Among the women in the California focus group, 10 (43%) indicated that they had engaged in pica, and 6 (60%) of these women reported pica behavior during pregnancy. Among the Mexican focus group, 18 (34%) reported engaging in pica, and 16 (80%) of these women reported engaging in pica during pregnancy. Commonly eaten items were earth, bean stones, and adobe. Among the California group, 5 (22%) had eaten earth. Among the Mexican
Update for Chapter 5 of the Exposure Factors Handbook
Chapter 5—Soil and Dust Ingestion
September 2017 Page 5-32
group, 6 (11%) had eaten earth. Some women discussed their pica behavior in the context of micronutrient deficiencies, or perceived health consequences of unfulfilled cravings. This study provides information on the pica behavior for Mexican-born women living in the United States and Mexico. However, this population may not be representative of the general population of the United States. Also, the study provides prevalence data only. Data on the quantity of pica substances ingested are not provided.
5.3.4.27. Ma et al. (2016)—Estimation of the Daily Soil/Dust (SD) Ingestion Rate of Children from Gansu Province, China via Hand-to-Mouth Contact Using Tracer Elements
Ma et al. (2016) estimated soil and dust ingestion among 60 children between the ages of 3 and 12 years in the Gansu Province of China. An activity pattern modeling approach was used to estimate the soil and dust ingestion from hand-to-mouth contact using the following equation:
IRhandSD = TAhandSD × TE × SAC × EF (Eqn. 5-10)
where:
IRhandSD = daily ingestion of soil and dust from hands (mg/day)
TAhandSD = theoretical amount of hand soil and dust (mg)
TE = transfer efficiency at each contact SAC = proportion of the hand surface area
contacting the mouth at each event EF = frequency of contact in a day (day−1)
The amount of soil on the hands was estimated by collecting two hand wipes from each child (one in the morning and one in the afternoon), and analyzing them for three tracer elements (cerium, yttrium, and vanadium). Background levels of these tracers were also measured in soil samples from the Gansu Province. Using these data, the amount of soil and dust on the children’s hands (TASD) was estimated as follows:
TASD = Ctracer-hands / Ctracer-soil (Eqn. 5-11)
where:
Ctracer-hands = the amount of tracer on the hands (ng)
Ctracer-soil = the amount of tracer in background soil (mg/kg)
Transfer efficiency (TE) was assumed to be 0.159, based on a study by Kissel et al. (1998b), the proportion of the hand surface contacting the mouth per event was assumed to be 0.1, and the frequency of contact (EF) was assumed to be 15 and 7 contacts/hour, for kindergarten and primary school children, respectively, over a 12-hour exposure period. The estimated mean soil and dust ingestion rates from hand-to-mouth contact ranged from 6 to 10 mg/day and 95th percentile rates ranged from 12 to 18 mg/day.
The estimates provided by Ma et al. (2016) are based on various assumptions related to hand-to-mouth exposure (i.e., surface areas of the hand contacted, transfer efficiency, the number of contacts per day), which introduce a certain degree of uncertainty. The amount of soil on the hands was based on measurements of three tracers (i.e., cerium, yttrium, and vanadium) from hand wipe samples, which the authors believed to “more accurately estimate the amounts of [soil and dust] on the hands” than simply weighing the hand wipes before and after wiping the children’s hands because other substances such as grease and other organic ingredients are eliminated. The estimates account for soil and dust ingestion from hand-to-mouth contact only, and the population of children studied may not be representative of children in the United States.
5.3.5. Relevant Studies of Secondary Analysis and Other Relevant Information
The following studies are classified as relevant rather than key. This section includes studies of secondary analysis using the three methodologies discussed in Section 5.3.1, and data on the prevalence of the soil ingestion behavior. The secondary analysis literature on soil and dust ingestion rates also gives important insights into methodological strengths and limitations of the studies. These methodological issues include attempts to determine the origins of apparent positive and negative bias in the methodologies, including: food input/fecal output misalignment; missed fecal samples; assumptions about the weight of children’s feces; particle sizes of, and relative contributions of soils and dusts to total soil and dust ingestion; and attempts to identify a “best” tracer
Update for Chapter 5 of the Exposure Factors Handbook
Chapter 5—Soil and Dust Ingestion
September 2017 Page 5-33
element or combination of tracer elements. The secondary analysis literature also provides insights into the data needs for assessing soil and dust ingestion using activity pattern approaches. Potential error from using short-term-study estimates for long-term soil and dust ingestion behavior estimates is also discussed.
5.3.5.1. Wong (1988)—The Role of Environmental and Host Behavioral Factors in Determining Exposure to Infection with Ascaris lumbricoides and Trichuris trichiura/Calabrese and Stanek (1993)―Soil Pica: Not a Rare Event
Calabrese and Stanek (1993) reviewed a tracer element study conducted by Wong (1988) to estimate the amount of soil ingested by two groups of children. Wong (1988) studied a total of 52 children in two government institutions in Jamaica. The younger group included 24 children with an average age of 3.1 years (range of 0.3 to 7.5 years). The older group included 28 children with an average age of 7.2 years (range of 1.8 to 14 years). One fecal sample was collected each month from each subject over the 4-month study period. The amount of silicon in dry feces was measured to estimate soil ingestion.
An unspecified number of daily fecal samples were collected from a hospital control group of 30 children with an average age of 4.8 years (range of 0.3 to 12 years). Dry feces were observed to contain 1.45% silicon, or 14.5 mg Si per gram of dry feces. This quantity was used to correct measured fecal silicon from dietary sources. Fecal silicon quantities greater than 1.45% in the 52 studied children were interpreted as originating from soil ingestion.
For the 28 children in the older group, soil ingestion was estimated to be 58 mg/day, based on the mean minus one outlier, and 1,520 mg/day, based on the mean of all the children. The outlier was a child with an estimated average soil ingestion rate of 41,000 mg/day (41 g/day) over the 4 months.
Estimates of soil ingestion were higher in the younger group of 24 children. The mean soil ingestion of all the children was 470 ± 370 mg/day. Due to some sample losses, of the 24 children studied, only 15 had samples for each of the 4 months of the study. Over the entire 4-month study period, 9 of 84 samples (or 10.5%) yielded soil ingestion estimates in excess of 1 g/day.
Of the 52 children studied, 6 had 1-day estimates of more than 1,000 mg/day. Table 5-25 shows the
estimated soil ingestion for these six children. The article describes 5 of 24 (or 20.8%) in the younger group of children as having a >1,000 mg/day estimate on at least one of the four study days; in the older group one child is described in this manner. A high degree of daily variability in soil ingestion was observed among these six children; three showed soil pica behavior on 2, 3, and 4 days, respectively, with the most consistent (4 out of 4 days) soil pica child having the highest estimated soil ingestion, 3.8 to 60.7 g/day.
5.3.5.2. Calabrese and Stanek (1992b)—What Proportion of Household Dust is Derived from Outdoor Soil?
Calabrese and Stanek (1992b) estimated the amount of outdoor soil in indoor dust using statistical modeling. The model used soil and dust data from the 60 households that participated in the Calabrese et al. (1989) study, by preparing scatter plots of each tracer’s concentration in soil versus dust. Correlation analysis of the scatter plots was performed. The scatter plots showed little evidence of a consistent relationship between outdoor soil and indoor dust concentrations. The model estimated the proportion of outdoor soil in indoor dust using the simplifying assumption that the following variables were constants in all houses: the amount of dust produced every day from both indoor and outdoor sources, the proportion of indoor dust due to outdoor soil, and the concentration of the tracer element in dust produced from indoor sources. Using these assumptions, the model predicted that 31.3% by weight of indoor dust came from outdoor soil. This model was then used to adjust the soil ingestion estimates from Calabrese et al. (1989).
5.3.5.3. Stanek and Calabrese (1995b)—Daily Estimates of Soil Ingestion in Children
Stanek and Calabrese (1995b) presented a methodology that links the physical passage of food and fecal samples to construct daily soil ingestion estimates from daily food and fecal trace-element concentrations. Soil ingestion data for children obtained from the Amherst study (Calabrese et al., 1989) were reanalyzed by Stanek and Calabrese (1995b). A lag period of 28 hours between food intake and fecal output was assumed for all respondents. Day 1 for the food sample corresponded to the 24-hour period from midnight on Sunday to midnight on Monday of a study week; Day 1 of the fecal sample corresponded to the 24-hour period from noon on Monday to noon on Tuesday. Based on these definitions, the food soil
Update for Chapter 5 of the Exposure Factors Handbook
Chapter 5—Soil and Dust Ingestion
September 2017 Page 5-34
equivalent was subtracted from the fecal soil equivalent to obtain an estimate of soil ingestion for a trace element. A daily overall ingestion estimate was constructed for each child as the median of trace element values remaining after tracers falling outside of a defined range around the overall median were excluded.
Table 5-26 presents adjusted estimates, modified according to the input/output misalignment correction, of mean daily soil ingestion per child (mg/day) for the 64 study participants. The approach adopted in this paper led to changes in ingestion estimates from those presented in Calabrese et al. (1989).
Estimates of children’s soil ingestion projected over a period of 365 days were derived by fitting log-normal distributions to the overall daily soil ingestion estimates using estimates modified according to the input/output misalignment correction (see Table 5-27). The estimated median value of the 64 respondents' daily soil ingestion averaged over a year was 75 mg/day, while the 95th percentile was 1,751 mg/day. In developing the 365-day soil ingestion estimates, data that were obtained over a short period of time (as is the case with all available soil ingestion studies) were extrapolated over a year. The 2-week study period may not reflect variability in tracer element ingestion over a year. This study was classified as relevant because, while Stanek and Calabrese (1995b) attempted to address the variability through modeling of the long-term ingestion, new uncertainties were introduced through the parametric modeling of the limited subject day data.
5.3.5.4. Calabrese et al. (1996)—Methodology to Estimate the Amount and Particle Size of Soil Ingested by Children: Implications for Exposure Assessment at Waste Sites
Calabrese et al. (1996) examined the hypothesis that one cause of the variation between tracers seen in soil ingestion studies could be related to differences in soil tracer concentrations by particle size. This study, published before the Calabrese et al. (1997a) primary analysis study results, used laboratory analytical results for the Anaconda, MT soil’s tracer concentration after it had been sieved to a particle size of <250 µm in diameter (it was sieved to <2 mm soil particle size in Calabrese et al. [1997a]). The smaller particle size was examined based on the assumption that children principally ingest soil of small particle size adhering to fingertips and under fingernails. For five of the tracers used in the original study (aluminum, silicon,
titanium, yttrium, and zirconium), soil concentration was not changed by particle size. However, the soil concentrations of three tracers (lanthanum, cerium, and neodymium) were increased 2- to 4-fold at the smaller soil particle size. Soil ingestion estimates for these three tracers were decreased by approximately 60% at the 95th percentile compared to the Calabrese et al. (1997a) results.
5.3.5.5. Stanek et al. (1999)—Soil Ingestion Estimates for Children in Anaconda Using Trace Element Concentrations in Different Particle Size Fractions
Stanek et al. (1999) extended the findings from Calabrese et al. (1996) by quantifying trace element concentrations in soil based on sieving to particle sizes of 100−250 µm and to particle sizes of 53 to <100 µm. The earlier study (Calabrese et al., 1996) used particle sizes of 0−2 µm and 1−250 µm. This study used the data from soil concentrations from the Anaconda, MT site reported by Calabrese et al. (1997a). Results of the study indicated that soil concentrations of aluminum, silicon, and titanium did not increase at the two finer particle size ranges measured. However, soil concentrations of cerium, lanthanum, and neodymium increased by a factor of 2.5 to 4.0 in the 100−250 µm particle size range when compared with the 0−2 µm particle size range. There was not a significant increase in concentration in the 53−100 µm particle size range.
5.3.5.6. Stanek and Calabrese (2000)—Daily Soil Ingestion Estimates for Children at a Superfund Site
Stanek and Calabrese (2000) reanalyzed the soil ingestion data from the Anaconda study (Calabrese et al., 1997a) to provide estimates of variability between days and subjects, and daily soil ingestion rates over a longer period. Stanek and Calabrese (2000) attempted to address several sources of uncertainties in this reanalysis including identification of outliers and the estimation of soil ingestion rates based on particle size of <250 µm. Tracer-specific soil ingestion rates were estimated for 8 tracer elements for up to 7 subject days for each of the 64 children. The mean and median values were estimated for all tracers for each day, and median and mean estimates were generated over all subject days. Table 5-28 summarizes these soil ingestion estimates.
Assuming a log-normal distribution for the soil ingestion estimates in the Anaconda study, average long-term soil ingestion rates were predicted for children for each of the eight trace elements. Using
Update for Chapter 5 of the Exposure Factors Handbook
Chapter 5—Soil and Dust Ingestion
September 2017 Page 5-35
“best linear unbiased predictors,” the authors predicted 95th percentile soil ingestion values over time periods of 7 days, 30 days, 90 days, and 365 days. The 95th percentile soil ingestion values were predicted to be 133 mg/day over 7 days, 112 mg/day over 30 days, 108 mg/day over 90 days, and 106 mg/day over 365 days. Based on this analysis, estimates of the distribution of longer term average soil ingestion are expected to be narrower, with the 95th percentile estimates being as much as 25% lower (Stanek and Calabrese, 2000). This study was classified as relevant because, while Stanek and Calabrese (2000) attempted to characterize the variability between days for a given subject and between subjects, the derivation of usual (long term) intake based on limited short term subject day data introduces new uncertainties.
5.3.5.7. Stanek et al. (2001a)—Biasing Factors for Simple Soil Ingestion Estimates in Mass Balance Studies of Soil Ingestion
To identify and evaluate biasing factors for soil ingestion estimates, the authors developed a simulation model based on data from previous soil ingestion studies. The soil ingestion data used in this model were taken from Calabrese et al. (1989) (the Amherst study), Davis et al. (1990) (southeastern Washington State), Calabrese et al. (1997a) (the Anaconda study), and Calabrese et al. (1997b) (soil pica in Massachusetts), and relied only on the aluminum and silicon trace element estimates provided in these studies.
Of the biasing factors explored, the impact of study duration was the most striking, with a positive bias of more than 100% for 95th percentile estimates in a 4-day tracer element study. A smaller bias was observed for the impact of absorption of trace elements from food. Although the trace elements selected for use in these studies are believed to have low absorption, whatever amount is not accounted for will result in an underestimation of the soil ingestion distribution. In these simulations, the absorption of trace elements from food of up to 30% was shown to negatively bias the estimated soil ingestion distribution by less than 20 mg/day. No biasing effect was found for misidentifying play areas for soil sampling (i.e., ingested soil from a yard other than the subject’s yard).
5.3.5.8. Stanek et al. (2001b)—Soil Ingestion Distributions for Monte Carlo Risk Assessment in Children
Stanek et al. (2001b) developed “best linear unbiased predictors” to reduce the biasing effect of
short-term soil ingestion estimates. This study estimated the long-term average soil ingestion distribution using daily soil ingestion estimates from children who participated in the Anaconda, MT study. Trace element specific estimates on a subject day were simulated assuming a normal distribution. In this long-term (annual) distribution, the soil ingestion estimates were: mean 31, median 24, 75th percentile 42, 90th percentile 75, and 95th percentile 91 mg/day. This study was classified as relevant because of the uncertainties introduced by the assumptions used to derive long-term average soil ingestion distribution. For example, the methodology assumes that the variance of the trace element estimates on a subject-day is identical for all subjects and days and that the variance between days in soil ingestion for a subject is the same for all subjects.
5.3.5.9. Von Lindern et al. (2003)—Assessing Remedial Effectiveness through the Blood Lead:Soil/Dust Lead Relationship at the Bunker Hill Superfund Site in the Silver Valley of Idaho
Similar to Hogan et al. (1998), Von Lindern et al. (2003) used the IEUBK model to predict blood lead levels in a nonrandom sample of several hundred children ages 0–9 years in an area of northern Idaho from 1989–1998 during community-wide soil remediation. Von Lindern et al. (2003) used the IEUBK default soil and dust ingestion rates together with observed house dust/soil lead levels (and imputed values based on community soil and dust lead levels, when observations were missing). The authors compared the predicted blood lead levels with observed blood lead levels and found that the default IEUBK soil and dust ingestion rates and lead bioavailability value over-predicted blood lead levels, with the over-prediction decreasing as the community soil remediation progressed. The authors stated that the over-prediction may have been caused either by a default soil and dust ingestion that was too high, a default bioavailability value for lead that was too high, or some combination of the two. They also noted under-predictions for some children, for whom follow up interviews revealed exposures to lead sources not accounted for in the model simulations (e.g., recreational exposures from outside the site). In addition, some of these children were socioeconomically disadvantaged, highly mobile, and cared for at multiple locations.
Von Lindern et al. (2003) developed a statistical model that apportioned the contributions of community soils, yard soils of the residence, and
Update for Chapter 5 of the Exposure Factors Handbook
Chapter 5—Soil and Dust Ingestion
September 2017 Page 5-36
house dust to lead intake; the models’ results suggested that community soils contributed more (50%) than neighborhood soils (28%) or yard soils (22%) to soil found in house dust of the studied children.
5.3.5.10. Layton and Beamer (2009)—Migration of Contaminated Soil and Airborne Particulates to Indoor Dust
Layton and Beamer (2009) developed a modeling and measurement framework to assess the transport of contaminated soils and airborne particulates indoors at a residence from outdoor sources. The model accounted for the resuspension and deposition processes, and the removal of particles by cleaning and exhalation. The model consisted of a two-compartment model (i.e., air and floor) that simulated the dust fall, accumulation, and loss of particles on floor surfaces using the concentration of an inorganic tracer in those two media. Monitoring data from the National Human Exposure Assessment Survey (NHEXAS) in six Midwestern states and a city in The Netherlands were used to characterize the transport parameters of the model. The analysis assumed a lognormal distribution of soil track-in indoors with a geometric mean of 0.1 g/day (GSD = 3) based on data from the published literature. Results of the model indicated that 60% of the arsenic indoors originated from ambient air, while 40% was a result of soil tracked-in.
5.3.5.11. Gavrelis et al. (2011)—An Analysis of the Proportion of the U.S. Population That Ingests Soil or Other Non-Food Substances
Gavrelis et al. (2011) evaluated the prevalence of the U.S. population that ingests nonfood substances such as soil, clay, starch, paint, or plaster. Data were compiled from the National Health and Nutrition Examination Survey (NHANES) collected from 1971 to 1975 (NHANES I) and 1976 to 1980 (NHANES II), which represent a complex, stratified, multistage, probability-cluster design, and include nationwide probability samples of approximately 21,000 and 25,000 study participants, respectively. NHANES I surveyed people aged 1 to 74 years and NHANES II surveyed those 6 months to 74 years. The study population included women of childbearing age, people with low income status, the elderly, and preschool children, who represented an oversampling of specific groups in the population that were believed to have high risks for malnutrition.
The survey questions were demographic, socioeconomic, dietary, and health-related queries, and included specific questions regarding soil and nonfood substance ingestion. Survey questions for children under 12 years asked whether they consumed nonfood substances including dirt or clay, starch, paint or plaster, and other materials (NHANES I) or about consumption of clay, starch, paint or plaster, dirt, and other materials (NHANES II). For participants over 12 years of age, the survey questions asked only about consumption of dirt or clay, starch, and other materials (NHANES I) or about nonfood substances including clay, starch, and other materials (NHANES II).
Age groupings used in this analysis vary slightly from the age group categories established by EPA and described in Guidance on Selecting Age Groups for Monitoring and Assessing Childhood Exposures to Environmental Contaminants (U.S. EPA, 2005). Other demographic parameters included sex (including pregnant and nonpregnant females), race (White, Black, and other), geography (urban and rural, with “urban” defined as populations >2,500), income level (ranging from $0−$9,999 up to >$20,000, or not stated), and highest grade head of household (population under 18 years) or respondent (population >18 years) attended. For statistical analysis, frequency estimates were generated for the proportion of the total U.S. population that reported consumption of dirt, clay, starch, paint or plaster, or other materials “considered unusual” using the appropriate NCHS sampling weights and responses to the relevant questions in NHANES I and II. NHANES I and II were evaluated separately because the data sets did not provide components of the weight variable separately (i.e., probability of selection, nonresponse adjustment weight, and poststratification weight).
Although the overall prevalence estimates were higher in NHANES I compared with NHANES II, similar patterns were generally observed across substance types and demographic groups studied. For NHANES I, the estimated prevalence of all nonfood substance consumption in the United States for all ages combined was 2.5% (95% confidence interval [CI]: 2.2−2.9%), whereas for NHANES II, the estimated prevalence of all nonfood substance consumption in the United States for all ages combined was 1.1% (95% CI: 1.0−1.2%). Table 5-29 provides the prevalence estimates by type of substance consumed for all ages combined. By type of substance, the estimated prevalence was greatest for dirt and clay consumption and lowest for starch. Figures 5-1, 5-2, and 5-3, respectively, show the prevalence of nonfood substance consumption by
Update for Chapter 5 of the Exposure Factors Handbook
Chapter 5—Soil and Dust Ingestion
September 2017 Page 5-37
age, race, and income. The most notable differences were seen across age, race (Black vs. White), and income groups. For both NHANES I and II, prevalence for the ingestion of all nonfood substances decreased with increasing age, was higher among Blacks (5.7%; 95% CI: 4.4−7.0%) as compared to Whites (2.1%; 95% CI: 1.8−2.5%), and was inversely related to income level, with prevalence of nonfood consumption decreasing as household income increased. The estimated prevalence of all nonfood substances for the 1- to <3-year age category was at least twice that of the next oldest category (3 to <6 years). Prevalence estimates were 22.7% (95% CI: 20.1–25.3%) for the 1- to <3-year age group based on NHANES I and 12% based on NHANES II. In contrast, prevalence estimates for the >21-year age group was 0.7% (95% CI: 0.5–1.0%) and 0.4% (95% CI: 0.3–0.5%) for NHANES I and NHANES II, respectively. Other differences related to geography (i.e., urban and rural), highest grade level of the household head, and sex were less remarkable. For NHANES I, for example, the estimated prevalence of nonfood substance consumption was only slightly higher among females (2.9%; CI: 2.3−3.5%) compared to males (2.1%; CI: 1.8−2.5%) of all ages. For pregnant females, prevalence estimates (2.5%; 95% CI: 0.0−5.6%) for those 12 years and over were more than twice those for nonpregnant females (1.0%; 95% CI: 0.7−1.4%).
5.3.5.12. Stanek et al. (2012a)—Meta-Analysis of Mass-Balance Studies of Soil Ingestion in Children
Stanek et al. (2012a) conducted a meta-analysis of four major mass-balance soil ingestion studies in U.S. children between 1 and 7 years of age. The four studies included the Amherst study (Calabrese et al., 1989), the Washington State study (Davis et al., 1990), the Washington Family study (Davis and Mirick, 2006), and the Anaconda study (Calabrese et al., 1997a).
Data for only two trace elements were included (Al and Si). Excluded from the study were 10% of subjects identified as outliers. In addition, study subjects with high soil intake (soil pica) were excluded. Additional sources of variability and bias between the four studies included in the meta-analysis are discussed in Stanek et al. (2012b). Mean, median, and 95th percentile soil ingestion estimates based on 216 children were 25.5, 32.6, and 79.4 mg/day, respectively. Soil ingestion rates for males and females were similar. As shown in Table 5-30, soil ingestion appeared to increase with age
with the youngest age group (1 to <2 years) having the lowest soil ingestion rate.
This study provides age-specific soil ingestion estimates based on an analysis of four U.S. mass-balance soil ingestion studies for children. However, this study was classified as relevant because high-end values that were considered to be biased were excluded. In addition, data for a child with pica were also excluded. The study subjects were all from a limited study area (northern United States only) and data were collected only in the summer and early fall.
5.3.5.13. Wilson et al. (2015)—Estimation of Sediment Ingestion Rates Based on Hand-to-Mouth Contact and Incidental Surface Water Ingestion
Wilson et al. (2015) used a similar mechanistic approach to that of Wilson et al. (2013) to estimate sediment ingestion rates, except that greater adherence of sediment to the hands was assumed than for soil and dust. These sediment ingestion rates were intended for use in recreational exposure scenarios involving contact with sediments in aquatic areas. Sediment ingestion was assumed to occur as a result of direct contact with the sediment and subsequent hand-to-mouth contact, as well as incidental ingestion of surface water containing suspended sediments. Both deterministic and probabilistic methods were used to estimate sediment ingestion based on the following equations:
SDIRHM = SLhands × SAhand × FSAfingers × FQ × SE
(Eqn. 5-12)
and
SDIRWC = SS × SWIR (Eqn. 5-13)
where:
FQ = frequency of hand-to-mouth events (1/hour)
FSAfingers = fractional surface area of the hands (unitless)
SAhand = surface area of the hand (cm2) SDIRHM = sediment ingestion rate from hand-
to-mouth contact (mg/hr) SDIRWC = sediment ingestion from incidental
water consumption (mg/hr) SE = saliva extraction factor (unitless)
Update for Chapter 5 of the Exposure Factors Handbook
Chapter 5—Soil and Dust Ingestion
September 2017 Page 5-38
SLhands = sediment adherence on hands (mg/cm2)
SS = suspended sediment concentration (mg/L)
SWIR = surface water ingestion rate (L/hr)
Table 5-31 presents the age-dependent input values used in these calculations. Both deterministic and probabilistic methods were used to estimate sediment ingestion rates. The results based on the probabilistic assessment are presented in Table 5-32. The estimated sediment ingestion rates based on hand-to-mouth contact using the probabilistic approach were 72 mg/hour for toddlers 7-months to 4 years old, 57 mg/hour for children 5 to 11 years old, 18 mg/hour for teens 12 to 19 years old, and 20 mg/hour for adults and seniors ages 20 to 60+ years. The sediment ingestion rate based on incidental surface water ingestion was 7.7 mg/hour for all age groups. Slightly lower values were observed using the deterministic approach.
This study provides sediment ingestion rates in units of mg/hour which can be used to estimate exposure to contaminants in sediment. Its limitations are based on the uncertainties associated with the input parameters used to model dust ingestion. Also, as indicated by the author, the age groups and receptor characteristics were intended to represent the Canadian population, which may or may not be representative of U.S. populations.
5.3.5.14. Wilson et al. (2016)—Estimation of Dust Ingestion Rates in Units of Surface Area per Day Using a Mechanistic Hand-to-Mouth Model
Wilson et al. (2016) estimated dust ingestion rates for various age groups of Canadian children on the basis of surface area (m2/day). These dust ingestion rates are intended to be used with measured contaminant loadings in surface dust (µg/m2) to estimate exposure from ingestion of surface dust. Wilson et al. (2016) used a similar approach and input parameters as used in Wilson et al. (2013). Dust ingestion was calculated using the following equation:
DIG = FTSS × SAhand × FSAfingers × FQ × SE × ET
(Eqn. 5-14)
where:
DIG = dust ingestion rate (m2/d)
ET = exposure time (h/d) FQ = frequency of hand-to-mouth events
(events/hr) FSAfingers = fractional surface area of hand
mouthed FTSS = fraction of dust transferred from
indoor surfaces to hands SAhand = surface area of one hand (cm2) SE = saliva extraction factor (unitless)
The age-dependent parameters used were the same as those used in Wilson et al. (2013), as shown in Table 5-13. Age-specific exposure time (ET) values were estimated as 24 hours/day minus the time spent sleeping and the time spent outdoors. It was assumed that contact occurred with hard surfaces (e.g., carpets, countertops) 50% of the time and with soft surfaces (e.g., carpets, sofas) 50% of the time, except for infants for whom contact was assumed to occur with soft surfaces only (i.e., 100% of the time). Both deterministic and probabilistic methods were used to estimate dust ingestion rates. Results based on the probabilistic approach are presented in Table 5-33. Dust ingestion rates for children <11 years old were estimated to range from 0.025 m2/day for infants 0–6 months to 0.061 m2/day for toddlers 7 months to 4 years.
This study provides dust ingestion rates in units of m2/day which can be used with surface loadings of dust (and corresponding contaminant concentrations in the dust) in µg/m2 to estimate exposure. Its limitations are based on the uncertainties associated with the input parameters used to model dust ingestion. The use of these dust ingestion rates assumes that the surface loading measurements are representative of the surfaces contacted.
5.3.5.15. Fawcett et al. (2016)—A Meta-Analysis of the Worldwide Prevalence of Pica during Pregnancy and the Postpartum Period
Fawcett et al. (2016) conducted a meta-analysis using information found in 70 studies published through February 2014 to develop worldwide pica prevalence estimates among pregnant and postpartum populations. Fawcett et al. (2016) also characterized variations in prevalence based on moderating variables (e.g., educational level, geographic region, and ethnicity). Of the studies evaluated, 33.8% were from North America, 5.6% were from South America, 33.8% were from Africa, 18.3% were from the Middle East, 4.2% were from
Update for Chapter 5 of the Exposure Factors Handbook
Chapter 5—Soil and Dust Ingestion
September 2017 Page 5-39
Asia, and 4.2% were from Europe. Fawcett et al. (2016) defined pica as “the purposeful consumption of nonfood or nonnutritive substances,” including “earth (geophagia), starch (amylophagia), ice (pagophagia), and a vast number of additional substances (e.g., baking soda).” Postpartum was defined as up to 12 months after delivery. The overall prevalence of pica was estimated to be 27.8%, but Fawcett et al. (2016) suggested that this is a poor indicator of pica prevalence among the general population of pregnant and postpartum because of the heterogeneity across studies. African women had the highest prevalence of pica at 44.8%, followed by North/South American at 23.0%, and Eurasia at 17.5%. Based on nine U.S. studies that included data on ethnicity, African-American women in the United States were also more likely to experience pica than non-African-American women. Based on a subset of 29 studies that reported the educational level of the women, education had a negative association with pica prevalence (i.e., higher educational level is associated with lower prevalence of pica). A subset of 31 studies reported on pica behavior among women with anemia. These women were one-and-a-half times more likely to report pica than nonanemic women.
This study estimated pica based on a wide range of studies, and provides information on the factors that may affect pica prevalence among pregnant and postpartum women. However, as stated by the author, the overall pica prevalence of 27.8% is not a good indicator of prevalence among the general population due to the wide range of values observed in the various studies evaluated. Also, pica was defined as ingestion of nonfood substances and did not represent soil/dust ingestion alone, but Fawcett et al. (2016) indicated that the moderating variables for geophagia did not differ from those of overall pica.
5.4. LIMITATIONS OF STUDY METHODOLOGIES
The three types of information needed to provide recommendations to exposure assessors on soil and dust ingestion rates among U.S. children include quantities of soil and dust ingested, frequency of high soil and dust ingestion episodes, and prevalence of high soil and dust ingesters. The methodologies provide different types of information: The tracer element, biokinetic model comparison, and activity pattern methodologies provide information on quantities of soil and dust ingested; the tracer element methodology provides limited evidence of the frequency of high soil ingestion episodes; and the
survey response methodology can shed light on prevalence of mouthing behavior and frequency of high soil ingestion episodes. The biokinetic model comparison methodology has the advantage of reflecting longer term exposures. However, the methodologies used to estimate soil and dust ingestion rates and prevalence of soil and dust ingestion behaviors have certain limitations when used for the purpose of developing recommended soil and dust ingestion rates. These limitations may not have excluded specific studies from use in the development of recommended ingestion rates, but have been noted throughout this handbook. This section describes some of the known limitations, presents an evaluation of the current state of the science for U.S. children’s soil and dust ingestion rates, and describes how the limitations affect the confidence ratings given to the recommendations.
5.4.1. Tracer Element Methodology This section describes some previously identified
limitations of the tracer element methodology as it has been implemented by U.S. researchers, as well as additional potential limitations that have not been explored. Some of these same limitations would also apply to the Dutch and Jamaican studies that used a control group of hospitalized children to account for dietary and pharmaceutical tracer intakes.
Binder et al. (1986) described some of the major and obvious limitations of the early U.S. tracer element methodology as follows:
[T]he algorithm assumes that children ingest predominantly soil from their own yards and that concentrations of elements in composite soil samples from front and back yards are representative of overall concentrations in the yards...children probably eat a combination of soil and dust; the algorithm used does not distinguish between soil and dust ingestion....fecal sample weights...were much lower than expected...the assumption that aluminum, silicon and titanium are not absorbed is not entirely true...dietary intake of aluminum, silicon and titanium is not negligible when compared with the potential intake of these elements from soil...Before accepting these estimates as true values of soil ingestion in toddlers, we need a better understanding of the metabolisms of aluminum, silicon and titanium in children, and the validity of the
Update for Chapter 5 of the Exposure Factors Handbook
Chapter 5—Soil and Dust Ingestion
September 2017 Page 5-40
assumptions we made in our calculations should be explored further.
The subsequent U.S. tracer element studies (Calabrese et al., 1997a, 1989; Barnes, 1990; Davis et al., 1990; Davis and Mirick, 2006) made some progress in addressing some of the Binder et al. (1986) study’s stated limitations.
Regarding the issue of nonyard (community-wide) soil as a source of ingested soil, one study (Calabrese et al., 1989; Barnes, 1990) addressed this issue to some extent, by including samples of children’s daycare center soil in the analysis. Calabrese et al. (1997a) attempted to address the issue by excluding children in daycare from the study sample frame. Homogeneity of community soils’ tracer element content would play a role in whether this issue is an important biasing factor for the tracer element studies’ estimates. Davis et al. (1990) evaluated community soils’ aluminum, silicon, and titanium content and found little variation among 101 yards throughout the three-city area. Stanek et al. (2001a) concluded that there was “minimal impact” on estimates of soil ingestion due to mis-specifying a child’s play area.
Regarding the issue of soil and dust both contributing to measured tracer element quantities in excreta samples, the key U.S. tracer element studies all attempted to address the issue by including samples of household dust in the analysis, and in some cases estimates are presented in the published articles that adjust soil ingestion estimates on the basis of the measured tracer elements found in the household dust. The relationship between soil ingestion rates and indoor settled dust ingestion rates has been evaluated in some of the secondary studies (Calabrese and Stanek, 1992b). An issue similar to the community-wide soil exposures in the previous paragraph could also exist with community-wide indoor dust exposures (such as dust found in schools and community buildings occupied by study subjects during or prior to the study period). A portion of the community-wide indoor dust exposures (due to occupying daycare facilities) was addressed in the Calabrese et al. (1989) and Barnes (1990) studies, but not in the other three key tracer element studies. In addition, if the key studies’ vacuum cleaner collection method for household and daycare indoor settled dust samples influenced tracer element composition of indoor settled dust samples, the dust sample collection method would be another area of uncertainty with the key studies’ indoor dust-related estimates. The survey response studies suggest that some young children may prefer ingesting dust to ingesting soil. The existing literature on soil versus
dust sources of children’s lead exposure may provide useful information that has not yet been compiled for use in soil and dust ingestion recommendations.
Regarding the issue of fecal sample weights and the related issue of missing fecal and urine samples, the key tracer element studies have varying strengths and limitations. The Calabrese et al. (1989) article stated that wipes and toilet paper were not collected by the researchers, and thus fecal quantities, and soil and dust ingestion may have been underestimated. Calabrese et al. (1989) stated that cotton cloth diapers were supplied for use during the study; commodes apparently were used to collect both feces and urine for those children who were not using diapers. Barnes (1990) described cellulose and polyester disposable diapers with significant variability in silicon and titanium content and suggested that children’s urine was not included in the analysis. Thus, it is unclear to what extent complete fecal and urine output was obtained for each study subject. The Calabrese et al. (1997a) study did not describe missing fecal samples and did not state whether urinary tracer element quantities were used in the soil and dust ingestion estimates, but stated that wipes and toilet paper were not collected. Missing fecal samples may have resulted in negative bias in the estimates from both of these studies. Davis et al. (1990) and Davis and Mirick (2006) were limited to children who no longer wore diapers. The authors made adjustments to the soil and dust ingestion estimates based on assumptions regarding the quantities of feces and urine in missed samples. These adjustments may have affected those studies’ estimates, but the direction of the bias is uncertain. Adjustments for missing fecal and urine samples could introduce errors sufficient to cause negative estimates if missed samples were heavier than the collected samples used in the soil and dust ingestion estimate calculations.
Regarding the issue of dietary intake, the key U.S. tracer element studies have all addressed dietary (and nondietary, nonsoil) intake by subtracting calculated estimates of these sources of tracer elements from excreta tracer element quantities, or by providing study subjects with personal hygiene products that were low in tracer element content. Applying the food and nondietary, nonsoil corrections required subtracting the tracer element contributions from these nonsoil sources from the measured fecal/urine tracer element quantities. To perform this correction required assumptions to be made regarding the gastrointestinal transit time, or the time lag between inputs (food, nondietary nonsoil, and soil) and outputs (fecal and urine). The gastrointestinal transit
Update for Chapter 5 of the Exposure Factors Handbook
Chapter 5—Soil and Dust Ingestion
September 2017 Page 5-41
time assumption introduced a new potential source of bias that some authors (Stanek and Calabrese, 1995b) called input/output misalignment or transit time error. Stanek and Calabrese (1995a) attempted to correct for this transit time error by using the BTM and focusing estimates on those tracers that had low food:soil tracer concentration ratios. The lag time may also be a function of age. Davis et al. (1990) and Davis and Mirick (2006) assumed a 24-hour lag time in contrast to the 28-hour lag times used in Calabrese et al. (1989), Barnes (1990), and Calabrese et al. (1997a). ICRP (2002) suggested a lag time of 37 hours for 1-year-old children and 5- to 15-year-old children. Stanek and Calabrese (1995b) describe a method designed to reduce bias from this error source. Lag times that are shorten or longer than what is assumed may result in misalignment of the intake of tracers and their output. The direction of these biases is difficult to predict.
Regarding gastrointestinal absorption, the authors of three of the studies appeared to agree that the presence of silicon in urine represented evidence that silicon was being absorbed from the gastrointestinal tract (Davis et al., 1990; Calabrese et al., 1989; Barnes, 1990; Davis and Mirick, 2006). There was some evidence of aluminum absorption in Calabrese et al. (1989) and Barnes (1990); Davis and Mirick (2006) stated that aluminum and titanium did not appear to have been absorbed, based on low urinary levels. Davis et al. (1990) stated that silicon appears to have been absorbed to a greater degree than aluminum and titanium, based on urine concentrations. Absorption of these tracer elements would likely bias the estimated soil and dust ingestion rates low, because intake of the tracer elements would not be accounted for in the excretia if they had been absorbed. More research to better understand the uptake of these tracer elements may be warranted.
Aside from the gastrointestinal absorption, lag time, and missed fecal sample issues, Davis and Mirick (2006) offered another possible explanation for the negative soil and dust ingestion rates estimated for some study participants. Negative values result when the tracer amount in food and medicine is greater than that in urine/fecal matter. Given that some analytical error may occur, any overestimation of tracer amounts in the food samples would be greater than an overestimation in urine/feces because the food samples were many times heavier than the urine and fecal samples. Overestimating the amount of tracers ingested via food and medicines would tend to negatively bias soil and dust ingestion estimates while underestimating the amount of tracers ingested via
foods and medicines would tend to positively bias soil and dust ingestion estimates. Interactions among elements in the gastrointestinal tract, in particular fluoride from ingested toothpaste, and how these may affect the absorption of tracer elements are not available based on the studies reviewed for this chapter.
Another limitation on the accuracy of tracer element-based estimates of soil and dust ingestion relates to inaccuracies inherent in environmental sampling and laboratory analytical techniques. The “percent recovery” of different tracer elements varies (according to validation of the study methodology performed with adults who swallowed gelatin capsules with known quantities of sterilized soil, as part of the Calabrese et al. [1989, 1997a] studies). Digestion/extraction efficiencies also vary by media type (e.g., food, soil, medicine). Estimates based on a particular tracer element with a lower or higher recovery than the expected 100% in any of the study samples would be influenced in either a positive or negative direction, depending on the recoveries in the various samples and their degree of deviation from 100% (Calabrese et al., 1989). Soil/dust size fractions, and digestion/extraction methods of sample analysis may be additional limitations.
Davis et al. (1990) offered an assessment of the impact of swallowed toothpaste on the tracer-based estimates by adjusting estimates for those children whose caregivers reported that they had swallowed toothpaste. Davis et al. (1990) had supplied study children with toothpaste that had been preanalyzed for its tracer element content, but it is not known to what extent the children actually used or swallowed the supplied toothpaste. Similarly, Calabrese et al. (1989, 1997a) supplied children in the Amherst, MA and Anaconda, MT studies with toothpaste containing low levels of most tracers, but it is unclear to what extent those children used or swallowed the supplied toothpaste. Not accounting for the consumption of toothpaste or other materials that contain the tracer elements would tend to bias soil and dust ingestion rates in the positive direction, but over-predicting the amount of tracers consumed in these materials would have the opposite effect.
Other research suggests additional possible limitations that have not yet been explored. First, lymph tissue structures in the gastrointestinal tract might serve as reservoirs for titanium dioxide food additives and soil particles, which could bias estimates either upward or downward depending on the tracers’ entrapment within, or release from, these reservoirs during the study period (ICRP, 2002; Shepherd et al., 1987; Powell et al., 1996). Second,
Update for Chapter 5 of the Exposure Factors Handbook
Chapter 5—Soil and Dust Ingestion
September 2017 Page 5-42
gastrointestinal uptake of silicon may have occurred, which could bias those estimates downward. There is an increasing body of evidence that silicon is an essential nutrient and that it plays a role in the initiation of the mineralization process and bone formation (Chen et al., 2016; Nielsen, 2014; Price et al., 2012; Jugdaohsingh, 2007; Carlisle, 1980). However, absorption of silicon in the gastrointestinal tract is not well understood (Jugdaohsingh et al., 2002). Van Dyck et al. (2000) suggests a possible negative bias in the silicon-based soil ingestion estimates, depending on the quantities of silicon absorbed by growing children. Third, regarding the potential for swallowed toothpaste to bias soil ingestion estimates upward, commercially available toothpaste may contain quantities of titanium and perhaps silicon and aluminum in the range that could be expected to affect the soil and dust ingestion estimates. Fourth, for those children who drank bottled or tap water during the study period, and did not include those drinking water samples in their duplicate food samples, slight upward bias may exist in some of the estimates for those children because drinking water may contain small, but relevant, quantities of silicon and potentially other tracer elements. Fifth, the tracer element studies conducted to date have not explored the impact of soil properties’ influence on toxicant uptake or excretion within the gastrointestinal tract. Nutrition researchers investigating influence of clay geophagy behavior on human nutrition have begun using in vitro models of human digestion (Dominy et al., 2003; Hooda et al., 2004). A recent review (Wilson, 2003) covers a wide range of geophagy research in humans and various hypotheses proposed to explain soil ingestion behaviors, with emphasis on the soil properties of geophagy materials.
5.4.2. Biokinetic Model Comparison Methodology
It is possible that the IEUBK biokinetic model comparison methodology contained sources of both positive and negative bias, like the tracer element studies, and that the net impact of the competing biases is not known. There may be several significant sources of bias with the biokinetic model comparison methodology. One source of potential bias was the possibility that the biokinetic model cannot account for sources of lead exposure that are important for certain children due to incomplete exposure characterizations. For these children, the model might under-predict blood lead levels compared to actual measured lead levels. However, this result may actually mean that the default
assumed lead intake rates via either soil and dust ingestion, or another lead source that is accounted for by the model, are too high. Another source of potential bias includes not accounting for the variability in the children’s blood lead levels with time. There are also uncertainties with regard to the representativeness of the media concentrations in the children’s play areas. For example, there is potential bias when predicting blood lead levels in children who have not spent a significant amount of time in the areas characterized as the main sources of environmental lead exposure. Modeling this population could result in either upward or downward biases in predicted blood lead levels. Comparing upward-biased predictions with actual measured blood lead levels and finding a relatively good match could lead to inferences that the model’s default soil and dust ingestion rates are accurate, when in fact the children’s soil and dust ingestion rates, or some other lead source, were actually higher than the default assumption. Von Lindern et al. (2016) attempted to address the issue of representativeness by assuming different partition models (i.e., percentage of time spent at various soil-contact locations).
Additionally, there is uncertainty with the assumption within the model itself regarding the biokinetics of absorbed lead, which could result in either positively or negatively biased predictions and the same kinds of incorrect inferences as the second source of potential bias. Another source of bias is the education and intervention programs implemented at contaminated sites which can potentially result in children’s temporary reduction in soil/dust ingestion rates (see Section 5.4.4) (von Lindern et al., 2016).
In addition, there was no extensive sensitivity analysis. The calibration step used to fix model parameters limits the degree that most parameters can reasonably be varied. Second, the IEUBK model was not designed to predict blood lead levels greater than 25−30 µg/dL; there are few data to develop such predictions and less to validate them. If there are site-specific data that indicate soil ingestion rates (or other ingestion/intake rates) are higher than the defaults on average (not for specific children), the site-specific data should be considered. EPA considers the default IEUBK value of 30% bioavailability reasonable for most data sets/sites. Bioavailability has been assayed for soils similar to those in the calibration step and the empirical comparison data sets; 30% was used in the calibration step, and is therefore recommended for similar sites. The default provides a reasonable substitute when there are no specific data. Speciation of lead compounds for a particular exposure scenario
Update for Chapter 5 of the Exposure Factors Handbook
Chapter 5—Soil and Dust Ingestion
September 2017 Page 5-43
could support adjusting bioavailability if they are known to differ strongly from 30%. The use of the 30% bioavailability was further supported by von Lindern et al. (2016). In general, EPA supports using bioavailability rates determined for the particular soils of interest if available.
5.4.3. Activity Pattern Methodology The limitations associated with the activity
pattern methodology relate to the availability and quality of the underlying data used to model soil ingestion rates. Some examples where data are limited or lacking include: information on the activities and environments of very young children (e.g., hand-to-mouth, object-to-mouth, and pica behaviors), information on skin adherence and dust loadings on indoor objects and floors (bare and carpeted), as well as the transfer of dust from both bare floors and carpets to hands, soil loadings to hands while playing outdoors, and information to evaluate temporal variability. Soil properties that may also be important include: soil particle size, organic content, moisture content, and other properties that affect soil adherence to the skin.
Real-time hand recording, where observations are made by trained professionals (rather than parents), may offer the advantage of consistency in interpreting visible behaviors and may be less subjective than observations made by someone who maintains a care-giving relationship to the child. On the other hand, young children’s behavior may be influenced by the presence of unfamiliar people (Davis et al., 1995). Groot et al. (1998) indicated that parent observers perceived that deviating from their usual care-giving behavior by observing and recording mouthing behavior appeared to have influenced the children’s behavior. With video-transcription methodology, an assumption is made that the presence of the videographer or camera does not influence the child’s behavior. This assumption may result in minimal biases introduced when filming newborns or when the camera and videographer are not visible to the child. However, if the children being studied are older than newborns and can see the camera or videographer, biases may be introduced. Ferguson et al. (2006) described apprehension caused by videotaping and described situations where a child’s awareness of the videotaping crew caused “play-acting” to occur, or parents indicated that the child was behaving differently during the taping session. Another possible source of measurement error may be introduced when children’s movements or positions cause their mouthing not to be captured by the
camera. Data transcription errors can bias results in either the negative or positive direction (i.e., underestimating mouthing behavior may bias results low while overestimating mouthing behavior may bias estimates high). Also, measurement error can occur if situations arise in which caregivers are absent during videotaping and researchers must stop videotaping and intervene to prevent risky behaviors (Zartarian et al., 1995). Finally, the videography studies have relatively small sample sizes, and the number of children studied and their method of selection may not be entirely representative of the population of the US.
Survey response studies rely on responses to questions about a child’s mouthing behavior posed to parents or caregivers. Measurement errors from these studies could occur for a number of different reasons, including language/dialect differences between interviewers and respondents, question wording problems and lack of definitions for terms used in questions, differences in respondents’ interpretation of questions, and recall/memory effects.
Other data collection methodologies (in-person interview, mailed questionnaire, or questions administered in “test” format in a school setting) may have had specific limitations. In-person interviews could result in either positive or negative response bias due to distractions posed by young children, especially when interview respondents simultaneously care for young children and answer questions. Other limitations include positive or negative response bias due to respondents’ perceptions of a “correct” answer, question wording difficulties, lack of understanding of definitions of terms used, language and dialect differences between investigators and respondents, respondents’ desires to avoid negative emotions associated with giving a particular type of answer, and respondent memory problems (“recall” effects) concerning past events. Positive biases would tend to occur when respondents overestimate behaviors that could result in soil and dust ingestion; negative biases would tend to occur when respondents underestimate behaviors that could result in soil and dust ingestion. Mailed questionnaires have many of the same limitations as in-person interviews, but may allow respondents to respond when they are not distracted by childcare duties. An in-school test format is more problematic than either interviews or mailed surveys because respondent bias related to teacher expectations could influence responses.
One approach to evaluating the degree of bias in survey response studies may be to make use of a surrogate biomarker indicator providing suggestive
Update for Chapter 5 of the Exposure Factors Handbook
Chapter 5—Soil and Dust Ingestion
September 2017 Page 5-44
evidence of ingestion of significant quantities of soil (although quantitative estimates would not be possible). The biomarker technique measures the presence of serum antibodies to Toxocara species, a parasitic roundworm from cat and dog feces. Two U.S. studies have found associations between reported soil ingestion and positive serum antibody tests for Toxocara infection (Marmor et al., 1987; Glickman et al., 1981); a third (Nelson et al., 1996) has not, but the authors stated that reliability of survey responses regarding soil ingestion may have been an issue. Further refinement of survey response methodologies, together with recent NHANES data on U.S. prevalence of positive serum antibody status regarding infection with Toxocara species, may be useful.
5.4.4. Environmental and Household Interventions
Some of the studies discussed in this chapter were conducted near hazardous waste sites where soil contamination was present (e.g., smelting and mining waste containing lead). Environmental and household educational interventions have occurred at many of these sites. Several studies have been published in the literature to evaluate the effectiveness of educational and environmental interventions for reducing blood lead levels in children. It may be reasonable to assume that environmental interventions (e.g., soil removal) would not have had an effect on soil and dust ingestion rates because blood lead levels may come down as a result of a reduction of lead concentrations and not a change in behavior. However, awareness of contamination and educational interventions may affect behaviors (e.g., increase in frequency of hand washing and household cleaning); thus, reducing soil ingestion rates. Researchers have studied the effectiveness of educational interventions alone in reducing blood lead levels in children (Brown et al., 2006; Jordan et al., 2003; Wasserman, 2002; Rhoads et al., 1999). These studies found a decline in blood lead levels in the intervention groups compared to the control groups. However, Rhoads et al. (1999) and Jordan et al. (2003) concluded that educational intervention was only partially effective in reducing or maintaining lower blood lead levels. Yeoh et al. (2014) conducted a meta-analysis of five studies of educational interventions (Lanphear et al., 1996; Lanphear et al., 1999; Brown et al., 2006; Jordan et al, 2003; and Wasserman, 2002). The meta-analysis of the log-transformed data from these five studies showed that there was no statistical significant reduction in blood lead levels (Yeoh et al, 2014).
However, another factor that may affect the results observed in these intervention studies is that bone turnover in children occurs at a higher rate than that of an adult, resulting in longer half-life of lead in blood (8 to 11 months for acute exposure and 20 to 38 months for chronic exposures), thus, providing a continuous source of lead in blood (Yeoh et al., 2014). With the exception of Jordan et al. (2003), who conducted quarterly booster sessions with participants for 2 years after the first year of educational intervention, the duration of these intervention studies was 12 months or less.
5.4.5. Key Studies: Representativeness of the U.S. Population
Limitations regarding the key studies performed in the United States for estimating soil and dust ingestion rates in the entire population of U.S. children ages 0 to <21 years fall into the broad categories of geographic range and demographics (age, sex, race/ethnicity, socioeconomic status).
Regarding geographic range, the two most obvious issues relate to soil types and climate. Soil properties might influence the soil ingestion estimates that are based on excreted tracer elements. The Davis et al. (1990), Calabrese et al. (1989), Barnes (1990), Calabrese et al. (1997a), and Davis and Mirick (2006) tracer element studies were conducted in locations with soils that had sand content ranging from 21−80%, silt content ranging from 16−71%, and clay content ranging from 3−20% by weight, based on data from USDA (2008). The location of children in the Calabrese et al. (1997b) study was not specified, but due to the original survey response study’s occurrence in western Massachusetts, the soil types in the vicinity of the Calabrese et al. (1997b) study are likely to be similar to those in the Calabrese et al. (1989) and Barnes (1990) study.
The Hogan et al. (1998) study included locations in the central part of the United States (an area along the Kansas/Missouri border, and an area in western Illinois) and one in the eastern United States (Palmerton, PA). The Davis et al. (1990) study was conducted in Washington State, Von Lindern et al. (2016) was conducted in Idaho, and Wilson et al. (2013) was conducted in Canada. The only key study conducted in the southern part of the United States was Vermeer and Frate (1979).
Children might be outside and have access to soil in a very wide range of weather conditions (Wong et al., 2000). In the parts of the United States that experience moderate temperatures year-round, soil ingestion rates may be fairly evenly distributed
Update for Chapter 5 of the Exposure Factors Handbook
Chapter 5—Soil and Dust Ingestion
September 2017 Page 5-45
throughout the year. During conditions of deep snow cover, extreme cold, or extreme heat, children could be expected to have minimal contact with outside soil. All children, regardless of location, could ingest soils located indoors in plant containers, soil derived particulates transported into dwellings as ambient airborne particulates, or outdoor soil tracked inside buildings by human or animal building occupants. Davis et al. (1990) did not find a clear or consistent association between the number of hours spent indoors per day and soil ingestion, but reported a consistent association between spending a greater number of hours outdoors and high (defined as the uppermost tertile) soil ingestion levels across all three tracers used.
The key tracer element studies all took place in northern latitudes. The temperature and precipitation patterns that occurred during these four studies’ data collection periods were difficult to discern due to no mention of specific data collection dates in the published articles. The Calabrese et al. (1989) and Barnes (1990) study apparently took place in mid to late September 1987 in and near Amherst, MA; Calabrese et al. (1997a) apparently took place in late September and early October 1992, in Anaconda, MT; Davis et al. (1990) took place in July, August, and September 1987, in Richland, Kennewick, and Pasco, WA; and Davis and Mirick (2006) took place in the same Washington state location in late July, August, and very early September 1988 (raw data). Inferring exact data collection dates, a wide range of temperatures may have occurred during the four studies’ data collection periods (daily lows from 22−60°F and 25−48°F, and daily highs from 53−81°F and 55−88°F in Calabrese et al. [1989] and Calabrese et al. [1997a], respectively, and daily lows from 51−72°F and 51−67°F, and daily highs from 69−103°F and 80−102°F in Davis et al. [1990] and Davis and Mirick [2006], respectively) (NCDC, 2006). Significant amounts of precipitation occurred during Calabrese et al. (1989) (more than 0.1 inches per 24-hour period) on several days; somewhat less precipitation was observed during Calabrese et al. (1997a); precipitation in Kennewick and Richland during the data collection periods of Davis et al. (1990) was almost nonexistent; there was no recorded precipitation in Kennewick or Richland during the data collection period for Davis and Mirick (2006) (NCDC, 2006).
One key biokinetic model comparison study (Hogan et al., 1998) targeted three locations in more southerly latitudes (Pennsylvania, southern Illinois, and southern Kansas/Missouri) than the tracer element studies. The other key biokinetic model comparison study was conducted in Idaho. The
biokinetic model comparison methodology had an advantage over the tracer element studies in that the study represented long-term environmental exposures over periods up to several years that would include a range of seasons and climate conditions.
A brief review of the representativeness of the key studies’ samples with respect to sex and age suggested that males and females were represented roughly equally in those studies for which study subjects’ sex was stated. Children up to age 12 years were studied in the key studies with an emphasis on younger children.
A brief review of the representativeness of the key studies’ samples with respect to socioeconomic status and racial/ethnic identity suggested that there were some discrepancies between the study subjects and the current U.S. population of children age 0 to <21 years. The single survey response study (Vermeer and Frate, 1979) was specifically targeted toward a predominantly rural Black population in a particular county in Mississippi. The tracer element studies are of predominantly White populations, apparently with limited representation from other racial and ethnic groups. The Amherst, MA study (Calabrese et al., 1989; Barnes, 1990) did not publish the study participants’ socioeconomic status or racial and ethnic identities. The socioeconomic level of children studied by Davis et al. (1990) was reported to be primarily of middle to high income. Self-reported race and ethnicity of relatives of the children studied (in most cases, they were the parents of the children studied) in Davis et al. (1990) were White (86.5%), Asian (6.7%), Hispanic (4.8%), Native American (1.0%), and Other (1.0%), and the 91 married or living-as-married respondents identified their spouses as White (86.8%), Hispanic (7.7%), Asian (4.4%), and Other (1.1%). Davis and Mirick (2006) did not state the race and ethnicity of the follow-up study participants, who were a subset of the original study participants from Davis et al. (1990). For the Calabrese et al. (1997a) study in Anaconda, MT, population demographics were not presented in the published article. The study sample appeared to have been drawn from a door-to-door census of Anaconda residents that identified 642 toilet-trained children who were less than 72 months of age. Of the 414 children participating in a companion study (out of the 642 eligible children identified), 271 had complete study data for that companion study, and of these 271, 97.4% were identified as White and the remaining 2.6% were identified as Native American, Black, Asian, and Hispanic (Hwang et al., 1997). The 64 children in the Calabrese et al. (1997a) study apparently were a
Update for Chapter 5 of the Exposure Factors Handbook
Chapter 5—Soil and Dust Ingestion
September 2017 Page 5-46
stratified random sample (based on such factors as behavior during a previous study, the existence of a disability, or attendance in daycare) drawn from the 642 children identified in the door-to-door census. Presumably these children identified as similar races and ethnicities to the Hwang et al. (1997) study children. The Calabrese et al. (1997b) study indicated that 11 of the 12 children studied were White.
In summary, the geographic range of the key study populations was somewhat limited. Of those performed in North America, U.S. locations include Massachusetts, Kansas, Montana, Missouri, Illinois, Washington, Pennsylvania, and Idaho. Canada is also represented. The two most obvious issues regarding geographic range relate to soil types and climate. Soil types were not always described, so the representativeness of the key studies related to soil types and properties is unclear. The key tracer element studies all took place in northern latitudes. The only key study conducted in the southern part of the United States was Vermeer and Frate (1979).
In terms of sex and age, males and females were represented roughly equally in those studies for which study subjects’ sex was stated, while the majority of children studied were under the age of eight. The tracer element studies are of predominantly White populations, with a single survey response study (Vermeer and Frate, 1979) targeted toward a rural Black population. Other racial and ethnic identities were not well reported among the key studies, nor was socioeconomic status.
5.5. DERIVATION OF RECOMMENDED SOIL AND DUST INGESTION VALUES
Table 5-34 summarizes the soil and dust ingestion estimates from the key studies for general population children, by age range, based on the tracer, biokinetic modeling, and activity patterns approaches. These three methods were given equal weight in deriving the recommendation because of the inherent limitations in all of the methods (see Section 5.4). Also, there is no supportive evidence to suggest that one method provides more reliable estimates than the other.
The mean and upper percentile recommendations were derived by averaging the values for each age group for each of the three study methodologies and then taking the average of the three study types, as follows:
IRsoil + dust = (IRt + IRb + IRa) / 3 (Eqn 5-15)
Where:
IRsoil + dust = age-specific mean (or 95th percentile) soil + dust ingestion rate (mg/day) IRt = average of the age-specific mean (or 95th percentile) soil + dust ingestion rates from the various tracer studies (mg/day); IRb = average of the age-specific mean (or 95th percentile) soil + dust ingestion rates from the various biokinetic modeling comparison studies (mg/day); IRa = average of the age-specific mean (or 95th percentile) soil + dust ingestion rates from the various activity pattern modeling studies.
For example, the mean soil + dust ingestion rate for children 1 to <6 years was estimated as follows (see Table 5-34 for additional details):
IRsoil + dust = (IRt [99 mg/day] + IRb [90 mg/day] +
IRa [65 mg/day]) / 3
IRsoil + dust = 84 mg/day
Where:
IRt = average of 132, 69, 66, and 129 mg/day (means from 4 tracers studies that represent children 1 to <6 years of age) = 99 mg/day; IRb = average of 113 and 67 mg/day (means from 2 biokinetic modeling studies that represent children 1 to <6 years of age) = 90 mg/day; IRa = average of 68 and 61 mg/day (means from 2 activity pattern studies that represent children 1 to <6 years) = 65 mg/day.
Using the number of study participants in the various studies to weight the means and upper percentile estimates would not change the recommended values, when rounded to one significant figure. Also, although there might be alternatives to averaging upper percentile values to get an upper percentile value, it does not appear that other approaches would significantly change the upper percentile values for these data because the upper percentile values from all study types are similar when rounded to one significant figure.
As stated earlier in this chapter, the key studies were used as the basis for developing the soil and dust ingestion recommendations shown in Table 5-1. The following sections describe in more detail how the recommended soil and dust ingestion, soil pica, and geophagy values were derived. Appendix B
Update for Chapter 5 of the Exposure Factors Handbook
Chapter 5—Soil and Dust Ingestion
September 2017 Page 5-47
provides a comparison of data from the tracer studies conducted in Amherst, MA, Washington State, Anaconda, MT, and western MA. Appendix C provides a detailed summary of the key studies used in developing the recommended soil and dust ingestion rates. Appendix D provides a detailed summary of the studies on the prevalence of pica.
5.5.1. Central Tendency Soil and Dust Ingestion Recommendations
In general, “central tendency” recommendations in this chapter reflect an arithmetic mean (average) of measured values within a study, across studies within a methodology, and across the three methodologies. For some studies, arithmetic means were not available from the study, and some other central estimate was used. For example, for some of the tracer studies, the means represent the average of the median values for multiple tracers for each child. As noted, when describing how different estimates were averaged, there is uncertainty as to what is a central estimate consumption rate. Also, for some studies, the age groups evaluated did not match the age stratifications in EPA’s Guidance on Selecting Age Groups for Monitoring and Assessing Childhood Exposures to Environmental Contaminants (U.S. EPA, 2005). However, for the purpose of providing recommended values for use in risk assessment, the ages were assumed to represent the age categories that they most closely matched.
For infants of 0 to <6 months in age, the recommended central tendency soil + dust ingestion estimate for use in risk assessments is 40 mg/day (36 mg/day rounded to one significant figure). This value is based on a single key activity pattern modeling study that provided data for infants 0 to <7 months (Wilson et al., 2013). Based on the assumption that 45% of the soil + dust ingestion can be attributed to soil and 55% can be attributed to dust, as in EPA’s IEUBK model for lead in older children (U.S. EPA, 1994a), the central tendency soil ingestion rate for infants 0 to <6 months of age is 18 mg/day and the dust ingestion rate is 22 mg/day. Rounded to one significant figure, both soil and dust mean ingestion estimates for infants 0 to <6 months of age are 20 mg/day. Because the Wilson et al. (2013) study did not include exposures from object-to-mouth contact, the recommended values provided here may underestimate soil + dust ingestion among this age group.
For infants, 6 months to <1 year, data from two key biokinetic modeling studies were used to estimate a central tendency soil + dust ingestion rate of 70 mg/day; no key tracer studies or activity
pattern modeling studies were available for this age group. This value is based on the average of the central estimate generated by von Lindern et al. (2016) and an EPA-adjusted central estimate from Hogan et al. (1998). Using the IEUBK model, Hogan et al. (1998) reported a predicted geometric mean blood lead level that was 1.4-fold higher than the geometric mean blood lead levels observed for 31 children 6- to 12-months old from a site in Illinois. The default soil and dust intakes for the 6- to 12-month old infants in the model (U.S. EPA, 1994b) are 38 mg soil/day and 47 mg house dust/day, for a total soil + dust intake of 85 mg/day for this life stage (U.S. EPA, 1994a). Assuming all other model input parameters are roughly accurate, EPA adjusted the default ingestion rate of 85 mg/day by a factor of 1.4 to estimate a soil + dust ingestion rate of 61 mg/day. Also using the biokinetic modeling approach, von Lindern et al. (2016) reported a mean value of 81 mg/day for children 6 months to <1 year of age, based on the average of the two best-fit model runs, as described in Section 5.3.3.7. The average of the estimates from these two biokinetic modeling studies is 71 mg/day (rounded to 70 mg/day). Based on the assumption that 45% of the soil + dust ingestion can be attributed to soil and 55% can be attributed to dust, as in EPA’s IEUBK model for lead (U.S. EPA, 1994a), the central tendency soil ingestion rate for infants 6 months to <1 year of age is 32 mg/day and the dust ingestion rate is 38 mg/day. Rounded to one significant figure, the mean soil-only estimate is 30 mg/day and the mean dust-only estimate is 40 mg/day.
For children 1 to <2 years and children 2 to <6 years, the recommended central tendency soil + dust ingestion estimate for use in risk assessments are 90 mg/day (92 mg/day rounded to one significant figure) and 60 mg/day (62 mg/day rounded to one significant figure), respectively. These values are based on a single key biokinetic modeling study that provided data for these age groups (von Lindern et al., 2016). The averages of the two best-fit model runs were used for these age groups (see Section 5.3.3.7). Based on the assumption that 45% of the soil + dust ingestion can be attributed to soil and 55% can be attributed to dust, as in EPA’s IEUBK model (U.S. EPA, 1994a) for lead, the central tendency soil ingestion rate for children 1 to <2 years of age is 41 mg/day and the dust ingestion rate is 49 mg/day. Rounded to one significant figure, the soil ingestion rate is 40 mg/day and the dust ingestion rate is 50 mg/day for children 1 to <2 years old. For children 2 to <6 years, the soil-only estimate is 27 mg/day and the dust-only value is 33 mg/day. Rounded to one significant
Update for Chapter 5 of the Exposure Factors Handbook
Chapter 5—Soil and Dust Ingestion
September 2017 Page 5-48
figure, both soil and dust mean ingestion estimates for infants 2 to <6 years of age are 30 mg/day.
For children ages 1 to <6 years the recommended central tendency ingestion rate for use in risk assessment is 80 mg/day. This value is based on estimates provided by studies conducted using tracer, biokinetic modeling, and activity pattern modeling approaches. Four key tracer studies (Calabrese et al. [1989] as reanalyzed by Stanek and Calabrese [1995a]; Davis et al. [1990] as reanalyzed by Stanek and Calabrese [1995a]; Calabrese et al. [1997a,b]) estimated central tendency soil and dust ingestion rates for children ranging in age from 1 to <8 years (N = 241). The estimates ranged from 66 to 132 mg/day, with an average of 99 mg/day. For the Calabrese et al. (1989) study, as reanalyzed by Stanek and Calabrese et al. (1995a), the average of the median of the best four tracers for each child was used in developing the recommendations for children 1 to <6 years of age. Stanek and Calabrese et al. (1995a) suggest that this is the most reliable estimate for this data set. For the Davis et al. (1990) study, as reanalyzed by Stanek and Calabrese (1995a), data for only three tracers were available, and the average of the median of these three tracers was used. For the Calabrese et al. (1997a) study, the average based of the best tracer for each child was used. This estimate was assumed to be more reliable than the average of the best four tracers because the central tendency estimates for some of the four individual tracers were negative. For Calabrese et al. (1997b), data were available for aluminum, silicon, and titanium. However, only the data for aluminum and silicon were used, given the high degree of variability in the titanium estimates. The results of two biokinetic modeling studies were used (Hogan et al., 1998; von Lindern et al., 2016) in developing the recommendations for children 1 to <6 years of age. In the Hogan et al. (1998) study, blood levels for 471 children were similar to those predicted by the IEUBK model. The IEUBK default soil + dust ingestion values used in the Hogan et al. (1998) biokinetic modeling study were 135 mg/day for 1-, 2-, and 3-year-olds; 100 mg/day for 4-year-olds; 90 mg/day for 5-year-olds; and 85 mg/day for 6-year-olds (U.S. EPA 1994b, 2007). The time-averaged daily soil + dust ingestion rate for these 6 years of life was 113 mg/day. Also, using the biokinetic modeling approach, von Lindern et al. (2016) estimated a mean soil ingestion rate of 68 mg/day for children 1 to <6 years of age (N = 1,075), based on the average of the two best-fit model runs, as described in Section 5.3.3.6. The average based on these two biokinetic model studies is 91 mg/day. The two activity pattern modeling
studies provide somewhat lower soil + dust ingestion estimates for this life stage. Özkaynak et al. (2011) provided an estimate of 68 mg/day for 3- to <6-year-old children, and Wilson et al. (2013) provided an estimate of 61 mg/day for children aged 7 months to <5 years. The mean of these two estimates is 65 mg/day. Averaging the soil + dust ingestion estimates from the three approaches yields a soil + dust ingestion estimate of 84 mg/day which was rounded to 80 mg/day. Based on the assumption that 45% of the soil + dust ingestion can be attributed to soil and 55% can be attributed to dust, the central tendency estimates for soil and dust ingestion alone are both 40 mg/day, rounded to one significant figure (i.e., 36 mg/day soil and 44 mg/day dust) for children 1 to <6 years old. Although children 1 to <6 years old have been grouped together for the purposes of deriving this recommendation, it is important to note that children ages 1 to <2 years have been reported to have higher blood lead levels compared to other children (Hogan et al., 1998). This age group also presents higher mouthing behavior frequency (i.e., hand-to-mouth and object-to-mouth) than other age groups based on the available data (See Chapter 4 of this handbook). Default soil ingestion rates used in the IEUBK model are higher for this age group than for older aged children, and von Lindern et al. (2016) showed that soil ingestion rate for this age group was the highest among all of the age groups evaluated up to <10 years of age, with an estimated value of 93 mg/day. The recommended soil ingestion rate for 1- to <2-year-olds for use in risk assessment is 90 mg/day, based on the von Lindern et al. (2016) study, as discussed above.
For children 6 to <12 years old, the recommended central tendency soil + dust ingestion rate is based on data from one biokinetic modeling study (von Lindern et al., 2016) and one activity pattern modeling study (Wilson et al., 2013). Based on biokinetic modeling, soil + dust ingestion was estimated to be 56 mg/day for 6- to <10-year-olds, based on the average of two best-fit model runs conducted by von Lindern et al. (2016) (see Section 5.3.3.7). The estimate for 5- to <12-year-olds, predicted by Wilson et al. (2013) using the activity pattern modeling was also 55 mg/day. The average of these two estimates is 56 mg/day. Rounded to one significant figure, the central tendency soil + dust ingestion rate for this life stage is 60 mg/day. Again, assuming that 45% of the soil + dust ingestion can be attributed to soil and 55% can be attributed to dust, the central tendency estimates for soil and dust ingestion alone are both 30 mg/day, rounded to one significant figure, for 6- to <12-year-old children.
Update for Chapter 5 of the Exposure Factors Handbook
Chapter 5—Soil and Dust Ingestion
September 2017 Page 5-49
For older children (i.e., ages 12 to <19 years) and general population adults (i.e., ages ≥19 years), the recommended central tendency soil + dust ingestion rate is 30 mg/day. This is based on data from one key tracer study for adults (Davis and Mirick, 2006) and one activity pattern modeling study (Wilson et al., 2013). Davis and Mirick (2006) reported a mean soil + dust ingestion rate of 52 mg/day for 33 adults, based on average estimates using aluminum and silicon as tracers. Wilson et al. (2013) used an activity pattern modeling approach to estimate soil + dust ingestion among various age groups, including teens (ages 12 to <20 years), adults (ages 20 to 59 years), and senior (ages 60+ years). The estimated soil + dust ingestion rates were 3.7 mg/day for teens, 4.2 mg/day for adults, and 3.8 mg/day for seniors. Given the similarity in these estimates, the three ages group were combined into one category (i.e., 12 years through adults), with a central tendency soil + dust ingestion estimate of 4 mg/day. Averaging the estimates from the Davis and Mirick (2006) tracer study and the Wilson et al. (2013) activity pattern modeling study results in a central tendency soil + dust ingestion estimate of 28 mg/day. Rounded to one significant figure, this value is 30 mg/day. Assuming that 45% of the soil + dust ingestion can be attributed to soil and 55% can be attributed to dust, the central tendency estimate for soil is 13 mg/day and the estimate for dust is 17 mg/day. Rounded to one significant figure, the central tendency estimates are 10 mg/day and soil and 20 mg/day dust.
For rural populations following traditional rural or wilderness lifestyles as described by Doyle et al. (2012) and Irvine et al. (2014) adult soil ingestion rates may be somewhat higher than those of the general population (see Sections 5.3.4.20 and 5.3.4.21). Doyle et al. (2012) conducted a tracer study in Canada in which the estimated mean soil + dust was 42 mg/day based on the average values for aluminum and silicon tracers. Irvine et al. (2014) also conducted a tracer study in Canada and estimated a mean soil + dust ingestion rate of 52 mg/day, based on the aluminum and silicon tracers. The average of these two values is 47 mg/day. Rounded to one significant figure, the soil + dust ingestion estimate is 50 mg/day (20 mg/day soil and 30 mg/day dust).
5.5.2. Upper Percentile, Soil Pica, and Geophagy Recommendations
In general, there is considerably more uncertainty related to the upper percentile soil and dust ingestion rate estimates than for the average
estimates. Biases due to the errors (e.g., sampling errors, measurement errors, analytical errors, etc.) are more likely to affect the upper percentile estimates than the average estimates. The use of data obtained from short-term studies to represent long-term usual behavior also introduces biases that may have a more considerable effect on the upper percentile estimates.
The upper percentile soil + dust ingestion rate for infants 0 to <6 months of age was estimated to be 100 mg/day. This value is based on a single key activity pattern modeling study that provided a soil + dust ingestion rate of 140 mg/day for infants 0 to <7 months (Wilson et al., 2013). Rounded to one significant figure, this value is 100 mg/day. Based on the assumption that 45% of the soil + dust ingestion can be attributed to soil and 55% can be attributed to dust, as in EPA’s IEUBK model for lead in older children (U.S. EPA, 1994a), the upper percentile soil ingestion rate for infants 0 to <6 months of age is 45 mg/day and the dust ingestion rate is 55 mg/day. Rounded to one significant figure, the soil ingestion rate is assumed to be 50 mg/day for soil and 60 mg/day for dust for infants 0 to <6 months of age. An uncertainty associated with this estimate is that the Wilson et al. (2013) study did not include exposures from object-to-mouth contact. Thus, the recommended values provided here may underestimate soil + dust ingestion among this age group.
The recommended upper percentile soil + dust ingestion rate for infants 6 months to <1 year is 200 mg/day. This value is based on data from one biokinetic modeling study. Von Lindern et al. (2016) provided a 95th percentile value of 208 mg/day, based on the average of two best-fit model runs (see Section 5.3.3.6), which has been rounded to 200 mg/day. It is assumed that 90 mg/day represents soil ingestion and 110 mg/day represents dust ingestion, based on the assumption that 55% of the 200 mg/day is soil and 45% is dust. Rounded to one significant figure the recommended upper percentile ingestion rates for infants 6 months to 1 year of age are 90 mg/day soil and 100 mg/day dust.
The von Lindern et al. (2016) biokinetic modeling study was also used as the basis for the upper percentile soil + dust ingestion rate for children 1 to <2 years of age and 2 to <6 years of age. For 1- to <2-year-olds, the upper percentile soil + dust ingestion rate was 240 mg/day, based on the average of two best-fit model runs (see Section 5.3.3.6). Rounded to one significant figure, the soil + dust ingestion recommendation for use in risk assessment is 200 mg/day (90 mg/day soil; 100 mg/day dust). For children ages 2 to <6 years, von
Update for Chapter 5 of the Exposure Factors Handbook
Chapter 5—Soil and Dust Ingestion
September 2017 Page 5-50
Lindern et al. (2016) reported an upper percentile soil + dust ingestion rate of 162 mg/day, based on the average of two best-fit model runs. Rounded to one significant figure, the soil + dust ingestion recommendation for use in risk assessment is also 200 mg/day (90 mg/day soil; 100 mg/day dust).
For children 1 to <6 years old, upper percentile soil + dust ingestion rates were derived from three tracer studies that used the BTM approach, one biokinetic study, and two activity pattern studies. The 95th percentile soil + dust ingestion estimates from the three tracer studies ranged from 154 to 282 mg/day, with a mean of 227 mg/day (N = 229) (Calabrese et al. [1989] as reanalyzed by Stanek and Calabrese [1995a]; Davis et al. [1990]; Calabrese et al. [1997a]). Von Lindern et al. (2016) estimated a 95th percentile rate of 178 mg/day. Özkaynak et al. (2011) and Wilson et al. (2013) reported similar estimates of the 95th percentile value (i.e., 224 mg/day and 204 mg/day for age groups 3 to <6 years and 7 months to <5 years, respectively). The average of these two values is 214 mg/day. Averaging the estimates from the three approaches gives an estimated 95th percentile soil + dust ingestion rate of 206 mg/day for children ages 1 to <6 years. Rounding to one significant figure, the recommended upper percentile estimate of soil + dust ingestion is 200 mg/day (90 mg/day soil; 100 mg/day dust).
Similar upper percentile estimates were provided for older children by von Lindern et al. (2016) and Wilson et al. (2013), and the recommended soil + dust ingestion rate for risk assessment purposes is also 200 mg/day. This upper percentile recommendation is the average of the von Lindern et al. (2016) estimate of 155 mg/day for children ages 6 to <10 years and the Wilson et al. (2013) estimate of 185 mg/day for children ages 5 to <12 years. The average of these two values is 170 mg/day. Rounded to one significant figure the soil + dust ingestion recommendation for use in risk assessment is 200 mg/day (90 mg/day soil; 100 mg/day dust).
Data that could be used to develop an upper percentile soil + dust ingestion rate for ages 12 years through adult were limited. For example, an upper percentile rate was not provided in the only adult tracer study. The only data available were from a single activity pattern study that provided an upper percentile rate (i.e., 14 mg/day) for teens, adults, and seniors that is inconsistent with the recommended central tendency rate of 30 mg/day. Therefore, an upper percentile recommendation for 12 years of age through adults was developed by assuming that the ratio of the 95th percentile value to the mean value for adults is the same as the average of the ratios of
95th percentiles to means for all other age groups (i.e., average ratio of the 95th percentile recommendations to the mean recommendation for all ages groups <12 years = 3.2). It should be noted that this assumes that the variance is the same for children and adults. Because estimates for adults are lower than those of children, they are likelier to have a lower variance. Applying this ratio to the central tendency estimate of 30 mg/day for the 12 years through adult age group gives an estimated upper percentile value of 100 mg/day (i.e., 30 mg/day × 3.2 = 94 mg/day, rounded to one significant figure). If upper percentile soil- or dust-only values are needed, the recommended rates are 50 mg/day soil and 60 mg/day dust. These values are rounded to one significant figure from 45 mg/day and 55 mg/day, assuming that 45% of the soil + dust estimate is soil and 55% is dust.
For rural populations following traditional rural or wilderness lifestyles the data from tracer studies conducted in rural Canadian locations and reported in Doyle et al. (2012) and Irvine et al. (2014) (see Section 5.3.4.20 and 5.3.4.21) may be used to estimate an upper percentile soil + dust ingestion rate for this population. Doyle et al. (2012) reported a 90th percentile soil + dust ingestion rate of 124 mg/day, based on the average of the results using aluminum and silicon as tracers. Irvine et al. (2014) reported a 90th percentile value of 220 mg/day based on the average of these same two tracers. Averaging the results from these two studies gives an upper percentile estimate of 172 mg/day. Rounded to one significant figure, the upper percentile soil + dust ingestion rate for these populations would be 200 mg/day (90 mg/day soil and 100 mg/day dust).
For the upper percentile soil pica and geophagy recommendations shown in Table 5-1, two primary lines of evidence suggest that at least some U.S. children exhibit soil pica behavior at least once during childhood. First, the survey response studies of reported soil ingestion behavior that were conducted in numerous U.S. locations and of different populations consistently yield a certain proportion of respondents who acknowledge soil ingestion by children. The surveys typically did not ask explicit and detailed questions about the soil ingestion incidents reported by the caregivers who acknowledged soil ingestion in children. Responses conceivably could fall into three categories: (1) responses in which caregivers interpret visible dirt on children’s hands and subsequent hand-to-mouth behavior as soil ingestion; (2) responses in which caregivers interpret intentional ingestion of clay, “dirt,” or soil as soil ingestion; and (3) responses in which caregivers
Update for Chapter 5 of the Exposure Factors Handbook
Chapter 5—Soil and Dust Ingestion
September 2017 Page 5-51
regard observations of hand-to-mouth behavior of visible quantities of soil as soil ingestion. Knowledge of soils’ bulk density allows one to infer that these latter observed hand-to-mouth soil ingestion incidents are likely to represent a quantity of soil that meets the quantity part of the definition of soil pica used in this chapter, or 1,000 mg. Occasionally, what is not known from survey response studies is whether the latter type of survey responses include responses regarding repeated soil ingestion that meets the definition of soil pica used in this chapter. The second category probably does represent ingestion that would satisfy the definition of soil pica as well as geophagy. The first category may represent relatively small amounts that appear to be ingested by many children based on the biokinetic modeling studies and the tracer element studies. Second, the U.S. tracer studies report a wide range of soil ingestion values. Due to averaging procedures used, for 4-, 7-, or 8-day periods, the rounded range of these estimates of soil ingestion behavior that apparently met the definition of soil pica used in this chapter is from 1,000 to 6,000 mg/day averaged over the study period. Due to the short-term nature of these studies and the limited amount of data available for children exhibiting pica behavior, the lower end of this range of 1,000 mg/day is recommended for use in risk assessments involving soil pica for children 1 to <6 years old. However, it is important to note that soil ingestion for these children exhibiting soil pica behavior has been reported as high as 20 to 25 g/day on a given day (Calabrese et al., 1997b).
Although no tracer element studies or biokinetic model comparison studies have been performed for children 15- to <21-year-olds in which soil pica behavior has been investigated, EPA is aware of one study documenting pica behavior in a group that includes children in this age range (Hyman et al., 1990). The study was not specific regarding whether soil pica (vs. other pica substances) was observed, nor did it identify the specific ages of the children observed to practice pica. In the absence of data that can be used to develop specific soil pica ingestion recommendations for children aged 15 years and 16 to <21 years, EPA recommends that risk assessors who need to assess risks via soil and dust ingestion to children ages 15 to <21 years use the same soil ingestion rate as that recommended for younger children, in the 1 to <6, 6 to <11, and 11 to <16-year age categories.
Researchers who have studied human geophagy behavior around the world typically have studied populations in specific locations, and often include investigations of soil properties as part of the
research (Wilson, 2003; Aufreiter et al., 1997). Most studies of geophagy behavior in the United States were survey response studies of residents in specific locations who acknowledged eating clays. Typically, study subjects were from a relatively small area such as a county, or a group of counties within the same state. Although geophagy behavior may have been studied in only a single county in a given state, documentation of geophagy behavior by some residents in one or more counties of a given state may suggest that the same behavior also occurs elsewhere within that state.
A qualitative description of amounts of soil ingested by geophagy practitioners was provided by Vermeer and Frate (1979) with an estimated mean amount, 50 g/day that apparently was averaged over 32 adults and 18 children. The 18 children whose caregivers acknowledged geophagy (or more specifically, eating of clay) were (N = 16) ages 1 to 4 and (N = 2) ages 5 to 12 years. The definition of geophagy used included consumption of clay “on a regular basis over a period of weeks.” EPA is recommending this 50 g/day value for geophagy. This mean quantity is roughly consistent with a median quantity reported by Geissler et al. (1998) in a survey response study of geophagy in primary school children in Nyanza Province, Kenya (28 g/day, range 8 to 108 g/day; interquartile range 13 to 42 g/day).
Several studies are available that investigated pica behavior among pregnant women. Many of these studies focus on the prevalence of the behavior, and very few provide data on amounts ingested (Fawcett et al., 2016; Lin et al., 2015; Lumish et al., 2014; Klitzman et al., 2002; Simpson et al., 2000; Smulian et al., 1995; Cooksey, 1995; Bronstein and Dollar 1974; Ferguson and Keaton, 1950). Studies of pica among pregnant women in various U.S. locations (Rainville, 1998; Corbett et al., 2003; Smulian et al., 1995) suggest that clay geophagy among pregnant women may include those less than 21 years old (Smulian et al., 1995; Corbett et al., 2003). Smulian provides a quantitative estimate of clay consumption of approximately 200−500 g/week, for the very small number of geophagy practitioners (N = 4) in that study’s sample (N = 125). If consumed on a daily basis, this quantity (approximately 30 to 70 g/day) is roughly consistent with the Vermeer and Frate (1979) estimated mean of 50 g/day.
Johns and Duquette (1991) describe use of clays in baking bread made from acorn flour, in a ratio of 1 part clay to 10 or 20 parts acorn flour, by volume, in a Native American population in California and in Sardinia (~12 grams clay suspended in water added
Update for Chapter 5 of the Exposure Factors Handbook
Chapter 5—Soil and Dust Ingestion
September 2017 Page 5-52
to 100 grams acorn). Either preparation method would add several grams of clay to the final prepared food; daily ingestion of the food would amount to several grams of clay.
5.6. REFERENCES FOR CHAPTER 5 ASTM (American Society for Testing and Materials)
(2017) Standard specification for woven wire test sieve cloth and test sieves. Designation: E11-17. ASTM International, West Conshohocken, PA.
ATSDR (Agency for Toxic Substances and Disease Registry). (2001) Summary report for the ATSDR soil-pica workshop. ATSDR, U.S. Department of Health and Human Services, Atlanta, GA. March 20, 2001.
Aufreiter, S; Hancock, RGV; Mahaney, WC; Stambolic-Robb, A; Sanmugadas, K. (1997) Geochemistry and mineralogy of soils eaten by humans. Int J Food Sci Nutr 48(5):293−305.
Barltrop, D. (1966) The prevalence of pica. Am J Dis Child 112(2):116−123.
Barnes, R. (1990) Childhood soil ingestion: how much dirt do kids eat? Anal Chem 62(19):1023A−1033A.
Beamer, PI; Elish, CA; Roe, DJ; Loh, M; Layton, DW. (2012) Differences in metal concentration by particle size in house dust and soil. J Environ Monit 14(3):839−844.
Bergstrom, C; Shira, J; Kissel, J. (2011) Particle size distributions, size concentration relationships, and adherence to hands of selected geologic media derived from mining, smelting, and quarrying activities. Sci Total Environ 409(20):4247−4256.
Binder, S; Sokal, D; Maughan, D. (1986) Estimating soil ingestion: the use of tracer elements in estimating the amount of soil ingested by young children. Arch Environ Health 41(6):341−345.
Black, K; Shalat, SL; Freeman, NC; Jimenez, M; Donnelly, KC; Calvin, JA. (2005) Children’s mouthing and food-handling behavior in an agricultural community on the US/Mexico border. J Expo Anal Environ Epidemiol 15(3):244–251.
Bronstein, ES; Dollar, J. (1974) Pica in pregnancy. J Med Assoc Ga 63(8):332–335.
Brown, MJ; McLaine, P; Dixon, S; Simon, P. (2006). A randomized, community-based trial of home visiting to reduce blood lead levels in children. Pediatrics 117(1):147–53.
Bruhn, CM; Pangborn, RM. (1971) Reported
incidence of pica among migrant families. J Am Diet Assoc 58(5):417−420.
Calabrese, EJ; Stanek, EJ. (1992a) Distinguishing outdoor soil ingestion from indoor dust ingestion in a soil pica child. Regul Toxicol Pharmacol 15:83−85.
Calabrese, EJ; Stanek, EJ. (1992b) What proportion of household dust is derived from outdoor soil? J Soil Contam 1(3):253−263.
Calabrese, EJ; Stanek, EJ. (1993) Soil pica: Not a rare event. J Environ Sci Health A 28(2):373−384.
Calabrese, EJ; Stanek, EJ. (1995) Resolving intertracer inconsistencies in soil ingestion estimation. Environ Health Perspect 103(5):454−456
Calabrese, EJ; Barnes, R; Stanek, EJ 3rd; Pastides, H.; Gilbert, CE; Veneman, P; Wang, X; Lásztity, A; Kostecki, PT. (1989) How much soil do young children ingest: An epidemiologic study. Regul Toxicol Pharm 10(2):123−137.
Calabrese, EJ; Stanek, EJ; Gilbert, CE; Barnes, R. (1990) Preliminary adult soil ingestion estimates: results of a pilot study. Regul Toxicol Pharmacol 12:88−95.
Calabrese, EJ; Stanek, EJ; Gilbert, CE. (1991) Evidence of soil-pica behavior and quantification of soil ingested. Hum Exp Toxicol 10(4):245−249.
Calabrese, EJ; Stanek, EJ; Barnes, R; Burmaster, DE; Callahan, BG; Heath, JS; Paustenbach, D; Abraham, J; Gephart, LA. (1996) Methodology to estimate the amount and particle size of soil ingested by children: implications for exposure assessment at waste sites. Regul Toxicol Pharmacol 24(3):264−268.
Calabrese, EJ; Stanek, EJ 3rd; Pekow, P; Barnes, RM. (1997a) Soil ingestion estimates for children residing on a superfund site. Ecotoxicol Environ Saf 36(3):258−268.
Calabrese, EJ; Stanek, EJ; Barnes, RM. (1997b) Soil ingestion rates in children identified by parental observation as likely high soil ingesters. J Soil Contam 6(3):271−279.
Cao, ZG; Yu, G; Chen, YS; Cao, QM; Fiedler, H; Deng, SB; Huang, J; Wang, B. (2012) Particle size: A missing factor in risk assessment of human exposure to toxic chemicals in settled indoor dust. Environ Int 49:24–30.
Carlisle, EM. (1980) Biochemical and morphological changes associated with long bone abnormalities in silicon
Update for Chapter 5 of the Exposure Factors Handbook
Chapter 5—Soil and Dust Ingestion
September 2017 Page 5-53
deficiency. J Nutr 110(5):1046−1055. Chen, Z; Klein, T; Murray, RZ; Crawford, R;
Chang, J; Wu, C; Xiao, Y. (2016) Osteoimmodulation for the development of advanced bone biomaterials. Mater Today 19(6):304−321.
Chien, LC; Tsou, MC; Hsi, HC; Beamer, P; Bradham, K; Hseu, ZY; Jien, SH; Jiang, CB; Dang, W; Özkaynak, H. (2015) Soil ingestion rates for children under 3 years old in Taiwan. J Expo Sci Environ Epidemiol 27(2):33−40.
Choate, LM; Ranville, JF; Bunge, AL; Macalady, DL. (2006) Dermally adhered soil: 1. Amount and particle size distribution. Int Environ Assess Manag 2(4):375−384.
Clausing, P; Brunekreef, B; Van Wïjnen, JH. (1987) A method for estimating soil ingestion by children. Int Arch Occup Environ Health 59(1):73−82.
Cooksey, NR. (1995) Pica and olfactory craving of pregnancy: How deep are the secrets? Birth 22(3):129−137.
Cooper, M. (1957) Pica: A survey of the historical literature as well as reports from the fields of veterinary medicine and anthropology, the present study of pica in young children, and a discussion of its pediatric and psychological implications. Springfield, IL: Charles C. Thomas.
Corbett, RW; Ryan, C; Weinrich, SP. (2003) Pica in pregnancy: Does it affect pregnancy outcome? MCN Am J Matern Child Nurs 25(3):183−189.
Danford, DE. (1982) Pica and nutrition. Annu Rev Nutr 2:303−322.
Danford, DE. (1983) Pica and zinc. In: Prasad, AS; Cavdar, AO; Brewer, GJ; Aggett, PJ; eds. Zinc deficiency in human subjects. New York: Alan R. Liss, Inc., pp. 185−195.
Davis, S; Mirick, D. (2006) Soil ingestion in children and adults in the same family. J Exp Anal Environ Epidem 16:63−75.
Davis, S; Waller, P; Buschbom, R; Ballou, J; White, P. (1990) Quantitative estimates of soil ingestion in normal children between the ages of 2 and 7 years: Population based estimates using aluminum, silicon, and titanium as soil tracer elements. Arch Environ Health 45(2):112−122.
Davis, S; Myers, PA; Kohler, E; Wiggins, C. (1995) Soil ingestion in children with pica: Final report. U.S. EPA Cooperative Agreement CR 816334-01. Fred Hutchinson Cancer Research Center, Seattle, WA.
Dickins, D; Ford, RN. (1942) Geophagy (dirt eating) among Mississippi Negro school children. Amer Soc Rev 7:59−65.
Dominy, NJ; Davoust, E; Minekus, M. (2003) Adaptive function of soil consumption: an in vitro study modeling the human stomach and small intestine. J Exp Biol 207:319−324.
Doyle, JR; Blais, JM; Holmes, RD; White, PA. (2012) A soil ingestion pilot study of a population following a traditional lifestyle typical of rural and wilderness areas. Sci Total Environ 424:110–120.
Fawcett, EJ; Fawcett, JM; Mazmanian, D. (2016) A meta-analysis of the worldwide prevalence of pica during pregnancy and the postpartum period. Int J Gynecol Obstet 133(3):277–283.
Ferguson, JH; Keaton, A. (1950) Studies of the diets of pregnant women in Mississippi: II Diet patterns. New Orleans Med Surg J 103(2):81–87.
Ferguson, AC; Canales, RA; Beamer, P; Auyeung, W; Key, M; Munninghoff, A; Lee, KT; Robertson, A; Leckie, JO. (2006) Video methods in the quantification of children’s exposures. J Expo Sci Environ Epidemiol 16(3):287–298.
Gavrelis, N; Sertkaya, A; Bertelsen, L; Cuthbertson, B; Phillips, L; Moya, J. (2011) An analysis of the proportion of the U.S. population that ingests soil or other non-food substances. Hum Ecol Risk Assess 17(4):996–1012.
Geissler, PW; Shulman, CE; Prince, RJ; Mutemi, W; Mnazi, C; Friis, H; Lowe, B. (1998) Geophagy, iron status and anaemia among pregnant women on the coast of Kenya. Trans Royal Soc Trop Med Hyg 92(5):549−553.
Glickman, LT; Chaudry, IU; Costantino, J; Clack, FB; Cypess. RH; Winslow, L. (1981) Pica patterns, toxocariasis, and elevated blood lead in children. Am J Trop Med Hyg 30(1):77−80.
Grigsby, RK; Thyer, BA; Waller, RJ; Johnston, GA Jr. (1999) Chalk eating in middle Georgia: A culture-bound syndrome of pica? South Med J 92(2):190−192.
Groot, ME; Lekkerkerk, MC; Steenbekkers, LPA. (1998) Mouthing behavior of young children: An observational study. Wageningen, the Netherlands: Agricultural University. Available online at http://edepot.wur.nl/384470.
Harris, SG; Harper, BL. (1997) A Native American
Update for Chapter 5 of the Exposure Factors Handbook
Chapter 5—Soil and Dust Ingestion
September 2017 Page 5-54
exposure scenario. Risk Anal 17(6):789−795.
Hawley, JK. (1985) Assessment of health risk from exposure to contaminated soil. Risk Anal 5(4):289−302.
Hogan, K; Marcus, A; Smith, R; White, P. (1998) Integrated exposure uptake biokinetic model for lead in children: empirical comparisons with epidemiologic data. Environ Health Perspect 106 (Supp 6):1557−1567.
Hooda, PS; Henry, CJ; Seyoum, TA; Armstrong, LD; Fowler, MB. (2004) The potential impact of soil ingestion on human mineral nutrition. Sci Total Environ 333(1−3):74−87.
Hook, EB. (1978) Dietary cravings and aversions during pregnancy. Am J Clini Nutri 31:1355−1362.
Hwang, YH; Bornschein, RL; Grote, J; Menrath, W; Roda, S. (1997) Environmental arsenic exposure of children around a former copper smelter site. Environ Res 72:72−81.
Hyman, SL; Fisher, W; Mercugliano, M; Cataldo, MF. (1990) Children with self-injurious behavior. Pediatrics 85:437−441.
ICRP (International Commission on Radiological Protection). (2002) Basic anatomical and physiological data for use in radiological protection: reference values. A report of age- and gender-related differences in the anatomical and physiological characteristics of reference individuals. ICRP Publication 89. Ann ICRP 32 (3−4):5−265.
Ikegami, M; Yoneda, M; Tsuji, T; Bannai, O; Morisawa, S. (2014) Effect of particle size on risk assessment of direct soil ingestion and metals adhered to children’s hands at playgrounds. Risk Anal 34(9):1677−1687.
Irvine, G; Doyle, JR; White, PA; Blais, JM. (2014) Soil ingestion rate determination in a rural population in Alberta, Canada practicing a wilderness lifestyle. Sci Tot Environ. 470-471:138−146.
Jang, JY; Kim, SY; Kim, SJ; Lee, KE; Cheong, HK; Kim, EH; Choi, KH; Kim, YH. (2014) General factors of the Korean exposure factors handbook. J Prev Med Pub Health 47:7−17.
Johns, T; Duquette, M. (1991) Detoxification and mineral supplementation as functions of geophagy. Am J Clin Nutr 53(2):448−456.
Jordan, CM; Yust, BL; Robison, LL; Hannan, P; Deinard, AS. (2003) A randomized trial of
education to prevent lead burden in children at high risk for lead exposure: Efficacy as measured by blood lead monitoring. Environ Health Perspect 111(16):1947–51.
Jugdaohsingh, R. (2007) Silicon and bone health. J Nutr Health Aging 11(2):99–110.
Jugdaohsingh, R; Anderson, SHC; Tucker, KL; Elliott, H; Kiel, DP; Thompson, RPH; Powell, JJ. (2002) Dietary silicon intake and absorption. Am J Clin Nutr 75(5):887−893.
Klitzman, S; Sharma, A; Nicaj, L; Vitkevich, R; Leighton, J. (2002) Lead poisoning among pregnant women in New York City: Risk factors and screening practices. J Urban Health 79(2):225−237.
Kinnell, HG. (1985) Pica as a feature of autism. Br J Psychiatry 147:80−82.
Kissel, JC; Shirai, JH; Richter, KY; Fenske, RA. (1998a) Empirical investigation of hand-to-mouth transfer of soil. Bull Environ Contam Toxicol 60(3):379−86.
Kissel, JC; Shirai, JH; Richter, KY; Fenske, RA. (1998b) Investigation of dermal contact with soil in controlled trials. J Soil Contam 7(6):737−752.
Korman, SH. (1990) Pica as a presenting symptom in childhood celiac disease. Am J Clin Nutr 51(2):139−141.Lanphear, BP; Winter, NL; Apetz, L; Eberly, S; Weitzman M. (1996). A randomized trial of the effect of dust control on children’s blood lead levels. Pediatrics 98(1):35–40.
Lanphear, BP; Winter, NL; Apetz, L; Eberly, S; Weitzman M. (1996) A randomized trial of the effect of dust control on children’s blood lead levels. Pediatrics 98(1):35–40.
Lanphear, BP; Howard, C; Eberly, S; Auinger, P; Kolassa, J; Weitzman, M; Schaffer, SJ; Alexander, K. (1999) Primary prevention of childhood lead exposure: A randomized trial of dust control. Pediatrics 103(4 Pt 1):772–777.
Layton DW; Beamer, P (2009) Migration of contaminated soil and airborne particulates to indoor dust. Environ Sci Technol. 43 (21), 8199-8205.
Lasztity, A; Wang, X; Viczian, M; Israel, Y; Barnes, R. (1989) Inductively coupled plasma spectrometry in the study of childhood soil ingestion. Part 2. Recovery. J Anal Atomic Spectrom 4(8):737−742.
Lin, JW; Temple, L; Trujillo, C; Mejia-Rodriquez, F; Rosas, LG; Fernald, L; Young, SL. (2015)
Update for Chapter 5 of the Exposure Factors Handbook
Chapter 5—Soil and Dust Ingestion
September 2017 Page 5-55
Pica during pregnancy among Mexican-born women: a formative study. Matern Child Nutr 11:550−558.
Lumish, RA; Young, SL; Lee, S; Cooper, E; Pressman, Eva; Guillet, R; O'Brien, KO. (2014) Gestational iron deficiency is associated with pica behaviors in adolescents. J Nutr 144(10):1533−1539.
Ma, J; Pan, LB; Wang, Q; Lin, CY; Duan, XL; Hou, H. (2016) Estimation of the daily soil/dust (SD) ingestion rate of children from Gansu Province, China via hand-to-mouth contact using tracer elements. Environ Geochem Health. DOI 10.1007/s10653-016-9906-1.
Manton, WI; Angle, CR; Stanek, KL; Reese, YR; Kuehnemann, TJ. (2000) Acquisition and retention of lead by young children. Environ Res 82:60−80.
Marmor, M; Glickman, L; Shofer, F; Faich, LA; Rosenberg, C; Cornblatt, B; Friedman, S. (1987) Toxocara canis infection of children: epidemiologic and neuropsychologic findings. Am J Public Health 77(5):554−559.
Moya, J; Phillips, L. (2014) A review of soil and dust ingestion studies for children. J Expo Sci Environ Epidemiol 24:545−554.
NCDC (National Climatic Data Center). (2006) Data documentation for data set TD3200: (DSI-3200). Surface land daily cooperative summary of the day. Asheville, NC: National Climatic Data Center. Available online at https://rda.ucar.edu/datasets/ds510.0/docs/2006jun.td3200.html.
Nelson, S; Greene, T; Ernhart, CB. (1996) Toxocara canis infection in preschool age children: risk factors and the cognitive development of preschool children. Neurotoxicol Teratol 18(2):167−174.
Nielsen, FH. (2014) Update on the possible nutritional importance of silicon. J Trace Elem Med Biol 28(4): 379−382.
Obialo, CI; Crowell, AK; Wen, XJ; Conner, AC; Simmons, EL. (2001) Clay pica has no hematologic or metabolic correlate in chronic hemodialysis patients. J Ren Nutr 11(1):32−36.
Özkaynak, H; Xue, J; Zartarian, VG; Glen, G; Smith, L. (2011) Modeled estimates of soil and dust ingestion rates for children. Risk Anal 31(4):592−608.
Powell, JJ; Ainley, CC; Harvey, RS; Mason, IM; Kendall, MD; Sankey, EA; Dhillon, AP; Thompson, RP. (1996) Characterisation of
inorganic microparticles in pigment cells of human gut associated lymphoid tissue. Gut 38(3):390−395.
Price, CT; Langford, JR; Liporace, FA (2012) Essential nutrients for bone health and a review of their availability in the average North American diet. Open Orthop J 6:143−149.
Rainville, AJ. (1998) Pica practices of pregnant women are associated with lower maternal hemoglobin level at delivery. J Am Diet Assoc 98(3):293−296.
Rhoads, GG; Ettinger, AS; Weisel, CP; Rhoads, GG; Ettinger, AS; Weisel, CP; Buckley, TJ; Goldman, KD; Adgate, J; Lioy, PJ. (1999). The effect of dust lead control on blood lead in toddlers: a randomized trial. Pediatrics 103(3):551-555.
Robischon, P. (1971) Pica practice and other hand-mouth behavior and children’s developmental level. Nurs Res 20(1):4−16.
Shepherd, NA; Crocker, PR; Smith, AP; Levison, DA. (1987) Exogenous pigment in Peyer’s patches. Hum Pathol 18(1):50−54.
Simpson, E; Mull, JD; Longley, E; East, J. (2000) Pica during pregnancy in low-income women born in Mexico. West J Med 173(1):20−24.
Smulian, JC; Motiwala, S; Sigman, RK. (1995) Pica in a rural obstetric population. South Med J 88(12):1236−1240.
Stanek, EJ III; Calabrese, EJ. (1995a) Soil ingestion estimates for use in site evaluations based on the best tracer method. Hum Ecol Risk Assess 1(3):133−156.
Stanek, EJ III; Calabrese, EJ. (1995b) Daily estimates of soil ingestion in children. Environ Health Perspect 103(3):276−285.
Stanek, EJ III; Calabrese, EJ. (2000) Daily soil ingestion estimates for children at a Superfund site. Risk Anal 20(5):627−635.
Stanek, EJ III; Calabrese, EJ; Mundt, K; Pekow, P; Yeatts, KB. (1998) Prevalence of soil mouthing/ingestion among healthy children aged 1 to 6. J Soil Contam 7(2):227–242.
Stanek, EJ III; Calabrese, EJ; Barnes, RM. (1999) Soil ingestion estimates for children in Anaconda using trace element concentrations in different particle size fractions. Hum Ecol Risk Assess 5(3):547−558.
Stanek, EJ III; Calabrese, EJ; Zorn, M. (2001a) Biasing factors for simple soil ingestion estimates in mass balance studies of soil
Update for Chapter 5 of the Exposure Factors Handbook
Chapter 5—Soil and Dust Ingestion
September 2017 Page 5-56
ingestion. Hum Ecol Risk Assess 7(2):329−355.
Stanek, EJ III; Calabrese, EJ; Zorn, M. (2001b) Soil ingestion distributions for Monte Carlo risk assessment in children. Hum Ecol Risk Assess 7(2):357−368.
Stanek, EJ III; Calabrese, EJ; Xu, B. (2012a) Meta-analysis of mass balance studies of soil ingestion in children. Risk Anal 32(3): 433−447.
Stanek, EJ III; Xu, B; Calabrese, EJ. (2012b) Equation reliability of soil ingestion estimates in mass-balance soil ingestion studies. Risk Anal 32(3):448−463.
Starks, PT; Slabach, BL. (2012) The scoop on eating dirt. Sci Am 306(6):30−32.
USDA (U.S. Department of Agriculture). (1999) Soil taxonomy: a basic system of soil classification for making and interpreting soil surveys. National Resources Conservation Service, Agriculture Handbook No. 436. Washington, DC: U.S. Government Printing Office. Available online at https://www.nrcs.usda.gov/Internet/FSE_DOCUMENTS/nrcs142p2_051232.pdf.
USDA (United States Department of Agriculture). (2008) Web soil survey. U.S. Department of Agriculture, Natural Resources Conservation Service. Available online at http://websoilsurvey.nrcs.usda.gov/app/HomePage.htm.
U.S. EPA (Environmental Protection Agency). (1994a) Guidance manual for the integrated exposure uptake biokinetic model for lead in children. Office of Solid Waste and Emergency Response Washington, DC; EPA 540/R-93/081. nepis.epa.gov/Exe/ZyPURL.cgi?Dockey=2000WN4R.TXT.
U.S. EPA (Environmental Protection Agency). (1994b) Technical support document: parameters and equations used in the integrated exposure uptake biokinetic (IEUBK) model for lead in children (v 0.99d). Technical Review Workgroup for Lead, Washington, DC and the Environmental Criteria and Assessment Office, Research Triangle Park, NC; EPA/540/R-94/040. Available online at https://ntrl.ntis.gov/NTRL/dashboard/searchResults/titleDetail/PB94963505.xhtml.
U.S. EPA. (Environmental Protection Agency). (2005) Guidance on selecting age groups for monitoring and assessing childhood
exposures to environmental contaminants. Risk Assessment Forum, Washington, DC. EPA/630/P-03/003F. Available online at https://www.epa.gov/sites/production/files/2013-09/documents/agegroups.pdf.
U.S. EPA. (Environmental Protection Agency). (2007) User’s guide for the integrated exposure uptake biokinetic model for lead in children (IEUBK) Windows®. Office of Superfund Remediation and Technology Innovation. Washington, DC. EPA 9285.7-42/540-K-01-005
U.S. EPA (Environmental Protection Agency). (2008) Child-specific exposure factors handbook. National Center for Environmental Assessment, Washington, DC. Available online at https://cfpub.epa.gov/ncea/risk/recordisplay.cfm?deid=199243.
U.S. EPA (Environmental Protection Agency). (2010) The stochastic human exposure and dose simulation (SHEDS) model. National Exposure Research Laboratory, Washington, DC. Available on-line at https://www.epa.gov/chemical-research/stochastic-human-exposure-and-dose-simulation-sheds-estimate-human-exposure.
U.S. EPA (Environmental Protection Agency) (2011) Exposure factors handbook: 2011 Edition. Office of Research and Development, Washington, DC. EPA/600//R-09/052F. Available online at https://cfpub.epa.gov/ncea/risk/recordisplay.cfm?deid=236252.
U.S. OSHA (Occupational Safety & Health Administration). (1987) Dust and its control. In: Dust control handbook for minerals processing, Chapter 1. Bureau of Mines, Department of the Interior, Washington, DC. Contract No. J0235005.
Van Dyck, K; Robberecht, H; Van Cauwenburgh, R; Van Vlaslaer, V; Deelstra, H. (2000) Indication of silicon essentiality in humans: serum concentrations in Belgian children and adults, including pregnant women. Biol Trace Elem Res 77(1):25−32.
Van Wïjnen, JH; Clausing, P; Brunekreff, B. (1990) Estimated soil ingestion by children. Environ Res 51(2):147−162.
Vermeer, DE; Frate, DA. (1979) Geophagia in rural Mississippi: Environmental and cultural contexts and nutritional implications. Am J Clin Nutr 32(10):2129−2135.
Von Lindern, I; Spalinger, S; Petroysan, V; von
Update for Chapter 5 of the Exposure Factors Handbook
Chapter 5—Soil and Dust Ingestion
September 2017 Page 5-57
Braun, M. (2003) Assessing remedial effectiveness through the blood lead:soil/dust lead relationship at the Bunker Hill Superfund Site in the Silver Valley of Idaho. Sci Total Environ 303(1−2):139−170.
Von Lindern, I; Spalinger, S; Stifelman, ML; Stanek, LW; Bartrem, C. (2016) Estimating children’s soil/dust ingestion rates through retrospective analyses of blood lead biomonitoring from the Bunker Hill Superfund Site in Idaho. Environ Health Perspect 124(9):1462−1470. DOI: 10.1289/ehp.1510144.
Wang, S; Ma, J; Pan, L; Lin, C; Wang, B; Duan, X. (2015) Quantification of soil/dust (SD) on the hands of children from Hubei Province, China using hand wipes. Ecotoxicol Environ Saf 120:193−197.
Ward, P; Kutner, NG. (1999) Reported pica behavior in a sample of incident dialysis patients. J Ren Nutr 9(1):14−20.
Wasserman, LR. (2002) The effects of a family-based educational intervention on the prevention of lead poisoning in children. Doctorate of Education Dissertation. Florida International University.
White, PD; Van Leeuwen, P; Davis, BD; Maddaloni, M; Hogan, KA; Marcus, AH; Elias, RW. (1998) The conceptual structure of the integrated exposure uptake biokinetic model for lead in children. Environ Health Perspect 106(Suppl 6):1513−1530.
Wilson, MJ. (2003) Clay mineralogical and related characteristics of geophagic materials. J Chem Ecol 29(7):1525−1547.
Wilson, R; Jones-Otazo, H; Petrovic, S; Mitchell, I; Bonvalot, Y; Williams, D; Richardson, GM. (2013) Revisiting soil and dust ingestion rates based on hand-to-mouth transfer. Human Ecol Risk Assess 19:158−188.
Wilson, R; Jones-Otazob, H; Petrovic, S; Roushorned, M; Smith-Munoze, L; Williams, D; Mitchell, I. (2015) Estimation of sediment ingestion rates based on hand-to-mouth contact and incidental surface water ingestion. Hum Ecol Risk Assess 21(6):1700-1713, DOI: 10.1080/10807039.2014.974498
Wilson, R; Mitchell, I; Richardson, GM. (2016) Estimation of dust ingestion rates in units of surface area per day using a mechanistic hand-to-mouth model. Hum Ecol Risk Assess 22(4):874−881, DOI:
10.1080/10807039.2015.1115956. Wong, MS. (1988) The role of environmental and
host behavioural factors in determining exposure to infection with Ascaris lumbricoldes and Trichuris trichiura. Ph.D. Thesis, Faculty of Natural Sciences, University of the West Indies.
Wong, EY;, Shirai, JH; Garlock, TJ; Kissel, JC. (2000) Adult proxy responses to a survey of children’s dermal soil contact activities. J Exp Anal Environ Epidem 10(6 Pt):509−517.
Yamamoto, N; Takahashi, Y; Yoshinaga, J; Tanaka, A; Shibata, Y. (2006) Size distributions of soil particles adhered to children’s hands. Arch Environ Contam Toxicol 51(2):157−163.
Yeoh, B; Woolfenden, S; Lanphear, B; Ridley, GF; Livingstone, N; Jorgensen, E. (2014). Household interventions for preventing domestic lead exposure in children. Cochrane Database Syst Rev Dec 15 2014, Issue 12. Art. No.: CD006047. DOI: 10.1002/14651858.CD006047.pub4.
Young, SL. (2010) Pica in pregnancy: New ideas about an old condition. Ann Rev Nutr 30:403−422.
Zartarian, VG; Streicker, J; Rivera, A; Cornejo, CS; Molina, S; Valadez, OF; Leckie, JO. (1995) A pilot study to collect micro-activity data of two- to four-year-old farm labor children in Salinas Valley, California. J Expo Anal Environ Epidemiol 5(1):21–34.
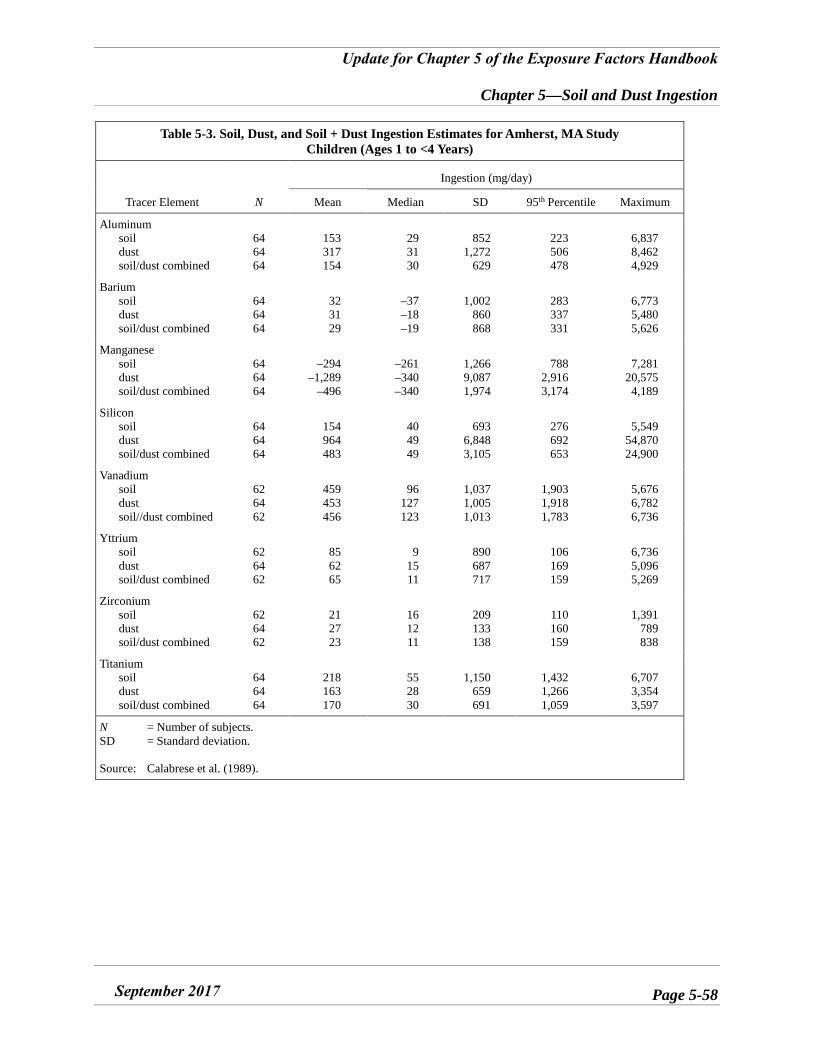
Update for Chapter 5 of the Exposure Factors Handbook
Chapter 5—Soil and Dust Ingestion
September 2017 Page 5-58
Table 5-3. Soil, Dust, and Soil + Dust Ingestion Estimates for Amherst, MA Study Children (Ages 1 to <4 Years)
Tracer Element N
Ingestion (mg/day)
Mean Median SD 95th Percentile Maximum
Aluminum soil dust soil/dust combined
64 64 64
153 317 154
29 31 30
852 1,272
629
223 506 478
6,837 8,462 4,929
Barium soil dust soil/dust combined
64 64 64
32 31 29
–37–18–19
1,002 860 868
283 337 331
6,773 5,480 5,626
Manganese soil dust soil/dust combined
64 64 64
–294–1,289
–496
–261–340–340
1,266 9,087 1,974
788 2,916 3,174
7,281 20,575 4,189
Silicon soil dust soil/dust combined
64 64 64
154 964 483
40 49 49
693 6,848 3,105
276 692 653
5,549 54,870 24,900
Vanadium soil dust soil//dust combined
62 64 62
459 453 456
96 127 123
1,037 1,005 1,013
1,903 1,918 1,783
5,676 6,782 6,736
Yttrium soil dust soil/dust combined
62 64 62
85 62 65
9 15 11
890 687 717
106 169 159
6,736 5,096 5,269
Zirconium soil dust soil/dust combined
62 64 62
21 27 23
16 12 11
209 133 138
110 160 159
1,391 789 838
Titanium soil dust soil/dust combined
64 64 64
218 163 170
55 28 30
1,150 659 691
1,432 1,266 1,059
6,707 3,354 3,597
N = Number of subjects. SD = Standard deviation.
Source: Calabrese et al. (1989).
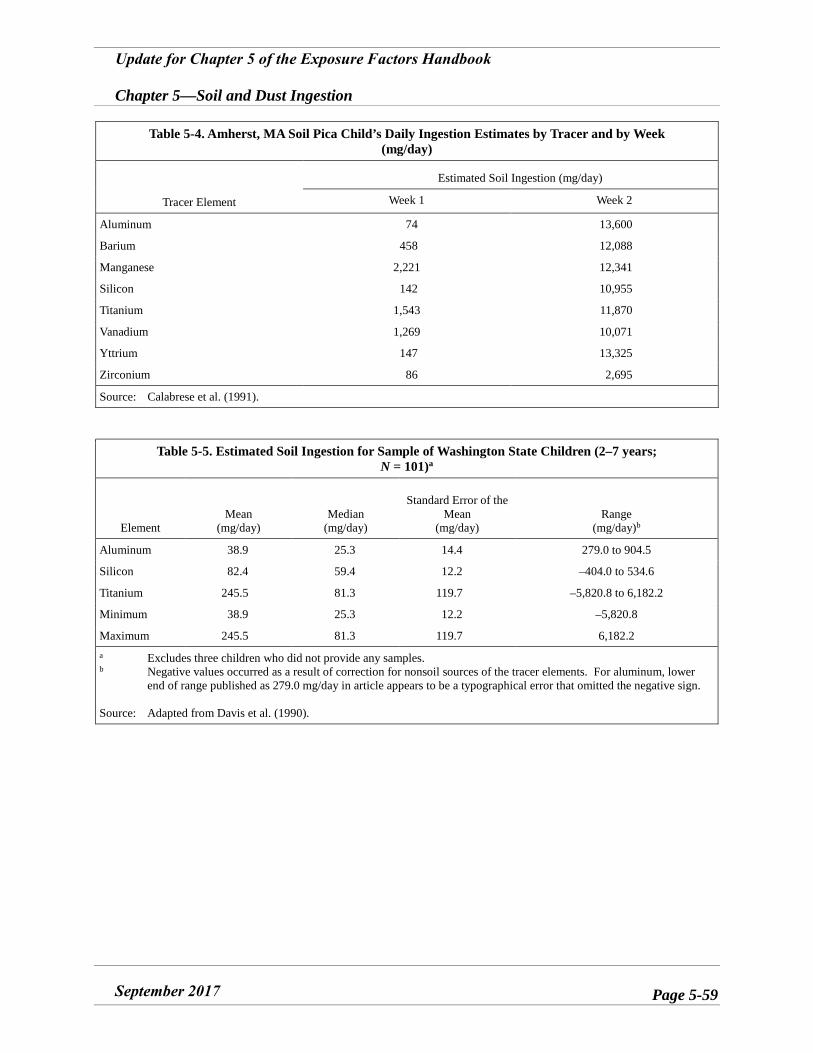
Update for Chapter 5 of the Exposure Factors Handbook
Chapter 5—Soil and Dust Ingestion
September 2017 Page 5-59
Table 5-4. Amherst, MA Soil Pica Child’s Daily Ingestion Estimates by Tracer and by Week (mg/day)
Tracer Element
Estimated Soil Ingestion (mg/day)
Week 1 Week 2
Aluminum 74 13,600
Barium 458 12,088
Manganese 2,221 12,341
Silicon 142 10,955
Titanium 1,543 11,870
Vanadium 1,269 10,071
Yttrium 147 13,325
Zirconium 86 2,695
Source: Calabrese et al. (1991).
Table 5-5. Estimated Soil Ingestion for Sample of Washington State Children (2–7 years; N = 101)a
Element Mean
(mg/day) Median
(mg/day)
Standard Error of the Mean
(mg/day) Range
(mg/day)b
Aluminum 38.9 25.3 14.4 279.0 to 904.5
Silicon 82.4 59.4 12.2 –404.0 to 534.6
Titanium 245.5 81.3 119.7 –5,820.8 to 6,182.2
Minimum 38.9 25.3 12.2 –5,820.8
Maximum 245.5 81.3 119.7 6,182.2 a Excludes three children who did not provide any samples. b Negative values occurred as a result of correction for nonsoil sources of the tracer elements. For aluminum, lower
end of range published as 279.0 mg/day in article appears to be a typographical error that omitted the negative sign.
Source: Adapted from Davis et al. (1990).
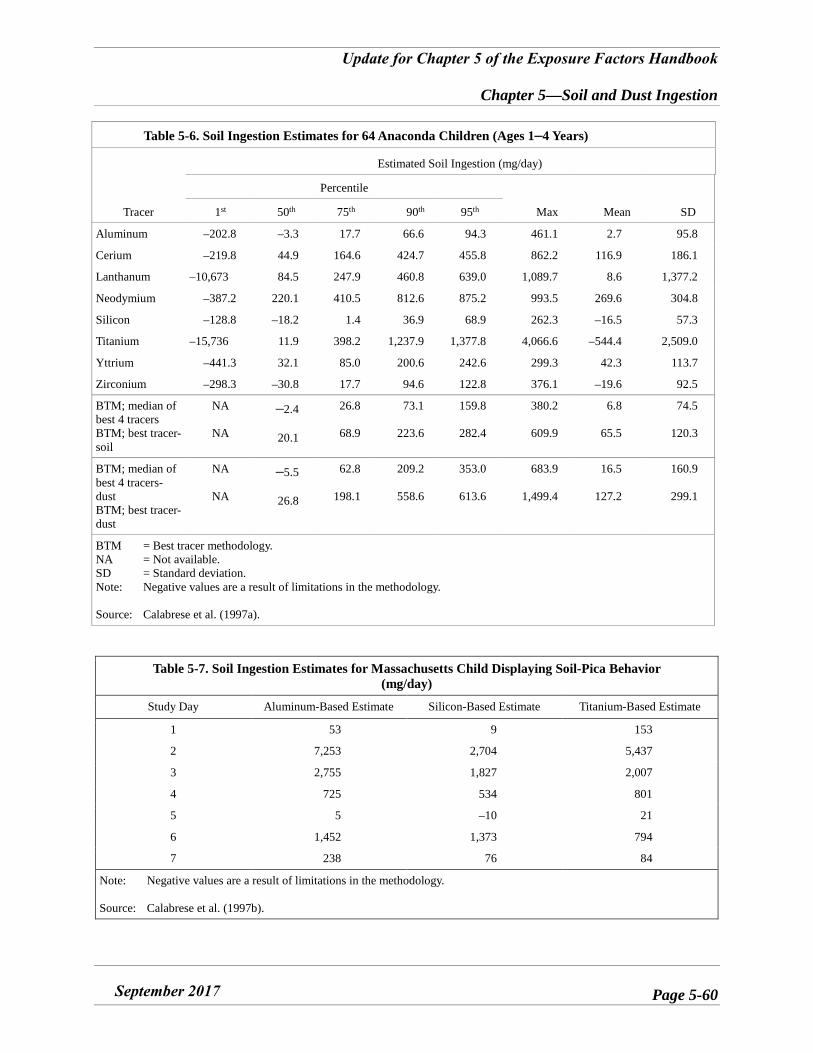
Update for Chapter 5 of the Exposure Factors Handbook
Chapter 5—Soil and Dust Ingestion
September 2017 Page 5-60
Table 5-6. Soil Ingestion Estimates for 64 Anaconda Children (Ages 1–4 Years)
Tracer
Estimated Soil Ingestion (mg/day)
Percentile
Max Mean SD 1st 50th 75th 90th 95th
Aluminum –202.8 –3.3 17.7 66.6 94.3 461.1 2.7 95.8
Cerium –219.8 44.9 164.6 424.7 455.8 862.2 116.9 186.1
Lanthanum –10,673 84.5 247.9 460.8 639.0 1,089.7 8.6 1,377.2
Neodymium –387.2 220.1 410.5 812.6 875.2 993.5 269.6 304.8
Silicon –128.8 –18.2 1.4 36.9 68.9 262.3 –16.5 57.3
Titanium –15,736 11.9 398.2 1,237.9 1,377.8 4,066.6 –544.4 2,509.0
Yttrium –441.3 32.1 85.0 200.6 242.6 299.3 42.3 113.7
Zirconium –298.3 –30.8 17.7 94.6 122.8 376.1 –19.6 92.5
BTM; median of best 4 tracers BTM; best tracer- soil
NA
NA
–2.4
20.1
26.8
68.9
73.1
223.6
159.8
282.4
380.2
609.9
6.8
65.5
74.5
120.3
BTM; median of best 4 tracers-dust BTM; best tracer- dust
NA
NA
–5.5
26.8
62.8
198.1
209.2
558.6
353.0
613.6
683.9
1,499.4
16.5
127.2
160.9
299.1
BTM = Best tracer methodology. NA = Not available. SD = Standard deviation. Note: Negative values are a result of limitations in the methodology.
Source: Calabrese et al. (1997a).
Table 5-7. Soil Ingestion Estimates for Massachusetts Child Displaying Soil-Pica Behavior (mg/day)
Study Day Aluminum-Based Estimate Silicon-Based Estimate Titanium-Based Estimate
1 53 9 153
2 7,253 2,704 5,437
3 2,755 1,827 2,007
4 725 534 801
5 5 –10 21
6 1,452 1,373 794
7 238 76 84
Note: Negative values are a result of limitations in the methodology.
Source: Calabrese et al. (1997b).
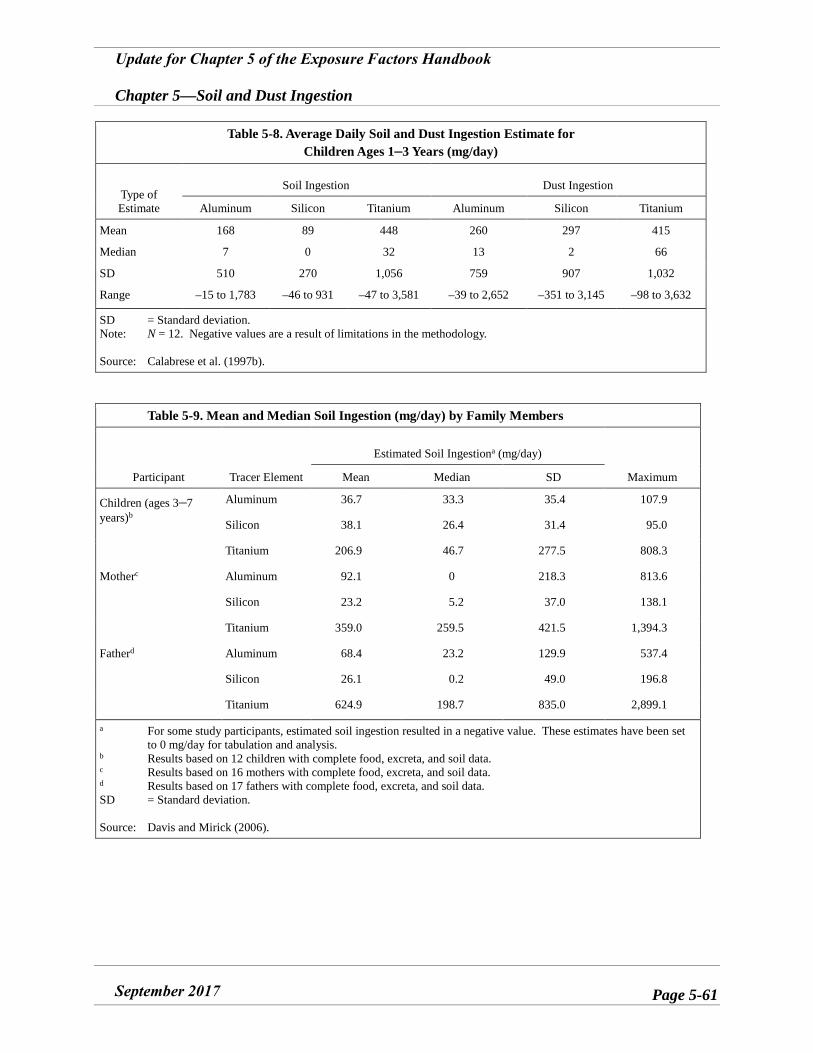
Update for Chapter 5 of the Exposure Factors Handbook
Chapter 5—Soil and Dust Ingestion
September 2017 Page 5-61
Table 5-8. Average Daily Soil and Dust Ingestion Estimate for Children Ages 1–3 Years (mg/day)
Type of Estimate
Soil Ingestion Dust Ingestion
Aluminum Silicon Titanium Aluminum Silicon Titanium
Mean 168 89 448 260 297 415
Median 7 0 32 13 2 66
SD 510 270 1,056 759 907 1,032
Range –15 to 1,783 –46 to 931 –47 to 3,581 –39 to 2,652 –351 to 3,145 –98 to 3,632
SD = Standard deviation. Note: N = 12. Negative values are a result of limitations in the methodology.
Source: Calabrese et al. (1997b).
Table 5-9. Mean and Median Soil Ingestion (mg/day) by Family Members
Participant Tracer Element
Estimated Soil Ingestiona (mg/day)
Maximum Mean Median SD
Children (ages 3–7years)b
Aluminum 36.7 33.3 35.4 107.9
Silicon 38.1 26.4 31.4 95.0
Titanium 206.9 46.7 277.5 808.3
Motherc Aluminum 92.1 0 218.3 813.6
Silicon 23.2 5.2 37.0 138.1
Titanium 359.0 259.5 421.5 1,394.3
Fatherd Aluminum 68.4 23.2 129.9 537.4
Silicon 26.1 0.2 49.0 196.8
Titanium 624.9 198.7 835.0 2,899.1
a For some study participants, estimated soil ingestion resulted in a negative value. These estimates have been set to 0 mg/day for tabulation and analysis.
b Results based on 12 children with complete food, excreta, and soil data. c Results based on 16 mothers with complete food, excreta, and soil data. d Results based on 17 fathers with complete food, excreta, and soil data. SD = Standard deviation.
Source: Davis and Mirick (2006).
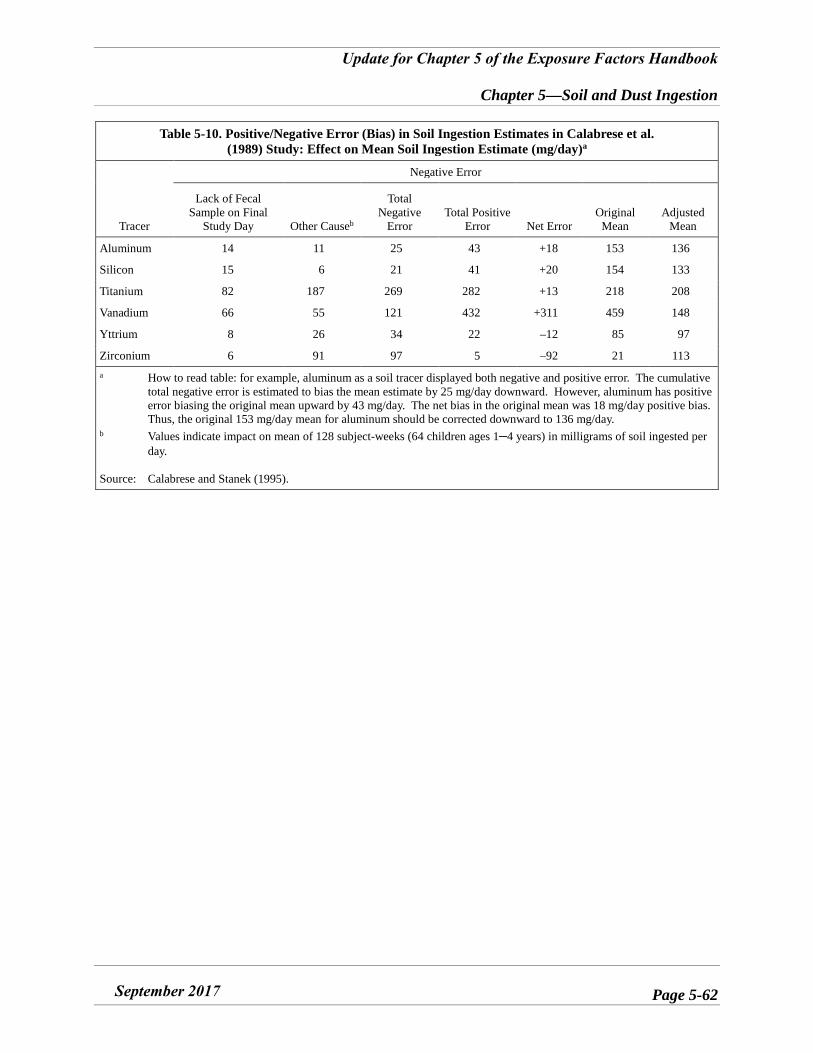
Update for Chapter 5 of the Exposure Factors Handbook
Chapter 5—Soil and Dust Ingestion
September 2017 Page 5-62
Table 5-10. Positive/Negative Error (Bias) in Soil Ingestion Estimates in Calabrese et al. (1989) Study: Effect on Mean Soil Ingestion Estimate (mg/day)a
Tracer
Negative Error
Lack of Fecal Sample on Final
Study Day Other Causeb
Total Negative
Error Total Positive
Error Net Error Original
Mean Adjusted
Mean
Aluminum 14 11 25 43 +18 153 136
Silicon 15 6 21 41 +20 154 133
Titanium 82 187 269 282 +13 218 208
Vanadium 66 55 121 432 +311 459 148
Yttrium 8 26 34 22 –12 85 97
Zirconium 6 91 97 5 –92 21 113 a How to read table: for example, aluminum as a soil tracer displayed both negative and positive error. The cumulative
total negative error is estimated to bias the mean estimate by 25 mg/day downward. However, aluminum has positive error biasing the original mean upward by 43 mg/day. The net bias in the original mean was 18 mg/day positive bias. Thus, the original 153 mg/day mean for aluminum should be corrected downward to 136 mg/day.
b Values indicate impact on mean of 128 subject-weeks (64 children ages 1–4 years) in milligrams of soil ingested perday.
Source: Calabrese and Stanek (1995).
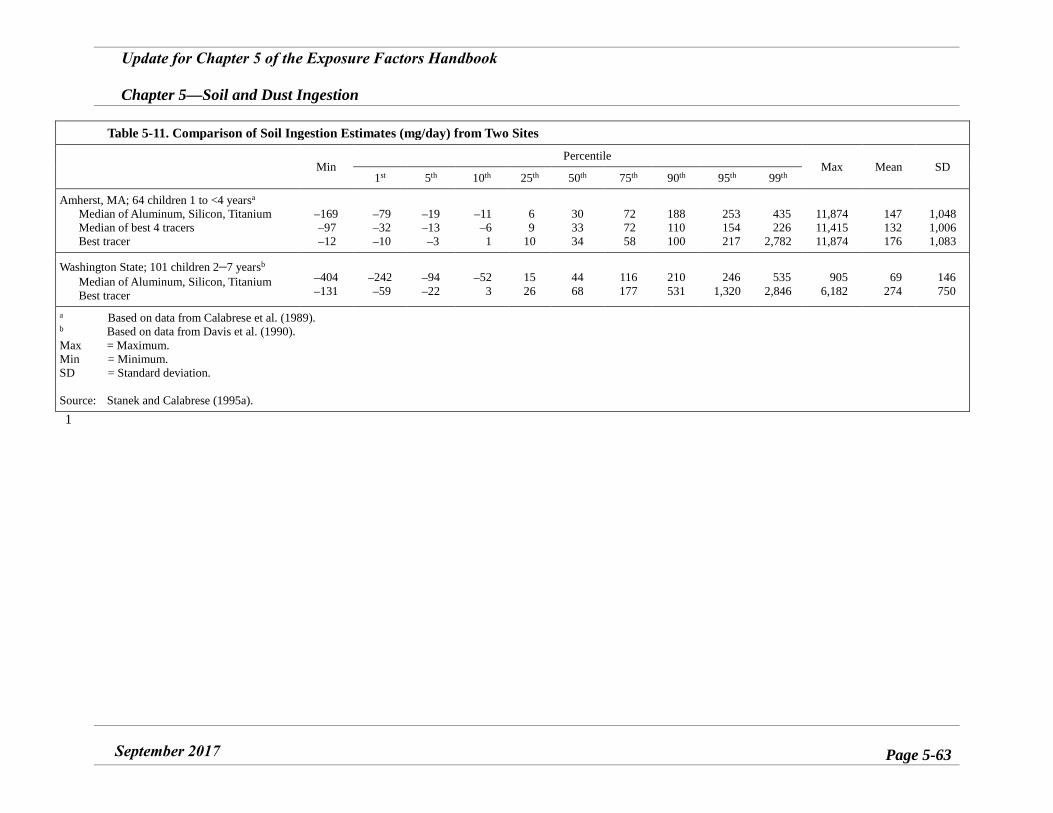
Update for Chapter 5 of the Exposure Factors Handbook
Chapter 5—Soil and Dust Ingestion
September 2017 Page 5-63
Table 5-11. Comparison of Soil Ingestion Estimates (mg/day) from Two Sites
Min Percentile
Max Mean SD 1st 5th 10th 25th 50th 75th 90th 95th 99th
Amherst, MA; 64 children 1 to <4 yearsa
Median of Aluminum, Silicon, Titanium
Median of best 4 tracers Best tracer
–169–97–12
–79–32–10
–19–13–3
–11–61
6 9
10
30 33 34
72 72 58
188 110 100
253 154 217
435 226
2,782
11,874 11,415 11,874
147 132 176
1,048 1,006 1,083
Washington State; 101 children 2–7 yearsb
Median of Aluminum, Silicon, Titanium Best tracer
–404–131
–242–59
–94–22
–523
15 26
44 68
116 177
210 531
246 1,320
535 2,846
905 6,182
69 274
146 750
a Based on data from Calabrese et al. (1989). b Based on data from Davis et al. (1990). Max = Maximum. Min = Minimum. SD = Standard deviation.
Source: Stanek and Calabrese (1995a). 1
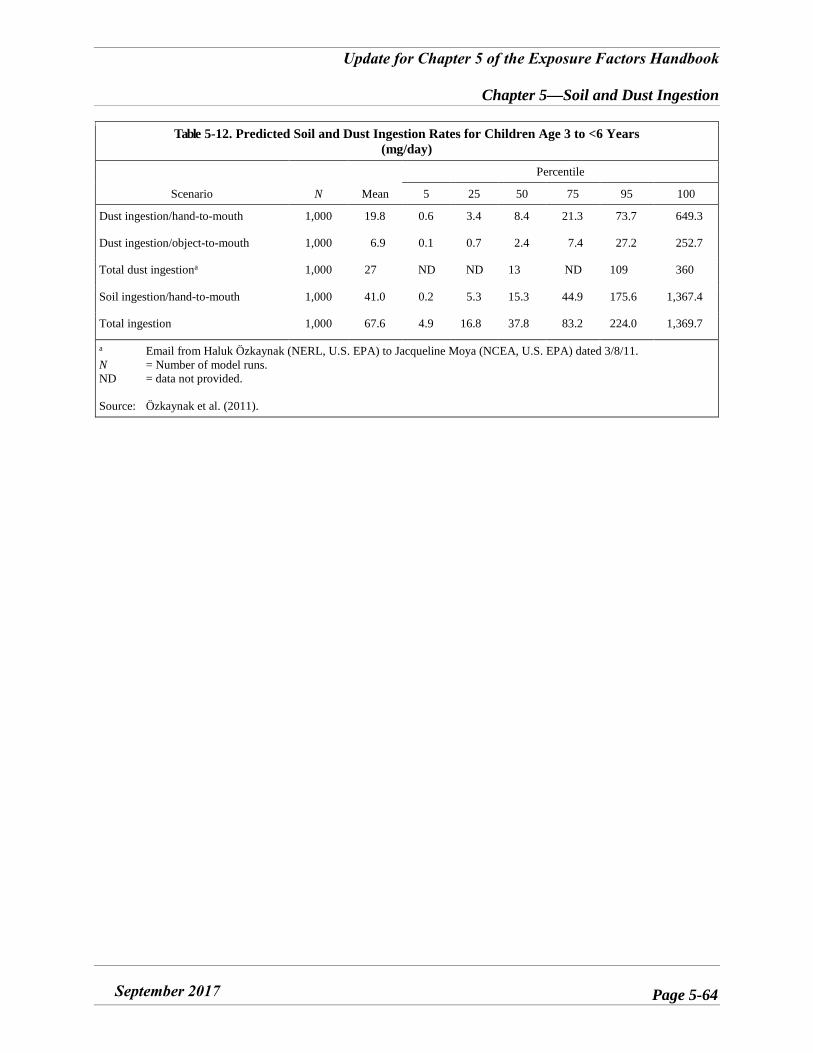
Update for Chapter 5 of the Exposure Factors Handbook
Chapter 5—Soil and Dust Ingestion
September 2017 Page 5-64
Table 5-12. Predicted Soil and Dust Ingestion Rates for Children Age 3 to <6 Years (mg/day)
Scenario N Mean
Percentile
5 25 50 75 95 100
Dust ingestion/hand-to-mouth 1,000 19.8 0.6 3.4 8.4 21.3 73.7 649.3
Dust ingestion/object-to-mouth 1,000 6.9 0.1 0.7 2.4 7.4 27.2 252.7
Total dust ingestiona 1,000 27 ND ND 13 ND 109 360
Soil ingestion/hand-to-mouth 1,000 41.0 0.2 5.3 15.3 44.9 175.6 1,367.4
Total ingestion 1,000 67.6 4.9 16.8 37.8 83.2 224.0 1,369.7
a Email from Haluk Özkaynak (NERL, U.S. EPA) to Jacqueline Moya (NCEA, U.S. EPA) dated 3/8/11. N = Number of model runs. ND = data not provided.
Source: Özkaynak et al. (2011).
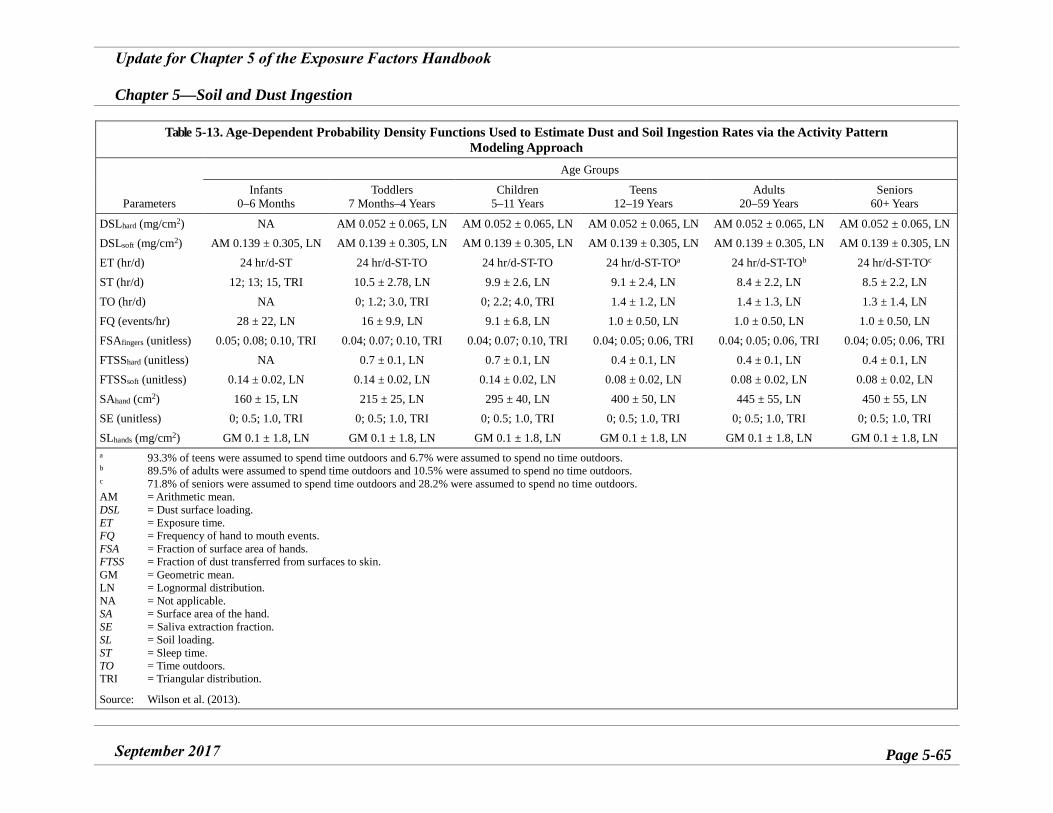
Update for Chapter 5 of the Exposure Factors Handbook
Chapter 5—Soil and Dust Ingestion
September 2017 Page 5-65
Table 5-13. Age-Dependent Probability Density Functions Used to Estimate Dust and Soil Ingestion Rates via the Activity Pattern Modeling Approach
Parameters
Age Groups
Infants 0–6 Months
Toddlers 7 Months–4 Years
Children 5–11 Years
Teens 12–19 Years
Adults 20–59 Years
Seniors 60+ Years
DSLhard (mg/cm2) NA AM 0.052 ± 0.065, LN AM 0.052 ± 0.065, LN AM 0.052 ± 0.065, LN AM 0.052 ± 0.065, LN AM 0.052 ± 0.065, LN DSLsoft (mg/cm2) AM 0.139 ± 0.305, LN AM 0.139 ± 0.305, LN AM 0.139 ± 0.305, LN AM 0.139 ± 0.305, LN AM 0.139 ± 0.305, LN AM 0.139 ± 0.305, LN ET (hr/d) 24 hr/d-ST 24 hr/d-ST-TO 24 hr/d-ST-TO 24 hr/d-ST-TOa 24 hr/d-ST-TOb 24 hr/d-ST-TOc
ST (hr/d) 12; 13; 15, TRI 10.5 ± 2.78, LN 9.9 ± 2.6, LN 9.1 ± 2.4, LN 8.4 ± 2.2, LN 8.5 ± 2.2, LN TO (hr/d) NA 0; 1.2; 3.0, TRI 0; 2.2; 4.0, TRI 1.4 ± 1.2, LN 1.4 ± 1.3, LN 1.3 ± 1.4, LN FQ (events/hr) 28 ± 22, LN 16 ± 9.9, LN 9.1 ± 6.8, LN 1.0 ± 0.50, LN 1.0 ± 0.50, LN 1.0 ± 0.50, LN FSAfingers (unitless) 0.05; 0.08; 0.10, TRI 0.04; 0.07; 0.10, TRI 0.04; 0.07; 0.10, TRI 0.04; 0.05; 0.06, TRI 0.04; 0.05; 0.06, TRI 0.04; 0.05; 0.06, TRI FTSShard (unitless) NA 0.7 ± 0.1, LN 0.7 ± 0.1, LN 0.4 ± 0.1, LN 0.4 ± 0.1, LN 0.4 ± 0.1, LN FTSSsoft (unitless) 0.14 ± 0.02, LN 0.14 ± 0.02, LN 0.14 ± 0.02, LN 0.08 ± 0.02, LN 0.08 ± 0.02, LN 0.08 ± 0.02, LN SAhand (cm2) 160 ± 15, LN 215 ± 25, LN 295 ± 40, LN 400 ± 50, LN 445 ± 55, LN 450 ± 55, LN SE (unitless) 0; 0.5; 1.0, TRI 0; 0.5; 1.0, TRI 0; 0.5; 1.0, TRI 0; 0.5; 1.0, TRI 0; 0.5; 1.0, TRI 0; 0.5; 1.0, TRI SLhands (mg/cm2) GM 0.1 ± 1.8, LN GM 0.1 ± 1.8, LN GM 0.1 ± 1.8, LN GM 0.1 ± 1.8, LN GM 0.1 ± 1.8, LN GM 0.1 ± 1.8, LN a 93.3% of teens were assumed to spend time outdoors and 6.7% were assumed to spend no time outdoors. b 89.5% of adults were assumed to spend time outdoors and 10.5% were assumed to spend no time outdoors. c 71.8% of seniors were assumed to spend time outdoors and 28.2% were assumed to spend no time outdoors. AM = Arithmetic mean. DSL = Dust surface loading. ET = Exposure time. FQ = Frequency of hand to mouth events. FSA = Fraction of surface area of hands. FTSS = Fraction of dust transferred from surfaces to skin. GM = Geometric mean. LN = Lognormal distribution. NA = Not applicable. SA = Surface area of the hand. SE = Saliva extraction fraction. SL = Soil loading. ST = Sleep time. TO = Time outdoors. TRI = Triangular distribution.
Source: Wilson et al. (2013).
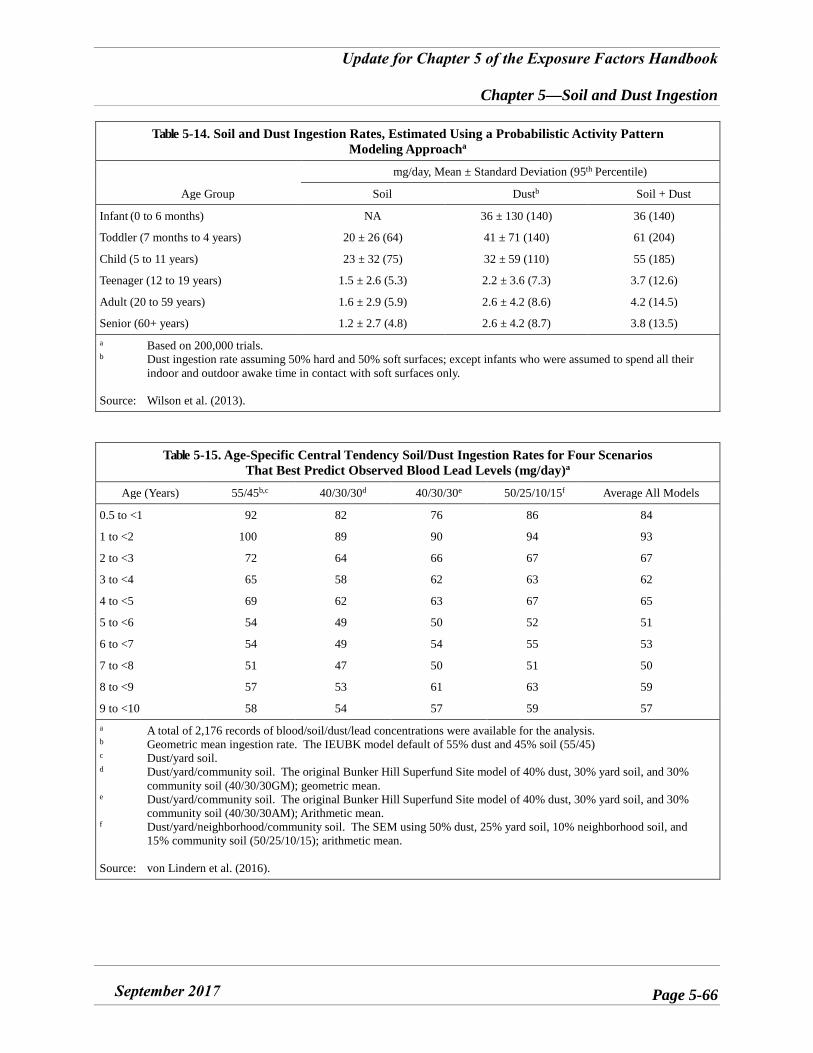
Update for Chapter 5 of the Exposure Factors Handbook
Chapter 5—Soil and Dust Ingestion
September 2017 Page 5-66
Table 5-14. Soil and Dust Ingestion Rates, Estimated Using a Probabilistic Activity Pattern Modeling Approacha
Age Group
mg/day, Mean ± Standard Deviation (95th Percentile)
Soil Dustb Soil + Dust
Infant (0 to 6 months) NA 36 ± 130 (140) 36 (140)
Toddler (7 months to 4 years) 20 ± 26 (64) 41 ± 71 (140) 61 (204)
Child (5 to 11 years) 23 ± 32 (75) 32 ± 59 (110) 55 (185)
Teenager (12 to 19 years) 1.5 ± 2.6 (5.3) 2.2 ± 3.6 (7.3) 3.7 (12.6)
Adult (20 to 59 years) 1.6 ± 2.9 (5.9) 2.6 ± 4.2 (8.6) 4.2 (14.5)
Senior (60+ years) 1.2 ± 2.7 (4.8) 2.6 ± 4.2 (8.7) 3.8 (13.5) a Based on 200,000 trials. b Dust ingestion rate assuming 50% hard and 50% soft surfaces; except infants who were assumed to spend all their
indoor and outdoor awake time in contact with soft surfaces only.
Source: Wilson et al. (2013).
Table 5-15. Age-Specific Central Tendency Soil/Dust Ingestion Rates for Four Scenarios That Best Predict Observed Blood Lead Levels (mg/day)a
Age (Years) 55/45b,c 40/30/30d 40/30/30e 50/25/10/15f Average All Models
0.5 to <1 92 82 76 86 84
1 to <2 100 89 90 94 93
2 to <3 72 64 66 67 67
3 to <4 65 58 62 63 62
4 to <5 69 62 63 67 65
5 to <6 54 49 50 52 51
6 to <7 54 49 54 55 53
7 to <8 51 47 50 51 50
8 to <9 57 53 61 63 59
9 to <10 58 54 57 59 57 a A total of 2,176 records of blood/soil/dust/lead concentrations were available for the analysis. b Geometric mean ingestion rate. The IEUBK model default of 55% dust and 45% soil (55/45) c Dust/yard soil. d Dust/yard/community soil. The original Bunker Hill Superfund Site model of 40% dust, 30% yard soil, and 30%
community soil (40/30/30GM); geometric mean. e Dust/yard/community soil. The original Bunker Hill Superfund Site model of 40% dust, 30% yard soil, and 30%
community soil (40/30/30AM); Arithmetic mean. f Dust/yard/neighborhood/community soil. The SEM using 50% dust, 25% yard soil, 10% neighborhood soil, and
15% community soil (50/25/10/15); arithmetic mean.
Source: von Lindern et al. (2016).
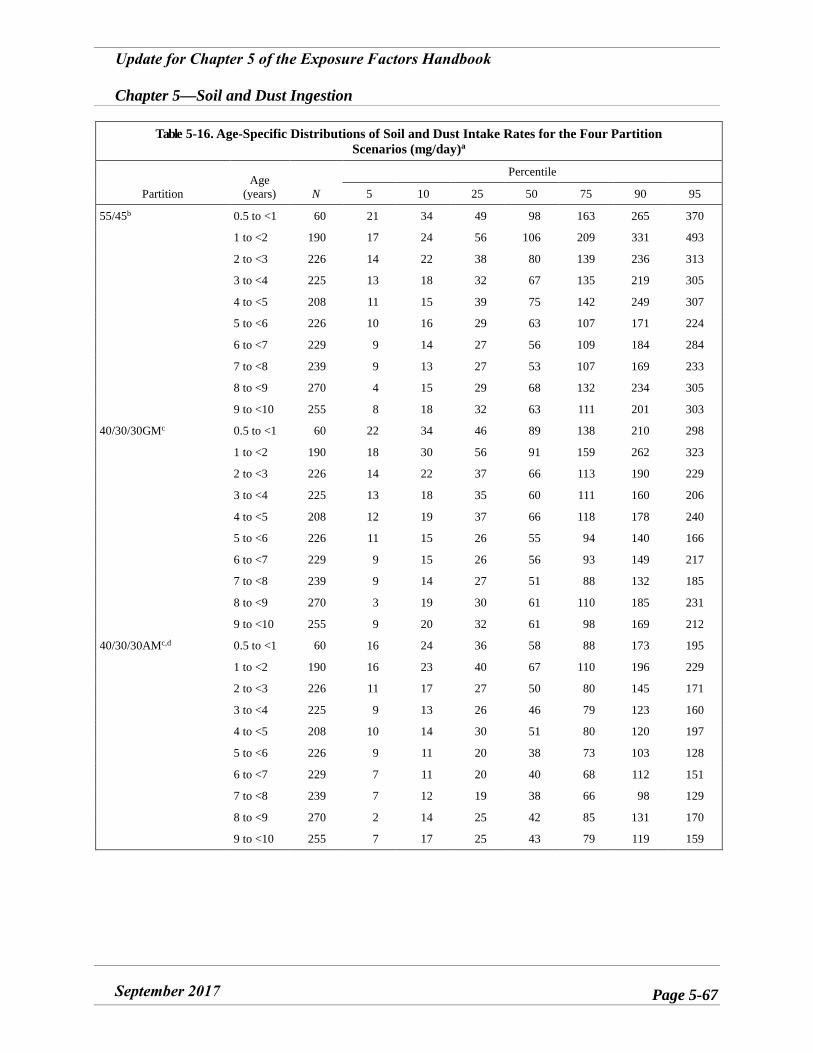
Update for Chapter 5 of the Exposure Factors Handbook
Chapter 5—Soil and Dust Ingestion
September 2017 Page 5-67
Table 5-16. Age-Specific Distributions of Soil and Dust Intake Rates for the Four Partition Scenarios (mg/day)a
Partition Age
(years) N
Percentile
5 10 25 50 75 90 95
55/45b 0.5 to <1 60 21 34 49 98 163 265 370
1 to <2 190 17 24 56 106 209 331 493
2 to <3 226 14 22 38 80 139 236 313
3 to <4 225 13 18 32 67 135 219 305
4 to <5 208 11 15 39 75 142 249 307
5 to <6 226 10 16 29 63 107 171 224
6 to <7 229 9 14 27 56 109 184 284
7 to <8 239 9 13 27 53 107 169 233
8 to <9 270 4 15 29 68 132 234 305
9 to <10 255 8 18 32 63 111 201 303
40/30/30GMc 0.5 to <1 60 22 34 46 89 138 210 298
1 to <2 190 18 30 56 91 159 262 323
2 to <3 226 14 22 37 66 113 190 229
3 to <4 225 13 18 35 60 111 160 206
4 to <5 208 12 19 37 66 118 178 240
5 to <6 226 11 15 26 55 94 140 166
6 to <7 229 9 15 26 56 93 149 217
7 to <8 239 9 14 27 51 88 132 185
8 to <9 270 3 19 30 61 110 185 231
9 to <10 255 9 20 32 61 98 169 212
40/30/30AMc,d 0.5 to <1 60 16 24 36 58 88 173 195
1 to <2 190 16 23 40 67 110 196 229
2 to <3 226 11 17 27 50 80 145 171
3 to <4 225 9 13 26 46 79 123 160
4 to <5 208 10 14 30 51 80 120 197
5 to <6 226 9 11 20 38 73 103 128
6 to <7 229 7 11 20 40 68 112 151
7 to <8 239 7 12 19 38 66 98 129
8 to <9 270 2 14 25 42 85 131 170
9 to <10 255 7 17 25 43 79 119 159
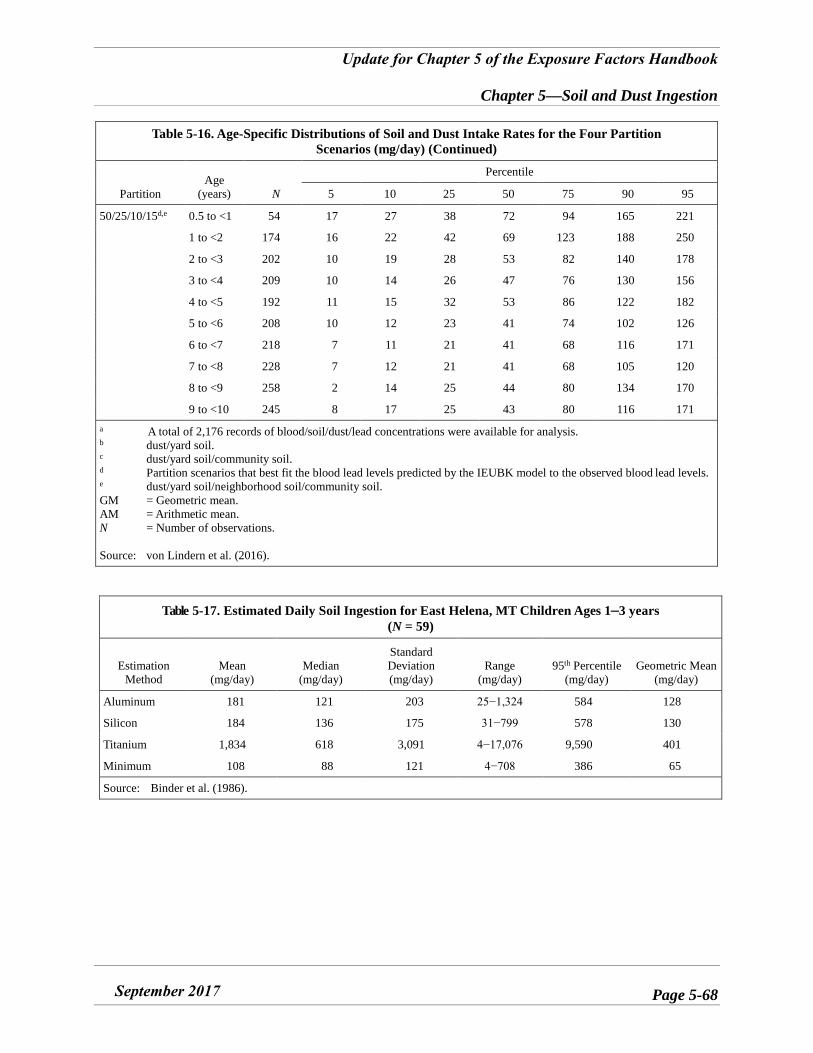
Update for Chapter 5 of the Exposure Factors Handbook
Chapter 5—Soil and Dust Ingestion
September 2017 Page 5-68
Table 5-16. Age-Specific Distributions of Soil and Dust Intake Rates for the Four Partition Scenarios (mg/day) (Continued)
Partition Age
(years) N
Percentile
5 10 25 50 75 90 95
50/25/10/15d,e 0.5 to <1 54 17 27 38 72 94 165 221
1 to <2 174 16 22 42 69 123 188 250
2 to <3 202 10 19 28 53 82 140 178
3 to <4 209 10 14 26 47 76 130 156
4 to <5 192 11 15 32 53 86 122 182
5 to <6 208 10 12 23 41 74 102 126
6 to <7 218 7 11 21 41 68 116 171
7 to <8 228 7 12 21 41 68 105 120
8 to <9 258 2 14 25 44 80 134 170
9 to <10 245 8 17 25 43 80 116 171 a A total of 2,176 records of blood/soil/dust/lead concentrations were available for analysis. b dust/yard soil. c dust/yard soil/community soil. d Partition scenarios that best fit the blood lead levels predicted by the IEUBK model to the observed blood lead levels. e dust/yard soil/neighborhood soil/community soil. GM = Geometric mean. AM = Arithmetic mean. N = Number of observations.
Source: von Lindern et al. (2016).
Table 5-17. Estimated Daily Soil Ingestion for East Helena, MT Children Ages 1–3 years (N = 59)
Estimation Method
Mean (mg/day)
Median (mg/day)
Standard Deviation (mg/day)
Range (mg/day)
95th Percentile (mg/day)
Geometric Mean (mg/day)
Aluminum 181 121 203 25−1,324 584 128
Silicon 184 136 175 31−799 578 130
Titanium 1,834 618 3,091 4−17,076 9,590 401
Minimum 108 88 121 4−708 386 65
Source: Binder et al. (1986).
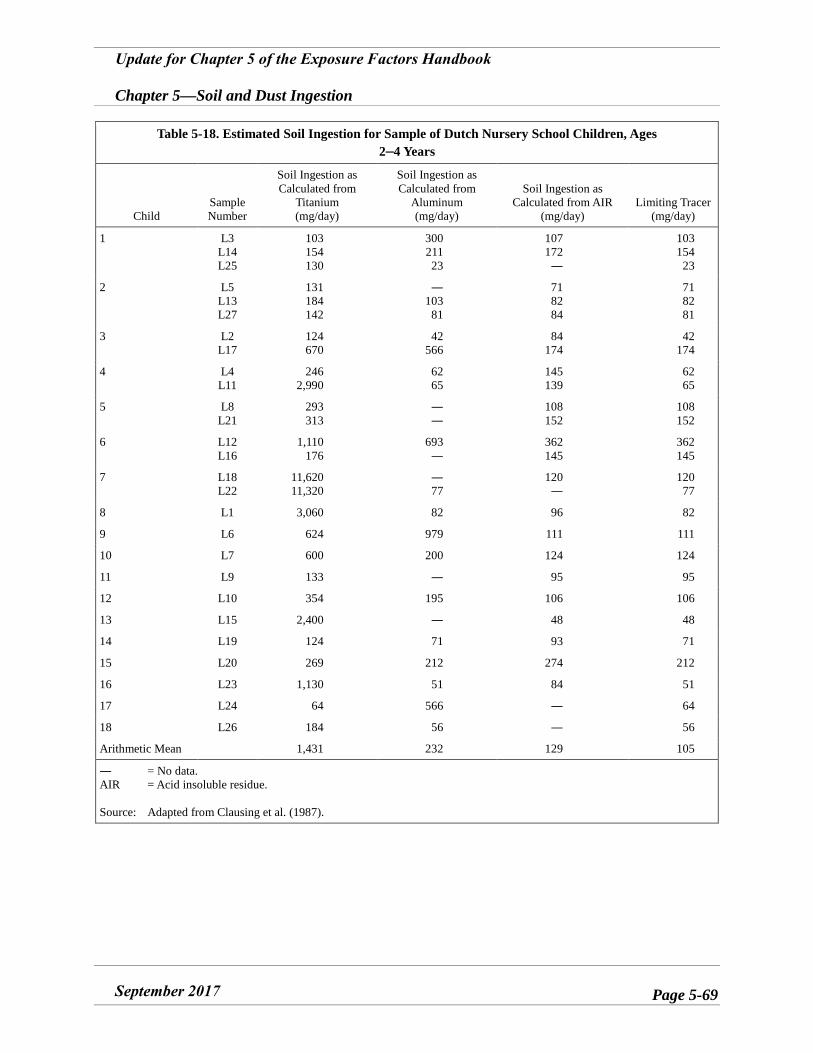
Update for Chapter 5 of the Exposure Factors Handbook
Chapter 5—Soil and Dust Ingestion
September 2017 Page 5-69
Table 5-18. Estimated Soil Ingestion for Sample of Dutch Nursery School Children, Ages 2–4 Years
Child Sample Number
Soil Ingestion as Calculated from
Titanium (mg/day)
Soil Ingestion as Calculated from
Aluminum (mg/day)
Soil Ingestion as Calculated from AIR
(mg/day) Limiting Tracer
(mg/day)
1 L3 L14 L25
103 154 130
300 211 23
107 172
―
103 154
23
2 L5 L13 L27
131 184 142
― 103
81
71 82 84
71 82 81
3 L2 L17
124 670
42 566
84 174
42 174
4 L4 L11
246 2,990
62 65
145 139
62 65
5 L8 L21
293 313
――
108 152
108 152
6 L12 L16
1,110 176
693 ―
362 145
362 145
7 L18 L22
11,620 11,320
― 77
120 ―
120 77
8 L1 3,060 82 96 82
9 L6 624 979 111 111
10 L7 600 200 124 124
11 L9 133 ― 95 95
12 L10 354 195 106 106
13 L15 2,400 ― 48 48
14 L19 124 71 93 71
15 L20 269 212 274 212
16 L23 1,130 51 84 51
17 L24 64 566 ― 64
18 L26 184 56 ― 56
Arithmetic Mean 1,431 232 129 105
― = No data. AIR = Acid insoluble residue.
Source: Adapted from Clausing et al. (1987).
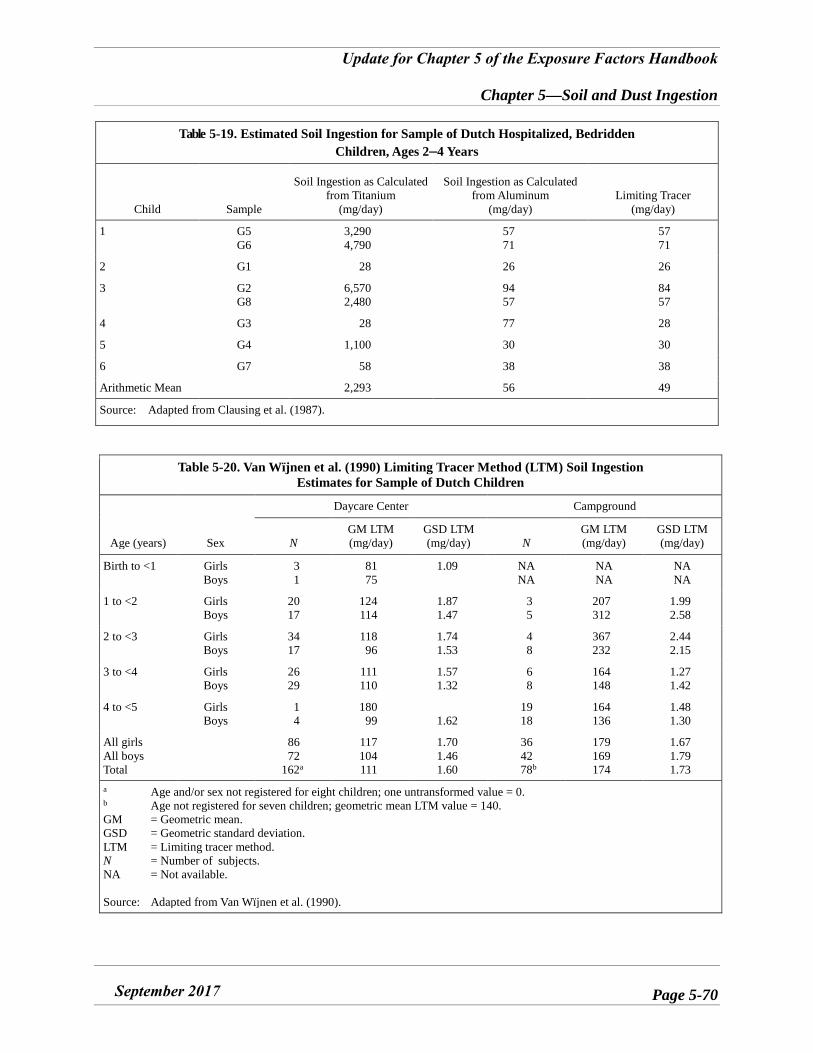
Update for Chapter 5 of the Exposure Factors Handbook
Chapter 5—Soil and Dust Ingestion
September 2017 Page 5-70
Table 5-19. Estimated Soil Ingestion for Sample of Dutch Hospitalized, Bedridden Children, Ages 2–4 Years
Child Sample
Soil Ingestion as Calculated from Titanium
(mg/day)
Soil Ingestion as Calculated from Aluminum
(mg/day) Limiting Tracer
(mg/day)
1 G5 G6
3,290 4,790
57 71
57 71
2 G1 28 26 26
3 G2 G8
6,570 2,480
94 57
84 57
4 G3 28 77 28
5 G4 1,100 30 30
6 G7 58 38 38
Arithmetic Mean 2,293 56 49
Source: Adapted from Clausing et al. (1987).
Table 5-20. Van Wïjnen et al. (1990) Limiting Tracer Method (LTM) Soil Ingestion Estimates for Sample of Dutch Children
Age (years) Sex
Daycare Center Campground
N GM LTM (mg/day)
GSD LTM (mg/day) N
GM LTM (mg/day)
GSD LTM (mg/day)
Birth to <1 Girls Boys
31
81 75
1.09 NA NA
NA NA
NA NA
1 to <2 Girls Boys
20 17
124 114
1.87 1.47
35
207 312
1.99 2.58
2 to <3 Girls Boys
34 17
118 96
1.74 1.53
48
367 232
2.44 2.15
3 to <4 Girls Boys
26 29
111 110
1.57 1.32
68
164 148
1.27 1.42
4 to <5 Girls Boys
14
180 99 1.62
19 18
164 136
1.48 1.30
All girls All boys Total
86 72
162a
117 104 111
1.70 1.46 1.60
36 42 78b
179 169 174
1.67 1.79 1.73
a Age and/or sex not registered for eight children; one untransformed value = 0. b Age not registered for seven children; geometric mean LTM value = 140. GM = Geometric mean. GSD = Geometric standard deviation. LTM = Limiting tracer method. N = Number of subjects. NA = Not available.
Source: Adapted from Van Wïjnen et al. (1990).
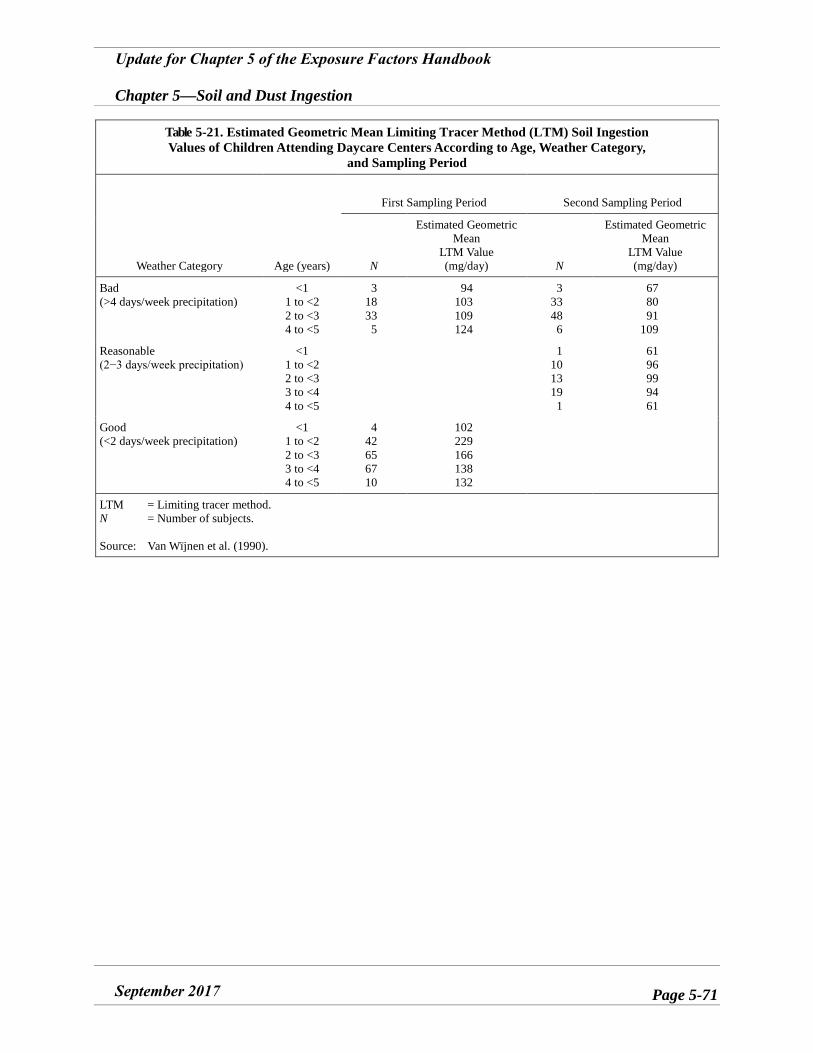
Update for Chapter 5 of the Exposure Factors Handbook
Chapter 5—Soil and Dust Ingestion
September 2017 Page 5-71
Table 5-21. Estimated Geometric Mean Limiting Tracer Method (LTM) Soil Ingestion Values of Children Attending Daycare Centers According to Age, Weather Category,
and Sampling Period
Weather Category Age (years)
First Sampling Period Second Sampling Period
N
Estimated Geometric Mean
LTM Value (mg/day) N
Estimated Geometric Mean
LTM Value (mg/day)
Bad (>4 days/week precipitation)
<1 1 to <2 2 to <3 4 to <5
3 18 33 5
94 103 109 124
3 33 48 6
67 80 91
109
Reasonable (2−3 days/week precipitation)
<1 1 to <2 2 to <3 3 to <4 4 to <5
1 10 13 19 1
61 96 99 94 61
Good (<2 days/week precipitation)
<1 1 to <2 2 to <3 3 to <4 4 to <5
4 42 65 67 10
102 229 166 138 132
LTM = Limiting tracer method. N = Number of subjects.
Source: Van Wïjnen et al. (1990).
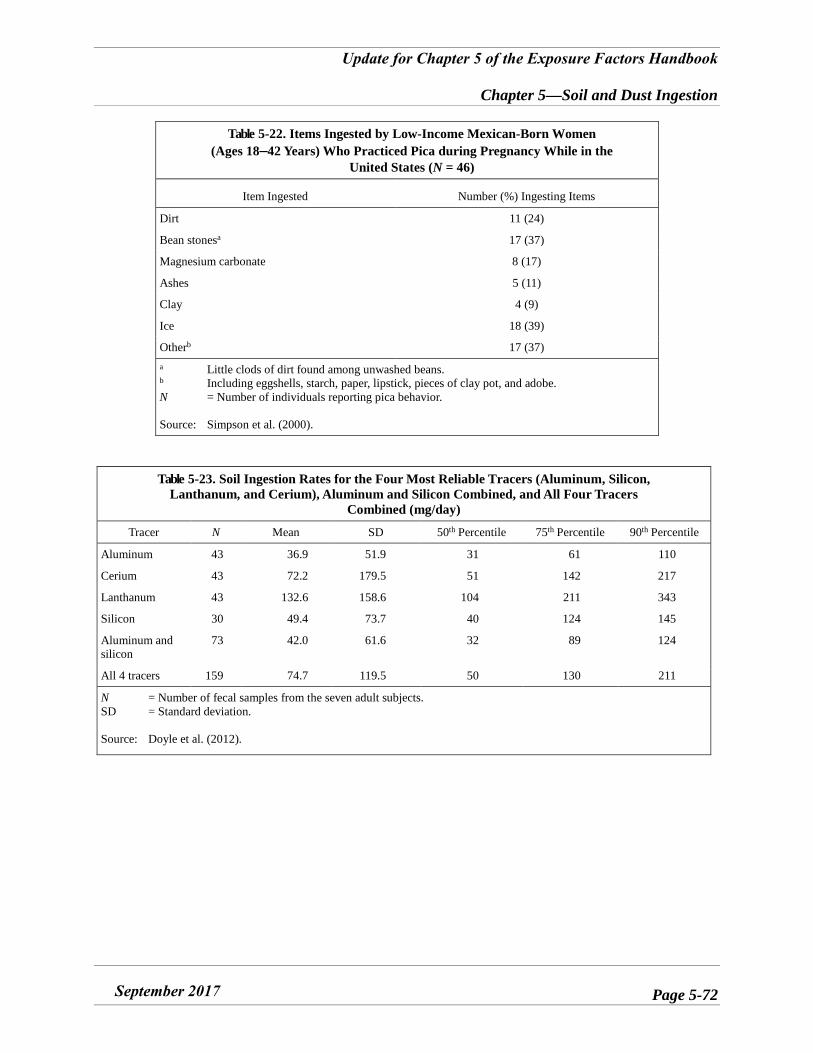
Update for Chapter 5 of the Exposure Factors Handbook
Chapter 5—Soil and Dust Ingestion
September 2017 Page 5-72
Table 5-22. Items Ingested by Low-Income Mexican-Born Women (Ages 18–42 Years) Who Practiced Pica during Pregnancy While in the
United States (N = 46)
Item Ingested Number (%) Ingesting Items
Dirt 11 (24)
Bean stonesa 17 (37)
Magnesium carbonate 8 (17)
Ashes 5 (11)
Clay 4 (9)
Ice 18 (39)
Otherb 17 (37) a Little clods of dirt found among unwashed beans. b Including eggshells, starch, paper, lipstick, pieces of clay pot, and adobe. N = Number of individuals reporting pica behavior.
Source: Simpson et al. (2000).
Table 5-23. Soil Ingestion Rates for the Four Most Reliable Tracers (Aluminum, Silicon, Lanthanum, and Cerium), Aluminum and Silicon Combined, and All Four Tracers
Combined (mg/day)
Tracer N Mean SD 50th Percentile 75th Percentile 90th Percentile
Aluminum 43 36.9 51.9 31 61 110
Cerium 43 72.2 179.5 51 142 217
Lanthanum 43 132.6 158.6 104 211 343
Silicon 30 49.4 73.7 40 124 145
Aluminum and silicon
73 42.0 61.6 32 89 124
All 4 tracers 159 74.7 119.5 50 130 211
N = Number of fecal samples from the seven adult subjects. SD = Standard deviation.
Source: Doyle et al. (2012).
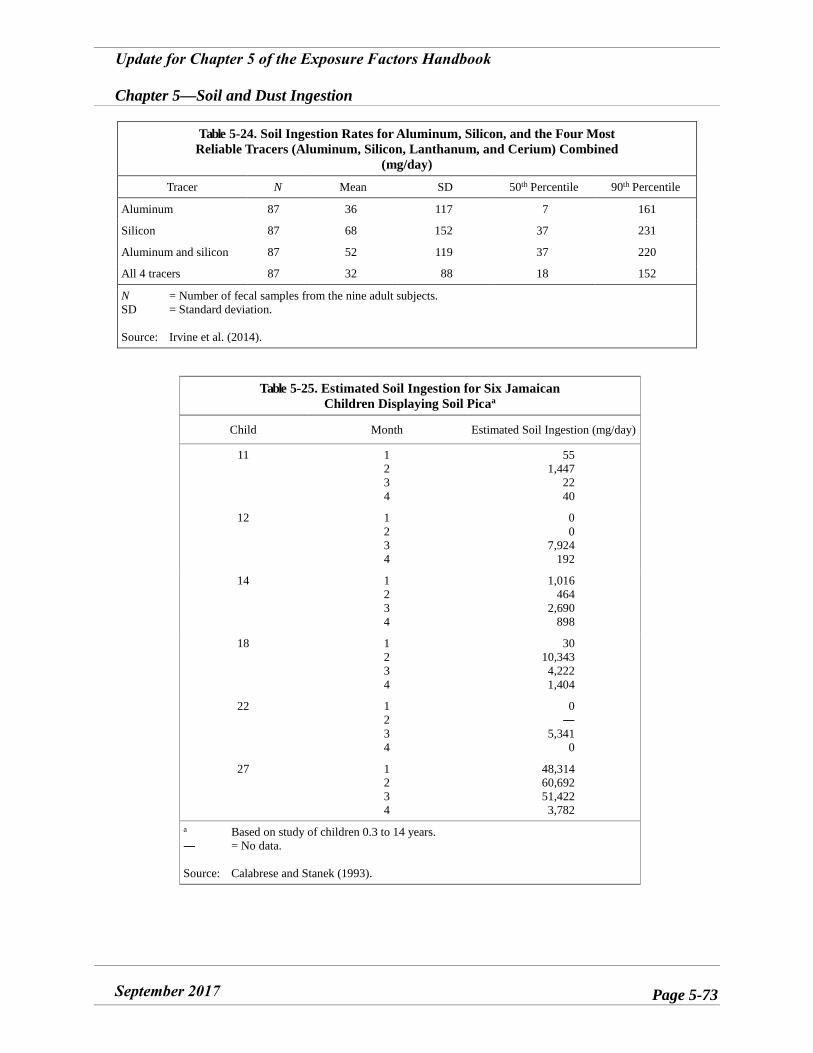
Update for Chapter 5 of the Exposure Factors Handbook
Chapter 5—Soil and Dust Ingestion
September 2017 Page 5-73
Table 5-24. Soil Ingestion Rates for Aluminum, Silicon, and the Four Most Reliable Tracers (Aluminum, Silicon, Lanthanum, and Cerium) Combined
(mg/day)
Tracer N Mean SD 50th Percentile 90th Percentile
Aluminum 87 36 117 7 161
Silicon 87 68 152 37 231
Aluminum and silicon 87 52 119 37 220
All 4 tracers 87 32 88 18 152
N = Number of fecal samples from the nine adult subjects. SD = Standard deviation.
Source: Irvine et al. (2014).
Table 5-25. Estimated Soil Ingestion for Six Jamaican Children Displaying Soil Picaa
Child Month Estimated Soil Ingestion (mg/day)
11 1234
55 1,447
22 40
12 1234
00
7,924 192
14 1234
1,016 464
2,690 898
18 1234
30 10,343 4,222 1,404
22 1234
0―
5,341 0
27 1234
48,314 60,692 51,422 3,782
a Based on study of children 0.3 to 14 years. ― = No data.
Source: Calabrese and Stanek (1993).
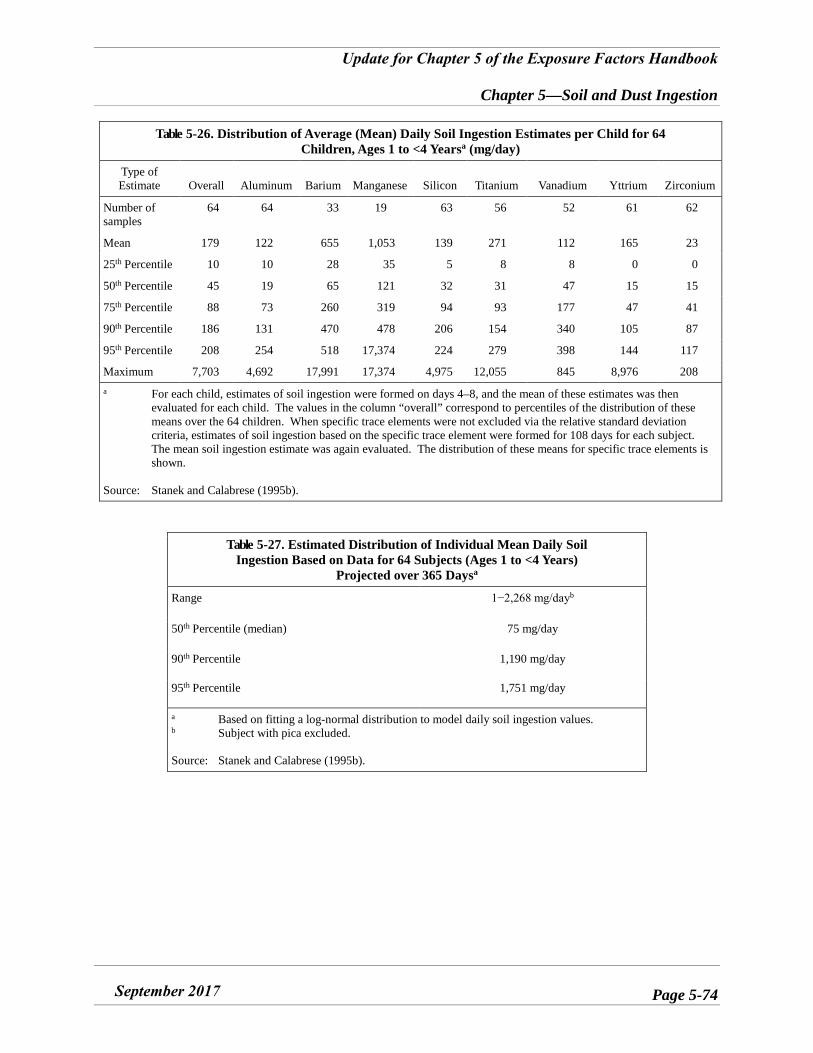
Update for Chapter 5 of the Exposure Factors Handbook
Chapter 5—Soil and Dust Ingestion
September 2017 Page 5-74
Table 5-26. Distribution of Average (Mean) Daily Soil Ingestion Estimates per Child for 64 Children, Ages 1 to <4 Yearsa (mg/day)
Type of Estimate Overall Aluminum Barium Manganese Silicon Titanium Vanadium Yttrium Zirconium
Number of samples
64 64 33 19 63 56 52 61 62
Mean 179 122 655 1,053 139 271 112 165 23
25th Percentile 10 10 28 35 5 8 8 0 0
50th Percentile 45 19 65 121 32 31 47 15 15
75th Percentile 88 73 260 319 94 93 177 47 41
90th Percentile 186 131 470 478 206 154 340 105 87
95th Percentile 208 254 518 17,374 224 279 398 144 117
Maximum 7,703 4,692 17,991 17,374 4,975 12,055 845 8,976 208 a For each child, estimates of soil ingestion were formed on days 4–8, and the mean of these estimates was then
evaluated for each child. The values in the column “overall” correspond to percentiles of the distribution of these means over the 64 children. When specific trace elements were not excluded via the relative standard deviation criteria, estimates of soil ingestion based on the specific trace element were formed for 108 days for each subject. The mean soil ingestion estimate was again evaluated. The distribution of these means for specific trace elements is shown.
Source: Stanek and Calabrese (1995b).
Table 5-27. Estimated Distribution of Individual Mean Daily Soil Ingestion Based on Data for 64 Subjects (Ages 1 to <4 Years)
Projected over 365 Daysa
Range 1−2,268 mg/dayb
50th Percentile (median) 75 mg/day
90th Percentile 1,190 mg/day
95th Percentile 1,751 mg/day
a Based on fitting a log-normal distribution to model daily soil ingestion values. b Subject with pica excluded.
Source: Stanek and Calabrese (1995b).
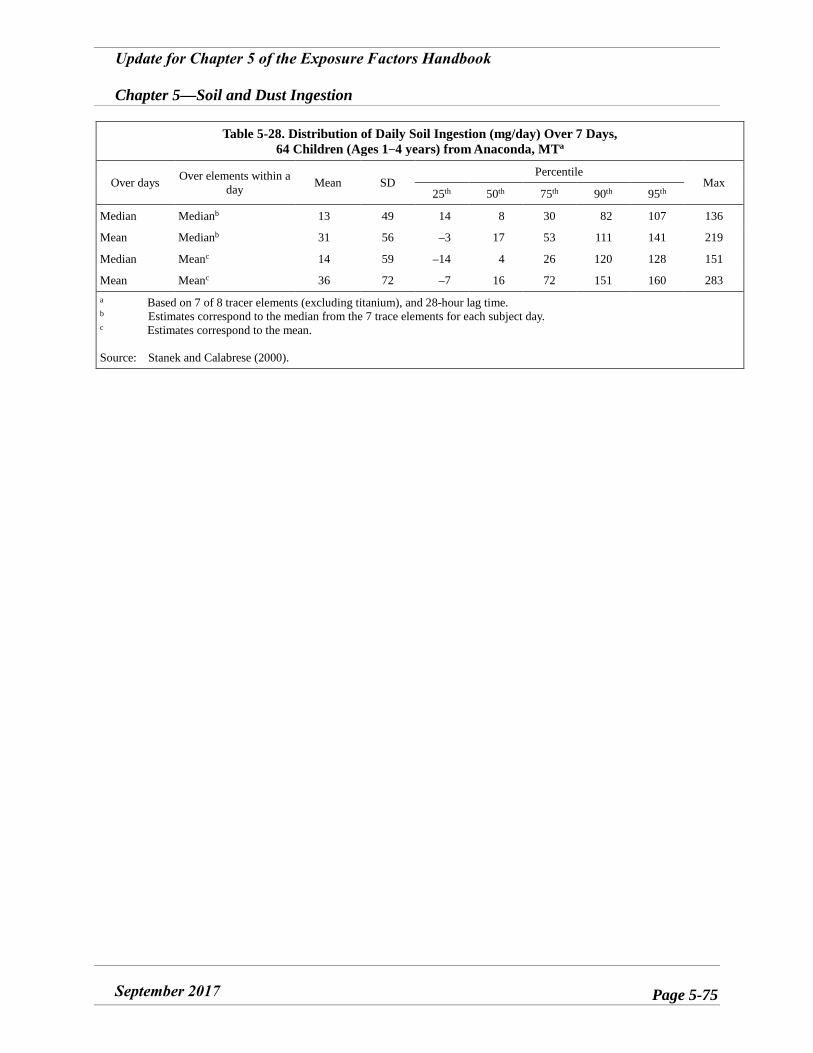
Update for Chapter 5 of the Exposure Factors Handbook
Chapter 5—Soil and Dust Ingestion
September 2017 Page 5-75
Table 5-28. Distribution of Daily Soil Ingestion (mg/day) Over 7 Days, 64 Children (Ages 1−4 years) from Anaconda, MTa
Over days Over elements within aday Mean SD
Percentile Max
25th 50th 75th 90th 95th
Median Medianb 13 49 14 8 30 82 107 136
Mean Medianb 31 56 –3 17 53 111 141 219
Median Meanc 14 59 –14 4 26 120 128 151
Mean Meanc 36 72 –7 16 72 151 160 283 a Based on 7 of 8 tracer elements (excluding titanium), and 28-hour lag time. b Estimates correspond to the median from the 7 trace elements for each subject day. c Estimates correspond to the mean.
Source: Stanek and Calabrese (2000).
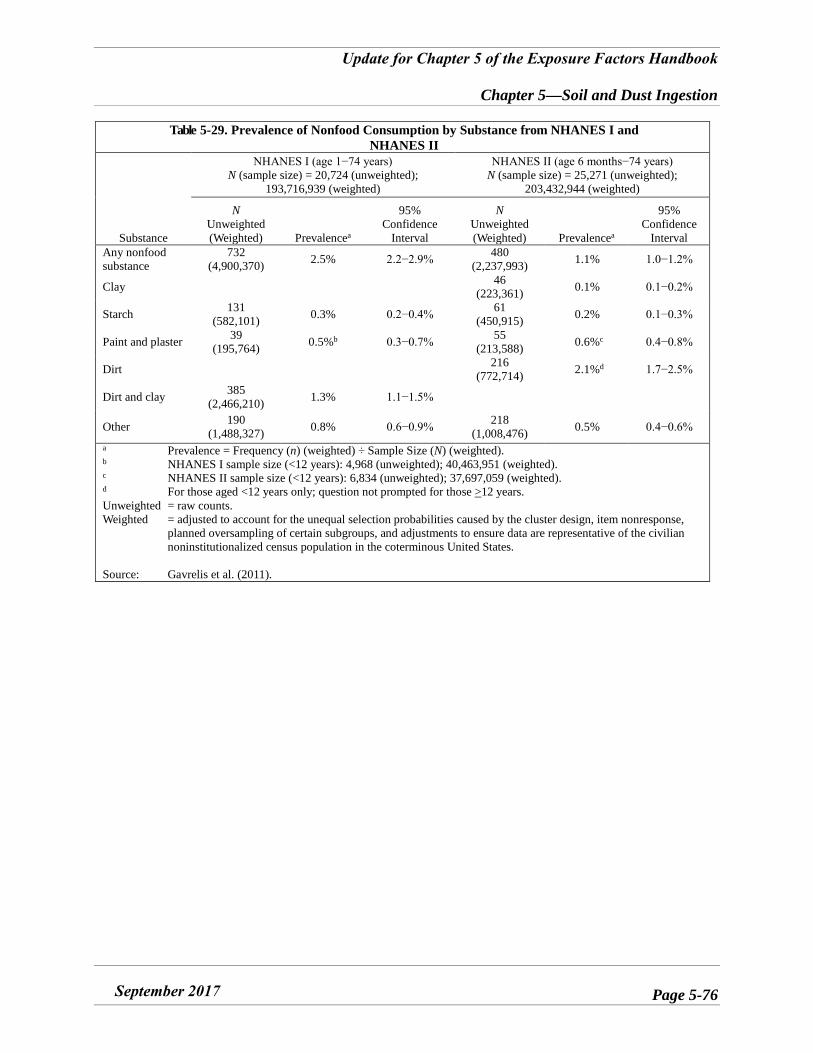
Update for Chapter 5 of the Exposure Factors Handbook
Chapter 5—Soil and Dust Ingestion
September 2017 Page 5-76
Table 5-29. Prevalence of Nonfood Consumption by Substance from NHANES I and NHANES II
Substance
NHANES I (age 1−74 years) N (sample size) = 20,724 (unweighted);
193,716,939 (weighted)
NHANES II (age 6 months−74 years) N (sample size) = 25,271 (unweighted);
203,432,944 (weighted)
N Unweighted (Weighted) Prevalencea
95% Confidence
Interval
N Unweighted (Weighted) Prevalencea
95% Confidence
Interval Any nonfood substance
732 (4,900,370) 2.5% 2.2−2.9% 480
(2,237,993) 1.1% 1.0−1.2%
Clay 46 (223,361) 0.1% 0.1−0.2%
Starch 131 (582,101) 0.3% 0.2−0.4% 61
(450,915) 0.2% 0.1−0.3%
Paint and plaster 39 (195,764) 0.5%b 0.3−0.7% 55
(213,588) 0.6%c 0.4−0.8%
Dirt 216 (772,714) 2.1%d 1.7−2.5%
Dirt and clay 385 (2,466,210) 1.3% 1.1−1.5%
Other 190 (1,488,327) 0.8% 0.6−0.9% 218
(1,008,476) 0.5% 0.4−0.6%
a Prevalence = Frequency (n) (weighted) ÷ Sample Size (N) (weighted). b NHANES I sample size (<12 years): 4,968 (unweighted); 40,463,951 (weighted). c NHANES II sample size (<12 years): 6,834 (unweighted); 37,697,059 (weighted). d For those aged <12 years only; question not prompted for those >12 years. Unweighted = raw counts. Weighted = adjusted to account for the unequal selection probabilities caused by the cluster design, item nonresponse,
planned oversampling of certain subgroups, and adjustments to ensure data are representative of the civilian noninstitutionalized census population in the coterminous United States.
Source: Gavrelis et al. (2011).
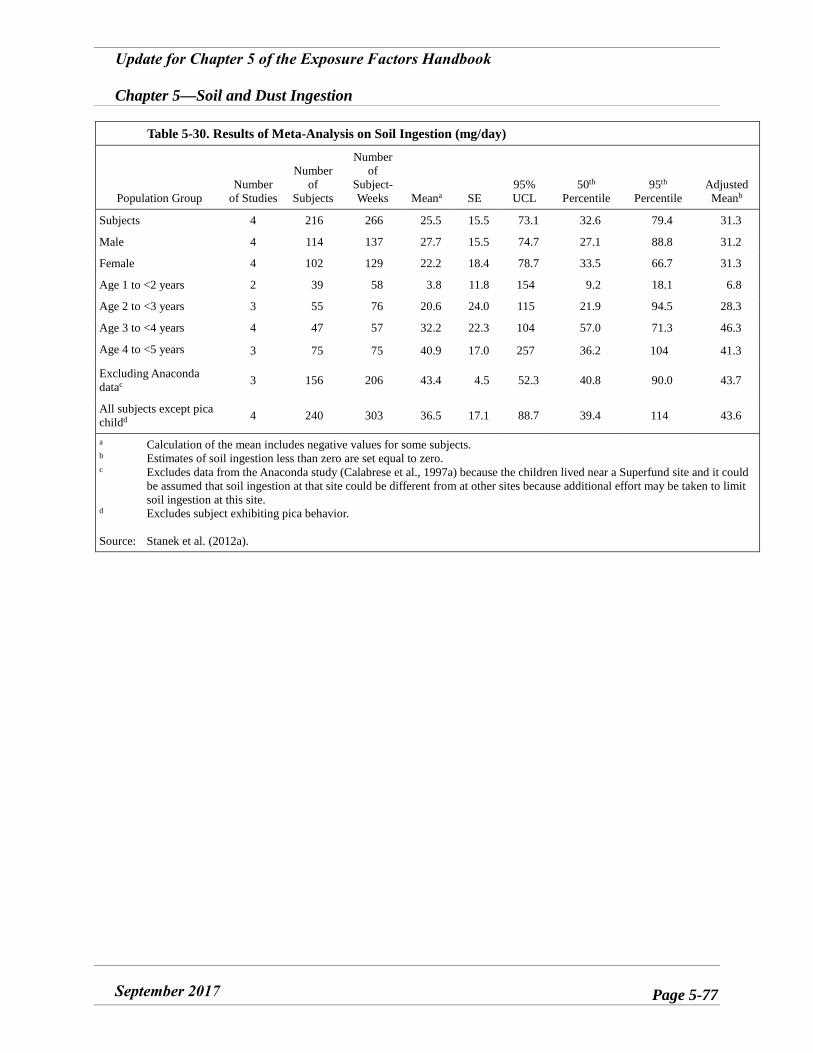
Update for Chapter 5 of the Exposure Factors Handbook
Chapter 5—Soil and Dust Ingestion
September 2017 Page 5-77
Table 5-30. Results of Meta-Analysis on Soil Ingestion (mg/day)
Population Group Number
of Studies
Number of
Subjects
Number of
Subject-Weeks Meana SE
95% UCL
50th Percentile
95th Percentile
Adjusted Meanb
Subjects 4 216 266 25.5 15.5 73.1 32.6 79.4 31.3
Male 4 114 137 27.7 15.5 74.7 27.1 88.8 31.2
Female 4 102 129 22.2 18.4 78.7 33.5 66.7 31.3
Age 1 to <2 years 2 39 58 3.8 11.8 154 9.2 18.1 6.8
Age 2 to <3 years 3 55 76 20.6 24.0 115 21.9 94.5 28.3
Age 3 to <4 years 4 47 57 32.2 22.3 104 57.0 71.3 46.3
Age 4 to <5 years 3 75 75 40.9 17.0 257 36.2 104 41.3
Excluding Anaconda datac 3 156 206 43.4 4.5 52.3 40.8 90.0 43.7
All subjects except pica childd 4 240 303 36.5 17.1 88.7 39.4 114 43.6
a Calculation of the mean includes negative values for some subjects. b Estimates of soil ingestion less than zero are set equal to zero. c Excludes data from the Anaconda study (Calabrese et al., 1997a) because the children lived near a Superfund site and it could
be assumed that soil ingestion at that site could be different from at other sites because additional effort may be taken to limit soil ingestion at this site.
d Excludes subject exhibiting pica behavior.
Source: Stanek et al. (2012a).
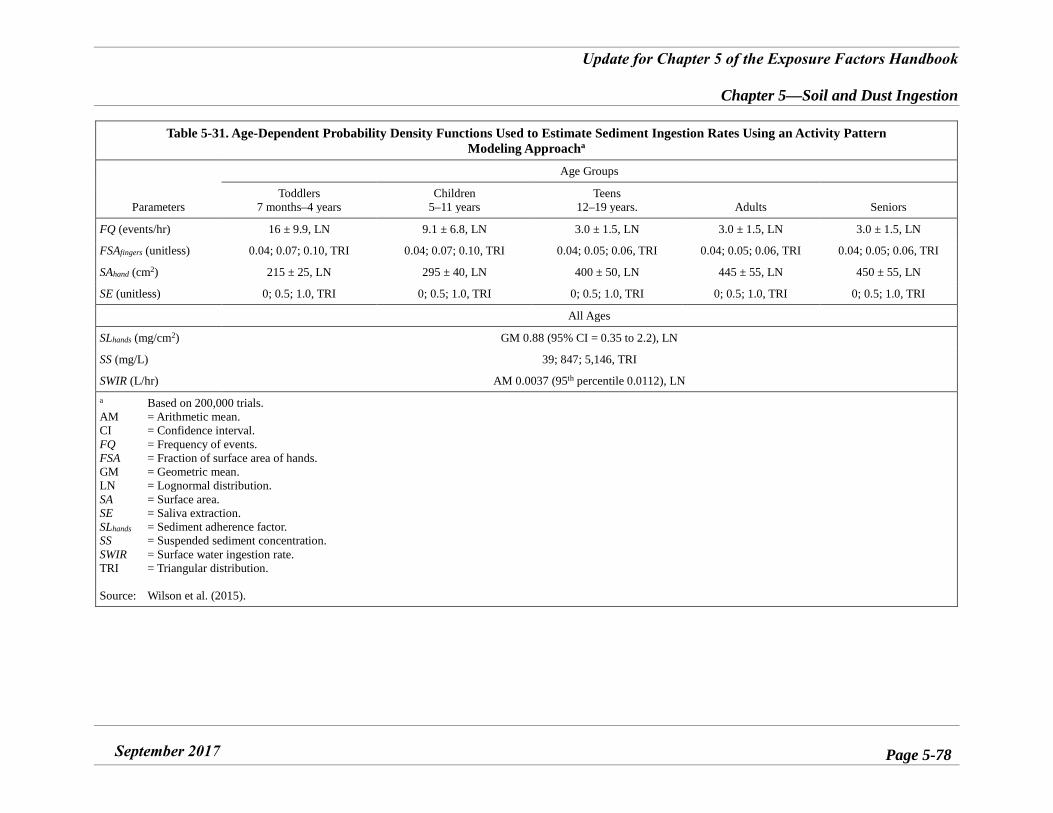
Update for Chapter 5 of the Exposure Factors Handbook
Chapter 5—Soil and Dust Ingestion
September 2017 Page 5-78
Table 5-31. Age-Dependent Probability Density Functions Used to Estimate Sediment Ingestion Rates Using an Activity Pattern Modeling Approacha
Parameters
Age Groups
Toddlers 7 months–4 years
Children 5–11 years
Teens 12–19 years. Adults Seniors
FQ (events/hr) 16 ± 9.9, LN 9.1 ± 6.8, LN 3.0 ± 1.5, LN 3.0 ± 1.5, LN 3.0 ± 1.5, LN
FSAfingers (unitless) 0.04; 0.07; 0.10, TRI 0.04; 0.07; 0.10, TRI 0.04; 0.05; 0.06, TRI 0.04; 0.05; 0.06, TRI 0.04; 0.05; 0.06, TRI
SAhand (cm2) 215 ± 25, LN 295 ± 40, LN 400 ± 50, LN 445 ± 55, LN 450 ± 55, LN
SE (unitless) 0; 0.5; 1.0, TRI 0; 0.5; 1.0, TRI 0; 0.5; 1.0, TRI 0; 0.5; 1.0, TRI 0; 0.5; 1.0, TRI
All Ages
SLhands (mg/cm2) GM 0.88 (95% CI = 0.35 to 2.2), LN
SS (mg/L) 39; 847; 5,146, TRI
SWIR (L/hr) AM 0.0037 (95th percentile 0.0112), LN a Based on 200,000 trials. AM = Arithmetic mean. CI = Confidence interval. FQ = Frequency of events. FSA = Fraction of surface area of hands. GM = Geometric mean. LN = Lognormal distribution. SA = Surface area. SE = Saliva extraction. SLhands = Sediment adherence factor. SS = Suspended sediment concentration. SWIR = Surface water ingestion rate. TRI = Triangular distribution.
Source: Wilson et al. (2015).
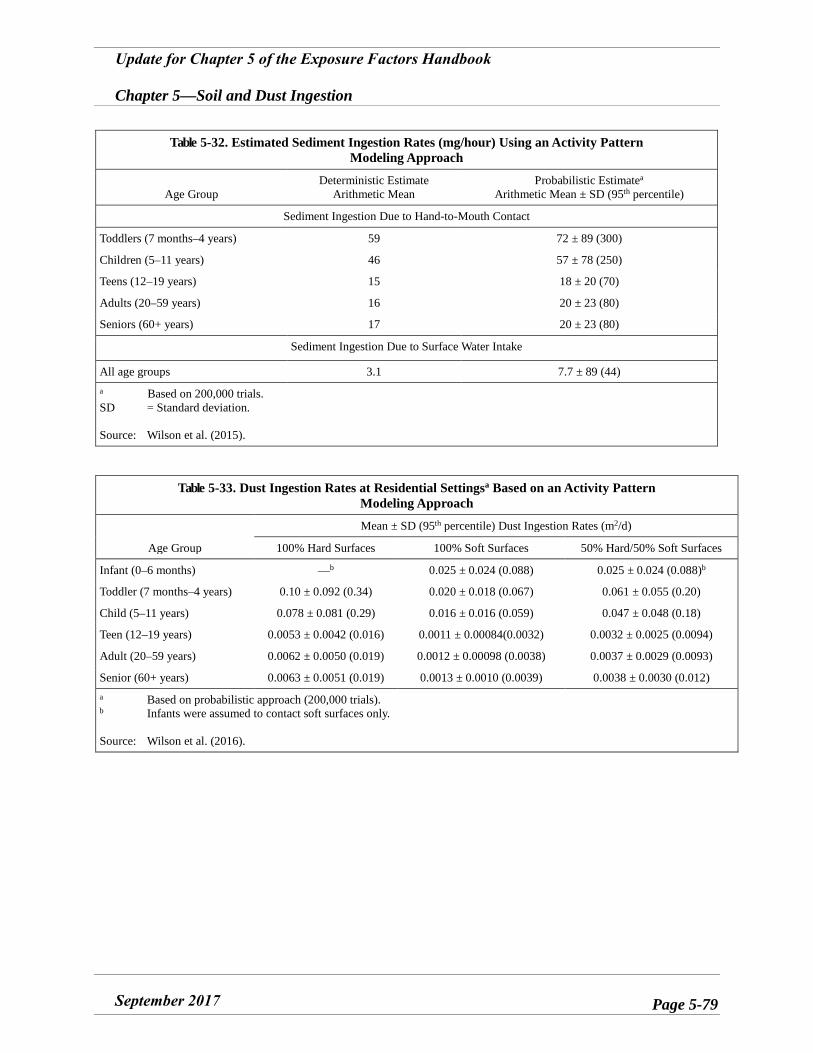
Update for Chapter 5 of the Exposure Factors Handbook
Chapter 5—Soil and Dust Ingestion
September 2017 Page 5-79
Table 5-32. Estimated Sediment Ingestion Rates (mg/hour) Using an Activity Pattern Modeling Approach
Age Group Deterministic Estimate
Arithmetic Mean Probabilistic Estimatea
Arithmetic Mean ± SD (95th percentile)
Sediment Ingestion Due to Hand-to-Mouth Contact
Toddlers (7 months–4 years) 59 72 ± 89 (300)
Children (5–11 years) 46 57 ± 78 (250)
Teens (12–19 years) 15 18 ± 20 (70)
Adults (20–59 years) 16 20 ± 23 (80)
Seniors (60+ years) 17 20 ± 23 (80)
Sediment Ingestion Due to Surface Water Intake
All age groups 3.1 7.7 ± 89 (44) a Based on 200,000 trials. SD = Standard deviation.
Source: Wilson et al. (2015).
Table 5-33. Dust Ingestion Rates at Residential Settingsa Based on an Activity Pattern Modeling Approach
Age Group
Mean ± SD (95th percentile) Dust Ingestion Rates (m2/d)
100% Hard Surfaces 100% Soft Surfaces 50% Hard/50% Soft Surfaces
Infant (0–6 months) —b 0.025 ± 0.024 (0.088) 0.025 ± 0.024 (0.088)b
Toddler (7 months–4 years) 0.10 ± 0.092 (0.34) 0.020 ± 0.018 (0.067) 0.061 ± 0.055 (0.20)
Child (5–11 years) 0.078 ± 0.081 (0.29) 0.016 ± 0.016 (0.059) 0.047 ± 0.048 (0.18)
Teen (12–19 years) 0.0053 ± 0.0042 (0.016) 0.0011 ± 0.00084(0.0032) 0.0032 ± 0.0025 (0.0094)
Adult (20–59 years) 0.0062 ± 0.0050 (0.019) 0.0012 ± 0.00098 (0.0038) 0.0037 ± 0.0029 (0.0093)
Senior (60+ years) 0.0063 ± 0.0051 (0.019) 0.0013 ± 0.0010 (0.0039) 0.0038 ± 0.0030 (0.012) a Based on probabilistic approach (200,000 trials). b Infants were assumed to contact soft surfaces only.
Source: Wilson et al. (2016).
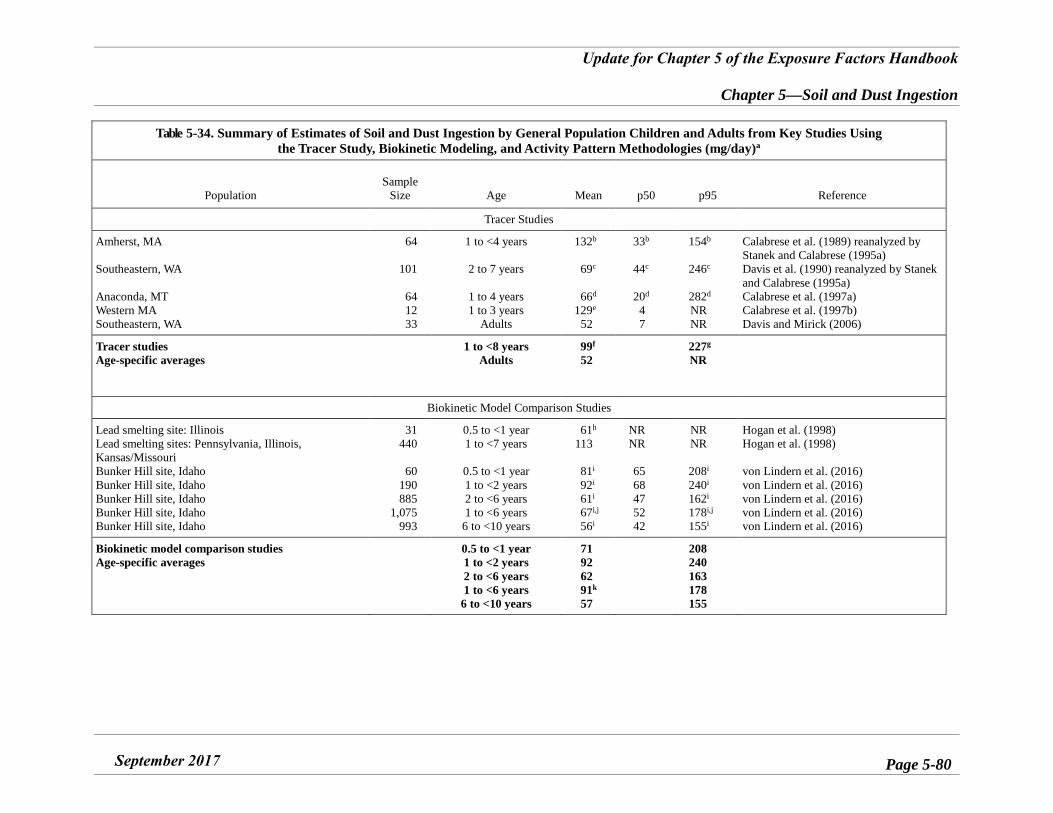
Update for Chapter 5 of the Exposure Factors Handbook
Chapter 5—Soil and Dust Ingestion
September 2017 Page 5-80
Table 5-34. Summary of Estimates of Soil and Dust Ingestion by General Population Children and Adults from Key Studies Using the Tracer Study, Biokinetic Modeling, and Activity Pattern Methodologies (mg/day)a
Population Sample
Size Age Mean p50 p95 Reference
Tracer Studies
Amherst, MA
Southeastern, WA
Anaconda, MT Western MA Southeastern, WA
64
101
64 12 33
1 to <4 years
2 to 7 years
1 to 4 years 1 to 3 years
Adults
132b
69c
66d 129e
52
33b
44c
20d 4 7
154b
246c
282d NR NR
Calabrese et al. (1989) reanalyzed by Stanek and Calabrese (1995a) Davis et al. (1990) reanalyzed by Stanek and Calabrese (1995a) Calabrese et al. (1997a) Calabrese et al. (1997b) Davis and Mirick (2006)
Tracer studies Age-specific averages
1 to <8 years Adults
99f 52
227g NR
Biokinetic Model Comparison Studies
Lead smelting site: Illinois Lead smelting sites: Pennsylvania, Illinois, Kansas/Missouri Bunker Hill site, Idaho Bunker Hill site, Idaho Bunker Hill site, Idaho Bunker Hill site, Idaho Bunker Hill site, Idaho
31 440
60 190 885
1,075 993
0.5 to <1 year 1 to <7 years
0.5 to <1 year 1 to <2 years 2 to <6 years 1 to <6 years
6 to <10 years
61h 113
81i 92i
61i 67i,j 56i
NR NR
65 68 47 52 42
NR NR
208i 240i
162i
178i,j 155i
Hogan et al. (1998) Hogan et al. (1998)
von Lindern et al. (2016) von Lindern et al. (2016) von Lindern et al. (2016) von Lindern et al. (2016) von Lindern et al. (2016)
Biokinetic model comparison studies Age-specific averages
0.5 to <1 year 1 to <2 years 2 to <6 years 1 to <6 years
6 to <10 years
71 92 62 91k 57
208 240 163 178 155
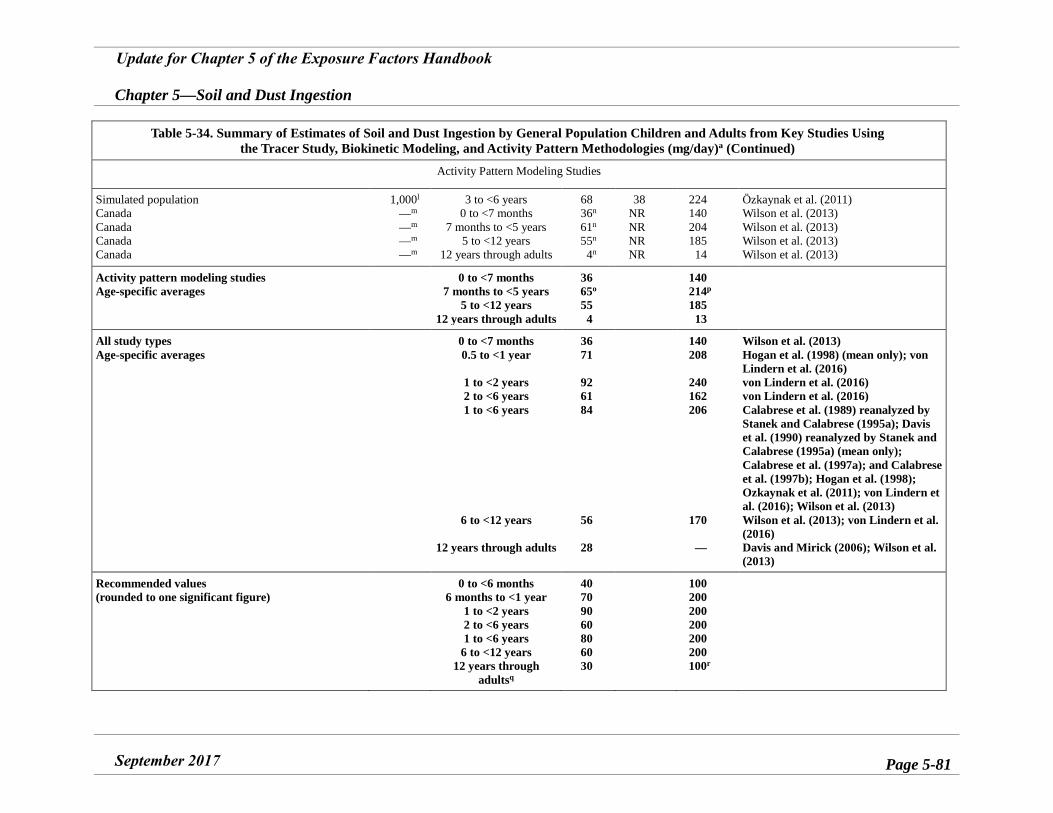
Update for Chapter 5 of the Exposure Factors Handbook
Chapter 5—Soil and Dust Ingestion
September 2017 Page 5-81
Table 5-34. Summary of Estimates of Soil and Dust Ingestion by General Population Children and Adults from Key Studies Using the Tracer Study, Biokinetic Modeling, and Activity Pattern Methodologies (mg/day)a (Continued)
Activity Pattern Modeling Studies
Simulated population Canada Canada Canada Canada
1,000l —m —m —m —m
3 to <6 years 0 to <7 months
7 months to <5 years 5 to <12 years
12 years through adults
68 36n
61n
55n
4n
38 NR NR NR NR
224 140 204 185
14
Özkaynak et al. (2011) Wilson et al. (2013) Wilson et al. (2013) Wilson et al. (2013) Wilson et al. (2013)
Activity pattern modeling studies Age-specific averages
0 to <7 months 7 months to <5 years
5 to <12 years 12 years through adults
36 65o 55 4
140 214p 185
13
All study types Age-specific averages
0 to <7 months 0.5 to <1 year
1 to <2 years 2 to <6 years 1 to <6 years
6 to <12 years
12 years through adults
36 71
92 61 84
56
28
140 208
240 162 206
170
—
Wilson et al. (2013) Hogan et al. (1998) (mean only); von Lindern et al. (2016) von Lindern et al. (2016) von Lindern et al. (2016) Calabrese et al. (1989) reanalyzed by Stanek and Calabrese (1995a); Davis et al. (1990) reanalyzed by Stanek and Calabrese (1995a) (mean only); Calabrese et al. (1997a); and Calabrese et al. (1997b); Hogan et al. (1998); Ozkaynak et al. (2011); von Lindern et al. (2016); Wilson et al. (2013) Wilson et al. (2013); von Lindern et al. (2016) Davis and Mirick (2006); Wilson et al. (2013)
Recommended values (rounded to one significant figure)
0 to <6 months 6 months to <1 year
1 to <2 years 2 to <6 years 1 to <6 years
6 to <12 years 12 years through
adultsq
40 70 90 60 80 60 30
100 200 200 200 200 200 100r
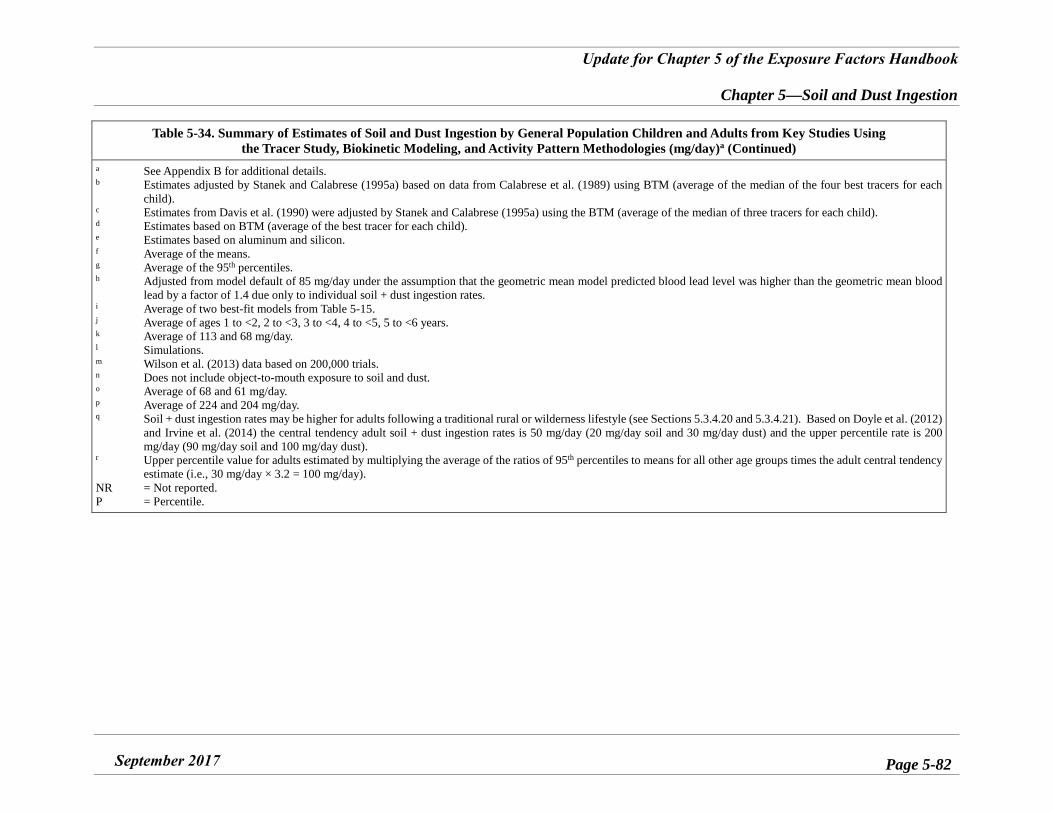
Update for Chapter 5 of the Exposure Factors Handbook
Chapter 5—Soil and Dust Ingestion
September 2017 Page 5-82
Table 5-34. Summary of Estimates of Soil and Dust Ingestion by General Population Children and Adults from Key Studies Using the Tracer Study, Biokinetic Modeling, and Activity Pattern Methodologies (mg/day)a (Continued)
a See Appendix B for additional details. b Estimates adjusted by Stanek and Calabrese (1995a) based on data from Calabrese et al. (1989) using BTM (average of the median of the four best tracers for each
child). c Estimates from Davis et al. (1990) were adjusted by Stanek and Calabrese (1995a) using the BTM (average of the median of three tracers for each child). d Estimates based on BTM (average of the best tracer for each child). e Estimates based on aluminum and silicon. f Average of the means. g Average of the 95th percentiles. h Adjusted from model default of 85 mg/day under the assumption that the geometric mean model predicted blood lead level was higher than the geometric mean blood
lead by a factor of 1.4 due only to individual soil + dust ingestion rates. i Average of two best-fit models from Table 5-15. j Average of ages 1 to <2, 2 to <3, 3 to <4, 4 to <5, 5 to <6 years. k Average of 113 and 68 mg/day. l Simulations. m Wilson et al. (2013) data based on 200,000 trials. n Does not include object-to-mouth exposure to soil and dust. o Average of 68 and 61 mg/day. p Average of 224 and 204 mg/day. q Soil + dust ingestion rates may be higher for adults following a traditional rural or wilderness lifestyle (see Sections 5.3.4.20 and 5.3.4.21). Based on Doyle et al. (2012)
and Irvine et al. (2014) the central tendency adult soil + dust ingestion rates is 50 mg/day (20 mg/day soil and 30 mg/day dust) and the upper percentile rate is 200 mg/day (90 mg/day soil and 100 mg/day dust).
r Upper percentile value for adults estimated by multiplying the average of the ratios of 95th percentiles to means for all other age groups times the adult central tendency estimate (i.e., 30 mg/day × 3.2 = 100 mg/day).
NR = Not reported. P = Percentile.
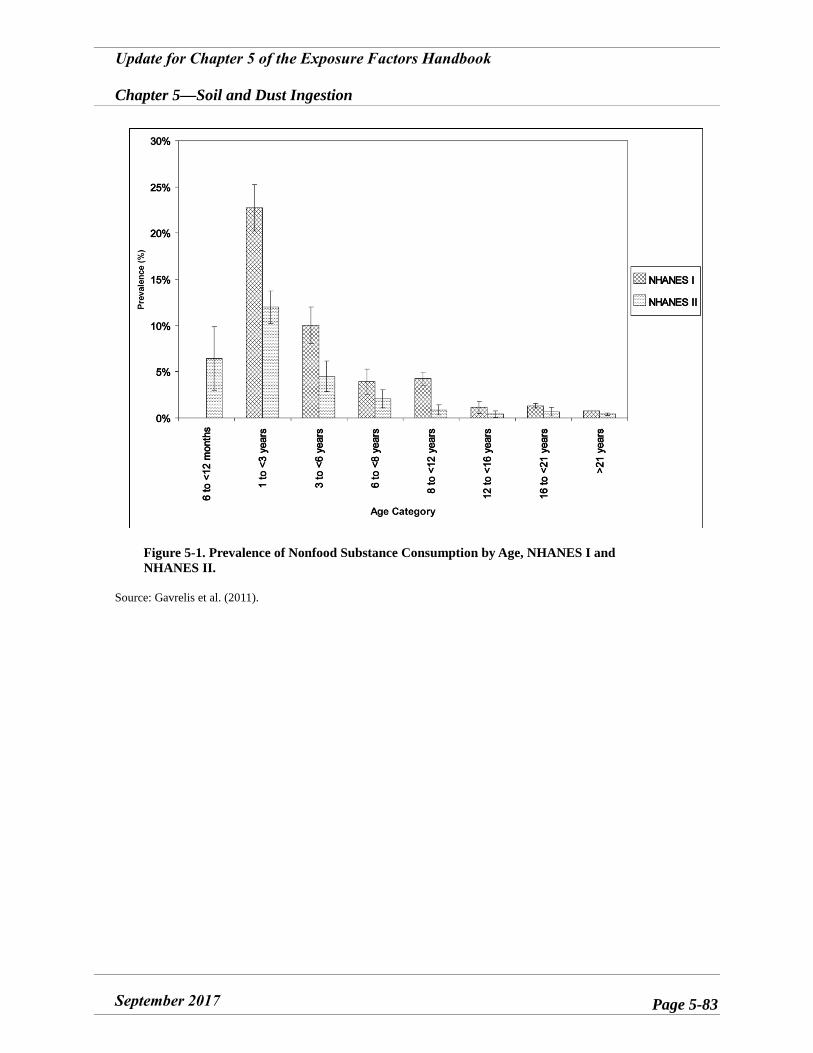
Update for Chapter 5 of the Exposure Factors Handbook
Chapter 5—Soil and Dust Ingestion
September 2017 Page 5-83
Figure 5-1. Prevalence of Nonfood Substance Consumption by Age, NHANES I and NHANES II.
Source: Gavrelis et al. (2011).
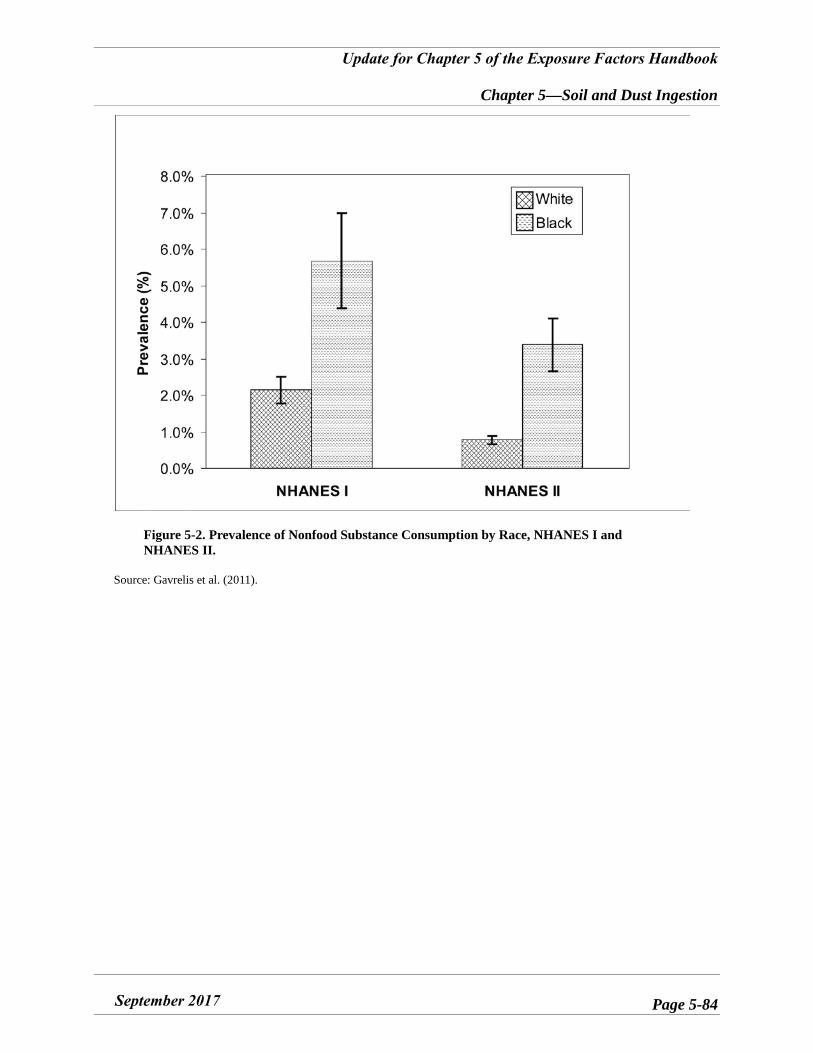
Update for Chapter 5 of the Exposure Factors Handbook
Chapter 5—Soil and Dust Ingestion
September 2017 Page 5-84
Figure 5-2. Prevalence of Nonfood Substance Consumption by Race, NHANES I and NHANES II.
Source: Gavrelis et al. (2011).
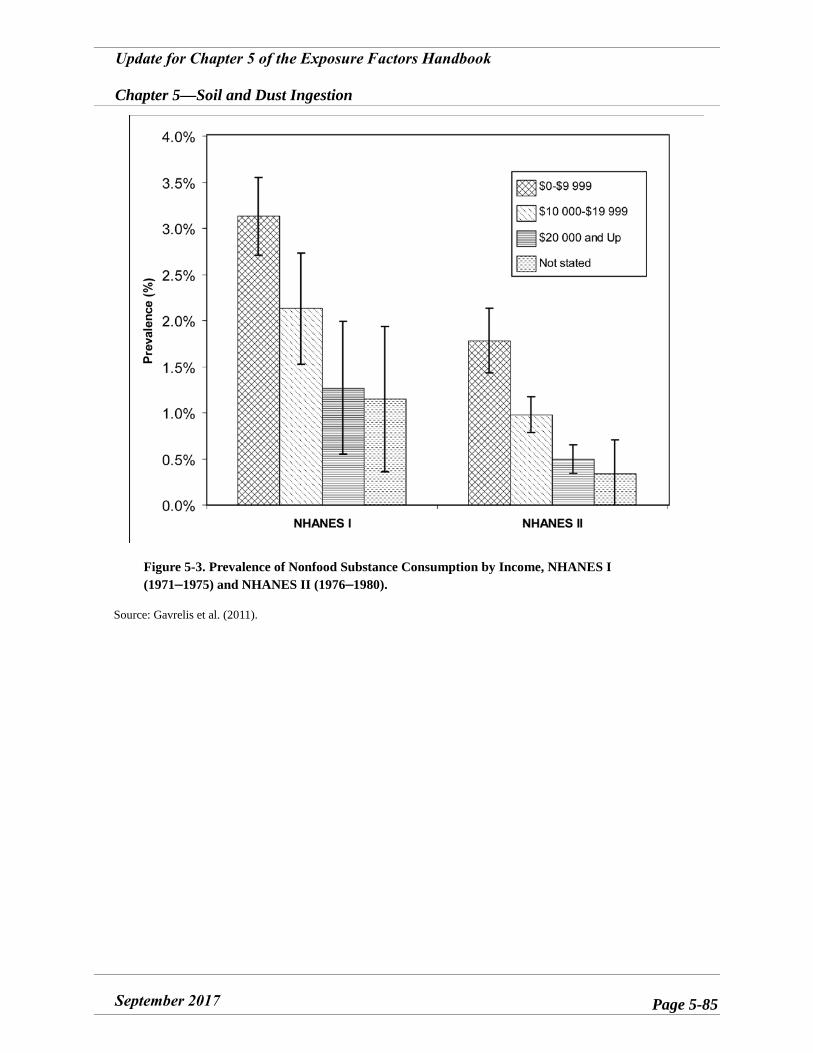
Update for Chapter 5 of the Exposure Factors Handbook
Chapter 5—Soil and Dust Ingestion
September 2017 Page 5-85
Figure 5-3. Prevalence of Nonfood Substance Consumption by Income, NHANES I (1971–1975) and NHANES II (1976–1980).
Source: Gavrelis et al. (2011).
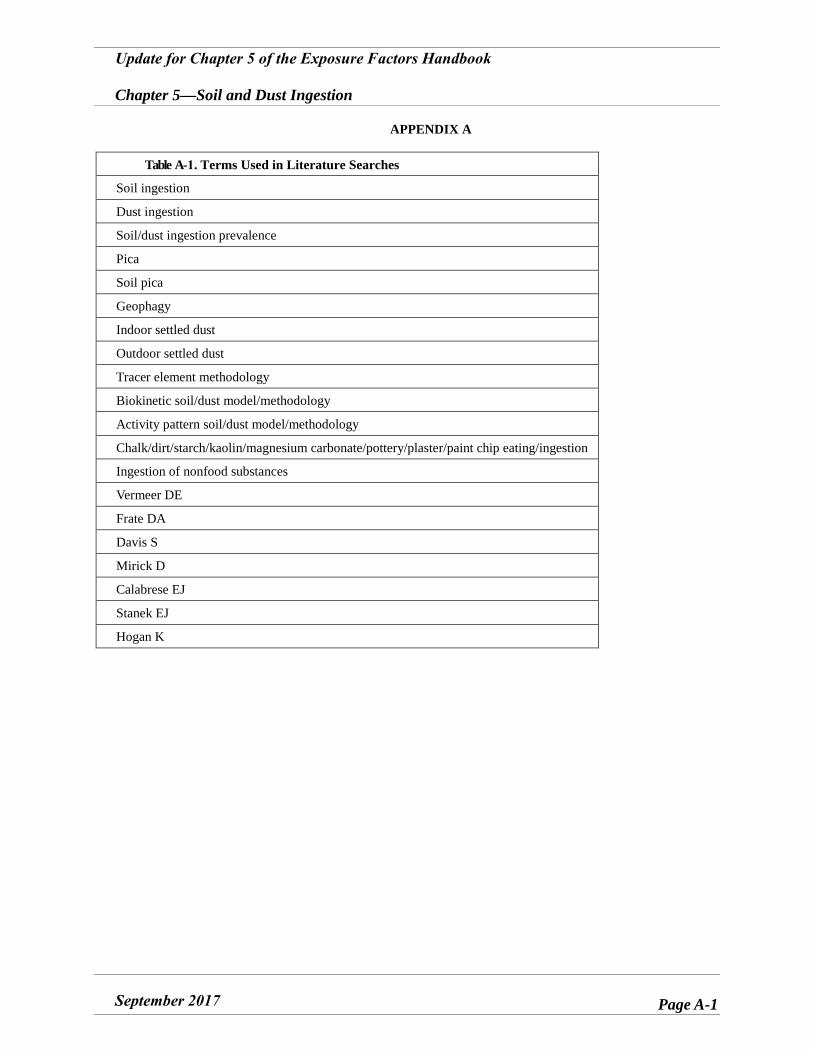
Update for Chapter 5 of the Exposure Factors Handbook
Chapter 5—Soil and Dust Ingestion
September 2017 Page A-1
APPENDIX A
Table A-1. Terms Used in Literature Searches
Soil ingestion
Dust ingestion
Soil/dust ingestion prevalence
Pica
Soil pica
Geophagy
Indoor settled dust
Outdoor settled dust
Tracer element methodology
Biokinetic soil/dust model/methodology
Activity pattern soil/dust model/methodology
Chalk/dirt/starch/kaolin/magnesium carbonate/pottery/plaster/paint chip eating/ingestion
Ingestion of nonfood substances
Vermeer DE
Frate DA
Davis S
Mirick D
Calabrese EJ
Stanek EJ
Hogan K
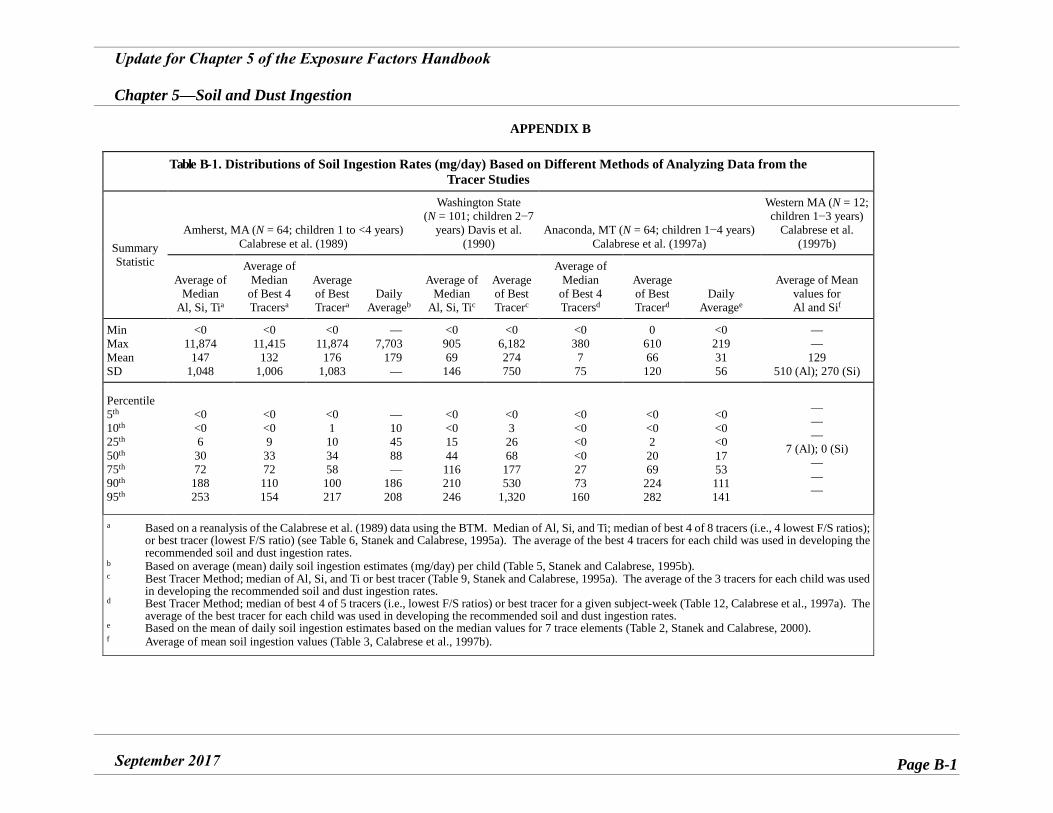
Update for Chapter 5 of the Exposure Factors Handbook
Chapter 5—Soil and Dust Ingestion
September 2017 Page B-1
APPENDIX B
Table B-1. Distributions of Soil Ingestion Rates (mg/day) Based on Different Methods of Analyzing Data from the Tracer Studies
Summary Statistic
Amherst, MA (N = 64; children 1 to <4 years) Calabrese et al. (1989)
Washington State (N = 101; children 2−7
years) Davis et al. (1990)
Anaconda, MT (N = 64; children 1−4 years) Calabrese et al. (1997a)
Western MA (N = 12; children 1−3 years)
Calabrese et al. (1997b)
Average of Median
Al, Si, Tia
Average of Median
of Best 4 Tracersa
Average of Best Tracera
Daily Averageb
Average of Median
Al, Si, Tic
Average of Best Tracerc
Average of Median
of Best 4 Tracersd
Average of Best Tracerd
Daily
Averagee
Average of Mean values for Al and Sif
Min Max Mean SD
<0 11,874
147 1,048
<0 11,415
132 1,006
<0 11,874
176 1,083
— 7,703
179 —
<0 905 69
146
<0 6,182 274 750
<0 380 7 75
0 610 66
120
<0 219 31 56
— —
129 510 (Al); 270 (Si)
Percentile 5th 10th 25th 50th 75th 90th 95th
<0 <0 6
30 72
188 253
<0 <0 9
33 72 110 154
<0 1 10 34 58
100 217
— 10 45 88 —
186 208
<0 <0 15 44 116 210 246
<0 3 26 68
177 530
1,320
<0 <0 <0 <0 27 73
160
<0 <0 2 20 69
224 282
<0 <0 <0 17 53 111 141
— — —
7 (Al); 0 (Si) — — —
a Based on a reanalysis of the Calabrese et al. (1989) data using the BTM. Median of Al, Si, and Ti; median of best 4 of 8 tracers (i.e., 4 lowest F/S ratios); or best tracer (lowest F/S ratio) (see Table 6, Stanek and Calabrese, 1995a). The average of the best 4 tracers for each child was used in developing the recommended soil and dust ingestion rates.
b Based on average (mean) daily soil ingestion estimates (mg/day) per child (Table 5, Stanek and Calabrese, 1995b). c Best Tracer Method; median of Al, Si, and Ti or best tracer (Table 9, Stanek and Calabrese, 1995a). The average of the 3 tracers for each child was used
in developing the recommended soil and dust ingestion rates. d Best Tracer Method; median of best 4 of 5 tracers (i.e., lowest F/S ratios) or best tracer for a given subject-week (Table 12, Calabrese et al., 1997a). The
average of the best tracer for each child was used in developing the recommended soil and dust ingestion rates. e Based on the mean of daily soil ingestion estimates based on the median values for 7 trace elements (Table 2, Stanek and Calabrese, 2000). f Average of mean soil ingestion values (Table 3, Calabrese et al., 1997b).
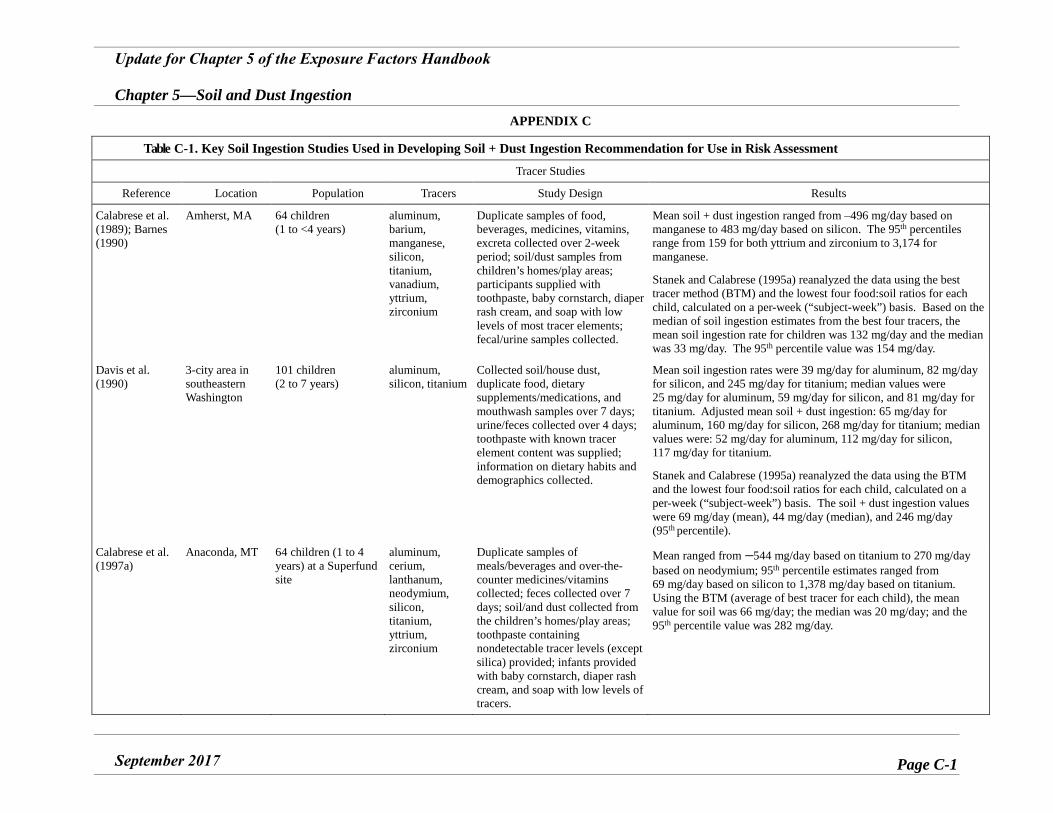
Update for Chapter 5 of the Exposure Factors Handbook
Chapter 5—Soil and Dust Ingestion
September 2017 Page C-1
APPENDIX C
Table C-1. Key Soil Ingestion Studies Used in Developing Soil + Dust Ingestion Recommendation for Use in Risk Assessment
Tracer Studies
Reference Location Population Tracers Study Design Results
Calabrese et al. (1989); Barnes (1990)
Amherst, MA 64 children (1 to <4 years)
aluminum, barium, manganese, silicon, titanium, vanadium, yttrium, zirconium
Duplicate samples of food, beverages, medicines, vitamins, excreta collected over 2-week period; soil/dust samples from children’s homes/play areas; participants supplied with toothpaste, baby cornstarch, diaper rash cream, and soap with low levels of most tracer elements; fecal/urine samples collected.
Mean soil + dust ingestion ranged from –496 mg/day based on manganese to 483 mg/day based on silicon. The 95th percentiles range from 159 for both yttrium and zirconium to 3,174 for manganese.
Stanek and Calabrese (1995a) reanalyzed the data using the best tracer method (BTM) and the lowest four food:soil ratios for each child, calculated on a per-week (“subject-week”) basis. Based on the median of soil ingestion estimates from the best four tracers, the mean soil ingestion rate for children was 132 mg/day and the median was 33 mg/day. The 95th percentile value was 154 mg/day.
Davis et al. (1990)
3-city area in southeastern Washington
101 children (2 to 7 years)
aluminum, silicon, titanium
Collected soil/house dust, duplicate food, dietary supplements/medications, and mouthwash samples over 7 days; urine/feces collected over 4 days; toothpaste with known tracer element content was supplied; information on dietary habits and demographics collected.
Mean soil ingestion rates were 39 mg/day for aluminum, 82 mg/day for silicon, and 245 mg/day for titanium; median values were 25 mg/day for aluminum, 59 mg/day for silicon, and 81 mg/day for titanium. Adjusted mean soil + dust ingestion: 65 mg/day for aluminum, 160 mg/day for silicon, 268 mg/day for titanium; median values were: 52 mg/day for aluminum, 112 mg/day for silicon, 117 mg/day for titanium.
Stanek and Calabrese (1995a) reanalyzed the data using the BTM and the lowest four food:soil ratios for each child, calculated on a per-week (“subject-week”) basis. The soil + dust ingestion values were 69 mg/day (mean), 44 mg/day (median), and 246 mg/day (95th percentile).
Calabrese et al. (1997a)
Anaconda, MT 64 children (1 to 4 years) at a Superfund site
aluminum, cerium, lanthanum, neodymium, silicon, titanium, yttrium, zirconium
Duplicate samples of meals/beverages and over-the-counter medicines/vitamins collected; feces collected over 7 days; soil/and dust collected from the children’s homes/play areas; toothpaste containing nondetectable tracer levels (except silica) provided; infants provided with baby cornstarch, diaper rash cream, and soap with low levels of tracers.
Mean ranged from –544 mg/day based on titanium to 270 mg/daybased on neodymium; 95th percentile estimates ranged from 69 mg/day based on silicon to 1,378 mg/day based on titanium. Using the BTM (average of best tracer for each child), the mean value for soil was 66 mg/day; the median was 20 mg/day; and the 95th percentile value was 282 mg/day.
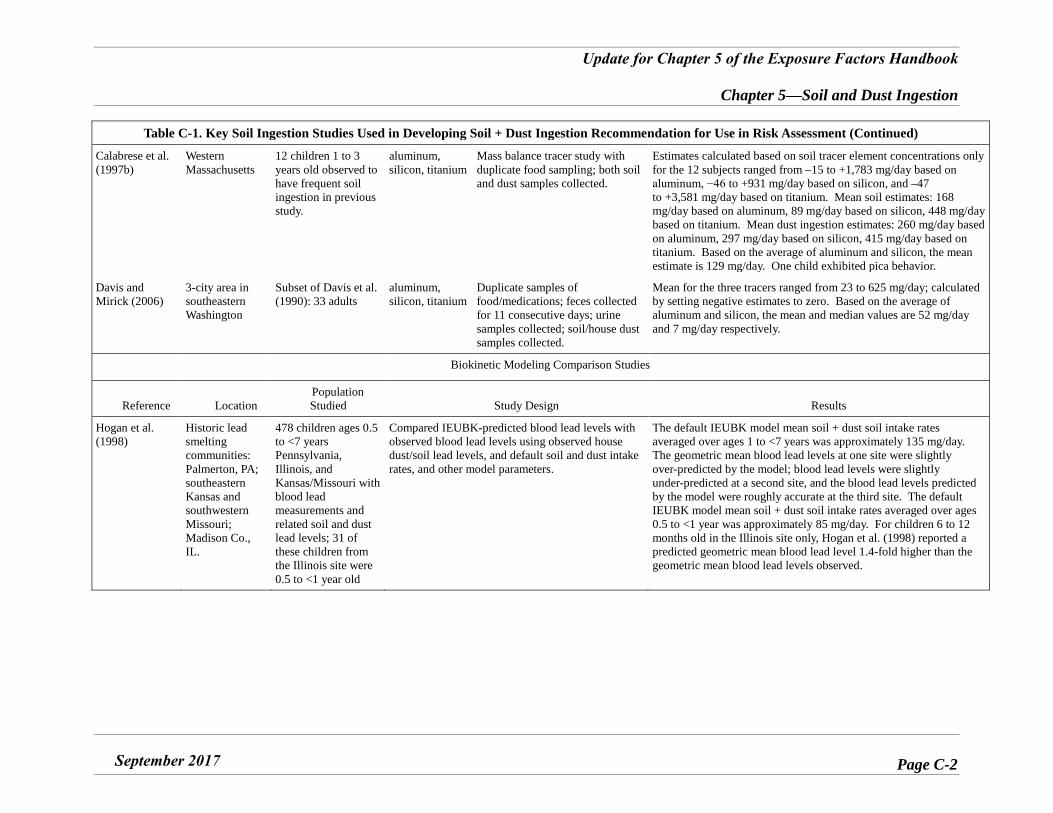
Update for Chapter 5 of the Exposure Factors Handbook
Chapter 5—Soil and Dust Ingestion
September 2017 Page C-2
Table C-1. Key Soil Ingestion Studies Used in Developing Soil + Dust Ingestion Recommendation for Use in Risk Assessment (Continued)
Calabrese et al. (1997b)
Western Massachusetts
12 children 1 to 3 years old observed to have frequent soil ingestion in previous study.
aluminum, silicon, titanium
Mass balance tracer study with duplicate food sampling; both soil and dust samples collected.
Estimates calculated based on soil tracer element concentrations only for the 12 subjects ranged from –15 to +1,783 mg/day based on aluminum, −46 to +931 mg/day based on silicon, and –47 to +3,581 mg/day based on titanium. Mean soil estimates: 168 mg/day based on aluminum, 89 mg/day based on silicon, 448 mg/day based on titanium. Mean dust ingestion estimates: 260 mg/day based on aluminum, 297 mg/day based on silicon, 415 mg/day based on titanium. Based on the average of aluminum and silicon, the mean estimate is 129 mg/day. One child exhibited pica behavior.
Davis and Mirick (2006)
3-city area in southeastern Washington
Subset of Davis et al. (1990): 33 adults
aluminum, silicon, titanium
Duplicate samples of food/medications; feces collected for 11 consecutive days; urine samples collected; soil/house dust samples collected.
Mean for the three tracers ranged from 23 to 625 mg/day; calculated by setting negative estimates to zero. Based on the average of aluminum and silicon, the mean and median values are 52 mg/day and 7 mg/day respectively.
Biokinetic Modeling Comparison Studies
Reference Location Population Studied Study Design Results
Hogan et al. (1998)
Historic lead smelting communities: Palmerton, PA; southeastern Kansas and southwestern Missouri; Madison Co., IL.
478 children ages 0.5 to <7 years Pennsylvania, Illinois, and Kansas/Missouri with blood lead measurements and related soil and dust lead levels; 31 of these children from the Illinois site were 0.5 to <1 year old
Compared IEUBK-predicted blood lead levels with observed blood lead levels using observed house dust/soil lead levels, and default soil and dust intake rates, and other model parameters.
The default IEUBK model mean soil + dust soil intake rates averaged over ages 1 to <7 years was approximately 135 mg/day. The geometric mean blood lead levels at one site were slightly over-predicted by the model; blood lead levels were slightly under-predicted at a second site, and the blood lead levels predicted by the model were roughly accurate at the third site. The default IEUBK model mean soil + dust soil intake rates averaged over ages 0.5 to <1 year was approximately 85 mg/day. For children 6 to 12 months old in the Illinois site only, Hogan et al. (1998) reported a predicted geometric mean blood lead level 1.4-fold higher than the geometric mean blood lead levels observed.
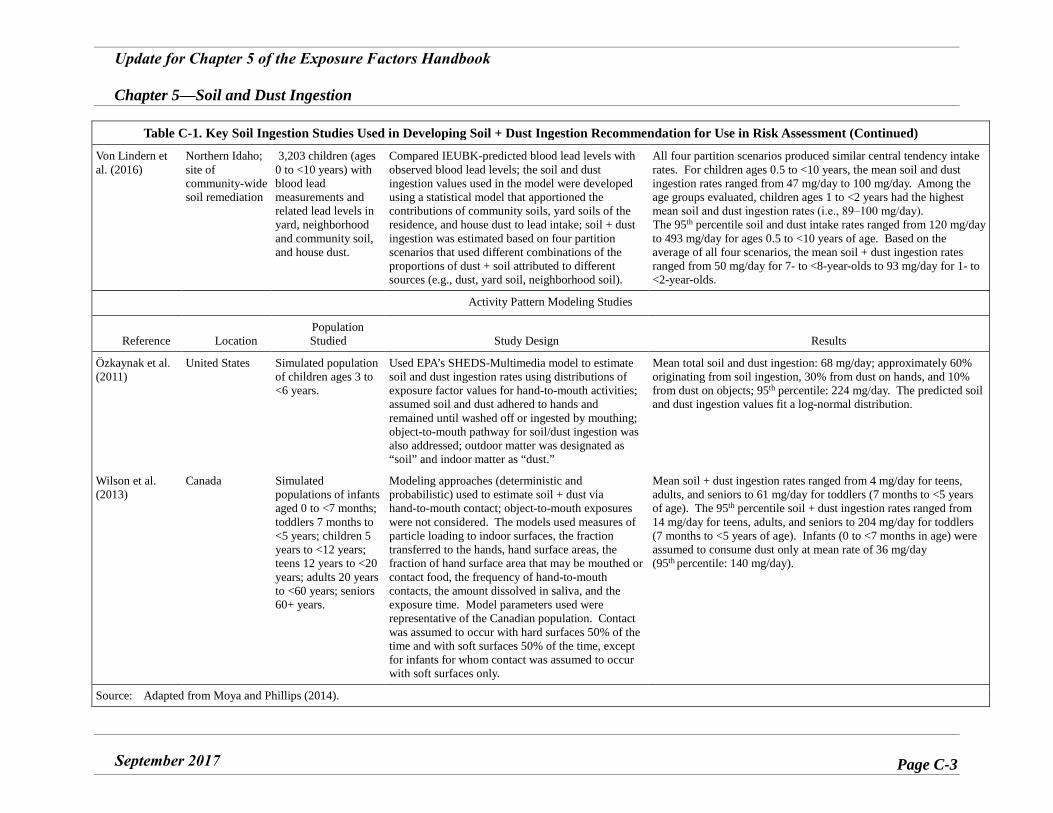
Update for Chapter 5 of the Exposure Factors Handbook
Chapter 5—Soil and Dust Ingestion
September 2017 Page C-3
Table C-1. Key Soil Ingestion Studies Used in Developing Soil + Dust Ingestion Recommendation for Use in Risk Assessment (Continued)
Von Lindern et al. (2016)
Northern Idaho; site of community-wide soil remediation
3,203 children (ages 0 to <10 years) with blood lead measurements and related lead levels in yard, neighborhood and community soil, and house dust.
Compared IEUBK-predicted blood lead levels with observed blood lead levels; the soil and dust ingestion values used in the model were developed using a statistical model that apportioned the contributions of community soils, yard soils of the residence, and house dust to lead intake; soil + dust ingestion was estimated based on four partition scenarios that used different combinations of the proportions of dust + soil attributed to different sources (e.g., dust, yard soil, neighborhood soil).
All four partition scenarios produced similar central tendency intake rates. For children ages 0.5 to <10 years, the mean soil and dust ingestion rates ranged from 47 mg/day to 100 mg/day. Among the age groups evaluated, children ages 1 to <2 years had the highest mean soil and dust ingestion rates (i.e., 89‒100 mg/day). The 95th percentile soil and dust intake rates ranged from 120 mg/day to 493 mg/day for ages 0.5 to <10 years of age. Based on the average of all four scenarios, the mean soil + dust ingestion rates ranged from 50 mg/day for 7- to <8-year-olds to 93 mg/day for 1- to <2-year-olds.
Activity Pattern Modeling Studies
Reference Location Population Studied Study Design Results
Özkaynak et al. (2011)
United States Simulated population of children ages 3 to <6 years.
Used EPA’s SHEDS-Multimedia model to estimate soil and dust ingestion rates using distributions of exposure factor values for hand-to-mouth activities; assumed soil and dust adhered to hands and remained until washed off or ingested by mouthing; object-to-mouth pathway for soil/dust ingestion was also addressed; outdoor matter was designated as “soil” and indoor matter as “dust.”
Mean total soil and dust ingestion: 68 mg/day; approximately 60% originating from soil ingestion, 30% from dust on hands, and 10% from dust on objects; 95th percentile: 224 mg/day. The predicted soil and dust ingestion values fit a log-normal distribution.
Wilson et al. (2013)
Canada Simulated populations of infants aged 0 to <7 months; toddlers 7 months to <5 years; children 5 years to <12 years; teens 12 years to <20 years; adults 20 years to <60 years; seniors 60+ years.
Modeling approaches (deterministic and probabilistic) used to estimate soil + dust via hand-to-mouth contact; object-to-mouth exposures were not considered. The models used measures of particle loading to indoor surfaces, the fraction transferred to the hands, hand surface areas, the fraction of hand surface area that may be mouthed or contact food, the frequency of hand-to-mouth contacts, the amount dissolved in saliva, and the exposure time. Model parameters used were representative of the Canadian population. Contact was assumed to occur with hard surfaces 50% of the time and with soft surfaces 50% of the time, except for infants for whom contact was assumed to occur with soft surfaces only.
Mean soil + dust ingestion rates ranged from 4 mg/day for teens, adults, and seniors to 61 mg/day for toddlers (7 months to <5 years of age). The 95th percentile soil + dust ingestion rates ranged from 14 mg/day for teens, adults, and seniors to 204 mg/day for toddlers (7 months to <5 years of age). Infants (0 to <7 months in age) were assumed to consume dust only at mean rate of 36 mg/day (95th percentile: 140 mg/day).
Source: Adapted from Moya and Phillips (2014).
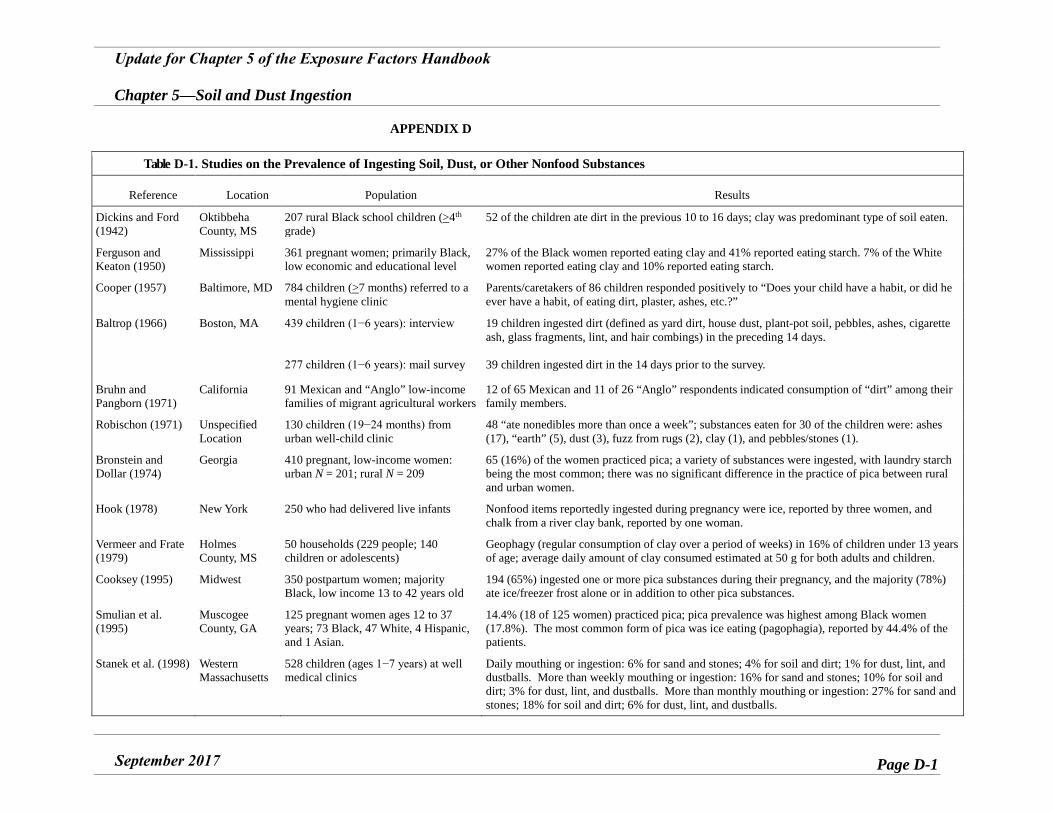
Update for Chapter 5 of the Exposure Factors Handbook
Chapter 5—Soil and Dust Ingestion
September 2017 Page D-1
APPENDIX D
Table D-1. Studies on the Prevalence of Ingesting Soil, Dust, or Other Nonfood Substances
Reference Location Population Results
Dickins and Ford (1942)
Oktibbeha County, MS
207 rural Black school children (>4th grade)
52 of the children ate dirt in the previous 10 to 16 days; clay was predominant type of soil eaten.
Ferguson and Keaton (1950)
Mississippi 361 pregnant women; primarily Black, low economic and educational level
27% of the Black women reported eating clay and 41% reported eating starch. 7% of the White women reported eating clay and 10% reported eating starch.
Cooper (1957) Baltimore, MD 784 children (>7 months) referred to a mental hygiene clinic
Parents/caretakers of 86 children responded positively to “Does your child have a habit, or did he ever have a habit, of eating dirt, plaster, ashes, etc.?”
Baltrop (1966) Boston, MA 439 children (1−6 years): interview
277 children (1−6 years): mail survey
19 children ingested dirt (defined as yard dirt, house dust, plant-pot soil, pebbles, ashes, cigarette ash, glass fragments, lint, and hair combings) in the preceding 14 days.
39 children ingested dirt in the 14 days prior to the survey.
Bruhn and Pangborn (1971)
California 91 Mexican and “Anglo” low-income families of migrant agricultural workers
12 of 65 Mexican and 11 of 26 “Anglo” respondents indicated consumption of “dirt” among their family members.
Robischon (1971) Unspecified Location
130 children (19−24 months) from urban well-child clinic
48 “ate nonedibles more than once a week”; substances eaten for 30 of the children were: ashes (17), “earth” (5), dust (3), fuzz from rugs (2), clay (1), and pebbles/stones (1).
Bronstein and Dollar (1974)
Georgia 410 pregnant, low-income women: urban N = 201; rural N = 209
65 (16%) of the women practiced pica; a variety of substances were ingested, with laundry starch being the most common; there was no significant difference in the practice of pica between rural and urban women.
Hook (1978) New York 250 who had delivered live infants Nonfood items reportedly ingested during pregnancy were ice, reported by three women, and chalk from a river clay bank, reported by one woman.
Vermeer and Frate (1979)
Holmes County, MS
50 households (229 people; 140 children or adolescents)
Geophagy (regular consumption of clay over a period of weeks) in 16% of children under 13 years of age; average daily amount of clay consumed estimated at 50 g for both adults and children.
Cooksey (1995) Midwest 350 postpartum women; majority Black, low income 13 to 42 years old
194 (65%) ingested one or more pica substances during their pregnancy, and the majority (78%) ate ice/freezer frost alone or in addition to other pica substances.
Smulian et al. (1995)
Muscogee County, GA
125 pregnant women ages 12 to 37 years; 73 Black, 47 White, 4 Hispanic, and 1 Asian.
14.4% (18 of 125 women) practiced pica; pica prevalence was highest among Black women (17.8%). The most common form of pica was ice eating (pagophagia), reported by 44.4% of the patients.
Stanek et al. (1998) Western Massachusetts
528 children (ages 1−7 years) at well medical clinics
Daily mouthing or ingestion: 6% for sand and stones; 4% for soil and dirt; 1% for dust, lint, and dustballs. More than weekly mouthing or ingestion: 16% for sand and stones; 10% for soil and dirt; 3% for dust, lint, and dustballs. More than monthly mouthing or ingestion: 27% for sand and stones; 18% for soil and dirt; 6% for dust, lint, and dustballs.
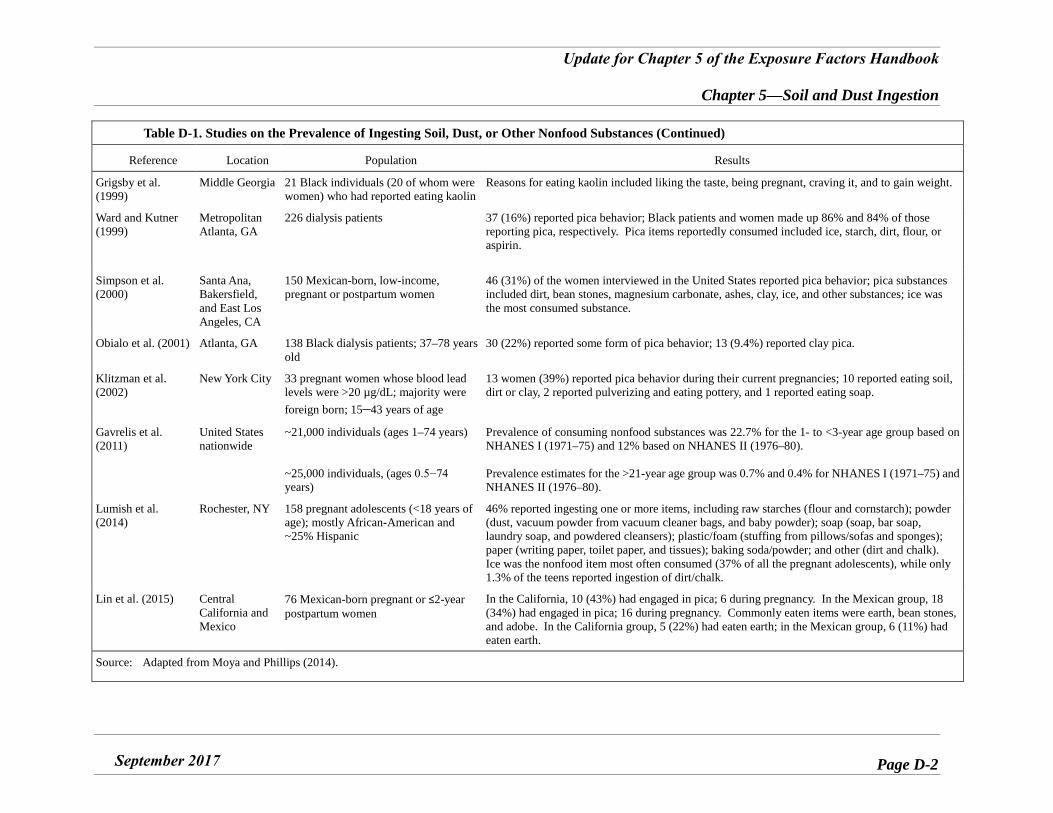
Update for Chapter 5 of the Exposure Factors Handbook
Chapter 5—Soil and Dust Ingestion
September 2017 Page D-2
Table D-1. Studies on the Prevalence of Ingesting Soil, Dust, or Other Nonfood Substances (Continued)
Reference Location Population Results
Grigsby et al. (1999)
Middle Georgia 21 Black individuals (20 of whom were women) who had reported eating kaolin
Reasons for eating kaolin included liking the taste, being pregnant, craving it, and to gain weight.
Ward and Kutner (1999)
Metropolitan Atlanta, GA
226 dialysis patients 37 (16%) reported pica behavior; Black patients and women made up 86% and 84% of those reporting pica, respectively. Pica items reportedly consumed included ice, starch, dirt, flour, or aspirin.
Simpson et al. (2000)
Santa Ana, Bakersfield, and East Los Angeles, CA
150 Mexican-born, low-income, pregnant or postpartum women
46 (31%) of the women interviewed in the United States reported pica behavior; pica substances included dirt, bean stones, magnesium carbonate, ashes, clay, ice, and other substances; ice was the most consumed substance.
Obialo et al. (2001) Atlanta, GA 138 Black dialysis patients; 37–78 years old
30 (22%) reported some form of pica behavior; 13 (9.4%) reported clay pica.
Klitzman et al. (2002)
New York City 33 pregnant women whose blood lead levels were >20 µg/dL; majority were foreign born; 15–43 years of age
13 women (39%) reported pica behavior during their current pregnancies; 10 reported eating soil, dirt or clay, 2 reported pulverizing and eating pottery, and 1 reported eating soap.
Gavrelis et al. (2011)
United States nationwide
~21,000 individuals (ages 1–74 years)
~25,000 individuals, (ages 0.5−74 years)
Prevalence of consuming nonfood substances was 22.7% for the 1- to <3-year age group based on NHANES I (1971–75) and 12% based on NHANES II (1976–80).
Prevalence estimates for the >21-year age group was 0.7% and 0.4% for NHANES I (1971–75) and NHANES II (1976–80).
Lumish et al. (2014)
Rochester, NY 158 pregnant adolescents (<18 years of age); mostly African-American and ~25% Hispanic
46% reported ingesting one or more items, including raw starches (flour and cornstarch); powder (dust, vacuum powder from vacuum cleaner bags, and baby powder); soap (soap, bar soap, laundry soap, and powdered cleansers); plastic/foam (stuffing from pillows/sofas and sponges); paper (writing paper, toilet paper, and tissues); baking soda/powder; and other (dirt and chalk). Ice was the nonfood item most often consumed (37% of all the pregnant adolescents), while only 1.3% of the teens reported ingestion of dirt/chalk.
Lin et al. (2015) Central California and Mexico
76 Mexican-born pregnant or ≤2-year postpartum women
In the California, 10 (43%) had engaged in pica; 6 during pregnancy. In the Mexican group, 18 (34%) had engaged in pica; 16 during pregnancy. Commonly eaten items were earth, bean stones, and adobe. In the California group, 5 (22%) had eaten earth; in the Mexican group, 6 (11%) had eaten earth.
Source: Adapted from Moya and Phillips (2014).


![Ascaris HaemoglobinReflectChangesin ... · (STH)Ascaris lumbricoides,Trichuris trichiura,orhookworms[1].AmongtheSTH,infections withA.lumbricoides aremostcommon anditspublichealthimpactis](https://img.pdfslide.us/doc/110x75/5eb5f794eb0ad258fd6c5b0d/ascaris-haemoglobinreflectchangesin-sthascaris-lumbricoidestrichuris-trichiuraorhookworms1amongthesthinfections.jpg)