Embed Size (px)
Citation preview
OR 41/2011
Update and Improvement of Dispersion Calculations for Emissions to Air from
TCM’s Amine Plant Part l-Worst case Nitrosamines and Nitramines
Dag Tønnesen
Scientific report

1
NILU OR 41/2011
Preface
Two different capture technologies will be tested at the CO2 Technology Centre
Mongstad (TCM) - the chilled ammonia based technology developed by Alstom
and the amine based technology developed by Aker Clean Carbon (ACC). The
facility will capture CO2 from two separate flue gas sources: the residue fluid
catalytic cracker (RFCC) and the combined heat and power plant (CHP). The
TCM facility is designed to capture 100.000 tonnes CO2 per year.
NILU ( The Norwegian Institute for Air Research) carried out dispersion
calculation studies for emissions to air from TCM in 2008 and 2010, resulting in
two reports (NILU-OR 12/2008 and NILU-OR 41/2010). Based on the
availability of new knowledge and updated data for emissions to air from the
amine plant, the dispersion calculations have been updated and improved for the
amine plant. For the Chilled ammonia technology plant report NILU-OR 41/2010
still applies.
The current update of emission dispersion calculations is divided in two parts. The
first part, which is documented in the present report, establishes current
knowledge on a worst case study for emissions of nitrosamines and nitramines for
amine capture technology. In a second report, a current knowledge likely case
study will be described in detail.

2
NILU OR 41/2011
3
NILU OR 41/2011
Contents
Page
Preface .................................................................................................................... 1
Summary ................................................................................................................ 5
Sammendrag .......................................................................................................... 7
1 Introduction .................................................................................................... 9
2 Study definitions ........................................................................................... 11 2.1 Emission estimates .................................................................................. 12 2.2 Topography of the area ........................................................................... 12 2.3 Chemical reactions, photolysis and deposition mechanisms .................. 13
2.4 Guideline values for health and environmental impact ........................... 13
3 Unitary inert emission dispersion ............................................................... 13
4 Nitrosamines and nitramines in air ............................................................ 18 4.1 Worst case for nitrosamines .................................................................... 18 4.2 Worst case assumptions and results for nitramines ................................. 22
4.3 Total worst case air concentrations of nitramines and nitrosamines ....... 24 4.4 Likely case............................................................................................... 26
5 Nitrosamines and nitramines in fresh water .............................................. 26 5.1 Worst case estimate ................................................................................. 26 5.2 Likely case estimate ................................................................................ 28
6 Back calculation of total amount of emission for reaching guideline
value ............................................................................................................... 28
7 Discussion ...................................................................................................... 29 7.1 Processes not included in calculations .................................................... 29
7.1.1 Influence of NOX concentration .................................................. 29
7.1.2 Influence of Cl atoms .................................................................. 29 7.1.3 Other reaction products of amines ............................................... 29
7.2 Main uncertainties ................................................................................... 29 7.3 Usefulness of CONCX vs TAPM ........................................................... 30 7.4 Comparison of assumptions between 2008, 2010 and 2011 ................... 31
8 Conclusions and recommendations ............................................................ 32
9 Abbreviations ................................................................................................ 33
10 References ..................................................................................................... 33
Appendix A Setup for TAPM model runs ......................................................... 35
Appendix B Data for wind and precipition in 2007 versus average ............... 41
Appendix C Detailed emission estimate from ACC ......................................... 45

4
NILU OR 41/2011
5
NILU OR 41/2011
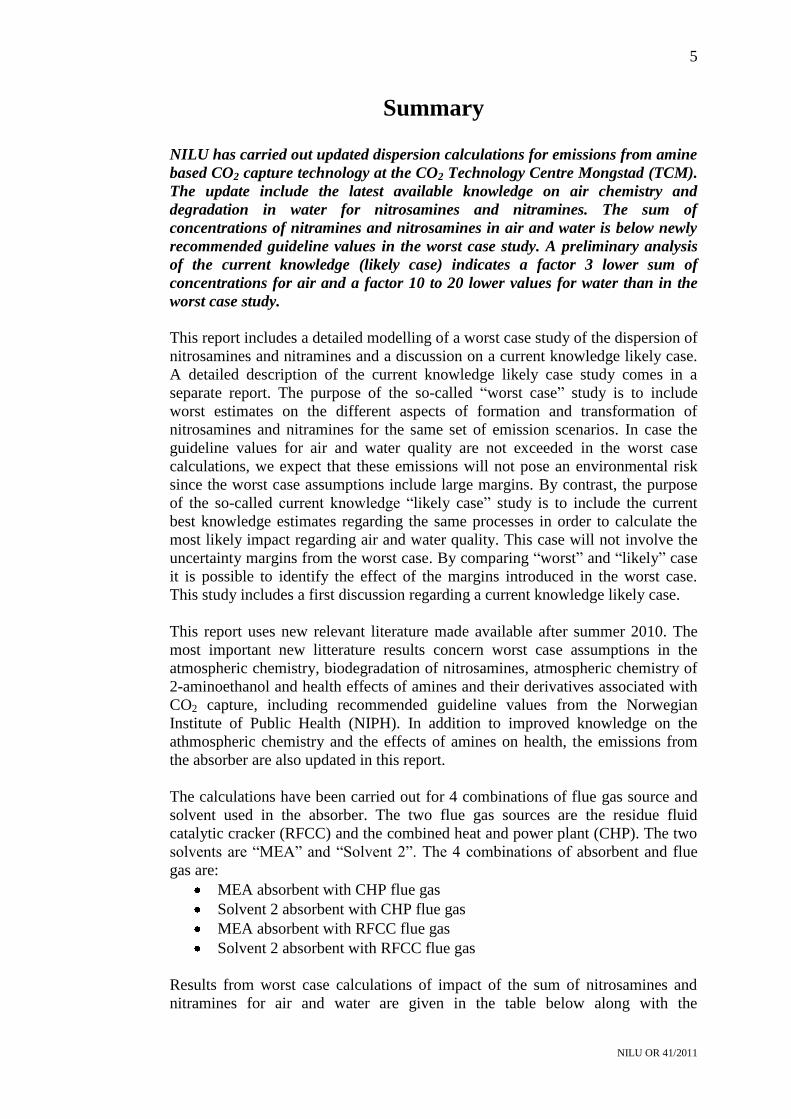
Summary
NILU has carried out updated dispersion calculations for emissions from amine
based CO2 capture technology at the CO2 Technology Centre Mongstad (TCM).
The update include the latest available knowledge on air chemistry and
degradation in water for nitrosamines and nitramines. The sum of
concentrations of nitramines and nitrosamines in air and water is below newly
recommended guideline values in the worst case study. A preliminary analysis
of the current knowledge (likely case) indicates a factor 3 lower sum of
concentrations for air and a factor 10 to 20 lower values for water than in the
worst case study.
This report includes a detailed modelling of a worst case study of the dispersion of
nitrosamines and nitramines and a discussion on a current knowledge likely case.
A detailed description of the current knowledge likely case study comes in a
separate report. The purpose of the so-called “worst case” study is to include
worst estimates on the different aspects of formation and transformation of
nitrosamines and nitramines for the same set of emission scenarios. In case the
guideline values for air and water quality are not exceeded in the worst case
calculations, we expect that these emissions will not pose an environmental risk
since the worst case assumptions include large margins. By contrast, the purpose
of the so-called current knowledge “likely case” study is to include the current
best knowledge estimates regarding the same processes in order to calculate the
most likely impact regarding air and water quality. This case will not involve the
uncertainty margins from the worst case. By comparing “worst” and “likely” case
it is possible to identify the effect of the margins introduced in the worst case.
This study includes a first discussion regarding a current knowledge likely case.
This report uses new relevant literature made available after summer 2010. The
most important new litterature results concern worst case assumptions in the
atmospheric chemistry, biodegradation of nitrosamines, atmospheric chemistry of
2-aminoethanol and health effects of amines and their derivatives associated with
CO2 capture, including recommended guideline values from the Norwegian
Institute of Public Health (NIPH). In addition to improved knowledge on the
athmospheric chemistry and the effects of amines on health, the emissions from
the absorber are also updated in this report.
The calculations have been carried out for 4 combinations of flue gas source and
solvent used in the absorber. The two flue gas sources are the residue fluid
catalytic cracker (RFCC) and the combined heat and power plant (CHP). The two
solvents are “MEA” and “Solvent 2”. The 4 combinations of absorbent and flue
gas are:
MEA absorbent with CHP flue gas
Solvent 2 absorbent with CHP flue gas
MEA absorbent with RFCC flue gas
Solvent 2 absorbent with RFCC flue gas
Results from worst case calculations of impact of the sum of nitrosamines and
nitramines for air and water are given in the table below along with the
6
NILU OR 41/2011
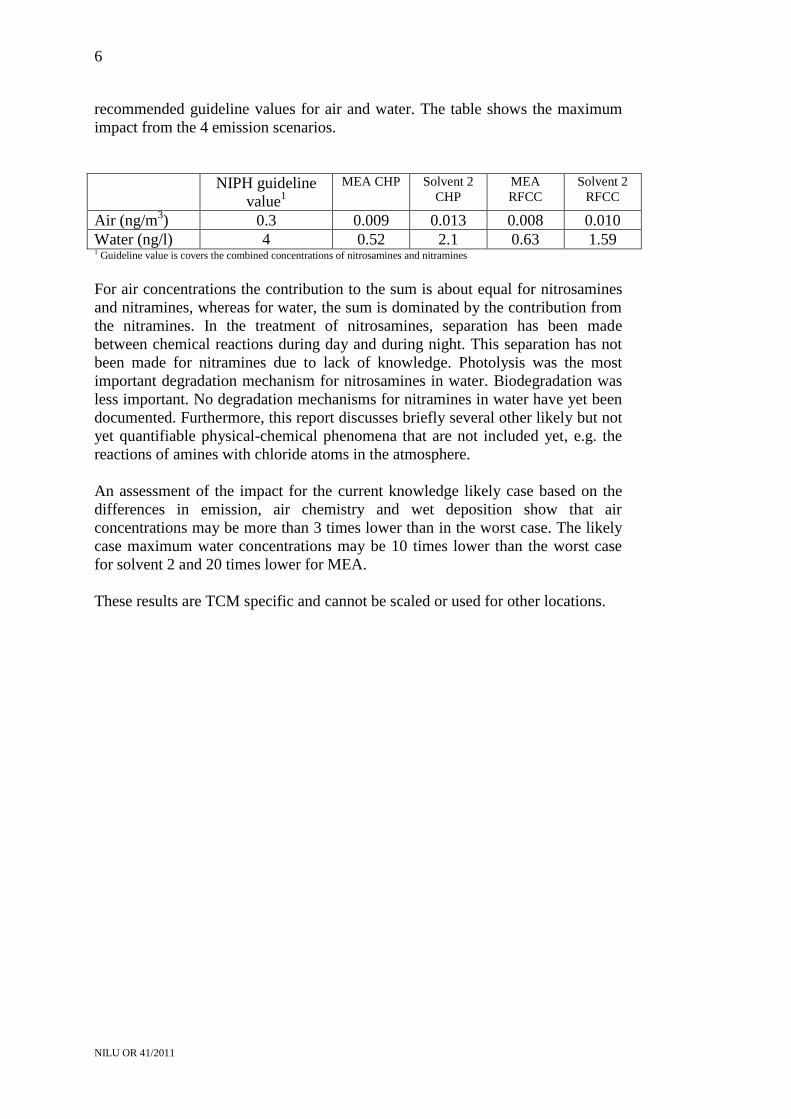
recommended guideline values for air and water. The table shows the maximum
impact from the 4 emission scenarios.
NIPH guideline
value1
MEA CHP Solvent 2
CHP
MEA
RFCC
Solvent 2
RFCC
Air (ng/m3) 0.3 0.009 0.013 0.008 0.010
Water (ng/l) 4 0.52 2.1 0.63 1.59 1 Guideline value is covers the combined concentrations of nitrosamines and nitramines
For air concentrations the contribution to the sum is about equal for nitrosamines
and nitramines, whereas for water, the sum is dominated by the contribution from
the nitramines. In the treatment of nitrosamines, separation has been made
between chemical reactions during day and during night. This separation has not
been made for nitramines due to lack of knowledge. Photolysis was the most
important degradation mechanism for nitrosamines in water. Biodegradation was
less important. No degradation mechanisms for nitramines in water have yet been
documented. Furthermore, this report discusses briefly several other likely but not
yet quantifiable physical-chemical phenomena that are not included yet, e.g. the
reactions of amines with chloride atoms in the atmosphere.
An assessment of the impact for the current knowledge likely case based on the
differences in emission, air chemistry and wet deposition show that air
concentrations may be more than 3 times lower than in the worst case. The likely
case maximum water concentrations may be 10 times lower than the worst case
for solvent 2 and 20 times lower for MEA.
These results are TCM specific and cannot be scaled or used for other locations.
7
NILU OR 41/2011
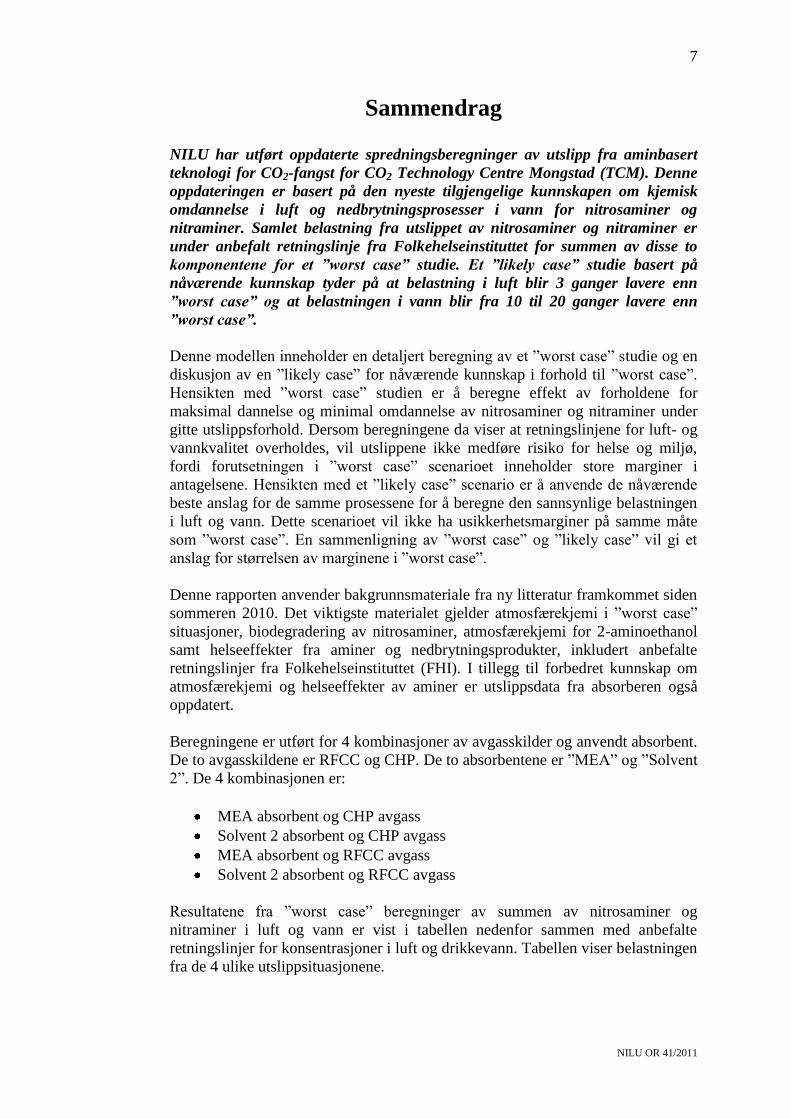
Sammendrag
NILU har utført oppdaterte spredningsberegninger av utslipp fra aminbasert
teknologi for CO2-fangst for CO2 Technology Centre Mongstad (TCM). Denne
oppdateringen er basert på den nyeste tilgjengelige kunnskapen om kjemisk
omdannelse i luft og nedbrytningsprosesser i vann for nitrosaminer og
nitraminer. Samlet belastning fra utslippet av nitrosaminer og nitraminer er
under anbefalt retningslinje fra Folkehelseinstituttet for summen av disse to
komponentene for et ”worst case” studie. Et ”likely case” studie basert på
nåværende kunnskap tyder på at belastning i luft blir 3 ganger lavere enn
”worst case” og at belastningen i vann blir fra 10 til 20 ganger lavere enn
”worst case”.
Denne modellen inneholder en detaljert beregning av et ”worst case” studie og en
diskusjon av en ”likely case” for nåværende kunnskap i forhold til ”worst case”.
Hensikten med ”worst case” studien er å beregne effekt av forholdene for
maksimal dannelse og minimal omdannelse av nitrosaminer og nitraminer under
gitte utslippsforhold. Dersom beregningene da viser at retningslinjene for luft- og
vannkvalitet overholdes, vil utslippene ikke medføre risiko for helse og miljø,
fordi forutsetningen i ”worst case” scenarioet inneholder store marginer i
antagelsene. Hensikten med et ”likely case” scenario er å anvende de nåværende
beste anslag for de samme prosessene for å beregne den sannsynlige belastningen
i luft og vann. Dette scenarioet vil ikke ha usikkerhetsmarginer på samme måte
som ”worst case”. En sammenligning av ”worst case” og ”likely case” vil gi et
anslag for størrelsen av marginene i ”worst case”.
Denne rapporten anvender bakgrunnsmateriale fra ny litteratur framkommet siden
sommeren 2010. Det viktigste materialet gjelder atmosfærekjemi i ”worst case”
situasjoner, biodegradering av nitrosaminer, atmosfærekjemi for 2-aminoethanol
samt helseeffekter fra aminer og nedbrytningsprodukter, inkludert anbefalte
retningslinjer fra Folkehelseinstituttet (FHI). I tillegg til forbedret kunnskap om
atmosfærekjemi og helseeffekter av aminer er utslippsdata fra absorberen også
oppdatert.
Beregningene er utført for 4 kombinasjoner av avgasskilder og anvendt absorbent.
De to avgasskildene er RFCC og CHP. De to absorbentene er ”MEA” og ”Solvent
2”. De 4 kombinasjonen er:
MEA absorbent og CHP avgass
Solvent 2 absorbent og CHP avgass
MEA absorbent og RFCC avgass
Solvent 2 absorbent og RFCC avgass
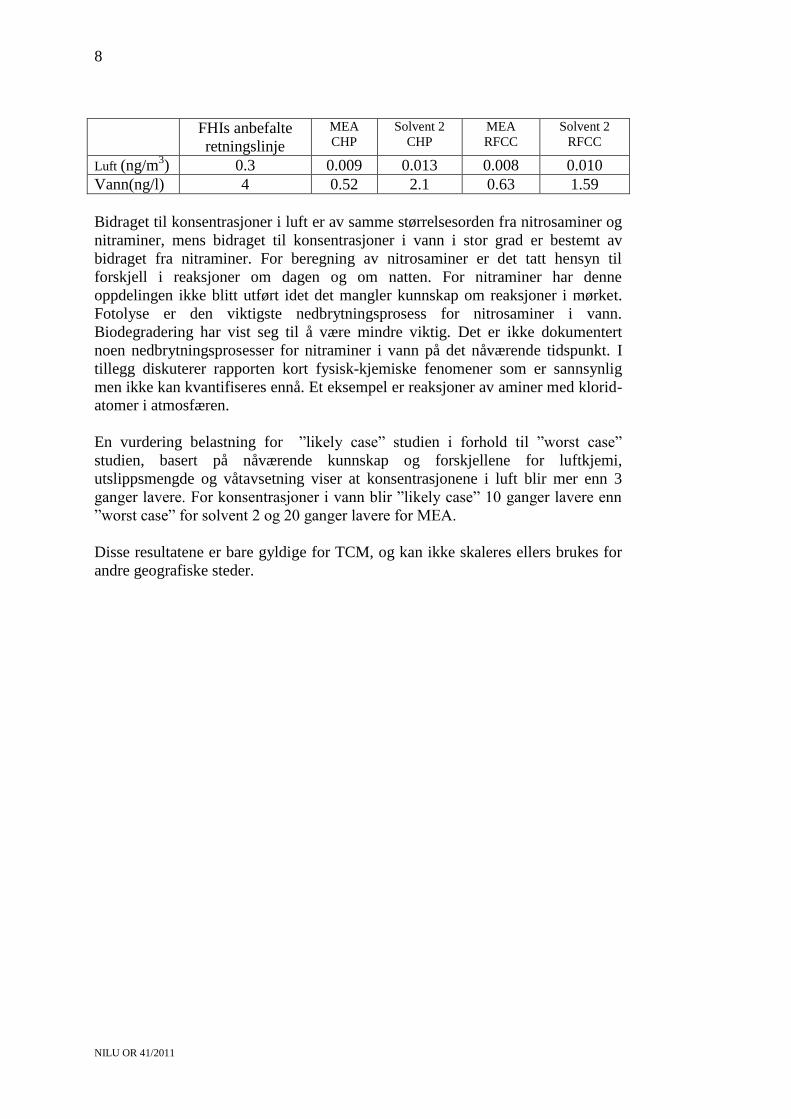
Resultatene fra ”worst case” beregninger av summen av nitrosaminer og
nitraminer i luft og vann er vist i tabellen nedenfor sammen med anbefalte
retningslinjer for konsentrasjoner i luft og drikkevann. Tabellen viser belastningen
fra de 4 ulike utslippsituasjonene.
8
NILU OR 41/2011
FHIs anbefalte
retningslinje
MEA
CHP Solvent 2
CHP MEA
RFCC Solvent 2
RFCC
Luft (ng/m3) 0.3 0.009 0.013 0.008 0.010
Vann(ng/l) 4 0.52 2.1 0.63 1.59
Bidraget til konsentrasjoner i luft er av samme størrelsesorden fra nitrosaminer og
nitraminer, mens bidraget til konsentrasjoner i vann i stor grad er bestemt av
bidraget fra nitraminer. For beregning av nitrosaminer er det tatt hensyn til
forskjell i reaksjoner om dagen og om natten. For nitraminer har denne
oppdelingen ikke blitt utført idet det mangler kunnskap om reaksjoner i mørket.
Fotolyse er den viktigste nedbrytningsprosess for nitrosaminer i vann.
Biodegradering har vist seg til å være mindre viktig. Det er ikke dokumentert
noen nedbrytningsprosesser for nitraminer i vann på det nåværende tidspunkt. I
tillegg diskuterer rapporten kort fysisk-kjemiske fenomener som er sannsynlig
men ikke kan kvantifiseres ennå. Et eksempel er reaksjoner av aminer med klorid-
atomer i atmosfæren.
En vurdering belastning for ”likely case” studien i forhold til ”worst case”
studien, basert på nåværende kunnskap og forskjellene for luftkjemi,
utslippsmengde og våtavsetning viser at konsentrasjonene i luft blir mer enn 3
ganger lavere. For konsentrasjoner i vann blir ”likely case” 10 ganger lavere enn
”worst case” for solvent 2 og 20 ganger lavere for MEA.
Disse resultatene er bare gyldige for TCM, og kan ikke skaleres ellers brukes for
andre geografiske steder.
9
NILU OR 41/2011
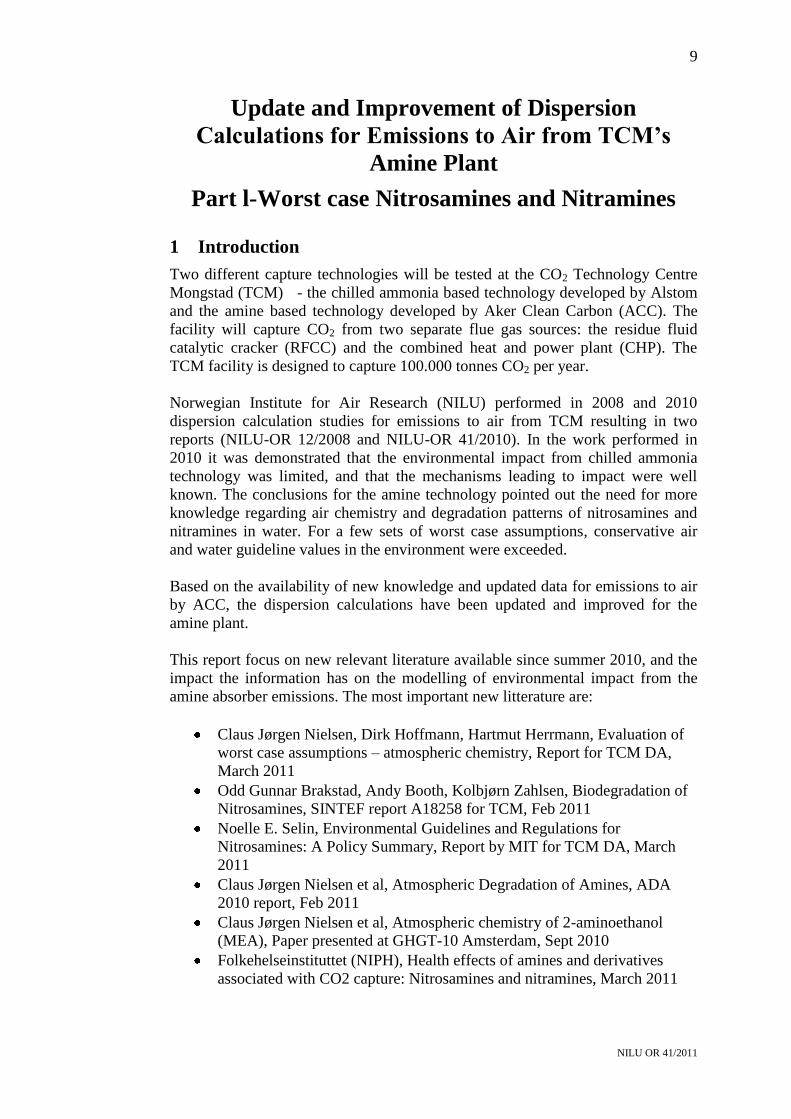
Update and Improvement of Dispersion
Calculations for Emissions to Air from TCM’s
Amine Plant
Part l-Worst case Nitrosamines and Nitramines
1 Introduction
Two different capture technologies will be tested at the CO2 Technology Centre
Mongstad (TCM) - the chilled ammonia based technology developed by Alstom
and the amine based technology developed by Aker Clean Carbon (ACC). The
facility will capture CO2 from two separate flue gas sources: the residue fluid
catalytic cracker (RFCC) and the combined heat and power plant (CHP). The
TCM facility is designed to capture 100.000 tonnes CO2 per year.
Norwegian Institute for Air Research (NILU) performed in 2008 and 2010
dispersion calculation studies for emissions to air from TCM resulting in two
reports (NILU-OR 12/2008 and NILU-OR 41/2010). In the work performed in
2010 it was demonstrated that the environmental impact from chilled ammonia
technology was limited, and that the mechanisms leading to impact were well
known. The conclusions for the amine technology pointed out the need for more
knowledge regarding air chemistry and degradation patterns of nitrosamines and
nitramines in water. For a few sets of worst case assumptions, conservative air
and water guideline values in the environment were exceeded.
Based on the availability of new knowledge and updated data for emissions to air
by ACC, the dispersion calculations have been updated and improved for the
amine plant.
This report focus on new relevant literature available since summer 2010, and the
impact the information has on the modelling of environmental impact from the
amine absorber emissions. The most important new litterature are:
Claus Jørgen Nielsen, Dirk Hoffmann, Hartmut Herrmann, Evaluation of
worst case assumptions – atmospheric chemistry, Report for TCM DA,
March 2011
Odd Gunnar Brakstad, Andy Booth, Kolbjørn Zahlsen, Biodegradation of
Nitrosamines, SINTEF report A18258 for TCM, Feb 2011
Noelle E. Selin, Environmental Guidelines and Regulations for
Nitrosamines: A Policy Summary, Report by MIT for TCM DA, March
2011
Claus Jørgen Nielsen et al, Atmospheric Degradation of Amines, ADA
2010 report, Feb 2011
Claus Jørgen Nielsen et al, Atmospheric chemistry of 2-aminoethanol
(MEA), Paper presented at GHGT-10 Amsterdam, Sept 2010
Folkehelseinstituttet (NIPH), Health effects of amines and derivatives
associated with CO2 capture: Nitrosamines and nitramines, March 2011
10
NILU OR 41/2011
Matthias Karl, Richard F. Wright, Tore F. Berglen, Bruce Denby, Worst
case scenario study to assess the environmental impact of amine emissions
from a CO2 capture plant, International Journal of Greenhouse Gas
Control, In Press, Corrected Proof, Available online 26 November 2010
latest version of “Environmental budget” from ACC, April 2011
Athmospheric Amines. Part I. A review. (Ge et. Al,2011)
The emission scenarios in this report cover the use of two different solvents in the
absorber (MEA and Solvent 2) and the use of two different flue gas sources to be
treated (CHP and RFCC). TCM has provided updated emission data and
information for the definition of two different studies, worst case and likely case.
The purpose of a so-called worst case study is to include worst estimates on the
different aspects of formation and transformation of nitrosamines and nitramines.
In case the guideline values for air and water quality are not exceeded the
emissions do very likely not pose a risk since the worst case assumptions include
large margins. In case the health and environmental guideline values are exceeded
no conclusion can be made other than there is a need for more knowledge.
The purpose of a so-called likely case study is to include the current best estimates
regarding the same processes in order to calculate the most likely impact
regarding air and water quality. This case will not have the margins from the
worst case. By comparing worst and likely case one can get an idea the effect of
the margins introduced in the worst case. This study will include the first attempt
to do such a likeley case since the new knowledge seems to have obtained a good
enough quality in the spring of 2011. NILU-OR 12/2008 and NILU-OR 41/2010
did not include such a likely case, only worst cases.
In NILU-OR 12/2008, the only amine included in the emission inventory was
MEA. No transformation was considered. Yearly average concentrations and wet
depositions were calculated based on on-site measurements of wind frequencies
and precipitation.
In NILU-OR 41/2010, an improved dispersion model (TAPM) was applied,
giving a much better description of the impact from the topography on the wind
field and precipitation field although the model overestimates the precipitation
amount (M. Karl et al, 2011). Due to updated emission inventories with the
introduction of several new amines, and also direct emissions of nitrosamines, a
very conservative calculation of nitrosamine total impact was made. The
calculations contained no degradation of nitrosamines, and an instant formation
assumption. Nitramines were not included yet since very little was known and
they seemed to be less carcinogenic than nitrosamines.
The 2011 modelling updates the 2010 modelling results by including primary
limiting factors towards formation as well as degradation rates of nitrosamines
and nitramines. Some of the background material for these processes is
summarized by Nielsen, Hoffmann and Hermann (2011). Time dependant
calculations with ambient air characteristics from Mongstad based on existing
monitoring results for wind conditions and concentrations of NOX have been run
separately, and the results is linked to the dispersion model results by the
11
NILU OR 41/2011
advection air speed from the emission to the areas of maximum ground level
impact and maximum yearly wet deposition.
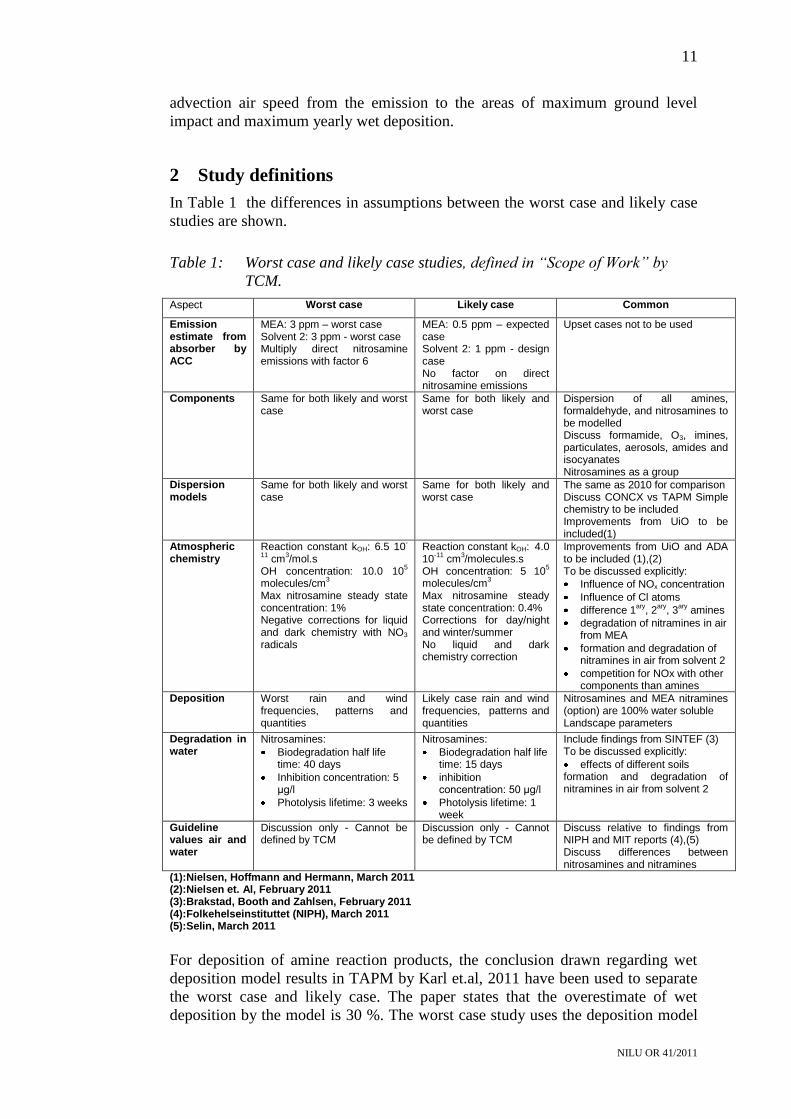
2 Study definitions
In Table 1 the differences in assumptions between the worst case and likely case
studies are shown.
Table 1: Worst case and likely case studies, defined in “Scope of Work” by
TCM.
Aspect Worst case Likely case Common
Emission estimate from absorber by ACC
MEA: 3 ppm – worst case Solvent 2: 3 ppm - worst case Multiply direct nitrosamine emissions with factor 6
MEA: 0.5 ppm – expected case Solvent 2: 1 ppm - design case No factor on direct nitrosamine emissions
Upset cases not to be used
Components Same for both likely and worst case
Same for both likely and worst case
Dispersion of all amines, formaldehyde, and nitrosamines to be modelled Discuss formamide, O3, imines, particulates, aerosols, amides and isocyanates Nitrosamines as a group
Dispersion models
Same for both likely and worst case
Same for both likely and worst case
The same as 2010 for comparison Discuss CONCX vs TAPM Simple chemistry to be included Improvements from UiO to be included(1)
Atmospheric chemistry
Reaction constant kOH: 6.5 10-
11 cm
3/mol.s
OH concentration: 10.0 105
molecules/cm3
Max nitrosamine steady state concentration: 1% Negative corrections for liquid and dark chemistry with NO3 radicals
Reaction constant kOH: 4.0 10
-11 cm
3/molecules.s
OH concentration: 5 105
molecules/cm3
Max nitrosamine steady state concentration: 0.4% Corrections for day/night and winter/summer No liquid and dark chemistry correction
Improvements from UiO and ADA to be included (1),(2) To be discussed explicitly:
Influence of NOx concentration
Influence of Cl atoms
difference 1ary
, 2ary
, 3ary
amines
degradation of nitramines in air from MEA
formation and degradation of nitramines in air from solvent 2
competition for NOx with other components than amines
Deposition Worst rain and wind frequencies, patterns and quantities
Likely case rain and wind frequencies, patterns and quantities
Nitrosamines and MEA nitramines (option) are 100% water soluble Landscape parameters
Degradation in water
Nitrosamines:
Biodegradation half life time: 40 days
Inhibition concentration: 5 μg/l
Photolysis lifetime: 3 weeks
Nitrosamines:
Biodegradation half life time: 15 days
inhibition concentration: 50 μg/l
Photolysis lifetime: 1 week
Include findings from SINTEF (3) To be discussed explicitly:
effects of different soils formation and degradation of nitramines in air from solvent 2
Guideline values air and water
Discussion only - Cannot be defined by TCM
Discussion only - Cannot be defined by TCM
Discuss relative to findings from NIPH and MIT reports (4),(5) Discuss differences between nitrosamines and nitramines
(1):Nielsen, Hoffmann and Hermann, March 2011 (2):Nielsen et. Al, February 2011 (3):Brakstad, Booth and Zahlsen, February 2011 (4):Folkehelseinstituttet (NIPH), March 2011 (5):Selin, March 2011
For deposition of amine reaction products, the conclusion drawn regarding wet
deposition model results in TAPM by Karl et.al, 2011 have been used to separate
the worst case and likely case. The paper states that the overestimate of wet
deposition by the model is 30 %. The worst case study uses the deposition model
12
NILU OR 41/2011
results without any adjustment. The likely case takes the overestimate into
account by reducing the wet deposition by 30 %. By this approach, the wet
deposition for the worst case study represent cases with yearly precipitation of
more than 1.5 times the average yearly precipitation in western Norway.
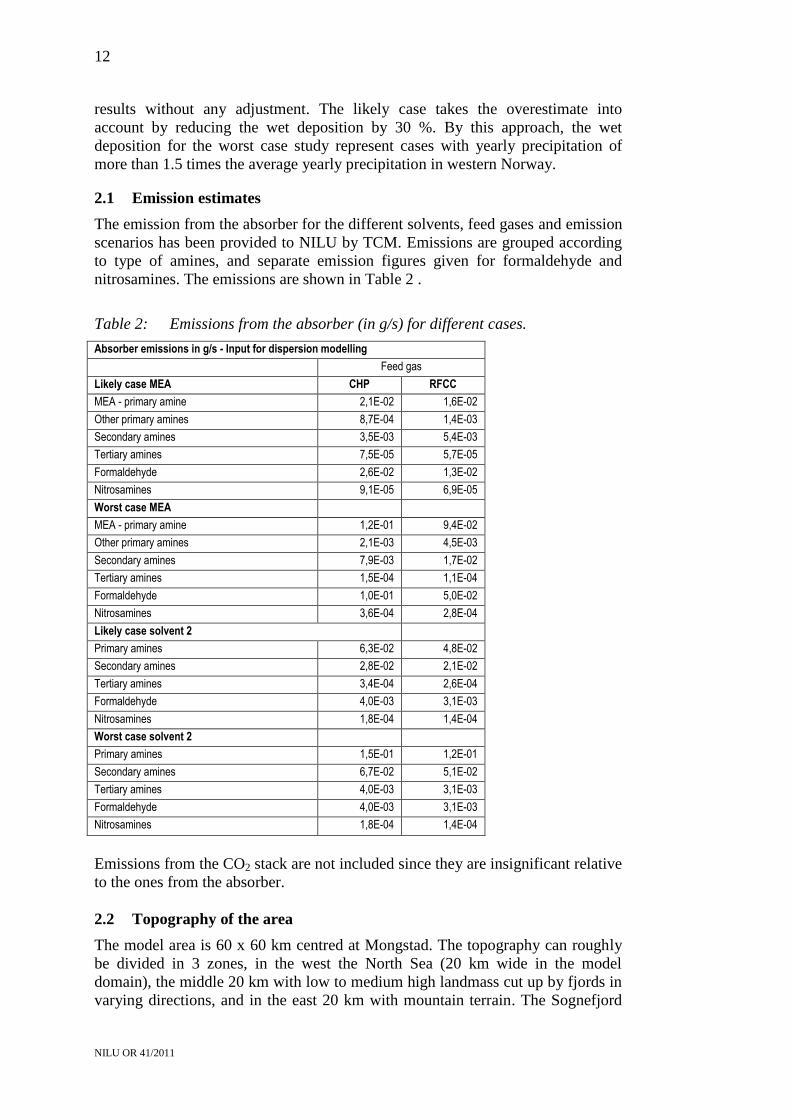
2.1 Emission estimates
The emission from the absorber for the different solvents, feed gases and emission
scenarios has been provided to NILU by TCM. Emissions are grouped according
to type of amines, and separate emission figures given for formaldehyde and
nitrosamines. The emissions are shown in Table 2 .
Table 2: Emissions from the absorber (in g/s) for different cases.
Absorber emissions in g/s - Input for dispersion modelling
Feed gas
Likely case MEA CHP RFCC
MEA - primary amine 2,1E-02 1,6E-02
Other primary amines 8,7E-04 1,4E-03
Secondary amines 3,5E-03 5,4E-03
Tertiary amines 7,5E-05 5,7E-05
Formaldehyde 2,6E-02 1,3E-02
Nitrosamines 9,1E-05 6,9E-05
Worst case MEA
MEA - primary amine 1,2E-01 9,4E-02
Other primary amines 2,1E-03 4,5E-03
Secondary amines 7,9E-03 1,7E-02
Tertiary amines 1,5E-04 1,1E-04
Formaldehyde 1,0E-01 5,0E-02
Nitrosamines 3,6E-04 2,8E-04
Likely case solvent 2
Primary amines 6,3E-02 4,8E-02
Secondary amines 2,8E-02 2,1E-02
Tertiary amines 3,4E-04 2,6E-04
Formaldehyde 4,0E-03 3,1E-03
Nitrosamines 1,8E-04 1,4E-04
Worst case solvent 2
Primary amines 1,5E-01 1,2E-01
Secondary amines 6,7E-02 5,1E-02
Tertiary amines 4,0E-03 3,1E-03
Formaldehyde 4,0E-03 3,1E-03
Nitrosamines 1,8E-04 1,4E-04
Emissions from the CO2 stack are not included since they are insignificant relative
to the ones from the absorber.
2.2 Topography of the area
The model area is 60 x 60 km centred at Mongstad. The topography can roughly
be divided in 3 zones, in the west the North Sea (20 km wide in the model
domain), the middle 20 km with low to medium high landmass cut up by fjords in
varying directions, and in the east 20 km with mountain terrain. The Sognefjord
13
NILU OR 41/2011
cut through the two latter features from west to east in the northern part of the
model domain. In the vicinity of Mongstad, the dominant terrain features are
Fensfjorden-Austfjorden which runs roughly from southeast to northwest
immediately north of Mongstad, with steeper terrain and higher hills / mountains
on the north side than the south side. At Lindås and Radøy south of Mongstad the
hills and ridges all run in a southeast to northwest direction. The closest
population centres are Lindås, Austrheim and Leirvåg. The northern suburbs of
Bergen are located on the south edge of the model domain. The two catchment
areas of Nordgulelva and Dingja, are located in the northeast part of the model
area.
2.3 Chemical reactions, photolysis and deposition mechanisms
The most important overall assumptions are:
Secondary and tertiary amines form nitrosamines in the atmosphere with
NOX through OH-radicals and NO3 radicals.
Primary amines do not form nitrosamines in the atmosphere with NOX
All amines form nitramines in the atmosphere with NOX
2.4 Guideline values for health and environmental impact
The Norwegian Institute for Public Health (NIHP) has recently published a report
proposing guideline values for the combined total of nitrosamines and nitramines
in air and water (Låg et al. 2011). The proposed guideline values are for long time
exposure:
0.3 ng/m3 in air
4 ng/l in drinking water
These values are recommendations and are not yet endorsed by the Norwegian
authorities. Selin, March 2011, list the same existing regulations and experimental
data as is given in the NIHP report. Regarding differences between nitrosamines
and nitramines, NIHP conclude that as groups, nitrosamines have higher
carcinogenic potential than nitramines. Applying the guideline as a value for the
sum of both groups will increase the level of safety. For the other components in
the emission inventory, no revision of guideline values has taken place since the
previous report.
3 Unitary inert emission dispersion
The dispersion model and dispersion conditions have not been changed since the
previous update (Berglen et. al, 2010). This provides a reliable basis for
comparison of the new results presented here with those previously presented. The
meteorological input to the dispersion model is thus the year of 2007. Model setup
files for TAPM are shown in Appendix A. From January to November 2007,
monitoring of meteorological parameters and air quality was carried out at
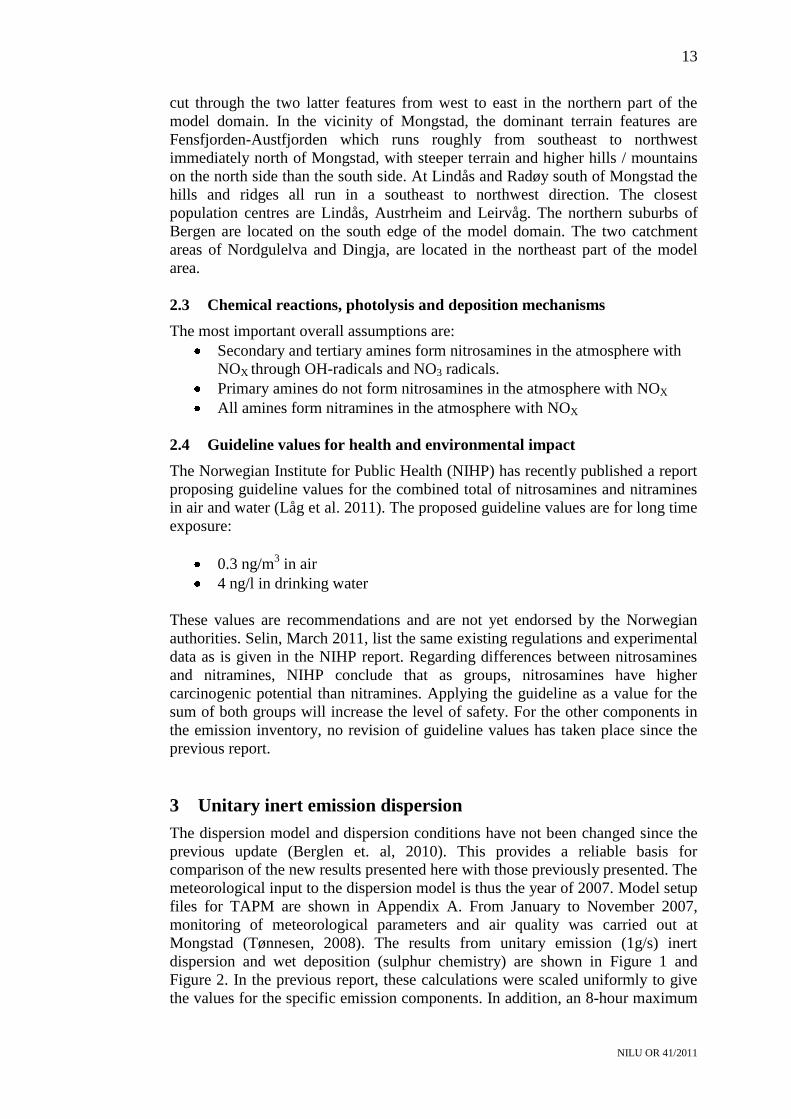
Mongstad (Tønnesen, 2008). The results from unitary emission (1g/s) inert
dispersion and wet deposition (sulphur chemistry) are shown in Figure 1 and
Figure 2. In the previous report, these calculations were scaled uniformly to give
the values for the specific emission components. In addition, an 8-hour maximum
14
NILU OR 41/2011
value, corresponding to the time span for air quality limit values for working
conditions, was extracted from the model runs, resulting in a value of 2.4 µg/m3
for a unitary emission calculated by TAPM (RFC case).
Figure 1: Yearly average concentrations (µg/m3) from a unitary inert emission
of 1 g/s from the TCM absorber (CHP case). Maximum ground level
impact is 0.03 µg/m3.
15
NILU OR 41/2011
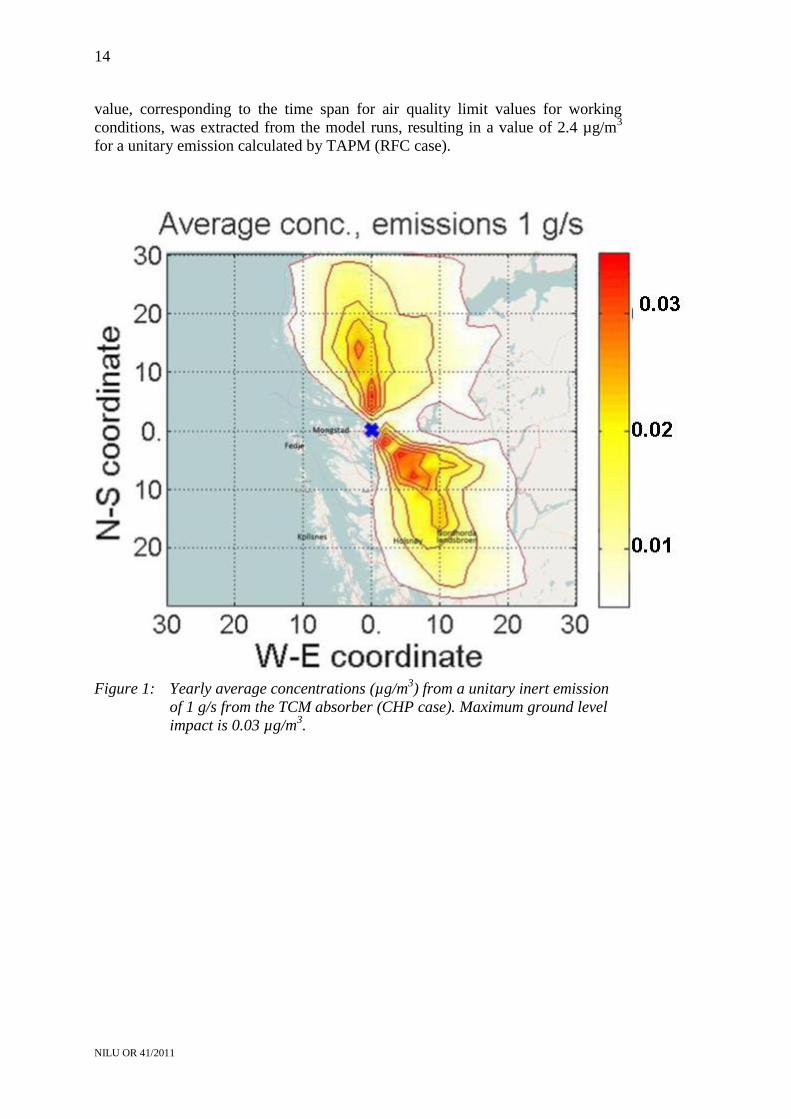
Figure 2: Yearly wet deposition (mg/m2/yr) from a unitary emission of 1 g/s
through the TCM absorber (CHP-case), applying sulphur chemistry.
Maximum deposition 39 mg/m2/yr.
The results from the unitary inert dispersion modelling have been used to provide
the background for calculation of formation and degradation of the reaction
products of nitramines and nitrosamines. From the TAPM model, we have
extracted the dilution of air along the pathways from the emission to the edge of
the model area along the two paths with minimum dispersion. The paths with
minimum dispersion are defined by the location of maximum ground level
concentration at increasing distance from the emissions. The pathways are shown
in Figure 3.
16
NILU OR 41/2011
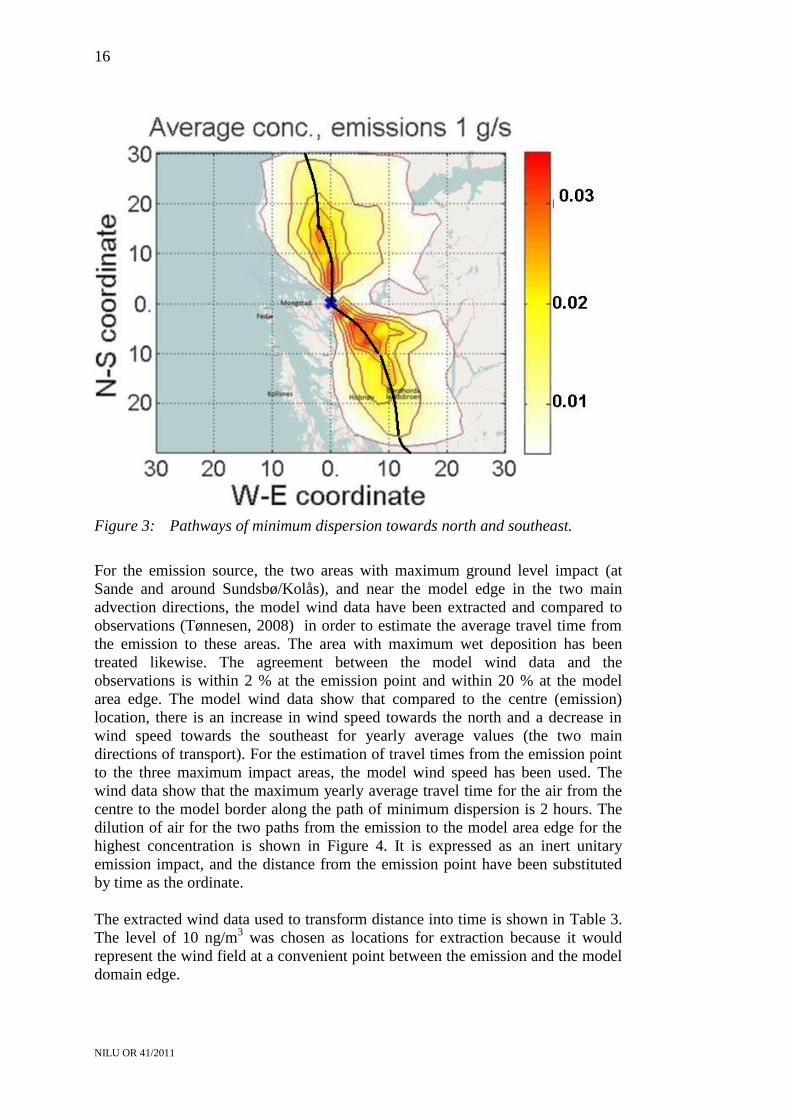
Figure 3: Pathways of minimum dispersion towards north and southeast.
For the emission source, the two areas with maximum ground level impact (at
Sande and around Sundsbø/Kolås), and near the model edge in the two main
advection directions, the model wind data have been extracted and compared to
observations (Tønnesen, 2008) in order to estimate the average travel time from
the emission to these areas. The area with maximum wet deposition has been
treated likewise. The agreement between the model wind data and the
observations is within 2 % at the emission point and within 20 % at the model
area edge. The model wind data show that compared to the centre (emission)
location, there is an increase in wind speed towards the north and a decrease in
wind speed towards the southeast for yearly average values (the two main
directions of transport). For the estimation of travel times from the emission point
to the three maximum impact areas, the model wind speed has been used. The
wind data show that the maximum yearly average travel time for the air from the
centre to the model border along the path of minimum dispersion is 2 hours. The
dilution of air for the two paths from the emission to the model area edge for the
highest concentration is shown in Figure 4. It is expressed as an inert unitary
emission impact, and the distance from the emission point have been substituted
by time as the ordinate.
The extracted wind data used to transform distance into time is shown in Table 3.
The level of 10 ng/m3 was chosen as locations for extraction because it would
represent the wind field at a convenient point between the emission and the model
domain edge.
17
NILU OR 41/2011
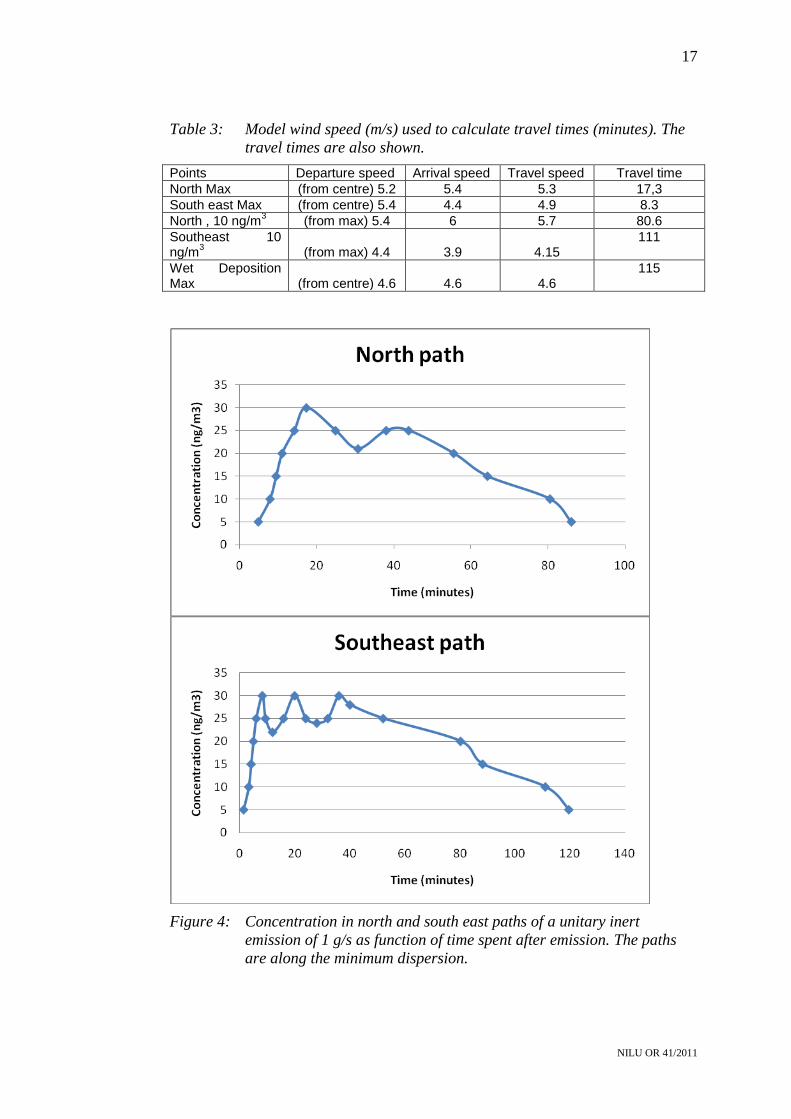
Table 3: Model wind speed (m/s) used to calculate travel times (minutes). The
travel times are also shown.
Points Departure speed Arrival speed Travel speed Travel time
North Max (from centre) 5.2 5.4 5.3 17,3
South east Max (from centre) 5.4 4.4 4.9 8.3
North , 10 ng/m3 (from max) 5.4 6 5.7 80.6
Southeast 10 ng/m
3 (from max) 4.4 3.9 4.15
111
Wet Deposition Max (from centre) 4.6 4.6 4.6
115
Figure 4: Concentration in north and south east paths of a unitary inert
emission of 1 g/s as function of time spent after emission. The paths
are along the minimum dispersion.
18
NILU OR 41/2011
Due to variations in the dispersion over the year, the concentration does not
change uniformly with time. These average yearly concentrations as a function of
time from the emission point enables the use of simplified chemical reactions to
quantify formation and degradation of the emitted amines (and the emitted
nitrosamines).
4 Nitrosamines and nitramines in air
Based on the evaluation of worst case assumptions for atmospheric chemistry
(Nielsen, Hoffmann and Hermann, 2011), the ADA 2010 report (Atmospheric
degradation of amines (ADA) Summary Report: Photo-Oxidation of
Methylamine, Dimethylamine and Trimethylamine CLIMIT project no. 201604.),
and the worst case and likely case definitions in the scope of work, impact of
nitrosamines and nitramines have been calculated as a function of elapsed time
since the emission into the air from the absorber.
4.1 Worst case for nitrosamines
The ADA 2010 report clearly recommends the use of steady state calculations for
nitrosamines in air, with a maximum concentration of 1 % of the concentration of
amines with potential of forming nitrosamines. However, because of the
combination of model area size and wind speed, the average time needed for air
passing the emission point to exit the model area is less than 2 hours. The time
spent by the moving air from the emission to the maximum ground level impact
area is even shorter, approximately 40 minutes, so no steady state will have been
established in the model area. The yield for nitrosamine as a reaction product from
the OH reaction is not specified in the ADA 2010 report. However, the yields of
the other OH reaction products sum up to 98 %. These calculations are based
upon an assumption that the remaining 2% of the reaction products are
nitrosamines.
The degradation and formation of nitrosamines will be distinctly different for
night conditions and day conditions. During the day, reaction by amines with the
OH radical will form nitrosamines from the secondary and tertiary amines, while
photolysis will destroy nitrosamines. Should there be water droplets present in the
air, they can act as a delaying function for both processes, but this process will be
of minor importance (Nielsen, Hoffmann and Herrmann, 2011). During night,
there will be no (yet known) degradation of nitrosamines, and the amines can
react to nitrosamines by the NO3 radical. For a yearly average value, the duration
of night-time and day-time conditions will be equal.
The Eurotrac TOR program (Dubois et al., 1997) contains quantification of NO3
concentrations. For clean marine air, the level before sunrise is given as 10 ppt.
In Ge et al. (2010), reaction constants for NO3 towards trimetyhlamine and two
amides are given, the constants range from 5 x 10-16
to 5 x 10-14
. Comparing the
reaction constants and the concentration levels of OH and NO3 indicate that the
NO3 reaction would be at least 10 times less efficient in forming nitrosamines
than the OH reaction. In the worst case calculations, a formation of nitrosamines
by NO3 during night has been set arbitrarily at 1/5 of the formation by OH during
day.
19
NILU OR 41/2011
In Table 4 the treatment of the emissions during day and night for the purpose of
calculating worst case impact of nitrosamines are shown. The applied reaction
constant and OH concentration during day is shown in Table 1.
Table 4: Treatment of emissions during day and night conditions for worst case
yearly average impact of nitrosamines.
Emission group Day Night
Primary amines (incl. MEA) No contribution to
nitrosamines
No contribution to
nitrosamines
Secondary and tertiary amines Formation by OH-reaction,
no photolysis reduction of
those formed
Formation by NO3
reaction at 1/5 of OH
formation rate
Nitrosamines Reduced by photolysis, at
average equinox conditions
No reduction
After calculation of the time dependent conversions for day and night conditions,
the two conditions have been averaged. The calculations have been made with the
emission rates as basis, this gives the fraction of the primary emissions that have
transformed from amines to nitrosamines, and the fraction of nitrosamines that
remain as nitrosamines as a function of time since the emission.
Two known effects have been omitted from these calculations, in order to
simplify the calculation and because the concentration level at the initial plume
height is unknown:
1. The reactions with OH will not start immediately after emissions due to
the presence of NO in the plume after release. Approximately 2 to 4
minutes will pass before the NO is oxidized to NO2 and no OH would be
present in the plume until that has happened.
2. The nitrosamines formed by OH reaction during day will immediately start
to be reduced by photolysis at the same rate of reduction as the primary
emission of nitrosamines.
Both of these effects would reduce the calculated impact of nitrosamines.
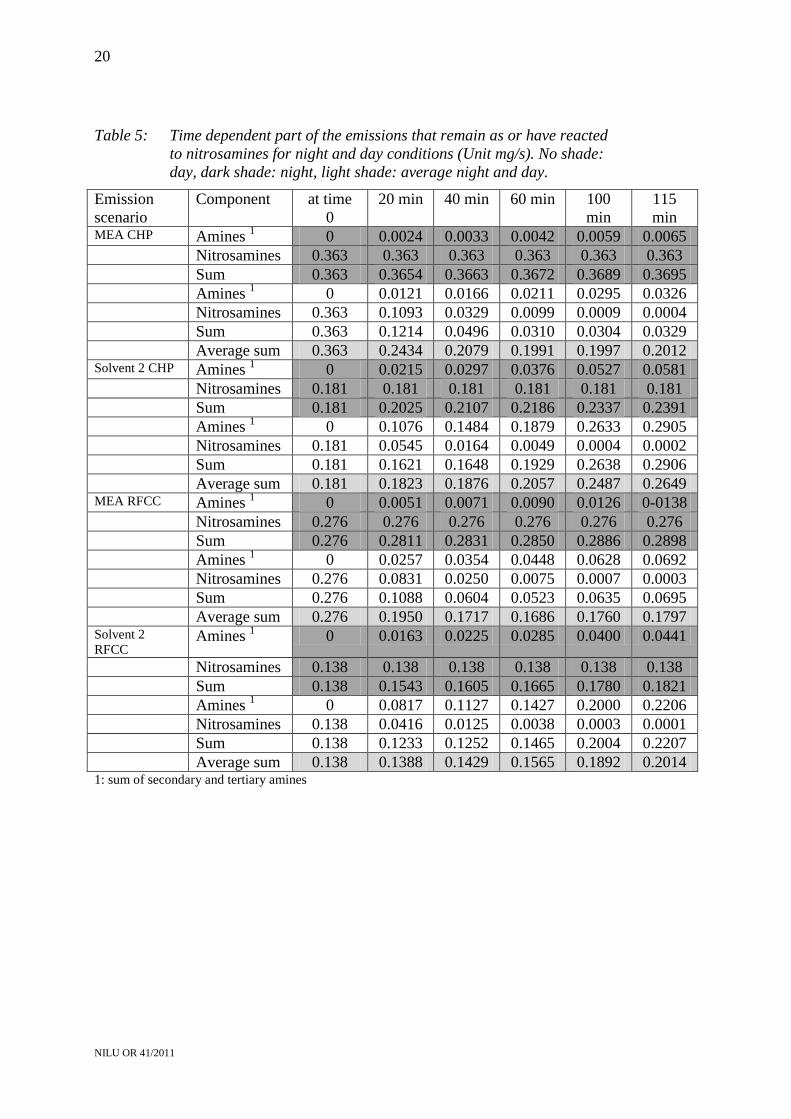
The results of the calculations of transformation and reduction are shown in Table
5 in the unit mg/s, and Figure 5 as the average percentage nitrosamines of the total
emission of secondary and tertiary amines and nitrosamines. Note that the
percentage of nitrosamines for the two flue gases with solvent 2 is nearly
identical.
From Table 5 it can be seen that the most important contribution to the total
average comes from the nitrosamines directly emitted during the night.
20
NILU OR 41/2011
Table 5: Time dependent part of the emissions that remain as or have reacted
to nitrosamines for night and day conditions (Unit mg/s). No shade:
day, dark shade: night, light shade: average night and day.
Emission
scenario
Component at time
0
20 min 40 min 60 min 100
min
115
min MEA CHP Amines
1 0 0.0024 0.0033 0.0042 0.0059 0.0065
Nitrosamines 0.363 0.363 0.363 0.363 0.363 0.363 Sum 0.363 0.3654 0.3663 0.3672 0.3689 0.3695 Amines
1 0 0.0121 0.0166 0.0211 0.0295 0.0326
Nitrosamines 0.363 0.1093 0.0329 0.0099 0.0009 0.0004 Sum 0.363 0.1214 0.0496 0.0310 0.0304 0.0329 Average sum 0.363 0.2434 0.2079 0.1991 0.1997 0.2012 Solvent 2 CHP Amines
1 0 0.0215 0.0297 0.0376 0.0527 0.0581
Nitrosamines 0.181 0.181 0.181 0.181 0.181 0.181 Sum 0.181 0.2025 0.2107 0.2186 0.2337 0.2391 Amines
1 0 0.1076 0.1484 0.1879 0.2633 0.2905
Nitrosamines 0.181 0.0545 0.0164 0.0049 0.0004 0.0002 Sum 0.181 0.1621 0.1648 0.1929 0.2638 0.2906 Average sum 0.181 0.1823 0.1876 0.2057 0.2487 0.2649 MEA RFCC Amines
1 0 0.0051 0.0071 0.0090 0.0126 0-0138
Nitrosamines 0.276 0.276 0.276 0.276 0.276 0.276 Sum 0.276 0.2811 0.2831 0.2850 0.2886 0.2898 Amines
1 0 0.0257 0.0354 0.0448 0.0628 0.0692
Nitrosamines 0.276 0.0831 0.0250 0.0075 0.0007 0.0003 Sum 0.276 0.1088 0.0604 0.0523 0.0635 0.0695 Average sum 0.276 0.1950 0.1717 0.1686 0.1760 0.1797 Solvent 2
RFCC Amines
1 0 0.0163 0.0225 0.0285 0.0400 0.0441
Nitrosamines 0.138 0.138 0.138 0.138 0.138 0.138 Sum 0.138 0.1543 0.1605 0.1665 0.1780 0.1821 Amines
1 0 0.0817 0.1127 0.1427 0.2000 0.2206
Nitrosamines 0.138 0.0416 0.0125 0.0038 0.0003 0.0001 Sum 0.138 0.1233 0.1252 0.1465 0.2004 0.2207 Average sum 0.138 0.1388 0.1429 0.1565 0.1892 0.2014 1: sum of secondary and tertiary amines
21
NILU OR 41/2011
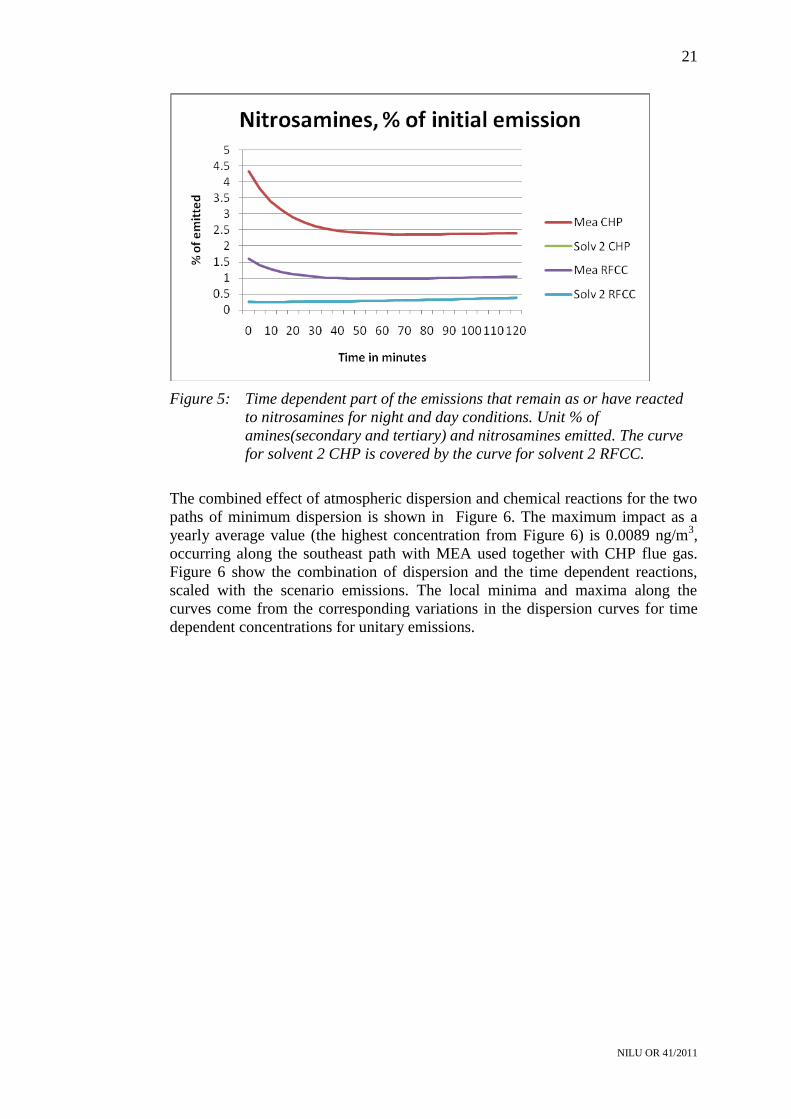
Figure 5: Time dependent part of the emissions that remain as or have reacted
to nitrosamines for night and day conditions. Unit % of
amines(secondary and tertiary) and nitrosamines emitted. The curve
for solvent 2 CHP is covered by the curve for solvent 2 RFCC.
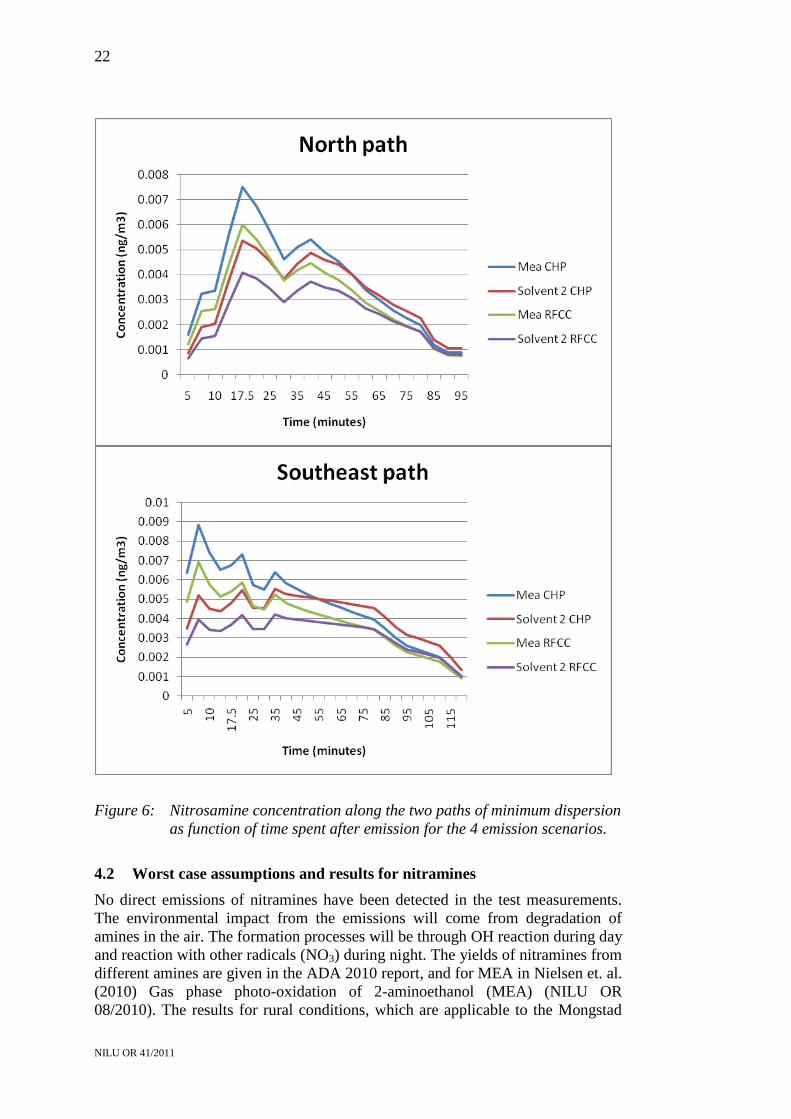
The combined effect of atmospheric dispersion and chemical reactions for the two
paths of minimum dispersion is shown in Figure 6. The maximum impact as a
yearly average value (the highest concentration from Figure 6) is 0.0089 ng/m3,
occurring along the southeast path with MEA used together with CHP flue gas.
Figure 6 show the combination of dispersion and the time dependent reactions,
scaled with the scenario emissions. The local minima and maxima along the
curves come from the corresponding variations in the dispersion curves for time
dependent concentrations for unitary emissions.
22
NILU OR 41/2011
Figure 6: Nitrosamine concentration along the two paths of minimum dispersion
as function of time spent after emission for the 4 emission scenarios.
4.2 Worst case assumptions and results for nitramines
No direct emissions of nitramines have been detected in the test measurements.
The environmental impact from the emissions will come from degradation of
amines in the air. The formation processes will be through OH reaction during day
and reaction with other radicals (NO3) during night. The yields of nitramines from
different amines are given in the ADA 2010 report, and for MEA in Nielsen et. al.
(2010) Gas phase photo-oxidation of 2-aminoethanol (MEA) (NILU OR
08/2010). The results for rural conditions, which are applicable to the Mongstad
23
NILU OR 41/2011
area, are shown in Table 6, together with the emission component group the yields
have been applied for.
Table 6: Estimated yields of nitramines from photo oxidation in the atmosphere
under rural conditions, and emission component groups the yield has
been applied for.
Component Yield Applied to emission
group
MEA Less than 0,3 % MEA
Methylamine Less than 0.4 % Other primary amines
Dimethylamine Less than 2.5 % Secondary amines
Trimethylamine Less than 5 % Tertiary amines
For nitramines there are more groups of components that might cause their
formation, and the yields for the different components vary considerably. In these
calculations, no attempt has been made to separate day reactions and night
reactions, the basic assumption being that the formation during day is higher than
at night. Since no primary emissions of nitramines have been measured, the
separation between day and night conditions is less critical than for nitrosamines.
Thus, applying constant day conditions for formation will not underestimate the
impact. The part of the emission formed to nitramines at different travel times
from the emission point is shown in Table 7 . The calculation is based on the
separate yields given in Table 6. Comparing the nitramine formation to the
nitrosamine formation (and non-reduced emission) in Table 5 show that for the
MEA scenarios, the nitrosamine fraction is larger than the nitramine fraction,
while for the Solvent 2 scenarios the opposite is the case.
Table 7: Nitramine formation from the original emissions, given as mg/s, for
different travel times from the emission.
Scenario Emission 20 min 40 min 60 min 100
min
115
min
MEA CHP 133.21 0.0438 0.0604 0.0756 0.1071 0.1181
Solvent 2
CHP
226.0 0.1886 0.2601 0.3294 0.4616 0.5091
MEA RFCC 115.01 0.0547 0.0755 0.0956 0.1340 0.1477
Solvent 2
RFCC
171.6 0.1433 0.1976 0.2502 0.3506 0.3867
1: Sum of amines including MEA
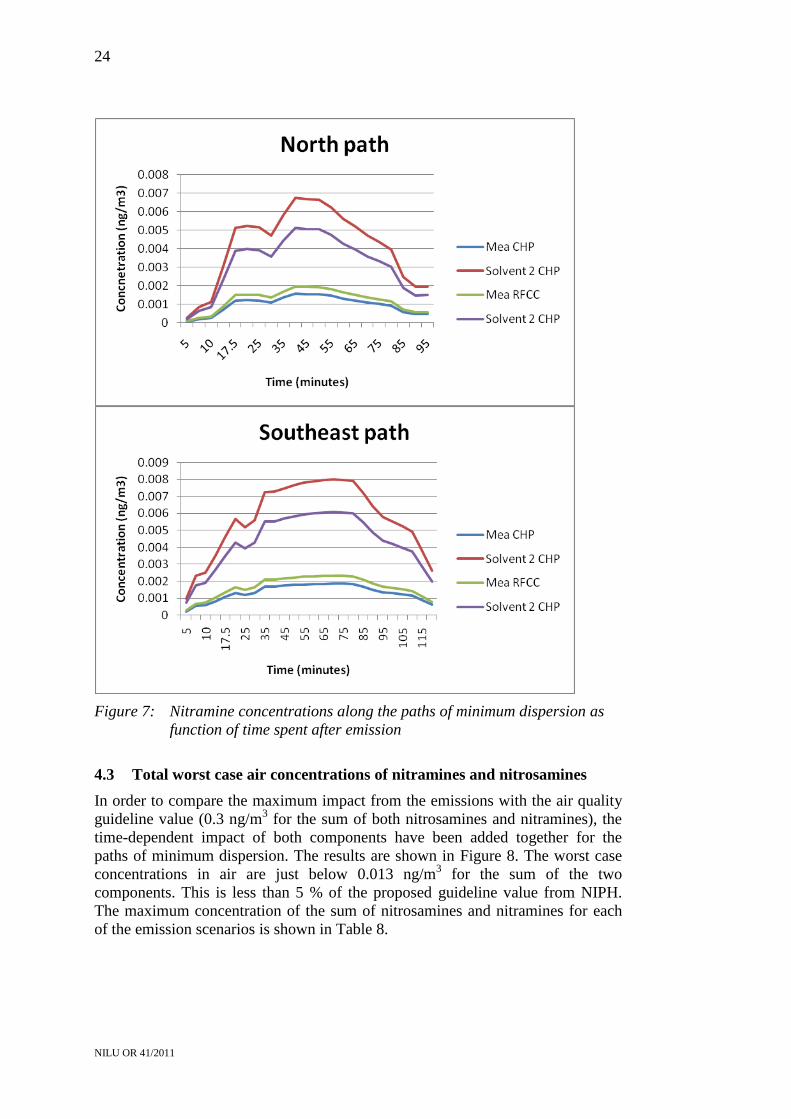
The combination of dispersion and chemistry for the paths of minimum
dispersion, corresponding to those previously shown for nitrosamines, are shown
in Figure 7 . The curves have been made by scaling the unitary emission
concentration by the formation rates in Table 7. Comparing the nitramine
concentrations with the unitary emission concentration show that the gradual
formation has a large impact on the shape of the curve, much larger than for the
nitrosamines, where the component is more dominated by the direct emissions.
The maximum ground level impact for nitramines occurs further from the
absorber for nitramines than it does for nitrosamines.
24
NILU OR 41/2011
Figure 7: Nitramine concentrations along the paths of minimum dispersion as
function of time spent after emission
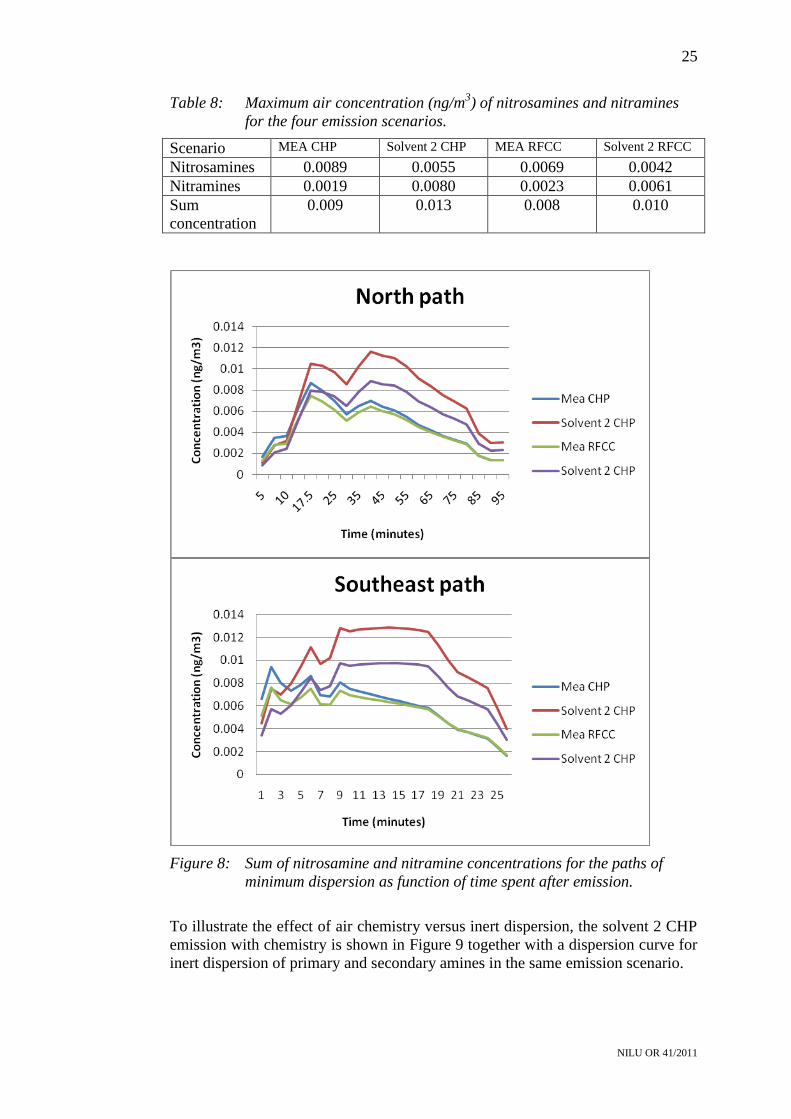
4.3 Total worst case air concentrations of nitramines and nitrosamines
In order to compare the maximum impact from the emissions with the air quality
guideline value (0.3 ng/m3 for the sum of both nitrosamines and nitramines), the
time-dependent impact of both components have been added together for the
paths of minimum dispersion. The results are shown in Figure 8. The worst case
concentrations in air are just below 0.013 ng/m3 for the sum of the two
components. This is less than 5 % of the proposed guideline value from NIPH.
The maximum concentration of the sum of nitrosamines and nitramines for each
of the emission scenarios is shown in Table 8.
25
NILU OR 41/2011
Table 8: Maximum air concentration (ng/m3) of nitrosamines and nitramines
for the four emission scenarios.
Scenario MEA CHP Solvent 2 CHP MEA RFCC Solvent 2 RFCC
Nitrosamines 0.0089 0.0055 0.0069 0.0042
Nitramines 0.0019 0.0080 0.0023 0.0061
Sum
concentration
0.009 0.013 0.008 0.010
Figure 8: Sum of nitrosamine and nitramine concentrations for the paths of
minimum dispersion as function of time spent after emission.
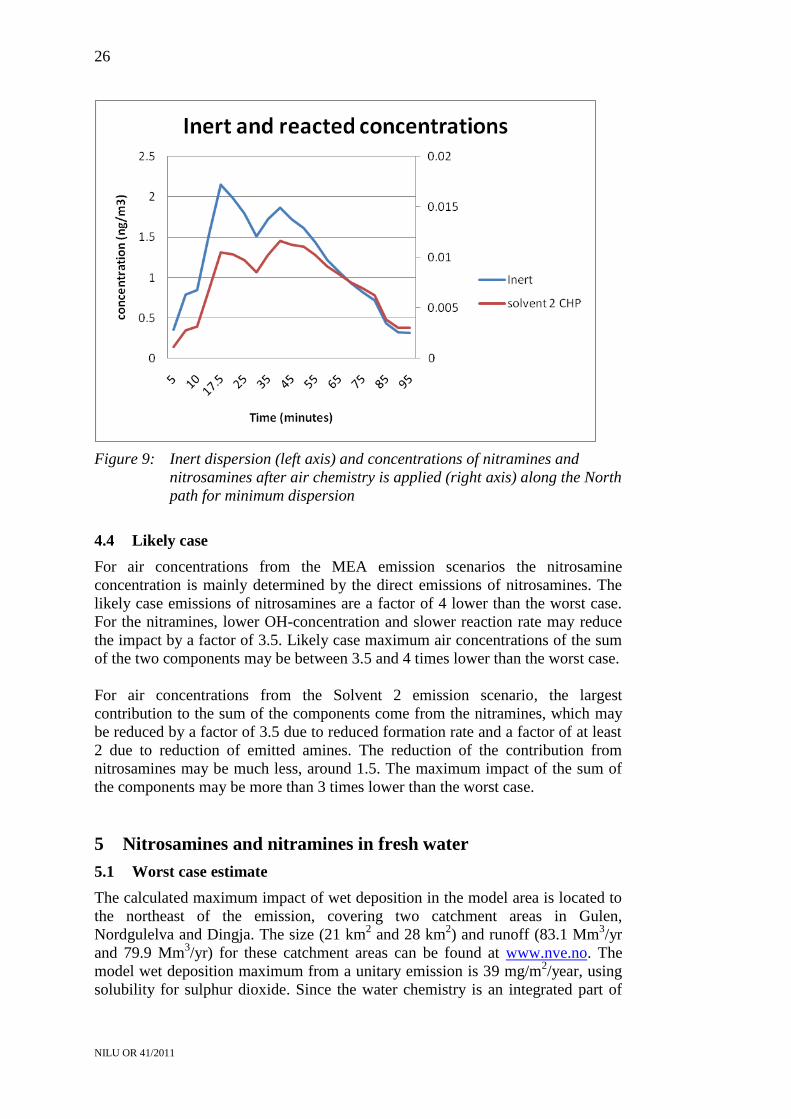
To illustrate the effect of air chemistry versus inert dispersion, the solvent 2 CHP
emission with chemistry is shown in Figure 9 together with a dispersion curve for
inert dispersion of primary and secondary amines in the same emission scenario.
26
NILU OR 41/2011
Figure 9: Inert dispersion (left axis) and concentrations of nitramines and
nitrosamines after air chemistry is applied (right axis) along the North
path for minimum dispersion
4.4 Likely case
For air concentrations from the MEA emission scenarios the nitrosamine
concentration is mainly determined by the direct emissions of nitrosamines. The
likely case emissions of nitrosamines are a factor of 4 lower than the worst case.
For the nitramines, lower OH-concentration and slower reaction rate may reduce
the impact by a factor of 3.5. Likely case maximum air concentrations of the sum
of the two components may be between 3.5 and 4 times lower than the worst case.
For air concentrations from the Solvent 2 emission scenario, the largest
contribution to the sum of the components come from the nitramines, which may
be reduced by a factor of 3.5 due to reduced formation rate and a factor of at least
2 due to reduction of emitted amines. The reduction of the contribution from
nitrosamines may be much less, around 1.5. The maximum impact of the sum of
the components may be more than 3 times lower than the worst case.
5 Nitrosamines and nitramines in fresh water
5.1 Worst case estimate
The calculated maximum impact of wet deposition in the model area is located to
the northeast of the emission, covering two catchment areas in Gulen,
Nordgulelva and Dingja. The size (21 km2 and 28 km
2) and runoff (83.1 Mm
3/yr
and 79.9 Mm3/yr) for these catchment areas can be found at www.nve.no. The
model wet deposition maximum from a unitary emission is 39 mg/m2/year, using
solubility for sulphur dioxide. Since the water chemistry is an integrated part of
27
NILU OR 41/2011
the dispersion model, the sulphur chemistry is the most conservative of the
options available.
The annual rainfall (average) is 1890 mm year. Taking into account the size of the
catchment areas and the gradients in the wet deposition field, gives an average
rainwater concentration of 4 µg/l over the catchment areas from a unitary
emission (1 g/s). The extracted travel speed for the air from the emission to the
deposition area is 4.6 m/s, giving a minimum time of 101 minutes for the
emissions to reach the deposition area. Due to the curvature of the airflow,
especially under conditions giving rain, the advection time has been increased to
115 minutes in these calculations.
Applying the same emission conversion factors as shown Table 5 for nitrosamines
and Table 6 for nitramines give converted emission figures as shown in Table 9.
These reflect the total average emission that remains as or has reacted to
nitrosamines, and how much that has reacted to nitramines. The table also show
what the resulting average rainwater concentration of nitrosamines and nitramines
will be.
Table 9: Part of emissions that have reacted to form or remain as nitrosamines
and nitramines after 115 minutes elapsed time since the emission, and
the resulting average rainwater concentration over the catchment
area.
Mass flow in emissions that
has reacted
Average rainwater
concentration
Scenario Nitrosamines
mg/s
Nitramines
mg/s
Nitrosamines
ng/l
Nitramines
ng/l
MEA CHP 0.2012 0.1181 0.8048 0.4724
Solvent 2 CHP 0.2649 0.5090 1.0596 2.036
MEA RFCC 0.1797 0.1477 0.7188 0.5908
Solvent 2 RFCC 0.2014 0.3867 0.8056 1.5468
For nitramines, there is as yet no documented degradation process for fresh water.
For nitrosamines, definitely photolysis (life-time 3 weeks) and possibly
biodegradation (half-life 40 days to 400 days) (Brakstad et al., 2011) will reduce
the concentrations. The effect of photolysis will result in a reduction of the
rainwater concentration of nitrosamines to 5.9 % of its initial value as a
contribution to the yearly average fresh water concentrations. Biodegradation
might reduce the nitrosamine concentration further, down towards 4 % of the
rainwater concentration.
The worst case concentrations in fresh water for nitrosamines and nitramines are
then largely decided by the nitramine contribution. All the scenarios are below the
guideline value of 4 ng/l proposed by NIPH. The results are shown in Table 10.
28
NILU OR 41/2011
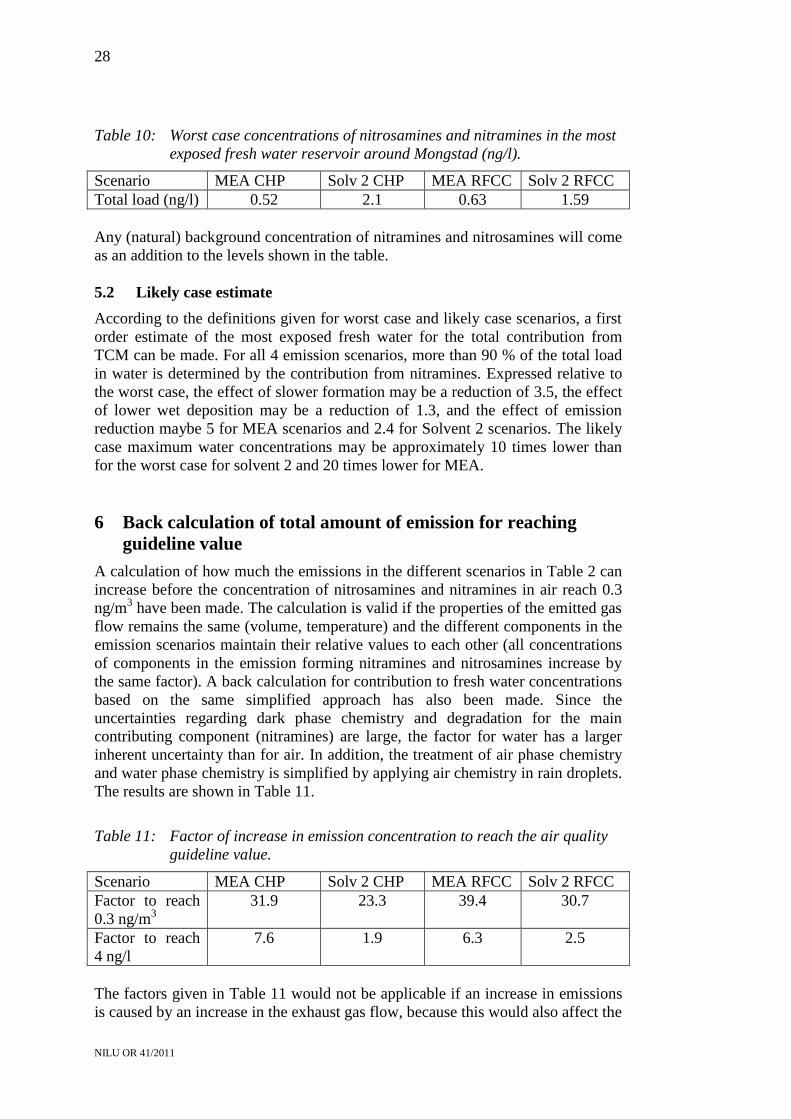
Table 10: Worst case concentrations of nitrosamines and nitramines in the most
exposed fresh water reservoir around Mongstad (ng/l).
Scenario MEA CHP Solv 2 CHP MEA RFCC Solv 2 RFCC
Total load (ng/l) 0.52 2.1 0.63 1.59
Any (natural) background concentration of nitramines and nitrosamines will come
as an addition to the levels shown in the table.
5.2 Likely case estimate
According to the definitions given for worst case and likely case scenarios, a first
order estimate of the most exposed fresh water for the total contribution from
TCM can be made. For all 4 emission scenarios, more than 90 % of the total load
in water is determined by the contribution from nitramines. Expressed relative to
the worst case, the effect of slower formation may be a reduction of 3.5, the effect
of lower wet deposition may be a reduction of 1.3, and the effect of emission
reduction maybe 5 for MEA scenarios and 2.4 for Solvent 2 scenarios. The likely
case maximum water concentrations may be approximately 10 times lower than
for the worst case for solvent 2 and 20 times lower for MEA.
6 Back calculation of total amount of emission for reaching
guideline value
A calculation of how much the emissions in the different scenarios in Table 2 can
increase before the concentration of nitrosamines and nitramines in air reach 0.3
ng/m3 have been made. The calculation is valid if the properties of the emitted gas
flow remains the same (volume, temperature) and the different components in the
emission scenarios maintain their relative values to each other (all concentrations
of components in the emission forming nitramines and nitrosamines increase by
the same factor). A back calculation for contribution to fresh water concentrations
based on the same simplified approach has also been made. Since the
uncertainties regarding dark phase chemistry and degradation for the main
contributing component (nitramines) are large, the factor for water has a larger
inherent uncertainty than for air. In addition, the treatment of air phase chemistry
and water phase chemistry is simplified by applying air chemistry in rain droplets.
The results are shown in Table 11.
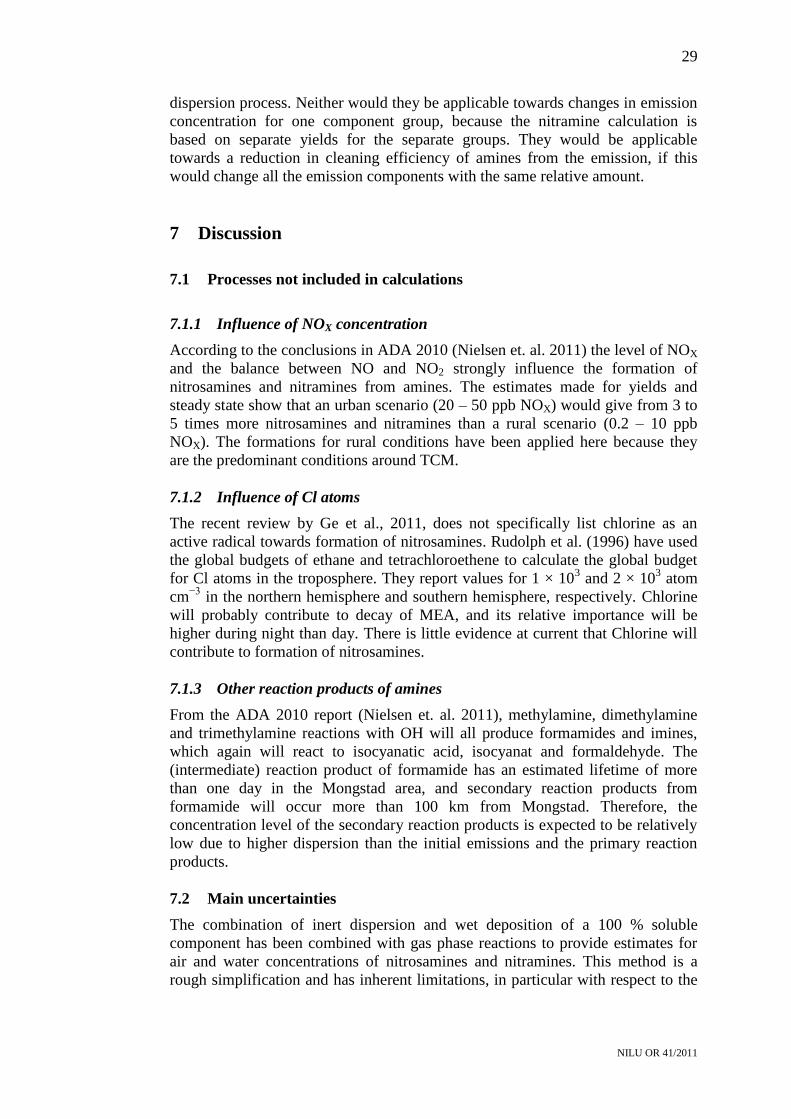
Table 11: Factor of increase in emission concentration to reach the air quality
guideline value.
Scenario MEA CHP Solv 2 CHP MEA RFCC Solv 2 RFCC
Factor to reach
0.3 ng/m3
31.9 23.3 39.4 30.7
Factor to reach
4 ng/l
7.6 1.9 6.3 2.5
The factors given in Table 11 would not be applicable if an increase in emissions
is caused by an increase in the exhaust gas flow, because this would also affect the
29
NILU OR 41/2011
dispersion process. Neither would they be applicable towards changes in emission
concentration for one component group, because the nitramine calculation is
based on separate yields for the separate groups. They would be applicable
towards a reduction in cleaning efficiency of amines from the emission, if this
would change all the emission components with the same relative amount.
7 Discussion
7.1 Processes not included in calculations
7.1.1 Influence of NOX concentration
According to the conclusions in ADA 2010 (Nielsen et. al. 2011) the level of NOX
and the balance between NO and NO2 strongly influence the formation of
nitrosamines and nitramines from amines. The estimates made for yields and
steady state show that an urban scenario (20 – 50 ppb NOX) would give from 3 to
5 times more nitrosamines and nitramines than a rural scenario (0.2 – 10 ppb
NOX). The formations for rural conditions have been applied here because they
are the predominant conditions around TCM.
7.1.2 Influence of Cl atoms
The recent review by Ge et al., 2011, does not specifically list chlorine as an
active radical towards formation of nitrosamines. Rudolph et al. (1996) have used
the global budgets of ethane and tetrachloroethene to calculate the global budget
for Cl atoms in the troposphere. They report values for 1 × 10³ and 2 × 10
3 atom
cm−3
in the northern hemisphere and southern hemisphere, respectively. Chlorine
will probably contribute to decay of MEA, and its relative importance will be
higher during night than day. There is little evidence at current that Chlorine will
contribute to formation of nitrosamines.
7.1.3 Other reaction products of amines
From the ADA 2010 report (Nielsen et. al. 2011), methylamine, dimethylamine
and trimethylamine reactions with OH will all produce formamides and imines,
which again will react to isocyanatic acid, isocyanat and formaldehyde. The
(intermediate) reaction product of formamide has an estimated lifetime of more
than one day in the Mongstad area, and secondary reaction products from
formamide will occur more than 100 km from Mongstad. Therefore, the
concentration level of the secondary reaction products is expected to be relatively
low due to higher dispersion than the initial emissions and the primary reaction
products.
7.2 Main uncertainties
The combination of inert dispersion and wet deposition of a 100 % soluble
component has been combined with gas phase reactions to provide estimates for
air and water concentrations of nitrosamines and nitramines. This method is a
rough simplification and has inherent limitations, in particular with respect to the
30
NILU OR 41/2011
processes mentioned in 7.1.1. An integrated model for dispersion and air
chemistry will be more accurate than this simplified method.
The resulting total load in air has contributions of approximately the same size
from nitrosamines and nitramines, while the total load in water is dominated by
the contribution from nitramines. The air and water chemistry for nitrosamines are
better documented than for nitramines. This means that the contribution to total
load from nitramines has a higher uncertainty than for nitrosamines, and that the
estimated total load for water is more uncertain than for air. No information on
night-time reactions of amines toward nitramines has been currently available for
the purpose of these calculations.
7.3 Usefulness of CONCX vs TAPM
The 8-hour maximum value of 2.4 µg/m3 calculated by the TAPM model (at 3-4
km distance from the source) and the 1-hour maximum value of nearly 12 µg/m3
calculated by the CONCX model (at 0.5 km from the source) are generally
consistent. Several facts must be considered when comparing the results. One
aspect is the actual dispersion conditions in the area. CONCX models theoretical
dispersion conditions while TAPM consider the actual meteorological conditions.
The combination of 1 m/s wind speed and unstable conditions is hardly present in
the dispersion data processed through TAPM. As a first order estimate the
concentration is inversely proportional to the wind speed. With a yearly average
wind speed of 3- 4 m/s, this largely explains most of the difference in the results.
Another aspect is that the horizontal resolution in the TAPM model is 2 x 2 km
and the concentration from CONCX represents an occurrence within an area of
approximately 20 x 50 m.
31
NILU OR 41/2011
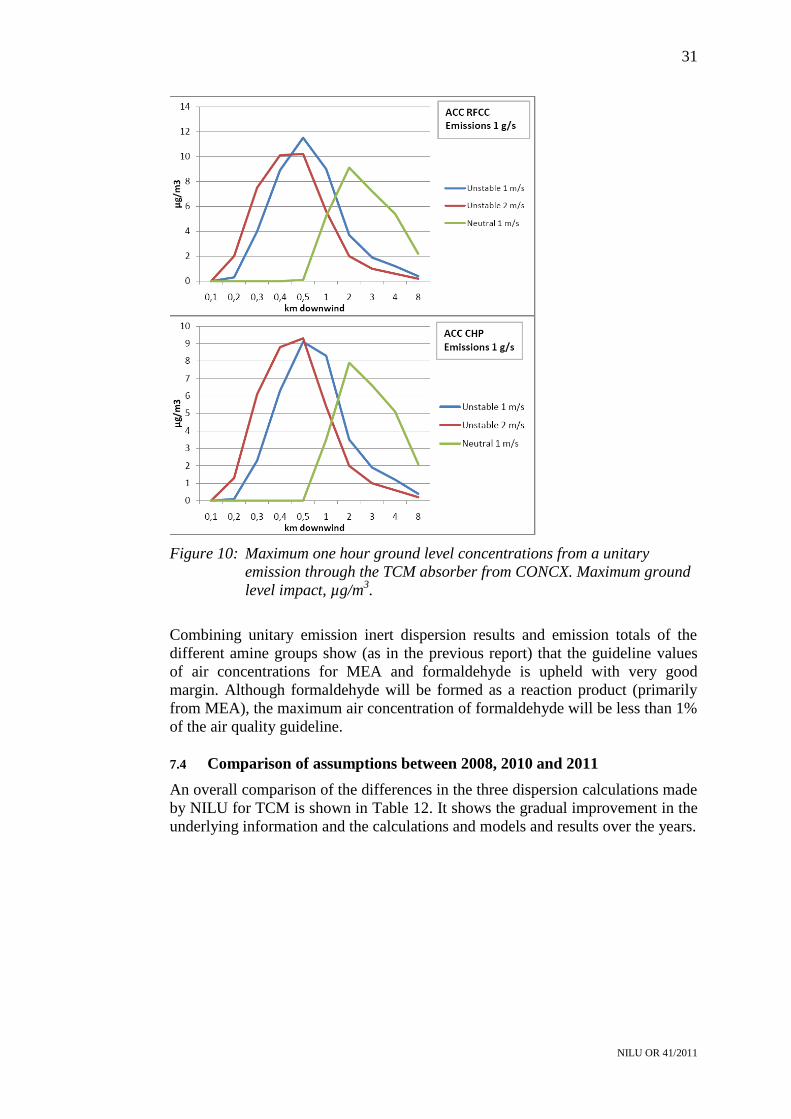
Figure 10: Maximum one hour ground level concentrations from a unitary
emission through the TCM absorber from CONCX. Maximum ground
level impact, µg/m3.
Combining unitary emission inert dispersion results and emission totals of the
different amine groups show (as in the previous report) that the guideline values
of air concentrations for MEA and formaldehyde is upheld with very good
margin. Although formaldehyde will be formed as a reaction product (primarily
from MEA), the maximum air concentration of formaldehyde will be less than 1%
of the air quality guideline.
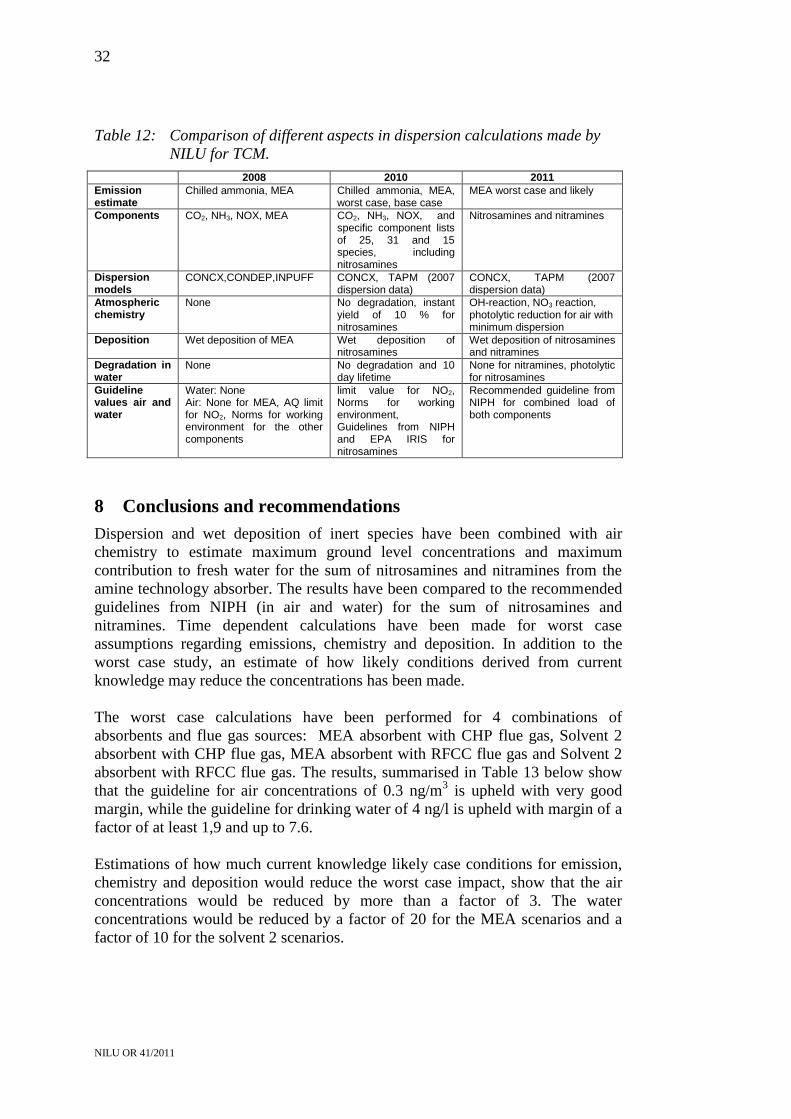
7.4 Comparison of assumptions between 2008, 2010 and 2011
An overall comparison of the differences in the three dispersion calculations made
by NILU for TCM is shown in Table 12. It shows the gradual improvement in the
underlying information and the calculations and models and results over the years.
32
NILU OR 41/2011
Table 12: Comparison of different aspects in dispersion calculations made by
NILU for TCM.
2008 2010 2011
Emission estimate
Chilled ammonia, MEA Chilled ammonia, MEA, worst case, base case
MEA worst case and likely
Components CO2, NH3, NOX, MEA CO2, NH3, NOX, and specific component lists of 25, 31 and 15 species, including nitrosamines
Nitrosamines and nitramines
Dispersion models
CONCX,CONDEP,INPUFF CONCX, TAPM (2007 dispersion data)
CONCX, TAPM (2007 dispersion data)
Atmospheric chemistry
None No degradation, instant yield of 10 % for nitrosamines
OH-reaction, NO3 reaction, photolytic reduction for air with minimum dispersion
Deposition Wet deposition of MEA Wet deposition of nitrosamines
Wet deposition of nitrosamines and nitramines
Degradation in water
None No degradation and 10 day lifetime
None for nitramines, photolytic for nitrosamines
Guideline values air and water
Water: None Air: None for MEA, AQ limit for NO2, Norms for working environment for the other components
limit value for NO2, Norms for working environment, Guidelines from NIPH and EPA IRIS for nitrosamines
Recommended guideline from NIPH for combined load of both components
8 Conclusions and recommendations
Dispersion and wet deposition of inert species have been combined with air
chemistry to estimate maximum ground level concentrations and maximum
contribution to fresh water for the sum of nitrosamines and nitramines from the
amine technology absorber. The results have been compared to the recommended
guidelines from NIPH (in air and water) for the sum of nitrosamines and
nitramines. Time dependent calculations have been made for worst case
assumptions regarding emissions, chemistry and deposition. In addition to the
worst case study, an estimate of how likely conditions derived from current
knowledge may reduce the concentrations has been made.
The worst case calculations have been performed for 4 combinations of
absorbents and flue gas sources: MEA absorbent with CHP flue gas, Solvent 2
absorbent with CHP flue gas, MEA absorbent with RFCC flue gas and Solvent 2
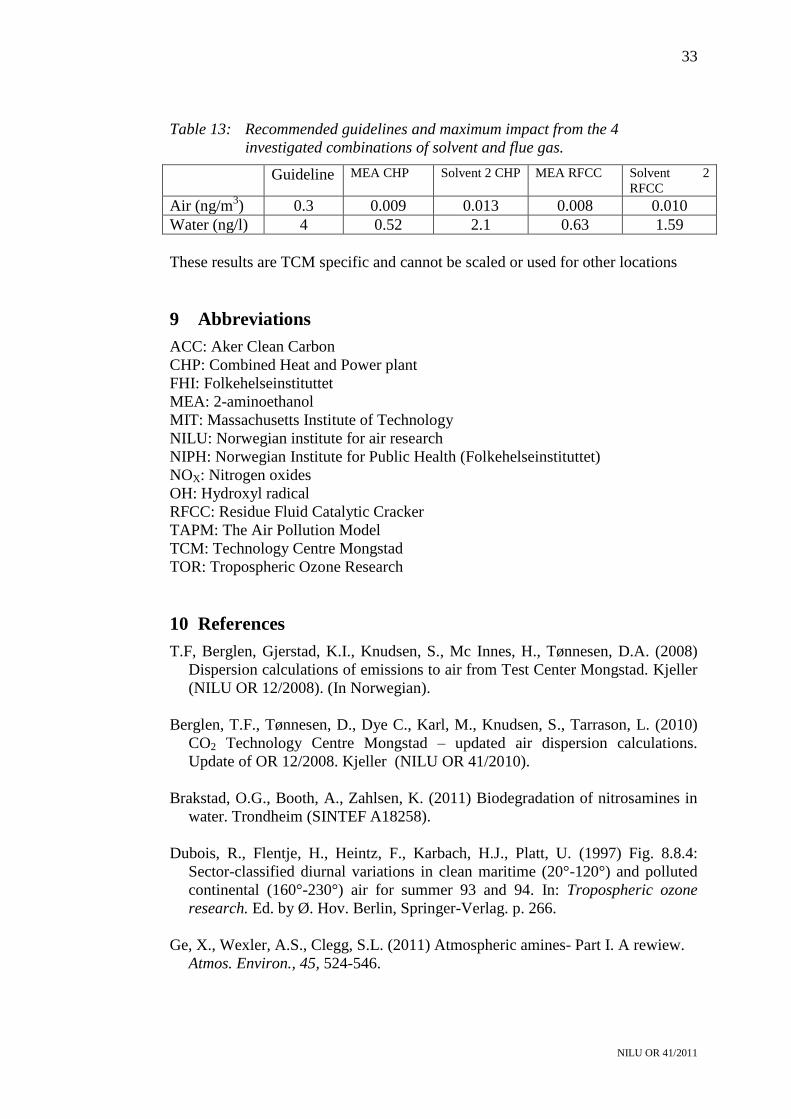
absorbent with RFCC flue gas. The results, summarised in Table 13 below show
that the guideline for air concentrations of 0.3 ng/m3 is upheld with very good
margin, while the guideline for drinking water of 4 ng/l is upheld with margin of a
factor of at least 1,9 and up to 7.6.
Estimations of how much current knowledge likely case conditions for emission,
chemistry and deposition would reduce the worst case impact, show that the air
concentrations would be reduced by more than a factor of 3. The water
concentrations would be reduced by a factor of 20 for the MEA scenarios and a
factor of 10 for the solvent 2 scenarios.
33
NILU OR 41/2011
Table 13: Recommended guidelines and maximum impact from the 4
investigated combinations of solvent and flue gas.
Guideline MEA CHP Solvent 2 CHP MEA RFCC Solvent 2
RFCC
Air (ng/m3) 0.3 0.009 0.013 0.008 0.010
Water (ng/l) 4 0.52 2.1 0.63 1.59
These results are TCM specific and cannot be scaled or used for other locations
9 Abbreviations
ACC: Aker Clean Carbon
CHP: Combined Heat and Power plant
FHI: Folkehelseinstituttet
MEA: 2-aminoethanol
MIT: Massachusetts Institute of Technology
NILU: Norwegian institute for air research
NIPH: Norwegian Institute for Public Health (Folkehelseinstituttet)
NOX: Nitrogen oxides
OH: Hydroxyl radical
RFCC: Residue Fluid Catalytic Cracker
TAPM: The Air Pollution Model
TCM: Technology Centre Mongstad
TOR: Tropospheric Ozone Research
10 References
T.F, Berglen, Gjerstad, K.I., Knudsen, S., Mc Innes, H., Tønnesen, D.A. (2008)
Dispersion calculations of emissions to air from Test Center Mongstad. Kjeller
(NILU OR 12/2008). (In Norwegian).
Berglen, T.F., Tønnesen, D., Dye C., Karl, M., Knudsen, S., Tarrason, L. (2010)
CO2 Technology Centre Mongstad – updated air dispersion calculations.
Update of OR 12/2008. Kjeller (NILU OR 41/2010).
Brakstad, O.G., Booth, A., Zahlsen, K. (2011) Biodegradation of nitrosamines in
water. Trondheim (SINTEF A18258).
Dubois, R., Flentje, H., Heintz, F., Karbach, H.J., Platt, U. (1997) Fig. 8.8.4:
Sector-classified diurnal variations in clean maritime (20°-120°) and polluted
continental (160°-230°) air for summer 93 and 94. In: Tropospheric ozone
research. Ed. by Ø. Hov. Berlin, Springer-Verlag. p. 266.
Ge, X., Wexler, A.S., Clegg, S.L. (2011) Atmospheric amines- Part I. A rewiew.
Atmos. Environ., 45, 524-546.
34
NILU OR 41/2011
Karl, M., Wright R. F., Berglen, T. F., Denby, B. (2011) Worst case scenario
study to assess the environmental impact of amine emissions from a CO2
capture plant. Internat. J. Greenhouse Gas Control., 5, 439-447.
Låg, M., Lindeman, B., Instanes, C., Brunborg, G., Schwarze, P. (2011) Health
effects of amines and derivatives associated with CO2 capture. Oslo, The
Norwegian Institute of Public Health.
URL: http://www.fhi.no/dokumenter/5fa8589ddf.pdf [accessed 09.08.2011]
Nielsen, C.J., D’Anna, B., Dye, C., George, C., Graus, M., Hansel, A., Karl, M.,
King, S., Musabila, M., Müller, M. Schmidbauer, N., Stenstrøm, Y., Wisthaler,
A. (2010) Atmospheric degradation of amines (ADA). Gas phase photo-
oxidation of 2-aminoethanol (MEA). CLIMIT project no.193438. Kjeller.
(NILU OR 08/2010).
Nielsen, C.J., Hoffmann, D., Herrmann, H. (2011) Evaluation of worst case
assumptions – atmospheric chemistry. Final Report, February 24, 2011. Oslo,
University of Oslo, Department of Chemistry.
Nielsen, C.J., D'Anna, B., Karl, M., Aursnes, M., Boreave, A., Bossi, R., Bunkan,
A.J.C., Glasius, M., Hallquist, M., Hansen, A.M.K., Kristensen, K., Mikoviny,
T., Maguta, M.M., Müller, M., Nguyen, Q., Westerlund, J., Salo, K., Skov, H.,
Stenstrøm, Y., Wisthaler, A. (2011) Athmospheric degradation of amines
(ADA) Summary report: Photo-oxidation of methylamine, dimethylamine and
trimethylamine. CLIMIT project no. 201604. Kjeller (NILU OR 2/2011).
Rudolph, J., Koppmann, R., Plass-Dülmer, C. (1996) The budgets of ethane and
tetrachloroethene: Is there evidence for an impact of reactions with chlorine
atoms in the troposphere? Atmos. Environ., 30, 1887-1894.
Selin, N.E. (2011) Environmental guidelines and regulations for nitrosamines: A
policy summary. Cambridge, MA, Massachusetts Institute of Technology.
Tønnesen, D. (2008) Air quality monitoring at Mongstad, November 2006 - October 2007. Kjeller (NILU OR 47/2008). (In Norwegian).
35
NILU OR 41/2011
Appendix A
Setup for TAPM model runs

36
NILU OR 41/2011
37
NILU OR 41/2011
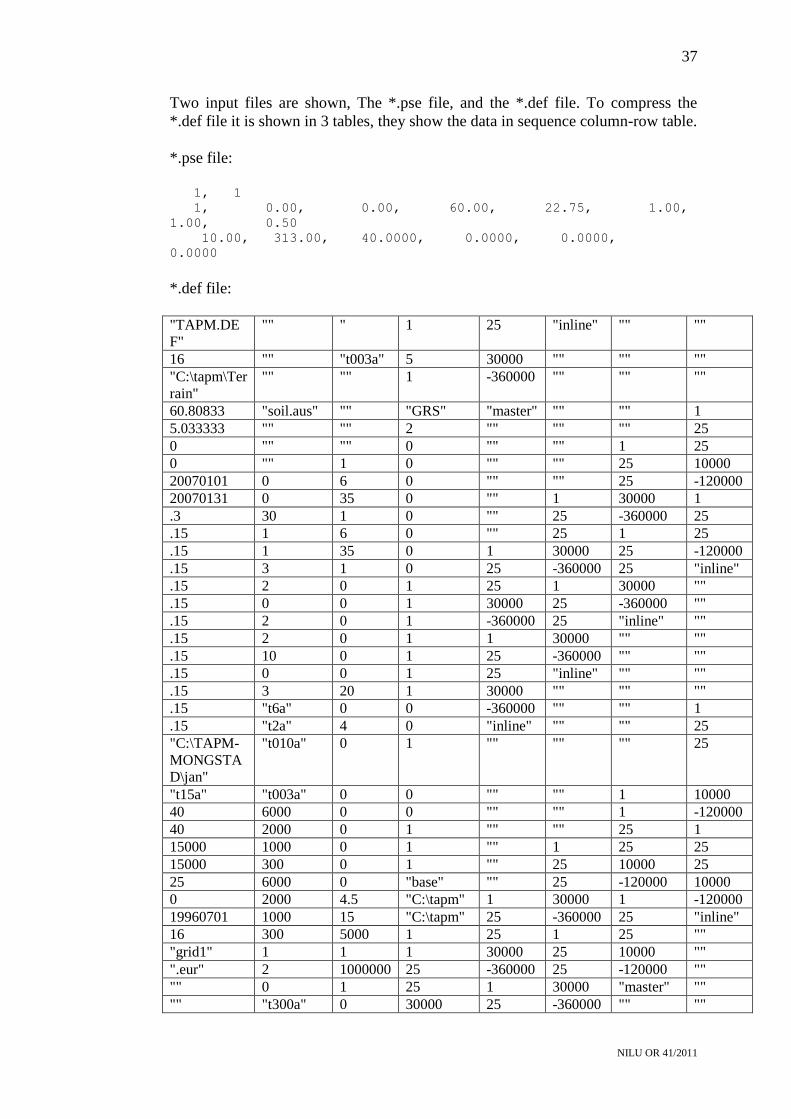
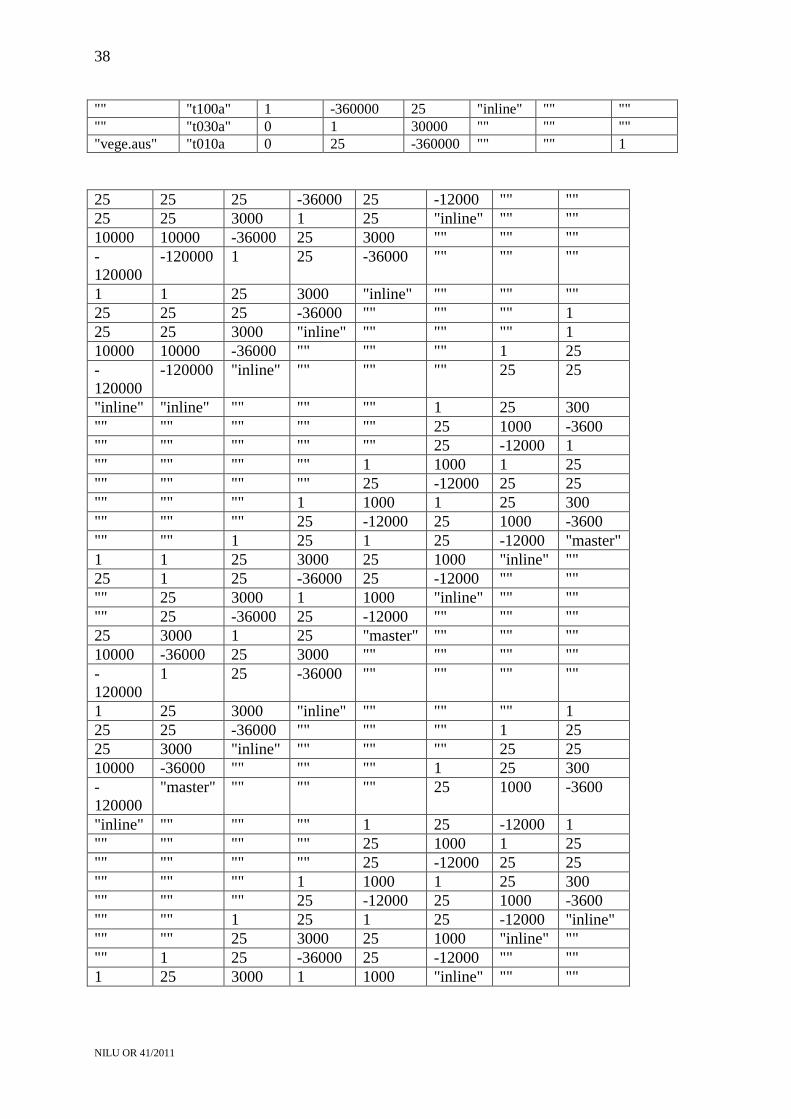
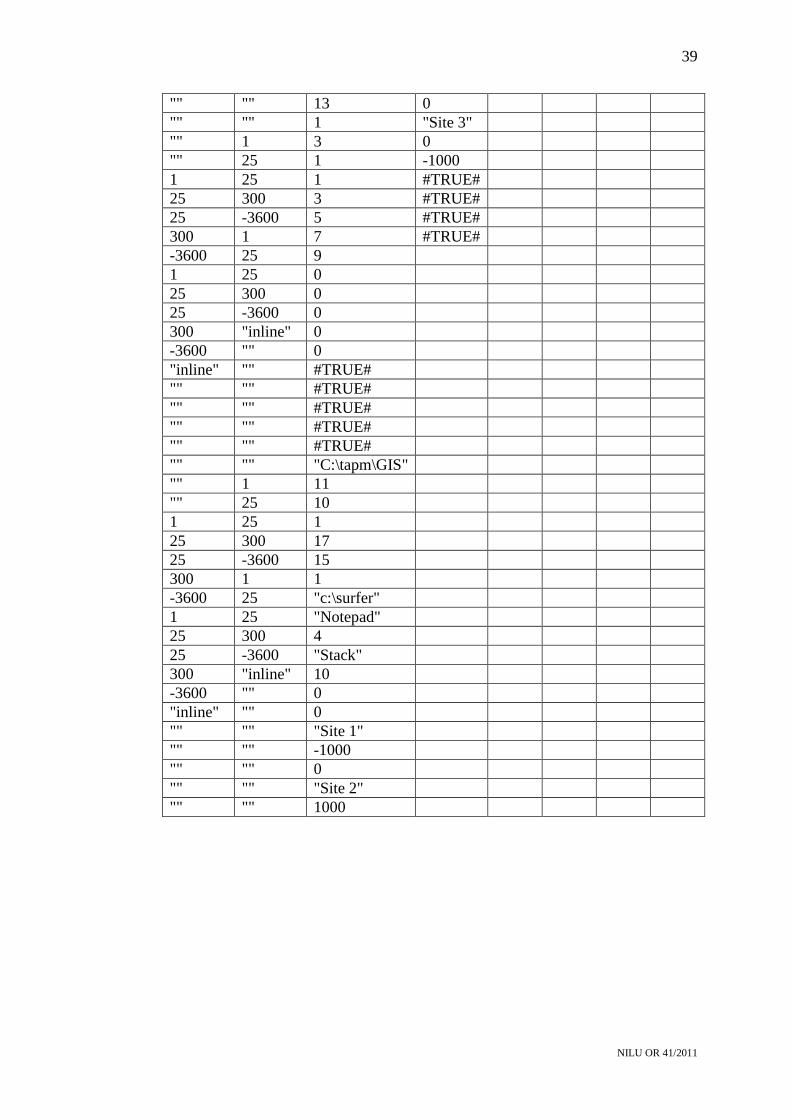
Two input files are shown, The *.pse file, and the *.def file. To compress the
*.def file it is shown in 3 tables, they show the data in sequence column-row table.
*.pse file:
1, 1
1, 0.00, 0.00, 60.00, 22.75, 1.00,
1.00, 0.50
10.00, 313.00, 40.0000, 0.0000, 0.0000,
0.0000
*.def file:
"TAPM.DE
F"
"" " 1 25 "inline" "" ""
16 "" "t003a" 5 30000 "" "" ""
"C:\tapm\Ter
rain"
"" "" 1 -360000 "" "" ""
60.80833 "soil.aus" "" "GRS" "master" "" "" 1
5.033333 "" "" 2 "" "" "" 25
0 "" "" 0 "" "" 1 25
0 "" 1 0 "" "" 25 10000
20070101 0 6 0 "" "" 25 -120000
20070131 0 35 0 "" 1 30000 1
.3 30 1 0 "" 25 -360000 25
.15 1 6 0 "" 25 1 25
.15 1 35 0 1 30000 25 -120000
.15 3 1 0 25 -360000 25 "inline"
.15 2 0 1 25 1 30000 ""
.15 0 0 1 30000 25 -360000 ""
.15 2 0 1 -360000 25 "inline" ""
.15 2 0 1 1 30000 "" ""
.15 10 0 1 25 -360000 "" ""
.15 0 0 1 25 "inline" "" ""
.15 3 20 1 30000 "" "" ""
.15 "t6a" 0 0 -360000 "" "" 1
.15 "t2a" 4 0 "inline" "" "" 25
"C:\TAPM-
MONGSTA
D\jan"
"t010a" 0 1 "" "" "" 25
"t15a" "t003a" 0 0 "" "" 1 10000
40 6000 0 0 "" "" 1 -120000
40 2000 0 1 "" "" 25 1
15000 1000 0 1 "" 1 25 25
15000 300 0 1 "" 25 10000 25
25 6000 0 "base" "" 25 -120000 10000
0 2000 4.5 "C:\tapm" 1 30000 1 -120000
19960701 1000 15 "C:\tapm" 25 -360000 25 "inline"
16 300 5000 1 25 1 25 ""
"grid1" 1 1 1 30000 25 10000 ""
".eur" 2 1000000 25 -360000 25 -120000 ""
"" 0 1 25 1 30000 "master" ""
"" "t300a" 0 30000 25 -360000 "" ""
38
NILU OR 41/2011
"" "t100a" 1 -360000 25 "inline" "" ""
"" "t030a" 0 1 30000 "" "" ""
"vege.aus" "t010a 0 25 -360000 "" "" 1
25 25 25 -36000 25 -12000 "" ""
25 25 3000 1 25 "inline" "" ""
10000 10000 -36000 25 3000 "" "" ""
-
120000
-120000 1 25 -36000 "" "" ""
1 1 25 3000 "inline" "" "" ""
25 25 25 -36000 "" "" "" 1
25 25 3000 "inline" "" "" "" 1
10000 10000 -36000 "" "" "" 1 25
-
120000
-120000 "inline" "" "" "" 25 25
"inline" "inline" "" "" "" 1 25 300
"" "" "" "" "" 25 1000 -3600
"" "" "" "" "" 25 -12000 1
"" "" "" "" 1 1000 1 25
"" "" "" "" 25 -12000 25 25
"" "" "" 1 1000 1 25 300
"" "" "" 25 -12000 25 1000 -3600
"" "" 1 25 1 25 -12000 "master"
1 1 25 3000 25 1000 "inline" ""
25 1 25 -36000 25 -12000 "" ""
"" 25 3000 1 1000 "inline" "" ""
"" 25 -36000 25 -12000 "" "" ""
25 3000 1 25 "master" "" "" ""
10000 -36000 25 3000 "" "" "" ""
-
120000
1 25 -36000 "" "" "" ""
1 25 3000 "inline" "" "" "" 1
25 25 -36000 "" "" "" 1 25
25 3000 "inline" "" "" "" 25 25
10000 -36000 "" "" "" 1 25 300
-
120000
"master" "" "" "" 25 1000 -3600
"inline" "" "" "" 1 25 -12000 1
"" "" "" "" 25 1000 1 25
"" "" "" "" 25 -12000 25 25
"" "" "" 1 1000 1 25 300
"" "" "" 25 -12000 25 1000 -3600
"" "" 1 25 1 25 -12000 "inline"
"" "" 25 3000 25 1000 "inline" ""
"" 1 25 -36000 25 -12000 "" ""
1 25 3000 1 1000 "inline" "" ""
39
NILU OR 41/2011
"" "" 13 0
"" "" 1 "Site 3"
"" 1 3 0
"" 25 1 -1000
1 25 1 #TRUE#
25 300 3 #TRUE#
25 -3600 5 #TRUE#
300 1 7 #TRUE#
-3600 25 9
1 25 0
25 300 0
25 -3600 0
300 "inline" 0
-3600 "" 0
"inline" "" #TRUE#
"" "" #TRUE#
"" "" #TRUE#
"" "" #TRUE#
"" "" #TRUE#
"" "" "C:\tapm\GIS"
"" 1 11
"" 25 10
1 25 1
25 300 17
25 -3600 15
300 1 1
-3600 25 "c:\surfer"
1 25 "Notepad"
25 300 4
25 -3600 "Stack"
300 "inline" 10
-3600 "" 0
"inline" "" 0
"" "" "Site 1"
"" "" -1000
"" "" 0
"" "" "Site 2"
"" "" 1000

40
NILU OR 41/2011
41
NILU OR 41/2011
Appendix B
Data for wind and precipition in 2007 versus
average

42
NILU OR 41/2011
43
NILU OR 41/2011
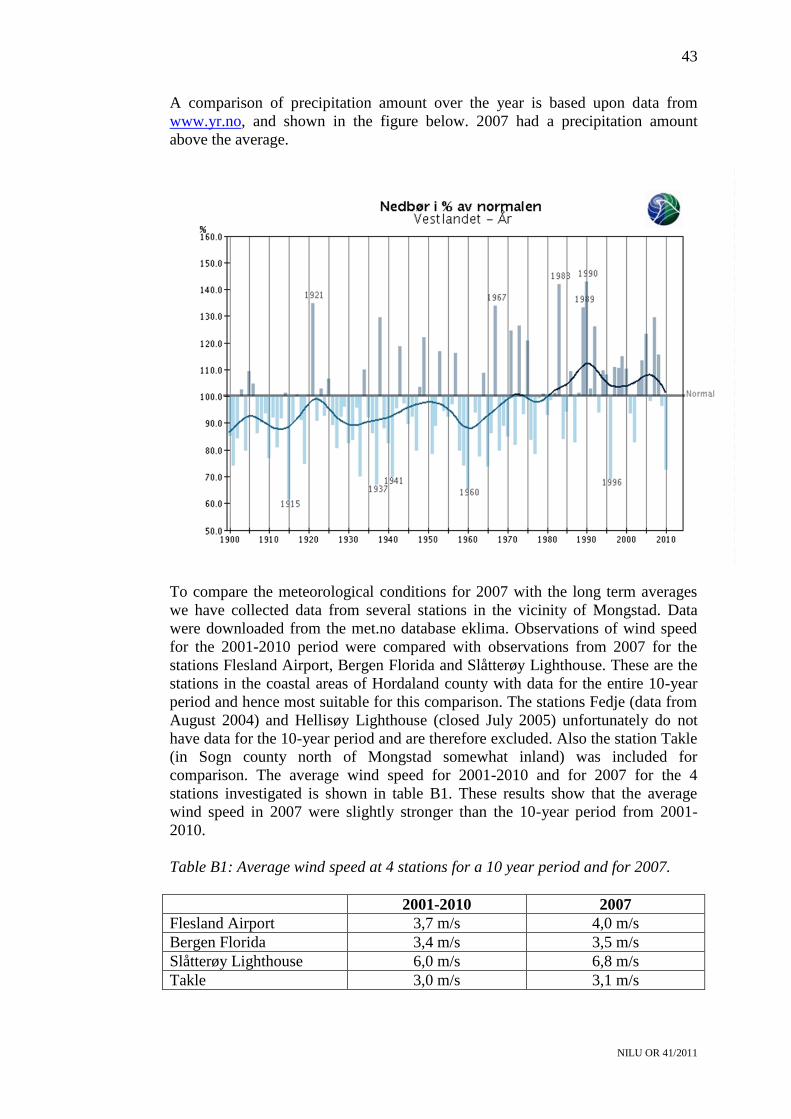
A comparison of precipitation amount over the year is based upon data from
www.yr.no, and shown in the figure below. 2007 had a precipitation amount
above the average.
To compare the meteorological conditions for 2007 with the long term averages
we have collected data from several stations in the vicinity of Mongstad. Data
were downloaded from the met.no database eklima. Observations of wind speed
for the 2001-2010 period were compared with observations from 2007 for the
stations Flesland Airport, Bergen Florida and Slåtterøy Lighthouse. These are the
stations in the coastal areas of Hordaland county with data for the entire 10-year
period and hence most suitable for this comparison. The stations Fedje (data from
August 2004) and Hellisøy Lighthouse (closed July 2005) unfortunately do not
have data for the 10-year period and are therefore excluded. Also the station Takle
(in Sogn county north of Mongstad somewhat inland) was included for
comparison. The average wind speed for 2001-2010 and for 2007 for the 4
stations investigated is shown in table B1. These results show that the average
wind speed in 2007 were slightly stronger than the 10-year period from 2001-
2010.
Table B1: Average wind speed at 4 stations for a 10 year period and for 2007.
2001-2010 2007
Flesland Airport 3,7 m/s 4,0 m/s
Bergen Florida 3,4 m/s 3,5 m/s
Slåtterøy Lighthouse 6,0 m/s 6,8 m/s
Takle 3,0 m/s 3,1 m/s

44
NILU OR 41/2011
45
NILU OR 41/2011
Appendix C
Detailed emission estimate from ACC

46
NILU OR 41/2011
47
NILU OR 41/2011
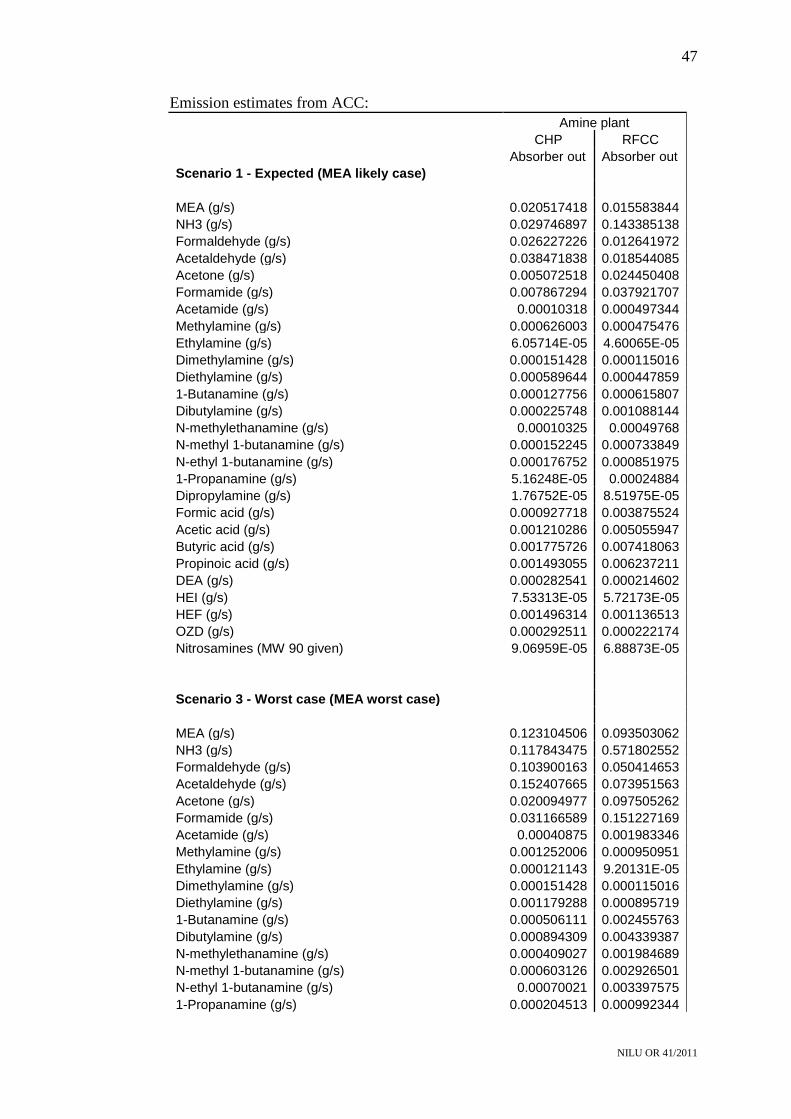
Emission estimates from ACC:
Amine plant
CHP RFCC
Absorber out Absorber out
Scenario 1 - Expected (MEA likely case)
MEA (g/s) 0.020517418 0.015583844
NH3 (g/s) 0.029746897 0.143385138
Formaldehyde (g/s) 0.026227226 0.012641972
Acetaldehyde (g/s) 0.038471838 0.018544085
Acetone (g/s) 0.005072518 0.024450408
Formamide (g/s) 0.007867294 0.037921707
Acetamide (g/s) 0.00010318 0.000497344
Methylamine (g/s) 0.000626003 0.000475476
Ethylamine (g/s) 6.05714E-05 4.60065E-05
Dimethylamine (g/s) 0.000151428 0.000115016
Diethylamine (g/s) 0.000589644 0.000447859
1-Butanamine (g/s) 0.000127756 0.000615807
Dibutylamine (g/s) 0.000225748 0.001088144
N-methylethanamine (g/s) 0.00010325 0.00049768
N-methyl 1-butanamine (g/s) 0.000152245 0.000733849
N-ethyl 1-butanamine (g/s) 0.000176752 0.000851975
1-Propanamine (g/s) 5.16248E-05 0.00024884
Dipropylamine (g/s) 1.76752E-05 8.51975E-05
Formic acid (g/s) 0.000927718 0.003875524
Acetic acid (g/s) 0.001210286 0.005055947
Butyric acid (g/s) 0.001775726 0.007418063
Propinoic acid (g/s) 0.001493055 0.006237211
DEA (g/s) 0.000282541 0.000214602
HEI (g/s) 7.53313E-05 5.72173E-05
HEF (g/s) 0.001496314 0.001136513
OZD (g/s) 0.000292511 0.000222174
Nitrosamines (MW 90 given) 9.06959E-05 6.88873E-05
Scenario 3 - Worst case (MEA worst case)
MEA (g/s) 0.123104506 0.093503062
NH3 (g/s) 0.117843475 0.571802552
Formaldehyde (g/s) 0.103900163 0.050414653
Acetaldehyde (g/s) 0.152407665 0.073951563
Acetone (g/s) 0.020094977 0.097505262
Formamide (g/s) 0.031166589 0.151227169
Acetamide (g/s) 0.00040875 0.001983346
Methylamine (g/s) 0.001252006 0.000950951
Ethylamine (g/s) 0.000121143 9.20131E-05
Dimethylamine (g/s) 0.000151428 0.000115016
Diethylamine (g/s) 0.001179288 0.000895719
1-Butanamine (g/s) 0.000506111 0.002455763
Dibutylamine (g/s) 0.000894309 0.004339387
N-methylethanamine (g/s) 0.000409027 0.001984689
N-methyl 1-butanamine (g/s) 0.000603126 0.002926501
N-ethyl 1-butanamine (g/s) 0.00070021 0.003397575
1-Propanamine (g/s) 0.000204513 0.000992344
48
NILU OR 41/2011
Dipropylamine (g/s) 7.0021E-05 0.000339757
Formic acid (g/s) 0.003185164 0.015455121
Acetic acid (g/s) 0.004155315 0.020162503
Butyric acid (g/s) 0.006096659 0.029582338
Propinoic acid (g/s) 0.005126157 0.024873243
DEA (g/s) 0.000282541 0.000214602
HEI (g/s) 0.000150663 0.000114435
HEF (g/s) 0.002992627 0.002273027
OZD (g/s) 0.000585022 0.000444349
Nitrosamines (MW 90 given) 0.000362783 0.000275549
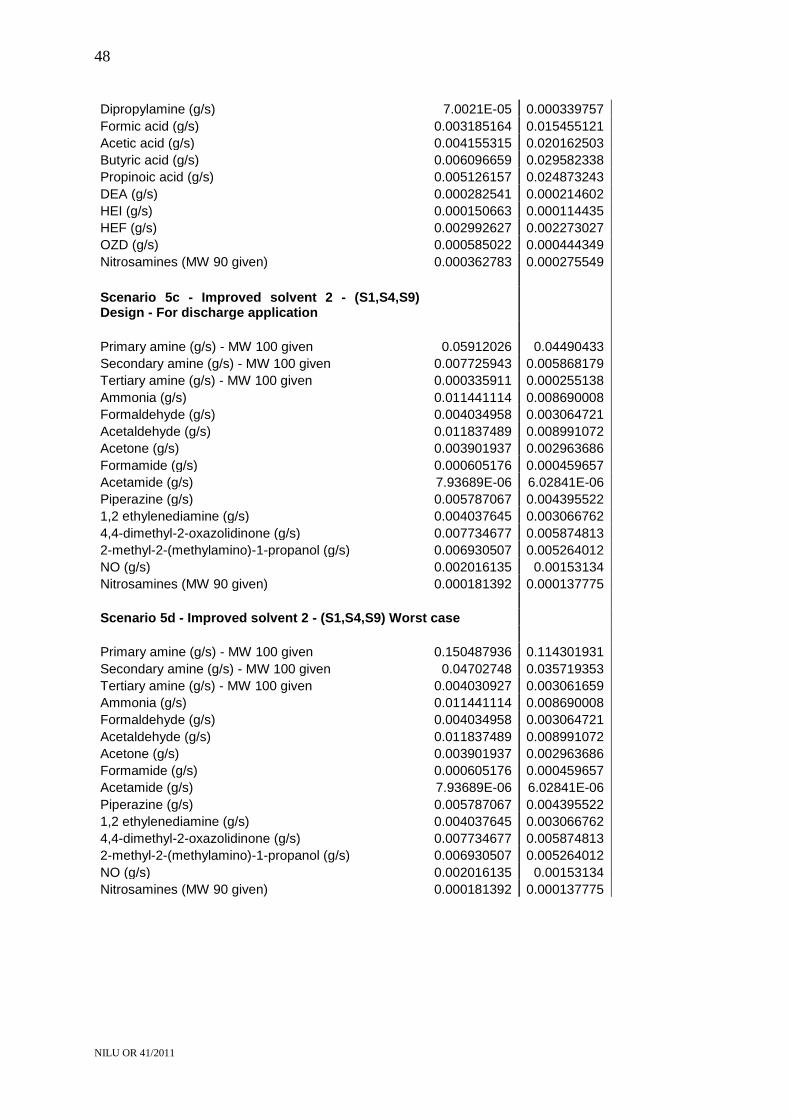
Scenario 5c - Improved solvent 2 - (S1,S4,S9) Design - For discharge application
Primary amine (g/s) - MW 100 given 0.05912026 0.04490433
Secondary amine (g/s) - MW 100 given 0.007725943 0.005868179
Tertiary amine (g/s) - MW 100 given 0.000335911 0.000255138
Ammonia (g/s) 0.011441114 0.008690008
Formaldehyde (g/s) 0.004034958 0.003064721
Acetaldehyde (g/s) 0.011837489 0.008991072
Acetone (g/s) 0.003901937 0.002963686
Formamide (g/s) 0.000605176 0.000459657
Acetamide (g/s) 7.93689E-06 6.02841E-06
Piperazine (g/s) 0.005787067 0.004395522
1,2 ethylenediamine (g/s) 0.004037645 0.003066762
4,4-dimethyl-2-oxazolidinone (g/s) 0.007734677 0.005874813
2-methyl-2-(methylamino)-1-propanol (g/s) 0.006930507 0.005264012
NO (g/s) 0.002016135 0.00153134
Nitrosamines (MW 90 given) 0.000181392 0.000137775
Scenario 5d - Improved solvent 2 - (S1,S4,S9) Worst case
Primary amine (g/s) - MW 100 given 0.150487936 0.114301931
Secondary amine (g/s) - MW 100 given 0.04702748 0.035719353
Tertiary amine (g/s) - MW 100 given 0.004030927 0.003061659
Ammonia (g/s) 0.011441114 0.008690008
Formaldehyde (g/s) 0.004034958 0.003064721
Acetaldehyde (g/s) 0.011837489 0.008991072
Acetone (g/s) 0.003901937 0.002963686
Formamide (g/s) 0.000605176 0.000459657
Acetamide (g/s) 7.93689E-06 6.02841E-06
Piperazine (g/s) 0.005787067 0.004395522
1,2 ethylenediamine (g/s) 0.004037645 0.003066762
4,4-dimethyl-2-oxazolidinone (g/s) 0.007734677 0.005874813
2-methyl-2-(methylamino)-1-propanol (g/s) 0.006930507 0.005264012
NO (g/s) 0.002016135 0.00153134
Nitrosamines (MW 90 given) 0.000181392 0.000137775
Norwegian Institute for Air Research P.O. Box 100, N-2027 Kjeller, Norway
Associated with CIENS and the Environmental Research Alliance of Norway
ISO certified according to NS-EN ISO 9001/ISO 14001
REPORT SERIES
Scientific report
REPORT NO. OR 41/2011
ISBN: 978-82-425-2422-5 (print) 978-82-425-2423-2 (electronic)
ISSN: 0807-7207
DATE
2011-08-12
SIGN.
NO. OF PAGES
48
PRICE
NOK 150.-
TITLE
Update and Improvement of Dispersion Calculations for Emissions to Air from TCM’s Amine Plant
PROJECT LEADER
Dag Tønnesen
Part l-Worst case Nitrosamines and Nitramines NILU PROJECT NO.
O-111077
AUTHOR(S)
Dag Tønnesen
CLASSIFICATION *
A
CONTRACT REF.
REPORT PREPARED FOR Technology Centre Mongstad
ABSTRACT Inert dispersion of a unitary emission has been combined with time dependent air chemistry to provide maximum impact of nitrosamines and nitramines in air and water for emissions from the amine absorber at TCM. The calculations show that worst case impact of nitrosamines and nitramines in air is 5 % of the recommended guideline value. The maximum concentrations in fresh water range from13 % to 53 % of the guideline depending on the use of absorbent and flue gas. Estimates for a likely case impact show that air concentrations will be a factor of 3 lower than the worst case, while water concentrations will be a factor from 10 to 20 lower than the worst case depending on the type of absorber.
NORWEGIAN TITLE
Oppdaterte og forbedrede spredningsberegninger for utslipp til luft fra TCMs aminanlegg.
KEYWORDS
Atmosphere and Climate
Carbon Capture and Storage
Modelling
ABSTRACT (in Norwegian) Inert spredning av et enhetsutslipp er kombinert med tidsavhengig luftkjemi for å beregne maksimal belastning I luft og ferskvann for utslipp fra aminabsorberen ved TCM. Beregningene for et worst case viser at maksimal belastning av summen av nitrosaminer og nitraminer er 5 % av anbefalt retningslinje for luftkvalitet. Maksimale konsentrasjoner i ferskvann fra utslippet er fra 13 % til 53 % av retningslinjen avhengig av hvilken absorbent som benyttes og hvilken avgass som renses.Effekten av et ”likely case” er estimert. Estimatet viser at luftkonsentrasjonene blir en faktor 3 lavere enn worst case. Ferskvannkonsentrasjonene bliren faktor fra 10 til 20 lavere enn worst case avhengig av hvilken absorbent som benyttes.
* Classification A B C
Unclassified (can be ordered from NILU) Restricted distribution Classified (not to be distributed)
NILU OR 41/2011
REFERENCE: O-111077 DATE: AUGUST 2011 ISBN: 978-82-425-2422-5 (print) 978-82-425-2423-2 (electronic) NILU is an independent, nonprofit institution established in 1969. Through its research NILU increases the understanding of climate change, of the composition of the atmosphere, of air quality and of hazardous substances. Based on its research, NILU markets integrated services and products within analyzing, monitoring and consulting. NILU is concerned with increasing public awareness about climate change and environmental pollution.