Embed Size (px)
Citation preview
Up and runningAlberta’s economy in 2017
Safety Codes Council
Banff, June 1, 2017
Rob Roach
Director of Insight
Economics and Research
ATB Financial

2 Up and running

3 Up and running
4 Up and running
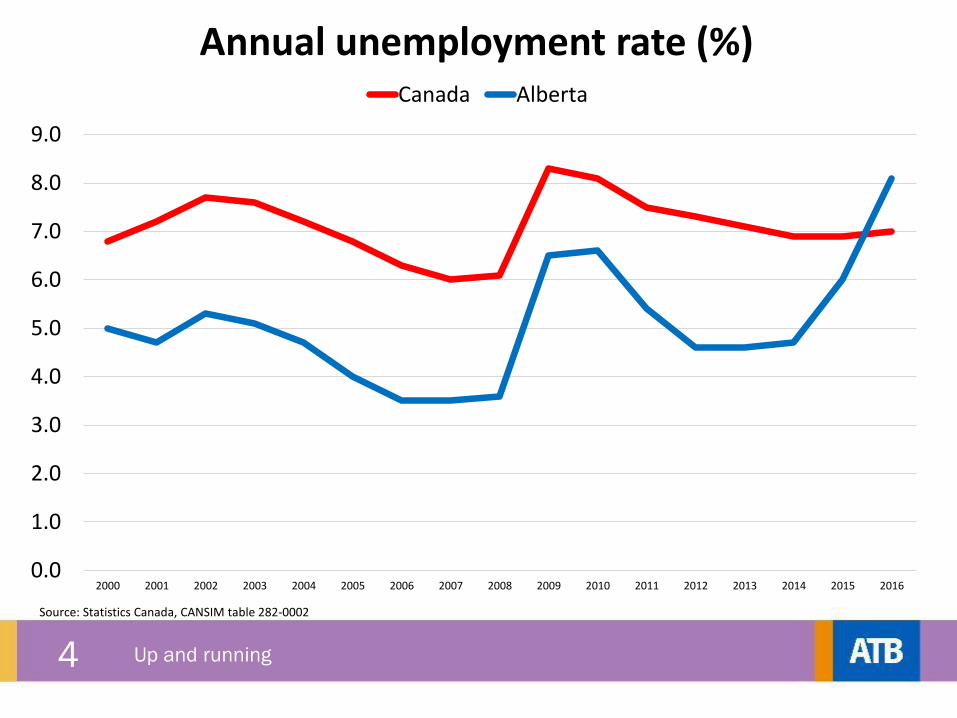
0.0
1.0
2.0
3.0
4.0
5.0
6.0
7.0
8.0
9.0
2000 2001 2002 2003 2004 2005 2006 2007 2008 2009 2010 2011 2012 2013 2014 2015 2016
Source: Statistics Canada, CANSIM table 282-0002
Annual unemployment rate (%)Canada Alberta
5 Up and running
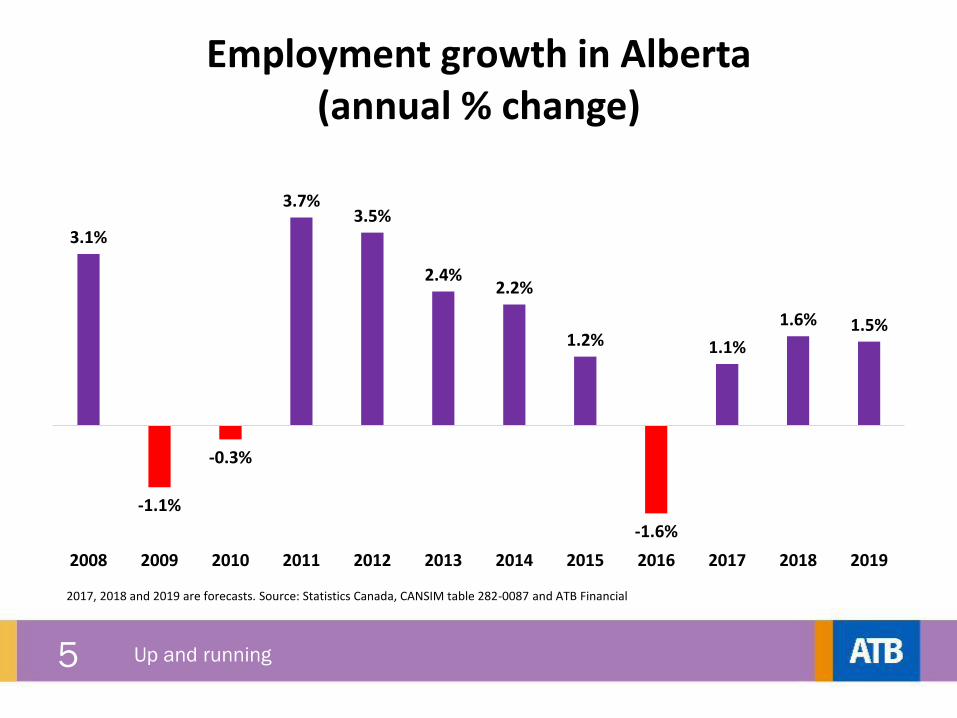
3.1%
-1.1%
-0.3%
3.7%3.5%
2.4%2.2%
1.2%
-1.6%
1.1%
1.6% 1.5%
2008 2009 2010 2011 2012 2013 2014 2015 2016 2017 2018 2019
2017, 2018 and 2019 are forecasts. Source: Statistics Canada, CANSIM table 282-0087 and ATB Financial
Employment growth in Alberta (annual % change)
6 Economic update
7 Up and running
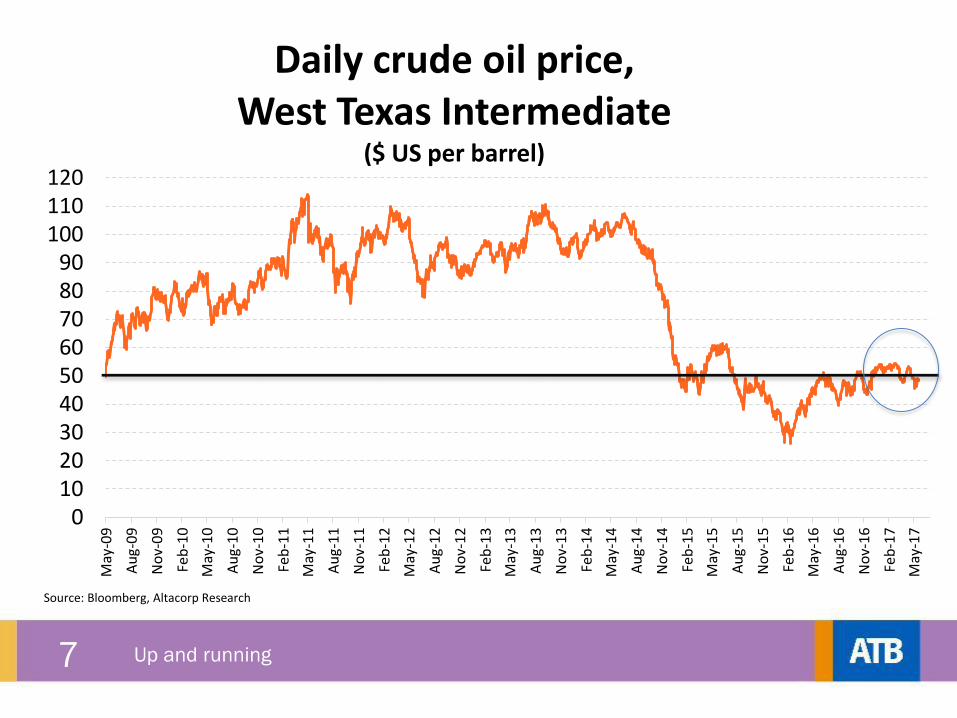
0102030405060708090
100110120
May
-09
Au
g-0
9
No
v-0
9
Feb
-10
May
-10
Au
g-1
0
No
v-1
0
Feb
-11
May
-11
Au
g-1
1
No
v-1
1
Feb
-12
May
-12
Au
g-1
2
No
v-1
2
Feb
-13
May
-13
Au
g-1
3
No
v-1
3
Feb
-14
May
-14
Au
g-1
4
No
v-1
4
Feb
-15
May
-15
Au
g-1
5
No
v-1
5
Feb
-16
May
-16
Au
g-1
6
No
v-1
6
Feb
-17
May
-17
Source: Bloomberg, Altacorp Research
Daily crude oil price, West Texas Intermediate
($ US per barrel)

8 Up and running
28
48
31
39
52 58
64
76
52
43
2007 2008 2009 2010 2011 2012 2013 2014 2015 2016
Value of Alberta's international exports of crude oil(billions of CDN $)
Source: Trade Data Online, HS Code 270900 - Crude Petroleum Oils and Oils Obtained from Bituminous Minerals
9 Up and running
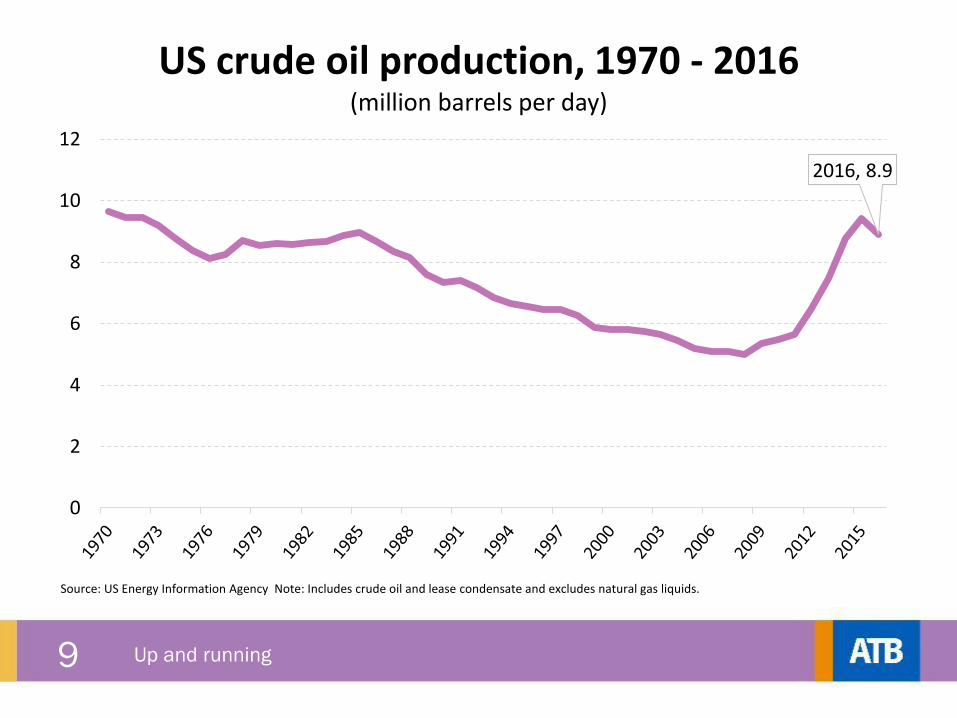
2016, 8.9
0
2
4
6
8
10
12
Source: US Energy Information Agency Note: Includes crude oil and lease condensate and excludes natural gas liquids.
US crude oil production, 1970 - 2016(million barrels per day)
10 Up and running
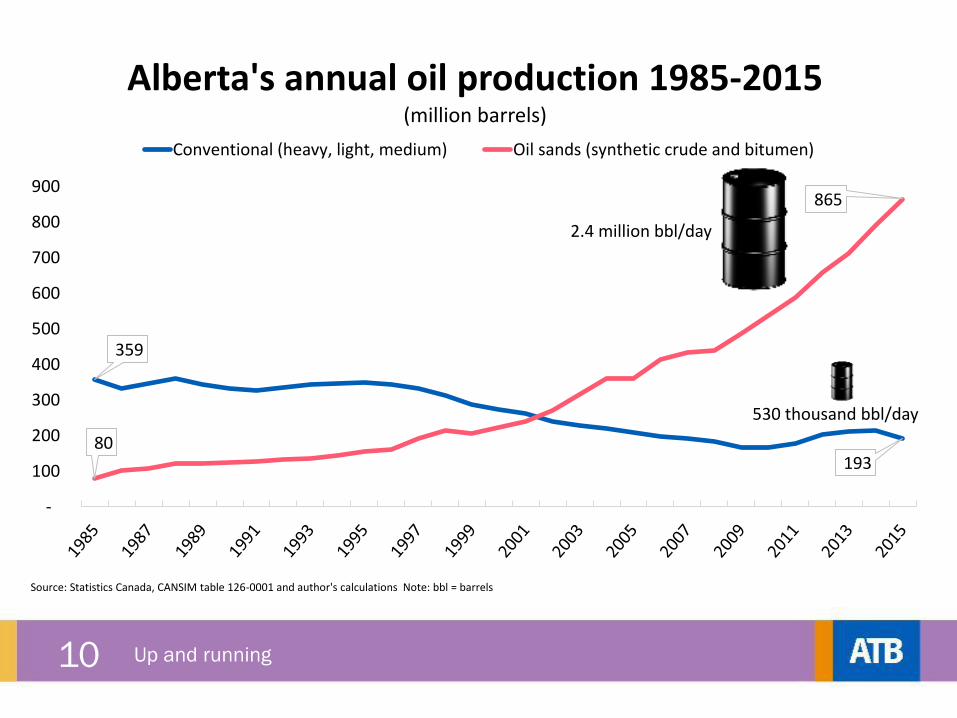
359
193 80
865
-
100
200
300
400
500
600
700
800
900
Source: Statistics Canada, CANSIM table 126-0001 and author's calculations Note: bbl = barrels
Alberta's annual oil production 1985-2015(million barrels)
Conventional (heavy, light, medium) Oil sands (synthetic crude and bitumen)
2.4 million bbl/day
530 thousand bbl/day
11 Up and running
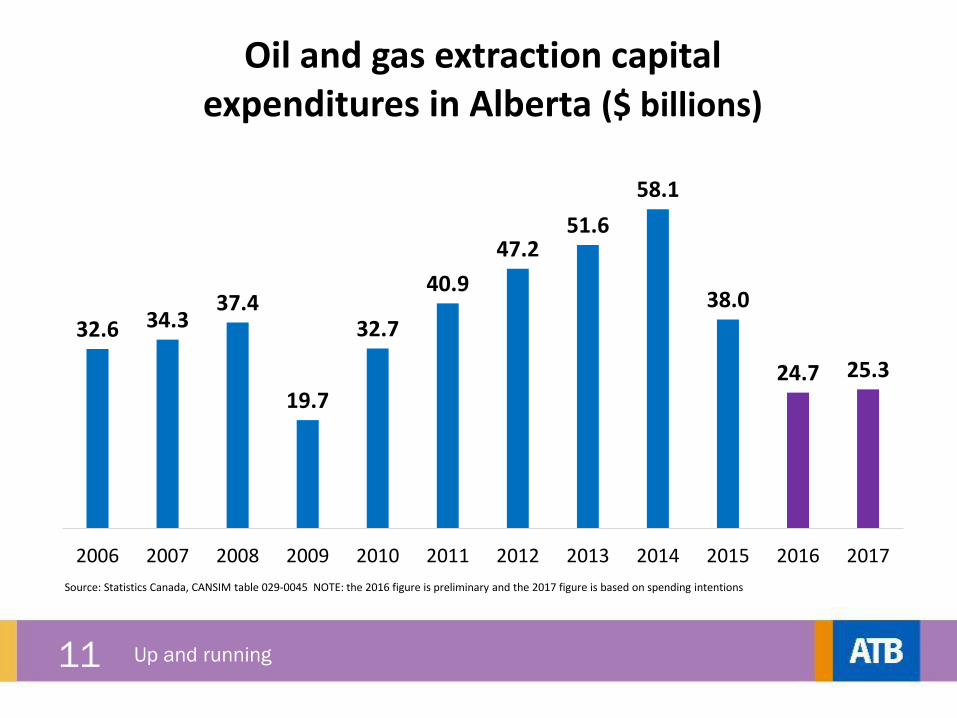
32.6 34.337.4
19.7
32.7
40.9
47.251.6
58.1
38.0
24.7 25.3
2006 2007 2008 2009 2010 2011 2012 2013 2014 2015 2016 2017
Source: Statistics Canada, CANSIM table 029-0045 NOTE: the 2016 figure is preliminary and the 2017 figure is based on spending intentions
Oil and gas extraction capital expenditures in Alberta ($ billions)
12 Up and running
0
5
10
15
20
25
30
35
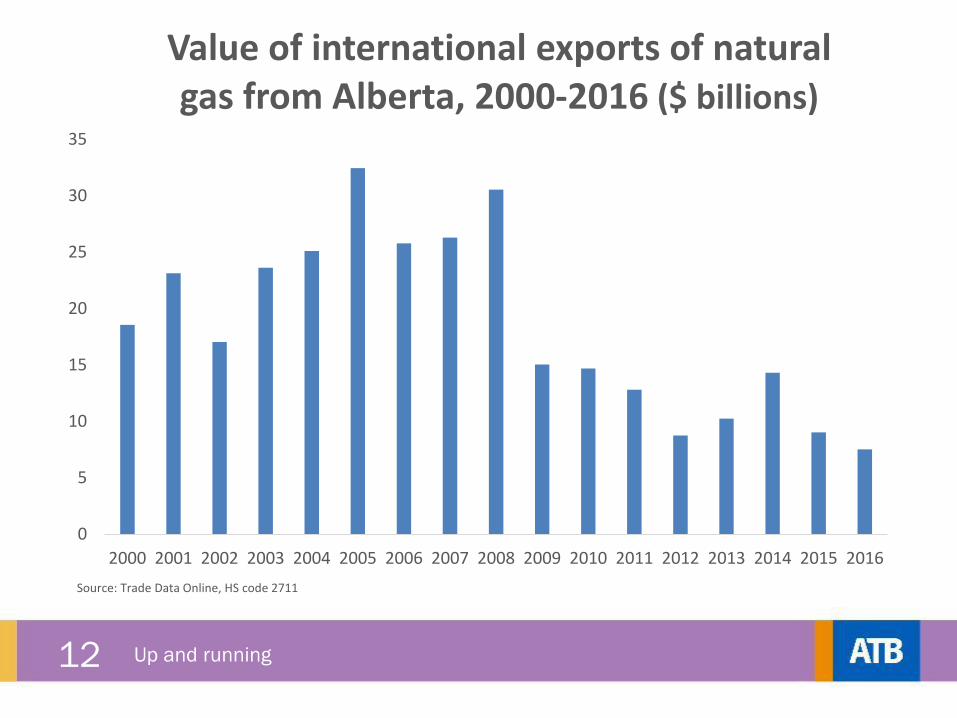
2000 2001 2002 2003 2004 2005 2006 2007 2008 2009 2010 2011 2012 2013 2014 2015 2016
Source: Trade Data Online, HS code 2711
Value of international exports of natural gas from Alberta, 2000-2016 ($ billions)
13 Up and running
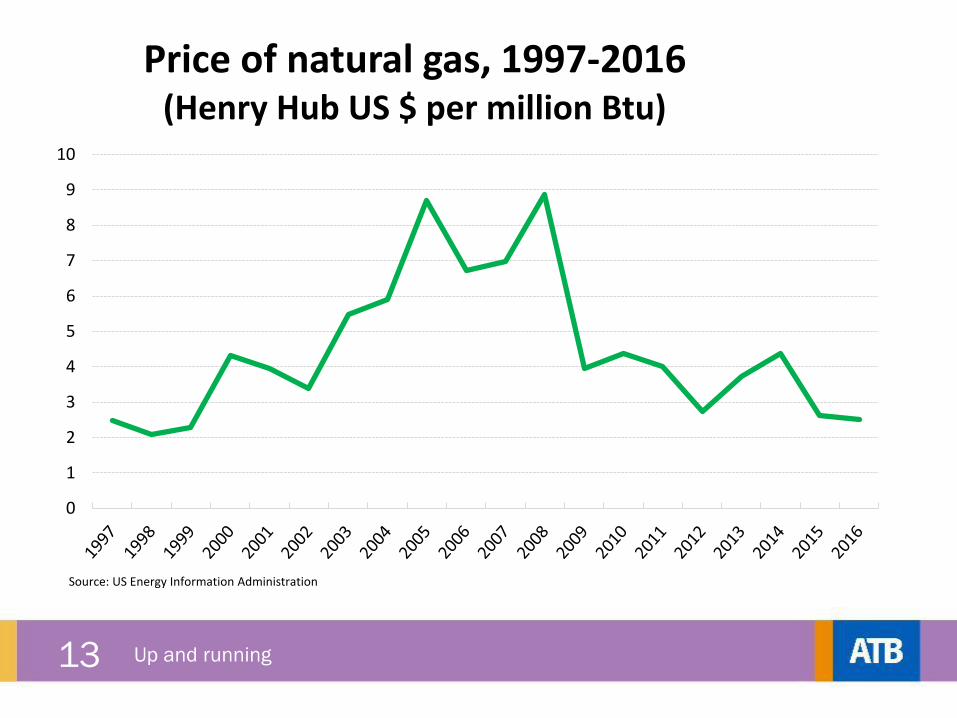
0
1
2
3
4
5
6
7
8
9
10
Source: US Energy Information Administration
Price of natural gas, 1997-2016 (Henry Hub US $ per million Btu)
14 Up and running
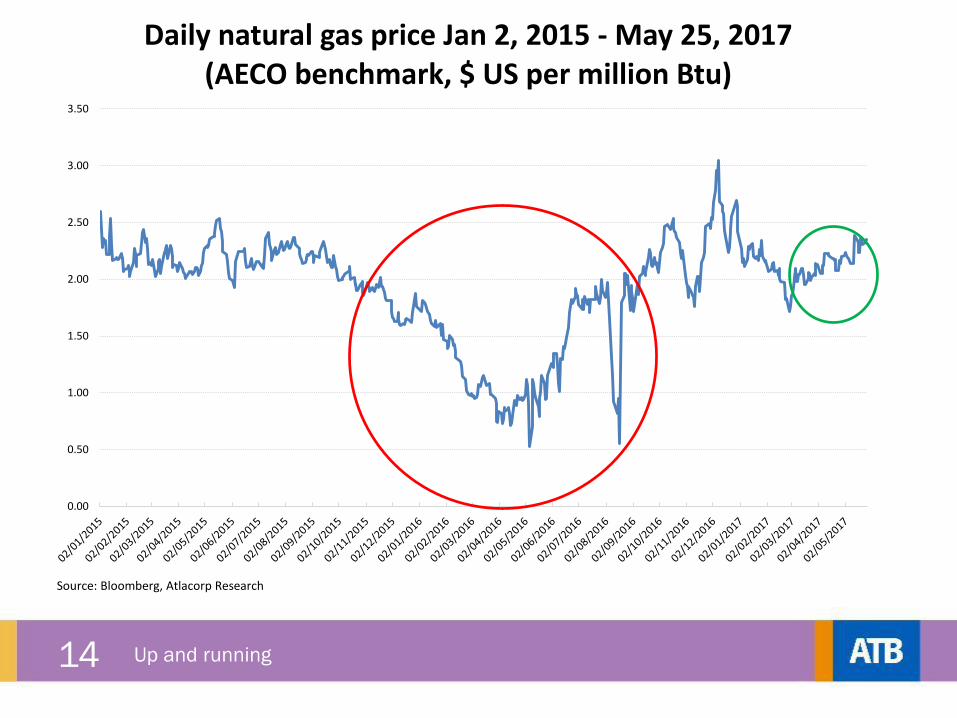
0.00
0.50
1.00
1.50
2.00
2.50
3.00
3.50
Source: Bloomberg, Atlacorp Research
Daily natural gas price Jan 2, 2015 - May 25, 2017(AECO benchmark, $ US per million Btu)
15 Up and running
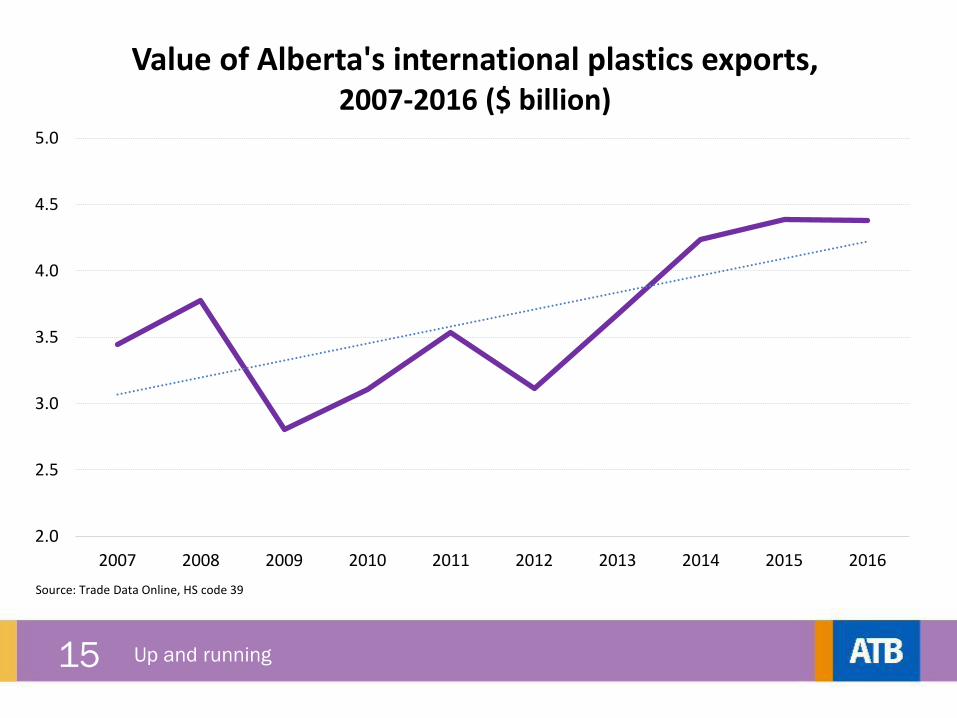
2.0
2.5
3.0
3.5
4.0
4.5
5.0
2007 2008 2009 2010 2011 2012 2013 2014 2015 2016
Source: Trade Data Online, HS code 39
Value of Alberta's international plastics exports, 2007-2016 ($ billion)
16 Up and running
17 Up and running
$1,060
$1,080
$1,100
$1,120
$1,140
$1,160
$1,180
$1,200
Jan
-14
Feb
-14
Mar
-14
Ap
r-1
4
May
-14
Jun
-14
Jul-
14
Au
g-1
4
Sep
-14
Oct
-14
No
v-1
4
Dec
-14
Jan
-15
Feb
-15
Mar
-15
Ap
r-1
5
May
-15
Jun
-15
Jul-
15
Au
g-1
5
Sep
-15
Oct
-15
No
v-1
5
Dec
-15
Jan
-16
Feb
-16
Mar
-16
Ap
r-1
6
May
-16
Jun
-16
Jul-
16
Au
g-1
6
Sep
-16
Oct
-16
No
v-1
6
Dec
-16
Jan
-17
Feb
-17
Mar
-17
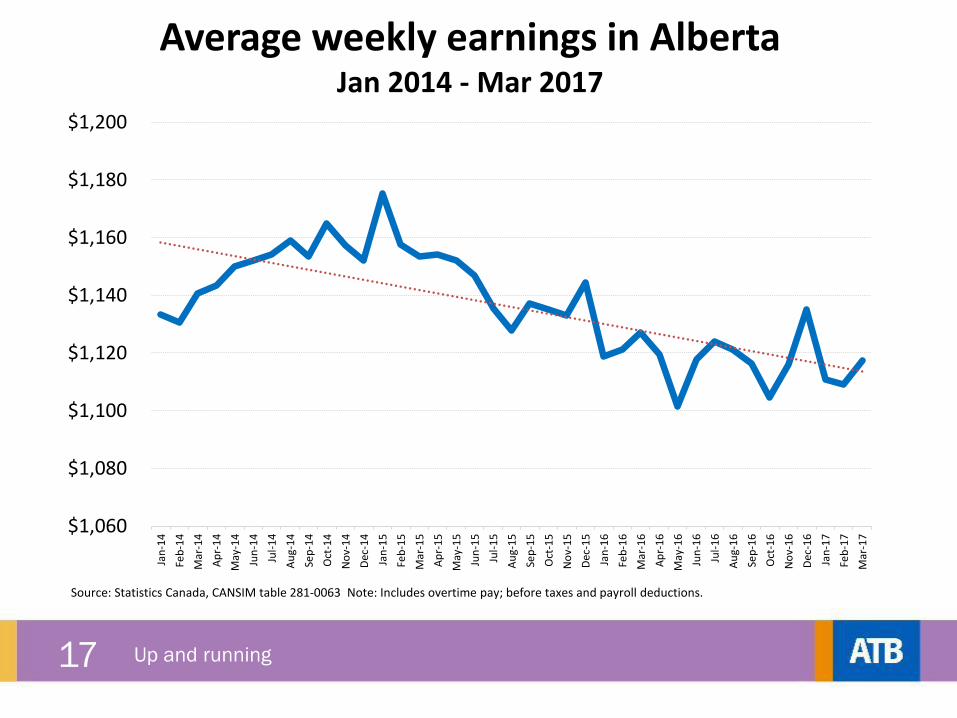
Source: Statistics Canada, CANSIM table 281-0063 Note: Includes overtime pay; before taxes and payroll deductions.
Average weekly earnings in AlbertaJan 2014 - Mar 2017
18 Up and running
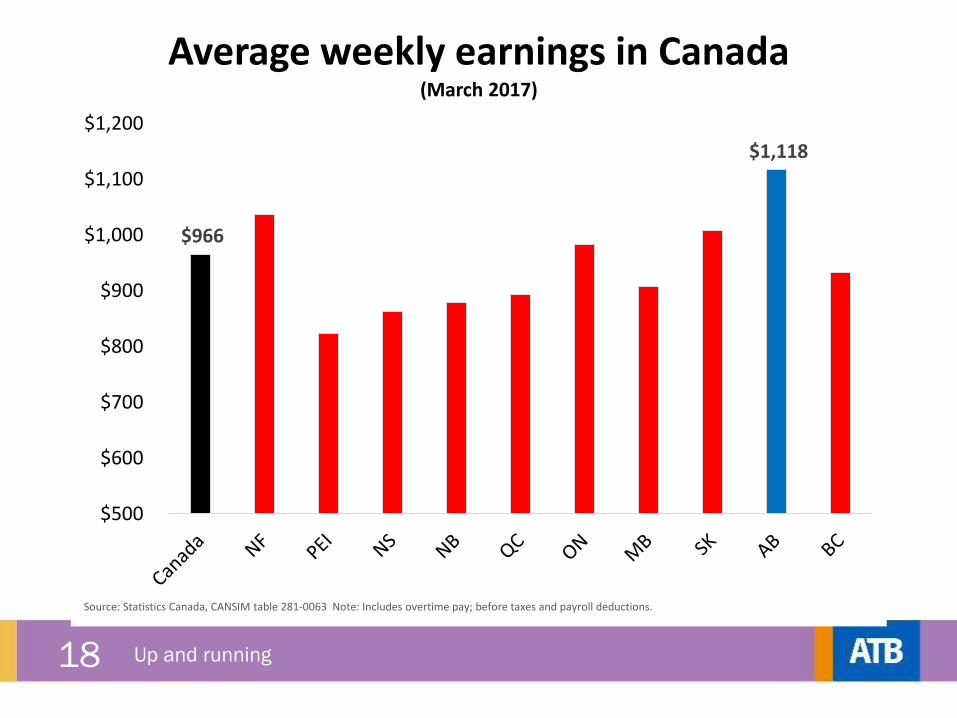
$966
$1,118
$500
$600
$700
$800
$900
$1,000
$1,100
$1,200
Source: Statistics Canada, CANSIM table 281-0063 Note: Includes overtime pay; before taxes and payroll deductions.
Average weekly earnings in Canada(March 2017)
19 Up and running
20 Up and running
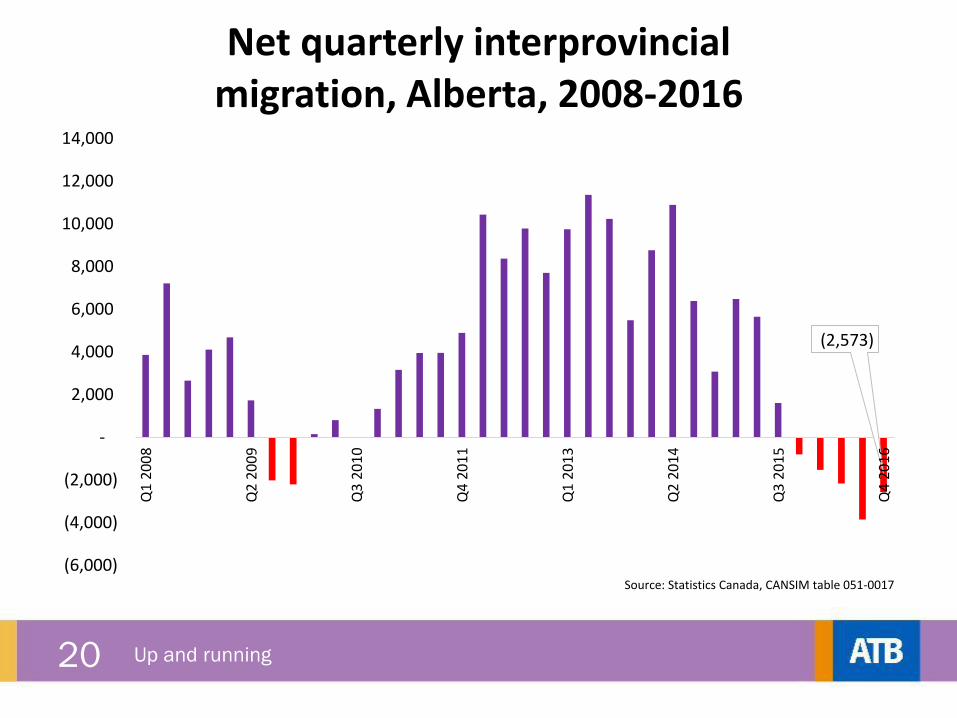
(2,573)
(6,000)
(4,000)
(2,000)
-
2,000
4,000
6,000
8,000
10,000
12,000
14,000Q
1 2
00
8
Q2
20
09
Q3
20
10
Q4
20
11
Q1
20
13
Q2
20
14
Q3
20
15
Q4
20
16
Source: Statistics Canada, CANSIM table 051-0017
Net quarterly interprovincial migration, Alberta, 2008-2016
21 Up and running
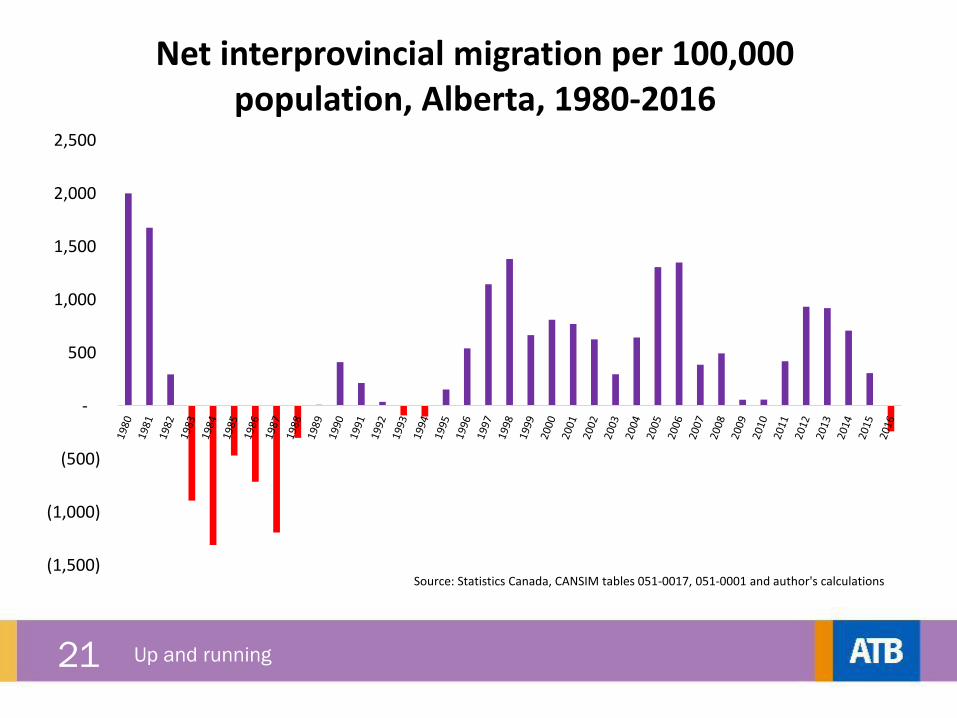
(1,500)
(1,000)
(500)
-
500
1,000
1,500
2,000
2,500
Source: Statistics Canada, CANSIM tables 051-0017, 051-0001 and author's calculations
Net interprovincial migration per 100,000 population, Alberta, 1980-2016
22 Up and running
23 Up and running
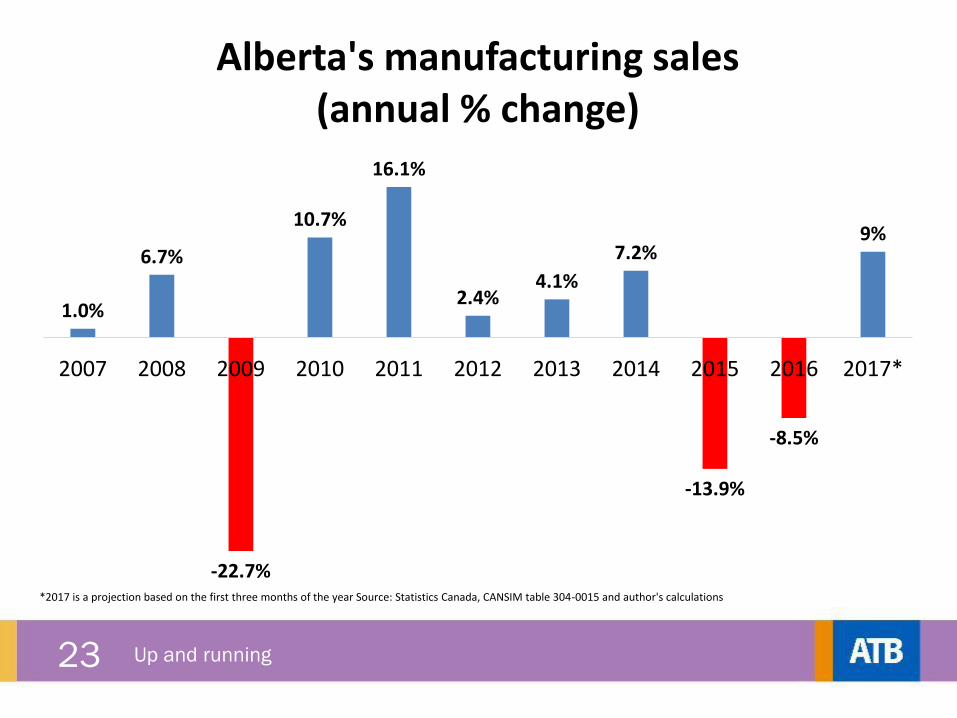
1.0%
6.7%
-22.7%
10.7%
16.1%
2.4%4.1%
7.2%
-13.9%
-8.5%
9%
2007 2008 2009 2010 2011 2012 2013 2014 2015 2016 2017*
*2017 is a projection based on the first three months of the year Source: Statistics Canada, CANSIM table 304-0015 and author's calculations
Alberta's manufacturing sales(annual % change)
24 Up and running
25 Up and running
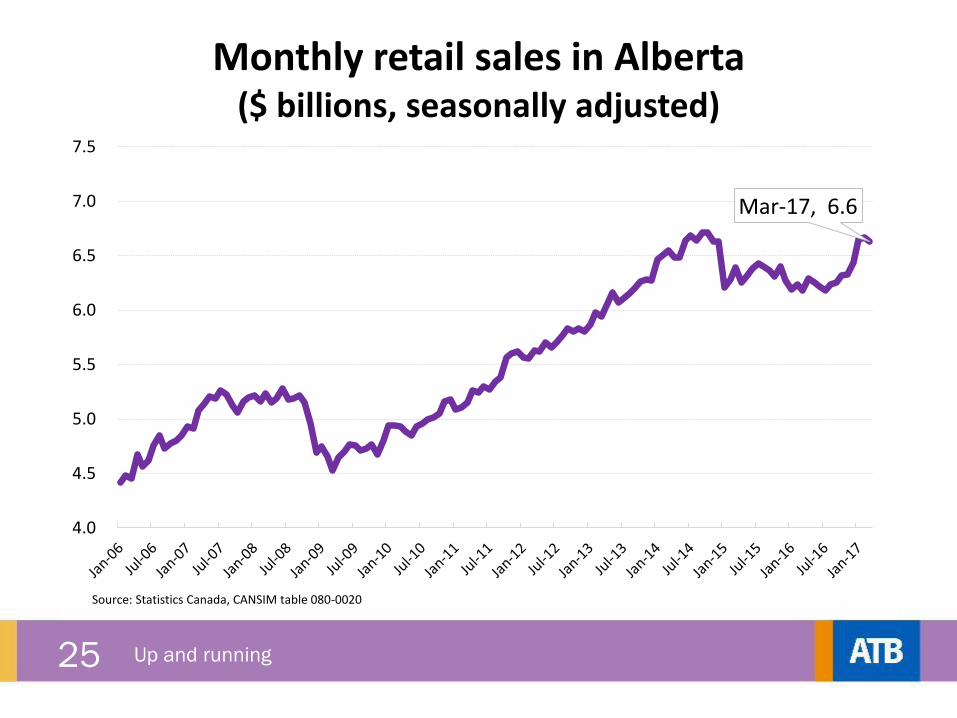
Mar-17, 6.6
4.0
4.5
5.0
5.5
6.0
6.5
7.0
7.5
Source: Statistics Canada, CANSIM table 080-0020
Monthly retail sales in Alberta ($ billions, seasonally adjusted)
26 Up and running
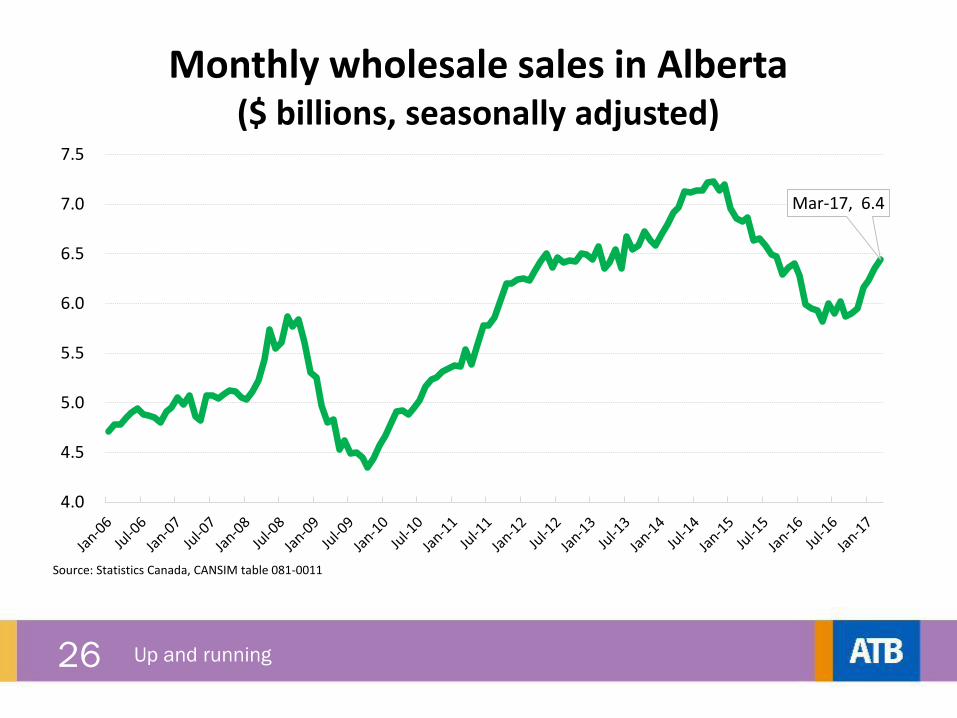
Mar-17, 6.4
4.0
4.5
5.0
5.5
6.0
6.5
7.0
7.5
Source: Statistics Canada, CANSIM table 081-0011
Monthly wholesale sales in Alberta ($ billions, seasonally adjusted)
27 Up and running
28 Up and running
-
10,000
20,000
30,000
40,000
50,000
60,000
2006 2007 2008 2009 2010 2011 2012 2013 2014 2015 2016 2017 2018 2019
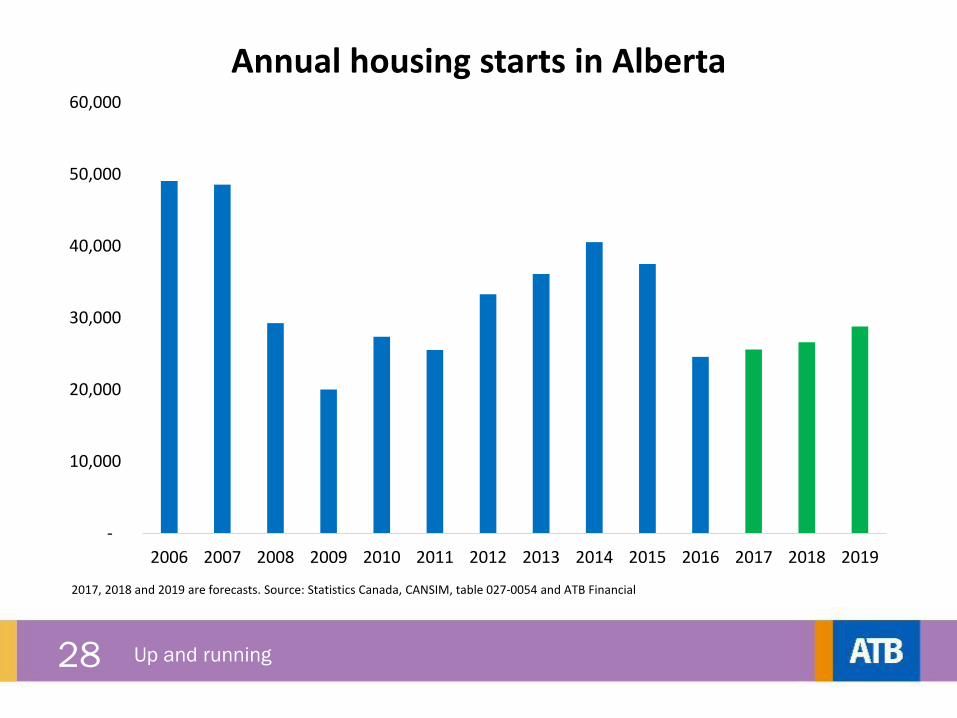
2017, 2018 and 2019 are forecasts. Source: Statistics Canada, CANSIM, table 027-0054 and ATB Financial
Annual housing starts in Alberta
29 Up and running
30 Up and running
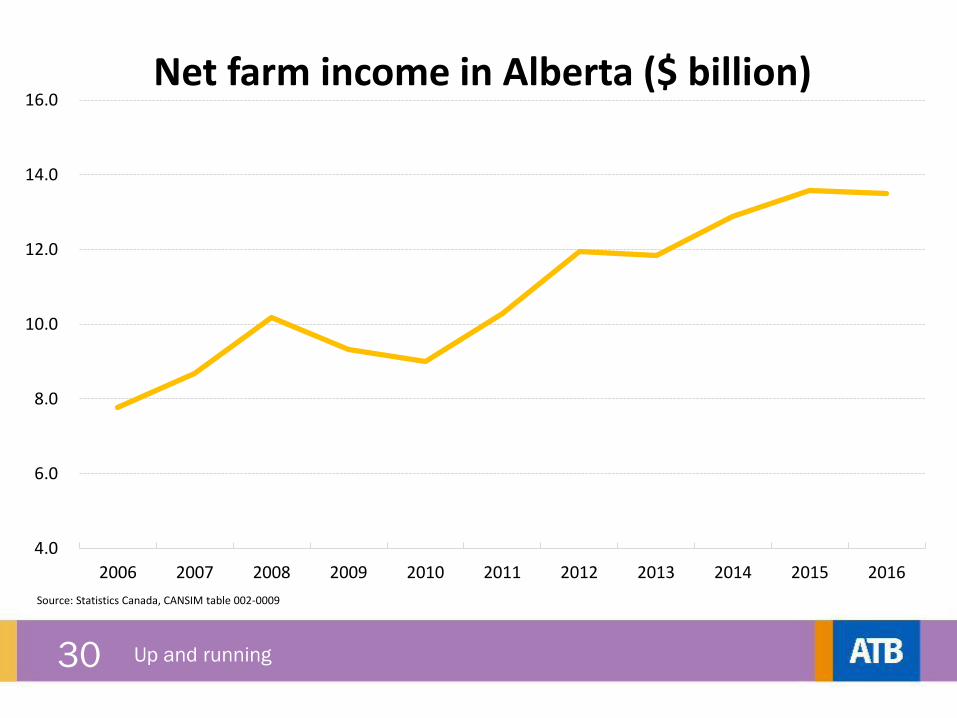
4.0
6.0
8.0
10.0
12.0
14.0
16.0
2006 2007 2008 2009 2010 2011 2012 2013 2014 2015 2016
Source: Statistics Canada, CANSIM table 002-0009
Net farm income in Alberta ($ billion)
31 Up and running
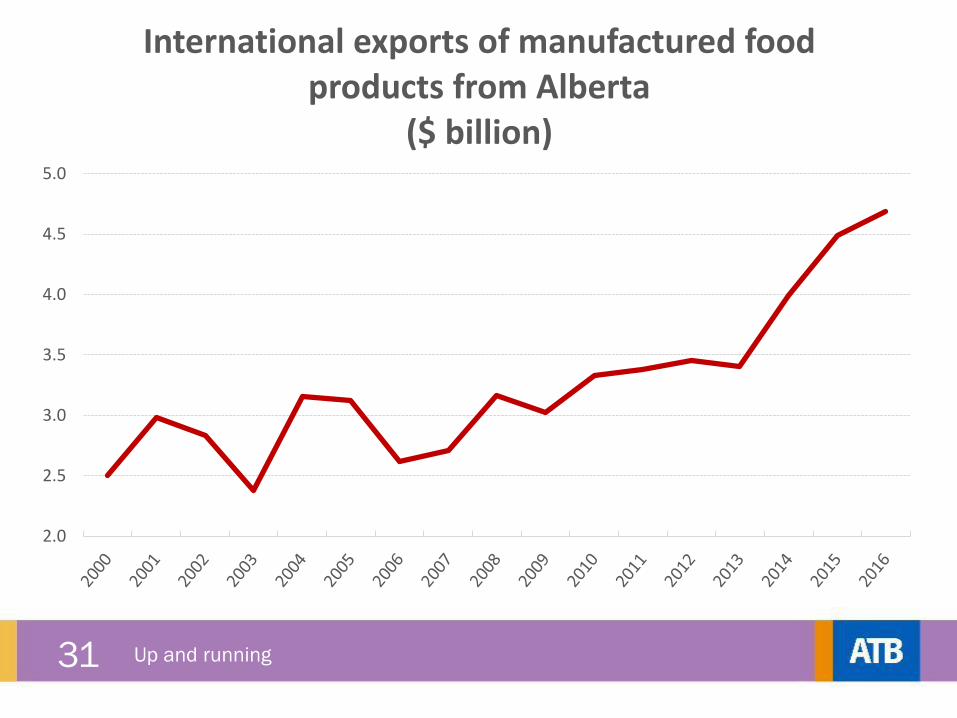
2.0
2.5
3.0
3.5
4.0
4.5
5.0
International exports of manufactured food products from Alberta
($ billion)
32 Up and running
33 Up and running
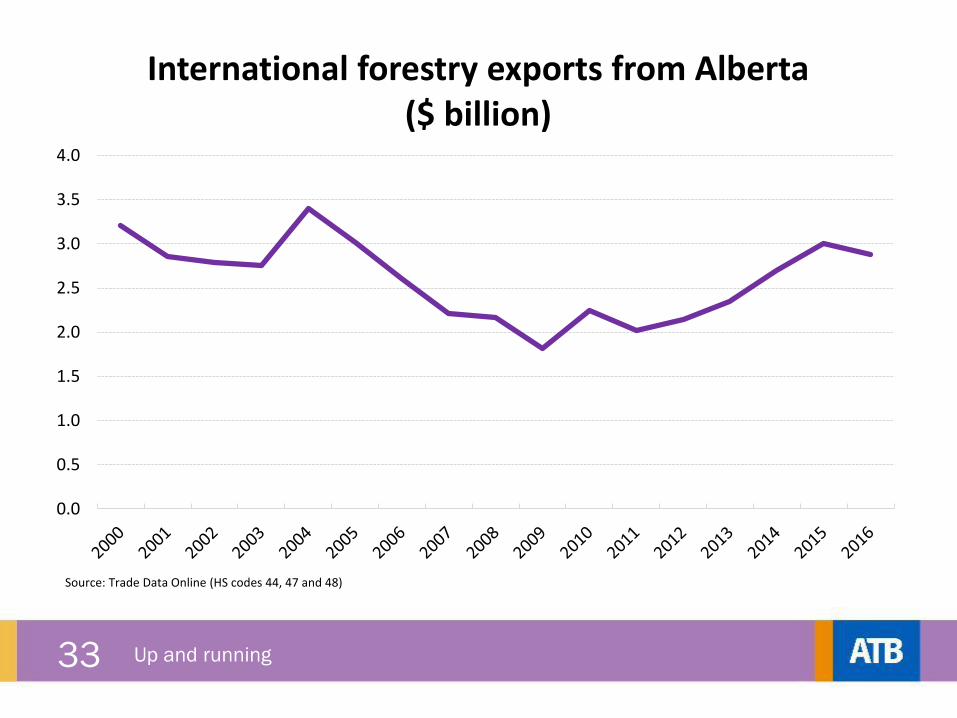
0.0
0.5
1.0
1.5
2.0
2.5
3.0
3.5
4.0
Source: Trade Data Online (HS codes 44, 47 and 48)
International forestry exports from Alberta ($ billion)
34 Up and running
35 Up and running
36 Up and running
37 Up and running
My latest book with
ATB’s Chief Economist
Todd Hirsch!
Ask me about
purchasing a copy or
visit
toddhirsch.com
38 Up and running
▸ The Owl
▸ Perch
▸@RobRoachCalgary
▸ RobRoachCalgary
▸ ATB.com/economics
Connect