Embed Size (px)
Citation preview
Discla imer: This mater ial that fol lows is a presentat ion of general background informat ion about the Bank’s act iv i t ies current at the date of the presentat ion. It is informat ion
given in summary form and does not purport to be complete. It is not to be rel ied upon as advice to investors or potentia l investors and does not take into account the
investment object ives, f inancial s ituat ion or needs of any part icular investor . This mater ial should be considered with professional advice when decid ing if an investment is
appropriate. UOB accepts no liabil ity whatsoever with respect to the use of this document or its content.
UOB Group Performance Backed by Healthy Growth Momentum and
Strong Balance Sheet
February 2018
Private & Confidential
Agenda
1. Overview of UOB Group
2. Macroeconomic Outlook
3. Strong UOB Fundamentals
4. Our Growth Drivers
5. Latest Financials
Overview of UOB Group
3
UOB Overview
4
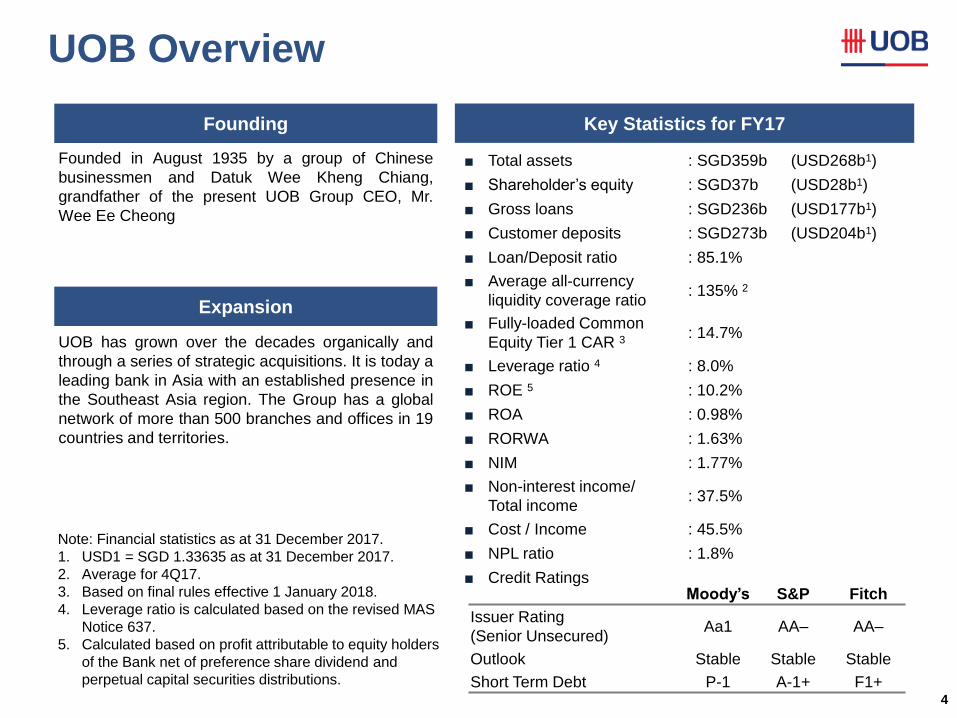
UOB has grown over the decades organically and
through a series of strategic acquisitions. It is today a
leading bank in Asia with an established presence in
the Southeast Asia region. The Group has a global
network of more than 500 branches and offices in 19
countries and territories.
Founding Key Statistics for FY17
Expansion
Founded in August 1935 by a group of Chinese
businessmen and Datuk Wee Kheng Chiang,
grandfather of the present UOB Group CEO, Mr.
Wee Ee Cheong
Note: Financial statistics as at 31 December 2017.
1. USD1 = SGD 1.33635 as at 31 December 2017.
2. Average for 4Q17.
3. Based on final rules effective 1 January 2018.
4. Leverage ratio is calculated based on the revised MAS
Notice 637.
5. Calculated based on profit attributable to equity holders
of the Bank net of preference share dividend and
perpetual capital securities distributions.
Moody’s S&P Fitch
Issuer Rating
(Senior Unsecured) Aa1 AA– AA–
Outlook Stable Stable Stable
Short Term Debt P-1 A-1+ F1+
■ Total assets : SGD359b (USD268b1)
■ Shareholder’s equity : SGD37b (USD28b1)
■ Gross loans : SGD236b (USD177b1)
■ Customer deposits : SGD273b (USD204b1)
■ Loan/Deposit ratio : 85.1%
■ Average all-currency
liquidity coverage ratio : 135% 2
■ Fully-loaded Common
Equity Tier 1 CAR 3 : 14.7%
■ Leverage ratio 4 : 8.0%
■ ROE 5 : 10.2%
■ ROA : 0.98%
■ RORWA : 1.63%
■ NIM : 1.77%
■ Non-interest income/
Total income : 37.5%
■ Cost / Income : 45.5%
■ NPL ratio : 1.8%
■ Credit Ratings
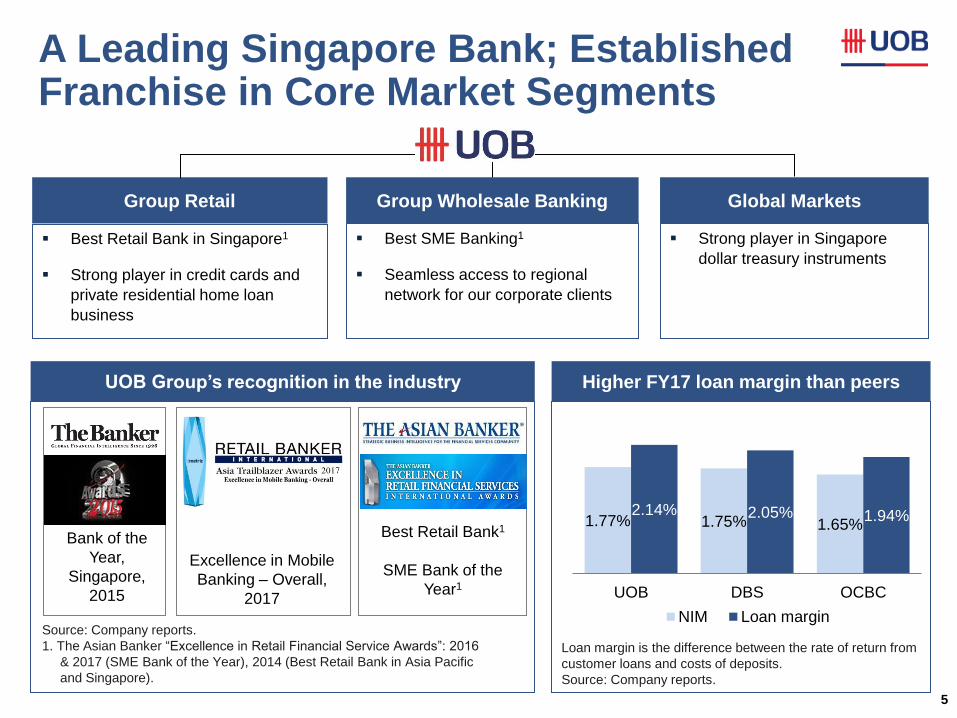
A Leading Singapore Bank; Established Franchise in Core Market Segments
5
Best Retail Bank in Singapore1
Strong player in credit cards and
private residential home loan
business
Best SME Banking1
Seamless access to regional
network for our corporate clients
Strong player in Singapore
dollar treasury instruments
Group Retail Group Wholesale Banking Global Markets
Best Retail Bank1
SME Bank of the
Year1
Bank of the
Year,
Singapore,
2015
UOB Group’s recognition in the industry Higher FY17 loan margin than peers
Source: Company reports.
1. The Asian Banker “Excellence in Retail Financial Service Awards”: 2016
& 2017 (SME Bank of the Year), 2014 (Best Retail Bank in Asia Pacific
and Singapore).
Excellence in Mobile
Banking – Overall,
2017 33% 58%
41% 1.77% 1.75% 1.65%
2.14% 2.05% 1.94%
UOB DBS OCBC
NIM Loan margin
Loan margin is the difference between the rate of return from
customer loans and costs of deposits.
Source: Company reports.
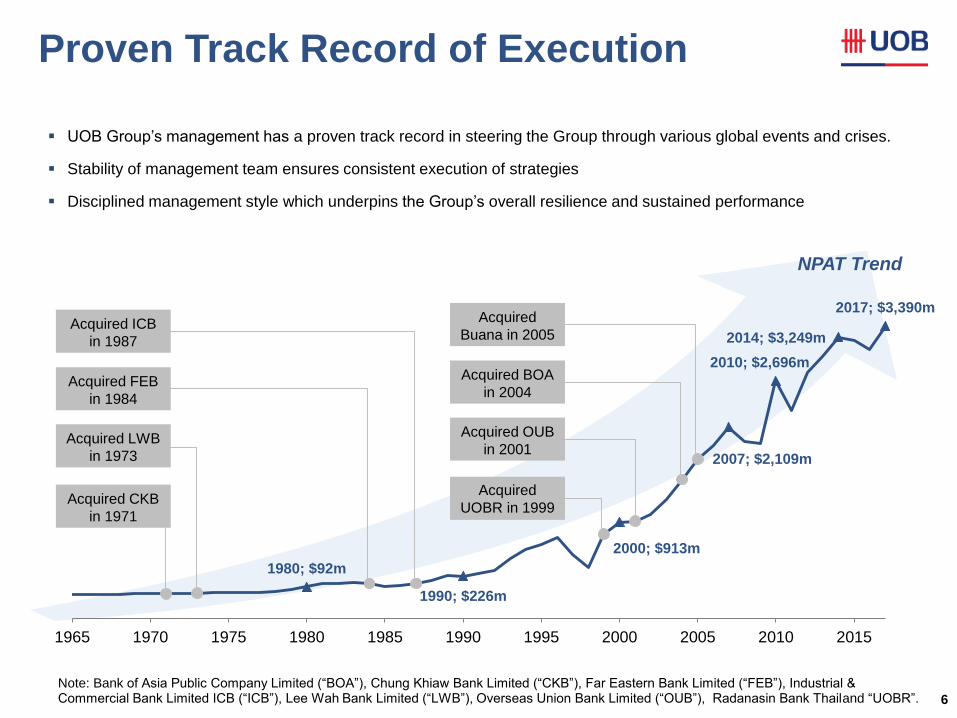
1980; $92m
1990; $226m
2000; $913m
2007; $2,109m
2010; $2,696m
2014; $3,249m
2017; $3,390m
1965 1970 1975 1980 1985 1990 1995 2000 2005 2010 2015
Proven Track Record of Execution
6
UOB Group’s management has a proven track record in steering the Group through various global events and crises.
Stability of management team ensures consistent execution of strategies
Disciplined management style which underpins the Group’s overall resilience and sustained performance
Acquired
UOBR in 1999
Acquired BOA
in 2004
Acquired OUB
in 2001
Acquired CKB
in 1971
Acquired LWB
in 1973
Acquired FEB
in 1984
Acquired ICB
in 1987
Acquired
Buana in 2005
Note: Bank of Asia Public Company Limited (“BOA”), Chung Khiaw Bank Limited (“CKB”), Far Eastern Bank Limited (“FEB”), Industrial & Commercial Bank Limited ICB (“ICB”), Lee Wah Bank Limited (“LWB”), Overseas Union Bank Limited (“OUB”), Radanasin Bank Thailand “UOBR”.
NPAT Trend
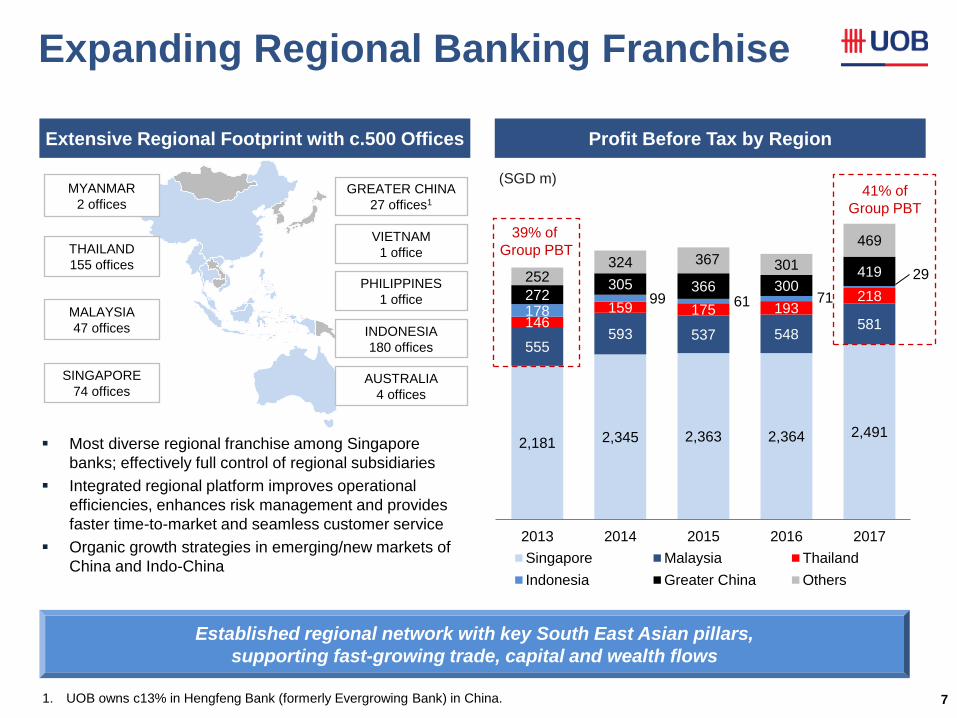
Expanding Regional Banking Franchise
7
SINGAPORE
74 offices
THAILAND
155 offices
MALAYSIA
47 offices INDONESIA
180 offices
VIETNAM
1 office
GREATER CHINA
27 offices1
Established regional network with key South East Asian pillars,
supporting fast-growing trade, capital and wealth flows
Profit Before Tax by Region Extensive Regional Footprint with c.500 Offices
Most diverse regional franchise among Singapore
banks; effectively full control of regional subsidiaries
Integrated regional platform improves operational
efficiencies, enhances risk management and provides
faster time-to-market and seamless customer service
Organic growth strategies in emerging/new markets of
China and Indo-China
(SGD m) MYANMAR
2 offices
2,181 2,345 2,363 2,364 2,491
555 593 537 548
581 146 159 175 193
218 178
99 61 71
29
272 305 366 300
419 252 324 367 301
469
2013 2014 2015 2016 2017
Singapore Malaysia Thailand
Indonesia Greater China Others
39% of
Group PBT
41% of
Group PBT
1. UOB owns c13% in Hengfeng Bank (formerly Evergrowing Bank) in China.
AUSTRALIA
4 offices
PHILIPPINES
1 office
Why UOB?
8
Integrated Regional
Platform
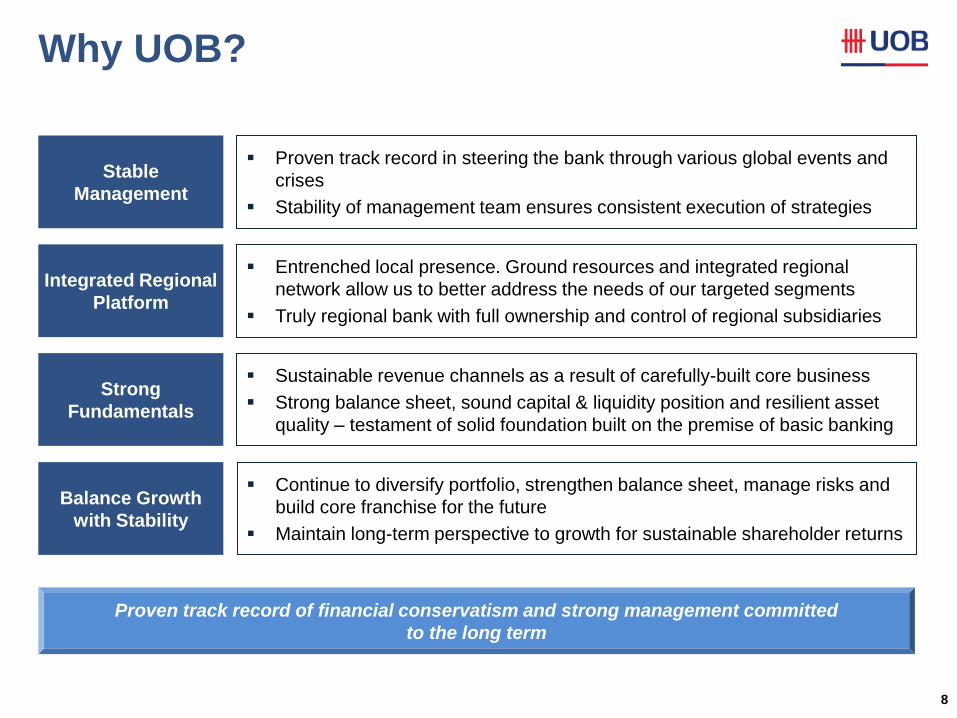
Entrenched local presence. Ground resources and integrated regional
network allow us to better address the needs of our targeted segments
Truly regional bank with full ownership and control of regional subsidiaries
Stable
Management
Proven track record in steering the bank through various global events and
crises
Stability of management team ensures consistent execution of strategies
Strong
Fundamentals
Sustainable revenue channels as a result of carefully-built core business
Strong balance sheet, sound capital & liquidity position and resilient asset
quality – testament of solid foundation built on the premise of basic banking
Balance Growth
with Stability
Continue to diversify portfolio, strengthen balance sheet, manage risks and
build core franchise for the future
Maintain long-term perspective to growth for sustainable shareholder returns
Proven track record of financial conservatism and strong management committed
to the long term
Macroeconomic Outlook
9
0
5
10
15
20
Dec-12 Dec-13 Dec-14 Dec-15 Dec-16 Dec-17
RMB loans Other financing
50
100
150
200
Feb-13 Feb-14 Feb-15 Feb-16 Feb-17 Feb-18
SSE Index 3m SHIBOR CNY/USD
5.2 3.7 2.6
4.3 3.6 3.9
9.9 7.6 6.8
2008 - 2011 2012 - 2014 2015 - 2017
Primary Secondary Tertiary Total
China’s Growth Slower but Low Risk of Hard Landing
10
46
202 87 96 66
163
102
82 73 54
47
57
87 78 53
256
361
256 247 173
China Japan UK US Germany
Government debt Corporate debt Household debt
New Financing Increasingly from Banking Sector
Structural Shift of China’s Economy
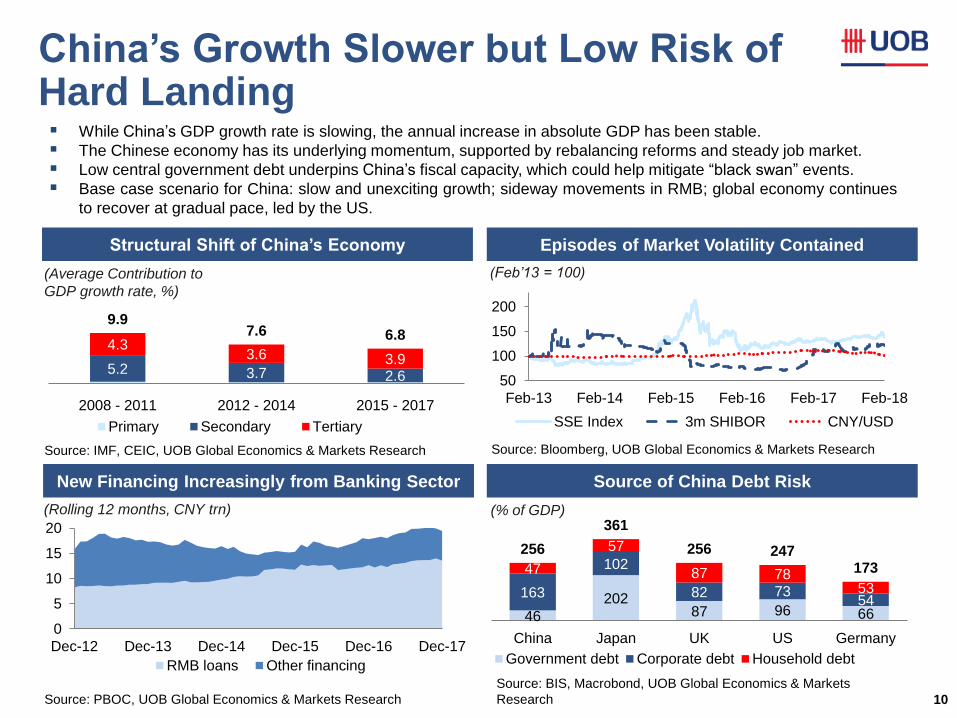
While China’s GDP growth rate is slowing, the annual increase in absolute GDP has been stable.
The Chinese economy has its underlying momentum, supported by rebalancing reforms and steady job market.
Low central government debt underpins China’s fiscal capacity, which could help mitigate “black swan” events.
Base case scenario for China: slow and unexciting growth; sideway movements in RMB; global economy continues
to recover at gradual pace, led by the US.
Source: IMF, CEIC, UOB Global Economics & Markets Research
(Average Contribution to
GDP growth rate, %)
Source: PBOC, UOB Global Economics & Markets Research
(Rolling 12 months, CNY trn)
Episodes of Market Volatility Contained
Source of China Debt Risk
(Feb’13 = 100)
Source: Bloomberg, UOB Global Economics & Markets Research
(% of GDP)
Source: BIS, Macrobond, UOB Global Economics & Markets
Research
Update until
2018f, if
available
Update Dec
2017 to the
latest dataset, if
available
Provide daily
data set from
2010 onwards
Update 2016 to
the latest
dataset, if
available
Brexit Impact on Asian Markets via Trade and Investment Channels
11
21
%
18
%
11
%
10
%
9%
5%
4%
3%
2%
1%
20
%
16
%
13
%
11
%
8%
4%
6%
3%
3%
2%
AS
EA
N
Chin
a
US
EU
28
Ja
pa
n
Sou
thK
ore
a
HK
Ind
ia
Austr
alia UK
Total trade Exports
17% 19%
16% 16%
10% 10% 8%
3% 4% 3% 3% 2% 1% 3%
HK USA India China ASEAN Japan Canada
To EU To UK
28
%
16
%
10
%
10
%
6%
5%
17
%
18
%
19
%
12
%
3%
5%
33
%
25
%
12
%
12
%
10
%
10
%
EU28 ASEAN USA Japan HongKong
China
2014 2015 2016
ASEAN’s Net FDI Flows by Key Partners
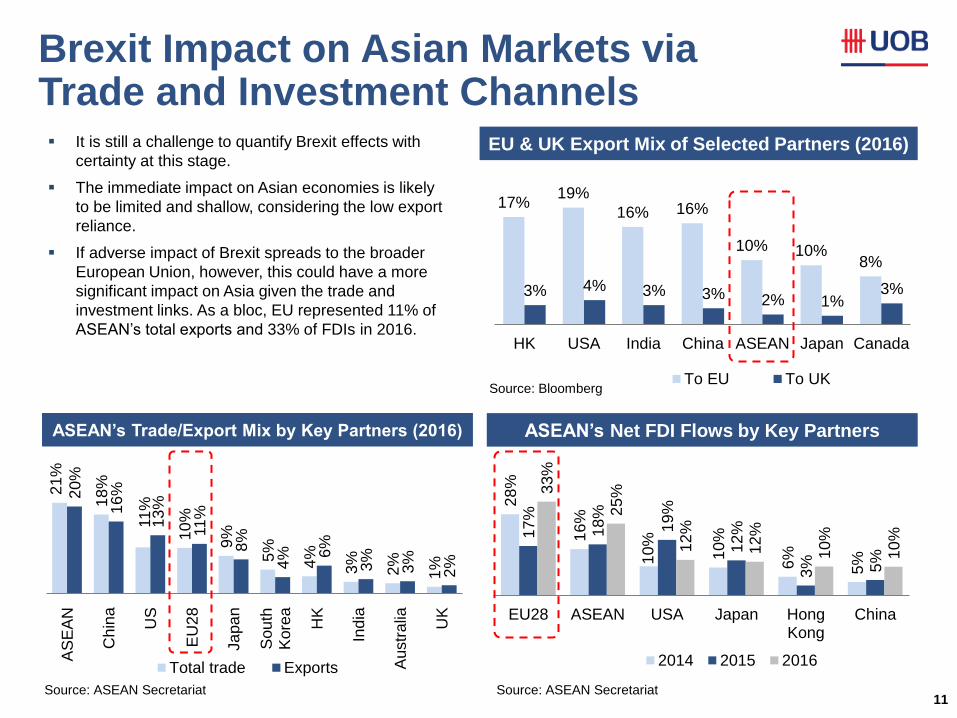
EU & UK Export Mix of Selected Partners (2016)
Source: Bloomberg
Source: ASEAN Secretariat
ASEAN’s Trade/Export Mix by Key Partners (2016)
Source: ASEAN Secretariat
Update 2016 to
the latest
dataset, if
available
Update 2016 to
the latest
dataset, if
available
Update 2016 to
the latest
dataset, if
available
It is still a challenge to quantify Brexit effects with
certainty at this stage.
The immediate impact on Asian economies is likely
to be limited and shallow, considering the low export
reliance.
If adverse impact of Brexit spreads to the broader
European Union, however, this could have a more
significant impact on Asia given the trade and
investment links. As a bloc, EU represented 11% of
ASEAN’s total exports and 33% of FDIs in 2016.
Implication on Regional Policy Rates
12 Sources: UOB Global Economics & Markets Research forecasts
Update where
relevant
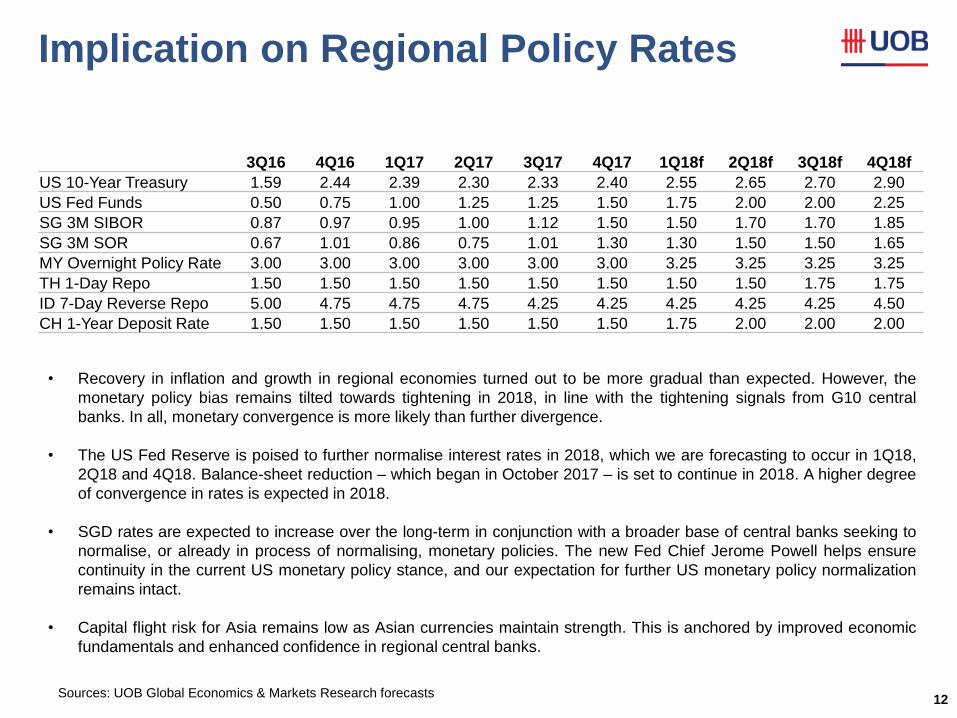
3Q16 4Q16 1Q17 2Q17 3Q17 4Q17 1Q18f 2Q18f 3Q18f 4Q18f
US 10-Year Treasury 1.59 2.44 2.39 2.30 2.33 2.40 2.55 2.65 2.70 2.90
US Fed Funds 0.50 0.75 1.00 1.25 1.25 1.50 1.75 2.00 2.00 2.25
SG 3M SIBOR 0.87 0.97 0.95 1.00 1.12 1.50 1.50 1.70 1.70 1.85
SG 3M SOR 0.67 1.01 0.86 0.75 1.01 1.30 1.30 1.50 1.50 1.65
MY Overnight Policy Rate 3.00 3.00 3.00 3.00 3.00 3.00 3.25 3.25 3.25 3.25
TH 1-Day Repo 1.50 1.50 1.50 1.50 1.50 1.50 1.50 1.50 1.75 1.75
ID 7-Day Reverse Repo 5.00 4.75 4.75 4.75 4.25 4.25 4.25 4.25 4.25 4.50
CH 1-Year Deposit Rate 1.50 1.50 1.50 1.50 1.50 1.50 1.75 2.00 2.00 2.00
• Recovery in inflation and growth in regional economies turned out to be more gradual than expected. However, the
monetary policy bias remains tilted towards tightening in 2018, in line with the tightening signals from G10 central
banks. In all, monetary convergence is more likely than further divergence.
• The US Fed Reserve is poised to further normalise interest rates in 2018, which we are forecasting to occur in 1Q18,
2Q18 and 4Q18. Balance-sheet reduction – which began in October 2017 – is set to continue in 2018. A higher degree
of convergence in rates is expected in 2018.
• SGD rates are expected to increase over the long-term in conjunction with a broader base of central banks seeking to
normalise, or already in process of normalising, monetary policies. The new Fed Chief Jerome Powell helps ensure
continuity in the current US monetary policy stance, and our expectation for further US monetary policy normalization
remains intact.
• Capital flight risk for Asia remains low as Asian currencies maintain strength. This is anchored by improved economic
fundamentals and enhanced confidence in regional central banks.
Southeast Asia: Resilient Key Markets
13
Lower Debt to Equity Ratio
Significantly Higher Foreign Reserves Healthier Current Account Balances
Lower Foreign Currency Loan Mix
Update 2017 to
the latest
dataset (see
excel file within)
Update Oct’17
to the latest
dataset (see
excel file within)
Update 2017e to
the latest
dataset (see
excel file within)
Update 2017 to
the latest
dataset (see
excel file within)
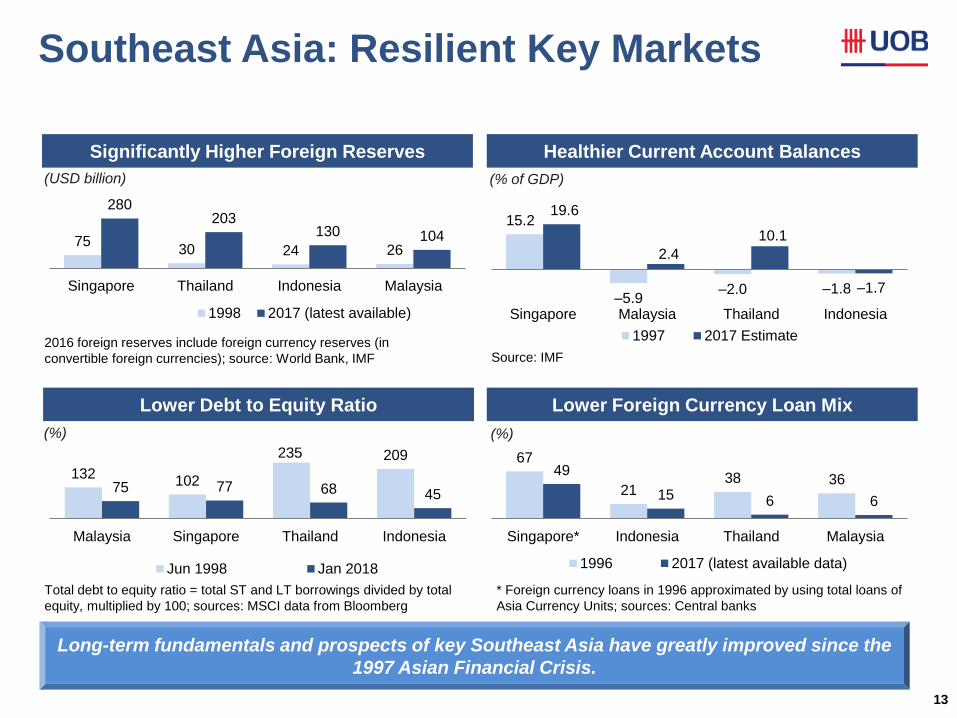
2016 foreign reserves include foreign currency reserves (in
convertible foreign currencies); source: World Bank, IMF
(USD billion)
Total debt to equity ratio = total ST and LT borrowings divided by total
equity, multiplied by 100; sources: MSCI data from Bloomberg
(%)
(% of GDP)
Source: IMF
(%)
* Foreign currency loans in 1996 approximated by using total loans of
Asia Currency Units; sources: Central banks
Long-term fundamentals and prospects of key Southeast Asia have greatly improved since the
1997 Asian Financial Crisis.
132 102
235 209
75 77 68 45
Malaysia Singapore Thailand Indonesia
Jun 1998 Jan 2018
67
21 38 36
49
15 6 6
Singapore* Indonesia Thailand Malaysia
1996 2017 (latest available data)
15.2
–5.9 –2.0 –1.8
19.6
2.4
10.1
–1.7
Singapore Malaysia Thailand Indonesia
1997 2017 Estimate
75 30 24 26
280 203
130 104
Singapore Thailand Indonesia Malaysia
1998 2017 (latest available)
Singapore GDP Growth Likely to Moderate in 2018
14
MAS Expected To Start Normalising in Apr 18
External Spillovers to Domestic Sectors
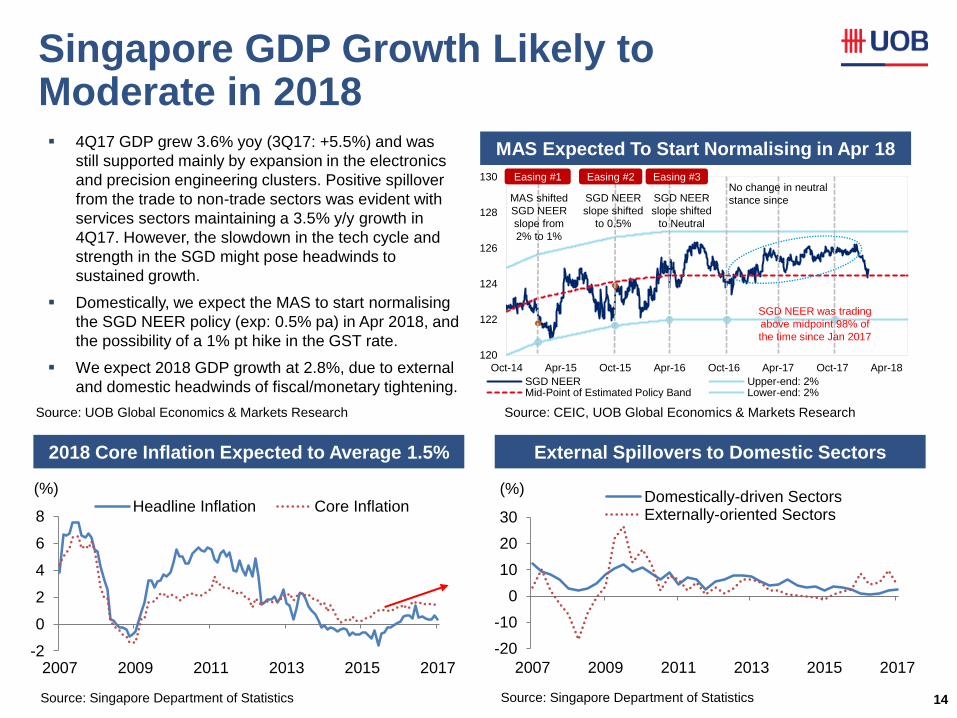
4Q17 GDP grew 3.6% yoy (3Q17: +5.5%) and was
still supported mainly by expansion in the electronics
and precision engineering clusters. Positive spillover
from the trade to non-trade sectors was evident with
services sectors maintaining a 3.5% y/y growth in
4Q17. However, the slowdown in the tech cycle and
strength in the SGD might pose headwinds to
sustained growth.
Domestically, we expect the MAS to start normalising
the SGD NEER policy (exp: 0.5% pa) in Apr 2018, and
the possibility of a 1% pt hike in the GST rate.
We expect 2018 GDP growth at 2.8%, due to external
and domestic headwinds of fiscal/monetary tightening.
Source: Singapore Department of Statistics
2018 Core Inflation Expected to Average 1.5%
Source: UOB Global Economics & Markets Research Source: CEIC, UOB Global Economics & Markets Research
Source: Singapore Department of Statistics
Update where
relevant
Pls provide a chart
file where the excel
source file can be
assessed.
Update the charts to
latest available data.
-2
0
2
4
6
8
2007 2009 2011 2013 2015 2017
(%) Headline Inflation Core Inflation
-20
-10
0
10
20
30
2007 2009 2011 2013 2015 2017
(%) Domestically-driven SectorsExternally-oriented Sectors
120
122
124
126
128
130
Oct-14 Apr-15 Oct-15 Apr-16 Oct-16 Apr-17 Oct-17 Apr-18
SGD NEER Upper-end: 2%Mid-Point of Estimated Policy Band Lower-end: 2%
MAS shifted
SGD NEER
slope from
2% to 1%
SGD NEER
slope shifted
to 0.5%
SGD NEER
slope shifted
to Neutral
Easing #1 Easing #2 Easing #3
SGD NEER was trading
above midpoint 98% of
the time since Jan 2017
No change in neutral
stance since
Southeast Asia Banking Sector: Strong Fundamentals Remain Intact
15
Key Banking Trends
Stable Funding; Adequate Loan/Deposit Ratios Robust Capital Positions
Higher NIM in Lightly Penetrated Markets
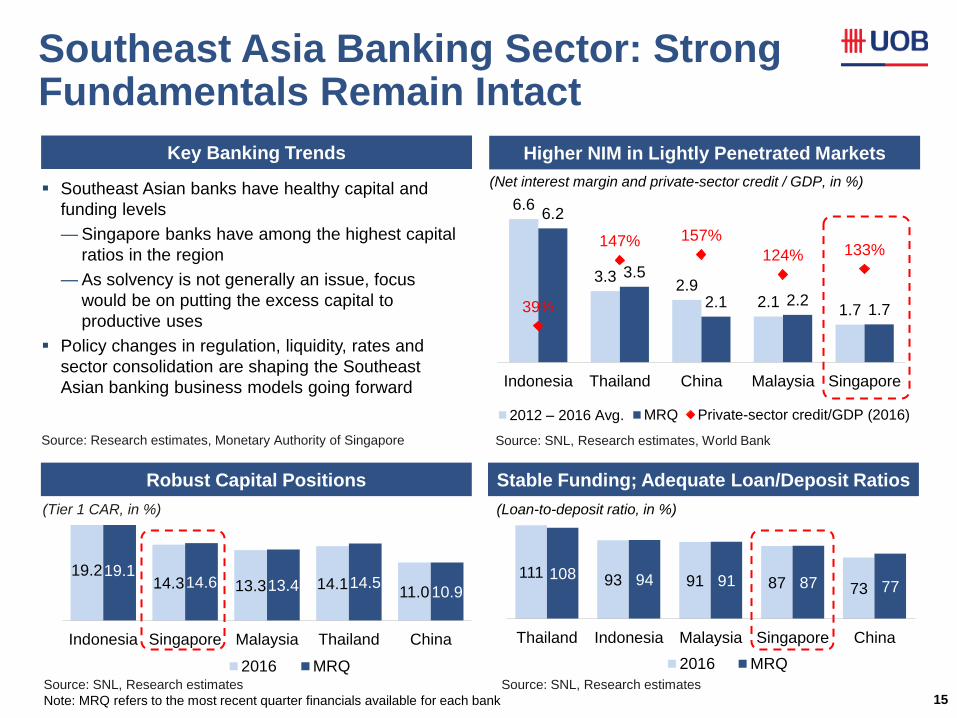
Source: Research estimates, Monetary Authority of Singapore
Southeast Asian banks have healthy capital and
funding levels
— Singapore banks have among the highest capital
ratios in the region
— As solvency is not generally an issue, focus
would be on putting the excess capital to
productive uses
Policy changes in regulation, liquidity, rates and
sector consolidation are shaping the Southeast
Asian banking business models going forward
Update MRQ to
the latest
dataset (see
excel file)
Update MRQ to
the latest
dataset (see
excel file)
Update MRQ to
the latest
dataset (see
excel file)
(Net interest margin and private-sector credit / GDP, in %)
(Tier 1 CAR, in %) (Loan-to-deposit ratio, in %)
Source: SNL, Research estimates, World Bank
Source: SNL, Research estimates
Note: MRQ refers to the most recent quarter financials available for each bank
Source: SNL, Research estimates
6.6
3.3 2.9
2.1 1.7
6.2
3.5
2.1 2.2 1.7 39%
147% 157%
124% 133%
Indonesia Thailand China Malaysia Singapore
2012 – 2016 Avg. MRQ Private-sector credit/GDP (2016)
19.2 14.3 13.3 14.1
11.0
19.1 14.6 13.4 14.5
10.9
Indonesia Singapore Malaysia Thailand China
2016 MRQ
111 93 91 87 73
108 94 91 87 77
Thailand Indonesia Malaysia Singapore China
2016 MRQ
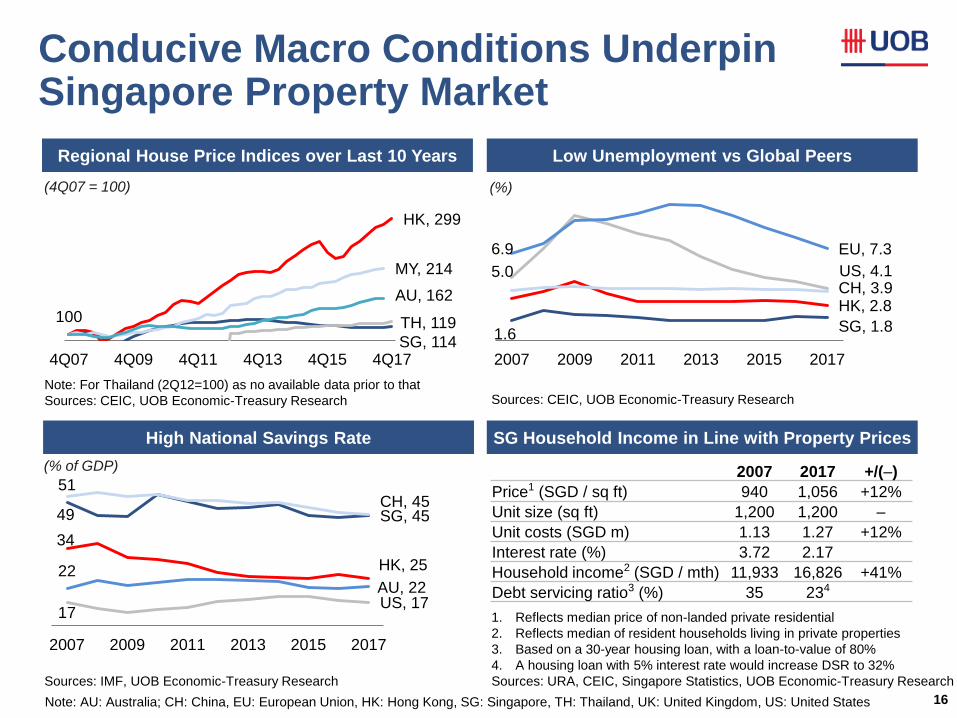
49 SG, 45
34
HK, 25
51 CH, 45
17 US, 17
22 AU, 22
2007 2009 2011 2013 2015 2017
High National Savings Rate SG Household Income in Line with Property Prices
Regional House Price Indices over Last 10 Years Low Unemployment vs Global Peers
SG, 114
HK, 299
100
MY, 214
TH, 119
AU, 162
4Q07 4Q09 4Q11 4Q13 4Q15 4Q17
Conducive Macro Conditions Underpin Singapore Property Market
16
Update 4Q17 to
the latest
dataset
Update 2017 to
the latest
dataset
Update 2017 to
the latest
dataset
Update 2017 to
the latest
dataset
Note: For Thailand (2Q12=100) as no available data prior to that
Sources: CEIC, UOB Economic-Treasury Research
(4Q07 = 100)
Sources: IMF, UOB Economic-Treasury Research
(% of GDP)
(%)
Sources: CEIC, UOB Economic-Treasury Research
1. Reflects median price of non-landed private residential
2. Reflects median of resident households living in private properties
3. Based on a 30-year housing loan, with a loan-to-value of 80%
4. A housing loan with 5% interest rate would increase DSR to 32%
Sources: URA, CEIC, Singapore Statistics, UOB Economic-Treasury Research
1.6 SG, 1.8
HK, 2.8 CH, 3.9
5.0 US, 4.1
6.9 EU, 7.3
2007 2009 2011 2013 2015 2017
2007 2017 +/(–)
Price1 (SGD / sq ft) 940 1,056 +12%
Unit size (sq ft) 1,200 1,200 –
Unit costs (SGD m) 1.13 1.27 +12%
Interest rate (%) 3.72 2.17
Household income2 (SGD / mth) 11,933 16,826 +41%
Debt servicing ratio3 (%) 35 234
Note: AU: Australia; CH: China, EU: European Union, HK: Hong Kong, SG: Singapore, TH: Thailand, UK: United Kingdom, US: United States
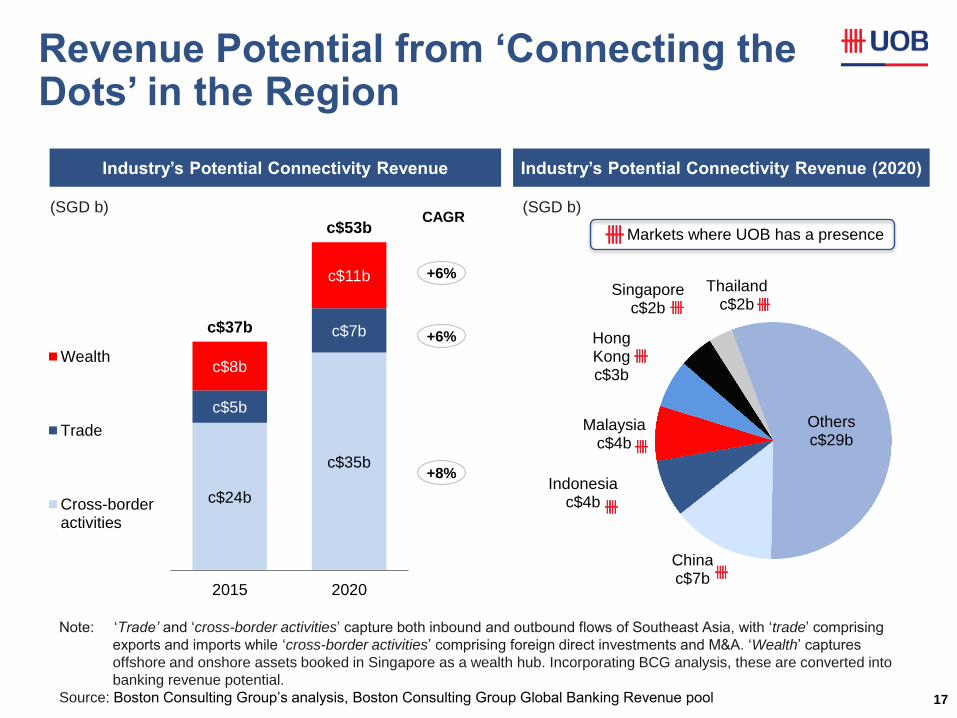
Revenue Potential from ‘Connecting the Dots’ in the Region
17
c$24b
c$35b
c$5b
c$7b
c$8b
c$11b
c$37b
c$53b
2015 2020
Total
Wealth
Trade
Cross-borderactivities
Note: ‘Trade’ and ‘cross-border activities’ capture both inbound and outbound flows of Southeast Asia, with ‘trade’ comprising
exports and imports while ‘cross-border activities’ comprising foreign direct investments and M&A. ‘Wealth’ captures
offshore and onshore assets booked in Singapore as a wealth hub. Incorporating BCG analysis, these are converted into
banking revenue potential.
Source: Boston Consulting Group’s analysis, Boston Consulting Group Global Banking Revenue pool
Source: BCG
+6%
CAGR
+6%
+8%
Industry’s Potential Connectivity Revenue
China c$7b
Indonesia c$4b
Malaysia c$4b
Hong Kong c$3b
Singapore c$2b
Thailand c$2b
Others c$29b
Industry’s Potential Connectivity Revenue (2020)
(SGD b) (SGD b)
Markets where UOB has a presence
7.0
%
9.0
%1
7.0
%
8.0
%
10.5
%
10.5
%
8.5
%
8.5
%
10.5
%1
8.5
%
9.5
%
12.0
%
12.0
%
9.5
%
10.5
%
12.5
%1
10.5
%
12.0
%
14.0
%
14.0
%
11.5
%
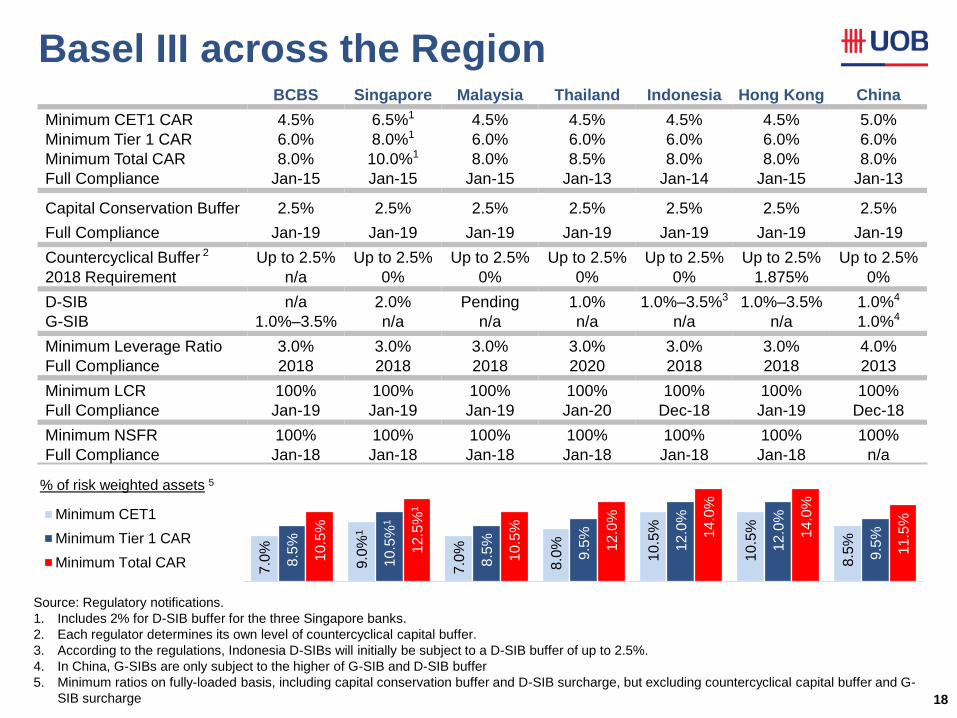
BCBS Singapore Malaysia Thailand Indonesia Hong Kong China
Minimum CET1
Minimum Tier 1 CAR
Minimum Total CAR
% of risk weighted assets 5
Basel III across the Region
18
Update where
appropriate
BCBS Singapore Malaysia Thailand Indonesia Hong Kong China
Minimum CET1 CAR 4.5% 6.5%1 4.5% 4.5% 4.5% 4.5% 5.0%
Minimum Tier 1 CAR 6.0% 8.0%1 6.0% 6.0% 6.0% 6.0% 6.0%
Minimum Total CAR 8.0% 10.0%1 8.0% 8.5% 8.0% 8.0% 8.0%
Full Compliance Jan-15 Jan-15 Jan-15 Jan-13 Jan-14 Jan-15 Jan-13
Capital Conservation Buffer 2.5% 2.5% 2.5% 2.5% 2.5% 2.5% 2.5%
Full Compliance Jan-19 Jan-19 Jan-19 Jan-19 Jan-19 Jan-19 Jan-19
Countercyclical Buffer 2 Up to 2.5% Up to 2.5% Up to 2.5% Up to 2.5% Up to 2.5% Up to 2.5% Up to 2.5%
2018 Requirement n/a 0% 0% 0% 0% 1.875% 0%
D-SIB n/a 2.0% Pending 1.0% 1.0%–3.5%3 1.0%–3.5% 1.0%4
G-SIB 1.0%–3.5% n/a n/a n/a n/a n/a 1.0%4
Minimum Leverage Ratio 3.0% 3.0% 3.0% 3.0% 3.0% 3.0% 4.0%
Full Compliance 2018 2018 2018 2020 2018 2018 2013
Minimum LCR 100% 100% 100% 100% 100% 100% 100%
Full Compliance Jan-19 Jan-19 Jan-19 Jan-20 Dec-18 Jan-19 Dec-18
Minimum NSFR 100% 100% 100% 100% 100% 100% 100%
Full Compliance Jan-18 Jan-18 Jan-18 Jan-18 Jan-18 Jan-18 n/a
Source: Regulatory notifications.
1. Includes 2% for D-SIB buffer for the three Singapore banks.
2. Each regulator determines its own level of countercyclical capital buffer.
3. According to the regulations, Indonesia D-SIBs will initially be subject to a D-SIB buffer of up to 2.5%.
4. In China, G-SIBs are only subject to the higher of G-SIB and D-SIB buffer
5. Minimum ratios on fully-loaded basis, including capital conservation buffer and D-SIB surcharge, but excluding countercyclical capital buffer and G-
SIB surcharge
Source: BCBS
1. Liquidity Coverage Ratio
2. Net Stable Funding Ratio
3. Standardised Approach for measuring Counterparty Credit Risk exposure
(MAS has not announced implementation date)
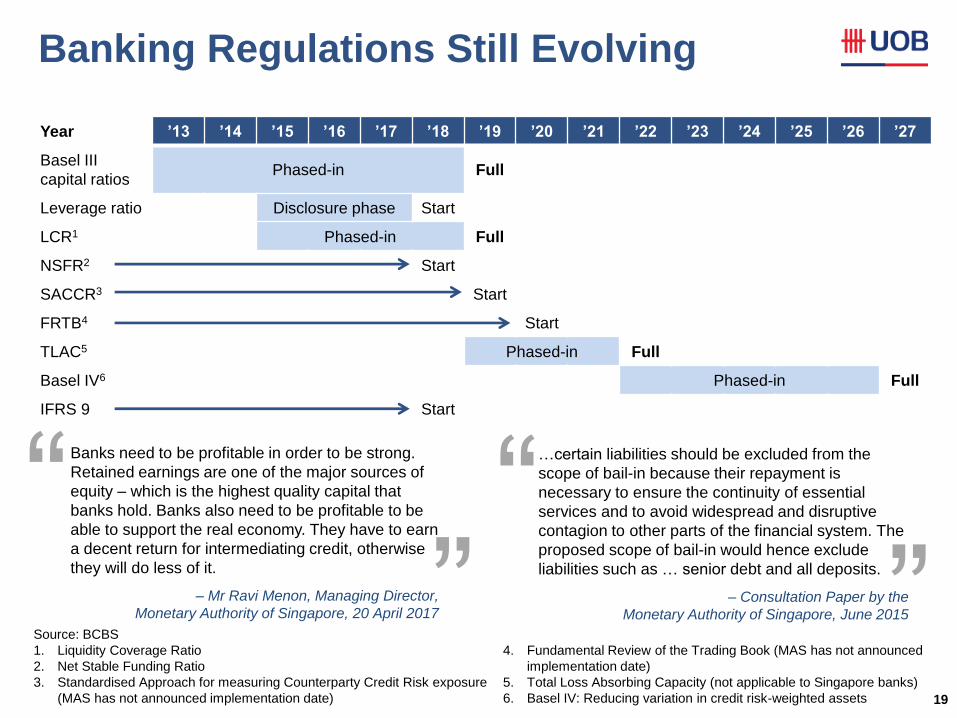
Banking Regulations Still Evolving
19
Year ’13 ’14 ’15 ’16 ’17 ’18 ’19 ’20 ’21 ’22 ’23 ’24 ’25 ’26 ’27
Basel III
capital ratios Phased-in Full
Leverage ratio Disclosure phase Start
LCR1 Phased-in Full
NSFR2 Start
SACCR3 Start
FRTB4 Start
TLAC5 Phased-in Full
Basel IV6 Phased-in Full
IFRS 9 Start
Banks need to be profitable in order to be strong.
Retained earnings are one of the major sources of
equity – which is the highest quality capital that
banks hold. Banks also need to be profitable to be
able to support the real economy. They have to earn
a decent return for intermediating credit, otherwise
they will do less of it.
– Mr Ravi Menon, Managing Director,
Monetary Authority of Singapore, 20 April 2017
…certain liabilities should be excluded from the
scope of bail-in because their repayment is
necessary to ensure the continuity of essential
services and to avoid widespread and disruptive
contagion to other parts of the financial system. The
proposed scope of bail-in would hence exclude
liabilities such as … senior debt and all deposits.
– Consultation Paper by the
Monetary Authority of Singapore, June 2015
4. Fundamental Review of the Trading Book (MAS has not announced
implementation date)
5. Total Loss Absorbing Capacity (not applicable to Singapore banks)
6. Basel IV: Reducing variation in credit risk-weighted assets
Strong UOB Fundamentals
20
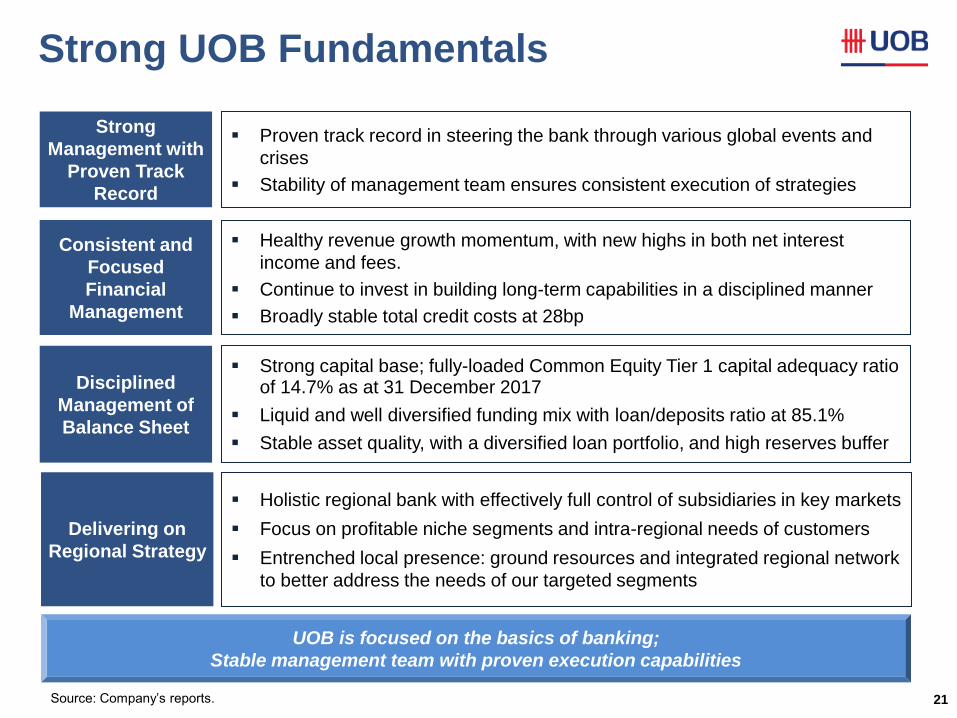
Strong UOB Fundamentals
21
UOB is focused on the basics of banking;
Stable management team with proven execution capabilities
Consistent and
Focused
Financial
Management
Healthy revenue growth momentum, with new highs in both net interest
income and fees.
Continue to invest in building long-term capabilities in a disciplined manner
Broadly stable total credit costs at 28bp
Strong
Management with
Proven Track
Record
Proven track record in steering the bank through various global events and
crises
Stability of management team ensures consistent execution of strategies
Disciplined
Management of
Balance Sheet
Strong capital base; fully-loaded Common Equity Tier 1 capital adequacy ratio of 14.7% as at 31 December 2017
Liquid and well diversified funding mix with loan/deposits ratio at 85.1%
Stable asset quality, with a diversified loan portfolio, and high reserves buffer
Delivering on
Regional Strategy
Holistic regional bank with effectively full control of subsidiaries in key markets
Focus on profitable niche segments and intra-regional needs of customers
Entrenched local presence: ground resources and integrated regional network
to better address the needs of our targeted segments
Source: Company’s reports.
Need to think
what to say
Dividend?
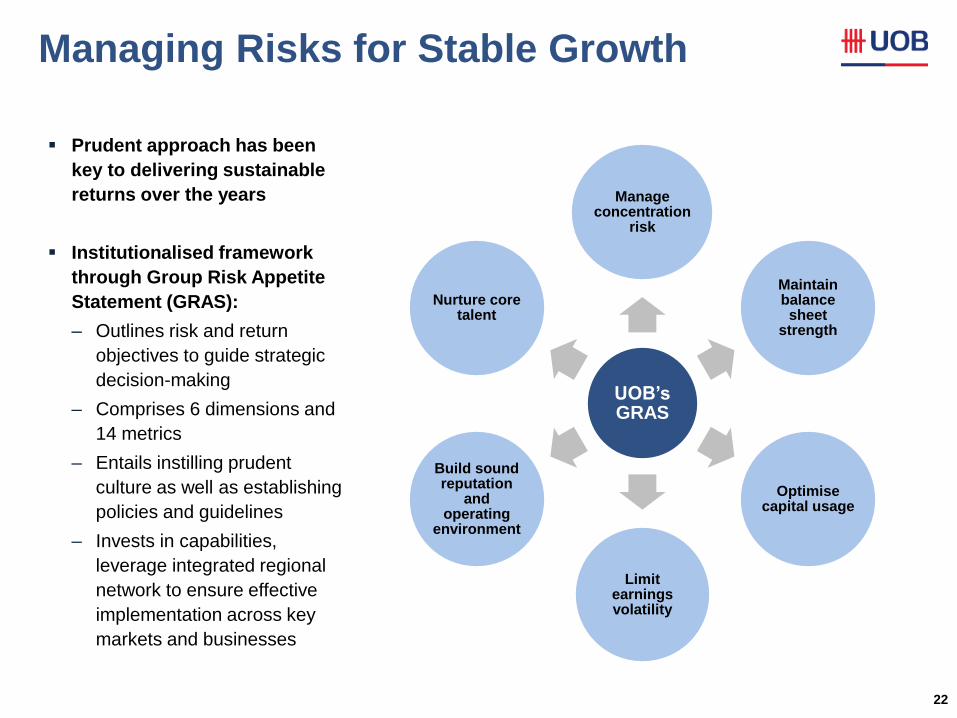
Managing Risks for Stable Growth
22
UOB’s GRAS
Manage concentration
risk
Maintain balance sheet
strength
Optimise capital usage
Limit earnings volatility
Build sound reputation
and operating
environment
Nurture core talent
Prudent approach has been
key to delivering sustainable
returns over the years
Institutionalised framework
through Group Risk Appetite
Statement (GRAS):
– Outlines risk and return
objectives to guide strategic
decision-making
– Comprises 6 dimensions and
14 metrics
– Entails instilling prudent
culture as well as establishing
policies and guidelines
– Invests in capabilities,
leverage integrated regional
network to ensure effective
implementation across key
markets and businesses
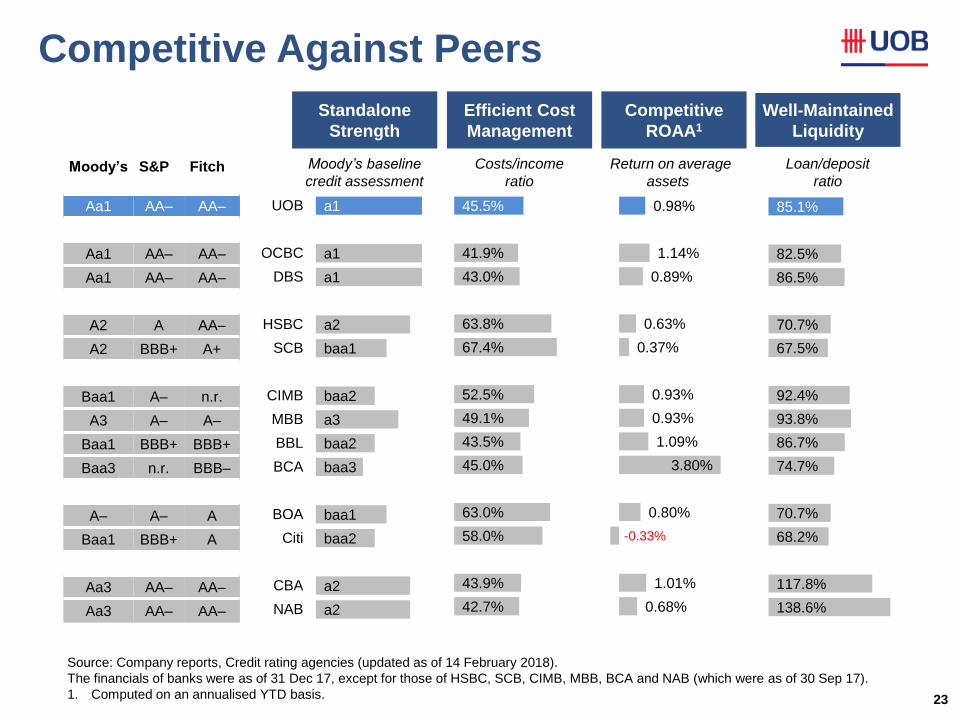
Competitive Against Peers
23
Standalone
Strength
Efficient Cost
Management
Competitive
ROAA1
Well-Maintained
Liquidity
Update to the
latest dataset
(see excel file).
Include all
results
announcements
until 14 Feb
2018
Source: Company reports, Credit rating agencies (updated as of 14 February 2018).
The financials of banks were as of 31 Dec 17, except for those of HSBC, SCB, CIMB, MBB, BCA and NAB (which were as of 30 Sep 17).
1. Computed on an annualised YTD basis.
Moody’s S&P Fitch
Aa1 AA– AA–
Aa1 AA– AA–
Aa1 AA– AA–
A2 A AA–
A2 BBB+ A+
Baa1 A– n.r.
A3 A– A–
Baa1 BBB+ BBB+
Baa3 n.r. BBB–
A– A– A
Baa1 BBB+ A
Aa3 AA– AA–
Aa3 AA– AA–
Moody’s baseline
credit assessment Costs/income
ratio
Return on average
assets1
Loan/deposit
ratio
a1
a1
a1
a2
baa1
baa2
a3
baa2
baa3
baa1
baa2
a2
a2
UOB
OCBC
DBS
HSBC
SCB
CIMB
MBB
BBL
BCA
BOA
Citi
CBA
NAB
45.5%
41.9%
43.0%
63.8%
67.4%
52.5%
49.1%
43.5%
45.0%
63.0%
58.0%
43.9%
42.7%
0.98%
1.14%
0.89%
0.63%
0.37%
0.93%
0.93%
1.09%
3.80%
0.80%
-0.33%
1.01%
0.68%
85.1%
82.5%
86.5%
70.7%
67.5%
92.4%
93.8%
86.7%
74.7%
70.7%
68.2%
117.8%
138.6%
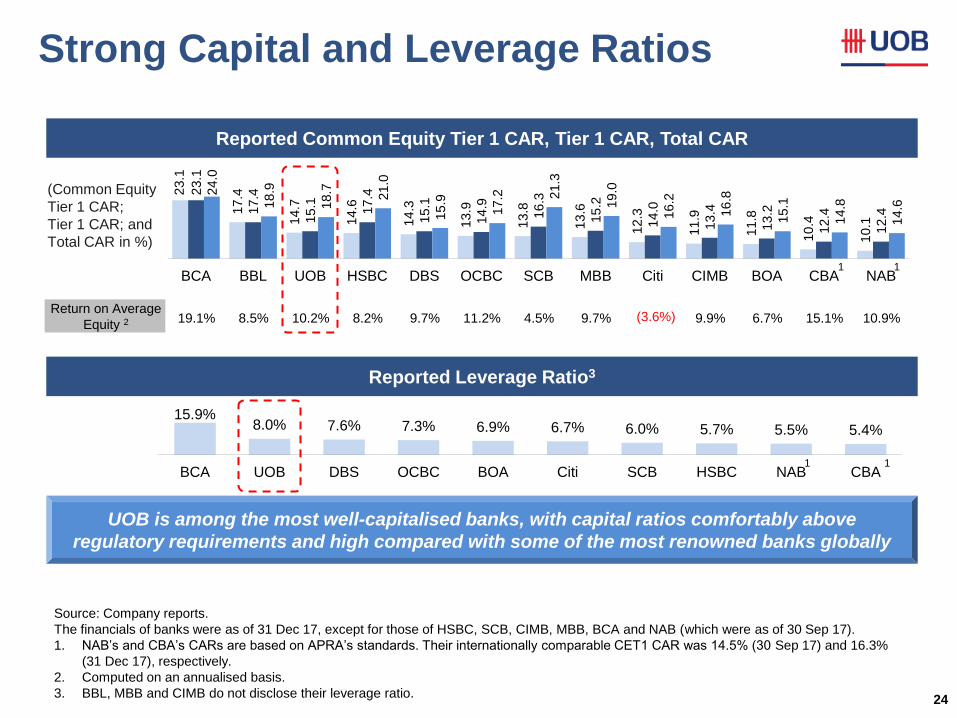
15.9% 8.0% 7.6% 7.3% 6.9% 6.7% 6.0% 5.7% 5.5% 5.4%
BCA UOB DBS OCBC BOA Citi SCB HSBC NAB CBA
Strong Capital and Leverage Ratios
24
Reported Leverage Ratio3
Reported Common Equity Tier 1 CAR, Tier 1 CAR, Total CAR
UOB is among the most well-capitalised banks, with capital ratios comfortably above
regulatory requirements and high compared with some of the most renowned banks globally
Update to the
latest dataset (see
excel file).
Include all results
announcements
until 14 Feb 2018
Update to the
latest dataset (see
excel file).
Include all results
announcements
until 14 Feb 2018
Update to the
latest dataset
(see excel file).
Include all
results
announcements
until 14 Feb
2018
23
.1
17.4
14.7
14.6
14.3
13
.9
13.8
13.6
12.3
11.9
11.8
10.4
10.1
23
.1
17.4
15.1
17.4
15.1
14.9
16.3
15
.2
14.0
13.4
13.2
12.4
12.4
24
.0
18.9
18.7
21.0
15.9
17.2
21.3
19.0
16.2
16.8
15.1
14.8
14.6
BCA BBL UOB HSBC DBS OCBC SCB MBB Citi CIMB BOA CBA NAB
(Common Equity
Tier 1 CAR;
Tier 1 CAR; and
Total CAR in %)
Return on Average
Equity 2
Source: Company reports.
The financials of banks were as of 31 Dec 17, except for those of HSBC, SCB, CIMB, MBB, BCA and NAB (which were as of 30 Sep 17).
1. NAB’s and CBA’s CARs are based on APRA’s standards. Their internationally comparable CET1 CAR was 14.5% (30 Sep 17) and 16.3%
(31 Dec 17), respectively.
2. Computed on an annualised basis.
3. BBL, MBB and CIMB do not disclose their leverage ratio.
1 1
19.1% 8.5% 10.2% 8.2% 9.7% 11.2% 4.5% 9.7% (3.6%) 9.9% 6.7% 15.1% 10.9%
1 1
Disciplined Balance Sheet Management
25
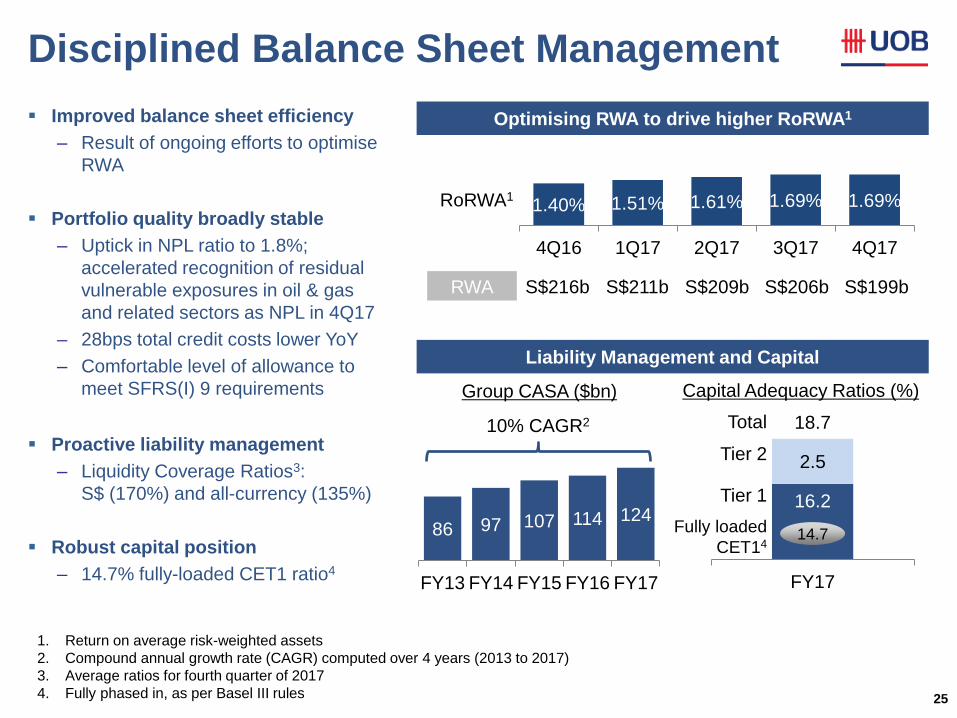
Improved balance sheet efficiency
– Result of ongoing efforts to optimise
RWA
Portfolio quality broadly stable
– Uptick in NPL ratio to 1.8%;
accelerated recognition of residual
vulnerable exposures in oil & gas
and related sectors as NPL in 4Q17
– 28bps total credit costs lower YoY
– Comfortable level of allowance to
meet SFRS(I) 9 requirements
Proactive liability management
– Liquidity Coverage Ratios3:
S$ (170%) and all-currency (135%)
Robust capital position
– 14.7% fully-loaded CET1 ratio4
1. Return on average risk-weighted assets
2. Compound annual growth rate (CAGR) computed over 4 years (2013 to 2017)
3. Average ratios for fourth quarter of 2017
4. Fully phased in, as per Basel III rules
Capital Adequacy Ratios (%) Group CASA ($bn)
Optimising RWA to drive higher RoRWA1
Liability Management and Capital
86 97 107 114 124
FY13 FY14 FY15 FY16 FY17
16.2
2.5
18.7
FY17
14.7
Total
Tier 2
Tier 1
Fully loaded
CET14
10% CAGR2
1.40% 1.51% 1.61% 1.69% 1.69%
4Q16 1Q17 2Q17 3Q17 4Q17
RWA S$216b S$211b S$209b S$206b S$199b
RoRWA1
Diversified Loan Portfolio
26
Gross Customer Loans by Maturity
Gross Customer Loans by Industry
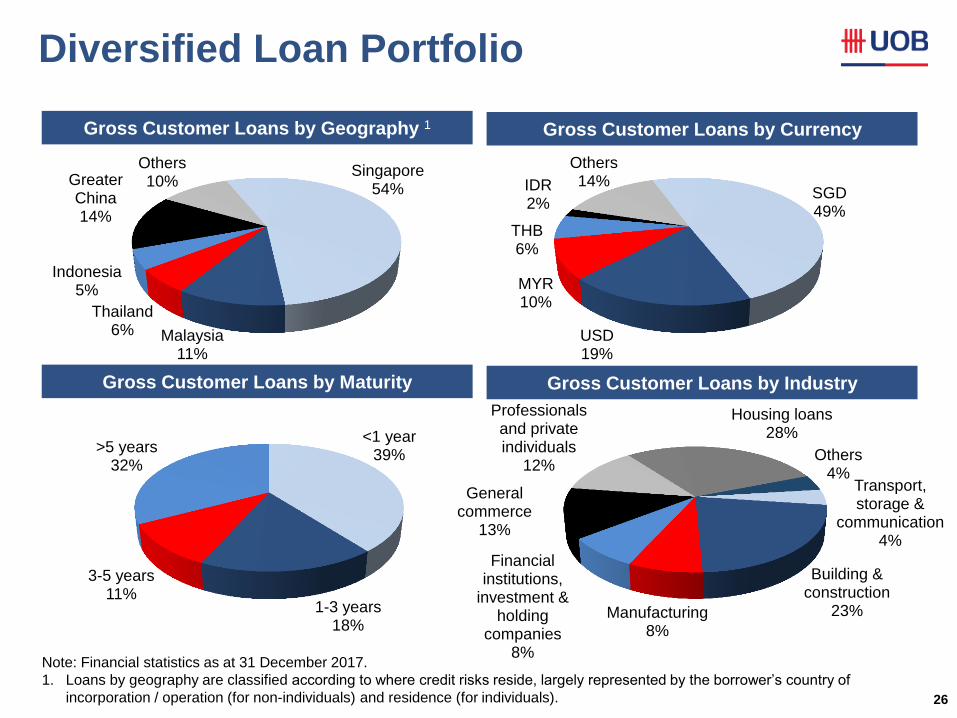
Gross Customer Loans by Currency Gross Customer Loans by Geography 1
Singapore 54%
Malaysia 11%
Thailand 6%
Indonesia 5%
Greater China 14%
Others 10%
<1 year 39%
1-3 years 18%
3-5 years 11%
>5 years 32%
Transport, storage &
communication 4%
Building & construction
23% Manufacturing 8%
Financial institutions,
investment & holding
companies 8%
General commerce
13%
Professionals and private individuals
12%
Housing loans 28%
Others 4%
Note: Financial statistics as at 31 December 2017.
1. Loans by geography are classified according to where credit risks reside, largely represented by the borrower’s country of
incorporation / operation (for non-individuals) and residence (for individuals).
SGD 49%
USD 19%
MYR 10%
THB 6%
IDR 2%
Others 14%
Strong Investment Grade Credit Ratings
27
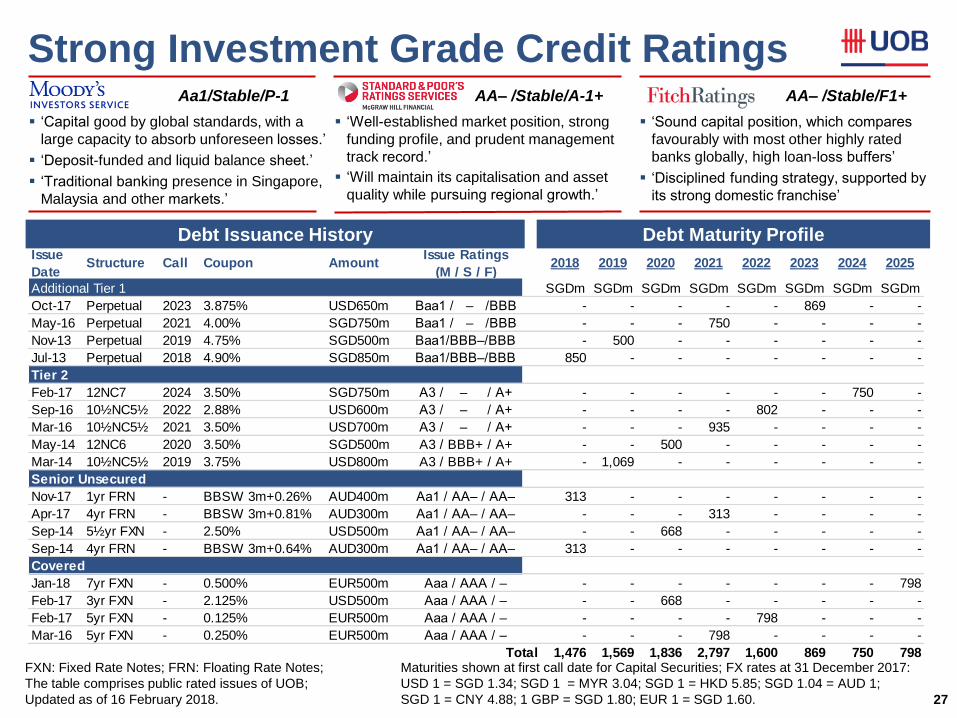
Issue
DateStructure Call Coupon Amount
Issue Ratings
(M / S / F)2018 2019 2020 2021 2022 2023 2024 2025
Additional Tier 1 SGDm SGDm SGDm SGDm SGDm SGDm SGDm SGDm
Oct-17 Perpetual 2023 3.875% USD650m Baa1 / – /BBB - - - - - 869 - -
May-16 Perpetual 2021 4.00% SGD750m Baa1 / – /BBB - - - 750 - - - -
Nov-13 Perpetual 2019 4.75% SGD500m Baa1/BBB–/BBB - 500 - - - - - -
Jul-13 Perpetual 2018 4.90% SGD850m Baa1/BBB–/BBB 850 - - - - - - -
Tier 2
Feb-17 12NC7 2024 3.50% SGD750m A3 / – / A+ - - - - - - 750 -
Sep-16 10½NC5½ 2022 2.88% USD600m A3 / – / A+ - - - - 802 - - -
Mar-16 10½NC5½ 2021 3.50% USD700m A3 / – / A+ - - - 935 - - - -
May-14 12NC6 2020 3.50% SGD500m A3 / BBB+ / A+ - - 500 - - - - -
Mar-14 10½NC5½ 2019 3.75% USD800m A3 / BBB+ / A+ - 1,069 - - - - - -
Senior Unsecured
Nov-17 1yr FRN - BBSW 3m+0.26% AUD400m Aa1 / AA– / AA– 313 - - - - - - -
Apr-17 4yr FRN - BBSW 3m+0.81% AUD300m Aa1 / AA– / AA– - - - 313 - - - -
Sep-14 5½yr FXN - 2.50% USD500m Aa1 / AA– / AA– - - 668 - - - - -
Sep-14 4yr FRN - BBSW 3m+0.64% AUD300m Aa1 / AA– / AA– 313 - - - - - - -
Covered
Jan-18 7yr FXN - 0.500% EUR500m Aaa / AAA / – - - - - - - - 798
Feb-17 3yr FXN - 2.125% USD500m Aaa / AAA / – - - 668 - - - - -
Feb-17 5yr FXN - 0.125% EUR500m Aaa / AAA / – - - - - 798 - - -
Mar-16 5yr FXN - 0.250% EUR500m Aaa / AAA / – - - - 798 - - - -
Total 1,476 1,569 1,836 2,797 1,600 869 750 798
Aa1/Stable/P-1 AA– /Stable/A-1+ AA– /Stable/F1+
‘Capital good by global standards, with a
large capacity to absorb unforeseen losses.’
‘Deposit-funded and liquid balance sheet.’
‘Traditional banking presence in Singapore,
Malaysia and other markets.’
‘Well-established market position, strong
funding profile, and prudent management
track record.’
‘Will maintain its capitalisation and asset
quality while pursuing regional growth.’
‘Sound capital position, which compares
favourably with most other highly rated
banks globally, high loan-loss buffers’
‘Disciplined funding strategy, supported by
its strong domestic franchise’
FXN: Fixed Rate Notes; FRN: Floating Rate Notes;
The table comprises public rated issues of UOB;
Updated as of 16 February 2018.
Debt Issuance History Debt Maturity Profile
Maturities shown at first call date for Capital Securities; FX rates at 31 December 2017:
USD 1 = SGD 1.34; SGD 1 = MYR 3.04; SGD 1 = HKD 5.85; SGD 1.04 = AUD 1;
SGD 1 = CNY 4.88; 1 GBP = SGD 1.80; EUR 1 = SGD 1.60.
Review Moody’s
A3 rating on T2
28
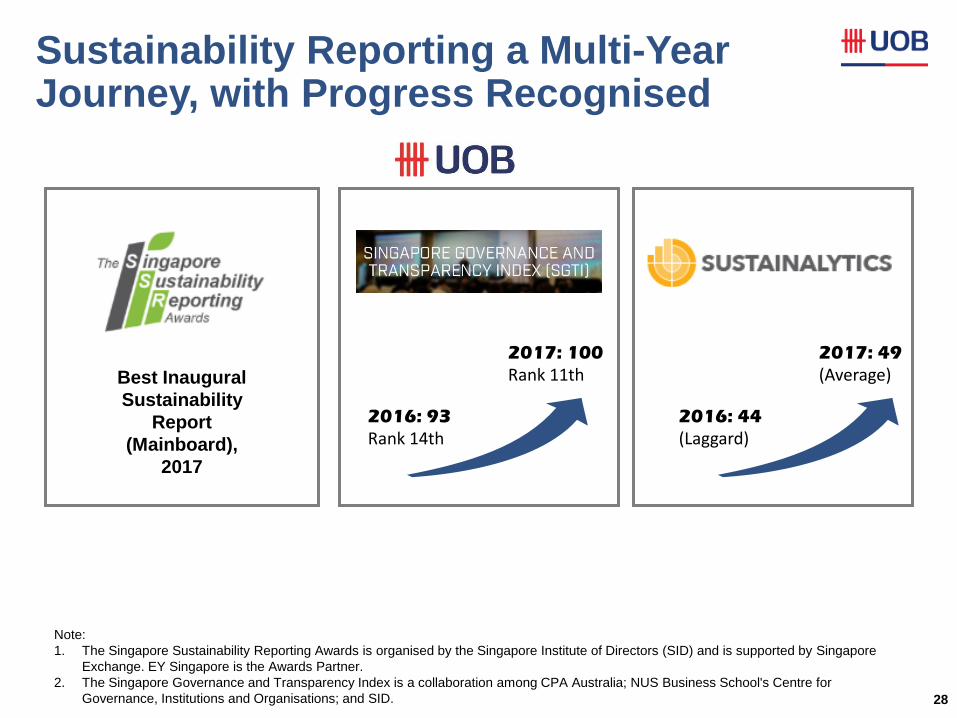
Sustainability Reporting a Multi-Year Journey, with Progress Recognised
UOB DBS OCBC
Sustainaltyics
2017 49 52 48
2016 44 47 47
2015 44
2014 42
GTI
2017 100
(11th)
117
(3rd)
104
(9th)
2016 (revised) 93
(14th)
121
(2nd)
101
(9th)
2015 74
2014 75
2013 65
2012 44
2011 41
2016: 44
(Laggard)
2017: 49
(Average)
2016: 93
Rank 14th
2017: 100
Rank 11th Best Inaugural
Sustainability
Report
(Mainboard),
2017
Note:
1. The Singapore Sustainability Reporting Awards is organised by the Singapore Institute of Directors (SID) and is supported by Singapore
Exchange. EY Singapore is the Awards Partner.
2. The Singapore Governance and Transparency Index is a collaboration among CPA Australia; NUS Business School's Centre for
Governance, Institutions and Organisations; and SID.
Our Growth Drivers
29
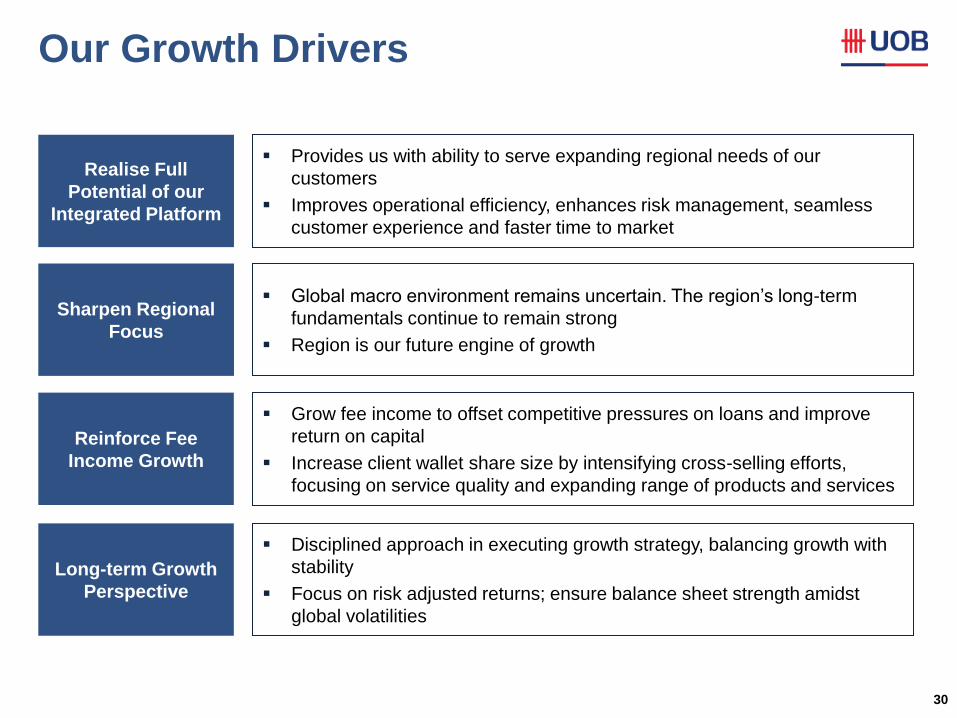
Our Growth Drivers
30
Realise Full
Potential of our
Integrated Platform
Provides us with ability to serve expanding regional needs of our
customers
Improves operational efficiency, enhances risk management, seamless
customer experience and faster time to market
Sharpen Regional
Focus
Global macro environment remains uncertain. The region’s long-term
fundamentals continue to remain strong
Region is our future engine of growth
Grow fee income to offset competitive pressures on loans and improve
return on capital
Increase client wallet share size by intensifying cross-selling efforts,
focusing on service quality and expanding range of products and services
Long-term Growth
Perspective
Disciplined approach in executing growth strategy, balancing growth with
stability
Focus on risk adjusted returns; ensure balance sheet strength amidst
global volatilities
Reinforce Fee
Income Growth
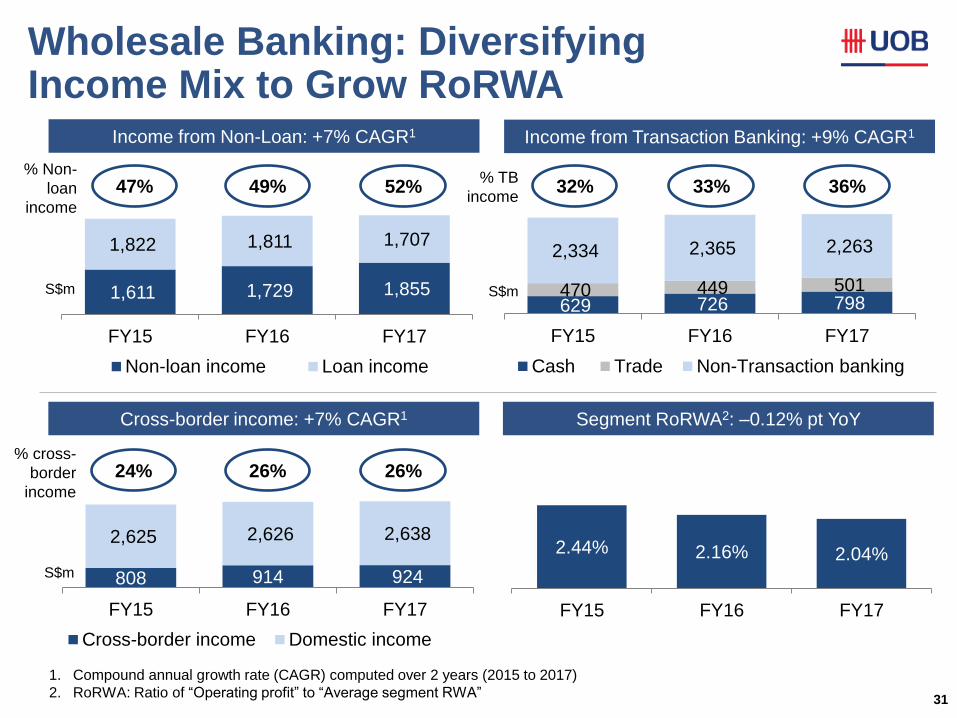
Wholesale Banking: Diversifying Income Mix to Grow RoRWA
31
808 914 924
2,625 2,626 2,638
FY15 FY16 FY17
Cross-border income Domestic income
24% 26% 26%
1. Compound annual growth rate (CAGR) computed over 2 years (2015 to 2017)
2. RoRWA: Ratio of “Operating profit” to “Average segment RWA”
2.44% 2.16% 2.04%
FY15 FY16 FY17
% cross-
border
income
S$m
1,611 1,729 1,855
1,822 1,811 1,707
FY15 FY16 FY17
Non-loan income Loan income
629 726 798 470 449 501
2,334 2,365 2,263
FY15 FY16 FY17
Cash Trade Non-Transaction banking
47% 49% 52% % Non-
loan
income
32% 33% 36% % TB
income
S$m S$m
Income from Non-Loan: +7% CAGR1
Segment RoRWA2: –0.12% pt YoY Cross-border income: +7% CAGR1
Income from Transaction Banking: +9% CAGR1
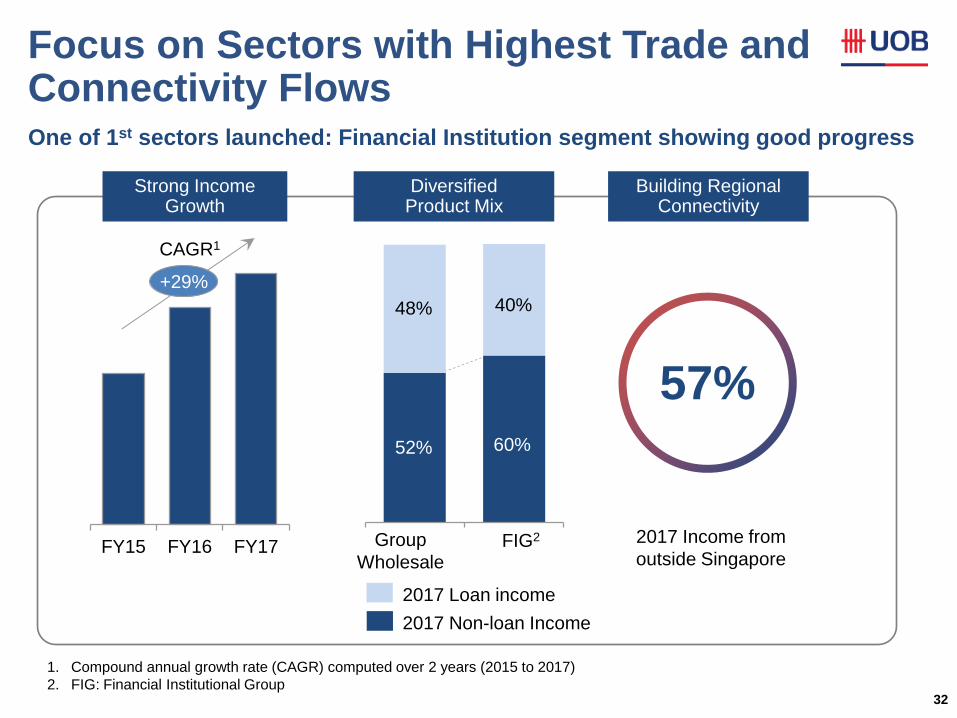
Focus on Sectors with Highest Trade and Connectivity Flows
32
One of 1st sectors launched: Financial Institution segment showing good progress
57%
2017 Income from
outside Singapore FIG2
60%
40%
Group
Wholesale
52%
48%
2017 Non-loan Income
2017 Loan income
Strong Income Growth
Building Regional Connectivity
Diversified Product Mix
FY15 FY16 FY17
+29%
1. Compound annual growth rate (CAGR) computed over 2 years (2015 to 2017)
2. FIG: Financial Institutional Group
CAGR1
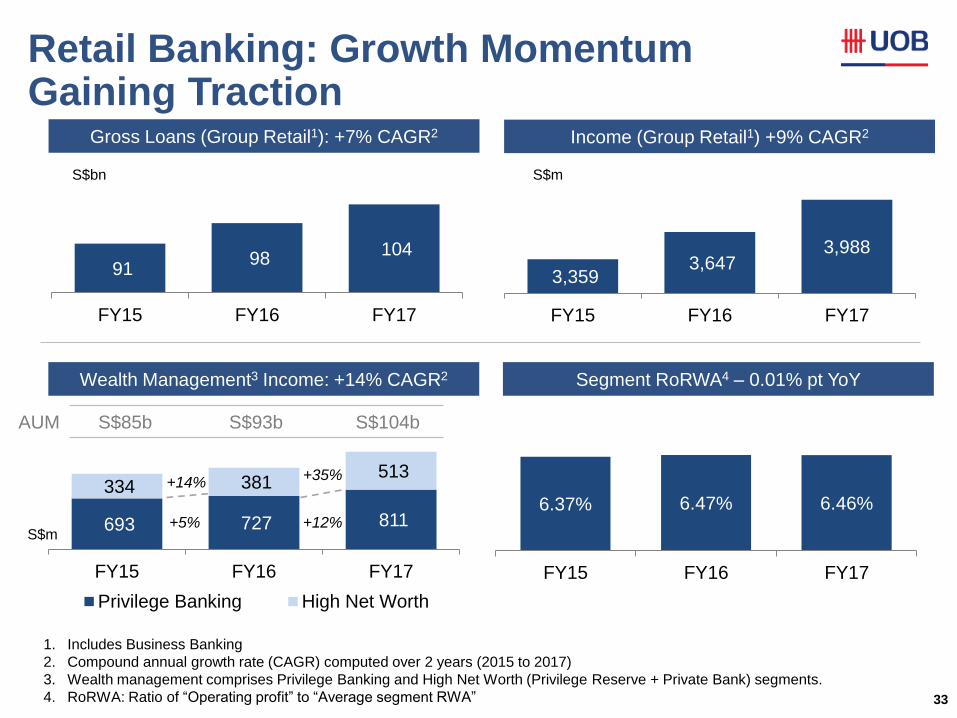
Retail Banking: Growth Momentum Gaining Traction
33
693 727 811
334 381 513
FY15 FY16 FY17
Privilege Banking High Net Worth
6.37% 6.47% 6.46%
FY15 FY16 FY17
91 98
104
FY15 FY16 FY17
3,359 3,647
3,988
FY15 FY16 FY17
1. Includes Business Banking
2. Compound annual growth rate (CAGR) computed over 2 years (2015 to 2017)
3. Wealth management comprises Privilege Banking and High Net Worth (Privilege Reserve + Private Bank) segments.
4. RoRWA: Ratio of “Operating profit” to “Average segment RWA”
AUM S$85b S$93b S$104b
+12%
+35%
+5%
+14%
S$bn
S$m
S$m
Gross Loans (Group Retail1): +7% CAGR2
Segment RoRWA4 – 0.01% pt YoY Wealth Management3 Income: +14% CAGR2
Income (Group Retail1) +9% CAGR2
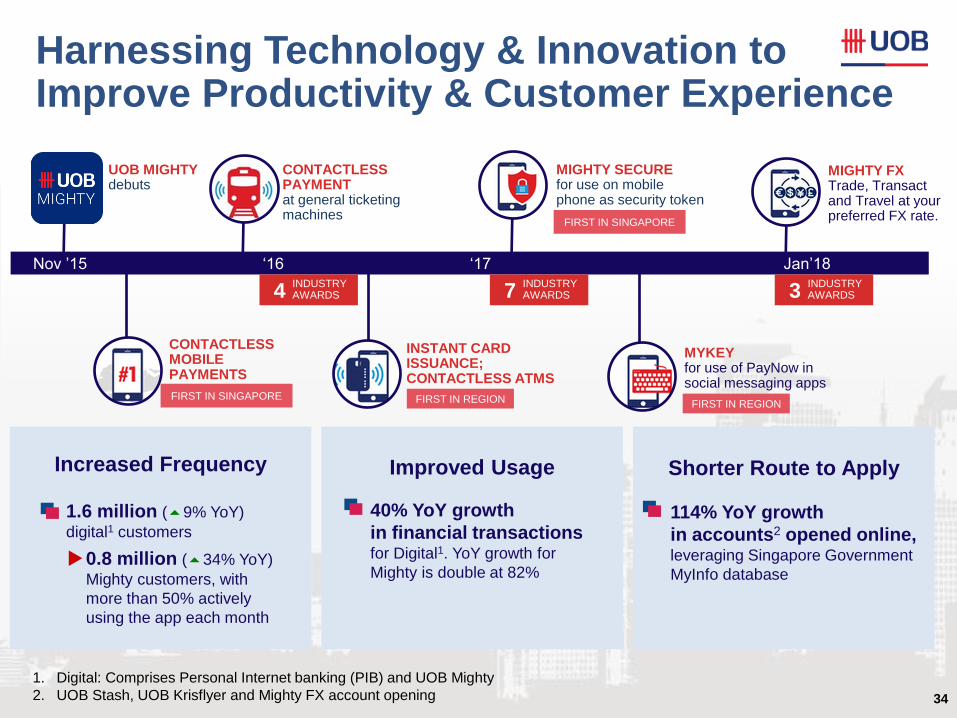
Harnessing Technology & Innovation to Improve Productivity & Customer Experience
CONTACTLESS PAYMENT at general ticketing machines
UOB MIGHTY debuts
MYKEY for use of PayNow in social messaging apps
MIGHTY FX Trade, Transact and Travel at your preferred FX rate.
Nov ’15 Jan’18 ‘17 ‘16
Increased Frequency
1.6 million (59% YoY)
digital1 customers
Improved Usage
Shorter Route to Apply
40% YoY growth
in financial transactions for Digital1. YoY growth for
Mighty is double at 82%
114% YoY growth
in accounts2 opened online, leveraging Singapore Government
MyInfo database
CONTACTLESS MOBILE PAYMENTS
FIRST IN SINGAPORE FIRST IN REGION
MIGHTY SECURE for use on mobile phone as security token
FIRST IN SINGAPORE
3 INDUSTRY AWARDS 7
INDUSTRY AWARDS 4
INDUSTRY AWARDS
INSTANT CARD ISSUANCE; CONTACTLESS ATMS
FIRST IN REGION
1. Digital: Comprises Personal Internet banking (PIB) and UOB Mighty
2. UOB Stash, UOB Krisflyer and Mighty FX account opening
0.8 million (534% YoY)
Mighty customers, with
more than 50% actively
using the app each month
u
34
Latest Financials
35
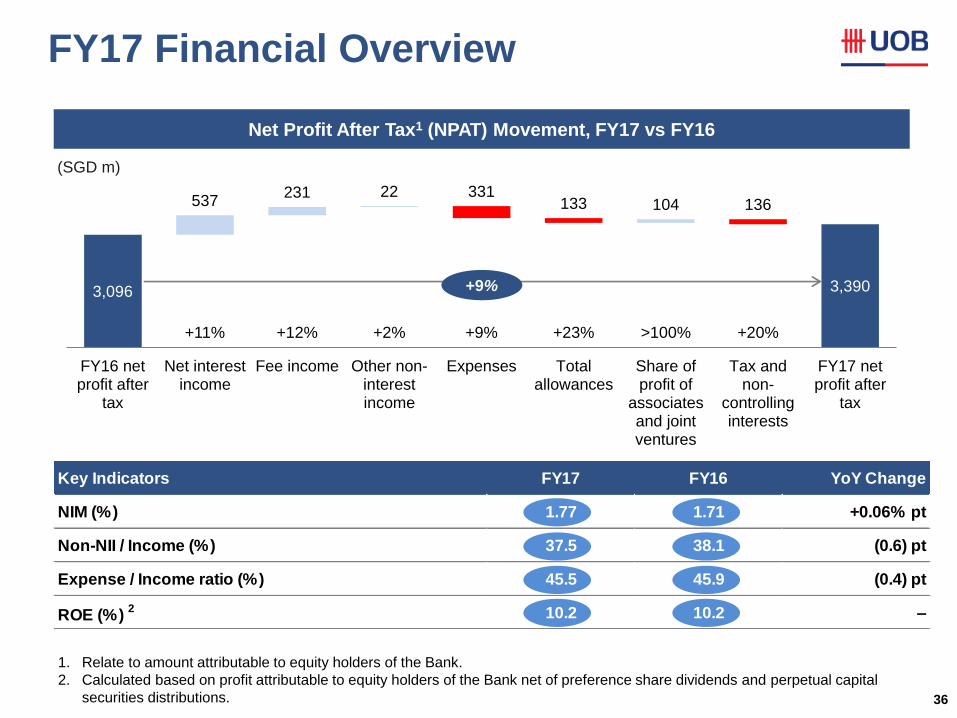
Key Indicators FY17 FY16 YoY Change
NIM (%) 1.77 1.71 +0.06% pt
Non-NII / Income (%) 37.5 38.1 (0.6) pt
Expense / Income ratio (%) 45.5 45.9 (0.4) pt
ROE (%) 2 10.2 10.2 –
FY17 Financial Overview
36
Net Profit After Tax1 (NPAT) Movement, FY17 vs FY16
(SGD m)
+11% +12% +2% +9% +23% >100% +20%
3,096 3,390
537 231 22
104 331
133 136
FY16 netprofit after
tax
Net interestincome
Fee income Other non-interestincome
Expenses Totalallowances
Share ofprofit of
associatesand jointventures
Tax andnon-
controllinginterests
FY17 netprofit after
tax
+9%
1. Relate to amount attributable to equity holders of the Bank.
2. Calculated based on profit attributable to equity holders of the Bank net of preference share dividends and perpetual capital
securities distributions.
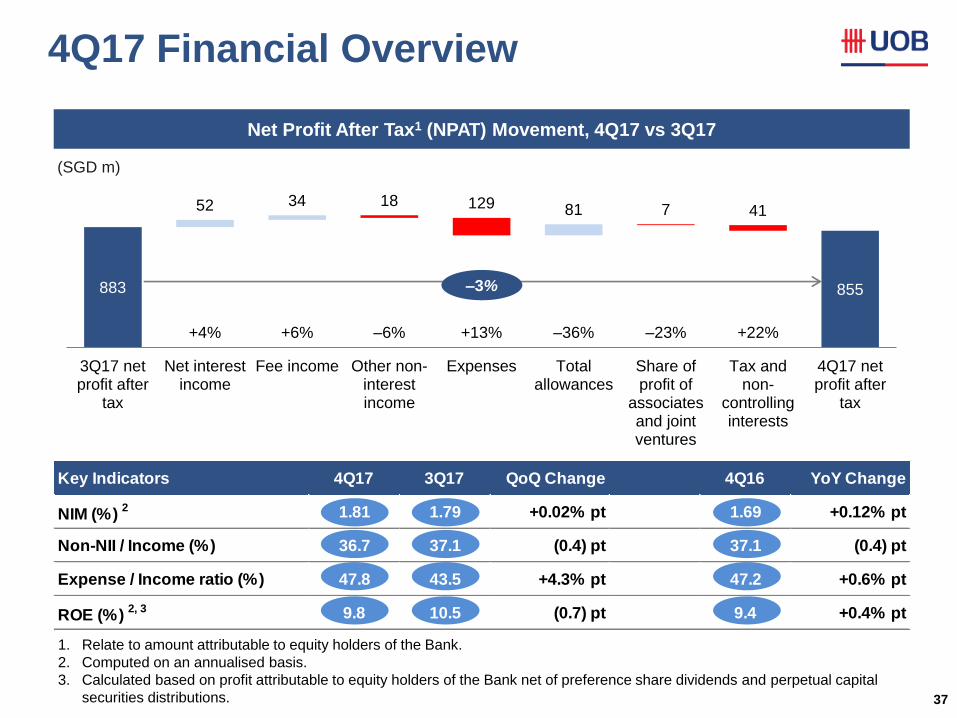
Key Indicators 4Q17 3Q17 QoQ Change 4Q16 YoY Change
NIM (%) 2 1.81 1.79 +0.02% pt 1.69 +0.12% pt
Non-NII / Income (%) 36.7 37.1 (0.4) pt 37.1 (0.4) pt
Expense / Income ratio (%) 47.8 43.5 +4.3% pt 47.2 +0.6% pt
ROE (%) 2, 3 9.8 10.5 (0.7) pt 9.4 +0.4% pt
4Q17 Financial Overview
37
Net Profit After Tax1 (NPAT) Movement, 4Q17 vs 3Q17
(SGD m)
+4% +6% +13% +22% –6% –36% –23%
883 855
52 34 81
18 129 7 41
3Q17 netprofit after
tax
Net interestincome
Fee income Other non-interestincome
Expenses Totalallowances
Share ofprofit of
associatesand jointventures
Tax andnon-
controllinginterests
4Q17 netprofit after
tax
–3%
1. Relate to amount attributable to equity holders of the Bank.
2. Computed on an annualised basis.
3. Calculated based on profit attributable to equity holders of the Bank net of preference share dividends and perpetual capital
securities distributions.
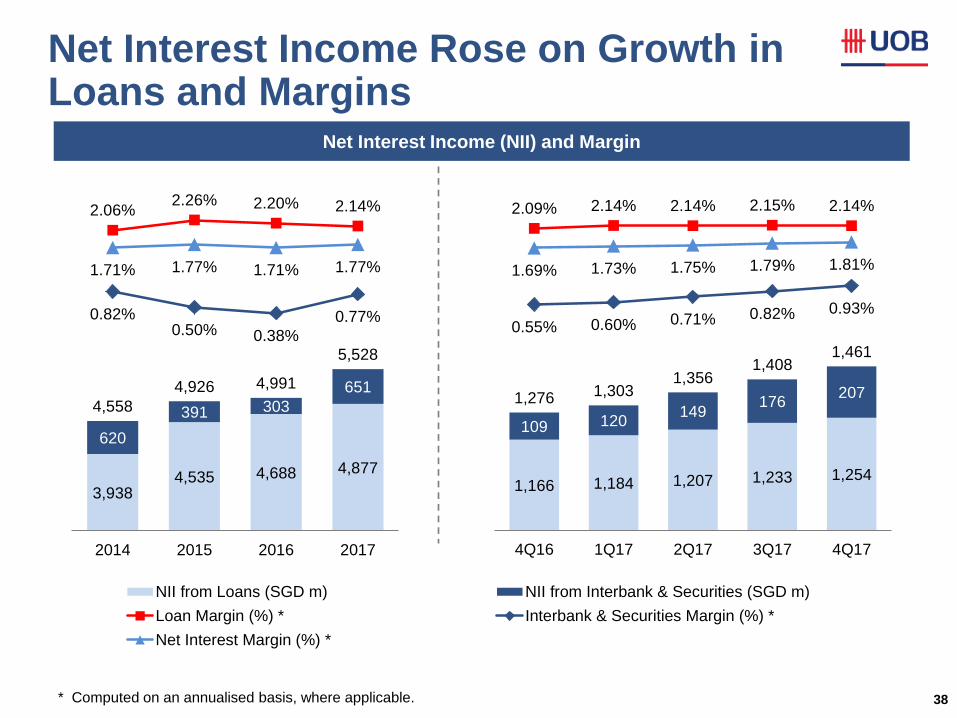
Net Interest Income Rose on Growth in Loans and Margins
38 * Computed on an annualised basis, where applicable.
3,938 4,535 4,688 4,877
620
391 303
651
4,558
4,926 4,991
5,528
2.06% 2.26% 2.20% 2.14%
0.82% 0.50% 0.38%
0.77%
1.71% 1.77% 1.71% 1.77%
-4.00%
-3.00%
-2.00%
-1.00%
0.00%
1.00%
2.00%
3.00%
2,500
3,500
4,500
5,500
6,500
7,500
8,500
2014 2015 2016 2017
NII from Loans (SGD m) NII from Interbank & Securities (SGD m)
Loan Margin (%) * Interbank & Securities Margin (%) *
Net Interest Margin (%) *
1,166 1,184 1,207 1,233 1,254
109 120 149
176 207 1,276 1,303
1,356 1,408
1,461
2.09% 2.14% 2.14% 2.15% 2.14%
0.55% 0.60% 0.71% 0.82% 0.93%
1.69% 1.73% 1.75% 1.79% 1.81%
-4.00%
-3.00%
-2.00%
-1.00%
0.00%
1.00%
2.00%
3.00%
800
1,000
1,200
1,400
1,600
1,800
2,000
2,200
4Q16 1Q17 2Q17 3Q17 4Q17
Net Interest Income (NII) and Margin
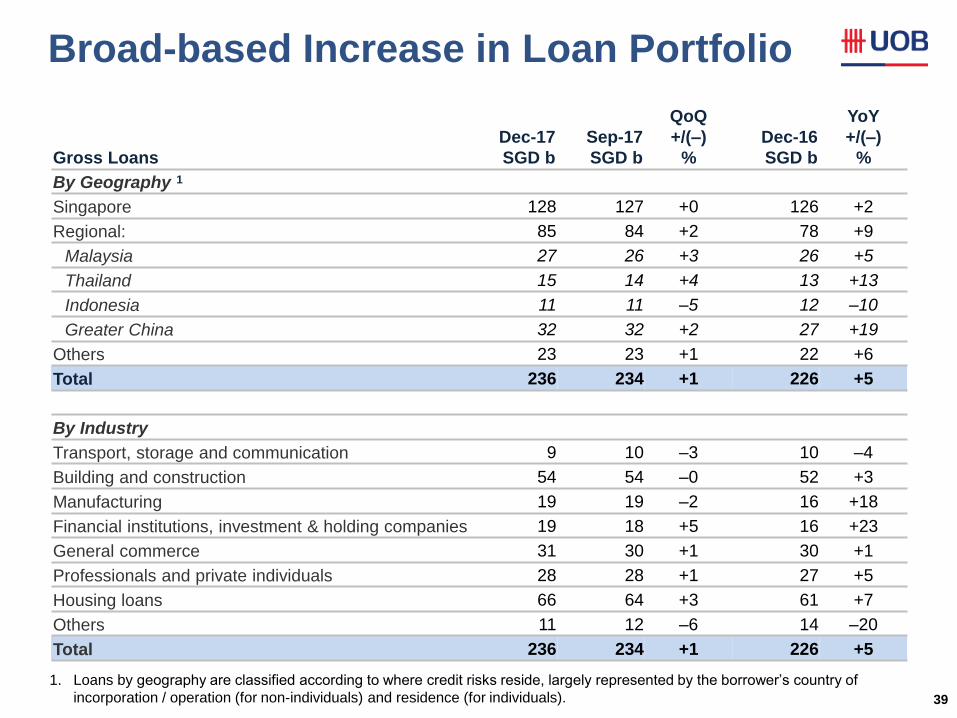
Broad-based Increase in Loan Portfolio
39
Gross Loans
Dec-17
SGD b
Sep-17
SGD b
QoQ
+/(–)
%
Dec-16
SGD b
YoY
+/(–)
%
By Geography 1
Singapore 128 127 +0 126 +2
Regional: 85 84 +2 78 +9
Malaysia 27 26 +3 26 +5
Thailand 15 14 +4 13 +13
Indonesia 11 11 –5 12 –10
Greater China 32 32 +2 27 +19
Others 23 23 +1 22 +6
Total 236 234 +1 226 +5
By Industry
Transport, storage and communication 9 10 –3 10 –4
Building and construction 54 54 –0 52 +3
Manufacturing 19 19 –2 16 +18
Financial institutions, investment & holding companies 19 18 +5 16 +23
General commerce 31 30 +1 30 +1
Professionals and private individuals 28 28 +1 27 +5
Housing loans 66 64 +3 61 +7
Others 11 12 –6 14 –20
Total 236 234 +1 226 +5
1. Loans by geography are classified according to where credit risks reside, largely represented by the borrower’s country of
incorporation / operation (for non-individuals) and residence (for individuals).
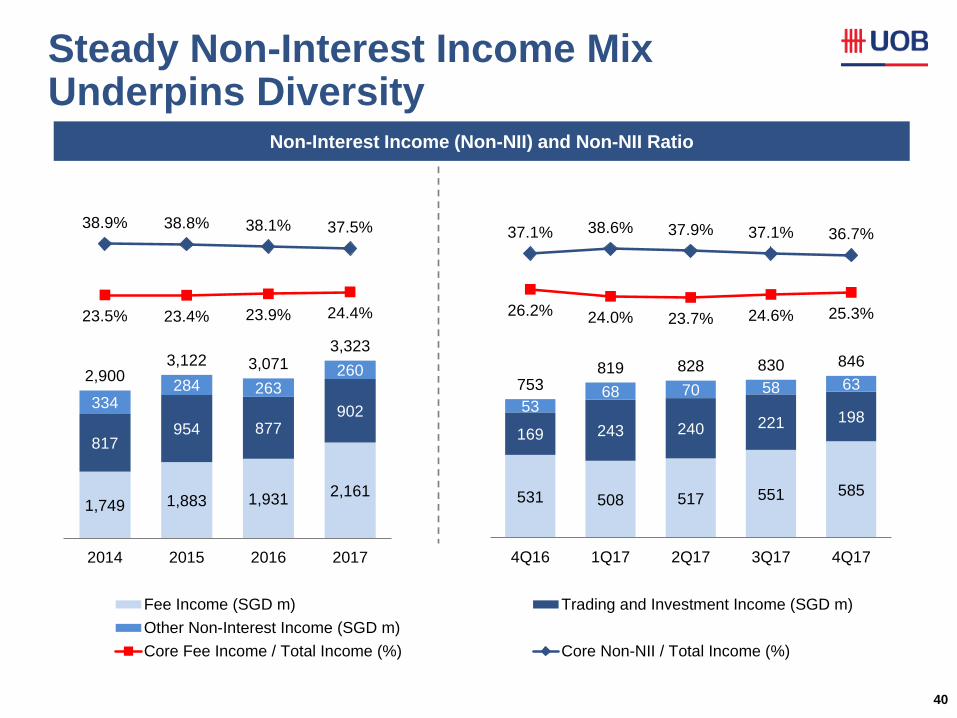
Steady Non-Interest Income Mix Underpins Diversity
40
1,749 1,883 1,931 2,161
817 954 877
902 334
284 263 260 2,900
3,122 3,071 3,323
23.5% 23.4% 23.9% 24.4%
38.9% 38.8% 38.1% 37.5%
-50.0%
-40.0%
-30.0%
-20.0%
-10.0%
0.0%
10.0%
20.0%
30.0%
40.0%
50.0%
800
1,300
1,800
2,300
2,800
3,300
3,800
4,300
4,800
5,300
2014 2015 2016 2017
Fee Income (SGD m) Trading and Investment Income (SGD m)
Other Non-Interest Income (SGD m)
Core Fee Income / Total Income (%) Core Non-NII / Total Income (%)
531 508 517 551 585
169 243 240 221 198 53
68 70 58 63 753 819 828 830 846
26.2% 24.0% 23.7% 24.6% 25.3%
37.1% 38.6% 37.9% 37.1% 36.7%
-50.0%
-40.0%
-30.0%
-20.0%
-10.0%
0.0%
10.0%
20.0%
30.0%
40.0%
50.0%
200
400
600
800
1000
1200
1400
4Q16 1Q17 2Q17 3Q17 4Q17
Non-Interest Income (Non-NII) and Non-NII Ratio
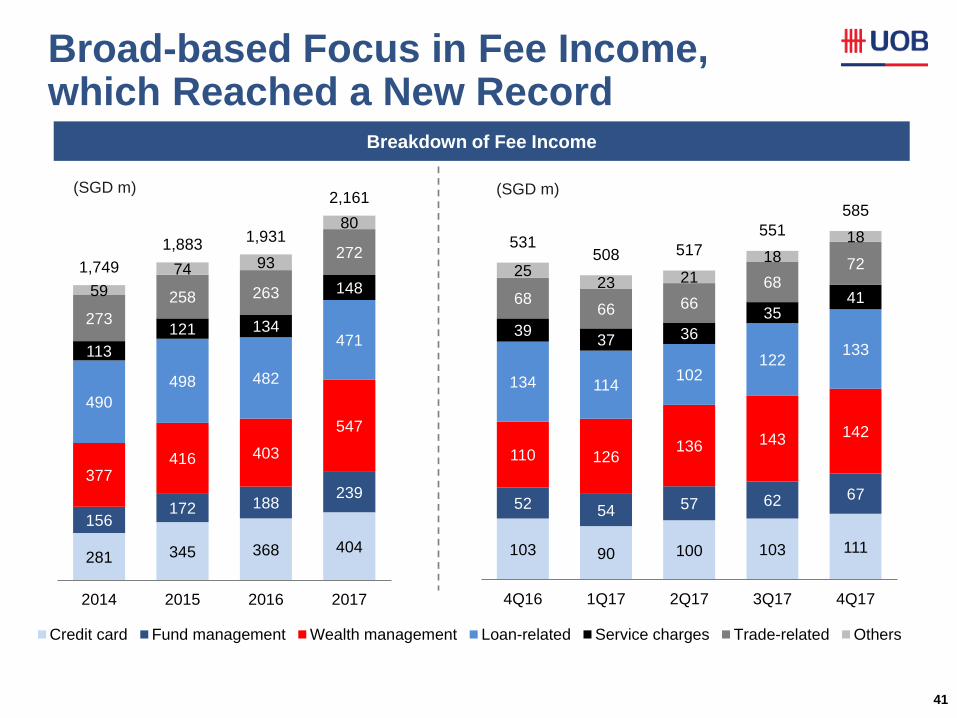
Broad-based Focus in Fee Income, which Reached a New Record
41
281 345 368 404
156 172 188
239 377
416 403
547
490
498 482
471 113
121 134
148
273
258 263
272
59
74 93
80
1,749
1,883 1,931
2,161
0
500
1,000
1,500
2,000
2014 2015 2016 2017
Credit card Fund management Wealth management Loan-related Service charges Trade-related Others
103 90 100 103 111
52 54 57 62 67
110 126 136 143 142
134 114 102
122 133
39 37 36
35 41 68
66 66
68 72 25
23 21
18
18 531 508 517
551
585
0
100
200
300
400
500
600
4Q16 1Q17 2Q17 3Q17 4Q17
(SGD m) (SGD m)
Breakdown of Fee Income
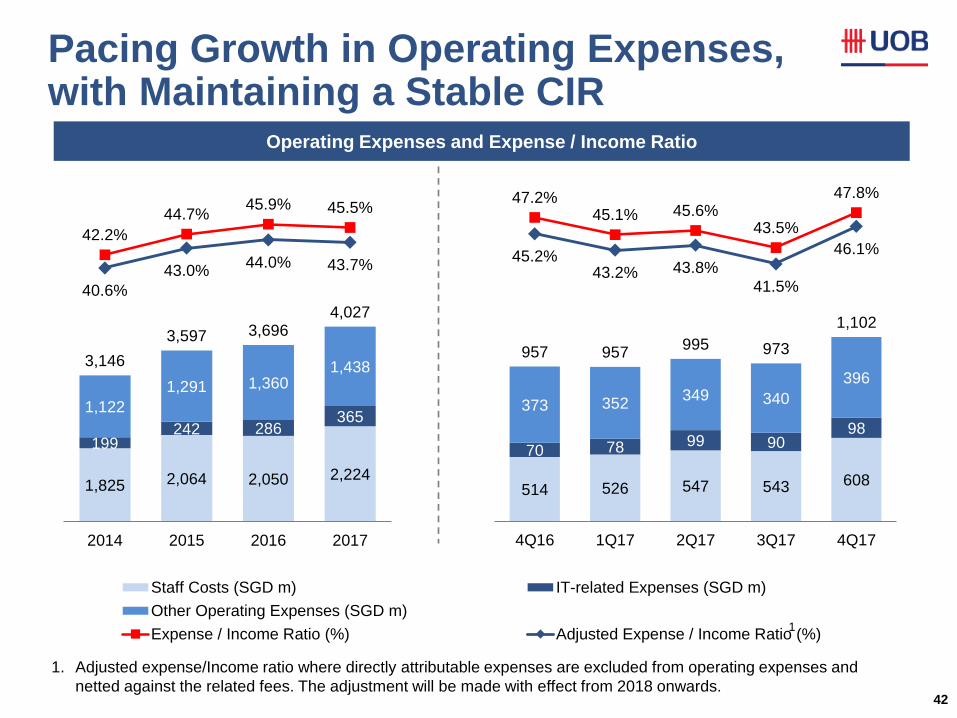
Pacing Growth in Operating Expenses, with Maintaining a Stable CIR
42
1,825 2,064 2,050 2,224
199 242 286
365 1,122
1,291 1,360 1,438 3,146
3,597 3,696 4,027
42.2%
44.7% 45.9% 45.5%
40.6%
43.0% 44.0% 43.7%
10.0%
15.0%
20.0%
25.0%
30.0%
35.0%
40.0%
45.0%
50.0%
500
1,500
2,500
3,500
4,500
5,500
6,500
2014 2015 2016 2017
Staff Costs (SGD m) IT-related Expenses (SGD m)
Other Operating Expenses (SGD m)
Expense / Income Ratio (%) Adjusted Expense / Income Ratio (%)
514 526 547 543 608
70 78 99 90 98
373 352 349 340
396
957 957 995 973
1,102
47.2% 45.1% 45.6%
43.5%
47.8%
45.2% 43.2% 43.8%
41.5%
46.1%
10.0%
15.0%
20.0%
25.0%
30.0%
35.0%
40.0%
45.0%
50.0%
200
400
600
800
1,000
1,200
1,400
1,600
1,800
4Q16 1Q17 2Q17 3Q17 4Q17
Operating Expenses and Expense / Income Ratio
1. Adjusted expense/Income ratio where directly attributable expenses are excluded from operating expenses and
netted against the related fees. The adjustment will be made with effect from 2018 onwards.
1
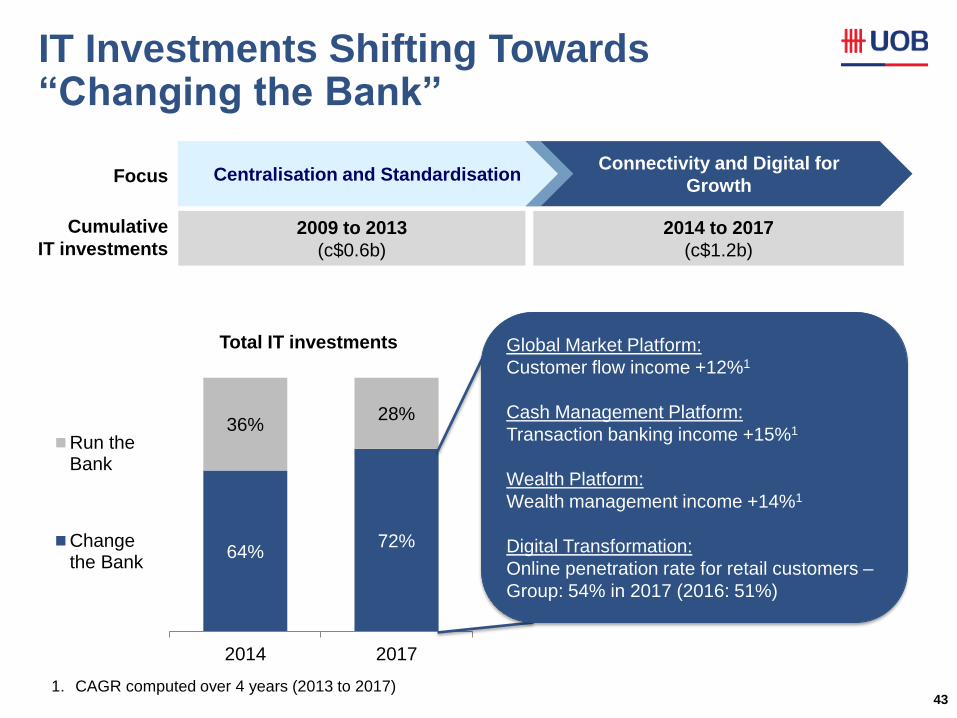
IT Investments Shifting Towards “Changing the Bank”
43
64% 72%
36% 28%
2014 2017
Run theBank
Changethe Bank
Total IT investments Global Market Platform:
Customer flow income +12%1
Cash Management Platform:
Transaction banking income +15%1
Wealth Platform:
Wealth management income +14%1
Digital Transformation:
Online penetration rate for retail customers –
Group: 54% in 2017 (2016: 51%)
1. CAGR computed over 4 years (2013 to 2017)
Connectivity and Digital for
Growth
2009 to 2013
(c$0.6b)
2014 to 2017
(c$1.2b)
Cumulative
IT investments
Focus Centralisation and Standardisation
44
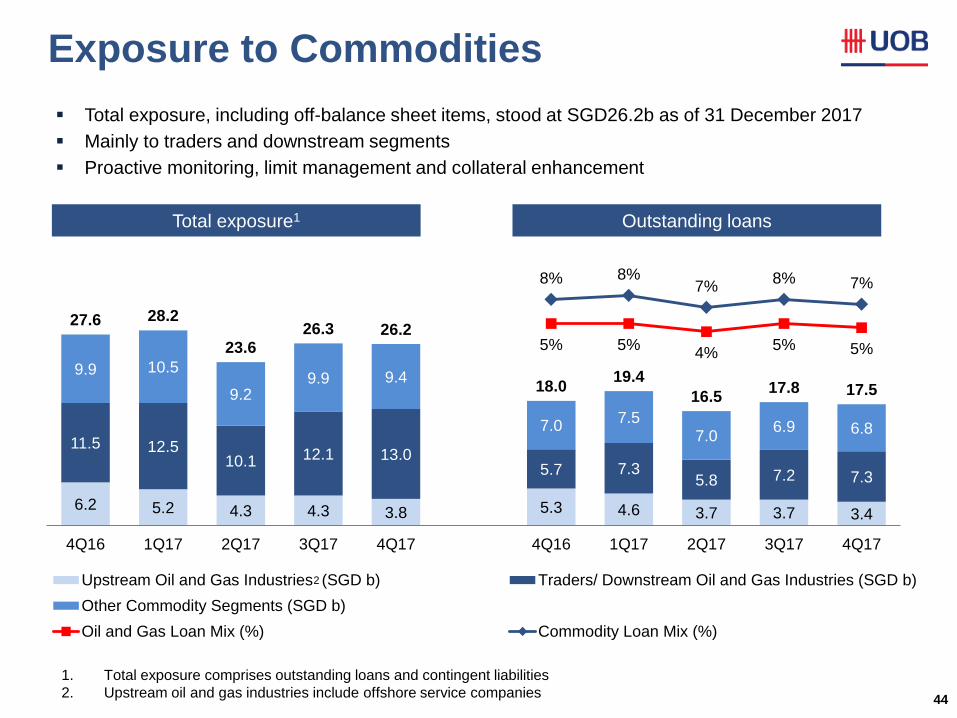
Exposure to Commodities
6.2 5.2 4.3 4.3 3.8 5.3 4.6 3.7 3.7 3.4
11.5 12.5 10.1 12.1 13.0
5.7 7.3 5.8 7.2 7.3
9.9 10.5
9.2 9.9 9.4
7.0 7.5
7.0 6.9 6.8
27.6 28.2
23.6 26.3 26.2
18.0 19.4
16.5 17.8 17.5
5% 5% 4%
5% 5%
8% 8% 7%
8% 7%
-0.2
-0.15
-0.1
-0.05
0
0.05
0.1
0.0
5.0
10.0
15.0
20.0
25.0
30.0
35.0
4Q16 1Q17 2Q17 3Q17 4Q17 4Q16 1Q17 2Q17 3Q17 4Q17
Upstream Oil and Gas Industries (SGD b) Traders/ Downstream Oil and Gas Industries (SGD b)
Other Commodity Segments (SGD b)
Oil and Gas Loan Mix (%) Commodity Loan Mix (%)
Total exposure, including off-balance sheet items, stood at SGD26.2b as of 31 December 2017
Mainly to traders and downstream segments
Proactive monitoring, limit management and collateral enhancement
1. Total exposure comprises outstanding loans and contingent liabilities
2. Upstream oil and gas industries include offshore service companies
Total exposure1 Outstanding loans
2
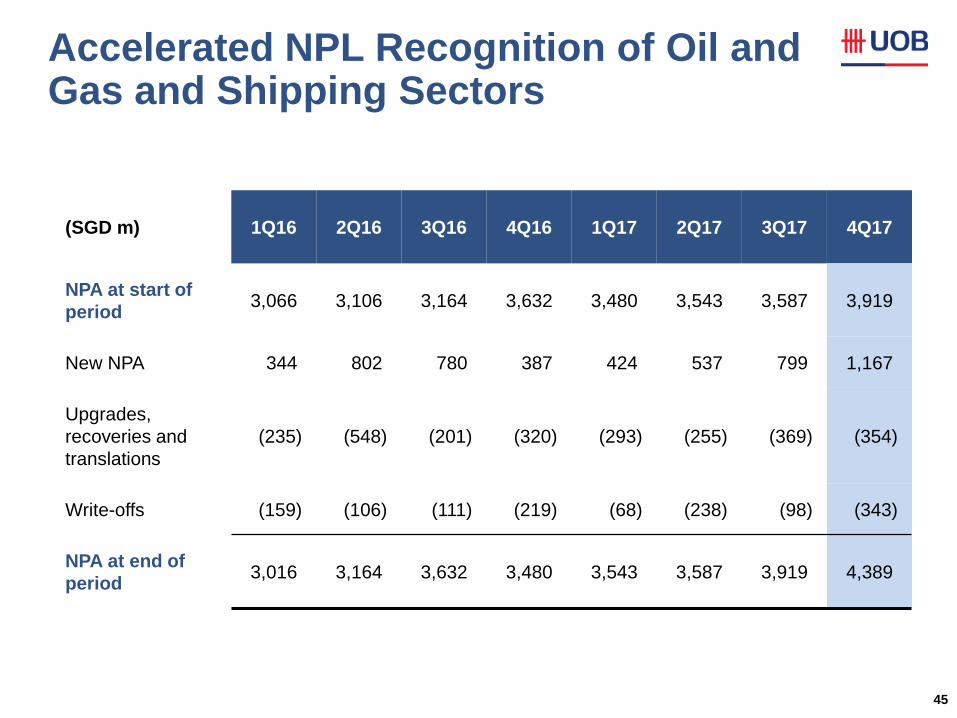
Accelerated NPL Recognition of Oil and Gas and Shipping Sectors
45
(SGD m) 1Q16 2Q16 3Q16 4Q16 1Q17 2Q17 3Q17 4Q17
NPA at start of
period 3,066 3,106 3,164 3,632 3,480 3,543 3,587 3,919
New NPA 344 802 780 387 424 537 799 1,167
Upgrades,
recoveries and
translations
(235) (548) (201) (320) (293) (255) (369) (354)
Write-offs (159) (106) (111) (219) (68) (238) (98) (343)
NPA at end of
period 3,016 3,164 3,632 3,480 3,543 3,587 3,919 4,389
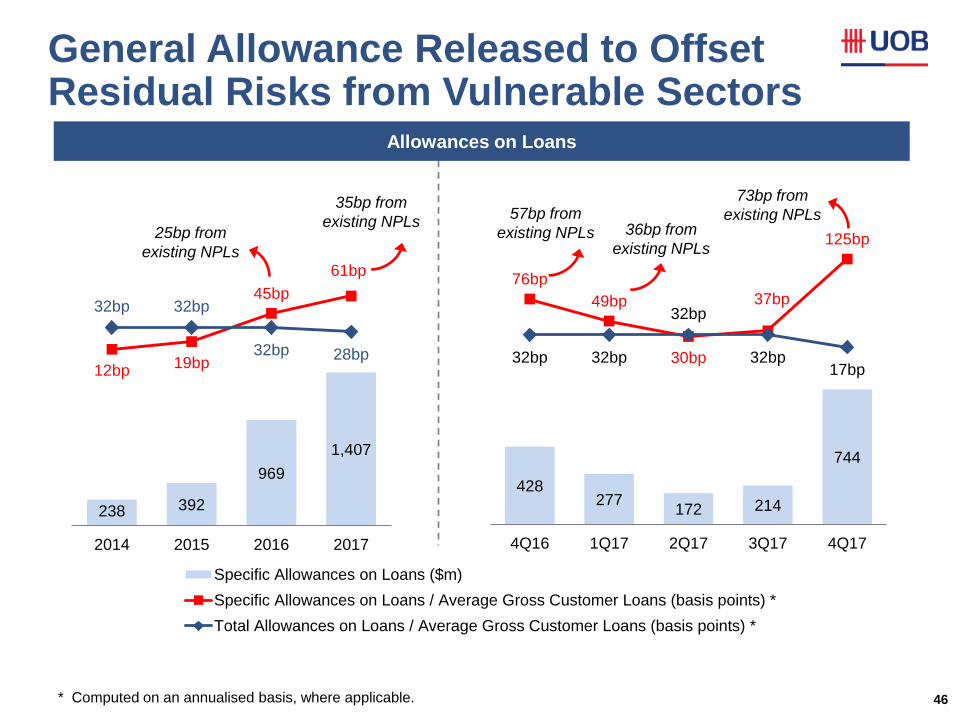
General Allowance Released to Offset Residual Risks from Vulnerable Sectors
46
238 392
969
1,407
12bp 19bp
45bp
61bp
32bp 32bp
32bp 28bp
(150)bp
(100)bp
(50)bp
0bp
50bp
100bp
150bp
0
500
1,000
1,500
2,000
2,500
3,000
2014 2015 2016 2017
Specific Allowances on Loans ($m)
Specific Allowances on Loans / Average Gross Customer Loans (basis points) *
Total Allowances on Loans / Average Gross Customer Loans (basis points) *
* Computed on an annualised basis, where applicable.
428 277
172 214
744
76bp
49bp
30bp
37bp
125bp
32bp 32bp
32bp
32bp 17bp
(200)bp
(150)bp
(100)bp
(50)bp
0bp
50bp
100bp
150bp
200bp
0
200
400
600
800
1000
1200
1400
1600
1800
4Q16 1Q17 2Q17 3Q17 4Q17
Allowances on Loans
57bp from
existing NPLs 36bp from
existing NPLs
73bp from
existing NPLs 35bp from
existing NPLs 25bp from
existing NPLs
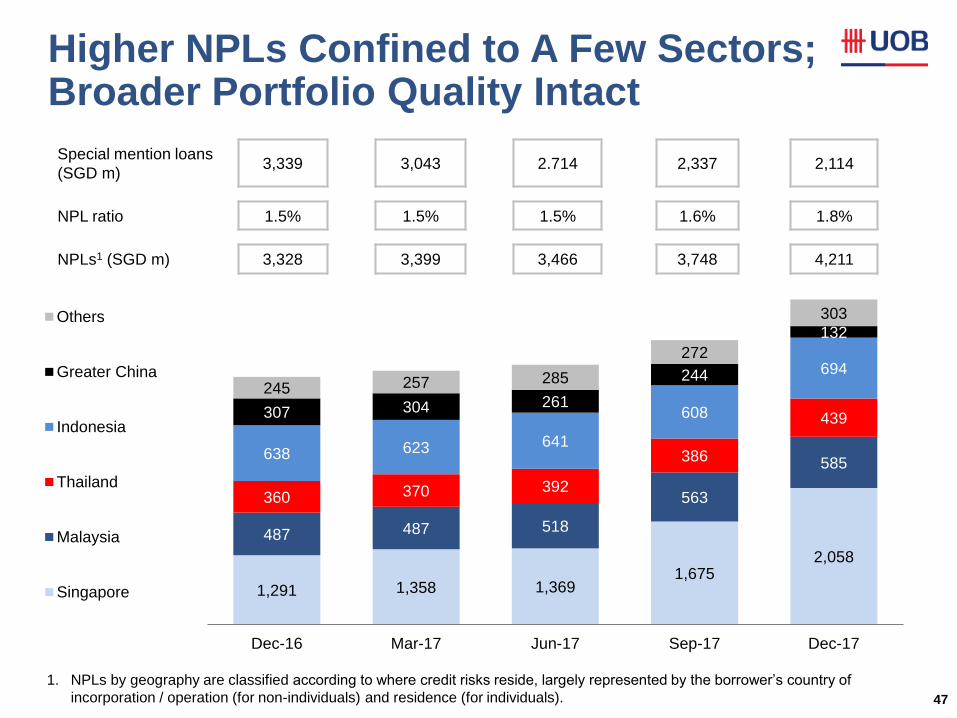
Higher NPLs Confined to A Few Sectors; Broader Portfolio Quality Intact
47
Special mention loans
(SGD m) 3,339 3,043 2.714 2,337 2,114
NPL ratio 1.5% 1.5% 1.5% 1.6% 1.8%
NPLs1 (SGD m) 3,328 3,399 3,466 3,748 4,211
1,291 1,358 1,369 1,675
2,058
487 487 518
563
585
360 370 392
386
439
638 623 641
608
694
307 304 261
244
132
245 257 285
272
303
500
1,000
1,500
2,000
2,500
3,000
3,500
4,000
4,500
Dec-16 Mar-17 Jun-17 Sep-17 Dec-17
Others
Greater China
Indonesia
Thailand
Malaysia
Singapore
1. NPLs by geography are classified according to where credit risks reside, largely represented by the borrower’s country of
incorporation / operation (for non-individuals) and residence (for individuals).
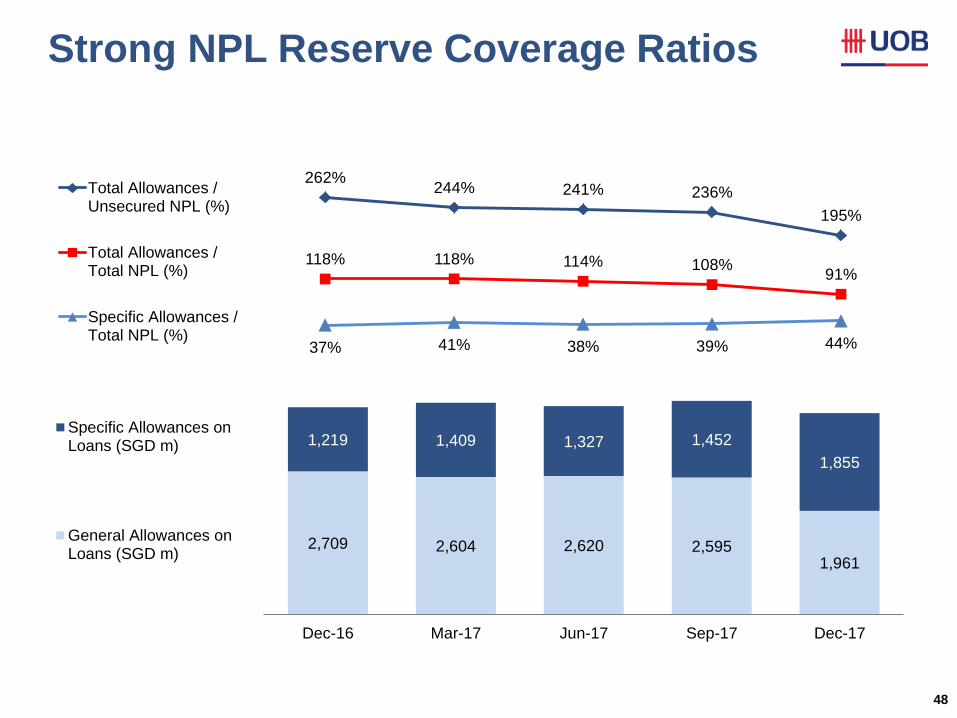
Strong NPL Reserve Coverage Ratios
48
2,709 2,604 2,620 2,595 1,961
1,219 1,409 1,327 1,452
1,855
0
500
1,000
1,500
2,000
2,500
3,000
3,500
4,000
4,500
Dec-16 Mar-17 Jun-17 Sep-17 Dec-17
Specific Allowances onLoans (SGD m)
General Allowances onLoans (SGD m)
262% 244% 241% 236%
195%
118% 118% 114% 108% 91%
37% 41% 38% 39% 44% 0%
50%
100%
150%
200%
250%
300%Total Allowances /Unsecured NPL (%)
Total Allowances /Total NPL (%)
Specific Allowances /Total NPL (%)
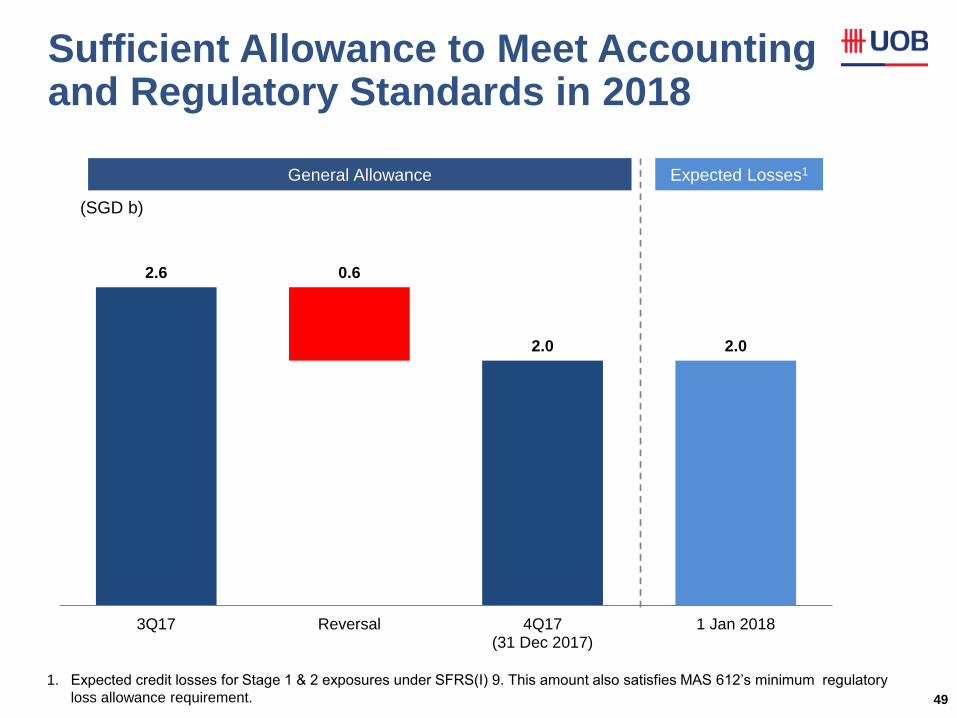
49
2.6 0.6
2.0 2.0
3Q17 Reversal 4Q17(31 Dec 2017)
1 Jan 2018
General Allowance Expected Losses1
(SGD b)
Sufficient Allowance to Meet Accounting and Regulatory Standards in 2018
1. Expected credit losses for Stage 1 & 2 exposures under SFRS(I) 9. This amount also satisfies MAS 612’s minimum regulatory
loss allowance requirement.
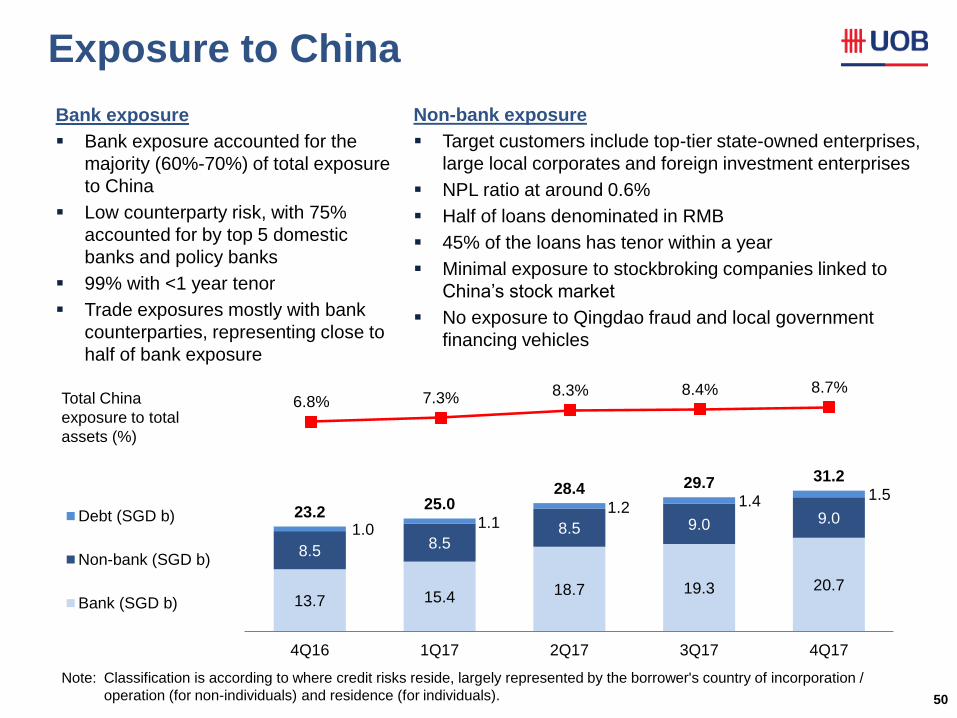
Exposure to China
50
Bank exposure
Bank exposure accounted for the
majority (60%-70%) of total exposure
to China
Low counterparty risk, with 75%
accounted for by top 5 domestic
banks and policy banks
99% with <1 year tenor
Trade exposures mostly with bank
counterparties, representing close to
half of bank exposure
Note: Classification is according to where credit risks reside, largely represented by the borrower's country of incorporation /
operation (for non-individuals) and residence (for individuals).
13.7 15.4 18.7 19.3 20.7
8.5 8.5
8.5 9.0 9.0 1.0 1.1
1.2 1.4 1.5 23.2
25.0 28.4 29.7 31.2
0.0
5.0
10.0
15.0
20.0
25.0
30.0
35.0
40.0
4Q16 1Q17 2Q17 3Q17 4Q17
Debt (SGD b)
Non-bank (SGD b)
Bank (SGD b)
Non-bank exposure
Target customers include top-tier state-owned enterprises,
large local corporates and foreign investment enterprises
NPL ratio at around 0.6%
Half of loans denominated in RMB
45% of the loans has tenor within a year
Minimal exposure to stockbroking companies linked to
China’s stock market
No exposure to Qingdao fraud and local government
financing vehicles
Total China
exposure to total
assets (%)
6.8% 7.3% 8.3% 8.4% 8.7%
5.0%
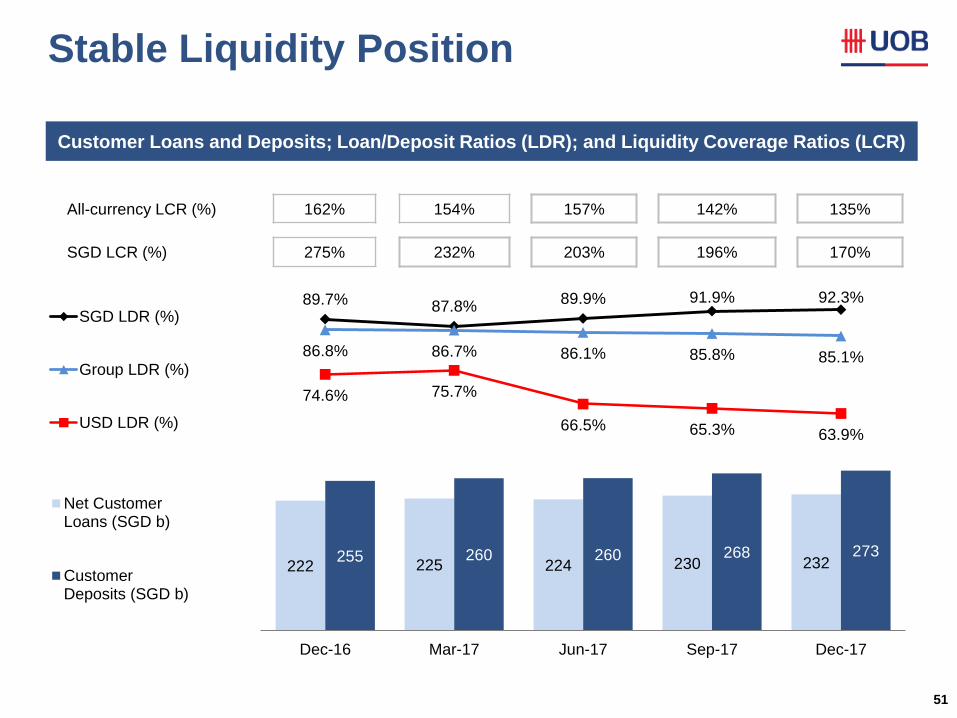
Stable Liquidity Position
51
All-currency LCR (%) 162% 154% 157% 142% 135%
SGD LCR (%) 275% 232% 203% 196% 170%
222 225 224 230 232 255 260 260 268 273
0
50
100
150
200
250
300
Dec-16 Mar-17 Jun-17 Sep-17 Dec-17
Net CustomerLoans (SGD b)
CustomerDeposits (SGD b)
89.7% 87.8% 89.9% 91.9% 92.3%
86.8% 86.7% 86.1% 85.8% 85.1%
74.6% 75.7%
66.5% 65.3% 63.9% 55.0%
65.0%
75.0%
85.0%
95.0%SGD LDR (%)
Group LDR (%)
USD LDR (%)
Customer Loans and Deposits; Loan/Deposit Ratios (LDR); and Liquidity Coverage Ratios (LCR)
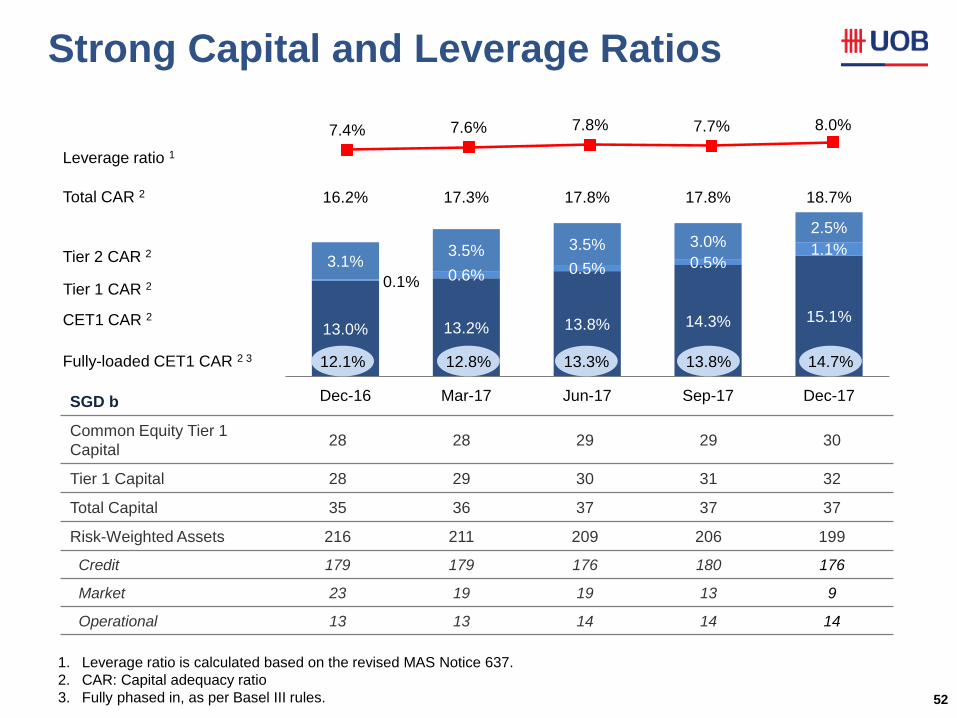
Strong Capital and Leverage Ratios
52
Tier 2 CAR 2
Total CAR 2
CET1 CAR 2
SGD b
Common Equity Tier 1
Capital 28 28 29 29 30
Tier 1 Capital 28 29 30 31 32
Total Capital 35 36 37 37 37
Risk-Weighted Assets 216 211 209 206 199
Credit 179 179 176 180 176
Market 23 19 19 13 9
Operational 13 13 14 14 14
Leverage ratio 1
1. Leverage ratio is calculated based on the revised MAS Notice 637.
2. CAR: Capital adequacy ratio
3. Fully phased in, as per Basel III rules.
13.0% 13.2% 13.8% 14.3% 15.1%
0.1% 0.6% 0.5% 0.5% 1.1%
3.1% 3.5% 3.5% 3.0%
2.5%
16.2% 17.3% 17.8% 17.8% 18.7%
-100000%
-80000%
-60000%
-40000%
-20000%
0%
5.0%
7.0%
9.0%
11.0%
13.0%
15.0%
17.0%
19.0%
Dec-16 Mar-17 Jun-17 Sep-17 Dec-17
14.7% 13.8% 13.3% 12.8% 12.1% Fully-loaded CET1 CAR 2 3
7.4% 7.6% 7.8% 7.7% 8.0%
5.0%
Tier 1 CAR 2
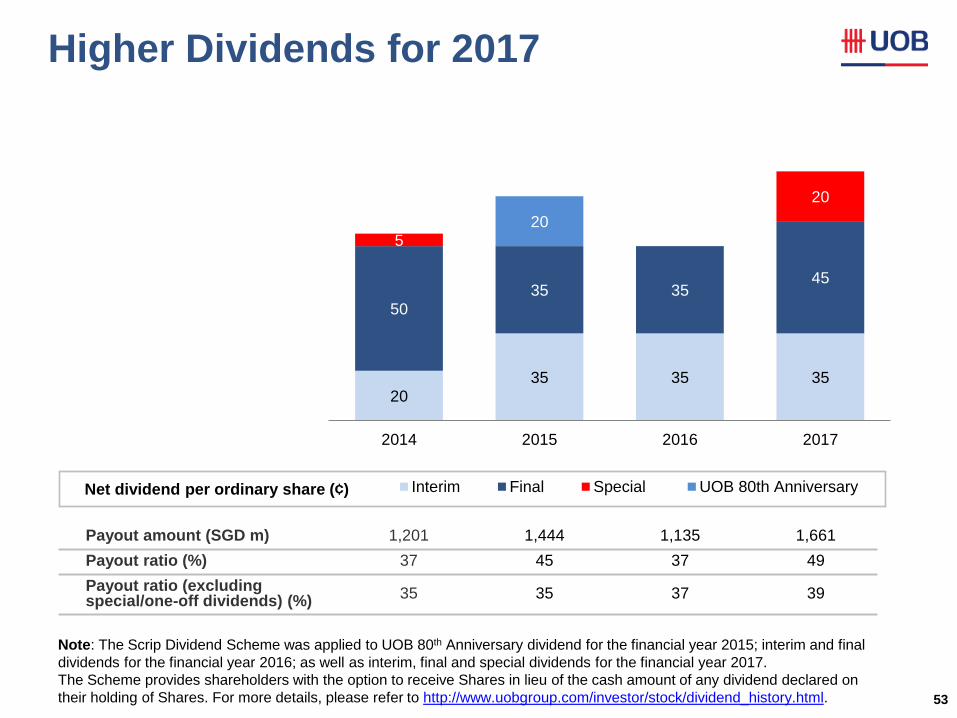
Higher Dividends for 2017
53
Net dividend per ordinary share (¢)
Payout amount (SGD m) 1,201 1,444 1,135 1,661
Payout ratio (%) 37 45 37 49
Payout ratio (excluding special/one-off dividends) (%)
35 35 37 39
20 35 35 35
50 35 35
45
5
20
20
2014 2015 2016 2017
Interim Final Special UOB 80th Anniversary
Note: The Scrip Dividend Scheme was applied to UOB 80th Anniversary dividend for the financial year 2015; interim and final
dividends for the financial year 2016; as well as interim, final and special dividends for the financial year 2017.
The Scheme provides shareholders with the option to receive Shares in lieu of the cash amount of any dividend declared on
their holding of Shares. For more details, please refer to http://www.uobgroup.com/investor/stock/dividend_history.html.
Thank You