Embed Size (px)
Citation preview

MOROCCO
REAL ESTATE
EQUITY PRIMER
See
tab
leof
fig
ure
s
UNVEILING
SOLID FUNDAMENTAL
STORIES BEHIND
THE PSYCHOLOGICAL
CURTAIN

1 Morocco Real Estate Equity Primer, November 16, 2015
Summary| Investment case
RECOMMENDATION
We recommend to buy Addoha (CS: ADH) with a price target at MAD 46.1 per share representing an
upside potential of 71%.
We recommend to buy Résidences Dar Saada (CS: RDS) with a price target at MAD 261 per share
representing an upside potential of 71.5%.
SUMMARY
Whether you are screening for anti-momentum stocks, following the Greenblatt’s motto “Buy low, Sell high”,
looking for stocks in distress climbing the hill, or haunting opportunities to invest in companies “who have
learned from their mistakes”, do not look any further: Moroccan real estate stocks offer a compelling
investment opportunity. While we think that we are approaching the end of the nightmare, and that the
sector will soon enter a bullish territory, we cannot emphasize enough the importance of stock selection.
It is true that stocks tend to trade in sympathy with each other when bad news hit the market, but this is only
happening because there is a general belief that the social housing market fundamentals have weakened
causing a series of adverse events in the sector.
This is why, we first show in this report that market fundamentals are healthy.
Indeed, some adverse evolutions of the sector’s key indicators triggered bearish sentiments while they should
be analyzed in their specific context. 1/As a matter of fact, the slowdown in the production of social
housing does not mean that the demand is anemic, but instead that the success in this business is
reliant on a deep know-how without which high margins are barely yielded. It is a business with high
entry barriers, where many entrants (neophytes) found their way out quite fast. The evolution of
housing starts for social and economical housing are bell-shaped with the top of the bell located in 2011 after
the 2010 fiscal reform which provided an attractive regulatory and fiscal framework to spur the segment.
Social housing production is now converging back to the pre-2010 era i.e. to normal levels.
If Addoha and Résidences Dar Saada emerged as the winners in an industry where many developers shied
away from the business, it is because they have in their DNA the capability to steer real estate projects
affectively. 2/As competition is lessening, ADH and RDS will be benefiting from a market that will
probably be undersupplied as shown by our estimates of the demand for social housing in the period
2014-2020E. In our base case, we find that 60% of households can afford social housing thanks to the
impetus resulting from demographic growth and urbanization but also thanks to a favorable regulatory and
fiscal framework as well as proper housing finance mechanisms that have allowed the supply of a housing
product that is bridging the affordability gap. Henceforth, we estimate demand for social housing at
610,200 units for the 2014-2020E period, and even when considering that there is no inventory of
households who would acquire social housing at the end of 2014, we find that demand stands at
490,200 units for the period or 81,700 units per annum to be compared to a production of social
housing that stood at 66,766 units in 2014 (production which is following a downward trend).
Although we derive estimates for the demand of social housing at the national level and show that social
housing is indeed undersupplied, 3/ we do insist on the fact that there are regional discrepancies and
that developers will need to go look for this demand at its actual location. We find as a matter of fact
that the Casablanca-Rabat axis is the region where the bulk of the demand is located.

2 Morocco Real Estate Equity Primer, November 16, 2015
A bottom-up analysis of ADH and RDS does corroborate the bullish sentiment triggered by our
macroeconomic analysis.
ADH have re-engineered their corporate strategy to re-focus on cash generation and increasing dividends.
The progress of the strategy has been showing so far that not only these objectives will be achieved, but also
and more importantly that 1/ADH might become one of the best yield stories in the Casablanca stock
exchange.
RDS is a great story of a developer engaged in a high growth cycle. RDS have an excellent track record of
beating their own guidance. Despite strong fundamentals, RDS has been suffering from a general climate of
reluctance to invest in the sector. As a result, 2/RDS offers today a wonderful investment opportunity
with a very nice entry point.
It is important to emphasize that the two developers are now facing an unprecedented opportunity to serve a
healthy demand undersupplied as a result of high entry barriers to an industry where value creation cannot
materialize unless the developer possesses multiple know-hows. It is also important to highlight the fact that
there is an experience curve that the two developers are leveraging and which explains the convergence of
many of their visions today. Some of the previous competitors of the two companies are distressed which
translate into wonderful land acquisition opportunities. Healthy balance sheets are at the center of
Management preoccupations, and top-notch risk management processes are being implemented to ensure
business perpetuation. 3/Finally, amid an unbeatable regulatory and fiscal framework, and a favorable
macroeconomic context, value creation cannot happen unless the developer’s corporate strategy is
appropriate and we show in the report that this concern is to be discarded.
The reader will find sections addressing elements of value creation and valuation in the sector as well
as more information on the sui generis nature of the social housing industry. Finally, a literature
review of studies around the subject and frequently asked questions are gathered at the end of the
report.

3 Morocco Real Estate Equity Primer, November 16, 2015
Note from the authors
This write-up is an attempt to decrypt the market where the publicly-traded Moroccan real
estate developers operate.
The transcendental motivation of this paper is to equip investors with a maximum of data
and information to make a sound investment decision based on fundamental indicators
beyond a general climate of reluctance to invest in the sector.
While all our findings are for the most part data-driven, we are aware that on the ground,
the (multivariate) equations can be very often more complex than what we present. We
choose to simplify most of the concepts and invite our readers to explore them in more
elaboration.
Beyond the aforementioned venture, we want this report to be a resource for an investor
who is exploring the sector to understand the specifications of the Moroccan Market.
Indeed, if Morocco’s success in fighting slums and reducing the housing deficit is praised
around the globe, it is because pioneering legal frameworks and innovative housing finance
mechanisms have been engineered.
Finally, the investment recommendations written in this report are indeed given in the
context of our macroeconomic study. However, and beyond the top-down approach
suggested by this document, a thorough bottom-up fundamental research of the companies
is used to generate these investment recommendations.
Figure 1-Social housing project in Deroua, South of Casablanca
Source: Résidences Dar Saada

4 Morocco Real Estate Equity Primer, November 16, 2015
Contents Summary| Investment case ........................................................................................................................................................................ 1
Note from the authors ................................................................................................................................................................................... 3
Contents ............................................................................................................................................................................................................... 4
Introduction: Motivation & Scope of the study .................................................................................................................................. 5
Abstract: Investment Thesis ....................................................................................................................................................................... 6
Part I: The Social Housing Market ........................................................................................................................................................... 7
The story of social housing, backbone of the real-estate industry in morocco .............................................................. 7
Preliminary question: Relevance of narrating the social housing production story .............................................. 8
Before 2010, things worked until they did not ....................................................................................................................... 9
Euphoric times ..................................................................................................................................................................................... 10
Current Environment: Back to pre-euphoria levels or heading towards the new normal? .............................. 13
Decrypting the evolution of the housing deficit.................................................................................................................... 14
Macroeconomic Fundamentals .......................................................................................................................................................... 15
Reviewing the indicators of the sector ..................................................................................................................................... 15
Estimating Demand for Social Housing .................................................................................................................................... 18
Microeconomics ....................................................................................................................................................................................... 31
The Casablanca-Rabat axis : The mecca of social housing ..................................................................................................... 39
Importance of the sector ...................................................................................................................................................................... 41
Part II: Stocks in the CSE ............................................................................................................................................................................ 45
A backward Glance At Real Estate Stocks ..................................................................................................................................... 45
CFG Coverage Universe ......................................................................................................................................................................... 48
Addoha: Strategy Re-engineered to Sustain Cash Generation........................................................................................ 49
Résidences Dar Saada: A Beautiful House in A Bad Neighborhood ............................................................................. 60
Part III: Elements of value creation and valuation in the industry ......................................................................................... 72
Detailed analysis of the internal rate of return of a social housing project ................................................................... 72
Impact of capitalized interests on the calculation of the (FCFF) ........................................................................................ 79
Appendix 1 –Literature Review .............................................................................................................................................................. 80
Appendix 2 – FAQs ........................................................................................................................................................................................ 87
Industry references ...................................................................................................................................................................................... 92
Table of figures ............................................................................................................................................................................................... 93
Bibliography .................................................................................................................................................................................................... 96
Disclaimer ......................................................................................................................................................................................................... 97

5 Morocco Real Estate Equity Primer, November 16, 2015
Introduction: Motivation & Scope of the study
Morocco social housing business: “It is not the strongest that survives but the most adaptable”
Figure 2- Value1 of MAD 100 invested in ADH, RDS and the CFG 25 Index at the time of RDS IPO (Dec 18th 2014)
Source: CFG Research
The Real Estate players publicly-traded in the Casablanca Stock Exchange, have an important portion of their
revenue coming from the social housing activity2. The Moroccan real estate stock market is in fact a social
housing story. It is thus critical to have a comprehensive understanding of this business. The social housing
business is the main focus of this paper. Basically, the companies that we are focusing on are in the business
of supplying housing to low-income households. It means that the success of this business is dependent upon
the existence of low-income households who can afford to acquire this housing product. In other terms, not
only do we need a pool of low-income households in need of housing but also a sound macroeconomic
context, favorable legal frameworks and adapted housing finance mechanisms.
Referring back to the questions expressed above, a weakness in the market would mean either a lack of
demand or a fragility of either the economy or the mechanisms put in place to supply housing for the poor.
We discard in our paper both eventualities. Now, the real mission statement of the publicly-traded developers
has evolved to become the production of housing that matches the existing demand. The selection of projects
to be developed is solely driven by the conviction that there will be acquirers for the type of housing
produced. This inherent flexibility might suggest that these players will be able to sustain their business
beyond changes in the macroeconomic and demographic landscapes.
In order to invest in Moroccan real estate stocks, one should have the confidence that developers can
adapt to the changes in the need for housing so that need could almost always translate into demand.
1 All the returns are price returns and henceforth do not include dividends. 2 Indeed, social housing accounts for the bulk of both units delivered and revenue in value of the two Real-Estate
developers that we are currently covering i.e. Addoha (ADH) and Residences Dar Saada (RDS).
55
65
75
85
95
105
115
Dec-14 Jan-15 Feb-15 Mar-15 Apr-15 May-15 Jun-15 Jul-15 Aug-15 Sep-15
Price return RDS Price return ADH Price return CFG 25 Index
This research piece is being written amid
an absolutely anemic performance of
Moroccan real estate stocks. The naïve
interrogation that arises almost naturally
is whether this pallid performance is a
telling barometer. Going further, if there
is evidence that the business environment
is indeed in ill health, could we argue that
the current weaknesses are only
symptomatic of short-term issues that
will be soon overcome?
This is a cardinal question from an
investment standpoint. Indeed, the
answer can suggest whether at the sector
level, performances are approaching a
nadir in which case the bulls should start
roaring.

6 Morocco Real Estate Equity Primer, November 16, 2015
Abstract: Investment Thesis ADH and RDS offer a compelling investment opportunity with a decent entry point
Whether you are screening for anti-momentum stocks, following
the Greenblatt’s motto “Buy low, Sell high”, looking for stocks in
distress climbing the hill, or haunting opportunities to invest in
companies “who have learned from their mistakes”, do not look
any further: Moroccan real estate stocks offer a compelling
investment opportunity.
While we think that we are approaching the end of the nightmare,
and that the sector will soon enter a bullish territory, we cannot
emphasize enough the importance of stock selection. It is true
that stocks tend to trade in sympathy with each other when bad
news hit the market, but this is only happening because there is a
general belief that the social housing market fundamentals have
weakened causing a series of adverse events in the sector.
This is why, we first review in this report and show that market
fundamentals are overall healthy and that it is more important
than ever for real estate developers to be sensitive to the needs of
the market and to constantly adapt to those. We then present the
general sentiment in the market and review the two stocks that
we are covering. We recommend buying the two stocks that we
are covering: ADH and RDS.
Figure 3 - ADH and RDS since their IPO vs. the CFG25 Index (Prices in MAD)
Source: CFG Research
15,000
17,000
19,000
21,000
23,000
25,000
27,000
29,000
31,000
20
70
120
170
220
Jul-
06
Sep
-06
No
v-0
6Ja
n-0
7M
ar-0
7M
ay-0
7Ju
l-0
7Se
p-0
7N
ov
-07
Jan
-08
Mar
-08
May
-08
Jul-
08
Sep
-08
No
v-0
8Ja
n-0
9M
ar-0
9M
ay-0
9Ju
l-0
9Se
p-0
9N
ov
-09
Jan
-10
Mar
-10
May
-10
Jul-
10
Sep
-10
No
v-1
0Ja
n-1
1M
ar-1
1M
ay-1
1Ju
l-1
1Se
p-1
1N
ov
-11
Jan
-12
Mar
-12
May
-12
Jul-
12
Sep
-12
No
v-1
2Ja
n-1
3M
ar-1
3M
ay-1
3Ju
l-1
3Se
p-1
3N
ov
-13
Jan
-14
Mar
-14
May
-14
Jul-
14
Sep
-14
No
v-1
4Ja
n-1
5M
ar-1
5M
ay-1
5Ju
l-1
5Se
p-1
5
RDS (IPO Dec 2014) ADH (IPO Jul 2006) CFG 25 Index (right axis)
“Moroccan real estate stocks offer a
compelling investment opportunity”
“We cannot emphasize enough the
importance of stock selection”
“We show that the market
fundamentals are overall healthy”
“We recommend buying the two
stocks that we are covering: ADH
and RDS”
7 Morocco Real Estate Equity Primer, November 16, 2015
Part I: The Social Housing Market
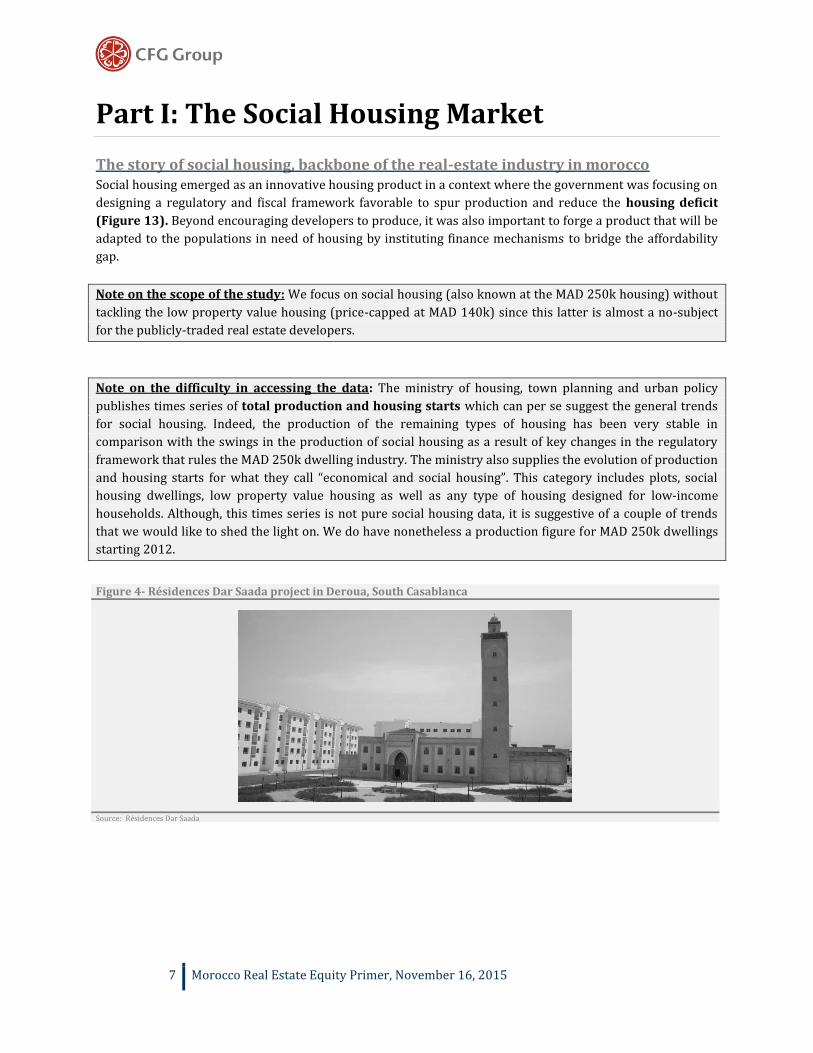
The story of social housing, backbone of the real-estate industry in morocco Social housing emerged as an innovative housing product in a context where the government was focusing on
designing a regulatory and fiscal framework favorable to spur production and reduce the housing deficit
(Figure 13). Beyond encouraging developers to produce, it was also important to forge a product that will be
adapted to the populations in need of housing by instituting finance mechanisms to bridge the affordability
gap.
Note on the scope of the study: We focus on social housing (also known at the MAD 250k housing) without
tackling the low property value housing (price-capped at MAD 140k) since this latter is almost a no-subject
for the publicly-traded real estate developers.
Note on the difficulty in accessing the data: The ministry of housing, town planning and urban policy
publishes times series of total production and housing starts which can per se suggest the general trends
for social housing. Indeed, the production of the remaining types of housing has been very stable in
comparison with the swings in the production of social housing as a result of key changes in the regulatory
framework that rules the MAD 250k dwelling industry. The ministry also supplies the evolution of production
and housing starts for what they call “economical and social housing”. This category includes plots, social
housing dwellings, low property value housing as well as any type of housing designed for low-income
households. Although, this times series is not pure social housing data, it is suggestive of a couple of trends
that we would like to shed the light on. We do have nonetheless a production figure for MAD 250k dwellings
starting 2012.
Figure 4- Résidences Dar Saada project in Deroua, South Casablanca
Source: Résidences Dar Saada

8 Morocco Real Estate Equity Primer, November 16, 2015
Preliminary question: Relevance of narrating the social housing production story
The farewell of the neophytes
Our study is all about revealing the solid fundamental story clouded as a result of a general climate of
reluctance to invest in the sector. Some adverse evolutions of the sector’s indicators triggered bearish
sentiments while they should be analyzed in their specific context. More importantly, it is essential to analyze
whether the underlying adversity does translate into a threat for the developer. Indeed, in the case of social
housing for instance, the slowdown in production does not mean that the demand is so anemic that
production is being readjusted, but instead that the success in this business is reliant on a deep know-how
without which high margins are barely yielded. It is a business with high entry barriers, where many entrants
(neophytes) found their way out quite fast. First, we look at the evolution of housing starts and production
for social housing from 2012 to 2014. (This data is clean MAD 250 dwelling data).
Figure 5- Social housing –Evolution of Housing Starts and Production from 2012 to 2014
Source: National association of real estate developers
But who are the neophytes? When did they enter and why did they so? Also, while it is comforting to
understand the reasons behind this plunge, it is essential to gauge whether production has not fallen much
lower than before these neophytes entered the industry, and this is what we verify using the data supplied by
the Ministry of housing although it is not pure social housing data.
We answer all these interrogations as we narrate the story of the industry.
Everything else held equal (demand held equal), a lower supply is a great opportunity for the
publicly-traded social housing developers.
130,938
71,791
41,108
25,517
60,24566,766
2012 2013 2014
Social housing starts Social housing production
Housing starts fell by 45.2% from
2012 to 2013 as a result of many
developers leaving the industry.
This event is what we baptize the
farewell of the neophytes.
This fall should be very visible in
2015E since the average production
cycle lasts 18 months.

9 Morocco Real Estate Equity Primer, November 16, 2015
Before 2010, things worked until they did not Housing starts of the social and economical housing category increased from 2003 to 2006 before starting to
decrease in 2007 and 2008 which required the intervention of government to re-accelerate the production of
housing and further tighten the structural housing deficit. Indeed, production decreased in 2009 and 2010.
Per contra, housing starts did soar by more than 34% in 2010 as a result of the reform legislated in the 2010
budget bill.
Figure 6- Housing Starts and Production of social and economical housing in Morocco in the period 2003-2010
Source: Ministry of Housing, Town Planning and Urban Policy
As a matter of fact, social housing is one of the major tools used by government to tighten the housing deficit,
and government has made it their priority to sustain healthy levels of production of social housing.
The 2007 fall in housing starts motivated a reform of the fiscal and regulatory framework legislated in the
2008 budget bill and shown in the table below.
Figure 7- Main elements regarding social housing in the 2008 budget bill
Source: 2008 budget bill
The regulatory framework ruled in 2008 barely stimulated an increase in production. Indeed, housing starts
resumed their plunge in 2008 and 2009. Despite the corporate tax decrease and the reduction of the size of
152
173
200
235
221213
157
211
60
103113 115
121129
9099
2003 2004 2005 2006 2007 2008 2009 2010
Housing Starts (000s) Production (000s)
Taxation (Article 19) Corporate tax stands at 17.5% and then increases by 2.5 points every fiscal year from 2011 to 2015 vs. a reduction of the corporate tax by 50% previously
Project requirements (Article 247)
The developer signs agreements with the government to build at least 1500 units vs. 2500 units previously
10 Morocco Real Estate Equity Primer, November 16, 2015
the mandatory production to sign an agreement with government, developers were not attracted enough to
launch new projects. The important information here is that social housing which is an apartment currently
price-capped at MAD 250k used to sell at MAD 200k at that time putting substantial pressures on the
potential on the project IRR.
Euphoric times
In 2010, the Ministry of Economy and Finance put in place a
couple of fiscal reforms to encourage the production and the
acquisition of social housing units. A social housing unit was
redefined as housing within a surface hovering between
50m² and 100m² and price-capped at MAD 250k excluding
the VAT. The sizable increase of the capped-price of a social
housing unit from MAD 200k in the 2008 budget bill to MAD
250k in the 2010 budget bill boosted considerably the attractiveness of the social housing industry. The
reform also waives the VAT for the acquirer of social housing provided that the unit is bought from a real
estate developer, a company or a person who has an agreement with the government and providing that the
transaction is wholly monitored by a notary. More
importantly, the unit acquired has to be the primary
residence of the acquirer for a minimum period of four years.
The 2010 budget bill incentivized the production of social
housing via the following benefits to developers: All of
corporate tax, registration fees, stamp duty, local authority
tax, registration duty, and the tax on cement are waived.
These incentives are tributary of the signature of an
agreement with the government stating that the developer
will produce at least 500 social housing units within five
years of the receipt of the building permit. This requirement
is less heavy than the 1,500 units required in the 2008 budget bill.
The regulatory and fiscal framework legislated in the 2010 budget bill is valid for a period of 10 years from
2010 until the end of 2019. However, if a developer signs an agreement in 2019, then the rules in the 2010
budget bill will be grandfathered until 2024. This long-term visibility is encouraging for developers who
engage in a business where fiscal stability is provided for at least 10 years. (Also interesting from an equity
investment standpoint since the main drivers of profitability should remain constant for the horizon
mentioned).
“The sizable increase of the capped-
price of a social housing unit from MAD
200k in the 2008 budget bill to MAD
250k in the 2010 budget bill boosted
considerably the attractiveness of the
social housing industry”
“The regulatory and fiscal framework
legislated in the 2010 budget bill is
valid until 2024: long-term visibility
for developers who engage in a
business with a 15 year fiscal stability.
(Interesting from an equity investment
standpoint since the main drivers of
profitability should remain constant
for the horizon mentioned)”

11 Morocco Real Estate Equity Primer, November 16, 2015
Figure 8- Main elements regarding social housing in the 2010 budget bill
Source: 2010 budget bill
Note on the advantage for acquirers of housing: Government waives the payment of the VAT. The
government pays this VAT to developers via the notary who orchestrated the transaction in order to monitor
every transaction and verify that the acquirer of housing is compliant with the conditions of the 2010 budget
bill. This process can be lengthy in some cases.
As a result of the 2010 fiscal reform, housing starts soared in 2011 which translated into higher production
figures in 2013 and 2014.
Figure 9- Housing Starts and Production of social and economical housing in Morocco in the period 2010-2014
Source: Ministry of Housing, Town Planning and Urban Policy
Acquirers The VAT is waived for the acquirer under the following conditions:
1/ The unit is bought from a real estate developer, a company or a person who has an agreement with the government and providing that the transaction is wholly monitored by a notary.
2/ More importantly, the unit acquired has to be the primary residence of the acquirer for a minimum period of four years.
3/Provide the government with a first- or second-rank housing collateral
Developers Fiscal and regulatory framework valid from 2010 to 2020 (actually until 2025 if last agreement signed in 2010);
A social housing units has a surface between 50m² and 100m² and is price-capped at MAD 250k;
Agreements with government to build at least 500 units for a maximum of 5 years after the authorization to build is issued;
All of orporate tax, registration fees, stamp duty, local authority tax, registration duty, and the tax on cement are waived
211
333
268
193180
99
135122
143 141
2010 2011 2012 2013 2014
Housing Starts (000s) Production (000s)
12 Morocco Real Estate Equity Primer, November 16, 2015
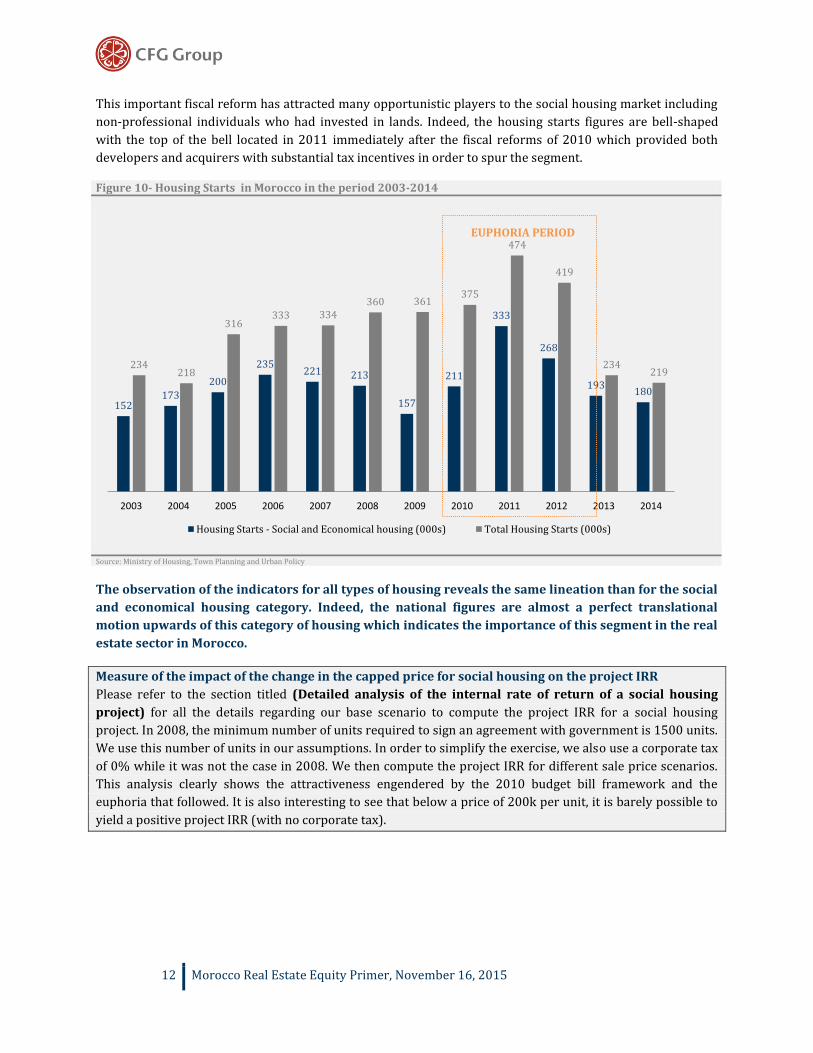
This important fiscal reform has attracted many opportunistic players to the social housing market including
non-professional individuals who had invested in lands. Indeed, the housing starts figures are bell-shaped
with the top of the bell located in 2011 immediately after the fiscal reforms of 2010 which provided both
developers and acquirers with substantial tax incentives in order to spur the segment.
Figure 10- Housing Starts in Morocco in the period 2003-2014
Source: Ministry of Housing, Town Planning and Urban Policy
The observation of the indicators for all types of housing reveals the same lineation than for the social
and economical housing category. Indeed, the national figures are almost a perfect translational
motion upwards of this category of housing which indicates the importance of this segment in the real
estate sector in Morocco.
Measure of the impact of the change in the capped price for social housing on the project IRR
Please refer to the section titled (Detailed analysis of the internal rate of return of a social housing
project) for all the details regarding our base scenario to compute the project IRR for a social housing
project. In 2008, the minimum number of units required to sign an agreement with government is 1500 units.
We use this number of units in our assumptions. In order to simplify the exercise, we also use a corporate tax
of 0% while it was not the case in 2008. We then compute the project IRR for different sale price scenarios.
This analysis clearly shows the attractiveness engendered by the 2010 budget bill framework and the
euphoria that followed. It is also interesting to see that below a price of 200k per unit, it is barely possible to
yield a positive project IRR (with no corporate tax).
152173
200
235221 213
157
211
333
268
193180
234218
316333 334
360 361375
474
419
234219
2003 2004 2005 2006 2007 2008 2009 2010 2011 2012 2013 2014
Housing Starts - Social and Economical housing (000s) Total Housing Starts (000s)
EUPHORIA PERIOD

13 Morocco Real Estate Equity Primer, November 16, 2015
Figure 11- Project IRR under different sale price scenarios
Source: CFG Research
Current Environment: Back to pre-euphoria levels or heading towards the new normal? Since 2013, production of social housing has been cooling
down. The first driver behind the decrease in social housing
production is tied to the nature of the business. Indeed, there
are very high entry barriers to producing social housing: There
are many administrative burdens that one can only alleviate by
having a deep know-how of the system. Moreover, having
access to strategic lands situated where the demand exists is
actually a real Gordian knot. Furthermore, the acquisition of big
lands to build social housing projects requires a sizable
financial capability creating a high entry barrier to a capital-
intensive industry. As a result, many “non-professional” players
are vanishing from the industry. Also, since some large real
estate players find themselves in need of cash, they made the
strategic choice of reducing the size of their production. The need of cash came as unsold units number
started to climb as a result of mistakes made by developers who built projects that outsized the local demand
and who were focusing on increasing production and sales volumes at the expense of cash generation. At
many instances, the market interpreted the phenomenon of unsold inventories as being the result of a
diminishing social housing demand. A cardinal question that we will be investigating is whether the
future of the industry is going to look like the pre-euphoria period or whether we will be witnessing a
change of shape of the social housing industry in which case it is critical to gauge the ability of real
estate developers to adapt to this change and to sustain their business beyond macroeconomic, urban
and social transformations. From an investment standpoint, it is critical to see the slowdown in housing
starts and production as a return to equilibrium rather than as a deterioration of the fundamentals of the
sector. There have been a few amendments to the 2010 fiscal reform that we are highlighting below. We
particularly highlight the 2012 amendment that allow an investor-lessor to acquire social housing as an
important reform to bridge the down payment affordability gap as well as to find an alternative for
populations who cannot or do not want to get a mortgage.
-2.2%
0.6%
3.3%
6.0%
8.5%
11.0%
13.5%
15.9%
18.2%
180 190 200 210 220 230 240 250 260
Price per unit (kMAD)
Maximum sale price under the 2008 budget
Maximum sale price under the 2010 budget bill
“The Casablanca-Rabat axis is today
the only region where demand for
social housing is plentiful”
“From an investment standpoint, it
is critical to see the slowdown in
housing starts and production as a
return to equilibrium rather than
as a deterioration of the
fundamentals of the sector”

14 Morocco Real Estate Equity Primer, November 16, 2015
Figure 12- Amendments to the 2010 fiscal reform legislated in 2012, 2013 and 2014
Source: 2010 budget bill
Decrypting the evolution of the housing deficit In 2002, the structural need for housing stood at 1.2 million units. This deficit was reduced to 608,000 units
in 2010 before climbing back to 840,000 units in 2011. An intervention of government in 2010 helped resume
reduce the deficit starting 2012 thanks to a spike in housing starts after the 2010 budget bill was legislated.
Since 2011, the deficit has been scaling down to stand at 746,000 units in 2012, 650,000 units in 2013 and
finally 580,000 units in 2014.
Figure 13- Evolution of the housing deficit from 2002 to 2010 and then from 2010 to 2014
Source: Ministry of Housing, Town Planning and Urban Policy
2012 - Encouraging the acquisition of investors-lessors of social housing to bridge the downpayment affordability gap
The investor-lessor can buy at least 25 units in a project for the purpose of renting them vs. an acquisition solely possible for primary residence previously;
The investor-lessors benefits during 20 years from the exemption of the VAT, the corporate tax and the income tax for both revenue and capital gains;
An agreement needs to be signed between the investor-lessor (necessatrily a company) and the government, the units need to be acquired during the 12 years following the signature of the agreement and need to be rentred during the 6 months following the acquisition;
The monthly rent is fixed at MAD 1,200. This monthly rent was increased to MAD 1,200 in the 2015 budget bill to further boost the social housing market
2013 1/ Change of the definition of a social housing unit surface to a surface between 50m² and 80m² vs. between 50m² and 100m² previously;
2/VAT is now waived for an acquirer although a partner owns already a primary residence vs. indivision agreement previously;
1,200,000
608,000
840,000
746,000
650,000580,000
2002 2010 2011 2012 2013 2014
GOVERNMENT INTERVENTION NEEDED
CAGR: -8,15%

15 Morocco Real Estate Equity Primer, November 16, 2015
Macroeconomic Fundamentals Reviewing the indicators of the sector Garbage in – Garbage out
Whenever we are faced with the gargantuan task of giving a
diagnosis of the social housing market in Morocco, we do seem
very optimistic. We do find that it is mainly because we are
usually benchmarked to morose sentiments backed by the
weakness of some fundamental indicators. Our approach is also
data-driven. Now, it is essential to select the indicators that apply
to the social housing business. The first and quickest health
check is to determine whether social housing is still selling. For
that, we look at the pre-sales of ADH and RDS. In H1 2015,
Résidences Dar Saada who have projects mainly located in the
Casablanca-Rabat axis pre-sold 2,596 units (up 7% YoY) while
ADH pre-sold 6,579 units excluding high-end housing (down
30% YoY). The decline in ADH’s pre-sales is mainly due to their
current corporate strategy baptized “Cash Generation Plan” and
which put heavy restrictions on the launch of the production of
new tranches and henceforth on pre-sales as in order to focus the commercial efforts on selling inventories of
unsold units. Addoha’s inventories of unsold units are mainly located outside of the Casablanca-Rabat axis. A
further diagnosis of a social housing project that sell well and quickly; shows that they are primarily located
in the Casablanca-Rabat axis. It reveals an important attribute of the social housing market in Morocco: It is a
totally flat and sterile perspective to analyze the market as a whole while there are tremendous regional
discrepancies. As we will explain in more details in the sections that follow, the Casablanca-Rabat axis is
today the only region where demand for social housing is plentiful. We then review a couple of indicators of
the sector:
Real Estate Price Index3 Figure 14- Evolution of the real estate price index (base 100 in Q4 2009)
Source: Moroccan Central Bank – Bank Al-Maghrib
Although this indicator is not relevant to the social housing business, and can be lead to make a “garbage-in
garbage-out” conclusion regarding revenues of developers in the social housing industry, it does to some
extents gauge the trend of real estate prices in Morocco. Indeed, social housing units are price-capped but can
sell in some cases at lower prices than MAD 250k per unit in times where general real estate prices are
3 The real estate price indexes were jointly constructed by Bank Al-Maghrib and the Land Registry Office on the basis of the latter’s data. These quarterly indexes are calculated following the repeat-sales method that controls the heterogeneity of properties. This method does indeed take into account only the properties sold at least twice during the period under review. This mechanism captures changes in property prices nationwide and by major cities for the three major types, namely residential property, urban land and commercial property, as well as for the six real estate categories: apartment (a dwelling located in a collective building and comprising one or several rooms), house (a single or several-story individual dwelling with no garden), villa (an individual dwelling with a garden), urban land (plot of land located in the urban area), business premises (space fitted for commercial activity) and office (working premises). These indexes are calculated on the basis of data as of the 35th day following the quarter under review, which implies an update of historical data. This update may be important because of the lag between transactions and registrations and/ or the integration of property that was sold at least twice during the quarter.
100.0%99.0% 98.9%
99.7%100.7% 101.3% 101.5% 101.4% 101.5%
98.8% 98.8%
2009Q4 2010Q2 2010Q4 2011Q2 2011Q4 2012Q2 2012Q4 2013Q2 2013Q4 2014Q2 2014Q4
“The first and quickest health
check is to determine whether
social housing is still selling. For
that, we look at the pre-sales”
“It is a totally flat and sterile
perspective to analyze the market
as a whole while exist tremendous
regional discrepancies”
“The Casablanca-Rabat axis is
today the only region where
demand for social housing is
plentiful”.
16 Morocco Real Estate Equity Primer, November 16, 2015
following a downward trajectory. Also, this index can indicate a general trend regarding land prices as well
and it is indeed relevant to emphasize the fact that the current market is full of opportunities to acquire cheap
land (especially after many developers shied away from the industry after the euphoria period). Low prices of
land should not justify however their acquisition by social housing developers since the decision to elect a
project in a certain location should be IRR-driven (potential success thanks to a healthy demand) while nice
margins should be there as a confirmation of the attractiveness of the underlying project.Then, we look at the
evolution of real estate loans in the industry.
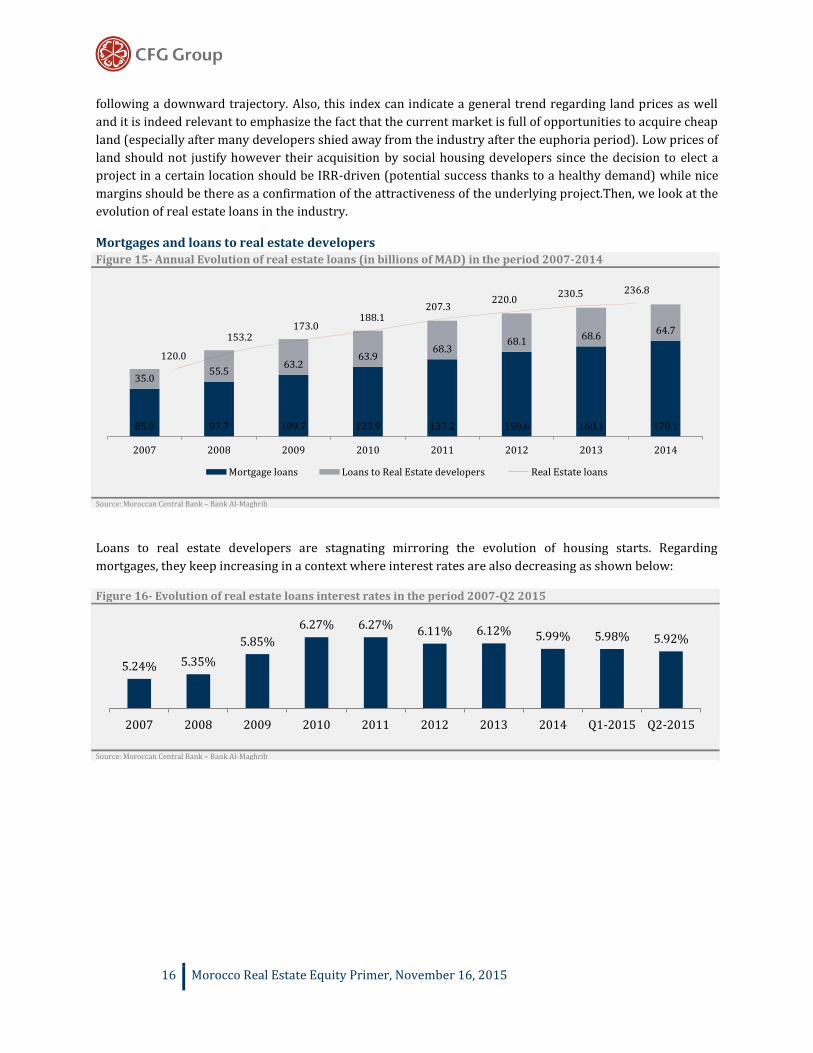
Mortgages and loans to real estate developers Figure 15- Annual Evolution of real estate loans (in billions of MAD) in the period 2007-2014
Source: Moroccan Central Bank – Bank Al-Maghrib
Loans to real estate developers are stagnating mirroring the evolution of housing starts. Regarding
mortgages, they keep increasing in a context where interest rates are also decreasing as shown below:
Figure 16- Evolution of real estate loans interest rates in the period 2007-Q2 2015
Source: Moroccan Central Bank – Bank Al-Maghrib
85.0 97.7 109.7 123.9 137.2 150.6 160.1 170.1
35.055.5
63.263.9
68.368.1
68.664.7
120.0
153.2173.0
188.1207.3
220.0230.5 236.8
2007 2008 2009 2010 2011 2012 2013 2014
Mortgage loans Loans to Real Estate developers Real Estate loans
5.24% 5.35%
5.85%
6.27% 6.27%6.11% 6.12% 5.99% 5.98% 5.92%
2007 2008 2009 2010 2011 2012 2013 2014 Q1-2015 Q2-2015

17 Morocco Real Estate Equity Primer, November 16, 2015
Another indicator that correlates well with housing starts is the consumption of cement. The housing sector
accounts for 80% of the cement consumption in Morocco. As shown below, the euphoria that followed the
2010 fiscal reform and created a spike in housing production translated naturally into a surge in the
consumption of cement. More importantly, cement consumption illustrates the fact that in current
times; indicators are going back to “normal levels” which is a central idea in this report.
Figure 17- Cement consumption evolution in the period 2000-2014
Source: Ministry of Housing, Town Planning and Urban Policy, Moroccan Cement Professionals Association, CFG Research
The observation of cement consumption is also interesting as it suggests the regional evolution of the
production of housing. Developers are re-focusing on the region where households who can afford social
housing are plentiful, the Casablanca-Rabat axis.
Figure 18- Cement consumption per region in the period 2010-2014 (Millions of tons)
Source: Moroccan Cement Professionals Association, CFG Research
9,2779,796
10,289
11,357
12,787
14,00014,523 14,571
16,130 15,871
14,86414,060
2003 2004 2005 2006 2007 2008 2009 2010 2011 2012 2013 2014
National Cement Consumption in Tons Total housing starts (000s) Total production (000s)
0.00.51.01.52.02.53.03.54.0
North
East
Center North-East
West
South Center
South
2010 2011 2012 2013 2014
Definition of regions: *North: Tanger-Tétouan *East: Oujda-Nador, Taza-Al Houceima-Taounate *Center North-East: Rabat-Salé-Zemmour-Zaer, Meknès-Tafilalt, Fès-Bouleman et Gharb-Cherada-B.hssen *West: Grand Casablanca et Chaouia-Ourdigha *South Centre: Marrakech-Tensift-Haouz, Tadla-Azilal et Doukkala-Ada *South: Oued Ed-Dahab-Lagouira, Laayoun-Boujdour-S.Elhamra, Guelmim-Es-Smara et Sous-Massa-Draa
0.0
0.5
1.0
1.5
2.0
2.5Oued Ed-Dahab-Lagouira
Laayoun-Boujdour-S.Elhamra
Guelmim-Es-Smara
Souss-Massa-Draa
Gharb-Cherarda-B.Hssen
Chaouia-Ourdigha
Marrakech-Tensift-Haouz
Oriental
Grand Casablanca
Rabat-Salé-Zemmour-Zaer
Doukkala-Abda
Tadla-Azilal
Meknès-Tafilalt
Fès
Taza-Al Houceima-Taounate
Tanger-Tétouan
2010 2011 2012 2013 2014

18 Morocco Real Estate Equity Primer, November 16, 2015
Estimating Demand for Social Housing Getting the picture of the demand for a “fixed commodity”
We start this part of the report by highlighting the fact that housing units are “fixed commodities” since they
cannot be shipped nor moved. This point is cardinal to the analyses that will follow: Indeed, and in order to be
able to get an accurate grasp of the demand at any point in time, it is essential to break it down by
geographical regions. In the pre-euphoria era, the housing deficit was so deep that real estate developers
could afford to build projects anywhere in the nation without the fear that they will be left with unsold units.
In the post-euphoria era, only well-thought projects built where demand is located will succeed. Forecasting
housing demand encompasses on one hand having knowledge of an existing housing deficit and on the other
hand estimating the incremental demand in the future. Forecasting housing demand is a multi-dimensional
problem with a geographical (space) component that we will tackle later, and a time component which takes
into account present (static) and future (dynamic) flows of demand.
Note on demand for housing vs. need for housing
We define the need for housing at the time t as the number of units that need to be built or rehabilitated at the
time t.
In other terms, if we can determine the number of urban households in need of a housing unit at the time t
and add the new urban households at the time t+1, then we will be able to derive the need for housing units at
the time t+1. While drawing the forecasts of urban households that will emerge as a result of demographic
growth, it is important to adjust for the cohabitation factor in contrast with other societies where nuclear
households prevail.
The notion of need translates into the concept of demand when there is a financial overlay on top of the need
for housing as defined above i.e. when there is a decent match between the supply of housing units and the
purchasing power of households in need for housing. In this case, we can formulate demand for a type of
housing supplied as the number of households in need for housing and who can afford to acquire the
underlying type of housing. Another financial consideration that can hinder the transformation of need into
demand is the nature of income of households. Households who can afford social housing but who have
relatively volatile incomes are very likely to shift to land plots and build them progressively. This situation
actually happened in the city of Fès where many people work as craftsmen. This is not an issue per se, since
developers adapted to this kind of demand and started to offer land plots as part of their product mix.
It is worth noting that for need to be transformed into demand; there must be a match between the socio-
cultural background of the households in need for housing and the supplied housing units. This becomes
truer when the supply of housing increases and the households in need for housing have the luxury to shop
around. As an example, the same social housing units which had a tremendous success in the city of
Casablanca did not fit households in need for housing in the city of Oujda where the structure of the unit was
not appealing at all.
Finally, for households in need for housing to move to new housing units and leave their barracks, their
unsafe housing units or stop to cohabitate with other households, it is more than critical for real estate
developers to supply housing in a location where access to public transportation is relatively easy.
To summarize our note on need for housing vs. demand for housing, for need to be transformed into demand,
households in need for housing need to have a stable income and the ability to afford the supplied unit.
Moreover, the housing unit needs to match the basic socio-cultural background of the population, and needs
to offer an easy access to public transportation and key facilities.

19 Morocco Real Estate Equity Primer, November 16, 2015
What our definition of demand implies is that for need to become demand, and excluding macroeconomic
considerations, depends solely on the ability of real estate developers to adapt to the potential acquirers of
housing. This is particularly true in the post-euphoria era where we can argue that the demand for housing is
“educated”. This is an extremely important note since we can infer that as long as developers can adapt
to their developers, business can be sustained especially in a context where social housing remains
affordable as we will explain later in this report.
This preliminary simple definition is important as we understand that while the need for housing can be
estimated in the scope of a society, demand for housing is on the other hand observed in relation to a pre-
defined type of housing.
*Provided the underlying housing units supplied will match the sociocultural definition of housing of the
acquirers. While we might argue that when there is a real need for housing, this consideration seems far
above in Maslow’s pyramid, examples such as in the city of Oujda show that a mismatch can actually hinder
the transformation of need into demand.

20 Morocco Real Estate Equity Primer, November 16, 2015
Definition of the parameters of the housing need equation
The inventory of urban households in need of housing at the time t i.e. the “static” housing deficit is broken
down as follows:
Figure 19- Origins of the housing deficit in Morocco
Source: CFG research
Figure 20- Breakdown of the static housing deficit in 2012
Source: CFG research
Figure 21- Homes collapsing in the Medina of Casablanca and Shantytowns in the city of Kénitra
Source: menara.ma
Type of housing Nature of the problem Solution to the problem
Informal HousingHouseholds living in homes in violation
of the town planning codeRelocation
Informal HousingHouseholds living in barracks and
slums (shantytowns)Relocation
Formal HousingHouseholds living in homes
in danger of collapsing (old medinas)Rehabilitation
Formal HousingHouseholds living in insalubrious
conditions (downtown of Casablanca) Rehabilitation
Formal HousingOvercrowded homes
(cohabitation of households)Relocation
Component of housing deficit Official figures in 2012
Total housing deficit 746,000
Households living in homes
in violation of the town planning code110,000
Households living
in barracks and slums 23,000
Overcrowded homes
(cohabitation of households)Not available
At any time t, looking for the housing deficit is
equivalent to the tally of the households who are in the
situations described in the table at the left.
In 2012, the minister of housing and urbanism
announced that the housing deficit in Morocco in 2012
stood at 746,000 units. 110,000 units out of this deficit
corresponded to households living in homes in
violation of the town planning code and 23,000 units
corresponded to households living in shantytowns.
Then, this deficit also comprised a number of units (no
number disclosed) emerging as a result of the
nuclearization of households in contrast with the
phenomenon of the cohabitation of households. But,
the bulk of the housing deficit was comprised of
housing units that needed rehabilitation in contrast
with households in need of housing and who need
relocation to a newly produced housing unit.
It is important to take note of the structure of this
deficit. Indeed, from 2012 to 2014, the housing deficit
decreased from 746,000 units to 580,000 units, but
this decrease was mainly achieved through
rehabilitations while the inventory of households in
need of housing barely changed and hovered around
200,000 households at the end of 2014. (Vs. 229,000 in
2013 and 200,000 in 2011)

21 Morocco Real Estate Equity Primer, November 16, 2015
Scope of the study:
The scope of our study is to tally the demand for social housing in Morocco. In this context, it is important to
dismiss from the housing deficit numbers given by the Ministry of Housing and Urbanism, all the units that
need rehabilitation and refurbishment. We will be solely focusing on households in need of housing and who
need to relocate to new units. This population includes households living in informal housing units as well as
households who cohabitate with other households and awaiting the supply of affordable housing.
It is worth noting that there is an additional population of households who are in need of housing although
not being tallied by the Ministry of Housing and Urbanism. There are many households who pay a relatively
expensive rent for a room in a low-end residential area who need to move to a decent flat to raise their
families. These households will definitely shift to social housing units should the monthly mortgage
installment hover around what they pay to rent their rooms and should they find a way to pay the down
payment.
The “dynamic” portion of the need for housing equation comprises the new households that will emerge as a
result of the combined effect of demographic growth, urbanization and the nuclearization of households.
Since the projections of the number of urban households in Morocco are provided, we do not need to take
into account the following considerations:
The inflow of new households from rural to urban areas as a result of the urban flight
The Inflow of the new generations’ households and outflow of the old generations’ households which
would be dependent on a myriad of demographic factors such as: the variation in the age at which
households get constituted, the average age of a household etc.
HCP also provides forecasts for the average size of urban households which takes into account the
change in household structure in Morocco from “extended family” households to “nuclear family”
households
Figure 22- Types of households in Morocco
Source: Morocco Higher Planning Commission
All households
Complex households
Extended household
Multiple family
households
Nuclear households
Complete family
Incomplete family
Non-parental families
Siblings
Non-family households
One-person households
Other type of
households

22 Morocco Real Estate Equity Primer, November 16, 2015
Figure 23- Evolution of the number of urban households and the average size of households for the period 2014-2030E
Source: Morocco Higher Planning Commission
Figure 24- Projections of the number of urban households over the period 2014-2020E
Source: Morocco Higher Planning Commission
The incremental number of urban households between 2014 and 2020E is 817,000 households.
35853700
38153930
40454173
43004428
45554683
48184954
50895225
53605500
56405780
59206060
61956330
64646599
67346857
4.7
4.6 4.6
4.5 4.5
4.4 4.4
4.3 4.3
4.24.2
4.1 4.14.0 4.0
3.9 3.9 3.9
3.8 3.8
3.7 3.7 3.7
3.6 3.6 3.6
2005 2006 2007 2008 2009 2010 2011 2012 2013 2014 2015 2016 2017 2018 2019 2020 2021 2022 2023 2024 2025 2026 2027 2028 2029 2030
Number of households (000s) Average size of households
Year 2014 2015 2016 2017 2018 2019 2020
Urban Households (000s) 4,683 4,818 4,954 5,089 5,225 5,360 5,500
% Chg 2.88% 2.82% 2.73% 2.67% 2.58% 2.61%

23 Morocco Real Estate Equity Primer, November 16, 2015
Forecasting the demand for social housing in the period 2014-2020E
KEY FINDINGS:
1/ At any point in time, 60% of households can afford social housing without taking into account
households who can afford a product more expensive than a MAD 250k housing units;
2/ Since we retained 60% as the percentage of the target population for the calculation of demand,
under the base assumption, we estimate demand for social housing at 610,200 units for the period i.e.
101,700 units per annum;
3/ Since we retained 60% as the percentage of the target population for the calculation of demand,
under the conservative assumption, we estimate demand for social housing at 490,200 units for the
period i.e. 81,700 units per annum;
4/ At the exclusion of the bear case, which is discarded from the results, and under the base
assumption, it seems that the social housing industry cannot be oversupplied in the period 2014-
2020E. We do insist however on the fact that there are regional discrepancies and that developers will
need to go look for this demand at its actual location;
5/ At the exclusion of the bear case and the 5th case which also corresponds to a higher Gini index
than actually observed in Morocco, and under the conservative assumption, it seems that the social
housing industry cannot be oversupplied in the period 2014-2020E. We do insist however on the fact
that there are regional discrepancies and that developers will need to go look for this demand at its
actual location.
Preliminary notes: Although we derive in this part estimates for the demand of social housing at the
national level and show that social housing is indeed undersupplied, we do insist on the fact that there are
regional discrepancies and that developers will need to go look for this demand at its actual location. (Please
refer to the section titled “The Casablanca-Rabat axis : The mecca of social housing”). Also, beyond the
quantitative dimension of demand, there can be socio cultural preferences that differ from a region to another
one and that developers will need to recognize. Furthermore, although threats of substitutes remain low for
the social housing product (Please refer to Figure 48- Porter’s Five Forces Model of Competition),
demand has become more educated and households can shop around and compare developers before making
a decision which should push developers to seek product differentiation.
We assume that household and units of housing can add up for the purpose of this study.
Need for Housing is mathematically a set in which is necessarily included Demand for Housing.
Ideally, and this is where public policy intervenes, demand would grow to the size of need. Theoretically, demand
and need should become closer as we climb higher the social ladder excepted for high-end housing where the
concept of need tends to fade.

24 Morocco Real Estate Equity Primer, November 16, 2015
1/Forecasting the need for social housing in the period 2014-2020E
First, there is the need for housing in Morocco from 2014 to 2020E. The need for housing is calculated as the
inventory of households (also equivalent to the housing deficit at the end of 2014 excluding all the
households who have a housing unit that needs rehabilitation) who need a housing unit at the end of 2014
plus all the new urban households from 2014 to 2020E who will need a housing unit.
Then, there is the need for social housing in the same period which is calculated using the same data but
excludes all the households that can acquire a housing property higher in value than a MAD 250k social
housing unit.
Note: It is quite ironical to exclude 20% of the households in the housing deficit, but we do assume for the
theoretical purpose of this exercise and in order to retain a floor figure derived from overly conservative
assumptions, that the static portion of the need equation does have the same structure as the entire Moroccan
population.
(Please refer to Figure 19- Origins of
the housing deficit in Morocco)
(Please refer to Figure 24- Projections of the
number of urban households over the period 2014-2020E)
2/Forecasting the demand for social housing in the period 2014-2020E
represents a
proportion of the inventory of households who need housing can afford to acquire social housing but
no real estate product more expensive than social housing.
It is often argued that the static portion of the demand equation is null since a massive production of
social housing the past years should have absorbed all the viable demand. The most conservative
assumption for the estimation of demand is to assume indeed that the static portion of the equation
is null.
We explore both scenarios i.e. a scenario where the static portion of the demand equation is null as
well as a second scenario where it is equal to 80%*200,000 as shown above.
Correspond to the portion of households who are
bankable i.e. with 40% or less of their income equal to the minimum monthly payment for a social
housing mortgage in addition to the population who can get a mortgage under a Fogarim guarantee.
We obviously exclude the urban households able to acquire assets more expensive than social

25 Morocco Real Estate Equity Primer, November 16, 2015
housing. We define a couple of scenarios regarding the portion of households who can afford social
housing:
1/ Bear case: Corresponding to a very high Gini index where 40% of the households belong to the upper-mid
class and the upper class, 40% of the households cannot acquire social housing and 20% of the households
falling in the bankable and Fogarim bankable categories. Not only does this case not fit the data provided by
the higher planning commission regarding the current income distribution structure in Morocco but it also
does not fit the ministry of housing projections for the weight of social classes by 2020E. This case represents
a floor estimate of the demand for social housing. Percentage of households who fall in the social housing
target with access to funds: 20%;
2/Base case: Corresponding to a situation mirroring the income distribution presented in (Figure 39-
Expense deciles for urban households and eligibility for mortgages)and matching as well the projections
of the ministry of housing regarding the evolution of the weight of social classes in Morocco. The ministry’s
projections are presented in Figure 94 and Figure 95. 50% of the households are bankable, 20% of the
household are Fogarim bankable, 15% of the households can afford housing more expensive than social
housing and 15% of households cannot afford social housing. Percentage of households who fall in the
social housing target with access to funds: 70%;
3/Base case with less households having access to the Fogarim guarantee. 50% of the households are
bankable, 10% of the household are Fogarim bankable, 20% of the households can afford housing more
expensive than social housing and 20% of households cannot afford social housing. Percentage of
households who fall in the social housing target with access to funds: 60%;
4/ Base case with more people in upper mid-class and upper class. 40% of the households are bankable,
20% of the household are Fogarim bankable, 30% of the households can afford housing more expensive than
social housing and 10% of households cannot afford social housing. Percentage of households who fall in
the social housing target with access to funds: 60%;
5/Base case with more people in upper mid-class and upper class while having less people accessing
Fogarim (higher Gini).40% of the households are bankable, 10% of the household are Fogarim bankable,
40% of the households can afford housing more expensive than social housing and 10% of households cannot
afford social housing. Percentage of households who fall in the social housing target with access to
funds: 50%;
6/Bull case : Base case with less people in upper mid-class and upper class (lower Gini). 60% of the
households are bankable, 20% of the household are Fogarim bankable, 10% of the households can afford
housing more expensive than social housing and 10% of households cannot afford social housing.
Percentage of households who fall in the social housing target with access to funds: 80%;
7/Base case with less people in upper mid-class and upper class while having more people accessing
Fogarim. 60% of the households are bankable, 10% of the household are Fogarim bankable, 10% of the
households can afford housing more expensive than social housing and 20% of households cannot afford
social housing. Percentage of households who fall in the social housing target with access to funds:
70%;

26 Morocco Real Estate Equity Primer, November 16, 2015
Figure 25- Target population for social housing with access to funds under different scenarios
Source: CFG research
Excluding the bear case which is only explored for information purposes and the bull case which is not very
realistic either, all the other cases deliver a percentage target population for social housing lying in the
interval [50%-70%]. In our section titled “Microeconomics”, we find that the actual percentage is a minimum
of 60%.
At any point in time, 60% of households can afford social housing without taking into account
households who can afford a product more expensive than a MAD 250k housing units.
Now, and although we retain the aforementioned percentage as our central scenario, we explore the
calculation of demand for all the cases and under two assumptions regarding the housing deficit:
20%70%
60%
60%50%
80%
70%
0%10%20%30%40%50%60%70%80%
Bear Case (Very high Gini)
Base Case
Base Case with less people havingaccess to Fogarim
Base case with more people in uppermid-class and upper class
Base case with more people in uppermid-class and upper class while havingless people accessing Fogarim (higher
Gini)
Base case with less people in uppermid-class and upper class (lower Gini)
Base case with less people in uppermid-class and upper class while having
more people accessing Fogarim
Percentage of population who will acquire intermediate and high-end housing
Percentage of population who can acquire social housing (bankable)
Percentage of population who can acquire social housing (Fogarim)
Percentage of population who cannot acquire social housing
Target population for social housing with access to funds
The percentage of the population which corresponds to households able to acquire social housing but not able to acquire a more
expensive type of housing is computed as the sum of the percentage of households who are bankable plus the percentage of
households who are bankable under a Fogarim guarantee.

27 Morocco Real Estate Equity Primer, November 16, 2015
Figure 26- Demand for social housing in 2014-2020E under different scenarios – Base assumption
Base assumption: We assume that the inventory of urban households in need of housing is 200,000. The breakdown of households into income classes mirrors the breakdown of the Moroccan urban population.
Source: CFG research
When we assume that the inventory of urban households in need for social housing is not null, demand for
social housing in the period 2014-2020E ranges from 203,400 units to 813,600 units. Since we retained
60% as the percentage of the target population for the calculation of demand, under the base
assumption, we estimate demand for social housing at 610,200 units for the period i.e. 101,700 units
per annum.
203,400
711,900
610,200
610,200508,500
813,600
711,900
0
100,000
200,000
300,000
400,000
500,000
600,000
700,000
800,000
900,000Bear Case (Very high Gini)
Base Case
Base Case with less people having access toFogarim
Base case with more people in upper mid-classand upper class
Base case with more people in upper mid-classand upper class while having less people
accessing Fogarim (higher Gini)
Base case with less people in upper mid-class andupper class (lower Gini)
Base case with less people in upper mid-class andupper class while having more people accessing
Fogarim
Demand for social housing 2014-2020E (Need of housing Inventory is 200,000 in 2014)

28 Morocco Real Estate Equity Primer, November 16, 2015
Figure 27- Demand for social housing in 2014-2020E under different scenarios – Conservative assumption
Conservative assumption: We assume here that the inventory of urban households in need of housing is null.
Source: CFG research
When we assume that the inventory of urban households in need for social housing is null, demand for social
housing in the period 2014-2020E ranges from 163,400 units to 653,600 units. Since we retained 60% as
the percentage of the target population for the calculation of demand, under the conservative
assumption, we estimate demand for social housing at 490,200 units for the period i.e. 81,700 units
per annum.
163,400
571,900
490,200
490,200408,500
653,600
571,900
0
100,000
200,000
300,000
400,000
500,000
600,000
700,000Bear Case (Very high Gini)
Base Case
Base Case with less people having access toFogarim
Base case with more people in upper mid-classand upper class
Base case with more people in upper mid-classand upper class while having less people
accessing Fogarim (higher Gini)
Base case with less people in upper mid-class andupper class (lower Gini)
Base case with less people in upper mid-class andupper class while having more people accessing
Fogarim
Demand for social housing 2014-2020E (Need of housing Inventory is null)

29 Morocco Real Estate Equity Primer, November 16, 2015
We then compare our demand for social housing estimates to the expected production of social housing.
Production of MAD 250k social housing stood at 66,766 units in 2014 up from 60,245 units in 2013. We build
two conservative scenarios under which the social housing production stands at an average 70,000 units and
80,000 units per annum from 2014 to 2020E.
Figure 28- Demand for social housing vs. production in the period 2014-2020E - Base assumption
Source: CFG research
At the exclusion of the bear case, which is discarded from the results, and under the base assumption,
it seems that the social housing industry cannot be oversupplied in the period 2014-2020E. We do
insist however on the fact that there are regional discrepancies and that developers will need to go
look for this demand at its actual location.
0100,000200,000300,000400,000500,000600,000700,000800,000900,000
Bear Case (Very high Gini)
Base Case
Base Case with less people havingaccess to Fogarim
Base case with more people in uppermid-class and upper class
Base case with more people in uppermid-class and upper class while
having less people accessing Fogarim(higher Gini)
Base case with less people in uppermid-class and upper class (lower
Gini)
Base case with less people in uppermid-class and upper class whilehaving more people accessing
Fogarim
Demand for social housing 2014-2020E (Need of housing Inventory is 200,000 in 2014)
Production of social housing 2014-2020E (80,000 units per annum)
Production of social housing 2014-2020E (70,000 units per annum)

30 Morocco Real Estate Equity Primer, November 16, 2015
Figure 29- Demand for social housing vs. production in the period 2014-2020E - Conservative assumption
Source: CFG research
At the exclusion of the bear case and the 5th case which also corresponds to a higher Gini index than
actually observed in Morocco, and under the conservative assumption, it seems that the social
housing industry cannot be oversupplied in the period 2014-2020E. We do insist however on the fact
that there are regional discrepancies and that developers will need to go look for this demand at its
actual location.
0
100,000
200,000
300,000
400,000
500,000
600,000
700,000Bear Case (Very high Gini)
Base Case
Base Case with less people havingaccess to Fogarim
Base case with more people in uppermid-class and upper class
Base case with more people in uppermid-class and upper class while
having less people accessing Fogarim(higher Gini)
Base case with less people in uppermid-class and upper class (lower
Gini)
Base case with less people in uppermid-class and upper class whilehaving more people accessing
Fogarim
Demand for social housing 2014-2020E (Need of housing Inventory is null)
Production of social housing 2014-2020E (80,000 units per annum)
Production of social housing 2014-2020E (70,000 units per annum)
31 Morocco Real Estate Equity Primer, November 16, 2015
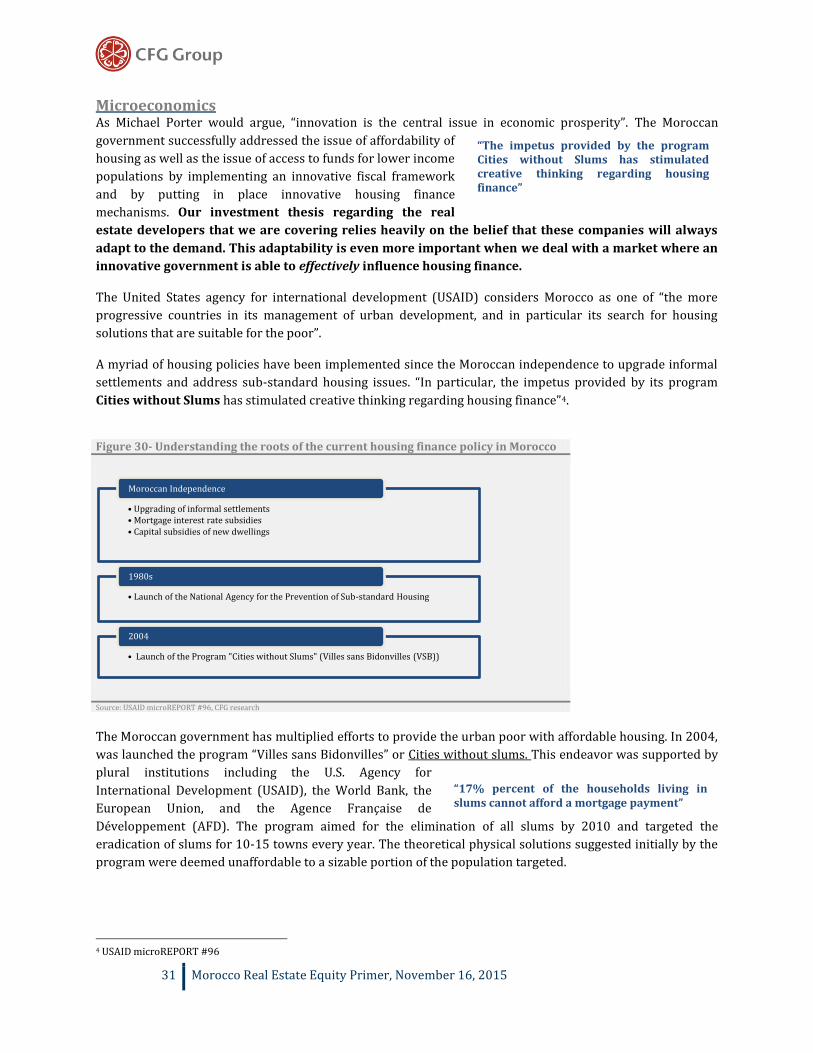
Microeconomics As Michael Porter would argue, “innovation is the central issue in economic prosperity”. The Moroccan
government successfully addressed the issue of affordability of
housing as well as the issue of access to funds for lower income
populations by implementing an innovative fiscal framework
and by putting in place innovative housing finance
mechanisms. Our investment thesis regarding the real
estate developers that we are covering relies heavily on the belief that these companies will always
adapt to the demand. This adaptability is even more important when we deal with a market where an
innovative government is able to effectively influence housing finance.
The United States agency for international development (USAID) considers Morocco as one of “the more
progressive countries in its management of urban development, and in particular its search for housing
solutions that are suitable for the poor”.
A myriad of housing policies have been implemented since the Moroccan independence to upgrade informal
settlements and address sub-standard housing issues. “In particular, the impetus provided by its program
Cities without Slums has stimulated creative thinking regarding housing finance”4.
Figure 30- Understanding the roots of the current housing finance policy in Morocco
Source: USAID microREPORT #96, CFG research
The Moroccan government has multiplied efforts to provide the urban poor with affordable housing. In 2004,
was launched the program “Villes sans Bidonvilles” or Cities without slums. This endeavor was supported by
plural institutions including the U.S. Agency for
International Development (USAID), the World Bank, the
European Union, and the Agence Française de
Développement (AFD). The program aimed for the elimination of all slums by 2010 and targeted the
eradication of slums for 10-15 towns every year. The theoretical physical solutions suggested initially by the
program were deemed unaffordable to a sizable portion of the population targeted.
4 USAID microREPORT #96
• Upgrading of informal settlements • Mortgage interest rate subsidies • Capital subsidies of new dwellings
Moroccan Independence
• Launch of the National Agency for the Prevention of Sub-standard Housing
1980s
• Launch of the Program "Cities without Slums" (Villes sans Bidonvilles (VSB))
2004
“The impetus provided by the program Cities without Slums has stimulated creative thinking regarding housing finance”
“17% percent of the households living in slums cannot afford a mortgage payment”

32 Morocco Real Estate Equity Primer, November 16, 2015
Figure 31- Evolution of the GNDI and the GDP per capita (in kMAD)
Source: Ministry of Economy and Finance
A study by the higher planning commission in 2000 shows that 17% percent of the households living in slums
cannot afford a mortgage payment:
Figure 32- Household income of slum residents
Note: Data cited from USAID microREPORT #96 published in 2006. Data published in USD. Exchange rate at the time of this publication was around MAD 8/USD
Source: Enquête Nationale sur la Consommation et des dépenses des Ménages 2000-2001 cited from USAID microREPORT #96
A further survey by USAID in 2006 in a sample slum (Nakhil in Nouaceur) reveals that 20% of head of
households earn less than MAD 496 per month:
Figure 33- Income for heads of households at the Nakhil slum in Nouaceur
Note: Data cited from USAID microREPORT #96 published in 2006. Data published in USD. Exchange rate at the time of this publication was around MAD 8/USD
Source: Résultats de l’enquête Ménage du Bisonville Nakhil cited from USAID microREPORT #96
Then, the government acknowledged that “innovation is the central issue in economic prosperity” to use
Michael Porter’s words. Creative ways to provide slums inhabitants with funds to acquire housing were
engineered such as granting guarantees to banks to spur lending to the lower income population.
15,711 16,288 16,58917,679 17,957
18,75019,426 19,912
20,677
17,15818,083
18,851
20,47621,771
23,88724,508
25,23426,151
2003 2004 2005 2006 2007 2008 2009 2010 2011
GDP per capita GNDI per capita
Household Income (MAD/month) <1416 <2008 <2816 <4352 >4352
% of households 16.8% 22.5% 23.0% 26.8% 11.3%
Affordable mortgage payment (MAD/month) 0 504 704 1000 >1000
Income for heads of HH (MAD/month) None 1-496 504-1000 1008-2008 2016-3000 >3000
% of households 14% 6% 19% 49% 10% 2%

33 Morocco Real Estate Equity Primer, November 16, 2015
Figure 34- Bridging the affordability gap in housing finance for the urban poor
Source: USAID microREPORT #96, CFG research
At the end of 2003, was introduced a government
guarantee, FOGARIM in order to encourage banks to
lend to lower income populations. The FOGARIM “is
used to guarantee 70 percent of each bank mortgage
loan to low-income individuals with irregular
incomes who would normally not be eligible for
these loans”5. FOGARIM was primarily designed for
households with irregular / informal sources of income.
In order to purchase a MAD 250,000 social housing unit, acquirers borrow the 15-20% down payment i.e.
MAD 37,500-MAD 50,000 from an MFI6 and reimburse the MFI as soon as the bank approves the loan under
the FOGARIM guarantee. It is interesting to observe in the table below that only 36% of the lowest income
quartile of the population borrowed money for housing from banks while 41% of this population borrowed
money from MFIs.
Figure 35- Source of loans by income quartile
Source: Practical Guide for Housing Microfinance in Morocco, CHF International prepared for RTI International, June 2005 / cited from USAID microREPORT #96
Clearly, with the design of an affordable housing product along with the existence of mechanisms that
encourage financial institutions to lend to people with low and/or irregular income, government has brightly
addressed two key issues that countries usually face in housing finance.
5 USAID microREPORT #96 6 The microfinance industry is led by four institutions Al Amana, Zakoura, FBP and Fondep. They have a loan book of about USD 500 million.
Government
• The ministry of housing and urban planning (MHU) manages a subsidy fund (FSH)
• Establishment of a central guarantee FOGARIM
Donors
• USD 90 million from the European Investment Bank for off-side infrastructure and VSB operations
• USD 65 million from the AFD to government's parastatal developer Holding Al Omrane
• USD 117 million from the EU for social infrastructure
Banks
• Increasing role of commercial banks in lending to lower income populations as a result of the FOGARIM guarantee
Developers
• The private sector is encouraged to participate in the social housing market as a result of tax incentives and serviced land by government
• The parastatal, Holding Al Omrane acts as the developer for many slum upgrading programs
Microfinance Institutions (MFIs)
• Government allowed MFIs to lend for housing
Source of loan Q1 Q2 Q3 Q4
Banks 36% 48% 40% 42%
MFIs 41% 28% 28% 28%
Consumer credit companies 19% 20% 26% 24%
NGOs 4% 4% 5% 6%
“Clearly, with the design of an affordable housing product along with the existence of mechanisms that encourage financial institutions to lend to people with low and/or irregular income, the Moroccan government has brightly addressed two key issues that countries usually face in housing finance.”

34 Morocco Real Estate Equity Primer, November 16, 2015
Focus on the FOGARIM guarantee
Purpose: Created to provide banks with a protection in order to lend to households with low and/or informal and/or
irregular income. This program pushed banks to lend to a population that they would have never considered at a
relatively low interest rate.
How it works? The government guarantees 70 percent of the principal with funds managed by a public agency, the Caisse
Centrale de Garantie (CCG).
As a result of a lower risk, banks provide loans at a rate between 5 and 9 percent for a maximum term of 25 years. The
maximum loan amount is MAD 250,000.
Who is eligible? The maximum monthly household income for loan eligibility is MAD 3,000.
How does the risk assessment of the borrower work? Banks usually engage MFIs to act as their credit screener since
their credit officers specialize in serving the poor. Indicators usually used include the word of neighbors, an appraisal of
the person’s assets and business as well the appearance of their home. The MFI’s credit screening includes the character
of the borrower, an assessment of his income level as well as of his residency. Once the bank receives the dossier from the
MFI, they need to make the final decision. If the bank approves the MAD 250,000 loan, the MFI advances a loan for the
down payment (MAD 37,500 at 19 percent interest per annum for up to 3years). The cost of the down payment loan is
extremely high regarding the fact that the bank will not transfer the funds to the borrower until the housing unit is
produced. Once the borrower receives the funds from the bank, the MFI down payment loan is repaid. It is worth noting
that this option to pay the down payment remains the last resort for the acquirers of social housing, they tend to finance
the down payment by relying on their own savings or by borrowing from relatives.
Default rate: As of September 2007, and out of 24,503 loans guaranteed, only 25 debtors have defaulted which is not a
bad ratio for loan duration of 20-25 years.
Some argue that because the banks reduce their risks substantially, they become less diligent in the credit screening
process. A more “market-oriented” guarantee at 50 percent instead of 70 percent has been suggested by USAID to the
commercial bank BMCE but has not been utilized.
More information:
95% of the FOGARIM guaranteed loans are for house purchase, the remaining loans are for house construction and the
purchase of a plot.
It is important to mention that the last monthly payment for a FOGARIM guaranteed loan should happen before the 60th
birthday of the borrower. It implies shorter repayment periods and henceforth higher monthly payments for some head
of households which can be restraining in some cases.
Figure 36- FOGARIM Guaranteed loans attributes June 2009-June 2014
Note: December 2010, June 2011, June 2013 and December 2014 data is not available.
Source: Ministry of Economy and Finance
It is important to note from the table hereabove that the number of Fogarim beneficiaries keep increasing
amid a reluctance of banks to participate in this market as a result of the low profitability of Fogarim
guaranteed loans. Fogarim loans are mainly directed to acquisition rather than construction. According to the
CCG, the risks related to construction are 2.4 times more important than risk related to acquisition. The
average loan-to-value ratio does not exceed 85%. According to the CCG, a personal contribution of 5% of the
June 2009 December 2009 June 2010 December 2011 June 2012 December 2012 December 2013 June 2014 June 2015
Cumulative Number of beneficiaries 50,453 54,102 58,909 74,109 81,226 86,549 99,927 108,811 123,559
Proportion of loans for construction in June 2015 13.0% 9.0% 18.0% 3.0% 3.0% 2.0% 0.5% 0.2% 0.3%
Proportion of loans for acquisition in June 2015 87.0% 91.0% 82.0% 97.0% 97.0% 98.0% 99.5% 99.8% 99.7%
Cumulative amount of loans (MMAD) 7,328 7,875 8,577 10,869 12,000 12,863 15,113 16,548 18,972
Average cost of housing (MAD) 170,550 181,815 169,997 219,169 213,788 220,288 237,977 228,068 232,733
Average amount borrowed (MAD) 145,706 150,006 137,895 158,817 158,780 162,561 167,102 160,245 160,942
Average monthly payment (MAD) 1,032 1,113 998 1,164 1,170 1,204 1,227 1,201 1,200
Average loan-to-value 85.0% 82.5% 81.5% 73.1% 74.8% 74.5% 71.0% 71.0% 70.0%
Average interest rate 5.2% 6.1% 5.8% 6.1% 6.2% 6.3% 6.2% 6.2% 6.2%
Average loan repayment period in years 20 21 20 21 21 21 21 20 21

35 Morocco Real Estate Equity Primer, November 16, 2015
value of the real estate good being acquired reduces the default risk by 30%, while a contribution of 10%
reduces the default risk by 65%.
Focus on the financing of a social housing apartment
Interest rates usually hover between 5 and 9 percent which translate into MAD 1,168 and MAD 1,680
monthly payments assuming a repayment period of 25 years (or between MAD 1,320 and MAD 1,800
monthly payments assuming a repayment period of 20 years)
Figure 37- Monthly payments in MAD by repayment period and by interest rate
Note: Typical repayment period is either 20 or 25 years
Source: CFG Research
Excluding the portion of the population eligible for Fogarim (The maximum monthly household income for
loan eligibility is MAD 3,000), a simple rule of thumb at the commercial banks consists of lending money up to
40% of the household income. When this rule is applied to this table, we derive the following data
regarding the minimum income per household.
Figure 38- Minimum income per household in MAD for different repayment periods and interest rates
Source: CFG Research
5% 7% 9%
10 2,652 2,903 3,167
15 1,977 2,247 2,536
20 1,650 1,938 2,250
25 1,461 1,767 2,098
Interest rateRepayment
period
5% 7% 9%
10 6,630 7,258 7,918
15 4,943 5,618 6,340
20 4,125 4,845 5,625
25 3,653 4,418 5,245
Repayment
period
Interest rate

36 Morocco Real Estate Equity Primer, November 16, 2015
We have sourced the categorization of households by decile of household expense from the last study
published by the Higher Planning Commission in 2007.
Figure 39- Expense deciles for urban households and eligibility for mortgages
Source: Enquête Nationale sur les revenus et les niveaux de vie des ménages 2006/2007, CFG Research
This table should be read in conjunction with the previous
one. We know that the minimum income per household to
afford a mortgage is MAD 3,653 should they get access to
the lowest interest rate and the longest maturity. The first
two deciles of households are thus completely discarded
from the pool of households who can acquire social
housing. Then, the third decile households have an average
monthly expense around MAD 3,096. These households
are more eligible for Fogarim than for a mortgage loan in
our view but are nonetheless households who can acquire
social housing. All the other deciles can afford the mortgage repayments but will need to get a repayment
period above 20 years (which is a common practice) and hopefully an interest rate as low as possible.
A couple of important notes:
1/ It is worth noting that the decile values (expense per household per month) are used as proxies for
revenues. However, if we were to account for the national savings rate that hover in average around 30%, we
would possibly be able to include more households among the category of households who can afford the
monthly loan repayments. The caveat nonetheless is that more people would also be able to have access to
housing of a higher standing than social housing. We conservatively take household expense as a proxy for
household revenue in the scope of this study;
2/ We use 2007 MAD data without adjusting it for inflation between 2007 and 2014 which is extremely
conservative. Indeed, in 2007, social housing used to cost MAD 200k;
Average
annual
expense
per person
Deciles
Decile Value
(In 2007
MAD)
Average
annual
expense
per person
(In 2007 MAD)
Average
monthly
expense
per person
(In 2007 MAD
Average
household
size
(# of people)
Average
monthly
expense
per household
(In 2007 MAD)
Eligibility
for
a regular
mortgage
Eligibility
for
Fogarim
1 4829 3795 316 6.1 1929 No Yes
2 6092 5456 455 5.8 2637 No Yes
3 7176 6634 553 5.6 3096 No Yes
4 8401 7795 650 5.5 3573 Yes No
5 9760 9057 755 5.2 3925 Yes No
6 11368 10492 874 5 4372 Yes No
7 13940 12524 1044 4.6 4801 Yes No
8 17531 12545 1045 4.2 4391 Yes No
9 25531 20903 1742 3.9 6793 Yes No
10 - 46695 3891 3.5 13619 Yes No
“The first two deciles of households are thus completely discarded from the pool of households who can acquire social housing
The third decile households are eligible for Fogarim
All the other deciles can afford the mortgage repayments”

37 Morocco Real Estate Equity Primer, November 16, 2015
This exercise serves the main purpose of measuring the percentage of the population able to acquire
social housing. Not only do we use 2007 MAD data, but do we also assume no savings rate while taking
expenses as a proxy for income; but we also discard additional sources of demand such as Moroccans
living abroad who can acquire this type of housing either as the primary residence in Morocco or as
investors-lessors, and the demand that can arise from Moroccans who would like to acquire a house
in another city.
More importantly, there is the demand from investors-lessors; this demand should not be added to
the demand for social housing since it is serving households in need for housing who will live in these
units. However, households belonging to the lowest income deciles could potentially rent these units
(inability to afford the down payment and/or to get access to a loan), which creates an additional
overlay of demand.
Then, there is also another mechanism by which the lowest decile households can acquire social
housing: Speculation. Speculators pay the down-payment for a social housing unit and then sell an
option to a potential acquirer to have this acquisition transferred under their name at the time of the
delivery. Speculation happens in the Casablanca-Rabat axis where many households would buy this
option in order to be delivered today rather than tomorrow. It is worth noting though that there can
be some penalties from developers when a contract is transferred. Finally, social housing can be
acquired for investment purposes especially in the Casablanca-Rabat axis where there could be
demand in the secondary market as already observed in some projects with the restriction that the
owner lives in their residence for at least 4 years.
Henceforth, if we were able to conservatively show that 2 bottom deciles of households cannot afford social
housing, and if we take into account the fact that the top two deciles are not a target population for this
product, then, we are left with 60% of the population that can afford social housing. It is important to
highlight that it is actually a floor number since additional overlays of demand complement this structural
pool of demand. This is only true if the overlays are mutually exclusive with the 60% calculated. We do think
that it is the case because Moroccans living abroad are excluded from the local population. Also, the demand
from investor-lessors, who belong to top deciles households, is transferred to households who can belong to
any of the bottom 3 deciles which can in fact add incremental demand to the 60% figure calculated.
Pool of demand for social housing
Indirect demand
• Investors-lessors giving access to housing to lower income households
• Speculation
Moroccans living abroad
and Moroccans from other
cities
Structural demand

38 Morocco Real Estate Equity Primer, November 16, 2015
Finally, for the portion of the population who cannot afford social housing, there are two other options under
slum upgrading program: Subsidized apartments and services plots. According to a study conducted by
USAID in 2006, half of slum dwellers may afford them.
Figure 40- Monthly payments for social housing purchase and slum upgrading program options
Source: CFG Research
5% 9%
Social housing (acquisition) 250,000 1,650 2,250
Subdidized apartment units (resettlement) 50,000 330 450
Serviced plot 60,000 396 540
Monthy payment for
varying interest rates
(20 years loan)Type of Housing Option
Cost to
beneficiary
(MAD)

39 Morocco Real Estate Equity Primer, November 16, 2015
The Casablanca-Rabat axis : The mecca of social housing In a report published in 2013 by the ministry of housing and summarizing the 2011 activity of the sector,
were announced numbers for the housing deficit by 2016E, 2021E and 2026E. In absence of income data, we
cannot derive from the numbers announced the actual deficit of social housing units. However, it is
interesting to observe the regional breakdown of these deficit figures to understand that the Casablanca-
Rabat axis is the court where the big game is played.
Figure 41- Housing deficit per annum per region by 2016E, 2021E and 2026E
Source: Ministry of Housing, CFG Research
Region 2016E 2021E 2026E
Oued Ed-Dahab-Lagouira 2,689 2,089 1,892
Guelmim-Es-Smara 5,247 4,078 3,693
Laâyoune-Boujdour-Sakia El Hamra 7,009 5,446 4,933
Doukala-Abda 8,772 6,816 6,174
Tadla-Azilal 8,836 6,867 6,219
Taza-Al Hoceima-Taounate 9,513 7,393 6,696
Gharb-Chrarda-Béni Hssen 11,936 9,275 8,401
Marrakech-Tensift-Al Haouz 16,242 12,622 11,431
Fès-Boulemane 17,109 13,295 12,042
Eastern cities 18,308 14,227 12,886
Chaouia-Ourdigha 18,776 14,591 13,215
Meknès-Tafilalet 19,064 14,815 13,418
Souss-Massa-Darâa 20,232 15,722 14,239
Tanger-Tétouan 20,827 16,184 14,658
Rabat-Salé-Zemmour-Zaër 28,602 22,226 20,130
% Rabat region 11.1% 11.1% 11.1%
Grand-Casablanca 45,238 35,154 31,839
% Casablanca 17.51% 17.51% 17.51%
Total 258,400 200,800 181,866
0
10,000
20,000
30,000
40,000
50,000Oued Ed-Dahab-Lagouira
Guelmim-Es-Smara
Laâyoune-Boujdour-Sakia El Hamra
Doukala-Abda
Tadla-Azilal
Taza-Al Hoceima-Taounate
Gharb-Chrarda-Béni Hssen
Marrakech-Tensift-Al Haouz
Fès-Boulemane
Eastern cities
Chaouia-Ourdigha
Meknès-Tafilalet
Souss-Massa-Darâa
Tanger-Tétouan
Rabat-Salé-Zemmour-Zaër
Grand-Casablanca
2016E 2021E 2026E
The table shows that in
order to eliminate the
housing deficit by 2016E,
the average production
per annum should stand
at 258,400 units.
Similarly, in order to
eliminate this deficit by
2021E or 2026E,
production should stand
at an average 200,800
and 181,866 units per
annum respectively.

40 Morocco Real Estate Equity Primer, November 16, 2015
Figure 42- 2007 Poverty Map of Morocco
Source: Cited from Higher Planning Commission’s Poverty Mapping study published in 2007
Figure 43- Expenses of households in 2013 per region (in MMAD)
Source: Higher planning commission, CFG Research
010,00020,00030,00040,00050,00060,00070,00080,00090,000
100,000Tadla - Azilal
Southern cities
Taza - Al Hoceïma – Taounate
Gharb - Chrarda - Béni Hssen
Chaouia – Ouardigha
Fès – Boulemane
Doukala – Abda
Meknès – Tafilalet
Eastern icties
Rabat - Salé - Zemmour –Zaer
Marrakech - Tensift - AlHaouz
Souss - Massa – Daraâ
Tanger – Tétouan
Grand Casablanca
Caption - Poverty rate
Poverty rate less than 10%
Poverty rate between 10% and 20%
Poverty rate between 20% and 30%
Poverty rate between 30% and 40%
The Casablanca-Rabat axis is
from a Microeconomic
perspective healthier than
other regions as shown by
the poverty map.
It is important to note that
the region has the highest
number of households who
have regular incomes which
facilitates the access to
mortgages (in the formal
and the informal sectors).

41 Morocco Real Estate Equity Primer, November 16, 2015
Importance of the sector We believe that in the very long run, government will sustain a fiscal and regulatory framework favorable to
the private sector. In 2011, the private sector accounted for 78.1% of the production of social housing
followed by the parastatal company Groupe Al Omrane who accounted for 19.5% of the social housing
production. The remaining portion was produced by other state-owned organizations. Indeed, the housing
and real estate sector has an important role in the Moroccan economy as shown by its sizable contribution to
the GDP, to the creation of employment and investments as well as to the economic and social development of
the country. Indeed, according to the cement professional association, the housing sector accounts for about
80% of the cement consumption in Morocco.
Moreover, the sector’s gross fixed capital formation (GFCF) to the national gross fixed capital formation ratio
stood at 51% in 2014. The average contribution of the sectors’ GFCF to the national GFCF for the past 10
years hovers around 51%. The sector’s GFCF grew from 2005 to 2014 at a CAGR of 7.22%.
Figure 44- Evolution of the gross fixed capital formation of the construction sector in the period 2005-2014
Source: Ministry of housing
Furthermore, the value added of the construction sector grew at a CAGR2000-2014 of 16.7% and contributed to
the total value by 6.3% in 2014.
74,54281,800
97,526
111,663 113,644121,000
129,200135,316 136,609 139,642
51% 50%51%
49%
50%
52%
52%52%
53%
51%
2005 2006 2007 2008 2009 2010 2011 2012 2013 2014
Construction sector Gross fixed capital formation (GFCF) (MMAD) Sector GFCF /Total GFCF

42 Morocco Real Estate Equity Primer, November 16, 2015
Figure 45- Evolution of the value added of the construction sector in the period 2005-2014
Source: Ministry of housing
The sector also attracts a sizable portion of foreign investments in Morocco. In the period 2005-2014, FDIs in
the real estate sector grew at a CAGR of 12.76% and stood at MAD 10,760m.
Figure 46- Evolution of the employment in the construction sector (000s) in the period 2007-2014
Source: Ministry of Transport and Public Works
17,83020,875 21,681
24,379
28,82231,552 32,912
37,233 38,663
45,776 47,085 47,94150,099
52,833 52,571
5.1%5.5% 5.5% 5.7%
6.3%6.7%
6.4%6.8%
6.2%
7.0% 6.8%
6.5% 6.5%6.6% 6.3%
2000 2001 2002 2003 2004 2005 2006 2007 2008 2009 2010 2011 2012 2013 2014
Value added of the construction sector (MMAD) Sector value added/Total value added
839904
9661,029 1,059 1,038
988 988
2007 2008 2009 2010 2011 2012 2013 2014

43 Morocco Real Estate Equity Primer, November 16, 2015
Figure 47- Evolution of FDIs (In MMAD) in real estate in the period 2005-2014
Source: Ministry of housing
Last but not least, the construction sector employs around 100,000 people. Beyond the number of jobs
created, this sector can create employment even for the non-educated portion of the population. This is
particularly relevant in Morocco.
4,117
7,591
9,152
5,555
7,268
8,200
7,332 7,518
10,760
2006 2007 2008 2009 2010 2011 2012 2013 2014

44 Morocco Real Estate Equity Primer, November 16, 2015
Figure 48- Porter’s Five Forces Model of Competition
Source: CFG Research
In our opinion, the assessment of the competitive landscape reveals the existence of an opportunity to
invest in developers of social housing. Indeed, the combination of low rivalry among existing
competitors along with high entry barriers should keep production of social housing away from an
oversupply scenario.
Lessening rivalry among existing
competitors
Low threats of new entrants
High bargaining power of customers
Relatively low
threat of substitutes
High bargaining power of suppliers
High Entry barriers
Capital-intensive industry where it is
important to have the financial capability
to acquire big lands in order to comply
with the regulation (A minimum of 500
units developed per project is required)
but also and more importantly in order to
optimize margins (Economies of Scale)
Difficult access to quality land in the cities
where the demand for housing is located
Heavy administrative processes require
an expertise in order to avoid production
delays
On the flipside, no product differentiation,
no switching costs to buyers
Attractive fiscal incentives will end in
2024E
Demand has become selective
Acquirers take more time to select
housing as a result of a more diversified
offer. This is less the case in the
Casablanca-Rabat axis
Heavy dependence on construction subcontractors
Substitutes to MAD 250k social housing
exist, nonetheless, the ability of
developers to adapt to the desired
housing product by offering land plots
for instance keep threat of substitutes
quite low
Also, the economies of scale as well as
the fiscal savings realized in social
housing translate into an unbeatable
products in terms of price-quality ratio
(value for money)

45 Morocco Real Estate Equity Primer, November 16, 2015
Part II: Stocks in the CSE
A backward Glance At Real Estate Stocks When we speak about real estate stocks in the Casablanca stock
exchange, we refer to the four following stocks: ADH, ADI, CGI and RDS.
RDS had their IPO on December 2014, and CGI delisting was
announced on October 2014.
YTD, real estate securities have been underperforming the CFG 25
index and have started to trigger now bullish signals for investors
looking to buy the dips; or for “vulture” investors interested in a stock
like ADI which is going through debt restructuring. This
underperformance has been driven by a series of bad news hitting the
sector such as the CGI case or the ongoing financial distress at
Alliances.
Not only have investors shied away from stock selection by sending all
four real estate stocks in an oversold territory, but they also have
concluded that the bad news were a consequence of a turmoil on the
fundamental scene. Indeed, negative headlines amid the “post-
euphoria period” were considered a consequence of a plummeting
demand for housing, oversupply issues and so on and so forth. We have
shown in Part I that the sector was actually mutating and that the
companies’ issues were tied to former strategic decisions in a sector
still on a “very steep” learning curve. For instance, Addoha have re-
engineered their corporate strategy in order to generate cash as a result of the accumulation of unsold units.
Units were not sold because a couple of projects were not properly designed rather than the demand for
housing losing steam.
What we are emphasizing in this part is that there is a significant behavioral component that has engendered
bearish pressures on all stocks of the sector regardless of how drivers and news flows impact the “present
value of future cash flows” equation. In other terms, no matter what results are indicated by fundamental
research (top-down and bottom-up), investors have to be aware of this behavioral overlay and of a general
climate of psychosis surrounding the sector. In a nutshell, investors have to be aware of the fact that the
sector momentum is unfavorable from a stock market standpoint.
This situation is making investors to put an emphasis on attributes such as the quality of management, the
transparency of financial communication and risk management practices in the companies that they are
considering.
More importantly, we cannot assert enough that for any real estate developer to win in the long run, it is
critical to have the ability to adapt to a demand in a continuous transformation.
The ability to adapt to the demand is the transcendental attribute imperative for developers to
sustain themselves.
“Companies’ issues were tied
to former strategic decisions
in a sector still on a very steep
learning curve.”
“Investors have to be aware of
the fact that the sector’s
momentum is very
unfavorable.”
“The ability to adapt to the
demand is the transcendental
attribute imperative for
developers to sustain
themselves.”

46 Morocco Real Estate Equity Primer, November 16, 2015
Figure 49- Real Estate stocks performance since January 2014
News flags A: Announcement of CGI delisting decided by Ministry of Economy and Finance B: Résidences Dar Saada completed initial public offering (IPO) C: Addoha released a new corporate strategy baptized “cash generation plan” (CGP) for 2015E-2017E and aiming at the reduction of the inventory of finished products. The inventory number was also disclosed D: Alliances issued profit warning with significant decrease of their earnings as well as a restructuring plan to mitigate the financial difficulties that the company is facing Notes: Stock prices are adjusted for splits and dividends The CFG 25 Index is linked to the right axis of the graph RDS, ADI and GCI prices are scaled to fit ADH prices: RDS prices are divided by 4, ADI and CGI prices are divided by 10
Source: CFG Research
16,000
17,000
18,000
19,000
20,000
21,000
22,000
23,000
0
10
20
30
40
50
60
70
80
90
100
Jan-14 Feb-14 Mar-14 Apr-14 May-14 Jun-14 Jul-14 Aug-14 Sep-14 Oct-14 Nov-14 Dec-14 Jan-15 Feb-15 Mar-15 Apr-15 May-15 Jun-15 Jul-15 Aug-15
ADH RDS (1/4) ADI (1/10) CGI (1/10) CFG 25 Index (Right Axis)
A
B
C
D

47 Morocco Real Estate Equity Primer, November 16, 2015
Figure 50- H1-15 Returns on MAD 100 invested in real estate stocks, an equally-weighted real estate portfolio and the CFG 25 index
Notes: Return is a simple return (not a total return); capital gains are never reinvested RE portfolio refers to an equally-weighted portfolio of ADH, ADI and RDS; the portfolio is never rebalanced Funds are invested on Dec 31st 2014 and withdrawn on June 30th 2015
Source: CFG Research
-
20
40
60
80
100
120
Dec-14 Jan-15 Feb-15 Mar-15 Apr-15 May-15 Jun-15
ADH ADI RDS RE Portfolio CFG 25 Index
We construct a simple equally-weighted portfolio which includes ADH, ADI and RDS. We do not include CGI since the delisting of this security has been announced on October 2014. The final value of the portfolio stands at MAD 53.79 vs. MAD 100 initially invested, while an investment in ADH would have generated MAD 75.66, an investment in ADI would have generated MAD 25.37 and an investment in RDS would have generated MAD 89.62. While this plain vanilla diversified portfolio would have hedged an investor against a 75% erosion of their money had they invested in ADI, it did perform very poorly highlighting the importance of stock selection. Indeed, the YTD correlation matrix of simple returns shows that stocks were positively correlated and that RDS which outperformed ADH and ADI did however trade in sympathy with ADI who published a significant decrease of their earnings. YTD correlation matrix of ADH, ADI and RDS simple returns
Source: CFG Research
ADH RDS ADI
ADH 1
RDS 0.36 1
ADI 0.20 0.08 1

48 Morocco Real Estate Equity Primer, November 16, 2015
CFG Coverage Universe Our coverage universe includes Addoha (CS: ADH) and Résidences Dar Saada (CS: RDS). CGI has been delisted
and henceforth does not belong to our coverage universe. Alliances (CS: ADI) is currently in debt
restructuring and on that account has been taken out from our coverage universe.
Before talking about each stock alone, it is important to emphasize that the two developers are now facing an
unprecedented opportunity to serve a healthy demand undersupplied as a result of high entry barriers to an
industry where value creation cannot materialize unless the developer possesses multiple know-hows. It is
also important to highlight the fact that there is an experience curve that the two developers are leveraging
and which explains the convergence of many of their visions today. Some of the previous competitors of the
two companies are distressed which translate into wonderful land acquisition opportunities. Healthy balance
sheets are at the center of Management preoccupations, and top-notch risk management processes are being
implemented to ensure business perpetuation. Amid an unbeatable regulatory and fiscal framework, and a
favorable macroeconomic context, value creation cannot happen unless the developer’s corporate strategy is
appropriate and we show in the following pages that this concern is to be discarded.
49 Morocco Real Estate Equity Primer, November 16, 2015
Addoha: Strategy Re-engineered to Sustain Cash Generation Addoha is the largest real estate developer in Morocco. The social
and intermediate housing segment accounts for more than 60%
of their revenue and the remaining of their sales are generated
from their high-end segment. Consolidated revenue decreased
from MAD 9.3b in 2012 to MAD 7.0b in 2014 as a result of lower
units delivered in both segments where the developer is
operating. It is amid a declining top-line that the developer
launched their 2015E-2017E cash generation plan (CGP).
The CGP reengineered many facets of the real estate giant’s
strategy and focuses on the following pillars: 1/ Generating cash
from the company’s current assets by selling the stocks of unsold
finished products and by reducing clients receivable; 2/ Reducing
both of production and investments in land acquisition over the
coming years; 3/ Launching the marketing of tranches only if
previous tranches have been entirely commercialized; 4/
Launching the production of tranches only if the pre-sale ratio is
above 70%.
Market Data
Share price (MAD) 27
Target Price (MAD) 46.1
Market Cap. (MADm) 8,709
VWAP - 1year (MAD) 36
Highest - 1 year (MAD) 50
Lowest - 1 year (MAD) 23
Daily average volume - 1 year (MADm) 11.0
Share price evolution
Share performance 3m 6m 12m
Absolute performance -6.9% -12.9% -43.8%
Relative to CFG25 0.4% -5.6% -37.9%
20
30
40
50
60
o-14 f-15 j-15 o-15
ADH C25
The ambition of the CGP is for the company to enter a cycle of
strong operating cash flow generation (a total of MAD 8b
targeted for the 2015E-2017E period), in order to reduce the
indebtedness (targeted gearing of 33% at the end of the period
vs. 80% as of 2014), as well as in order to significantly increase
the amount of dividends distributed to their shareholders.
At the occasion of the CGP, Addoha have committed to publish
more indicators in order to assess the advancement of the
implementation of this new strategic plan. Indeed, Addoha now
publish quarterly updates to their cash generation plan in
addition to the regular half-year publication.

50 Morocco Real Estate Equity Primer, November 16, 2015
Why a new strategic plan and what are its main objectives?
In order to have a clear understanding of the genesis of Addoha’s new strategic plan, it’s important in a first
time to understand 3 fundamental points that have led to this strategy re-engineering, and which are related
to the past strategy of the company and to the major evolutions of the sector. In fact:
1/ Since 2011 and until 2013, the company used to have at the end of each year an inventory of unsold
finished products equivalent to almost 6,000 units. These unsold finished products were mainly
corresponding to the most difficult units to sell in the company’s projects (notably ground and last flours
apartments). All these unsold units recorded in the group’s inventories of finished products at the end of each
year, were generally sold in the following year;
2/ Starting from 2013 and more particularly over 2014, the share of unsold products in each project almost
doubled from the 20% it used to represent over the 2011-2013 period, mainly due to a more challenging
competitive environment with the emergence of an alternative offer to Addoha’s projects, leading potential
buyers to adopt a more selective approach in their social housing acquisition processes;
3/ In order to achieve its guidance of at least 25,000 units delivered in 2014, and given the decrease of its
projects’ rates of commercialization, the company started accelerating the development of new projects and
of new tranches in some existing projects, even when only 40% to 50% of previous tranches was sold in some
cases. This intensive development policy led the company to experience a strong rise of its inventories of
finished products to 20,395 units at the end of 2014.
Thus and given these inventories and the risk of a deterioration of the company’s financial structure and cash
flow generation profile, Addoha’s management has decided, after a strategic diagnosis started on August
2014, to adopt some major strategic reorientations through its new 2015E -2017E strategy baptized “Cash
Generation Plan”. The main goals of this new strategy are:
1/ CFFO should stand at MAD 3.2b in 2017E and the cumulative CFFO should stand at MAD 8b for the 2015E-2017E
period;
2/Gearing (Net debt/Total Equity) should hover around 33% in 2017E;
3 WCR should decrease by MAD 4.5b in 2017E vs.2014;
4/Dividends will increase starting from 2015E;
5/Receivables days should stand at 4 months of sales at the end of the period;
6/Net receivables should decrease by MAD 6.5b between 2013 and 2017E;
7/Production to decrease almost two-fold from 25,000 units in 2014 to 14,000 units in 2017E;
8/Inventory of unsold finished products to decrease from 20,395 units in 2014 to 8,400 units in 2017 E;

51 Morocco Real Estate Equity Primer, November 16, 2015
The strategic plan in details
The plan aims to:
1/ Focus in the 3 coming years on selling the unsold units accumulated in the company’s inventories over
2014 (almost 20,395 units at the end of 2014). The objective is to sell 80% of these units by 2017E by
eventually revising their pricing depending on the projects and geographical areas where they are located,
further motivating the sales force to market these units, and concentrating communication efforts on these
products. Consequently and over the 2015 E -2017E period, revenues generated from the inventory of finished
products should represent almost half of total revenues;
2/ Strongly limit launching the commercialization of new tranches in projects where unsold units are located.
The commercialization of new tranches will be launched only if previous tranches are almost totally sold.
3/ Avoid in the future a new accumulation of unsold
units in the group’s inventories. Consequently, the
group will limit launching the development of new
projects, to only those which reach a
commercialization rate threshold of 70%. This
will lead to a postponement of the production of the
projects that don’t meet these criteria. This will also
result in a strong decline in the company’s
production over the 3 coming years vs. 25,000 units
in 2014.
4/ Strongly reduce investments in land acquisition. These investments were already deflated from MAD
2,100m in 2012 to MAD 700m in 2013 and 2014, and the objective is to further reduce them to a maximum of
MAD 300m per year in the future.
5/ To decrease its clients’ accounts receivable from 10 months of sales by the end of June to 4 months of sales
by the end of 2017E. According to the management of the company, this favorable evolution will be mainly
enabled by:
i/ More linear deliveries throughout coming years enabling the group to reduce the recorded amount
of accounts receivable at the end of the year. In the past, most deliveries were concentrated on the
second half and more particularly on the last months of the year, thus mechanically resulting in an
amplification of clients’ accounts receivable at the end of the year;
ii/ The increasing share of revenues generated by the stock of unsold units. When sold, the cash
collection related to these products requires in general less time than for new finished units, as a
significant part of the necessary administrative processes is already performed;
iii/ A general acceleration of the administrative processes between the moment when the unit is
delivered to the client and the moment when the company collect the cash, thanks to a decline in the
volume of the files that will submitted by Addoha’s customers to public authorities. In fact, Addoha’s
social and intermediary housing deliveries should be significantly reduced from an average 24,615
units per year between 2011 and 2013 to an average 17,000 units per year over the 2015E-2017E
period.
Figure 51- Total production (in number of units)
Source: Addoha
24,990
12,000 13,000 14,000
2014 2015E 2016E 2017E

52 Morocco Real Estate Equity Primer, November 16, 2015
Figure 52- Targeted evolution of clients’ accounts receivable (in MAD b) and of their average term of collection (in months of sales)
Source : Addoha
If the company manages to achieve all its objectives, it should be able to generate a huge level of cash flows
from operations estimated by the management at MAD 1.8 b in 2015E, MAD 3.0 b in 2016E and MAD 3.2 b in
2017E. This would enable it to significantly decrease its gearing from 80% in 2014 to 33% in 2017E, as well as,
to strongly increase the dividends distributed to shareholders. In this regard, Addoha has communicated the
following KPIs and has committed to achieve them within the framework of this new strategic plan. The
quarterly publications of Addoha in 2015 have shown that they have the potential to generate more CFFO
than the MAD 1.8b expected by Management in 2015E.
Figure 53- Targeted consolidated revenues (in billions of MAD)
Figure 54- Targeted Shareholders’ Equity, Net Debt and Gearing evolution
Source: Addoha Source: Addoha
10.3
8.57.2
5.3
3.5
10.9
12.1
10.0
7.1
4.6
2013 2014E 2015E 2016E 2017E
Clients accounts receivables (in MAD bn) Average collection term (in months of sales)
7.02
7.21
7.44
7.64
2014E 2015E 2016E 2017E
12.012.7
13.2 13.5
9.69.1
5.9
4.5
80%
72%
45%
33%
2014E 2015E 2016E 2017E
Shareholders Equity (MAD bn) Net Debt (MAD bn) Gearing (%)

53 Morocco Real Estate Equity Primer, November 16, 2015
Figure 55- Targeted Investments in production & Clients’ accounts receivables
Figure 56- Targeted CFFO after investments in land acquisition (in billions of MAD)
Source: Addoha Source: Addoha
Finally and in order to ensure the success of its new strategic plan and restore the financial market
confidence in the stock, the management has decided to take some measures aimed at further improving the
governance of the company as well as its financial communication:
1/ Implementation of a monitoring committee. This committee will be constituted in the coming months and
will be in charge of following the achievements of this new strategic plan and approving all the decisions
related to future land acquisitions;
2/ Nomination of more independent directors in the board of administrators ;
3/ Upgrading the financial communication of the company through publishing the group’s results on a
quarterly basis (vs. half-year basis previously). The management has also committed to release in the future
detailed information and KPIs to enable investors to follow-up closely the advancement of its new strategic
plan;
4/ Implementation of a group’s grading system after the completion of this new strategic plan.
Most of these new strategic plan objectives should be achieved. Margins should however witness a
contraction. We also adopted a more conservative assumption than the management in terms of
clients’ accounts receivable reduction.
The announcement of this new strategic plan came as surprise given the extent and the significant increase
over 2014 of the proportion of unsold finished products in the company’s inventories. As long as this stock
was contained to 6,000 units, we believed that the company could have continued increasing moderately its
sales and deliveries year after year, while entering into a strong cash flow generation cycle.
But given the new configuration of these stocks in 2014, we have the conviction that the management’s
reaction through this new strategic plan is completely relevant and appropriate. In fact, if Addoha continued
in its past strategy focused on delivering each year 25,000 units, this would have led to a dangerous increase
in finished products inventories. In the current market context, the company would have needed to
constantly increase its production to reach the same level of sales. Such an evolution would have conducted
the company to enter into a cycle of strong cash flows destruction with a significant rise of its net debt. Thus,
we fully approve the group’s decision to sharply reduce its future production, although this would result in an
important decline in Addoha’s deliveries, revenues and profits over the coming years.
7.3
4.1 4.2 4.5
8.5
7.2
5.3
3.5
2014 2015E 2016E 2017EInvestments in production (in MAD bn) Clients Accounts Receivables (in MAD bn)
0.2
1.8
3.03.2
2014 2015E 2016E 2017E

54 Morocco Real Estate Equity Primer, November 16, 2015
Concerning the financial objectives settled within the framework of this new strategy, we believe that:
1/ Addoha should be able to reach its goals in terms of sales related to the products currently included in its
finished products. In the past years, and even in 2014 when the demand’s configuration deteriorated, the
company managed to sell 6,000 units per year from its finished products inventories. Most of these 6,000
units correspond to the units that are usually the less attractive and hardest ones to sell in the group’s
projects.
2/ The group’s capacity to market these units combined with a sharp reduction of its production from 25,000
units in 2014, to 12,000 units, 13,000 units and 14,000 units in 2015E, 2016E and 2017E respectively, should
enable it to reduce its stock of unsold finished products from around 17,000 units by the end of 2014 to 8,400
units by 2017E. The decline in the group’s future production is justified by 2 major decisions of the new
strategic plan:
i/ In projects where the currently unsold units are located, the company will sharply limit the launching of
new tranches commercialization. New tranches will be launched only if previous tranches are almost totally
sold;
ii/ The construction of a new project or a new tranche will be started only if 70% of its units are pre-sold.
3/ The objectives in terms of revenues over the 2015E -2017 E period are achievable. Also and according to
our estimates, the forecasted revenues over the 2015E -2017E could be generated through the following
achievements in terms of revenues and deliveries by segment:
i/ Social and intermediary deliveries over the 2015E -2017E period should range between 16,853 and 17,534
units. Revenues from this business activity should range between MAD 4.35b and MAD 4.53b, thus
representing 61% of total revenues (vs. 68% on average between 2011 and 2013) ;
ii/ High-end deliveries over the 2015E -2017E period should range between 1,140 and 1,186 units. Revenues
from this business activity should range between MAD 2.82b and MAD 2.94b, thus representing the
remaining 39% of total revenues (vs. 32% on average between 2011 and 2013) ;
Figure 57- Revenues by segment from 2014 to 2017E (in billions of MAD)
Figure 58- Deliveries by segment from 2014 to 2017E (in units)
Source: Addoha, CFG Research Source: Addoha, CFG Research
4/ The gross margin of the social and intermediary housing segment should witness a contraction due to 2
reasons: i/ The higher proportion of less profitable units in the group’s future deliveries as Addoha will focus
in the coming years on selling the unsold units accumulated in its 2014 finished products inventories. We
expect this proportion to increase from an average 25% over the past years to almost 1/3 over the 3 coming
4.27 4.35 4.44 4.53
2.77 2.82 2.88 2.94
2014 2015E 2016E 2017E
Social and Intermediary Segment High-End Segment
16,52316,853
17,19117,534
1,118
1,140
1,163
1,186
2014 2015E 2016E 2017E
Social and Intermediary Segment High-End Segment

55 Morocco Real Estate Equity Primer, November 16, 2015
years; ii/ The group will likely need to revise down the prices of some of these products to ensure their
commercial success. The consolidated gross margin contraction should however be limited by the rising
contribution of the high-end segment to total revenues. In fact, the high-segment gross margin should stand
at 33% over the coming years vs. a S&I housing segment gross margin ranging between at 27.8% from 2015E
to 2017E.
Figure 59- Gross margin from 2011 to 2017E Figure 60- Revenues breakdown by segment from 2014 to 2017E
Source: Addoha, CFG Research Source: Addoha, CFG Research
Figure 61- EBITDA margin from 2011 to 2017E Figure 62- Net margin from 2011 to 2017E
Source: Addoha, CFG Research Estimates Source: Addoha, CFG Research Estimates
5/ The group’s net debt should be reduced by almost MAD 4.2b from 2014 to 2017E according to our
estimates, thus reaching a gearing of 41% vs. 33% targeted by the company. This favorable debt evolution
should be mainly driven by a MAD 3.3b reduction of working capital requirements (vs. MAD 4.5b targeted by
the company).
Regarding clients’ accounts receivable, it’s also important to notice that we adopted a much more
conservative approach that the management as we expect clients’ accounts receivable to represent
7.0 months of sales in 2017E vs. 4 months of sales targeted by the company. We have also taken into
account the decrease in the amount of debt to suppliers (negative impact on WCR) in order to take
into consideration the reduction of the group’s production.
29.8%
32.8%
27.1%
24.4% 24.4% 24.4% 24.4%
30.0%
32.8%
28.4%
33.0% 33.0% 33.0% 33.0%
29.8%
32.6%
27.5% 27.8% 27.8% 27.8%27.8%
2011 2012 2013 2014 2015E 2016E 2017E
Social and Intermediary Segment Gross Margin High-End Segment Gross Margin Consolidated Gross Margin
61% 61% 61% 61%
39% 39% 39% 39%
2014 2015E 2016E 2017E
Social and Intermediary Segment High-End Segment
24.5%
27.9%
24.3%
19.3% 19.3% 19.4% 19.5%
2011 2012 2013 2014 2015E 2016E 2017E
EBITDA Margin
19.7%
19.1%17.8%
14.4% 14.6% 14.8% 15.0%
2011 2012 2013 2014 2015E 2016E 2017E
Net Margin

56 Morocco Real Estate Equity Primer, November 16, 2015
Figure 63- Net Debt and Gearing from 2014 to 2017E
Figure 64- Working capital requirements from 2014 to 2017E (in MAD m)
Source: Addoha, CFG Research Source: Addoha, CFG Research
Clients’ accounts receivable from 2014 to 2017E (in MMAD) Clients’ accounts receivable from 2014 to 2017E (in months)
Source: Addoha, CFG Research Source: Addoha, CFG Research
6/ Dividends should increase starting 2014. In fact, thanks to the strong cash flow generation forecasted over
the 2015E-2017E period, Addoha should be able to reduce its net debt, as well as to rise significantly its
dividends. We thus expect the company to raise its DPS to MAD 2.4 in 2015E, to MAD 2.9 in 2016E and MAD
3.3 in 2017E.
DPS (in MAD) Dividend Yield (on the basis of current share price)
Source: Addoha, CFG Research Source: Addoha, CFG Research
9.3
7.8
6.15.1
80%
65%
50%
41%
2014 2015E 2016E 2017E
Net Debt (in MAD bn) Gearing
20.0
18.8
17.516.7
2014 2015E 2016E 2017E
Working Capital Requirements (in MAD bn)
8.4
6.65.8
5.2
2014 2015E 2016E 2017E
Clients' Accounts Receivable (in MAD bn)
11.9
9.27.9 7.0
2014 2015E 2016E 2017E
Clients' Accounts Receivable (in months of sales)
2.02.4
2.93.3
63.8%75.0%
85.0%95.0%
2014 2015E 2016E 2017E
Dividend per share (in MAD) Payout ratio
7.4%
9.0%
10.6%
12.2%
2014 2015E 2016E 2017E
Dividend Yield

57 Morocco Real Estate Equity Primer, November 16, 2015
Valuation & Opinion
We value Addoha using an equally weighted average of a DCF-derived intrinsic value and a DDM-derived fair
value. We believe that this valuation method is appropriate regarding the low growth, high yield profile of the
stock.
Using a WACC at 8.0%, we obtain an intrinsic value at MAD 46.1 per share for the stock. With this target
price, the stock offers an upside potential of 70.7% versus the close on 11/04/15).
Henceforth, we recommend buying ADH. We believe that this stock is appealing for income investors
especially amid the current corporate strategy which is intending to increase dividends.
We are also comforted in our conviction about the share price potential recovery by:
- The company’s current low valuation multiples with a 2015E P/B of 0.7x and a 2015E P/E of 8.3x;
- The high levels of DY implied by the current share price. This high yield profile is all the more
interesting given the strong local investors’ appetite for high dividend yield stocks since the beginning of this
year;
The management’s objective to further improve the group’s governance and financial communication through
quarterly publications related to its financial results, and to the detailed achievements of its new strategic
plan. Over the coming quarters, this could play a major role in restoring investors’ confidence in the stock.
Figure 65- 2014-2017E P/E (on the basis of 11/04/15 share price)
Figure 66- 2014-2017E P/B (on the basis of 11/04/15 share price)
Source: Addoha, CFG Research Source: Addoha, CFG Research
8.6x
8.3x8.0x
7.8x
14 15E 16E 17E
0.7x
0.7x
0.7x0.7x
14 15E 16E 17E

58 Morocco Real Estate Equity Primer, November 16, 2015
We obtain a DCF-derived fair value at MAD 49.5 per share.
Figure 67- Discounted Cash Flow Model of Addoha
Source: CFG Research
Assuming that the dividend payment month will remain September, and using our projections of the
dividends paid out from 2016E to 2020E, we obtain a DDM-derived intrinsic value at MAD 42.7 per share.
Figure 68- Dividend Discounted Model of Addoha
Source: CFG Research
Risks
Please refer to (Figure 48- Porter’s Five Forces Model of Competition) for an analysis of the industry’s
risks.
n (Fiscal year ends in December) 0 0.17 1.17 2.17 3.17 4.17 5.17 5.17
2014 2015E 2016E 2017E 2018E 2019E 2020ETerminal Value
Dicsounted FCFF 2,633,438 2,585,976 1,946,837 1,004,502 988,607 936,742 16,183,981
Entreprise Value 26,280,083
-Net Debt (end year 2014) 9,316,216
-Estimated Value of Minority interests 498,354
-Dividends Paid Out in 2015 645,114
+Non-operating assets (book value) 133,305
= Equity Value 15,953,703
Shares Outstanding 322,557,118
Fair value (MAD per share) 49.5
All values in kMAD excepted per share data
n (payment month is September) 0 0.83 1.83 2.83 3.83 4.83 4.83
2015 2016E 2017E 2018E 2019E 2020ETerminal Value
Discounted dividends (kMAD) 645,114 726,641 773,770 811,392 823,707 768,033 9,885,099
Sum of discounted dividends (kMAD) 13,788,643
Shares Outstanding 322,557,118
Fair value (MAD per share) 42.7

59 Morocco Real Estate Equity Primer, November 16, 2015
Summary financials
Notes: Data is calculated using the last close price (November 4th, 2015).
Source: CFG Research Estimates
P&L - In MADm 2014 2015E 2016E 2017E
Total revenues 7,036.3 7,177.0 7,320.5 7,467.0
Change in % -25.5% 2.0% 2.0% 2.0%
EBITDA 1,354.7 1,388.0 1,423.1 1,459.0
Change in % -41.0% 2.5% 2.5% 2.5%
EBITDA margin 19.3% 19.3% 19.4% 19.5%
EBIT 1,332.2 1,365.0 1,399.6 1,435.0
Change in % -40.5% 2.5% 2.5% 2.5%
EBIT margin 18.9% 19.0% 19.1% 19.2%
Financial result -58.5 -47.8 -39.0 -31.5
Consolidated Net Income 1,073.9 1,112.8 1,149.4 1,185.4
Change in % -37.0% 3.6% 3.3% 3.1%
Net margin 15.3% 15.5% 15.7% 15.9%
Of which Group Share 1,011.7 1,048.3 1,082.8 1,116.7
Of which Minority Interests 62.2 64.5 66.6 68.7
Simplified BS - In MADm 2014 2015E 2016E2017E
Fixed assets 1,281 1,281 1,281 1,281
Working Capital 19,953 18,839 17,520 16,697
Economic Asset 21,234 20,120 18,800 17,978
Shareholders Equity 11,616 12,044 12,359 12,568
Other Liabilities 301 301 301 301
Net debt 9,316 7,774 6,140 5,109
Capital Employed 21,234 20,120 18,800 17,978
Financial ratios 2014 2015E 2016E2017E
ROCE 6.3% 6.8% 7.4% 8.0%
ROE 8.7% 8.7% 8.8% 8.9%
Gearing 80% 65% 50% 41%
EPS 3.1 3.3 3.4 3.5
DPS 2.0 2.4 2.9 3.3
Valuation multiples 2014 2015E 2016E2017E
EV/Sales (x) x2.6 x2.5 x2.5 x2.4
EV/EBITDA (x) x13.3 x13.0 x12.7 x12.4
EV/EBIT (x) x13.5 x13.2 x12.9 x12.6
P/E (x) x8.6 x8.3 x8.0 x7.8
P/B (x) x0.7 x0.7 x0.7 x0.7
DY 7.4% 9.0% 10.6% 12.2%

60 Morocco Real Estate Equity Primer, November 16, 2015
Résidences Dar Saada: A Beautiful House in A Bad Neighborhood This title summarizes our opinion that Résidences Dar Saada is a
great stock from a fundamental perspective. Unfortunately, their
performance in the stock market was hindered since their IPO in
December 2014 as a result of an adverse sector momentum. The
metaphor is in our view quite accurate and reflects a situation
where the stock is mispriced as would be an architectural gem
suddenly devalued because of a not-so-nice neighborhood.
What we like about the stock:
Growth story amid favorable market conditions: While there
is a clear demand for the housing supplied by Résidences Dar
Saada, the supply of housing remains limited as a result of many
developers shying away from this business. This context is also
favorable for land acquisition in a market where the offer is
plentiful and where developers with cash in hand have become
very scarce.
Strong guidance beat surprise: Actual earnings came above
Management guidance four times in a row (since the 2012 bond
issue).
Sound Risk Management practices: Résidences Dar Saada
finance their projects using project finance debt instead which ensures proper risk management of the
underlying project. It is worth noting that the company has pioneered this practice in the sector. According to
Management, debt raised in capital markets is also allocated to specific projects to avoid managing debt at the
balance sheet level. Unlike other companies in the sector, indebtedness is a no-subject for RDS.
Important visibility thanks to a high number of pre-sales. Indeed, RDS pre-sold more than 14,500 units
securing around MAD 4.3b (2.4 times 2014 revenue)
Heavy concentration of the projects in the Casablanca-Rabat axis: There is a clear experience curve in
this market, and RDS are clearly leveraging it. Their projects are carefully selected in the region where the
employment landscape creates a sizable pool of demand. Also, access to land in this region can become a
gargantuan task for developers. The company has a competitive advantage thanks to an expertise in land
acquisition.
Differentiation through quality: This has become important in a context where demand has become more
selective than a few years ago. The product design of Residences Dar Saada is also very appealing to the
populations targeted. Projects are built like small cities favoring life in community. Indeed, these populations
display very high “collectivism” attributes as Hofstede would argue.
Market Data
Share price (MAD) 152
Target Price (MAD) 261
Market Cap. (MADm) 3,989
VWAP - 1year (MAD) 181
Highest - 1 year (MAD) 215
Lowest - 1 year (MAD) 120
Daily average volume - 1 year (MADm) 2.5
Share price evolution
Share performance 3m 6m 12m
Absolute performance -9.9% -15.4% -29.2%
Relative to CFG25 -2.9% -8.3% -21.7%
110
130
150
170
190
210
230
d-14 j-15 f-15m-15m-15a-15m-15 j-15 j-15 a-15 a-15 s-15 o-15
RDS C25

61 Morocco Real Estate Equity Primer, November 16, 2015
The firm’s mission statement is to produce housing that is adapted to the demanders of housing. In other
terms, the evolution of the product mix of RDS is likely to mirror the evolution of the demand for housing in
the Moroccan real estate market. We believe that the willingness of management to tailor their strategic
decisions to fit the attributes of the acquirers of housing can help sustain this business. RDS have the
ambition to grow -prudently- as highlighted by the forecasts drawn in their pre-IPO prospectus. Management
expected that the top-line would grow at a 2014-2017E CAGR of 12.2%.
Decrypting 2014 results
In 2014, Résidences Dar Saada clearly remained “a social housing story”. Figure 69- Sources of RDS revenue in 2014
Source: Résidences Dar Saada, CFG research
A large portion of the business generated was located in the Casablanca-Rabat axis where many
households can afford to acquire a social housing unit.
Figure 70- Geographical Breakdown of RDS revenue in 2014
72.6%
59.2%
14.6%
23.07%
4.3% 5.8%3.2%
9.5%5.2%
2.4%
% in Volume % in Value
Social housing Land plots Intermediate housing Commercial units Low property value
Source: Résidences Dar Saada , CFG research
51.0%
57.6%
24.8%22.4%
24.2%
20.0%
% in Volume % in Value
Casablanca-Rabat Center-North South
In 2014, RDS sold 5,990 units and generated
revenue of MAD 1,812m (up 63% YoY). This
revenue is broken down into:
MAD 1,070m corresponding to the sale
of 4,350 social housing units;
MAD 418m corresponding to the sale of
876 land plots;
MAD 172m corresponding to the sale of
194 commercial units;
MAD 106m corresponding to the sale of
258 intermediate housing units;
And MAD 44m corresponding to the
sale of 312 low property value homes.
The units sold in in 2014 are broken down
geographically as follows:
3,056 units sold in the Casablanca-Rabat
region which corresponds to MAD
1,044m of revenue generated;
1,484 units sold in the Center-North
region which corresponds to MAD 406m
of revenue generated;
1,450 units sold in the South region
which corresponds to MAD 354m of
revenue generated.

62 Morocco Real Estate Equity Primer, November 16, 2015
Figure 71-Breakdown of the units sold
*The orange color refers to projects fully completed The blue color refers to projects under construction
Source: Résidences Dar Saada, CFG research
Casablanca-Rabat 3,056
Casablanca 3,056
Jnane Nouaceur 189
Fadaat Rahma 549
Oulad Azzouz 1,654
Fadaat Elyassamine 664
Center-North 1,484
Tanger 750
Jardins de l'Atlantique (Ilot 19) 103
Dyar El Boughaz (Ilot 14) 647
Fès 734
Bouhayrat Saiss 734
South 1,450
Marrakech 282
Saada III (Tamensourt) 162
Dyar Marrakech 120
Agadir 1,137
Adrar Ilot 5 386
Adrar Ilot 9 149
Adrar Anza 275
Nzaha 327
Total 5,990
Figure 72-Average price per unit (APPU) by project
Source: Résidences Dar Saada, CFG research
Projects Units
sold
Revenue
MMAD
APPU
MAD
Projects fully completed 2,260 687 303,982
Casablanca 738 222 300,813
Jnane Nouaceur 189 67 354,497
Fadaat Rahma 549 155 282,332
Marrakech 282 71 251,773
Saada III (Tamensourt) 162 41 253,086
Dyar Marrakech 120 30 250,000
Agadir 1,137 361 317,502
Adrar Ilot 5 386 97 251,295
Adrar Ilot 9 149 30 201,342
Adrar Anza 275 156 567,273
Nzaha 327 78 238,532
Tanger 103 33 320,388
Jardins de l'Atlantique 103 33 320,388
Projects in construction 3,699 1,098 296,837
Casablanca 2,318 733 316,221
Oulad Azzouz 1,654 568 343,410
Fadaat Elyassamine 664 165 248,494
Fès 734 208 283,379
Bouhayrat Saiss 734 208 283,379
Tanger 647 157 242,658
Dyar El Boughaz 647 157 242,658

63 Morocco Real Estate Equity Primer, November 16, 2015
Figure 73-Résidences Dar Saada projects (updated at the end of 2014)
Source: Résidences Dar Saada , CFG research
Projects Surface
(hectars)
Number
of units
Delivered
in 2014
To be
delivered
Inventory
of pre-sold
units
% units
realized
% pre-sold Units
produced
in 2014
Deliveries
in 2014
Deliveries
in MMAD
APPU in
MAD
Finished projects 112.4 19161 16062 3072 17397 100 91% 388 2,260 687
Casablanca 43.8 5572 5011 551 5259 100 94% 388 738 222
Médiouna 11 394 393 1 394 100 100%
Jnane Nouaceur 18.9 3265 3143 113 3217 100 99% 189 67 354497
Fadaat Rahma 13.9 1913 1475 437 1648 100 86% 388 549 155 282332
Marrakech 45.1 8363 8043 312 8174 100 98% 282 71
Saada I 23.5 3647 3632 11 3634 100 100%
Saada II 2.6 794 787 5 789 100 99%
Saada III (Tamensourt) 17.9 3269 3020 248 3107 100 95% 162 41 253086
Dyar Marrakech 1.1 653 604 48 644 100 99% 120 30 250000
Agadir 14.6 3339 2258 1072 2597 100 78% 1,137 361
Adrar Ilot 5 2.1 403 386 15 399 100 99% 386 97 251295
Adrar Ilot 8 1.1 724 714 8 715 100 99%
Adrar Ilot 9 2.7 513 247 265 400 100 78% 149 30 201342
Adrar Anza 1 400 275 125 356 100 89% 275 156 567273
Nzaha 7.7 1299 636 659 727 100 56% 327 78 238532
Tanger 8.9 1887 750 1137 1367 100 72% 103 33
Jardins de l'Atlantique (Ilot 19) 5.1 1063 103 960 645 100 61% 103 33 320388
Dyar El Boughaz (Ilot 20) 3.8 824 647 177 722 100 88%
Projects in construction 369.8 29636 3747 25778 14351 64% 6,562 3,699 1,098
Casablanca 171.2 14728 2318 12338 10463 80% 3,858 2,318 733
Oulad Azzouz 68.3 7923 1654 6231 7563 40% 97% 3,199 1,654 568 343410
Fadaat Elyassamine 3.7 799 664 133 704 82% 88% 659 664 165 248494
Jnane El Menzeh 56.5 958 0 950 203 51%
Manazil Mediouna 5.4 1230 0 1228 387 31%
Dyar Al Ghofrane 37.3 3818 0 3796 1606 55%
Fès 124.3 7412 1322 6073 1756 39% 2,074 734 208
Bouhayrat Saiss 124.3 7412 1322 6073 1756 46% 39% 2,074 734 208 283379
Marrakech 33.5 2199 107 2085 935 72%
Targa Garden 21 313 107 203 195 35% 62%
Targa Resort 12.5 1886 0 1882 740 75%
Skhirat 10 2232 0 2222 478 60%
Jawharat Skhirat 10 2232 0 2222 478 60%
Tanger 3.9 1349 0 1346 606 45% 630 647 157
Dyar El Boughaz (Ilot 14) 3.9 1349 0 1346 606 45% 630 647 157 242658
Oujda 26.9 1716 0 1714 113 9%
Projet Oujda 26.9 1716 0 1714 113 9%
Projects in development 230.7 19784 0 21259 2168 38%
Casablanca 201.7 14882 0 16361 673 17%
Panorama 28 3344 0 3372 613 34%
Sania 21.6 2251 0 2245 60 3%
Arraha 16.3 2402 0 2393
Laassilate 115.6 5830 0 5830
Tamaris 21 1055 0 2521
Agadir 2.5 307 0 306
Adrar Ilot 8 extension 2.5 307 0 306
Marrakech 15.9 2205 0 2202
Azzouzia 15.9 2205 0 2202
Martil 10.6 2390 0 2390 1495 93%
Projet Martil 10.6 2390 0 2390 1495 93%
Total 712.9 68581 19809 50109 33916 72% 6,950 5,990 1,785

64 Morocco Real Estate Equity Primer, November 16, 2015
The average sale price stood at MAD 303k across all regions and segments. Figure 74- Average sale price per unit per property type and per region in 2014
Source: Résidences Dar Saada, CFG research The evolution of the average sale price per unit depends on the evolution of the product mix. According to the
pre-IPO prospectus, this latter should evolve according to the following radar chart:
Figure 75-Evolution of the product mix as presented in the IPO prospectus
Source: Résidences Dar Saada, CFG research We are comforted with the idea that the expansion of the business by 2017E will be realized with the focus on
social housing in the Casablanca region.
0 200 400 600 800 1000
Social housing
Low property value
Land plots
Intermediate housing
Commercial units
Price per unit (kMAD)
0.0%
10.0%
20.0%
30.0%
40.0%
50.0%
60.0%
70.0%Social housing
Intermediate housing
Land plots
Others
2015 2016 2017
0.0%
10.0%
20.0%
30.0%
40.0%
50.0%
60.0%Casablanca
Agadir
MarrakechNorth
Other regions
2015 2016 2017
0 50 100 150 200 250 300 350 400
Center-North
Casablanca-Rabat
South
Price per unit (kMAD)

65 Morocco Real Estate Equity Primer, November 16, 2015
Figure 76-Evolution of the price per unit as a result of a higher contribution of social housing to total revenue
Source: Résidences Dar Saada, CFG research
Commenting H1-2015 results
Results in line with the guidance – Outstanding earnings surprise record
Revenue stood at MAD 679m down 13% YoY as a result of the expected seasonality in deliveries in 2015.
Indeed, as a result of the evolution of projects being currently produced, higher deliveries are expected in H2-
15 than in H1-15. Deliveries in H2-15 will include both the units pre-commercialized and produced in H1-15
in addition to units pre-commercialized and produced in H2-15.
As a reminder, the production process implies higher deliveries in H2 as a result of the initiation of projects
almost always happening at the beginning of the year along with the fact that production usually lasts 18
months.
The H1-15 guided Net Income was expected at MAD 115m. RDS beat their guidance this semester with a Net
Income delivered at MAD 155m.
The bottom-line performance indicates Management ability to properly manage their projects and time their
deliveries. Since the first guidance issued at the 2012 bond issues, RDS have delivered 4 earnings beats in a
row with the largest beat by far being the last one.
It is worth noting that the FY-15 guidance is reiterated with a Net Income expected between MAD 450m and
MAD 460m vs. 2014 Net Income at MAD 406m.
Management guided H1-15 Net Income to account for 25% of the FY-15 Net Income vs. an actual contribution
at more than 30% should the FY guidance materializes as a result of YoY seasonality shifts. Also, net margin
stood at 23% higher than the industry average.
Balance sheet in a healthy territory amid a market where operators are overindebted
Aside from a low gearing, we are particularly comforted with the level of receivables in conjunction with the
evolution of sales. Indeed, while the top-line is expanding, receivables are not soaring indicating that cash
generation is properly materializing. Receivables stood at 3.5 months of sales, much lower than competitors.
Furthermore, the inventory of finished products is quite “young” discarding issues about un-sellable units
369
354
346
50.6%
58.8%
64.1%
Price per unit (kMAD) Social housing as a % total revenue (in value)

66 Morocco Real Estate Equity Primer, November 16, 2015
being carried in the balance sheet. Also, along with expected deliveries, this inventory will contribute to the
targeted results for FY-15 and beyond.
Pre-sales discard worries about a plummeting demand for the housing supplied by RDS
Pre-sales stood at 2,596 units up 7% YoY triggering a positive sentiment regarding the sustainability of
demand for social housing primarily. The total units pre-sold stand at 14,533 units i.e. estimated revenue of
MAD 4.3b which will along with the expected planning of production put future earnings in a very healthy
territory. Indeed, the production indicators are also very satisfactory with the units produced up 15% YoY IN
H1-15.
It is worth noting that Résidences Dar Saada published an update to their operational indicators on August,
10th. This additional publication reveals management keenness to build trust and proximity with
shareholders through an increased frequency of publications. Indeed, the stock has been trading in sympathy
with other names in the sector oversold as a result of a lack of trust in the market.

67 Morocco Real Estate Equity Primer, November 16, 2015
Land bank and ongoing land acquisitions
Figure 77-Land Bank Acquisition History
Source: Résidences Dar Saada, CFG research Figure 78- Geographical breakdown of the land bank
Source: Résidences Dar Saada, CFG research
Year of
acquisition
City Surface (hectars) Surface
allocated to
projects
(hectars)
Surface
available
(hectars)
1980-1990 Marrakech 25 25 0
2005 Marrakech 44 41 3
2006 Marrakech 220 12 208
2007 Agadir 8 8 0
2007 Casablanca 19 19 0
2007 Marrakech 7 7 0
2007 Tanger 13 13 0
2008 Agadir 8 8 0
2008 Casablanca 33 33 0
2008 Fès 124 124 0
2008 Marrakech 2 0 2
2009 Marrakech 11 9 2
2011 Casablanca 249 249 0
2012 Casablanca 56 56 0
2013 Casablanca 75 37 38
2013 Oujda 27 27 0
2013 Skhirat 10 10 0
2014 Casablanca 23 21 2
2014 Martil 11 11 0
2015 Casablanca 4.1 0 4.1
Total Maroc 969.1 710 259.1
City Surface
(hectars)
Surface
allocated
to projects
(hectars)
Surface
available
(hectars)
# of
projects
# of units
Agadir 16 16 0 6 3,645
Casablanca 459.1 415 44.1 13 36,666
Fès 124 124 0 1 7,428
Marrakech 309 94 215 7 12,764
Martil 11 11 0 1 2,525
Oujda 27 27 0 1 1,721
Skhirat 10 10 0 1 2,226
Tanger 13 13 0 3 3,236
Total 969.1 710 259.1 33 70,211
Region Surface
(hectars)
Surface
allocated
to projects
(hectars)
Surface
available
(hectars)
Casablanca-Rabat: Casablanca+Skhirat 469.1 425 44.1
North: Fès+Martil+Oujda+Tanger 175 175 0
South: Agadir+Marrakech 325 110 215
Total 969.1 710 259.1
Total surface allocated to projects in
years of social housing production is
7 years (12% of 710ha is constructed
ground and using Management
projections in terms of deliveries)
Management disclosed the acquisition
of a 4.1 hectares land in Casablanca in
the downtown area in 2015. This land
will be developed to produce
intermediate housing units and shops.
The project will count about 1,000 units
and should generate around MAD 1.2b
according to the release.
The land acquisition costs hovers
around MAD 200m
This project will be located in the
Roches Noires area. According to the
ministry of Finance benchmark of real
estate prices, the price per square
meter for a new apartment in the
Roches Noires area hovers between
MAD 10,000 and MAD 12,000 per
square meter and could even reach
MAD 15,000 per square meter in some
streets. It is thus foreseeable to
generate more than MAD 1b in turnover
for this project.
More than ever, it is critical for real
estate developers to build projects
where the demand is located. Today, the
bulk of the demand for social and
intermediate housing demand is located
in the Casablanca-Rabat area.
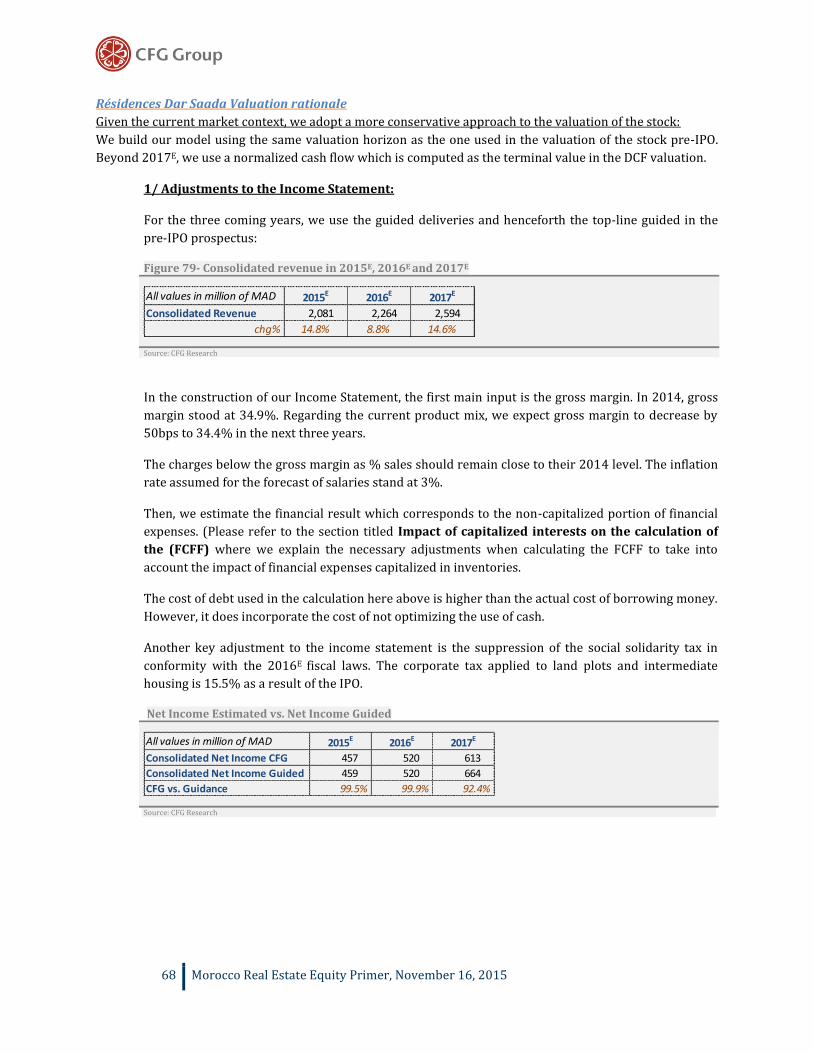
68 Morocco Real Estate Equity Primer, November 16, 2015
Résidences Dar Saada Valuation rationale
Given the current market context, we adopt a more conservative approach to the valuation of the stock:
We build our model using the same valuation horizon as the one used in the valuation of the stock pre-IPO.
Beyond 2017E, we use a normalized cash flow which is computed as the terminal value in the DCF valuation.
1/ Adjustments to the Income Statement:
For the three coming years, we use the guided deliveries and henceforth the top-line guided in the
pre-IPO prospectus:
Figure 79- Consolidated revenue in 2015E, 2016E and 2017E
Source: CFG Research
In the construction of our Income Statement, the first main input is the gross margin. In 2014, gross
margin stood at 34.9%. Regarding the current product mix, we expect gross margin to decrease by
50bps to 34.4% in the next three years.
The charges below the gross margin as % sales should remain close to their 2014 level. The inflation
rate assumed for the forecast of salaries stand at 3%.
Then, we estimate the financial result which corresponds to the non-capitalized portion of financial
expenses. (Please refer to the section titled Impact of capitalized interests on the calculation of
the (FCFF) where we explain the necessary adjustments when calculating the FCFF to take into
account the impact of financial expenses capitalized in inventories.
The cost of debt used in the calculation here above is higher than the actual cost of borrowing money.
However, it does incorporate the cost of not optimizing the use of cash.
Another key adjustment to the income statement is the suppression of the social solidarity tax in
conformity with the 2016E fiscal laws. The corporate tax applied to land plots and intermediate
housing is 15.5% as a result of the IPO.
Net Income Estimated vs. Net Income Guided
Source: CFG Research
All values in million of MAD 2015E 2016E 2017E
Consolidated Revenue 2,081 2,264 2,594
chg% 14.8% 8.8% 14.6%
All values in million of MAD 2015E 2016E 2017E
Consolidated Net Income CFG 457 520 613
Consolidated Net Income Guided 459 520 664
CFG vs. Guidance 99.5% 99.9% 92.4%

69 Morocco Real Estate Equity Primer, November 16, 2015
2/ Balance sheet assumptions summary:
Figure 80- Assumptions used in the forecast of the balance sheet in the 2015E-2017E period
Source: CFG Research
3/ Normalized Free Cash Flow For the Firm Modeling
a/ Given the trends suggested by the current operational indicators, we believe that the company will
be able to sustain a level of 8500 deliveries per annum beyond 2017E;
b/ We also assume a product mix mirroring the structure in 2017E which translates into an average
selling price that hovers around MAD 305k per unit;
c/ We assume that gross margin will stand at 33% (150Bps lower than the margin forecasted in the
2015E-2017E period). Operating expenses as a % of sales should stand at 9%;
d/ We also adjust the corporate tax rate on taxable products to 31% from 15.5% (IPO incentive).
Corporate tax will increase by 100bps in Morocco in 2016E;
e/ We maintain CAPEX and depreciation at their 2017E levels;
f/ We assume that WCR as a % of sales will hover around 212%;
g/ We finally estimate normalized financial capitalized expenses at MAD 104m.
Figure 81-Assumptions to calculate the normalized FCFF
Source: CFG Research Figure 82- Normalized FCFF used for the computation of the terminal value
Source: CFG Research
Assumption 2015E-2017E
Days Sales Outstanding (Accounts Receivable) 90 DAYS
Other receivable as a % of sales 47.5%
Days Payable Outstanding (Accounts Payable) 180 DAYS
Customer prepayments as a % of sales 46.0%
Other current liabilities as a % of sales 10.0%
Deliveries 8500
Average selling price (kMAD per unit) 305
Gross Margin as a % of sales 33%
Operating expenses as a % of sales 9%
Corporate Tax 31%
WCR as a % of sales 212%
Payout Ratio 85%
All values in million of MAD Normative FCFF
Gross Margin 857
-Other operating expenses 234
-Depreciation 17
+Capitalized financial expenses 104
=EBIT adjusted from capitalized financial expenses 710
- Corporate Tax on EBIT 79
=NOPAT 631
+Depreciation 17
-Capex 17
-Change in WCR (Including Land acquisition investments) 110
FCFF 521
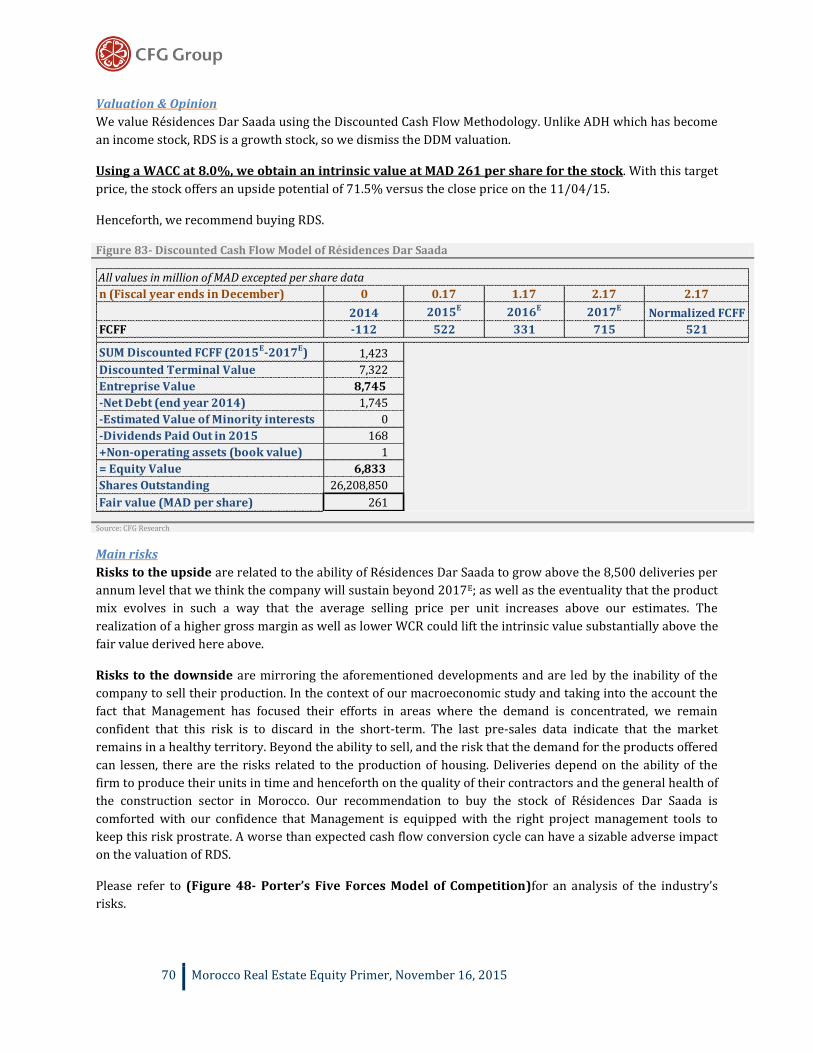
70 Morocco Real Estate Equity Primer, November 16, 2015
Valuation & Opinion
We value Résidences Dar Saada using the Discounted Cash Flow Methodology. Unlike ADH which has become
an income stock, RDS is a growth stock, so we dismiss the DDM valuation.
Using a WACC at 8.0%, we obtain an intrinsic value at MAD 261 per share for the stock. With this target
price, the stock offers an upside potential of 71.5% versus the close price on the 11/04/15.
Henceforth, we recommend buying RDS.
Figure 83- Discounted Cash Flow Model of Résidences Dar Saada
Source: CFG Research
Main risks
Risks to the upside are related to the ability of Résidences Dar Saada to grow above the 8,500 deliveries per
annum level that we think the company will sustain beyond 2017E; as well as the eventuality that the product
mix evolves in such a way that the average selling price per unit increases above our estimates. The
realization of a higher gross margin as well as lower WCR could lift the intrinsic value substantially above the
fair value derived here above.
Risks to the downside are mirroring the aforementioned developments and are led by the inability of the
company to sell their production. In the context of our macroeconomic study and taking into the account the
fact that Management has focused their efforts in areas where the demand is concentrated, we remain
confident that this risk is to discard in the short-term. The last pre-sales data indicate that the market
remains in a healthy territory. Beyond the ability to sell, and the risk that the demand for the products offered
can lessen, there are the risks related to the production of housing. Deliveries depend on the ability of the
firm to produce their units in time and henceforth on the quality of their contractors and the general health of
the construction sector in Morocco. Our recommendation to buy the stock of Résidences Dar Saada is
comforted with our confidence that Management is equipped with the right project management tools to
keep this risk prostrate. A worse than expected cash flow conversion cycle can have a sizable adverse impact
on the valuation of RDS.
Please refer to (Figure 48- Porter’s Five Forces Model of Competition)for an analysis of the industry’s
risks.
n (Fiscal year ends in December) 0 0.17 1.17 2.17 2.17
2014 2015E 2016E 2017ENormalized FCFF
FCFF -112 522 331 715 521
SUM Discounted FCFF (2015E-2017E) 1,423
Discounted Terminal Value 7,322
Entreprise Value 8,745
-Net Debt (end year 2014) 1,745
-Estimated Value of Minority interests 0
-Dividends Paid Out in 2015 168
+Non-operating assets (book value) 1
= Equity Value 6,833
Shares Outstanding 26,208,850
Fair value (MAD per share) 261
All values in million of MAD excepted per share data
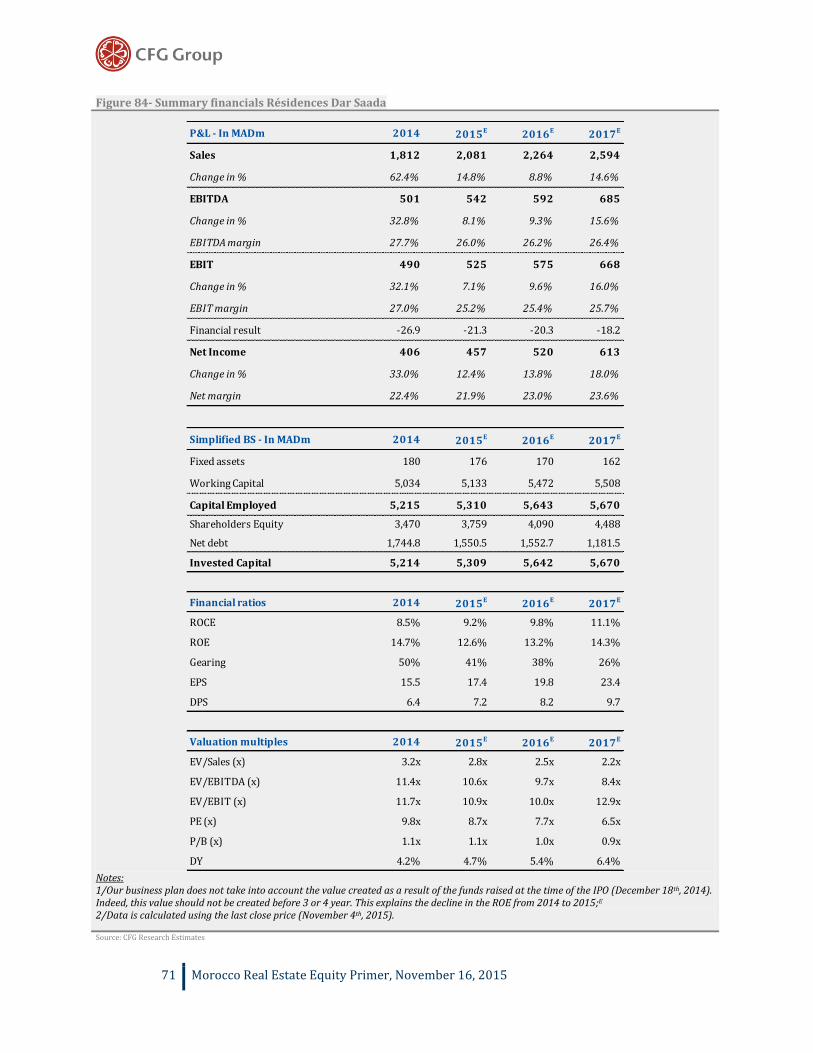
71 Morocco Real Estate Equity Primer, November 16, 2015
Figure 84- Summary financials Résidences Dar Saada
Notes: 1/Our business plan does not take into account the value created as a result of the funds raised at the time of the IPO (December 18th, 2014). Indeed, this value should not be created before 3 or 4 year. This explains the decline in the ROE from 2014 to 2015;E 2/Data is calculated using the last close price (November 4th, 2015).
Source: CFG Research Estimates
P&L - In MADm 2014 2015E 2016E 2017E
Sales 1,812 2,081 2,264 2,594
Change in % 62.4% 14.8% 8.8% 14.6%
EBITDA 501 542 592 685
Change in % 32.8% 8.1% 9.3% 15.6%
EBITDA margin 27.7% 26.0% 26.2% 26.4%
EBIT 490 525 575 668
Change in % 32.1% 7.1% 9.6% 16.0%
EBIT margin 27.0% 25.2% 25.4% 25.7%
Financial result -26.9 -21.3 -20.3 -18.2
Net Income 406 457 520 613
Change in % 33.0% 12.4% 13.8% 18.0%
Net margin 22.4% 21.9% 23.0% 23.6%
Simplified BS - In MADm 2014 2015E 2016E 2017E
Fixed assets 180 176 170 162
Working Capital 5,034 5,133 5,472 5,508
Capital Employed 5,215 5,310 5,643 5,670
Shareholders Equity 3,470 3,759 4,090 4,488
Net debt 1,744.8 1,550.5 1,552.7 1,181.5
Invested Capital 5,214 5,309 5,642 5,670
Financial ratios 2014 2015E 2016E 2017E
ROCE 8.5% 9.2% 9.8% 11.1%
ROE 14.7% 12.6% 13.2% 14.3%
Gearing 50% 41% 38% 26%
EPS 15.5 17.4 19.8 23.4
DPS 6.4 7.2 8.2 9.7
Valuation multiples 2014 2015E 2016E 2017E
EV/Sales (x) 3.2x 2.8x 2.5x 2.2x
EV/EBITDA (x) 11.4x 10.6x 9.7x 8.4x
EV/EBIT (x) 11.7x 10.9x 10.0x 12.9x
PE (x) 9.8x 8.7x 7.7x 6.5x
P/B (x) 1.1x 1.1x 1.0x 0.9x
DY 4.2% 4.7% 5.4% 6.4%

72 Morocco Real Estate Equity Primer, November 16, 2015
Part III: Elements of value creation and valuation in the industry Detailed analysis of the internal rate of return of a social housing project In this part, we walk you through the computation of a social housing project IRR. We analyze the impact of
various factors on the IRR to unveil the key drivers of profitability as well as the business challenges that can
adversely alter value creation.
Base scenario
Figure 85- Social Housing Project Assumptions
Source: CFG Research
The annualized project IRR using the aforementioned assumptions stands at 15.8%.
Then, we assume that the bank will finance 50% of the total development cost of the project minus the client
advances. The annualized equity IRR stands at 19.7%.
Production Assumptions
Land
Land developped surface (in m²) 30,000
Land cost (in MAD/m²) 1,000
Cost (in kMAD) 30,000
Strategic reserve land surface (in m²) 0
Land cost in (MAD/m²) 1,000
Cost (in kMAD) 0
Number of units developped
Number of units developped per hectare 200
Total number of units developped 600
Construction and development costs
Construction cost per unit (in kMAD) 115
Construction cost per unit (in kMAD including land cost) 165
Gross Margin 31%
% construction costs paid in advance 10%
Operating costs as a % of revenue 8%
Marketing Assumptions
Average sale price per unit (in kMAD) 240
% units pre-sold 50%
Average downpayment 20%
% units sold before the end of construction works 40%
% units sold after the end of construction works 7%
% units unsold 3%
Production and Marketing Schedule Assumptions
Number of months to obtain an autorisation to build 6
Number of months to reach pre-commercialization threshold 6
Number of months to finish construction works 18
Number of months to collect the cash 9
Number of months to sell units not sold before end of construction works 12
Corporate tax 0%
- The developer does not have a strategic
reserve (land acquired for a future
development);
- 3 hectares of land (acquired at MAD
1,000/m²) are developed to produce 600
units;
- Gross margin per unit is 31%;
- Operating costs as a % of revenue is 8%
(difference between EBITDA margin and
gross margin);
- The average sale price per unit is MAD
240k;
- 6 months are required to get the
authorization to build;
- An additional 6 months are needed to
pre-commercialize 50% of the units. The
average down payment is 20% of the sale
price;
- Construction works take 18 months to
be completed;
- 10% construction costs are paid in
advance;
- 9 months are needed to collect the cash
after the units are produced for all the
units pre-sold as well as the units sold
before construction is over. 9 months are
also needed to collect the cash for the
units sold after the end of construction
works;
-For all the units not sold before
construction has ended, it takes about 12
months to sell them;
-3% of the units developed are never
sold;
- Corporate tax for social housing is 0%.

73 Morocco Real Estate Equity Primer, November 16, 2015
Important notes
It is important to highlight that we take conservative assumptions for the financing of the project. Developers
can refinance partially or totally the cost of the land by debt as soon as they receive the building permits.
They also can privilege financing construction works by debt before starting to inject equity. In these cases, a
higher Equity IRR can be yielded.
The comparison of the equity IRR calculated (19.7%) as well of the project IRR calculated (15.8%) to the cost
of equity which hovers around 10% and a WACC around 8% for this industry in Morocco; demonstrate that
value can be significantly created in a social housing project in Morocco.
Indeed, the chosen assumptions regarding costs (land cost and construction cost), the sale price, margins as
well all of commercialization, construction and cash collection delays, correspond to the actual levels
observed in the industry.
It is important to note that albeit some attributes unique to this industry and that can hinder value creation
such as cash collection delays that can be very lengthy, and even if the down payments as a percentage of the
total price of housing can seem to be very low in comparison to the actual levels in other developing
countries, social housing developers in Morocco, who operate in an unbeatable fiscal framework, yield
very interesting margins thanks to the optimization of construction and land costs (as a result of
economies of scales), which translate into a considerable creation of value with or without the use of
leverage.
Sensitivity of the project IRR and the equity IRR to input variables
Figure 86- Sensitivity of the project IRR and the equity IRR to a change in gross margin
Source: CFG Research
As shown in the graph hereabove, both the project IRR and the equity IRR are linear increasing
functions of gross margin. If gross margin increases 1%, the project IRR increases by 0.93% and the
equity IRR increases by 1.25%.
13.1%14.3%
15.5%16.7%
17.9%19.2%
20.4%21.7%
23.0%24.3%
25.6%
11.0%11.9%
12.7%13.6%
14.5%15.4%
16.4%17.3%
18.3%19.3%
20.4%
y = 1.2475x - 0.1943R² = 0.999
y = 0.9335x - 0.1339R² = 0.999
26% 27% 28% 29% 30% 31% 32% 33% 34% 35% 36%
Equity IRR Project IRR Linear trend line (Equity IRR) Linear trend line (Project IRR)

74 Morocco Real Estate Equity Primer, November 16, 2015
Figure 87- Sensitivity of the project IRR and the equity IRR to the average months to collect the cash
Source: CFG Research
As shown in the graph hereabove, both the project IRR and the equity IRR are linear decreasing
functions of the average cash collection delay. If the average cash collection months increase by 1%,
the project IRR decreases by 0.0049% and the equity IRR decreases by 0.0063%.
Figure 88- Sensitivity of the project IRR and the equity IRR to the percentage of unsold units
Source: CFG Research
As shown in the graph hereabove, both the project IRR and the equity IRR are linear decreasing
functions of the percentage the units in the project that will never be sold. If the number of unsold
units increases by 1%, the project IRR decreases by 0.58% and the equity IRR decreases by 0.77%.
17.9%17.2%
15.8%15.2%
14.1%
12.8%11.6%
11.0%
22.2%21.3%
19.7%18.9%
17.5%
15.7%
14.2%13.3%
y = -0.0049x + 0.2042R² = 0.983
y = -0.0063x + 0.2555R² = 0.988
6 8 10 12 14 16 18 20
Project IRR Equity IRR Linéaire (Project IRR) Linear trend line (Project IRR) Linear trend line (Equity IRR)
12.2%12.8%
13.5%14.1%
14.7%15.2%
15.8%16.4%
16.9% 14.9%15.7%
16.5%17.3%
18.1%18.9%
19.7%20.4%
21.1%
y = -0.5854x + 0.1755R² = 0.9996
y = -0.7738x + 0.2194R² = 0.9992
1% 2% 3% 4% 5% 6% 7% 8% 9% 10%
Project IRR Equity IRR Linéaire (Project IRR) Linear trend line (Equity IRR)
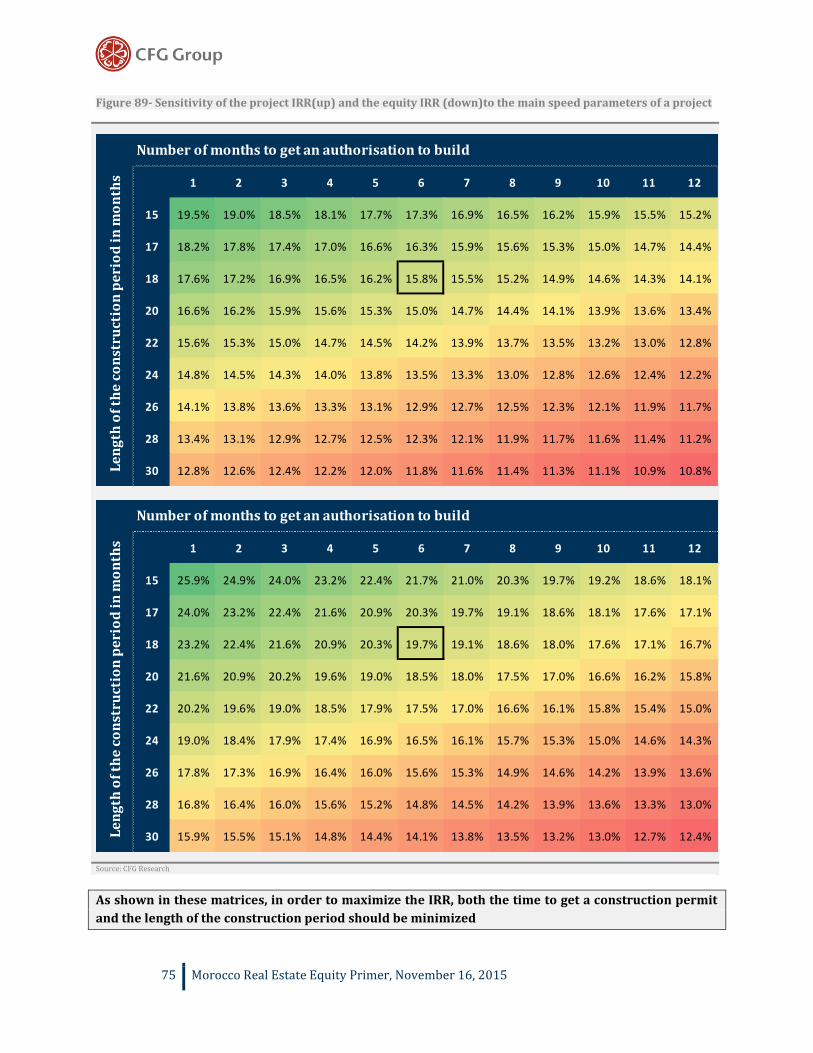
75 Morocco Real Estate Equity Primer, November 16, 2015
Figure 89- Sensitivity of the project IRR(up) and the equity IRR (down)to the main speed parameters of a project
Source: CFG Research
As shown in these matrices, in order to maximize the IRR, both the time to get a construction permit
and the length of the construction period should be minimized
1 2 3 4 5 6 7 8 9 10 11 12
15 19.5% 19.0% 18.5% 18.1% 17.7% 17.3% 16.9% 16.5% 16.2% 15.9% 15.5% 15.2%
17 18.2% 17.8% 17.4% 17.0% 16.6% 16.3% 15.9% 15.6% 15.3% 15.0% 14.7% 14.4%
18 17.6% 17.2% 16.9% 16.5% 16.2% 15.8% 15.5% 15.2% 14.9% 14.6% 14.3% 14.1%
20 16.6% 16.2% 15.9% 15.6% 15.3% 15.0% 14.7% 14.4% 14.1% 13.9% 13.6% 13.4%
22 15.6% 15.3% 15.0% 14.7% 14.5% 14.2% 13.9% 13.7% 13.5% 13.2% 13.0% 12.8%
24 14.8% 14.5% 14.3% 14.0% 13.8% 13.5% 13.3% 13.0% 12.8% 12.6% 12.4% 12.2%
26 14.1% 13.8% 13.6% 13.3% 13.1% 12.9% 12.7% 12.5% 12.3% 12.1% 11.9% 11.7%
28 13.4% 13.1% 12.9% 12.7% 12.5% 12.3% 12.1% 11.9% 11.7% 11.6% 11.4% 11.2%
30 12.8% 12.6% 12.4% 12.2% 12.0% 11.8% 11.6% 11.4% 11.3% 11.1% 10.9% 10.8%
Number of months to get an authorisation to build
Le
ng
th o
f th
e c
on
stru
ctio
n p
eri
od
in
mo
nth
s
1 2 3 4 5 6 7 8 9 10 11 12
15 25.9% 24.9% 24.0% 23.2% 22.4% 21.7% 21.0% 20.3% 19.7% 19.2% 18.6% 18.1%
17 24.0% 23.2% 22.4% 21.6% 20.9% 20.3% 19.7% 19.1% 18.6% 18.1% 17.6% 17.1%
18 23.2% 22.4% 21.6% 20.9% 20.3% 19.7% 19.1% 18.6% 18.0% 17.6% 17.1% 16.7%
20 21.6% 20.9% 20.2% 19.6% 19.0% 18.5% 18.0% 17.5% 17.0% 16.6% 16.2% 15.8%
22 20.2% 19.6% 19.0% 18.5% 17.9% 17.5% 17.0% 16.6% 16.1% 15.8% 15.4% 15.0%
24 19.0% 18.4% 17.9% 17.4% 16.9% 16.5% 16.1% 15.7% 15.3% 15.0% 14.6% 14.3%
26 17.8% 17.3% 16.9% 16.4% 16.0% 15.6% 15.3% 14.9% 14.6% 14.2% 13.9% 13.6%
28 16.8% 16.4% 16.0% 15.6% 15.2% 14.8% 14.5% 14.2% 13.9% 13.6% 13.3% 13.0%
30 15.9% 15.5% 15.1% 14.8% 14.4% 14.1% 13.8% 13.5% 13.2% 13.0% 12.7% 12.4%
Number of months to get an authorisation to build
Le
ng
th o
f th
e c
on
stru
ctio
n p
eri
od
in
mo
nth
s
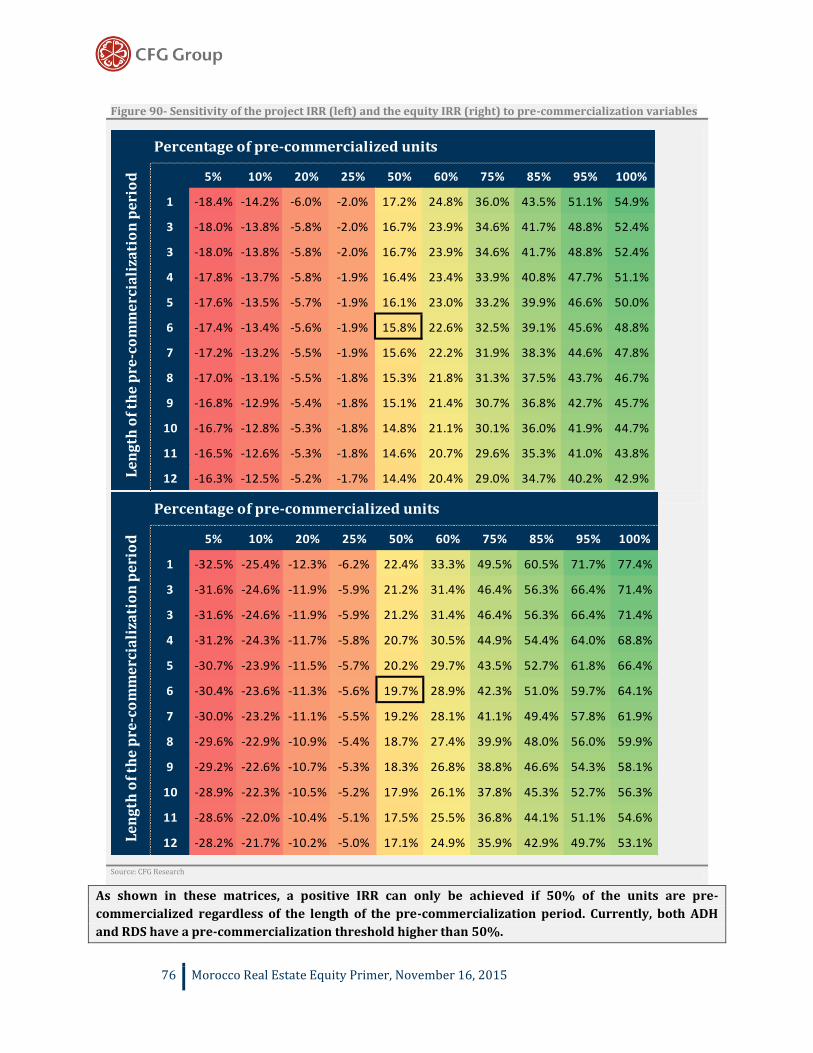
76 Morocco Real Estate Equity Primer, November 16, 2015
As shown in these matrices, a positive IRR can only be achieved if 50% of the units are pre-
commercialized regardless of the length of the pre-commercialization period. Currently, both ADH
and RDS have a pre-commercialization threshold higher than 50%.
Figure 90- Sensitivity of the project IRR (left) and the equity IRR (right) to pre-commercialization variables
Source: CFG Research
5% 10% 20% 25% 50% 60% 75% 85% 95% 100%
1 -18.4% -14.2% -6.0% -2.0% 17.2% 24.8% 36.0% 43.5% 51.1% 54.9%
3 -18.0% -13.8% -5.8% -2.0% 16.7% 23.9% 34.6% 41.7% 48.8% 52.4%
3 -18.0% -13.8% -5.8% -2.0% 16.7% 23.9% 34.6% 41.7% 48.8% 52.4%
4 -17.8% -13.7% -5.8% -1.9% 16.4% 23.4% 33.9% 40.8% 47.7% 51.1%
5 -17.6% -13.5% -5.7% -1.9% 16.1% 23.0% 33.2% 39.9% 46.6% 50.0%
6 -17.4% -13.4% -5.6% -1.9% 15.8% 22.6% 32.5% 39.1% 45.6% 48.8%
7 -17.2% -13.2% -5.5% -1.9% 15.6% 22.2% 31.9% 38.3% 44.6% 47.8%
8 -17.0% -13.1% -5.5% -1.8% 15.3% 21.8% 31.3% 37.5% 43.7% 46.7%
9 -16.8% -12.9% -5.4% -1.8% 15.1% 21.4% 30.7% 36.8% 42.7% 45.7%
10 -16.7% -12.8% -5.3% -1.8% 14.8% 21.1% 30.1% 36.0% 41.9% 44.7%
11 -16.5% -12.6% -5.3% -1.8% 14.6% 20.7% 29.6% 35.3% 41.0% 43.8%
12 -16.3% -12.5% -5.2% -1.7% 14.4% 20.4% 29.0% 34.7% 40.2% 42.9%
Percentage of pre-commercialized units L
en
gth
of
the
pre
-co
mm
erc
iali
zati
on
pe
rio
d
5% 10% 20% 25% 50% 60% 75% 85% 95% 100%
1 -32.5% -25.4% -12.3% -6.2% 22.4% 33.3% 49.5% 60.5% 71.7% 77.4%
3 -31.6% -24.6% -11.9% -5.9% 21.2% 31.4% 46.4% 56.3% 66.4% 71.4%
3 -31.6% -24.6% -11.9% -5.9% 21.2% 31.4% 46.4% 56.3% 66.4% 71.4%
4 -31.2% -24.3% -11.7% -5.8% 20.7% 30.5% 44.9% 54.4% 64.0% 68.8%
5 -30.7% -23.9% -11.5% -5.7% 20.2% 29.7% 43.5% 52.7% 61.8% 66.4%
6 -30.4% -23.6% -11.3% -5.6% 19.7% 28.9% 42.3% 51.0% 59.7% 64.1%
7 -30.0% -23.2% -11.1% -5.5% 19.2% 28.1% 41.1% 49.4% 57.8% 61.9%
8 -29.6% -22.9% -10.9% -5.4% 18.7% 27.4% 39.9% 48.0% 56.0% 59.9%
9 -29.2% -22.6% -10.7% -5.3% 18.3% 26.8% 38.8% 46.6% 54.3% 58.1%
10 -28.9% -22.3% -10.5% -5.2% 17.9% 26.1% 37.8% 45.3% 52.7% 56.3%
11 -28.6% -22.0% -10.4% -5.1% 17.5% 25.5% 36.8% 44.1% 51.1% 54.6%
12 -28.2% -21.7% -10.2% -5.0% 17.1% 24.9% 35.9% 42.9% 49.7% 53.1%
Percentage of pre-commercialized units
Le
ng
th o
f th
e p
re-c
om
me
rcia
liza
tio
n p
eri
od

77 Morocco Real Estate Equity Primer, November 16, 2015
Figure 91- Sensitivity of the equity IRR to the percentage of total costs financed by debt and interest rates
Source: CFG Research
As shown in the matrix hereabove, leverage boosts significantly the equity IRR especially when
combined with low interest rates. For the average market interest rate of 6.0%, if only 10% of the
project is financed by debt, the IRR delivered is 3.3% lower than in our base case where the bank
finances 50% of the total costs of the project (land costs and construction costs).
Note on the sensitivity analyses performed hereabove
If this study shows that value creation is based on the ability of the developer to 1/ manage their
projects effectively via a tight control of the administrative, production and commercialization delays;
and to 2/identify and develop healthy projects that fit an existing demand, it reveals the existence of a
myriad of entry barriers to this business.
Indeed, the sui generis know how that developers possess to navigate the stormy seas of Daedalean
administrative processes as well as their ability to sustain a high margin creation as a result of
economies of scale are paramount to value creation and perpetuate their activity.
10% 20% 30% 40% 50% 60% 70% 80% 90%
16.8% 17.9% 19.2% 20.7% 22.3% 24.3% 26.5% 29.1% 32.1%
3.0% 16.6% 17.5% 18.5% 19.7% 21.0% 22.5% 24.3% 26.4% 28.9%
3.5% 16.6% 17.4% 18.4% 19.5% 20.8% 22.2% 24.0% 26.0% 28.3%
4.0% 16.5% 17.4% 18.3% 19.3% 20.6% 22.0% 23.6% 25.5% 27.8%
4.5% 16.5% 17.3% 18.2% 19.2% 20.3% 21.7% 23.2% 25.1% 27.2%
5.0% 16.5% 17.2% 18.1% 19.0% 20.1% 21.4% 22.9% 24.6% 26.7%
5.5% 16.4% 17.1% 17.9% 18.8% 19.9% 21.1% 22.5% 24.2% 26.1%
6.0% 16.4% 17.1% 17.8% 18.7% 19.7% 20.8% 22.1% 23.7% 25.6%
6.5% 16.4% 17.0% 17.7% 18.5% 19.4% 20.5% 21.8% 23.2% 25.0%
7.0% 16.3% 16.9% 17.6% 18.3% 19.2% 20.2% 21.4% 22.8% 24.5%
7.5% 16.3% 16.9% 17.5% 18.2% 19.0% 19.9% 21.0% 22.3% 23.9%
8.0% 16.3% 16.8% 17.4% 18.0% 18.8% 19.6% 20.7% 21.9% 23.3%
Percentage of project costs financed by debt
Inte
rest
ra
tes

78 Morocco Real Estate Equity Primer, November 16, 2015
Figure 92- Sensitivity of the project IRR and the equity IRR to the size of the strategic reserve land as a % of the total land bank
Source: CFG Research
We assume for the theoretical purpose of this exercise that the strategic reserve is acquired at the same price
than the land developed to produce social housing. The excessive accumulation of land reserve acquired to be
developed in the medium-term can destroy value in the short-term. We emphasize that this adverse effect
happens in the short-term. Indeed, land acquired for the strategic reserve by big developers is usually
bought at a low price which once developed help yield very high margins which can counterbalance at least
partially the unfavorable impact of the cost of time on the IRR.
The erosion of value creation as a result of the accumulation of land reserve can explain (should we
bypass the theoretical limits of our model) the differences between the IRRs that we compute and
realized by ADH and RDS with the ROCE and ROE delivered by the developers. When compared to the
cost of funds, ADH’s ROCE and ROE seem correct regarding its current low growth high yield
investment. These ratios are higher for RDS which is currently in a very high growth cycle.
Note on the relative valuation of Addoha and Résidences Dar Saada:
We voluntarily discard including international comparable peers of Addoha and Résidences Dar Saada in this
report. Indeed, the social housing business is unique and is hardly comparable to other real estate businesses.
The sui generis nature of fiscal and regulatory frameworks ruling the social housing in Morocco, is per se
annihilating the eventuality of comparing ADH and RDS to companies outside of their industry. One could
attempt to compare ADH and RDS to UAE’s Emaar but it would be akin to comparing LVMH to H&M. (For
joke’s sake)
Finally, it is currently vain to compare ADH and RDS to ADI which is not currently engaged in the real estate
development business but rather in restructuring and turnaround management.
Should we perform a relative valuation of these two stocks albeit the aforementioned elements, it would be
only very favorable since ADH and RDS trade at sunken valuation levels.
15.82%14.65%
13.38%12.06%
10.66%9.16%
7.59%
19.66%
17.94%
16.10%
14.21%
12.24%
10.18%
8.05%
0% 5% 10% 15% 20% 25% 30%
Project IRR Equity IRR

79 Morocco Real Estate Equity Primer, November 16, 2015
Impact of capitalized interests on the calculation of the (FCFF) Definition of Free Cash Flow to the Firm (FCFF)
The FCFF is the net amount of cash generated for the firms before the payment to debt holders and
shareholders. Henceforth, the FCFF should exclude any cash flow with creditors and shareholders.
Importance of an accurate calculation of the 'Free Cash Flow for the Firm
The FCFF is used to calculate the Enterprise Value from which is subtracted the Net Debt to derive the Equity
Value. If in the calculation of the FCFF, interest payments are already subtracted, then, the calculation of the
Equity Value would have not only deducted the net debt but also the present value of these interest expenses.
Relevance in the case of ADH and RDS
This remark is very relevant in the case of real estate developers since the operating result is already
impacted by interest expenses and is henceforth not an actual EBIT. Indeed, we find three types of financial
expenses in the Income Statements of these companies:
A/ Non-capitalized financial expenses shown in the P&L in Financial Result;
B/ Financial expenses capitalized in assets and more precisely in inventories. Since the financial expenses line
in the income statement includes the total cost of debt, these expenses are cancelled out via an expenses
transfer;
C/Financial expenses capitalized during previous fiscal periods and then removed as a result of delivering the
projects to which they are associated. These financial expenses directly impact the operational result.
Illustrative example
In a fiscal year n, the cost of financial debt is 150 broken down into 120 (A) capitalized (associated to projects
to be delivered in future fiscal periods), and 30 (B) shown in the income statement. In this fiscal year n, the
developer delivers a couple of projects and henceforth removes previously capitalized interest expenses for a
total of 100 (C).
Figure 93- Impact of capitalized interests on the calculation of FCFF
Source: CFG Research
Conclusions
1/ When the FCFF is not adjusted, it can be negatively impacted by the financial expenses newly
capitalized in inventories;
2/ The FCFF should be adjusted by adding back the newly capitalized financial expenses in
inventories and the effective corporate tax should be calculated using the adjusted operating result
(increased by adding back previously capitalized financial expenses being removed from
inventories).
Income statement item Impact of interest expenses Comment
Revenue 0 No impact
Operating result -100 Removal of previously capitalized financial expenes
Financial expenses -150 Financial expenses include the total cost of debt
Financial income +120 Expense transfer to cancel the impact from capitalized financial expenses
Net income -130 Sum of removed previously capitalized expenses and non-capitalized financial expenses
FCFF Impact of interest expenses Comment
+Operating result -100 Removal of previously capitalized financial expenes
-Effective corporate tax 0 We assume that corporate tax is null for a simplification purposes
+Depreciation & Amortization 0 No impact
-CAPEX 0 No impact
+100 Financial expenses previously capitalized in inventories are removed and henceforth reduce inventories
-120 Financial expenses newly capitalized in inventories increase inventories
=FCFF -120 When the FCFF is not adjusted, the total negative impact on the FCFF is -120
Impact on the Income Statement
Impact on a FCFF calculated without adjustments
-Change in WCR

80 Morocco Real Estate Equity Primer, November 16, 2015
Appendix 1 –Literature Review
This part is a literature review of studies that aimed at estimating the demand for housing for the poor in
Morocco as well as evaluating the frameworks surrounding the supply and the demand of this type of housing. It
is a compilation of key ideas of the studies that we use directly or indirectly in our paper.
Ministry’s forecasts of demand by 2020E |Ministry of Housing –2011
The study underlines the importance of having a good understanding of the evolution of households in terms
of number, size, income, employment and mobility in order to determine the evolution of the demand for
housing. The evolution of the aforementioned parameters, impacts the consumption of housing. Household’s
mobility is specifically a critical factor. Housing should be supplied in the regions where households are
foreseen to accumulate.
As households become more mature, i.e. willing and able to acquire housing, supply of housing in the sale
market should increase. Prior to that, households will be looking to the rental market, and a step ahead there
will be strictly looking for subsidized housing. Real estate players should not only be aware of the number of
households but also of where they stand in the “maturity” trajectory. Households should be able to navigate
this path provided there is a favorable macroeconomic context.
The study uses the 2020E projection of the number of urban households which should stand at 5,500,000
households with an average size of 3.9 people per household. They also use the results of the 2007 HCP
study7 on the economic status of households. This study shows that 34% of the population belongs to the
lower social class, 53% to the medium class and 13% to the upper social class.
The study explores two potential scenarios of the evolution of the social classes by 2020E in Morocco.
1/A scenario where households’ incomes increase modestly and where the weight of the middle class
decreases;
2/A scenario where households’ incomes increase substantially and where a rising middle class strengthens.
These two scenarios give the following floors and ceilings for the number of cumulated households in each
social category by 2020E.
Figure 94 -Cumulated new households in 2020E (2009) Figure 95- Weights of the social classes for each scenario
Source: Ministry of Housing, Urbanism and Policy of the City
Source: Ministry of Housing, Urbanism and Policy of the City
The number from this study would suggest that between 2009 and 2020, 1,455,000 urban households should
be added. Between 2009 and 2014, 638,000 households have actually been added. Thus and in line with HCP
projections, 817,000 urban households should be added between 2014 and 2020E.
7 http://www.hcp.ma/downloads/Niveau-de-vie-et-pauvrete-Enquete-nationale-sur-les-niveaux-de-vie-des-menages_t13111.html
Lower bound Upper bound
Lower class 469,722 503,733
Middle class 751,655 812,717
Upper class 172,561 199,602
Scenario AWeights A Scenario B Weights B
Lower class 469,722 32% 503,733 35%
Middle class 812,717 56% 751,655 52%
Upper class 172,561 12% 199,602 14%

81 Morocco Real Estate Equity Primer, November 16, 2015
We take the average weights of the two scenarios. We assume that new households between 2014 and 2020E
will flow in the three social categories in the same fashion than between 2009 and 2020E.
That is to say, 33% of the cumulated new households between 2014 and 2020E (837,000 urban households)
would be lower class households, 54% would be middle class households and 14% would belong to the upper
class. These weights translate in the following tally of households in the period 2014-2020E: 279,995
new households belonging to the lower class, 449,960 households belonging to the middle class and
107,045 households belonging to the upper class.
We can conservatively think about the middle class as a social class who can afford to acquire social housing.
Since, in average, 54% of the households in the period 2014-2020E belongs to this social class, we can
conservatively apply this percentage to the equation:
Thanks to housing finance mechanisms that help supply housing to the poor, a portion of the lower class will
also afford social housing and henceforth:
Note on the Middle Class:
In the absence of substantial supply of intermediate housing, middle class households will acquire social
housing. The lowest sub-class of the middle class does represents a pool of households that will acquire social
housing. In general terms, it is quite difficult to match social classes with categories of social housing. While it
is hard to believe that middle class households could afford high-end housing, and that the lowest class could
afford intermediate housing, nothing prevents demand from arising in the opposite direction which opens the
discussion about acquisition of social housing for speculation purposes. Speculation as well as other
purposes not standing very low in Maslow’s pyramid, add another overlay of demand for social
housing.
Economic Evaluation of Housing Subsidy Systems: A Methodology with Application to Morocco| World
Bank – February 2005
Theoretical ideas
Note on Consumption versus saving: “By lowering the price of housing today, a housing subsidy may alter
the arbitrage between present and future consumption. However, housing prices may also decrease in
future”. This idea is central when thinking about the time dimension when we estimate demand for housing.
Indeed, in the case of social housing, housing prices are perceived as low for acquirers who are not
necessarily afraid that these prices can substantially decrease in the future. As a result, if acquisition is
possible today, everything else held equal, it will happen today rather than tomorrow.
Note on the Composition of the household’s portfolio: “Tax treatment, government investment in housing
or direct subsidies to homeownership may cause households to invest more in housing, relative to other
types of investment, than would otherwise be the case”. This is also a cardinal idea to the estimation of
demand for housing. Indeed, we believe that once a household can afford a mortgage payment, they will
acquire housing no matter how much they used to spend for housing before. A household can restructure

82 Morocco Real Estate Equity Primer, November 16, 2015
their expenses should they see in a housing acquisition a significant opportunity to save money while
becoming the owner of a home.
Impact of taxation on the loss of welfare for producers and consumers:.
Figure 96- Harberger’s triangle – Deadweight loss of welfare for producers and consumers
Source: Economic Evaluation of Housing Subsidy Systems: A Methodology with Application to Morocco¬| World Bank – February 2005
Elements of information on housing in Morocco
Housing Supply & Demand: “Demand for new housing units is estimated at about 120,000 units per year
and is expected to continue growing in future due to the demographic composition of the population, whereas
annual supply of formal housing units is estimated around 90,000 units”. The housing stock was broken down
into formal housing accounting for 80% of the total stock, and informal housing accounting for the rest of the
stock. Informal housing is itself broken down into slums (5% of the total stock) and housing in violation of the
town planning code (15% of the total stock).
Harberger's triangle refers to the
deadweight loss occurring in the
trade of a good or service due to
government intervention
“When taxes are low and only
second-order changes can be
considered, the loss of welfare grows
as the square of the tax rate
increases”.

83 Morocco Real Estate Equity Primer, November 16, 2015
Figure 97 - Borrowing Capacity and Maximum Dwelling Value (1995)
Source: Evaluation of Housing Subsidy Systems: A Methodology with Application to Morocco¬| World Bank – February 2005
It is clear that new construction in urban centers was totally inaccessible to those within the lower half of the
income distribution. As a result, more than 50 % of new construction was self-construction.
Academic study of demand for housing by 2020E|CIHEAM –2003
The study estimates the production needed per annum to eliminate the housing deficit under three scenarios:
1/ A scenario where the housing deficit is eliminated by 2010;
2/ A scenario where the housing deficit is eliminated by 2015E;
3/ A scenario where the housing deficit is eliminated by 2020E.
We focus on the third scenario findings. Although the study assumes a particular rhythm of deficit reduction,
we highlight the implied demand between 2014 and 2020E and invite the reader to observe the structural
undersupply in the market as well as to take note of the regional discrepancies, two phenomena that we
emphasize in our own study.

84 Morocco Real Estate Equity Primer, November 16, 2015
Figure 98 – Production per annum needed to eliminate the housing deficit
Source: Academic study of demand for housing by 2020E|CIHEAM –2003
“Affordable Housing Finance in Morocco” presented in the 5th Global Housing Finance Conference |2002
Notes from the presentation:
Demand incentives:
Tax incentives for main residence :
Deduction of interest payments of mortgage loans
VAT exemption on social houses for purchasers occupying the acquired home as their main residence for
a period of at least four years;
Before 2005: demand subsidies essentially based on Interest buydown (IBD) system (interest subsidies):
Main aim: to lessen the cost of financing;
A system that showed its limits:
Targeting : mainly medium income wage-earners benefits;
Weak marginal impact
Macroeconomic stability permits a large decline in interest rates

85 Morocco Real Estate Equity Primer, November 16, 2015
Solution: move to more targeted system focusing on irregular and low-income households
In the end of 2004: Implementation of Fogarim a mortgage insurance fund targeting :
Informal income: precondition not have formal revenues (wages);
Low income: social houses and monthly payment less than 1500 DH ~$176;
Not a homeowner;
Practice an activity that generates income
The presentation also tackled the issue of loan defaults for Fogarim guaranteed mortgages. When we exclude
the population belonging to the cities without slums programs, the default rates seem correct.
Figure 99 - Fogarim Default (6’years generation of loans)
Source: “Affordable Housing Finance in Morocco” presented in the 5th Global Housing Finance Conference |2002
Best practices in slum improvement – The case of Casablanca |Development Innovations Group –
Undated
The report draws important conclusions in the “Summary of Potential Lessons Learned” section: Indeed, the
report suggests that “there is a market for the private sector at the bottom of the pyramid”. Financial
business models that are properly designed to meet a specific demand can be effective in mobilizing
private sector involvement in slum upgrading at scale”. This idea is cardinal in our report although we do
not particularly focus on the slum population. We highlight the following mechanisms reported in the paper:
1/ Retail Platforms or one-stop-shops located in slum neighborhoods;
2/ Public-private partnerships between parastatal housing societies and private developers;
3/ Partial credit guarantee programs are necessary;
“Not all slum dwellers have the employment/income stability necessary to become homeowners.
Mechanisms such as savings-to-homeownership and a rejuvenation of the rental market are
necessary to provide a transparent and fair basis equitable solutions tailored to the diverse means of
slum households”. The rejuvenation of the rental market happening in the social housing industry as
a result of the 2012 amendment is very relevant.
Morocco Housing Market| OPIC –2006
“If Morocco follows the path to market liberalization, the long run housing stock should become more elastic
allowing increased demand to be met by increased supply rather than exorbitant price increases”. This
concept also illustrated below suggests a theoretical antecedent to the undersupply in the Moroccan housing
market. The price increase mentioned was indeed a mechanism by which the 2010 fiscal reform was forcing
supply to meet an increased demand.

86 Morocco Real Estate Equity Primer, November 16, 2015
Figure 100 – The Supply side effect of Moroccan Government Housing Policies
Source: Morocco Housing Market| OPIC –2006
The following table shows that the problem of housing affordability in Morocco was very prevalent in
comparison with other comparable countries.
Figure 101 – Housing Indicators Comparison, MENA and select countries
Source: Morocco Housing Market| OPIC –2006
87 Morocco Real Estate Equity Primer, November 16, 2015
Appendix 2 – FAQs
SECTOR
Key elements of the fiscal framework
The Moroccan government has put in place numerous incentives in order to spur the production of social
housing in Morocco. In 2010, the “Loi de Finances” provided a favorable fiscal environment for both the
developers and the acquirers of social housing.
Today, a social housing unit has a variable price that cannot exceed MAD 250k for a total surface hovering
between 50m² and 80m².
The government waves the VAT for the acquirer provided this latter does not own a house prior to this
acquisition and commits to use the unit acquired as a primary residence for at least 4 years.
The government waives taxes for developers as well as many administrative costs provided they have an
agreement with government to build at least 500 social housing units in a period less than 5 years.
The same fiscal framework is applicable to low real estate value housing. This type of housing can be sold at a
price that does not exceed MAD 140k for a total surface hovering between 50m² and 60m².
The aforementioned benefits are applicable up until December 31st 2020 for developers who produce low
value real estate housing and up until December 31st 2019 for developers who do not have this type of
housing. This means that a social housing developer has the possibility to sign 5 years conventions until
December 31st 2019, and that he can consequently potentially benefit from this favorable fiscal framework
until the end of 2024.
More recently, in the 2015 budget bill, Government has proposed some new measures that could have a positive impact on the social housing segment:
- Enlarge the possibility to buy a social housing unit to foreign residents in Morocco (this population is estimated at more than 100.000 people) ;
- Boost the rental market in the social housing segment by allowing buyers of a minimum of 25 units
to rent them as a principal residential use for a minimum of 8 years, and benefit from a corporate tax
exemption over the same period, provided that the monthly rent do not exceed MAD 2,000 vs. MAD
1,200 previously.
How many social housing units were produced by the top developers (e.g. RDS, Addoha and Alliances)
during 2012 and then 2014? By taking out these numbers from the total production of social housing
units, can we make a reasonable estimate on the social housing production from opportunistic
developers?
After the fiscal reform of 2010, which intended to boost the production of social housing and reduce the
structural housing deficit, production of social housing started to soar and included one-time developers who
saw into the reform an opportunity to yield interesting margins. This situation did not last for many reasons:
First, it is a business with high entry barriers such as the administrative burdens inherent to social housing.
Second, only projects launched in areas where demand is located can actually succeed, and only experienced
developers could get access to land in strategic areas etc.
Addoha produced an average of 25,000 units per annum from 2012 to 2014.
RDS produced 6,750 units in 2012, 9,200 units in 2013 and 6,680 units in 2014.
Alliances produced an average of 12,500 units per annum from 2012 to 2014.
All of Addoha, RDS and Alliances have not decreased their production between 2012 and 2014 which would
indeed show that the decrease in units produced is coming from the other developers:

88 Morocco Real Estate Equity Primer, November 16, 2015
The government real estate development arm “Al Omrane” did not decrease their production between 2012
and 2014 as well.
The remaining production is broken down between “mom and pop” investors, small developers, and
relatively medium-sized developers such as Chaabi Lil Iskane, Dyar Al Mansour, Groupe Jamai, Groupe
Chaimaa and Jet Sakane.
So, not only do we have mom and pop investors who shied away from the business but also smaller
developers who had no choice but to reduce their production because they probably did not have neither the
expertise nor the financial capabilities to acquire lands in the areas where the demand is located and
henceforth sustain their business beyond the initial “euphoria” period that followed the 2010 fiscal law.
Can you run through the economics for a single low income housing unit – how much does the land
cost, what is the building cost, what is the selling price, tax incentives etc.?
Please refer to Part III – Detailed analysis of a social housing project IRR
Can you give me more info on tax refund delays? What happened? How is this being resolved?
When an acquirer buys a social housing unit, they do not pay the VAT provided that the acquirer is a first time
buyer and that he uses the social housing unit a principal residence for at least 4 years. Instead the VAT is
paid by the Government to the notary, who then have the total amount (the amount excluding VAT paid by
the buyer and the VAT subsidy paid the Government) to complete the transaction, thus enabling the
developer to complete the physical delivery of the unit and collect the cash.
Amid a highly growing industry in 2011 to 2013, the delays were getting bigger due to a soaring number of
cases requiring treatment by public authorities, and due probably also to the fact that the Government was
trying to optimize the management of its cash positions in a context of deteriorating public finances.
According to management, these delays are now improving with the number of cases requiring treatment by
public authorities diminishing and in a context of improved public finances.
Can you please explain the flow/accounting between pre-sales, receivables, inventory and then revenue for the
business?
First, land is acquired and accounted for in Inventory in the Balance Sheet.
Then, pre-sales (20% of revenue) are accounted for in Client Advances in the Balance Sheet.
When the production starts, units in production are accounted for in Inventory of non-finished products in
the Balance Sheet.
Finished products are accounted for in Inventory of finished products in the Balance Sheet.
When the revenue is recognized (when the company has the certainty that it will be able to complete the
transaction after the completion of construction works and when the permit to inhabit is granted), the margin
achieved by the developer (total revenue minus related development costs which are removed from the
company’s inventory) increases its equity.
However, the remaining 80% to be collected by the developer remains in clients’ accounts receivables until
the whole delivery process is completed.

89 Morocco Real Estate Equity Primer, November 16, 2015
Figure 102- Accounting flow between pre-sales, receivables, inventory and revenue
Source: CFG Research
What are the reasons behind the delays in cash collection at delivery?
1/ Complex and numerous administrative processes;
2/ Delays for banks to free up the funds;
3/ Delays related to the VAT refund received by the notary from the government.
Why is the effective corporate tax different from zero for Addoha and RDS?
Only social housing is corporate tax exempt.
Since the developers are also engaged in other types of housing products (intermediate housing and land
plots for ADH and RDS + high-end housing for ADH), the portion of non-social housing projects that they
develop are subject to the normal corporate tax rate which is currently at 30%. Furthermore, RDS benefits
following its IPO in December 2014, from a 50% corporate tax reduction for a period of 3 years, i.e. from 2015
to 2017.
Are the land bank and others inventories shown on the financial statements revalued at their market prices ?
Land bank and others inventories aren’t measured at their market prices but rather are at their cost, both
under Moroccan GAAP and IFRS standards.
More exactly, IAS 2 states that inventories are measured at the lower of cost (using the weighted average
method) and net realizable value.
Land bank is valued at acquisition cost including the purchase price of land, expenses incidental to this
purchase, expenditures on studies as well as servicing construction works.
Inventory of under construction units is valued at the lower of weighted average cost and net realizable value.
Inventory of finished units is valued using total land and equipment costs as well as any remaining charges
(accrued liabilities).
What is “Autres Produits de l’activité” under chiffre d’affaires in ADH or RDS income statement?
“Autres Produits de l’activité” mainly refers to the change in inventory. Please refer to the illustrative
example below.
Explain the change in inventory in the Income Statement
Illustrative example:
1/In this example, we produce two housing units in the fiscal year n. The production cost per unit is 100, i.e. a
total production cost of 200 in the fiscal year n;
2/ In year n, one housing unit is sold and delivered. The revenue per unit is 120;
3/ In year n+1, the second housing unit is sold and delivered. The revenue per unit is also 120.
Revenue recognition
• Accounts receivable increase
Physical Delivery & Cash collection
• Inventory of non-finished and then finished products increase
Production
• Client Advances increase
Pre-sales
• Inventory (land bank) increases
Land acquisition

90 Morocco Real Estate Equity Primer, November 16, 2015
Figure 103- Illustrative example – Variation of inventory in the income statement
Source: CFG Research
ADDOHA
What do fixed assets represent in the case of Addoha?
Fixed assets include mainly headquarters and show rooms.
What is the breakdown of Addoha’s inventory?
As of December 31 2014, the value of Addoha’s inventories stood at MAD 18,358,882k. This number is broken
down as follows:
Land bank: MAD 3,249,839k (This includes only the land bank that Addoha hasn’t started developing)
Consumable materials and supplies: MAD 1,219k
Non-finished products: MAD 9,252,127k (Including the land bank related to these products)
Finished products: MAD 5,855,697k (Including the land bank related to these products)
So, the inventory of finished products stood at MAD 6b in 2014.
Unsold finished products at the end of December 2014 stood at about 20,395 units.
This translates into a cost per unit of MAD 287k per unit which would make sense because this number
includes social housing but also intermediate housing and high-end housing.
Also, MAD 5,855,697k divided by 2014 revenue i.e. 7,036m *365=303 DSI
How many units can Addoha produce given their current land bank? What is the cost of the land bank? If they did
not buy any additional land, how many units could they produce?
The land bank is 5,000ha valued at MAD 10b.
About 50% of this total land bank is dedicated to high-end projects in which the Group intends to develop a
total of approximately 30,000 units.
900ha is a strategic reserve.
We are left with about 1,600ha dedicated to social housing, intermediate housing and land plots.
Taking into account an average ratio of 170 units per hectare, we can conclude that the social housing land
bank of Addoha is equivalent to 170,000 units i.e. at least 10 years of production based on an average annual
production of 17,000 units.
It is very important to keep in mind that they have targeted in their new strategic plan to continue buying
land but only in the Casablanca and Rabat region where the demand is very high and where they need to
renew frequently their land bank.
n n+1
Revenue 120 120
Variation of inventory 100 -100
Costs (of goods produced) 200 0
20 20

91 Morocco Real Estate Equity Primer, November 16, 2015
RESIDENCES DAR SAADA
What is the geographical breakdown of their land bank?
Figure 104- Geographical breakdown of Résidences Dar Saada land bank
Source: RDS
RDS Bonds and treasuries
RDS issued on June 2012 5-year bonds to raise MAD 750m. The characteristics of the bonds issued are as follows:
53% of the bonds issued have a yield at 5.47%.
47% of the bonds issued have a floating yield. The yield stood at 4.79% in June 2013 and at 5.48% in June 2014.
RDS had treasuries in their balance sheet up until September 2014.
Breakdown of RDS debt
Figure 105- Breakdown of RDS debt by type and maturity as of 12/31/2014
Source: CFG Research
City Surface
(hectars)
Surface
allocated
to projects
(hectars)
Surface
available
(hectars)
# of
projects
# of units
Agadir 16 16 0 6 3,645
Casablanca 459.1 415 44.1 13 36,666
Fès 124 124 0 1 7,428
Marrakech 309 94 215 7 12,764
Martil 11 11 0 1 2,525
Oujda 27 27 0 1 1,721
Skhirat 10 10 0 1 2,226
Tanger 13 13 0 3 3,236
Total 969.1 710 259.1 33 70,211
Type of debt Maturity Amount in MAD
Project Finance Debt More than 1 year 1,193,009,558
Project Finance Debt Less than 1 year 699,106,893
Total Project Finance Debt 1,892,116,451
Bonds More than 1 year 749,995,875
Bonds Less than 1 year -
749,995,875
2,642,112,326 Total Debt
Total Bonds

92 Morocco Real Estate Equity Primer, November 16, 2015
Industry references
GOVERNMENT BODIES AND AGENCIES
SECTOR DATA MINISTRY OF HOUSING, TOWN PLANNING AND URBAN POLICY – www.mhu.gov.ma
MACROECONOMIC AND MICROECONOMIC DATA MINISTRY OF ECONOMY AND FINANCE – www.finances.gov.ma
HIGHER PLANNING COMMISSION – www.hcp.ma
CENTRAL BANK “BANK-AL-MAGHRIB” – www.bkam.ma
CENTRAL GUARANTEE FUND – www.ccg.ma
PROFESSIONAL ASSOCIATIONS NATIONAL ASSOCIATION OF REAL ESTATE DEVELOPERS – www.fnpi.net.ma
MOROCCAN CEMENT ASSOCIATION – www.apc.ma

93 Morocco Real Estate Equity Primer, November 16, 2015
Table of figures Figure 1-Social housing project in Deroua, South of Casablanca ............................................................................................... 3 Figure 2- Value of MAD 100 invested in ADH, RDS and the CFG 25 Index at the time of RDS IPO (Dec 18th
2014)..................................................................................................................................................................................................................... 5 Figure 3 - ADH and RDS since their IPO vs. the CFG25 Index (Prices in MAD) .................................................................... 6 Figure 4- Résidences Dar Saada project in Deroua, South Casablanca ................................................................................... 7 Figure 5- Social housing –Evolution of Housing Starts and Production from 2012 to 2014 ......................................... 8 Figure 6- Housing Starts and Production of social and economical housing in Morocco in the period 2003-
2010 ...................................................................................................................................................................................................................... 9 Figure 7- Main elements regarding social housing in the 2008 budget bill .......................................................................... 9 Figure 8- Main elements regarding social housing in the 2010 budget bill ........................................................................ 11 Figure 9- Housing Starts and Production of social and economical housing in Morocco in the period 2010-
2014 .................................................................................................................................................................................................................... 11 Figure 10- Housing Starts and in Morocco in the period 2003-2014 ................................................................................... 12 Figure 11- Project IRR under different sale price scenarios ...................................................................................................... 13 Figure 12- Amendments to the 2010 fiscal reform legislated in 2012, 2013 and 2014 ................................................ 14 Figure 13- Evolution of the housing deficit from 2002 to 2010 and then from 2010 to 2014 ................................... 14 Figure 14- Evolution of the real estate price index (base 100 in Q4 2009) ........................................................................ 15 Figure 15- Annual Evolution of real estate loans (in billions of MAD) in the period 2007-2014 ............................. 16 Figure 16- Evolution of real estate loans interest rates in the period 2007-Q2 2015 ................................................... 16 Figure 17- Cement consumption evolution in the period 2000-2014 ................................................................................... 17 Figure 18- Cement consumption per region in the period 2010-2014 (Millions of tons) ............................................ 17 Figure 19- Origins of the housing deficit in Morocco .................................................................................................................... 20 Figure 20- Breakdown of the static housing deficit in 2012 ..................................................................................................... 20 Figure 21- Homes collapsing in the Medina of Casablanca and Shantytowns in the city of Kénitra ....................... 20 Figure 22- Types of households in Morocco ..................................................................................................................................... 21 Figure 23- Evolution of the number of urban households and the average size of households for the period
2014-2030E ...................................................................................................................................................................................................... 22 Figure 24- Projections of the number of urban households over the period 2014-2020E ........................................... 22 Figure 25- Target population for social housing with access to funds under different scenarios ............................ 26 Figure 26- Demand for social housing in 2014-2020E under different scenarios – Base assumption .................... 27 Figure 27- Demand for social housing in 2014-2020E under different scenarios – Conservative assumption .. 28 Figure 28- Demand for social housing vs. production in the period 2014-2020E - Base assumption ................... 29 Figure 29- Demand for social housing vs. production in the period 2014-2020E - Conservative assumption . 30 Figure 30- Understanding the roots of the current housing finance policy in Morocco ............................................... 31 Figure 31- Evolution of the GNDI and the GDP per capita (in kMAD) ................................................................................... 32 Figure 32- Household income of slum residents............................................................................................................................. 32 Figure 33- Income for heads of households at the Nakhil slum in Nouaceur .................................................................... 32 Figure 34- Bridging the affordability gap in housing finance for the urban poor ............................................................ 33 Figure 35- Source of loans by income quartile ................................................................................................................................ 33 Figure 36- FOGARIM Guaranteed loans attributes June 2009-June 2014 ........................................................................... 34 Figure 37- Monthly payments in MAD by repayment period and by interest rate .......................................................... 35 Figure 38- Minimum income per household in MAD for different repayment periods and interest rates ........... 35 Figure 39- Expense deciles for urban households and eligibility for mortgages ............................................................. 36 Figure 40- Monthly payments for social housing purchase and slum upgrading program options ........................ 38 Figure 41- Housing deficit per annum per region by 2016E, 2021E and 2026E ................................................................. 39 Figure 42- 2007 Poverty Map of Morocco.......................................................................................................................................... 40

94 Morocco Real Estate Equity Primer, November 16, 2015
Figure 43- Expenses of households in 2013 per region (in MMAD) ...................................................................................... 40 Figure 44- Evolution of the gross fixed capital formation of the construction sector in the period 2005-201441 Figure 45- Evolution of the value added of the construction sector in the period 2005-2014 .................................. 42 Figure 46- Evolution of the employment in the construction sector (000s) in the period 2007-2014 .................. 42 Figure 47- Evolution of FDIs (In MMAD) in real estate in the period 2005-2014 ........................................................... 43 Figure 48- Porter’s Five Forces Model of Competition................................................................................................................. 44 Figure 49- Real Estate stocks performance since January 2014 .............................................................................................. 46 Figure 50- H1-15 Returns on MAD 100 invested in real estate stocks, an equally-weighted real estate portfolio
and the CFG 25 index ................................................................................................................................................................................... 47 Figure 51- Total production (in number of units) .......................................................................................................................... 51 Figure 52- Targeted evolution of clients’ accounts receivable (in MAD b) and of their average term of
collection (in months of sales) ................................................................................................................................................................ 52 Figure 53- Targeted consolidated revenues (in billions of MAD) ........................................................................................... 52 Figure 54- Targeted Shareholders’ Equity, Net Debt and Gearing evolution ..................................................................... 52 Figure 55- Targeted Investments in production & Clients’ accounts receivables ............................................................ 53 Figure 56- Targeted CFFO after investments in land acquisition (in billions of MAD) .................................................. 53 Figure 57- Revenues by segment from 2014 to 2017E (in billions of MAD) ....................................................................... 54 Figure 58- Deliveries by segment from 2014 to 2017E (in units) ........................................................................................... 54 Figure 59- Gross margin from 2011 to 2017E .................................................................................................................................. 55 Figure 60- Revenues breakdown by segment from 2014 to 2017E ........................................................................................ 55 Figure 61- EBITDA margin from 2011 to 2017E ............................................................................................................................. 55 Figure 62- Net margin from 2011 to 2017E ....................................................................................................................................... 55 Figure 63- Net Debt and Gearing from 2014 to 2017E ................................................................................................................. 56 Figure 64- Working capital requirements from 2014 to 2017E (in MAD m) ...................................................................... 56 Figure 65- 2014-2017E P/E (on the basis of 11/04/15 share price) ..................................................................................... 57 Figure 66- 2014-2017E P/B (on the basis of 11/04/15 share price)..................................................................................... 57 Figure 67- Discounted Cash Flow Model of Addoha ...................................................................................................................... 58 Figure 68- Dividend Discounted Model of Addoha ........................................................................................................................ 58 Figure 69- Sources of RDS revenue in 2014 ...................................................................................................................................... 61 Figure 70- Geographical Breakdown of RDS revenue in 2014 ................................................................................................. 61 Figure 71-Breakdown of the units sold .............................................................................................................................................. 62 Figure 72-Average price per unit (APPU) by project .................................................................................................................... 62 Figure 73-Résidences Dar Saada projects (updated at the end of 2014) ............................................................................. 63 Figure 74- Average sale price per unit per property type and per region in 2014 ......................................................... 64 Figure 75-Evolution of the product mix as presented in the IPO prospectus .................................................................... 64 Figure 76-Evolution of the price per unit as a result of a higher contribution of social housing to total revenue
............................................................................................................................................................................................................................... 65 Figure 77-Land Bank Acquisition History .......................................................................................................................................... 67 Figure 78- Geographical breakdown of the land bank ................................................................................................................. 67 Figure 79- Consolidated revenue in 2015E, 2016E and 2017E ................................................................................................... 68 Figure 80- Assumptions used in the forecast of the balance sheet in the 2015E-2017E period ................................. 69 Figure 81-Assumptions to calculate the normalized FCFF ......................................................................................................... 69 Figure 82- Normalized FCFF used for the computation of the terminal value .................................................................. 69 Figure 83- Discounted Cash Flow Model of Résidences Dar Saada ........................................................................................ 70 Figure 84- Summary financials Résidences Dar Saada................................................................................................................. 71 Figure 85- Social Housing Project Assumptions ............................................................................................................................. 72 Figure 86- Sensitivity of the project IRR and the equity IRR to a change in gross margin ........................................... 73 Figure 87- Sensitivity of the project IRR and the equity IRR to the average months to collect the cash ............... 74

95 Morocco Real Estate Equity Primer, November 16, 2015
Figure 88- Sensitivity of the project IRR and the equity IRR to the percentage of unsold units ............................... 74 Figure 89- Sensitivity of the project IRR(up) and the equity IRR (down)to the main speed parameters of a
project ................................................................................................................................................................................................................ 75 Figure 90- Sensitivity of the project IRR (left) and the equity IRR (right) to pre-commercialization variables 76 Figure 91- Sensitivity of the equity IRR to the percentage of total costs financed by debt and interest rates ... 77 Figure 92- Sensitivity of the project IRR and the equity IRR to the size of the strategic reserve land as a % of
the total land bank ........................................................................................................................................................................................ 78 Figure 93- Impact of capitalized interests on the calculation of FCFF .................................................................................. 79 Figure 94 -Cumulated new households in 2020E (2009) ............................................................................................................ 80 Figure 95- Weights of the social classes for each scenario ......................................................................................................... 80 Figure 96- Harberger’s triangle – Deadweight loss of welfare for producers and consumers................................... 82 Figure 97 - Borrowing Capacity and Maximum Dwelling Value (1995) ............................................................................... 83 Figure 98 – Production per annum needed to eliminate the housing deficit ..................................................................... 84 Figure 99 - Fogarim Default (6’years generation of loans) ........................................................................................................ 85 Figure 100 – The Supply side effect of Moroccan Government Housing Policies ............................................................ 86 Figure 101 – Housing Indicators Comparison, MENA and select countries ....................................................................... 86 Figure 102- Accounting flow between pre-sales, receivables, inventory and revenue ................................................. 89 Figure 103- Illustrative example – Variation of inventory in the income statement ...................................................... 90 Figure 104- Geographical breakdown of Résidences Dar Saada land bank ........................................................................ 91 Figure 105- Breakdown of RDS debt by type and maturity as of 12/31/2014 ................................................................. 91

96 Morocco Real Estate Equity Primer, November 16, 2015
Bibliography
CORPORATE PUBLICATIONS
ADDOHA CORPORATE WEBSITE – www.groupeaddoha.com
RÉSIDENCES DAR SAADA CORPORATE WEBSITE – www.espacessaada.com/institutionnel.php
FILINGS AND PUBLIC INFORMATION – www.cdvm.gov.ma
GOVERNMENT BODIES DATA AND PUBLICATIONS
MINISTRY OF HOUSING, TOWN PLANNING AND URBAN POLICY – www.mhu.gov.ma
HIGHER PLANNING COMMISSION – www.hcp.ma
MINISTRY OF ECONOMY AND FINANCE – www.finances.gov.ma
CENTRAL BANK “BANK-AL-MAGHRIB” – www.bkam.ma
FOREIGN AGENCIES WORKING PAPERS
Housing finance for the poor in morocco: programs, policies and institutions – USAID – January 2008
https://www.microlinks.org/sites/microlinks/files/resource/files/ML5597_mr_96_morocco_housing_financ
e_for_the_poor.pdf
Morocco housing market: Industry status, Government involvement and investment opportunity Overseas
Private Investment Corporation – January 2006
https://www.opic.gov/sites/default/files/docs/Issues_MoroccoHousingOverview_Jan2006.pdf
The Macroeconomic and Sectoral Performance of Housing Supply Policies in Selected MENA Countries: A
Comparative analysis –World Bank – April 2005
http://siteresources.worldbank.org/INTMENA/Publications/20459465/Macroeconomic%20and%20Sector
al%20Performance%20of%20Housing%20Supply.pdf
Housing Sector Development Policy Loan –World Bank – December 2008
www-
wds.worldbank.org/external/default/WDSContentServer/WDSP/IB/2009/08/14/000333037_2009081400
4644/Rendered/PDF/ICR10340P083741IC0disclosed08112191.pdf
Housing Finance in Africa–Centre for Affordable Housing Finance in Africa –November 2014
http://www.housingfinanceafrica.org/wp-content/uploads/2014/11/CAHF-14.11.2014-small.pdf
Best Practices in Slum Improvement: The Case of Casablanca–Development Innovations Group
http://www.housingfinanceforthepoor.com/data/images/casablanca%20best%20practices%20in%20slum
%20improvement.pdf
ACADEMIC PAPERS
El Hachtouki M. Evaluation des besoins en logements à l'horizon 2020. In : Camarda D. (ed.), Grassini L. (ed.).
Local resources and global trades: Environments and agriculture in the Mediterranean region. Bari : CIHEAM,
2003. p. 461-476 (Options Méditerranéennes : Série A. Séminaires Méditerranéens; n. 57)
http://ressources.ciheam.org/om/pdf/a57/04001997.pdf

97 Morocco Real Estate Equity Primer, November 16, 2015
Disclaimer All rights attached to this document are exclusively reserved to CFG Group. This document can in no case be
copied, photocopied, or partially or completely duplicated without prior written permission from CFG Group.
This document can only be distributed by CFG Group. This document is confidential and intended solely for
the use of the addressees. It should not be transmitted to any person other than the original addressees
without the prior written consent of CFG Group. If you receive this document in error, please delete or
destroy it and notify the sender immediately.
This document is communicated to each recipient for information purposes only and do not constitute a
personalized recommendation. It is intended for general distribution and the products or services described
therein do not take into account any specific investment objective, financial situation or particular need of
any recipient.
It should not be construed as an offer or solicitation with respect to the purchase, sale or subscription of any
interest or security.
This document is based on carefully selected public information. However, no representation, warranty or
undertaking, express or implied, is made to the recipients of this document as to or in relation to the accuracy
or completeness or otherwise of this document or as to the reasonableness of any assumption contained in
this document. In addition, any view, opinion or other information provided herein is indicative only and
subject to change or withdrawal by CFG Group at any time without notice.
Prices and margins are indicative only and are subject to changes at any time without notice depending on
market conditions. Past performances and simulations of past performances are not a reliable indicator and
therefore do not predict future results. The information contained in this document may include the results of
analysis derived from a quantitative model, which represent potential future events that may or may not be
realised, and is not a complete analysis of every material fact representing any product. The information may
be amended or withdrawn by CFG Group at any time without notice.
More generally, no responsibility is accepted by CFG Group, nor any of its subsidiaries, associated
undertakings or controlling persons, nor any of its directors, officers, partners, employees or agents as to or
in relation to the characteristics of this information. The opinions, views and forecasts expressed in this
document reflect the personal views of the author(s) and do not reflect the views of any other person or CFG
Group unless otherwise mentioned.
It should not be assumed that the information contained in this document will have been updated subsequent
to date stated on the first page of this document. In addition, the delivery of this document does not imply in
any way an obligation on anyone to update such information at any time.
CFG Group shall not be liable for any financial loss or any decision taken on the basis of the information
contained in this document. In any event, you should request for any internal and/or external advice that you
consider necessary or desirable to obtain, including from any financial, legal, tax or accounting advisor, or any
other specialist advice, in order to verify in particular that the investment(s) described in this document
meets your investment objectives and constraints and to obtain an independent valuation of such
investment(s), its risks factors and rewards.