Embed Size (px)
Citation preview
Section: WATER
Guidance
Definitions
Table W1
Table W2
Table W3
Table W4
Table W5
Table W6
Table W7
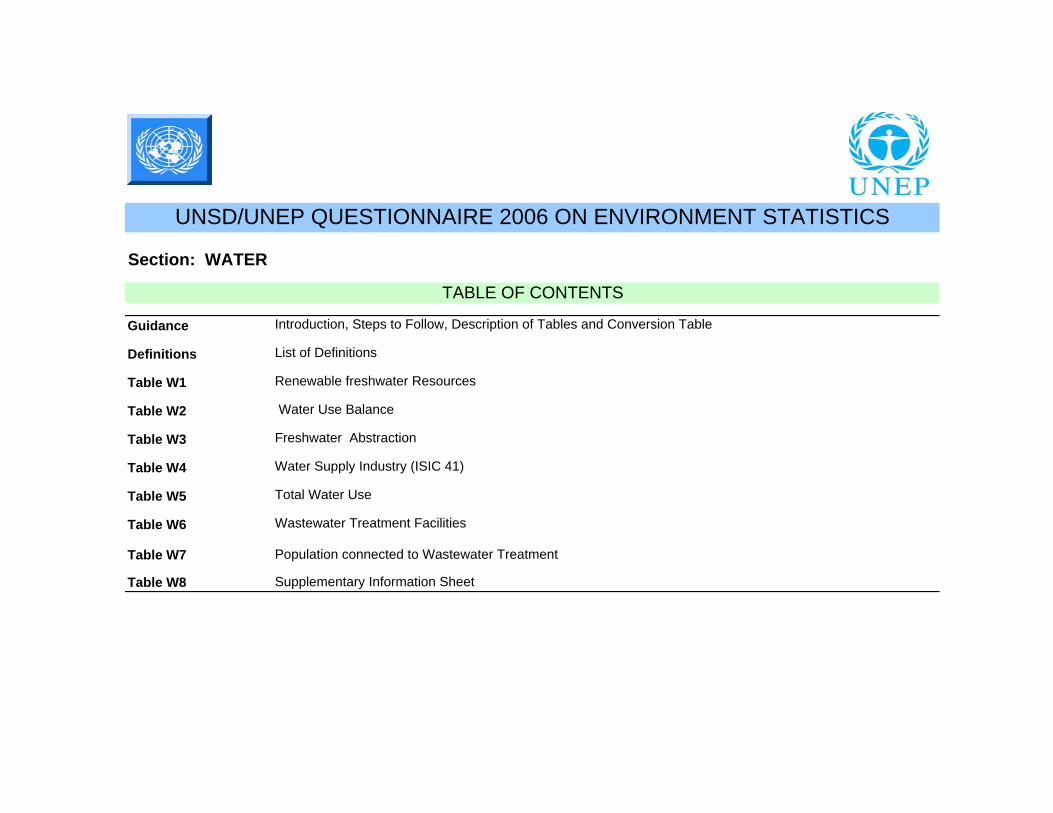
Table W8 Supplementary Information Sheet
Wastewater Treatment Facilities
Water Supply Industry (ISIC 41)
Total Water Use
Population connected to Wastewater Treatment
Water Use Balance
Freshwater Abstraction
UNSD/UNEP QUESTIONNAIRE 2006 ON ENVIRONMENT STATISTICS
TABLE OF CONTENTS
Introduction, Steps to Follow, Description of Tables and Conversion Table
List of Definitions
Renewable freshwater Resources
Section: WATER
INTRODUCTION
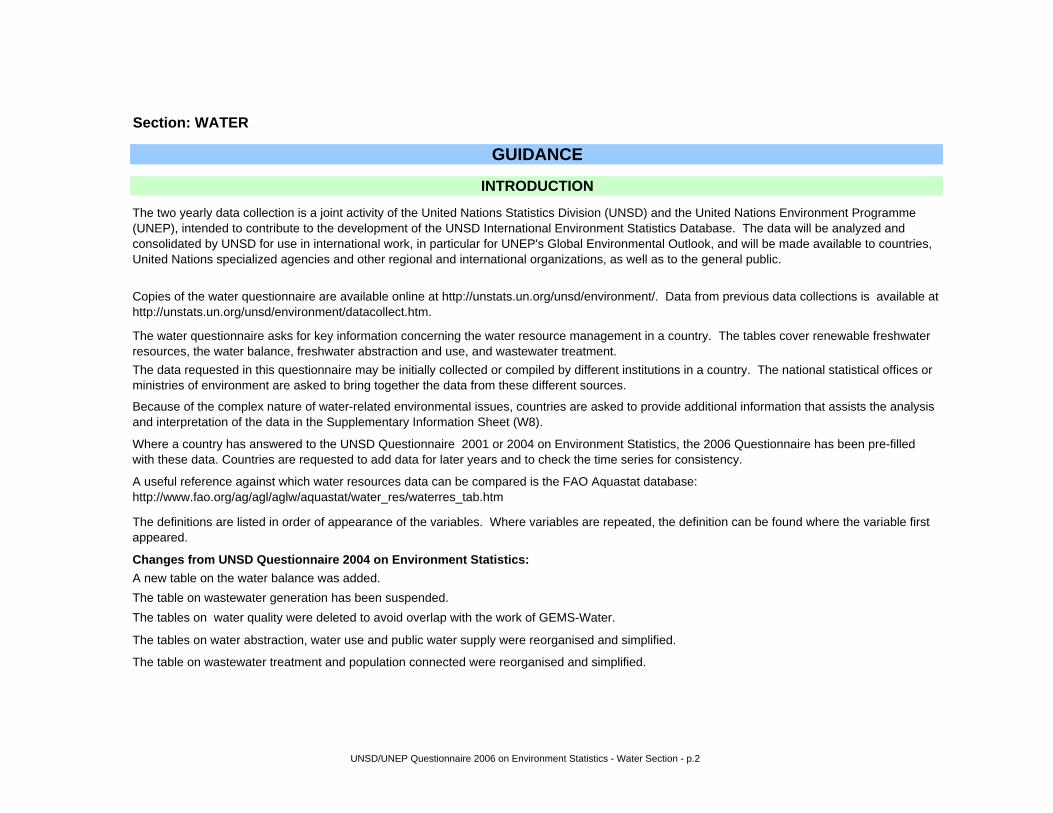
Copies of the water questionnaire are available online at http://unstats.un.org/unsd/environment/. Data from previous data collections is available at http://unstats.un.org/unsd/environment/datacollect.htm.
A new table on the water balance was added.
The tables on water quality were deleted to avoid overlap with the work of GEMS-Water.The table on wastewater generation has been suspended.
Changes from UNSD Questionnaire 2004 on Environment Statistics:
GUIDANCE
The table on wastewater treatment and population connected were reorganised and simplified.
The tables on water abstraction, water use and public water supply were reorganised and simplified.
A useful reference against which water resources data can be compared is the FAO Aquastat database: http://www.fao.org/ag/agl/aglw/aquastat/water_res/waterres_tab.htm
The water questionnaire asks for key information concerning the water resource management in a country. The tables cover renewable freshwater resources, the water balance, freshwater abstraction and use, and wastewater treatment.
Where a country has answered to the UNSD Questionnaire 2001 or 2004 on Environment Statistics, the 2006 Questionnaire has been pre-filled with these data. Countries are requested to add data for later years and to check the time series for consistency.
The definitions are listed in order of appearance of the variables. Where variables are repeated, the definition can be found where the variable first appeared.
Because of the complex nature of water-related environmental issues, countries are asked to provide additional information that assists the analysis and interpretation of the data in the Supplementary Information Sheet (W8).
The data requested in this questionnaire may be initially collected or compiled by different institutions in a country. The national statistical offices or ministries of environment are asked to bring together the data from these different sources.
The two yearly data collection is a joint activity of the United Nations Statistics Division (UNSD) and the United Nations Environment Programme (UNEP), intended to contribute to the development of the UNSD International Environment Statistics Database. The data will be analyzed and consolidated by UNSD for use in international work, in particular for UNEP's Global Environmental Outlook, and will be made available to countries, United Nations specialized agencies and other regional and international organizations, as well as to the general public.
UNSD/UNEP Questionnaire 2006 on Environment Statistics - Water Section - p.2
Section: WATER
GUIDANCE
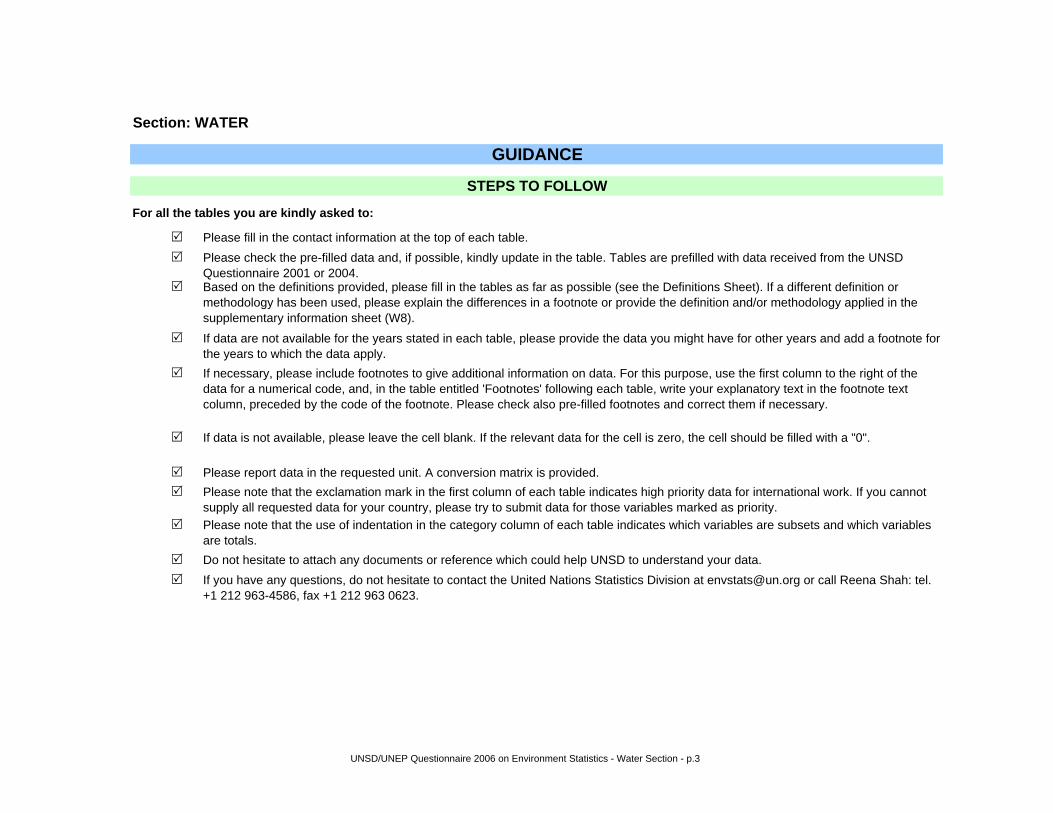
For all the tables you are kindly asked to:
If you have any questions, do not hesitate to contact the United Nations Statistics Division at [email protected] or call Reena Shah: tel. +1 212 963-4586, fax +1 212 963 0623.
Do not hesitate to attach any documents or reference which could help UNSD to understand your data.
STEPS TO FOLLOW
Please report data in the requested unit. A conversion matrix is provided.Please note that the exclamation mark in the first column of each table indicates high priority data for international work. If you cannot supply all requested data for your country, please try to submit data for those variables marked as priority.
If necessary, please include footnotes to give additional information on data. For this purpose, use the first column to the right of the data for a numerical code, and, in the table entitled 'Footnotes' following each table, write your explanatory text in the footnote text column, preceded by the code of the footnote. Please check also pre-filled footnotes and correct them if necessary.
If data is not available, please leave the cell blank. If the relevant data for the cell is zero, the cell should be filled with a "0".
Please fill in the contact information at the top of each table.Please check the pre-filled data and, if possible, kindly update in the table. Tables are prefilled with data received from the UNSD Questionnaire 2001 or 2004.
If data are not available for the years stated in each table, please provide the data you might have for other years and add a footnote for the years to which the data apply.
Please note that the use of indentation in the category column of each table indicates which variables are subsets and which variables are totals.
Based on the definitions provided, please fill in the tables as far as possible (see the Definitions Sheet). If a different definition or methodology has been used, please explain the differences in a footnote or provide the definition and/or methodology applied in the supplementary information sheet (W8).
UNSD/UNEP Questionnaire 2006 on Environment Statistics - Water Section - p.3
Section: WATER
GUIDANCE
Table number
W1
W2
W3
W4
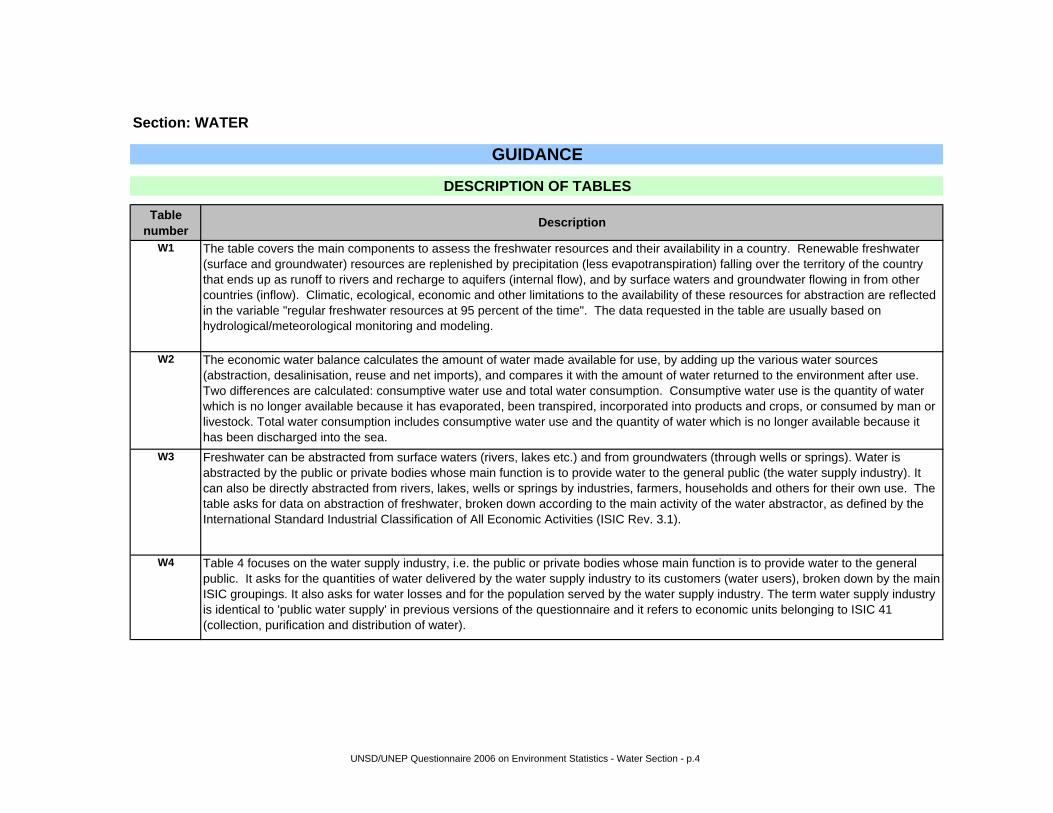
The table covers the main components to assess the freshwater resources and their availability in a country. Renewable freshwater (surface and groundwater) resources are replenished by precipitation (less evapotranspiration) falling over the territory of the country that ends up as runoff to rivers and recharge to aquifers (internal flow), and by surface waters and groundwater flowing in from other countries (inflow). Climatic, ecological, economic and other limitations to the availability of these resources for abstraction are reflected in the variable "regular freshwater resources at 95 percent of the time". The data requested in the table are usually based on hydrological/meteorological monitoring and modeling.
Freshwater can be abstracted from surface waters (rivers, lakes etc.) and from groundwaters (through wells or springs). Water is abstracted by the public or private bodies whose main function is to provide water to the general public (the water supply industry). It can also be directly abstracted from rivers, lakes, wells or springs by industries, farmers, households and others for their own use. The table asks for data on abstraction of freshwater, broken down according to the main activity of the water abstractor, as defined by the International Standard Industrial Classification of All Economic Activities (ISIC Rev. 3.1).
DESCRIPTION OF TABLES
Description
Table 4 focuses on the water supply industry, i.e. the public or private bodies whose main function is to provide water to the general public. It asks for the quantities of water delivered by the water supply industry to its customers (water users), broken down by the main ISIC groupings. It also asks for water losses and for the population served by the water supply industry. The term water supply industry is identical to 'public water supply' in previous versions of the questionnaire and it refers to economic units belonging to ISIC 41 (collection, purification and distribution of water).
The economic water balance calculates the amount of water made available for use, by adding up the various water sources (abstraction, desalinisation, reuse and net imports), and compares it with the amount of water returned to the environment after use. Two differences are calculated: consumptive water use and total water consumption. Consumptive water use is the quantity of water which is no longer available because it has evaporated, been transpired, incorporated into products and crops, or consumed by man or livestock. Total water consumption includes consumptive water use and the quantity of water which is no longer available because it has been discharged into the sea.
UNSD/UNEP Questionnaire 2006 on Environment Statistics - Water Section - p.4

Section: WATER
GUIDANCEW5
W6
W7
W8
To Convert To Multiply bygallons (UK) l 4.54609gallons (US) l 3.785411784
m3 l 1000liter (l) m3 0.001
ml l 0.001
The share of the resident population connected to public/urban wastewater collecting system, to public/urban wastewater treatment and to independent treatment facilities indicate the coverage and level of sanitation.
Wastewater can be discharged directly into water bodies, or may be treated to remove some of the pollutants before being discharged. This table asks for details (number, design capacity) of the wastewater treatment infrastructure serving the population of the country, and covers urban treatment stations serving a larger population as well as independent treatment stations for a small number of households. The amount and type of pollutants removed will depend on the technical specifications of the wastewater treatment plant. The table distinguishes primary and secondary treatment according to the level of wastewater treatment (see definitions).
Table 5 asks for the overall amount of water used by the main ISIC groupings. Figures should include water delivered by the water supply industry, water directly abstracted by the user from ground or surface waters, and water received from other parties. Water abstracted but returned without use (for example, drainage water or mine water), should be excluded.
Table 8 is where any relevant additional information regarding water can be added. The purpose of this table is to allow space for additional information related to the figures asked for in Tables W1 to W7. For example, additional information on water use by manufacturing categories would be relevant eg water use by the manufacture of chemicals and water use by manufacture of food products and beverages.
CONVERSION TABLE
UNSD/UNEP Questionnaire 2006 on Environment Statistics - Water Section - p.5
Section: WATER
ISIC Code(s) Questionnaire abbreviation ISIC Rev 3.1
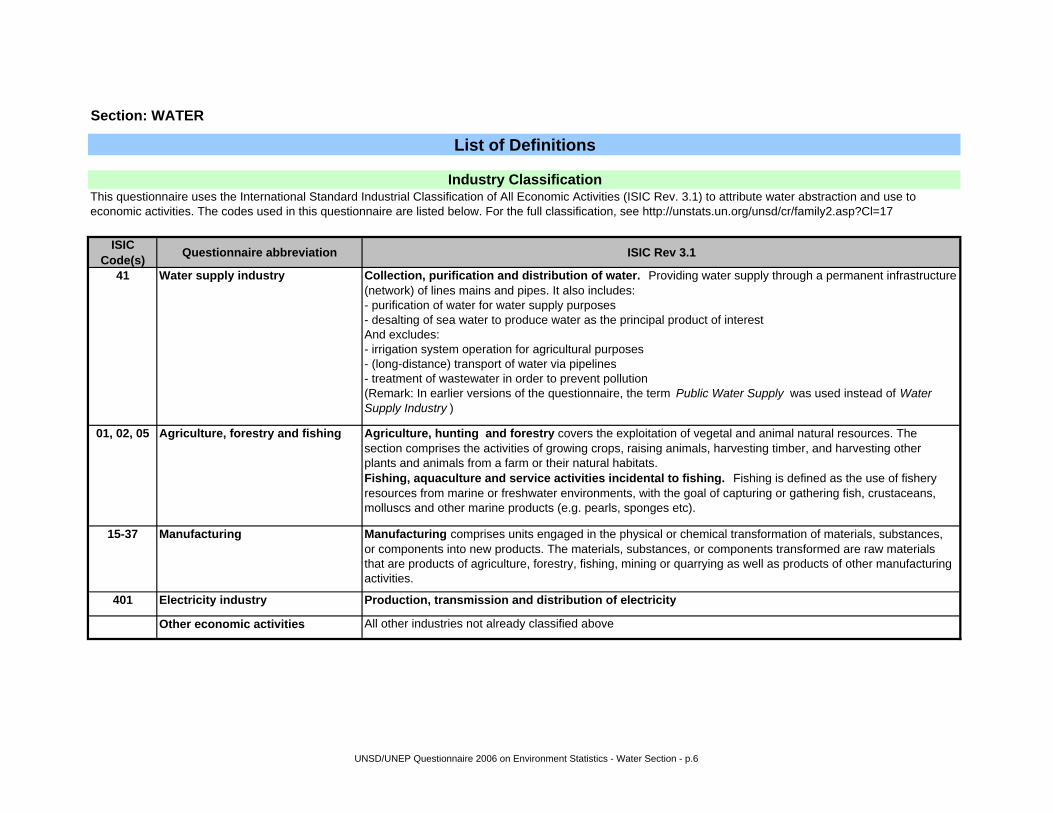
41 Water supply industry Collection, purification and distribution of water. Providing water supply through a permanent infrastructure (network) of lines mains and pipes. It also includes:- purification of water for water supply purposes- desalting of sea water to produce water as the principal product of interestAnd excludes:- irrigation system operation for agricultural purposes- (long-distance) transport of water via pipelines- treatment of wastewater in order to prevent pollution(Remark: In earlier versions of the questionnaire, the term Public Water Supply was used instead of Water Supply Industry )
01, 02, 05 Agriculture, forestry and fishing Agriculture, hunting and forestry covers the exploitation of vegetal and animal natural resources. The section comprises the activities of growing crops, raising animals, harvesting timber, and harvesting other plants and animals from a farm or their natural habitats. Fishing, aquaculture and service activities incidental to fishing. Fishing is defined as the use of fishery resources from marine or freshwater environments, with the goal of capturing or gathering fish, crustaceans, molluscs and other marine products (e.g. pearls, sponges etc).
15-37 Manufacturing Manufacturing comprises units engaged in the physical or chemical transformation of materials, substances, or components into new products. The materials, substances, or components transformed are raw materials that are products of agriculture, forestry, fishing, mining or quarrying as well as products of other manufacturing activities.
401 Electricity industry Production, transmission and distribution of electricity
Other economic activities All other industries not already classified above
List of Definitions
Industry ClassificationThis questionnaire uses the International Standard Industrial Classification of All Economic Activities (ISIC Rev. 3.1) to attribute water abstraction and use to economic activities. The codes used in this questionnaire are listed below. For the full classification, see http://unstats.un.org/unsd/cr/family2.asp?Cl=17
UNSD/UNEP Questionnaire 2006 on Environment Statistics - Water Section - p.6
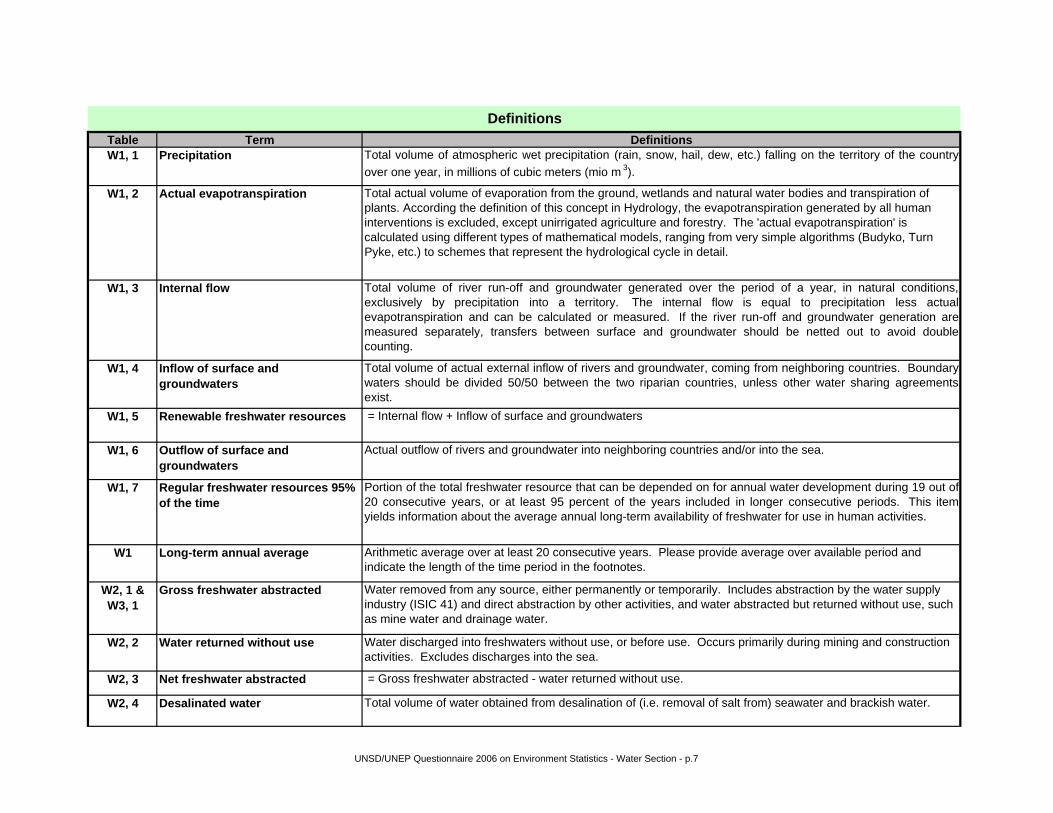
Table Term DefinitionsW1, 1 Precipitation Total volume of atmospheric wet precipitation (rain, snow, hail, dew, etc.) falling on the territory of the country
over one year, in millions of cubic meters (mio m 3).
W1, 2 Actual evapotranspiration Total actual volume of evaporation from the ground, wetlands and natural water bodies and transpiration of plants. According the definition of this concept in Hydrology, the evapotranspiration generated by all human interventions is excluded, except unirrigated agriculture and forestry. The 'actual evapotranspiration' is calculated using different types of mathematical models, ranging from very simple algorithms (Budyko, Turn Pyke, etc.) to schemes that represent the hydrological cycle in detail.
W1, 3 Internal flow Total volume of river run-off and groundwater generated over the period of a year, in natural conditions,exclusively by precipitation into a territory. The internal flow is equal to precipitation less actualevapotranspiration and can be calculated or measured. If the river run-off and groundwater generation aremeasured separately, transfers between surface and groundwater should be netted out to avoid doublecounting.
W1, 4 Inflow of surface and groundwaters
Total volume of actual external inflow of rivers and groundwater, coming from neighboring countries. Boundarywaters should be divided 50/50 between the two riparian countries, unless other water sharing agreementsexist.
W1, 5 Renewable freshwater resources = Internal flow + Inflow of surface and groundwaters
W1, 6 Outflow of surface and groundwaters
Actual outflow of rivers and groundwater into neighboring countries and/or into the sea.
W1, 7 Regular freshwater resources 95% of the time
Portion of the total freshwater resource that can be depended on for annual water development during 19 out of20 consecutive years, or at least 95 percent of the years included in longer consecutive periods. This itemyields information about the average annual long-term availability of freshwater for use in human activities.
W1 Long-term annual average Arithmetic average over at least 20 consecutive years. Please provide average over available period and indicate the length of the time period in the footnotes.
W2, 1 & W3, 1
Gross freshwater abstracted Water removed from any source, either permanently or temporarily. Includes abstraction by the water supply industry (ISIC 41) and direct abstraction by other activities, and water abstracted but returned without use, such as mine water and drainage water.
W2, 2 Water returned without use Water discharged into freshwaters without use, or before use. Occurs primarily during mining and construction activities. Excludes discharges into the sea.
W2, 3 Net freshwater abstracted = Gross freshwater abstracted - water returned without use.
W2, 4 Desalinated water Total volume of water obtained from desalination of (i.e. removal of salt from) seawater and brackish water.
Definitions
UNSD/UNEP Questionnaire 2006 on Environment Statistics - Water Section - p.7
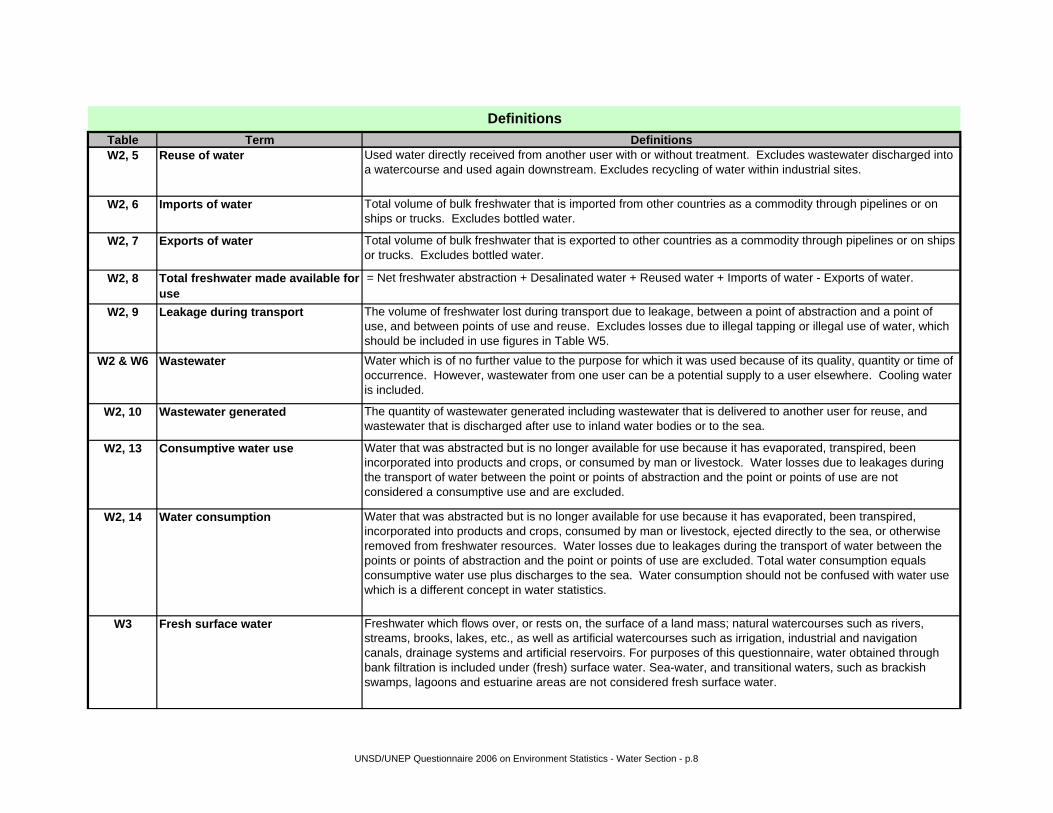
Table Term Definitions
Definitions
W2, 5 Reuse of water Used water directly received from another user with or without treatment. Excludes wastewater discharged into a watercourse and used again downstream. Excludes recycling of water within industrial sites.
W2, 6 Imports of water Total volume of bulk freshwater that is imported from other countries as a commodity through pipelines or on ships or trucks. Excludes bottled water.
W2, 7 Exports of water Total volume of bulk freshwater that is exported to other countries as a commodity through pipelines or on ships or trucks. Excludes bottled water.
W2, 8 Total freshwater made available for use
= Net freshwater abstraction + Desalinated water + Reused water + Imports of water - Exports of water.
W2, 9 Leakage during transport The volume of freshwater lost during transport due to leakage, between a point of abstraction and a point of use, and between points of use and reuse. Excludes losses due to illegal tapping or illegal use of water, which should be included in use figures in Table W5.
W2 & W6 Wastewater Water which is of no further value to the purpose for which it was used because of its quality, quantity or time of occurrence. However, wastewater from one user can be a potential supply to a user elsewhere. Cooling water is included.
W2, 10 Wastewater generated The quantity of wastewater generated including wastewater that is delivered to another user for reuse, and wastewater that is discharged after use to inland water bodies or to the sea.
W2, 13 Consumptive water use Water that was abstracted but is no longer available for use because it has evaporated, transpired, been incorporated into products and crops, or consumed by man or livestock. Water losses due to leakages during the transport of water between the point or points of abstraction and the point or points of use are not considered a consumptive use and are excluded.
W2, 14 Water consumption Water that was abstracted but is no longer available for use because it has evaporated, been transpired, incorporated into products and crops, consumed by man or livestock, ejected directly to the sea, or otherwise removed from freshwater resources. Water losses due to leakages during the transport of water between the points or points of abstraction and the point or points of use are excluded. Total water consumption equals consumptive water use plus discharges to the sea. Water consumption should not be confused with water use which is a different concept in water statistics.
W3 Fresh surface water Freshwater which flows over, or rests on, the surface of a land mass; natural watercourses such as rivers, streams, brooks, lakes, etc., as well as artificial watercourses such as irrigation, industrial and navigation canals, drainage systems and artificial reservoirs. For purposes of this questionnaire, water obtained through bank filtration is included under (fresh) surface water. Sea-water, and transitional waters, such as brackish swamps, lagoons and estuarine areas are not considered fresh surface water.
UNSD/UNEP Questionnaire 2006 on Environment Statistics - Water Section - p.8

Table Term Definitions
Definitions
W3 Bank filtration Use of existing geologic formations adjacent to surface water bodies to filter drinking water. Wells are dug in fine, sandy sediments next to water bodies and water is extracted from these wells. Water in the water bodies filters through the sediments, removing contaminants.
W3 Fresh groundwater Freshwater which is being held in, and can usually be recovered from, or via, an underground formation. All permanent and temporary deposits of water, both artificially charged and naturally, in the subsoil, of sufficient quality for at least seasonal use. This category includes phreatic water-bearing strata, as well as deep strata under pressure or not, contained in porous or fracture soils. For purposes of this questionnaire, groundwater includes springs, both concentrated and diffused, which may be subaqueous.
W3, 21 Gross fresh groundwater abstracted
Fresh groundwater removed from the ground, either permanently or temporarily. Includes abstraction by the water supply industry (ISIC 41) and direct abstraction by other activities, and water abstracted but returned without use, such as mine water and drainage water. Note artificial recharge is not deducted from this figure.
W3, 2 Water abstraction by water supply industry
Water abstraction by economic units engaged in collection, purification and distribution of water (including desalting of sea water to produce water as the principal product of interest, and excluding system operation for agricultural purposes and treatment of wastewater solely in order to prevent pollution.) The water supply industry is classified as ISIC 41 in the International Standard Industrial Classification of All Economic Activities (ISIC Rev. 3.1).
W3 Direct abstraction Abstraction of freshwater by households and economic units other than the water supply industry.
W4, 1 Gross freshwater delivered by water supply industry (ISIC 41)
Water delivered by water supply industry to the user. Includes losses during transport.
W4, 2 Freshwater losses during transport
The volume of freshwater lost during transport between a point of abstraction and a point of use, and between points of use and reuse. Includes leakages and evaporation. Excludes losses due to illegal tapping and use of water which should be included in use figures in Table W5.
UNSD/UNEP Questionnaire 2006 on Environment Statistics - Water Section - p.9
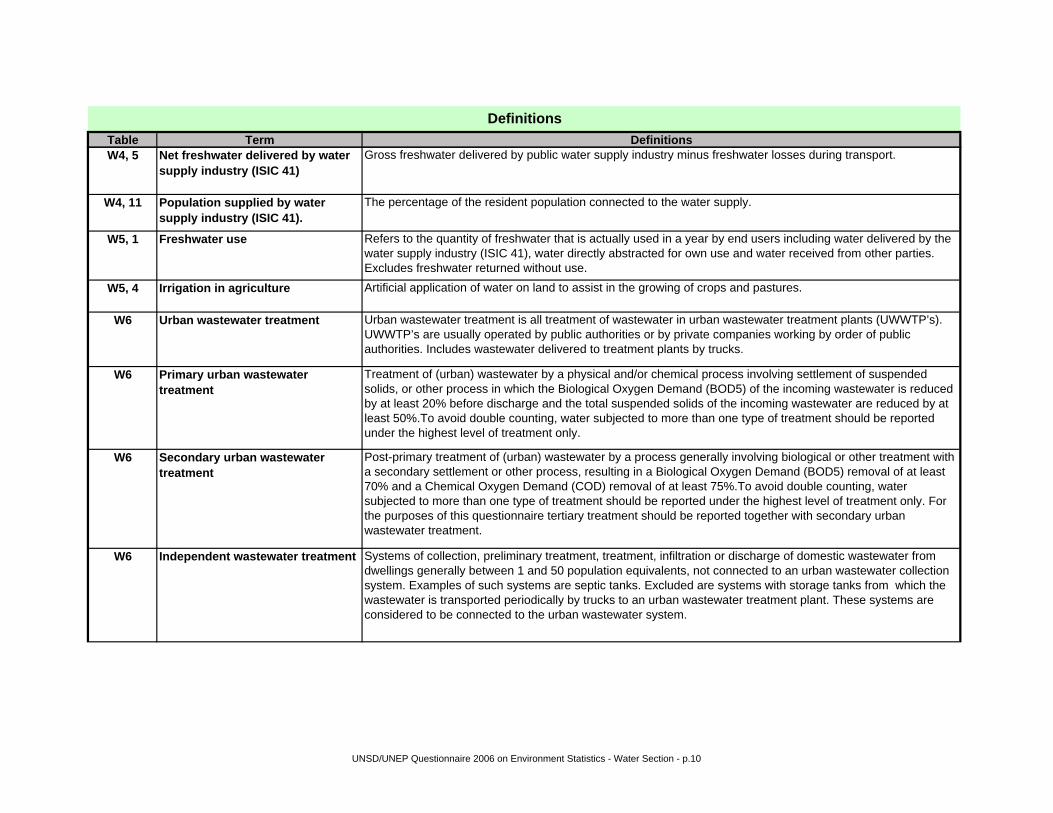
Table Term Definitions
Definitions
W4, 5 Net freshwater delivered by water supply industry (ISIC 41)
Gross freshwater delivered by public water supply industry minus freshwater losses during transport.
W4, 11 Population supplied by water supply industry (ISIC 41).
The percentage of the resident population connected to the water supply.
W5, 1 Freshwater use Refers to the quantity of freshwater that is actually used in a year by end users including water delivered by the water supply industry (ISIC 41), water directly abstracted for own use and water received from other parties. Excludes freshwater returned without use.
W5, 4 Irrigation in agriculture Artificial application of water on land to assist in the growing of crops and pastures.
W6 Urban wastewater treatment Urban wastewater treatment is all treatment of wastewater in urban wastewater treatment plants (UWWTP’s). UWWTP’s are usually operated by public authorities or by private companies working by order of public authorities. Includes wastewater delivered to treatment plants by trucks.
W6 Primary urban wastewater treatment
Treatment of (urban) wastewater by a physical and/or chemical process involving settlement of suspended solids, or other process in which the Biological Oxygen Demand (BOD5) of the incoming wastewater is reduced by at least 20% before discharge and the total suspended solids of the incoming wastewater are reduced by at least 50%.To avoid double counting, water subjected to more than one type of treatment should be reported under the highest level of treatment only.
W6 Secondary urban wastewater treatment
Post-primary treatment of (urban) wastewater by a process generally involving biological or other treatment with a secondary settlement or other process, resulting in a Biological Oxygen Demand (BOD5) removal of at least 70% and a Chemical Oxygen Demand (COD) removal of at least 75%.To avoid double counting, water subjected to more than one type of treatment should be reported under the highest level of treatment only. For the purposes of this questionnaire tertiary treatment should be reported together with secondary urban wastewater treatment.
W6 Independent wastewater treatment Systems of collection, preliminary treatment, treatment, infiltration or discharge of domestic wastewater from dwellings generally between 1 and 50 population equivalents, not connected to an urban wastewater collection system. Examples of such systems are septic tanks. Excluded are systems with storage tanks from which the wastewater is transported periodically by trucks to an urban wastewater treatment plant. These systems are considered to be connected to the urban wastewater system.
UNSD/UNEP Questionnaire 2006 on Environment Statistics - Water Section - p.10
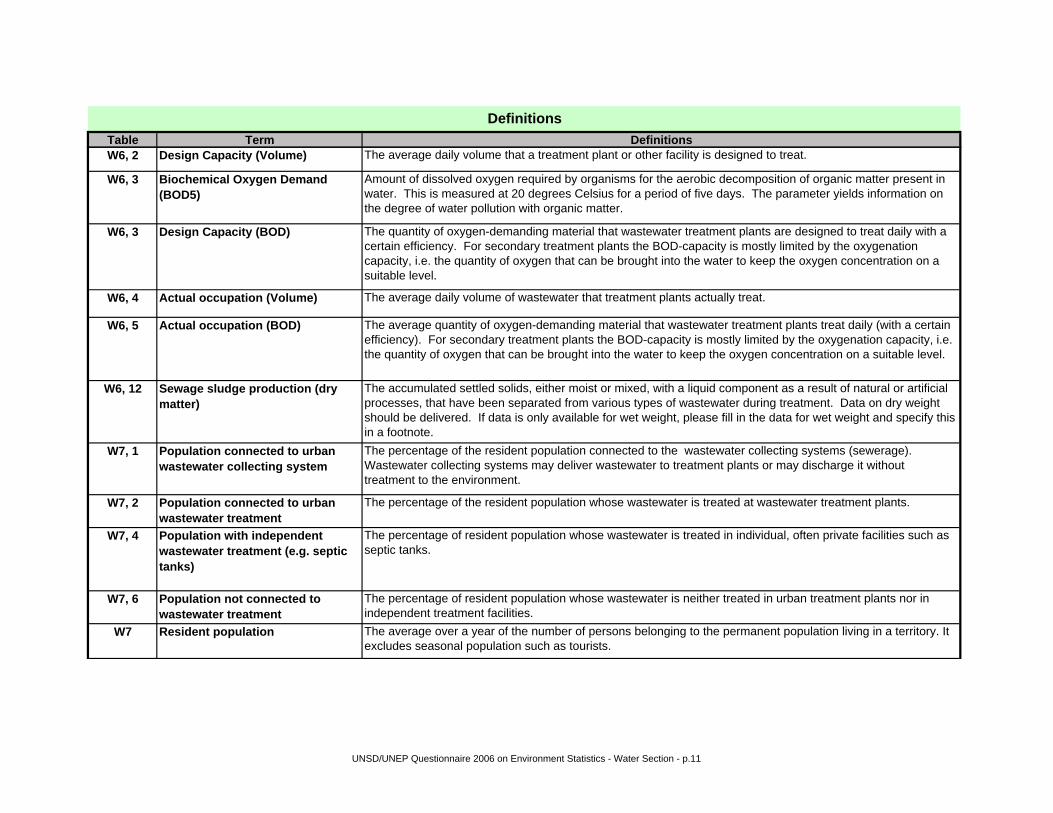
Table Term Definitions
Definitions
W6, 2 Design Capacity (Volume) The average daily volume that a treatment plant or other facility is designed to treat.
W6, 3 Biochemical Oxygen Demand (BOD5)
Amount of dissolved oxygen required by organisms for the aerobic decomposition of organic matter present in water. This is measured at 20 degrees Celsius for a period of five days. The parameter yields information on the degree of water pollution with organic matter.
W6, 3 Design Capacity (BOD) The quantity of oxygen-demanding material that wastewater treatment plants are designed to treat daily with a certain efficiency. For secondary treatment plants the BOD-capacity is mostly limited by the oxygenation capacity, i.e. the quantity of oxygen that can be brought into the water to keep the oxygen concentration on a suitable level.
W6, 4 Actual occupation (Volume) The average daily volume of wastewater that treatment plants actually treat.
W6, 5 Actual occupation (BOD) The average quantity of oxygen-demanding material that wastewater treatment plants treat daily (with a certain efficiency). For secondary treatment plants the BOD-capacity is mostly limited by the oxygenation capacity, i.e. the quantity of oxygen that can be brought into the water to keep the oxygen concentration on a suitable level.
W6, 12 Sewage sludge production (dry matter)
The accumulated settled solids, either moist or mixed, with a liquid component as a result of natural or artificial processes, that have been separated from various types of wastewater during treatment. Data on dry weight should be delivered. If data is only available for wet weight, please fill in the data for wet weight and specify this in a footnote.
W7, 1 Population connected to urban wastewater collecting system
The percentage of the resident population connected to the wastewater collecting systems (sewerage). Wastewater collecting systems may deliver wastewater to treatment plants or may discharge it without treatment to the environment.
W7, 2 Population connected to urban wastewater treatment
The percentage of the resident population whose wastewater is treated at wastewater treatment plants.
W7, 4 Population with independent wastewater treatment (e.g. septic tanks)
The percentage of resident population whose wastewater is treated in individual, often private facilities such as septic tanks.
W7, 6 Population not connected to wastewater treatment
The percentage of resident population whose wastewater is neither treated in urban treatment plants nor in independent treatment facilities.
W7 Resident population The average over a year of the number of persons belonging to the permanent population living in a territory. It excludes seasonal population such as tourists.
UNSD/UNEP Questionnaire 2006 on Environment Statistics - Water Section - p.11
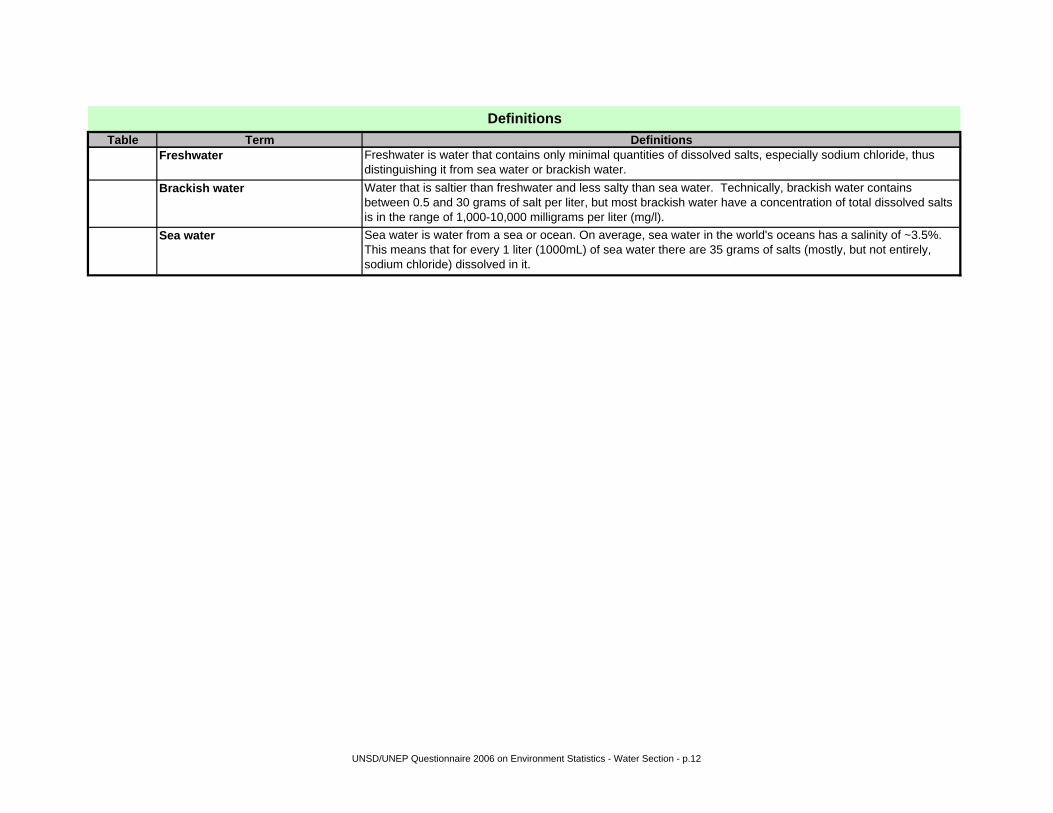
Table Term Definitions
Definitions
Freshwater Freshwater is water that contains only minimal quantities of dissolved salts, especially sodium chloride, thus distinguishing it from sea water or brackish water.
Brackish water Water that is saltier than freshwater and less salty than sea water. Technically, brackish water contains between 0.5 and 30 grams of salt per liter, but most brackish water have a concentration of total dissolved salts is in the range of 1,000-10,000 milligrams per liter (mg/l).
Sea water Sea water is water from a sea or ocean. On average, sea water in the world's oceans has a salinity of ~3.5%. This means that for every 1 liter (1000mL) of sea water there are 35 grams of salts (mostly, but not entirely, sodium chloride) dissolved in it.
UNSD/UNEP Questionnaire 2006 on Environment Statistics - Water Section - p.12

Section: WATER
Country: Contact person: Tel:Contact institution: E-mail: Fax:
If the value turns red, please check if it is correct.
Priority Line Category UnitLong term
annual average
1990 1995 1999 2000 2001 2002 2003 2004 2005
! 1 Precipitation mio m3/y
2 Actual evapotranspiration mio m3/y
! 3 Internal flow (=1-2) mio m3/y
4 Inflow of surface and groundwaters mio m3/y
! 5 Renewable freshwater resources (=3+4) mio m3/y
6 Outflow of surface and groundwaters mio m3/y
7 Regular freshwater resources 95% of the time mio m3/y
Notes :
Table W1: Renewable Freshwater Resources
Precipitation figures should be based on representative precipitation measurements from across the country and the country's climatic zones.
UNSD/UNEP Questionnaire 2006 on Environment Statistics - Water Section - p.13
Section: WATER
Footnotes
Code Footnote text
UNSD/UNEP Questionnaire 2006 on Environment Statistics - Water Section - p.14
Section: WATER
Country: Contact person: Tel:Contact institution: E-mail: Fax:
If the value turns red, please check if it is correct.Priority Line Category Unit 1990 1995 1999 2000 2001 2002 2003 2004 2005
1 Gross freshwater abstracted (=W3,1) mio m3/y
2 Water returned without use mio m3/y
3 Net freshwater abstracted (=1-2) mio m3/y
4 Desalinated water mio m3/y
5 Reused water mio m3/y
6 Imports of water mio m3/y
7 Exports of water mio m3/y
8 Total freshwater made available for use (=3+4+5+6-7) mio m3/y
9 Leakage during transport (=W4,4) mio m3/y
10 Wastewater generated (=11+12+13) mio m3/y
11 of which: Discharged to inland water bodies mio m3/y
12 Discharged to marine water bodies mio m3/y
13 Reused water (=5) mio m3/y
14 Consumptive water use (=8-9-10) mio m3/y
15 Water consumption (=14+12) mio m3/y
Notes :
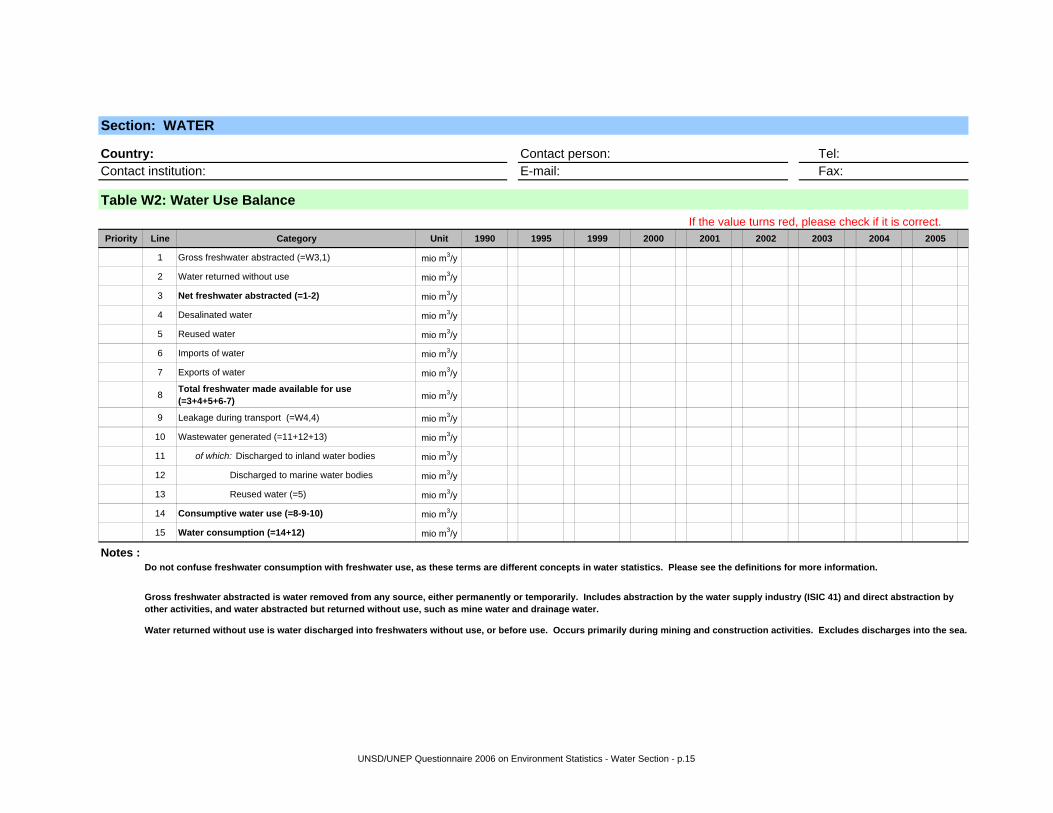
Table W2: Water Use Balance
Do not confuse freshwater consumption with freshwater use, as these terms are different concepts in water statistics. Please see the definitions for more information.
Gross freshwater abstracted is water removed from any source, either permanently or temporarily. Includes abstraction by the water supply industry (ISIC 41) and direct abstraction by other activities, and water abstracted but returned without use, such as mine water and drainage water.
Water returned without use is water discharged into freshwaters without use, or before use. Occurs primarily during mining and construction activities. Excludes discharges into the sea.
UNSD/UNEP Questionnaire 2006 on Environment Statistics - Water Section - p.15
Section: WATER
Footnotes
Code Footnote text
UNSD/UNEP Questionnaire 2006 on Environment Statistics - Water Section - p.16
Section: WATER
Country: Contact person: Tel:Contact institution: E-mail: Fax:
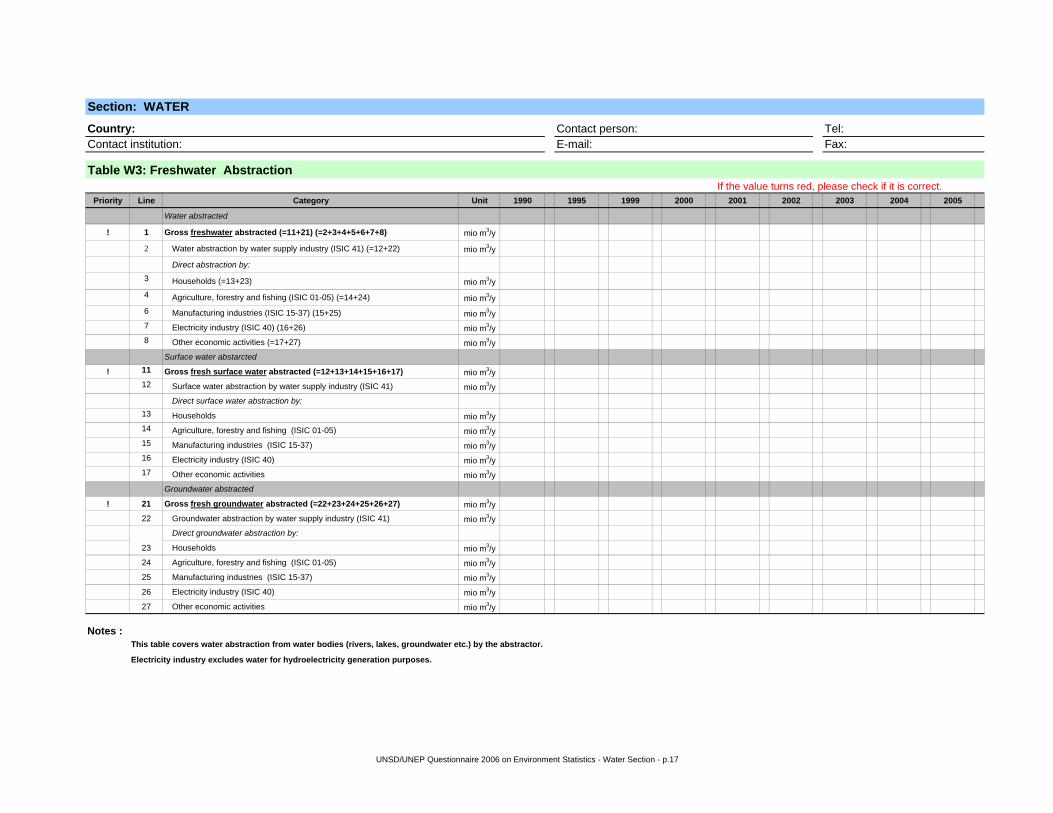
If the value turns red, please check if it is correct.Priority Line Category Unit 1990 1995 1999 2000 2001 2002 2003 2004 2005
Water abstracted
! 1 Gross freshwater abstracted (=11+21) (=2+3+4+5+6+7+8) mio m3/y
2 Water abstraction by water supply industry (ISIC 41) (=12+22) mio m3/y
Direct abstraction by:3 Households (=13+23) mio m3/y4 Agriculture, forestry and fishing (ISIC 01-05) (=14+24) mio m3/y6 Manufacturing industries (ISIC 15-37) (15+25) mio m3/y7 Electricity industry (ISIC 40) (16+26) mio m3/y8 Other economic activities (=17+27) mio m3/y
Surface water abstarcted
! 11 Gross fresh surface water abstracted (=12+13+14+15+16+17) mio m3/y12 Surface water abstraction by water supply industry (ISIC 41) mio m3/y
Direct surface water abstraction by:13 Households mio m3/y14 Agriculture, forestry and fishing (ISIC 01-05) mio m3/y15 Manufacturing industries (ISIC 15-37) mio m3/y16 Electricity industry (ISIC 40) mio m3/y17 Other economic activities mio m3/y
Groundwater abstracted
! 21 Gross fresh groundwater abstracted (=22+23+24+25+26+27) mio m3/y
22 Groundwater abstraction by water supply industry (ISIC 41) mio m3/yDirect groundwater abstraction by:
23 Households mio m3/y
24 Agriculture, forestry and fishing (ISIC 01-05) mio m3/y
25 Manufacturing industries (ISIC 15-37) mio m3/y
26 Electricity industry (ISIC 40) mio m3/y
27 Other economic activities mio m3/y
Notes :
Table W3: Freshwater Abstraction
This table covers water abstraction from water bodies (rivers, lakes, groundwater etc.) by the abstractor.
Electricity industry excludes water for hydroelectricity generation purposes.
UNSD/UNEP Questionnaire 2006 on Environment Statistics - Water Section - p.17
Section: WATER
Footnotes
Code Footnote text
UNSD/UNEP Questionnaire 2006 on Environment Statistics - Water Section - p.18

Section: WATER
Country: Contact person: Tel:Contact institution: E-mail: Fax:
If the value turns red, please check if it is correct.Priority Line Category Unit 1990 1995 1999 2000 2001 2002 2003 2004 2005
! 1 Gross freshwater delivered by water supply industry (ISIC 41) mio m3/y
2 Freshwater losses during transport mio m3/y
3 of which: Losses by evaporation mio m3/y
4 Losses by leakage mio m3/y
! 5 Net freshwater delivered by water supply industry (ISIC 41) (=1-2) (=6+7+8+9+10) mio m3/y
of which delivered to:
! 6 Households mio m3/y
7 Agriculture, forestry and fishing (ISIC 01-05) mio m3/y
8 Manufacturing (ISIC 15-37) mio m3/y
9 Electricity industry (ISIC 40) mio m3/y
10 Other economic activities mio m3/y
Population supplied by water supply industry (ISIC 41)
! 11 Population supplied by water supply industry (ISIC 41) %
Notes:
Table W4: Water Supply Industry (ISIC 41)
* This table covers water supplied by water supply industries, whether under public or under private control. It corresponds to what was called public water supply in previous questionnaires.
UNSD/UNEP Questionnaire 2006 on Environment Statistics - Water Section - p.19
Section: WATER
Footnotes
Code Footnote text
UNSD/UNEP Questionnaire 2006 on Environment Statistics - Water Section - p.20
Section: WATER
Country: Contact person: Tel:Contact institution: E-mail: Fax:
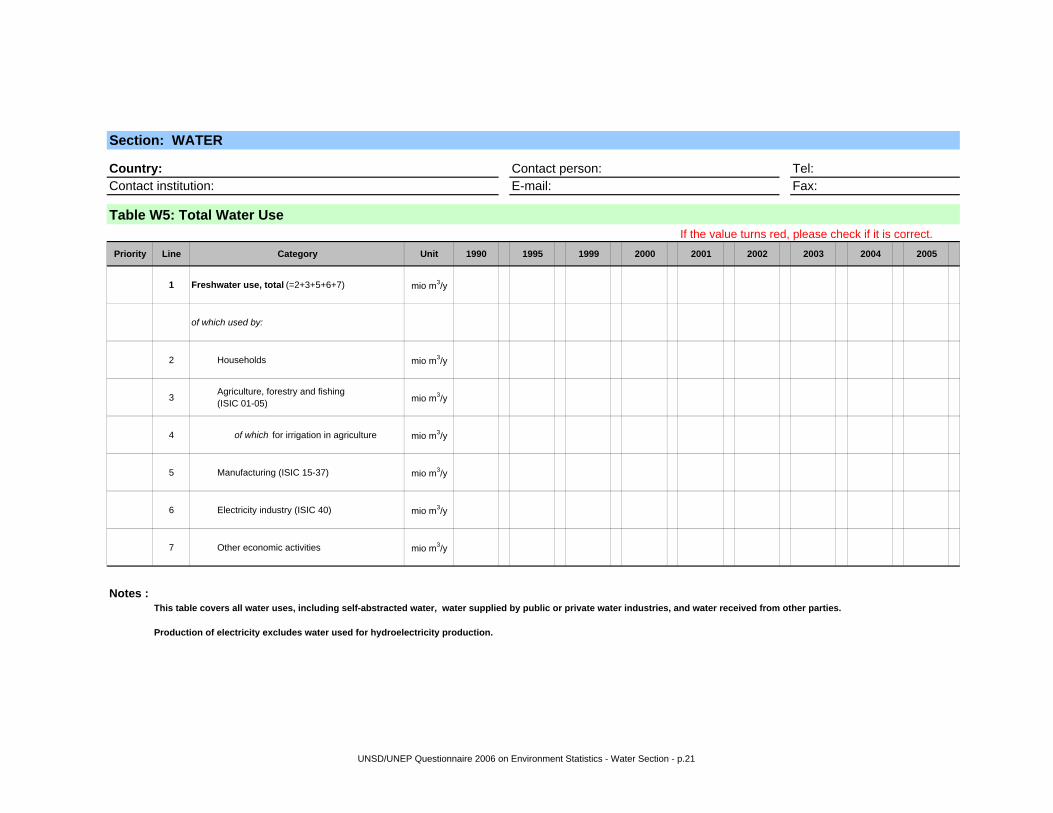
If the value turns red, please check if it is correct.Priority Line Category Unit 1990 1995 1999 2000 2001 2002 2003 2004 2005
1 Freshwater use, total (=2+3+5+6+7) mio m3/y
of which used by:
2 Households mio m3/y
3 Agriculture, forestry and fishing (ISIC 01-05) mio m3/y
4 of which for irrigation in agriculture mio m3/y
5 Manufacturing (ISIC 15-37) mio m3/y
6 Electricity industry (ISIC 40) mio m3/y
7 Other economic activities mio m3/y
Notes :
Table W5: Total Water Use
This table covers all water uses, including self-abstracted water, water supplied by public or private water industries, and water received from other parties.
Production of electricity excludes water used for hydroelectricity production.
UNSD/UNEP Questionnaire 2006 on Environment Statistics - Water Section - p.21
Section: WATER
Footnotes
Code Footnote text
UNSD/UNEP Questionnaire 2006 on Environment Statistics - Water Section - p.22
Section: WATER
Country: Contact person: Tel:Contact institution: E-mail: Fax:
If the value turns red, please check if it is correct.Priority Line Category Unit 1990 1995 1999 2000 2001 2002 2003 2004 2005
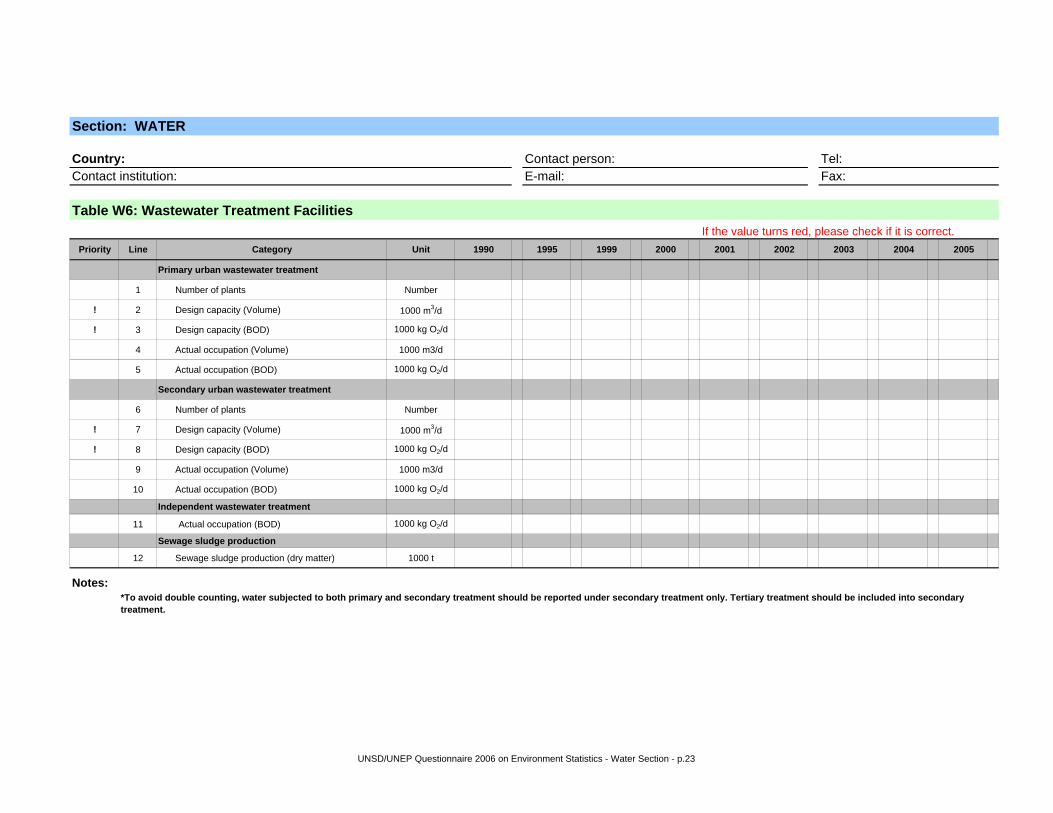
Primary urban wastewater treatment
1 Number of plants Number
! 2 Design capacity (Volume) 1000 m3/d
! 3 Design capacity (BOD) 1000 kg O2/d
4 Actual occupation (Volume) 1000 m3/d
5 Actual occupation (BOD) 1000 kg O2/d
Secondary urban wastewater treatment
6 Number of plants Number
! 7 Design capacity (Volume) 1000 m3/d
! 8 Design capacity (BOD) 1000 kg O2/d
9 Actual occupation (Volume) 1000 m3/d
10 Actual occupation (BOD) 1000 kg O2/d
Independent wastewater treatment
11 Actual occupation (BOD) 1000 kg O2/d
Sewage sludge production
12 Sewage sludge production (dry matter) 1000 t
Notes:
Table W6: Wastewater Treatment Facilities
*To avoid double counting, water subjected to both primary and secondary treatment should be reported under secondary treatment only. Tertiary treatment should be included into secondary treatment.
UNSD/UNEP Questionnaire 2006 on Environment Statistics - Water Section - p.23
Section: WATER
Footnotes
Code Footnote text
UNSD/UNEP Questionnaire 2006 on Environment Statistics - Water Section - p.24
Section: WATER
Country: Contact person: Tel:Contact institution: E-mail: Fax:
If the value turns red, please check if it is correct.
Priority Line Category Unit 1990 1995 1999 2000 2001 2002 2003 2004 2005
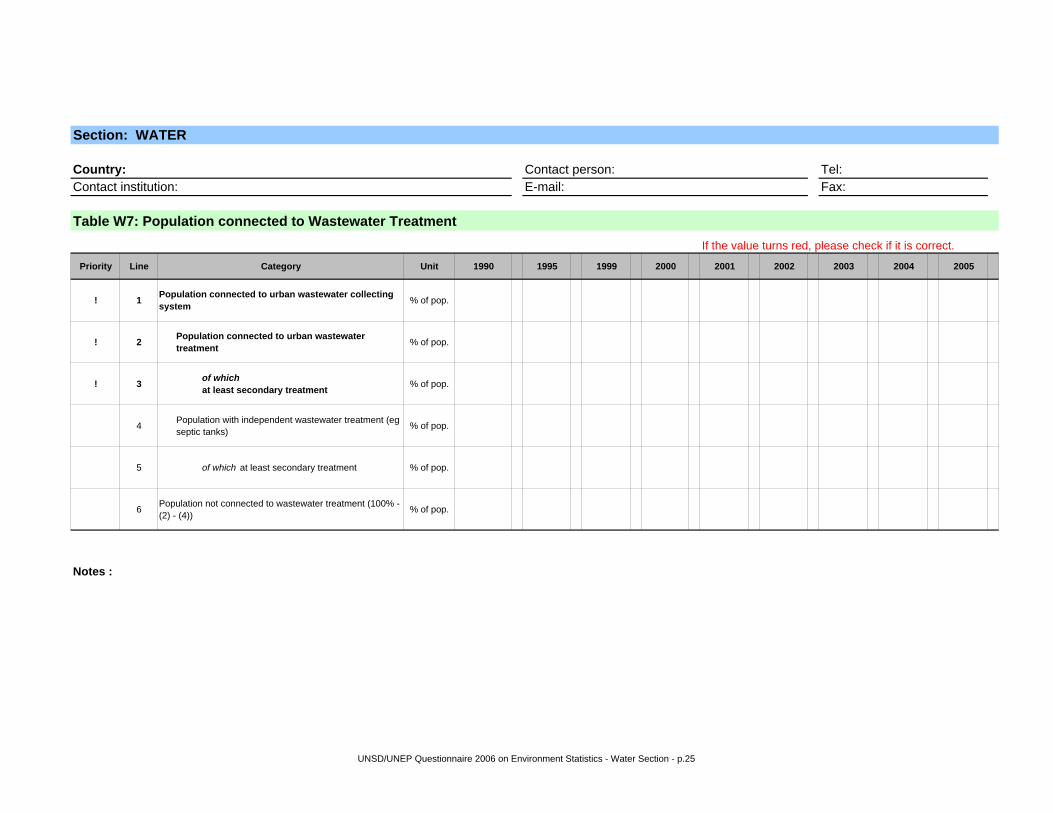
! 1 Population connected to urban wastewater collecting system % of pop.
! 2 Population connected to urban wastewater treatment % of pop.
! 3 of which at least secondary treatment % of pop.
4 Population with independent wastewater treatment (eg septic tanks) % of pop.
5 of which at least secondary treatment % of pop.
6 Population not connected to wastewater treatment (100% - (2) - (4)) % of pop.
Notes :
Table W7: Population connected to Wastewater Treatment
UNSD/UNEP Questionnaire 2006 on Environment Statistics - Water Section - p.25

Section: WATER
Footnotes
Code Footnote text
UNSD/UNEP Questionnaire 2006 on Environment Statistics - Water Section - p.26
Section: WATER
Country: Contact person: Tel:Contact institution: E-mail: Fax:
Table W8: Supplementary Information Sheet
(Calculation method used for various inflows and outflows; the reference period covered in the long-term annual averages; the methodology used for estimating evapotranspiration etc.)
UNSD/UNEP Questionnaire 2006 on Environment Statistics - Water Section - p.27