Embed Size (px)
Citation preview
SOURCES, EFFECTS AND RISKS
OF IONIZING RADIATION United Nations Scientific Committee on the Effects
of Atomic Radiation 1988 Report to the General Assembly, with annexes
UNITED NATIONS New York, 1988

NOTE
The report of the Committee without its annexes appears as Official Records of the General Assembly, Forty-third Session, Supplement No. 45 (A/43/45).
The designations employed and the presentation of material in this publication do not imply the expression of any opinion whatsoever on the part of the Secretariat of the United Nations concerning the legal status of any country, territory, city or area. or of its authorities, or concerning the delimitation of its frontiers o r boundaries.
UNITED NATIONS PUBLICATION Sales No. E.88.IX.7 ISBN 92-1- 142143-8
09000P

ANNEX A
Exposures from natural sources of radiation
C O N T E N T S
Paragraphs
INTRODUCTION ....................... 1-6
I . NATURAL SOURCES O F RADIA- TION ............................. 7-82
.................... A . Cosmic rays 13-25 1 . External irradiation .......... 14-24
(a) Ionizing component ..... 15-17 ..... (b) Neutron component 18-19
(c) Distribution of doses .... 20-21 (d) Elevated exposures ...... 22-24
.......... 2 . Internal irradiation 25
B . Terrestrial sources of radiation .... 26-80 .......... 1 . External irradiation
(a) Exposure outdoors ...... (b) Exposure indoors ....... (c) Annual effective dose equi-
valents from gamma ter- restrial radiation ........
2 . Internal irradiation .......... ........... (a) Potassium-40
(b) Rubidium-87 ........... (c) Uranium-238 series ......
...... (d) Thorium-232 series
...................... C . Summary 81-82
I1 . RADON-222 AND ITS SHORT-LIVED ............... DECAY PRODUCTS 83-169
........... A . Outdoor concentrations 85-93
........... B . Indoor concentrations 1 . Sources of indoor radon ......
(a) Underlying soil ......... (b) Building materials .......
............ (c) Outdoor air ................. (d) Water
............ (e) Natural gas (f) Summary ..............
2 . Indoor behaviour of radon and radon daughters ............. (a) Radon .................
Paragraphs
... (b) Radon decay products 128-138 3 . Results of indoor surveys ..... 139- 14 1
....... . C Exposure-dose relationships 142- 162 .................. . I lnhalation 142-159
(a) Relationships from the UNSCEAR 1982 Report 142-149
(b) Consideration of other ............ information 150- 158
............. (c) Conclusion 159 . ................... 2 Ingestion 160-161 . .................. 3 Summary 162
D . Doses ......................... 163-169
......... . 111 INDUSTRIAL ACTIVITIES
...... . A Energy production from coal ................ . I Coal mining
................. . 2 Use of coal (a) Coal-fired power plants (b) Domestic use ........... (c) Coke ovens ............
3 . Use of fuel ash .............. 4 . Summary ..................
B . Other energy production .......... I . Geothermal energy .......... 2 . Oil-fired power plants ........ 3 . Natural gas ................. 4 . Peat ........................
.................. . 5 Summary
C . Use of phosphate rock ............ 1 . Effluent discharges during phos-
phate industrial operations ... 2 . Use of phosphate fertilizers ... 3 . Use of by-products and wastes 4 . Summary ..................
D . Non-uranium ore mining and pro- cessing ........................ 1 . Occupational exposures from
non-uranium mining .........

Paragraphs
2. Occupational exposures from factory processes ............ 255-260 (a) Processing of raw ilmenite 256 (b) Industrial use of zircon
sand .................. 257-260 3. Exposures of members of the
public ................. 261 -274 (a) Zinc mining and proces-
sing.. ................. 262-263 (b) Fireclay mine and refrac-
............ tory plant.. 264 (c) Aluminium ore processing 265-268
Introduction
1. The major contribution to the various radiation exposures received by mankind comes from natural sources. These include external sources, such as cosmic rays and radioactive substances in the ground and in building materials, and internal sources result- ing from the inhalation and ingestion of naturally occurring substances in air and diet. One characteristic of natural irradiation is that it has been experienced by the whole population of the world at a relatively constant rate over a long period of time.
2. Exposures from natural sources of radiation have been reviewed by the Committee in its 1958. 1962, 1966, 1972. 1977 and 1982 Reports. Since such exposures d o not. to a large extent,vary with time, the changes in the estimates of doses in successive Reports have reflected greater knowledge in the field of natural radiation, including wider surveys of the levels of radioactive materials in the environment and in human tissues, as well as changes in the dosimetric models and quantities used.
3. The Committee has repeatedly reviewed the ex- posures from natural sources of radiation for a number of reasons including: (a) natural background radiation represents a substantial fraction of the total radiation exposure of most individuals and is generally the most important source of radiation; (b) the knowledge of the doses from natural background is necessary as a basis for comparison with man-made sources of exposure: (c) some exposures vary substan- tially according to human practices and some of [be natural sources of radiation may be easily control- lable; and (d) outing to the large variability of doses from natural sources of radiation, some individual doses may be high enough to warrant the introduction of remedial measures.
4. The purpose of this Annex is to update informa- tion on exposures to all sources of natural radiation. The range of activity concentrations of natural radio- nuclides and the range of exposures of people can be very wide. The discussion in this Annex is focused on the exposures associated with the higher portions of the observed distribution, i.e.. with elevated levels of radiation or of radioactive materials. These can
Paragraphs
(d) Copper ore mining and processing ............. 269-271
(e) Lead ore processing ..... 272-273 (f) Other metal and non-metal
mining ................ 274
....................... IV. SUMMARY 275-276
Pages
To bles ................................. 95
References .............................. 123
sometimes be identified in a comparison with the world average value of the parameter being considered. for example. a comparison of the external dose rate from cosmic radiation at a high altitude with the average at sea level; in some instances it may be more appropriate to consider the average for a country o r geographical region; for example, radon concentra- tions in air indoors in a part of a country compared with the average for that country.
5. Both occupational exposures and exposures of members of the public are considered. Not considered is any type of exposure arising from a technological activity expressly designed to make use of the nuclear or radioactive properties of a substance, such as exposures to consumer products containing naturally occurring radionuclides or exposures due to uranium mining and milling. The latter, however. are dealt with in Annex B, "Exposures from nuclear power produc- tion".
6 . The first chapter presents an overview of the natural sources of radiation and indicates the changes that have been made since the UNSCEAR 1982 Report. Chapter I1 presents a discussion of the doses resulting from the inhalation of radon and its decay products, which constitute the most important exposure from natural sources of radiation. In chapter 111, exposures resulting from industrial activities are con- sidered in depth.
I . NATURAL SOURCES OF RADIATIOK
7. Natural radiation sources are classified into two categories: (a) External sources of extraterrestrial origin, i.e., cosmic radiation, and radiation of terrestrial origin, i.e.. the radioactive nuclides present in the crust of the earth, in building materials and in air; (b) Internal sources, comprising the naturally occurring radionuclides that are taken into the human body.
8. Table 1 summarizes the contributions of natural sources to the radiation exposure of human popula- tions living in areas of normal radiation background. The mean annual effective dose equivalent is estimated to be 2.4 mSv. This refers to exposures of adults in the populations.

9. Some of the contributions to the total exDosure to natural radiation background are quite constant in space and time and practically independent of human practices and activities. This is true for doses from ingestion of 'OK. which is homeostatically controlled, and for doses from inhalation and ingestion of cosmogenic radionuclides, as such radioactive mate- rials are to a first approximation homogeneously distributed over the surface of the globe. At the other end of the spectrum are exposures that depend strongly on human activities and practices and present a wide variability. Doses from indoor inhalation of radon and thoron decay products are typical: building design and practices. as well as the choice of building materials and of ventilation systems, influence indoor levels, thus implying a variation with time of the doses from radon as the techniques and practices evolve. Variability from one dwelling to another also stems from the wide range of radon entry rates from soil, which are to a large extent still unpredictable. In between those extreme types of exposures are several other types: (a) external doses from cosmic rays which, though affected by human practices and quite predictable, cannot be controlled except by moving to a n area with a lower dose level; (b) doses from inhalation and ingestion of long-lived nuclides of the 23sU and ?"Th decay series, which represent a small contribution to the total dose from natural sources and which are relatively constant in space: (c) doses from external irradiation by terrestrial sources, which are also significantly altered by human activities and practices, especially through indoor exposure. Such doses, however. are, as a rule, smaller than those from inhalation of radon decay products and much less variable.
10. In comparison to the estimates given in the UNSCEAR 1982 Report. several changes have been made: ( a ) with respect to external exposures to cosmic radiation, the new estimates of the annual effective dose equivalents take into account the geographical distribution of the world population as a function of altitude and the shielding effect of building materials. As a result. the new estimates of the annual effective dose equivalents due to the ionizing and neutron components are higher by 20 /IS\. and 30 pSv. respec- tively; (b) regarding external exposure to terrestrial sources of radiation, the annual effective dose equi- valents hat'e been re-evaluated and increased by 60pSv. as a result of better knowledge of the indoor gamma absorbed doses in air; (c) annual effective dose equivalents from internal exposure to primordial radionuclides have been reassessed slightly downwards for the "'U and ?l0Pb series, as well as for the decay products of ??ORn, whereas those for the short-lived decay products of ?::Rn have been increased by about 300 pSv on the basis of more comprehensive results of' nation-wide indoor surveys. The net effect of these corrections is a 20% increase in the estimate of the overall annual effective dose equivalent from natural sources of radiation. The various contributions to the annual effective dose equivalent are discussed in more detail in this chapter. As in the previous reports of the Committee, the estimates of exposures from natural sources of radiation are essentially based on measure- ments in temperate latitudes, and on dietary and living
habits also of the populations in these regions. It is recognized that exposures to populations in tropical latitudes may differ substantially from those in tem- perate latitudes, because of differences in environ- mental concentrations, and also in living and dietary habits. An effort has been made to estimate the exposures to populations in tropical latitudes, but the data base available is too small to enable a good assessment to be made.
11. Table 1 shows clearly the magnitude of the inhalation of IZZRn and its short-lived decay products, a topic discussed extensively in chapter 11.
12. Esposures resulting from industrial activities that bring to the surface of the earth, or make available to the public, materials with enhanced concentrations of naturally occurring radionuclides do not significantly alter the picture presented in Table 1. These exposures, which may to a large extent be controlled, are dealt ui th in chapter 111.
A. COSMIC RAYS
13. The high-energy radiation that enters the earth's atmosphere from outer space is known as primary cosmic rays. Upon interaction with the nuclei of atoms present in the air, neutrons, protons, pions a n d kaons (secondary cosmic rays) are produced, as well as a variety of reaction products (cosmogenic nuclides) such as 'H. 'Be, I0Be, I4C, 22Na and 24Na. The high- energy secondary cosmic rays thus formed react further with nuclei in the air to form more secondary particles (electrons and muons).
1. External irradiation
14. The doses from directly ionizing components of cosmic rays and from neutrons are examined separately.
(a) Ionizing componen 1
15. In the lower atmosphere. the dose rates in air due to the ionizing component vary little with latitude but significantly with altitude. doubling approximately every 1.500 metres. Figure I shows the variation of absorbed dose rates in air, as derived from ionization chamber measurements aboard aircraft. for low and high latitudes and altitudes ranging from 0 to 12 km [HlO]. Dose rates in air are about 30 nGy h- ' at sea level for any latitude and increase to about 4 p G y h-' at an altitude of 12 km and high latitudes [H 101.
16. The majority of the world's population lives at altitudes close to sea level. In the UNSCEAR 1982 Report (Annex B, paragraph lo), the absorbed dose rate in outdoor air from the ionizing component of cosmic rays was estimated to be 32 nGy h-'; this value is taken to be numerically equal to the effective dose equivalent. Indoors, the doses are somewhat lower because of the shielding effect of building structures. Dose rates measured at the centre of various le\uels of

Figure I. Absorbed dose rates In air as a function of altitude and geomagnetic latitude.
[HI01
5000-
a 12-storey building showed a fairly smooth decline with depth, i.e., from the top storey down to the basement of the building (Table 2) [M9]. The marked change from the roof to the twelfth floor (65%' transmission) was because of the filtering out of the relatively soft component of the cosmic-ray flux at sea level. The value of the remaining hard component
decreased more slowly with depth. These measure- ments. however, which were made in a massive building. are not representative of the average situa-
(6) Neutron component
tion. A shielding factor of about 0.85 has been reported in the case of a 0.2 m thick concrete layer
2000- [L6]. In the Netherlands, the following shielding factors for cosmic rays were determined [J17]: 0.82 for single homes with wooden ceilings: 0.76 for row
1000- houses and office buildings with wooden ceilings and floors: 0.50 for dwellings of any kind with concrete ceilings and floors; 0.42 for apartment buildings.
500 - Somewhat higher values, varying according to the floor number, were obtained in the Soviet Union [FIO]: 0.81-0.96 in wooden houses; 0.72-0.92 in old stone buildings; 0.54-0.86 in modern buildings. A
200 - mean shielding factor of 0.8 is assumed in this Annex. A - High latitudes The average indoor absorbed dose index rate at sea B - Low latitudes level is thus estimated to be about 26 nGy h-'.
100 - 17. Using a value of one for the quality factor of the
50 - ionizing component of cosmic rays and an indoor occupancy factor of 0.8, the annual effective dose
30 - equivalent is estimated to be about 240pSv at sea I I I I I I level. The doses received by populations living above
0 3 6 9 12 15 18 sea level are higher: they are discussed later in this
ALTITUDE (km) section.
18. The variation with altitude and latitude of the neutron component is similar to that of the ionizing component (see Figure 11). At sea level. the neutron fluence rate is about 0.008 cm-' s-I [HIO, H 1 I]. On the basis of measurements of neutron energy spectra carried out in New York City in 1986 during a sis- month experiment, Hajnal [H 151 calculated an average absorbed dose rate of 0.8 nGy h-' and a dose equi- valent rate of 3 nSv h-' for neutrons incident isotropi-
1 - Tota l
---- Charged particles --...... Neutrons
0 ' 1 2 3 4 5 6
ALTITUDE (km)
Figure I I . Varlatlon of the annual eftective dore equivalent from the ionizing component and the neutron component of cosmic mdlatlon as a function of altitude.
( B a d on [B38])

cally on both sides of a 30 cm thick tissue-equivalent slab. This translates into a quality factor of 3.8. In Japan. Nakamura et al. [N20] also derived from measured neutron energy spectra a dose equivalent rate of 3.3 nSv h-l. which is an overestimate of the effective dose equivalent rate, as it was determined using the conversion factors from flux density to maximum dose equivalent given in ICRP Publication 21 [I 141. Nakamura et al. [N20] also indicated that the calculated spectra of O'Brien led to values of 2.2 nSv h-' a t the surface of a 30 cm body phantom and of 1.4 nSv h-' on average over the phantom. These figures are consistent with the estimate of 2.4 nSv h-I that was used in the UNSCEAR 1982 Report and reflect the variability associated with the choice of geometry used to calculate the effective dose equi- valent. Neglecting the shielding effect of building structures, the annual effective dose equivalent for the neutron component is estimated to be about 20 pSv at sea level.
19. On the basis of radiobiological considerations, the ICRP issued in 1985 an interim recommendation according to which the value of the quality factor for neutrons was to be increased by a factor of 2 [I12]. This recommendation, however, has not been followed in most countries and has not been confirmed by the ICRP. The value of the quality factor for neutrons has not been modified in this report.
(c) Disrriburion of doses
20. The distribution of the effective dose equivalent from cosmic radiation over the globe was estimated by Bouville and Lowder [B38] using tabulated data on terrain heights on a 1" by l o grid [G22], combined with population data [UT]. On the basis of information in [L14]. [03], [N20] and [H15], the variation of the annual effective dose equivalent from the ionizing
component H,, in pSv, as a function of altitude z (km) was expressed as
k , ( z ) = ~ ~ ( 0 ) [0.205 exp (-1.6492) + 0.795 exp (+0.45282)] (1.1)
and, for the neutron component H ~ . as
H,(z) = ~ ~ ( 0 ) exp (1.042) (1.2)
for z < 2 km, and as
H,(z) = ~ ~ ( 0 ) r1.98 exp (0.698z)I (1.3)
for z > 2 km. The value used in [B38]for ~ ~ ( 0 ) is similar to the figure of 240 pSv a-ladopted in this Annex, while the value for H,(o) is the same.
21. For the purpose of this Annex. the distribution of the effective dose equivalent from cosmic radiation over the globe was recalculated. using the annual sea-level effective dose equivalents of 240pSv for the ionizing component and 20pSv for the neutron component. ~ i ~ ~ r e I1 shows th; variation of the annual effective dose equivalent with altitude obtained from equations (1.1), (1.2) and (1.3). It is worth noting that the dose equivalent from the neutron component, which is small at sea level. increases more rapidly than the dose equivalent from the ionizing component and becomes more important a t altitudes above 6 km. The distribu- tion of the collective effective dose equivalent as a function of altitude. presented in Figure 111, indicates that although about one half of the collective dose equivalent is received by people living at altitudes below 0.5 km, a contribution to the collective dose equivalent of about 10% is received by populations living at altitudes above 3 km. There are large countries with mountains and sea borders, like the Soviet Union and the United States, where the population-weighted dose from cosmic rays differs only slightly from the dose at sea level because the bulk of the population in each of
ALTITUDE (km)
Figure Ill. Dlrtrlbutlon of the collective etfectlve dose equivalent from cormlc radlatlon as a functlon of altltude.
(Based on [B38])

those countries lives at low altitudes [FIO, 0121. In countries like Ethiopia, Islamic Republic of Iran, Kenya or Mexico, however, large cities are situated on elevated plateaux, accounting for relatively high ex- posures. Figure IV presents the distribution of the collective dose equivalent and the variation of the per caput dose equivalent as a function of latitude. The population of the northern hemisphere accounts for about 90% of the total collective effective dose equi- valent. The per caput effective dose equivalent for the world's population is found to be 355pSv, the ionizing and neutron components contributing about 300 and 55 pSv, respectively.
(d) Elevaled exposures
22. Elevated exposures result from prolonged presence at high altitudes. Populations living in high-altitude cities like Bogoti, Lhasa or Quito receive annual effective dose equivalents from cosmic radiation in excess of 1 mSv. Passengers and crew members aboard commercial aircraft are exposed to much higher dose rates. which vary according to the flight altitude and, to a smaller extent. the latitude and solar activity. Assuming that the average altitude of commercial subsonic flights is 8 km, the average dose equivalent rate would be about 2pSv h - ' from equations (1.1) and (1.3). the neutron component contributingabout 60% of the total. Taking the annual number of hours spent flying by crew members to be 600 h, the corresponding annual effective dose equivalent is about 1 mSv. A small fraction of commercial transport is conducted with supersonic aircraft, which fly at an altitude of about 15 km. Dose equivalent rates received during supersonic transport have been reported to be about 1 1 pSv h-' on average for French aeroplanes [S64] and about 9pSv h-'
on average for British aeroplanes, with a maximum of around 40pSv h-' [P14]. Annual dose equivalents received by the technical and cabin crew for the period 1979-1983 were on average about 2.5 mSv. with possible maxima of I5 mSv [P14]. For a given flight. doses received by passengers are about the same as in subsonic flights since the higher dose rates incurred during a supersonic flight are compensated for by the shorter travel time.
23. Using statistical data on air transportation, the collective dose equivalents incurred by the passenger and flight personnel of civil aviation may be estimated. The number of passenger kilometres flown in 1984. excluding Chinese airlines, was 1.3 lo'? [I1 51. Assuming an average speed of 600 km h-' at an altitude of 8 km and an effective dose equivalent rate of 2pSv h-I at that altitude, the annual collective dose equivalent is found to be 4.300 man Sv. Published estimates [Vl, W17] are 3.500 man Sv for the world population and no more than 1.600 man Sv for flights in the United States, while the collective dose equivalent to the flight crews would be up to 65 man Sv. Taking the ratio of the annual collective dose equivalent to the passengers and to the flight crews in the United States as a guide. the annual collective dose equivalent for the flight crews of the world would be about 170 man Sv.
24. While travelling in space. astronauts are subjected to primary cosmic-ray particles, radiation from solar flares and the intense radiation present in the two radiation belts. Radiation doses received by astronauts represent one of the most important constraints to long-term manned space activities [B17]. Reported dose equivalents (assumed to be effective dose equi- valents) to astronauts from recent United States
NORTH SOUTH
LATITJDE
Figure IV. Dlslrlbulion of the annual effective dose equivalent from cosmic radlatlon as a lunction of latitude.
(Based on [B38])

manned space missions range from 0.5 to 5 mSv [B18]. Similar information is available for Soviet missions [Vl]. In a majority of cases, individual effective dose equivalents did not exceed 5 mSv per flight; however. for prolonged orbital flights, i.e.. those lasting longer than one month. the effective dose equivalent exceeded 10 mSv and reached 55 mSv for expedition IV on board Salut-6, which lasted 175 days rv11.
2. Internal irradiation
25. A large number of cosmogenic radionuciides are produced in the stratosphere and upper troposphere by the interaction of cosmic rays with the nuclei of atoms present in the air (e.g.. nitrogen. oxygen and argon). The production and distribution of these nuclides in the environment was reviewed by the Committee in the UNSCEAR 1977 Report [U?]. Only four cosmogenic radionuclides ('H, ''C, 'Be and '2Na) are of importance from the viewpoint of radiation doses to man. Together they deliver annual doses from internal irradiation ranging from 5 to 25 pGy in the various organs and tissues of interest. The annual effective dose equivalents are estimated to be 0.01 pSv for 'H, 3 ~ S V for 'Be, 12 pSv for I4C and 0.2 pSv for "&a. Because of the relative homogeneity of the cosmic-ray flus over the earth's surface, the variability of the annual doses from the cosmogenic radionuclides is expected to be low.
B. TERRESTRIAL SOURCES O F RADIATION
26. Terrestrial sources of radiation are the very long- lived radionuclides that have existed within the earth since its formation several billion years ago and have not substantially decayed. The most important of these so-called primordial radionuclides are 'OK (half- life = 1.28 lo9 a), "Rb (half-life = 4.7 1010 a). "'U (half-life = 4.47 lo9 a ) and ?':Th (half-life = 1.41 loL0 a). 238U and ?'-Th head series of 14 and 1 1 significant radionuclides, respectively. (Figures V and VI) that also contribute to the doses from terrestrial sources. Other radionuclides, such as those present in the 235U decay series, have been neglected, as they contribute little to the total dose from natural background.
27. The ubiquitous presence of the primordial radio- nuclides and of their decay products in the environ- ment (air. water, soil, rocks, foodstuffs) and in humans results in external and internal radiation doses.
1. External irradiation
(a) E.~posure outdoors
28. Activity mass concentrations of primordial radio- nuclides in rocks are usually higher in igneous rocks than in sedimentary ones, while metamorphic rocks have concentrations typical of the rocks from which they are derived. There are. however, exceptions, a s
Figure V. Uranium-238 decay series. [I101
t 2 1 8 ~ ~
(3.05 min)
2 1 4 ~ 0 2 1 0 ~ o
a 2148i
2 1 4 ~ b
(26.8 min)
2 0 6 ~ b
(22.3 a ) (stable)

Figure VI. Thorium-232 decay series. r i l a l
certain sedimentary rocks, notably some shales and phosphate rocks, are highly active. The activity mass concentrations in soil, which are directly relevant to outdoor exposure, are thought to be largely determined by the activity mass concentrations in the source rock. The average activity mass concentrations of 40K, 233U and Z3ZTh in soil and the corresponding absorbed dose rates in air 1 m above the ground surface are given in Table 3 [B32]: the calculations are for a soil density of 1.6 g cm-' and a water content of 10% and are based on the assumption that all decay products of 238U and 232Th are in radioactive equilibrium with their precur- sors. The average outdoor terrestrial absorbed dose rate in air from gamma-radiation I m above the ground surface is 44 nGy h-I. The results of a large soil sampling programme recently carried out in the United States are in fairly good agreement with the activity concentrations given in Table 3 [M 101.
29. Large-scale surveys, using different methods and types of instrumentation, have been or are being carried out in a number of countries in order to estimate average nation-wide exposures to outdoor external gamma-radiation. The results for 23 countries or areas, representing about one half of the world population, are summarized in Table 4. Country- averaged outdoor absorbed dose rates in air are found to range between 24 and 85 nGy h-I, with an arith- metic mean of 55 nGy h-'.
30. It is to be noted that the two most populated countries in the world, China and India, have recently published the results of extensive surveys. In China, about 40,000 outdoor measurements were carried out
by the Ministry of Public Health from 1981 to 1985, using sodium iodide crystals and ionization chambers in 21 provinces, five autonomous regions and the cities of Beijing, Tianjin and Shanghai. Detailed preliminary results are found in a special issue of the Chinese Journal of Radiological Medicine and Protec- tion [C19] and a summary has been prepared by Wang Qiliang et al. [W21]. Population-weighted means of the absorbed dose rates in air are presented in Table 5: the value for the country as a whole is reported to be about 80 nGy h-I, which is in the upper range of the levels observed in the world. These results led to a large soil-sampling programme that showed that the average concentrations of 40K, 238U and 232Th in soil in China are indeed higher than the estimates by UNSCEAR of the world averages by a factor of about 2 [W21]. Independent survey programmes of outdoor gamma-radiation have also been undertaken in China by the National Environmental Protection Agency [L18] and by the Ministry of Nuclear Industry [G29]. A comparison of the results obtained for the same areas [P22] shows discrepancies that may have arisen from the energy dependence of the various types of dosimeters used in the surveys and from the estimation of the cosmic-ray dose rates which were subtracted from the readings. The average absorbed dose rates in air in the cities, provinces and auto- nomous regions investigated by the Ministry of Public Health [W21] were found to be lower than those measured by the National Environmental Protection Agency and the Ministry of Nuclear Industry. the relative differences ranging from 11% to 63% [P22]. Since the survey of the Ministry of Public Health is the only one completed at the time of publication of
this Annex, its results have been incorporated without modification; however, it should be kept in mind that the gamma doses for China may be revised in the near future.
31. In India, 214 locations scattered all over the country were monitored with thermoluminescent dosi- meters. The national mean value of the outdoor absorbed dose rate in air due to natural radiation (terrestrial sources of radiation and cosmic radiation) is estimated to be 785pGy a-I [N19]. Assuming a mean dose rate from cosmic rays of 300 pGy a-I yields an average absorbed dose rate in air from the terrestrial component of 55 nGy h-I.
32. In the UNSCEAR 1977 Report [U2]. the Com- mittee adopted a value of 50 nGy h-I for the popula- tion-weighted average absorbed dose rate in air over the world and estimated that 95% of the world's population residing in areas of usual naturai radiation live where the outdoor absorbed dose rate in air from the primordial radionuclides lies between 30 and 70 nGy h-I. As shown in Table 4, the available data base is currently much larger than i t was in 1977. The population-weighted average absorbed dose rate in air for the countries in Table 4 is 63 nGy h-I. This is likely to be an overestimate because of the probable bias in the Chinese measurements. When the Chinese data are not taken into account. the population- weighted average absorbed dose rate in air is reduced to 53 nGy h-I. An intermediate figure of 55 nGy h-' is adopted in this Annex as the mean absorbed dose rate in air outdoor from terrestrial sources of radiation.
33. There are regions in the world where the usual range of variation of outdoor terrestrial radiation doses is substantially exceeded. The best documented of those regions are in Brazil and India. In the coastal areas of Kerala and Tamil Nadu in India, there are patches of sand containing monazite with thorium concentrations ranging between 8% and 10.5% by weight. The absorbed dose rates in air in the high radiation areas of Kerala vary between 150 and 1,000 nGy h-I; in Tamil Nadu, these may reach about 6,000 nGy h-I [S69]. I n Brazil, outdoor absorbed dose rates of 130-1.200, 220-4,200 and 110-1,000 nGy h-' were measured in Guarapari, Meaipe and P o ~ o s de Caldas, respectively [P24].
(6) Exposure indoors
34. Knowledge of radiation levels in buildings is important in the assessment of population exposures, as most individuals spend a large amount of time indoors. Large-scale surveys of indoor exposures to gamma external radiation have recently been conducted in several European countries as well as in China; the results are summarized in Table 6. An estimation of the world distribution of exposures may be derived from the results presented in Table 6 or, as in previous UNSCEAR Reports. from the indoor-to-outdoor ratios.
35. Estimates of average indoor absorbed dose rates in air are between 23 and 120 nGy h-', most values being in the narrow range of 60-95 nGy h-I (Table 6). The arithmetic mean is about 70 nGy h-'. The popula-
tion-weighted mean for all countries except China is 72 nGy h-' and becomes 110 nGy h-I if China is included.
36. In previous UNSCEAR Reports, use was made of the indoor-to-outdoor ratio, under the assumption that the relationship between the indoor and the outdoor absorbed dose rates depends essentially on the type of building materials used and their origin. If the building materials are of local origin, it may be expected that the value of the indoor-to-outdoor ratio of the absorbed dose rates in air lies between 1 and 7,. because of the change in source geometn and the presence of doors and windows. Calculations taking into account the thickness and the dimensions of the walls yield ratios of 1.35 for typical brick dwellings and 1.48 for concrete buildings [Kl I].
37. Country-averaged indoor-to-outdoor ratios. derived from the results presented in Tables 4 and 6. range from 0.8 to 2.0. with an average of 1.3. This figure, combined with an average outdoor absorbed dose rate in air of 55 nGy h-I. yields an average indoor absorbed dose rate in air of 72 nGy h-I, in close agreement with some of the values obtained by the first method. In this Annex, the mean indoor absorbed dose rate in air from terrestrial sources of radiation is taken to be 70 nGy h-l.
38. Elevated external dose rates indoors may arise from high concentrations of natural radionuclides in building materials. These building materials may be of natural origin (concrete based on alum shale, granite, lithoid tuff) or result from industrial processes (phosphogypsum, red mud). As discussed in the UNSCEAR 1982 Report, the resulting exposures, calculated with pessimistic assumptions, range between 100 and 2.000 nGy h-I.
(c) Annual effective dose equivalents from gamma terresrrial radiarion
39. The value of the quotient of effective dose equivalent rate to absorbed dose rate in air is taken, as in the UNSCEAR 1982 Report. to be 0.7 Sv per Gy for environmental exposures to gamma rays of moderate energy. This value is assumed to apply equally to males and females and to the indoor and outdoor environ- ments. Taking the outdoor occupancy factor to be 0.2, the annual effective dose equivalent from outdoor terrestrial gamma-radiation is found to be
55 (nGy h-I) X 0.7 (Sv Gy-I) X 8,760 (h a-I) x 0.2 = 70 pSv
For indoor exposure, using an occupancy factor of 0.8, the annual effective dose equivalent is
70 (nGy h-') X 0.7 (Sv Gy-') X 8,760 (h a-') X 0.8 = 340 pSv
40. The total (outdoor plus indoor) annual effective dose equivalent from terrestrial radiation, averaged over the world's population, is 410pSv. Using the information presented in Table 3 as a guide, the contributions of 'OK and the radionuclides of the 238U and 232Th decay series to the total annual effective dose equivalent from gamma terrestrial radiation would be 150, 100 and 160 pSv, respectively.

2. Internal irradiation (i) Uranium-238 subseries (23BU, 234Th, U4mPa, UIU)
41. Inhalation and ingestion of naturally occurring radionuclides give rise to internal irradiation. As in the previous reports of the Committee, the absorbed doses and effective dose equivalents are derived from measured tissue concentrations, in so far as such data are available.
(a) Porassium-40
42. Potassium is an essential element that is under close homeostatic control in the body. The average mass concentration for an adult male is about 2 g of potassium per kg of body weight [A4, K123. The isotopic ratio of 'OK is 1.18 lo-' and the average activity mass concentration of 40K in the body is about 60 Bq kg-'. The distribution of potassium in various tissues and organs of the body [Kl2] has been used to determine the concentrations of 40K in those tissues and organs and the corresponding absorbed dose rates. The highest annual absorbed dose (270pGy) is received in red bone marrow and the lowest in the thyroid (100pGy). The annual effective dose equi- valent is estimated to be 180 pSv. The variation of the concentration of potassium in the entire body reflects the amount of relatively potassium-free adipose tissue that is present in lean body mass at different ages: it is found to vary between about 1 and 2.5 g kg-'.
(b) Rubidium-87
43. Very little is known about the behaviour of rubidium in the environment. Limited measurements in foodstuffs and humans seem to indicate that the human body retains rubidium more s o than potassium [T12]. from the mass concentrations of rubidium reported on by ICRP [I3]. the average activity mass concentration of 87Rb in the body is 8.5 Bq kg-!. The assumed distribution of rubidium in various organs and tissues of the body [I31 is used to calculate the resulting absorbed dose rates from R'Rb. Bone lining cells receive the highest annual dose (14 pGy) and the thyroid the lowest (3 p G y ) The annual effective dose equivalent is estimated to be about 6 pSv.
, (c) Uranium-238 series
44. Uranium-238 is the head of a series of 14 principal nuclides (Figure V). This can be divided into subseries in which the activity of the precursor controls to a large degree the activities of the decay products: 2 3 8 u - 234U. 230Th. 226Ra; 222Rn - 214po; and 'lOPb - '''Po. For each subseries. the intakes by inhalation and by ingestion, as well as the concentra- tions in bone and in soft tissues, are estimated. The results are presented in Tables 7 and 8. The conver- sions from the activitv concentrations in bone and in soft tissues to the adsorbed doses are based on the models described in ICRP Publication 30 [14]. Estimates of annual absorbed doses are shown in Table 9. Pre- sented below is a brief discussion of the exposures with a n indication of what new information has become available since the publication of the UNSCEAR 1982 Report.
45. In this Annex, uranium is assumed to consist of "W in radioactive equilibrium with "'Th, 34mPa and W , SO that 1 kg of uranium contains 12 MBq of each of the four radionuciides. The contribution of ')'U and its decay products to the total dose from natural background has been neglected.
46. In the atmosphere, the main natural source of uranium, as well as of any other precursor of one of the radon isotopes, is likely to be the resuspension of dust particles from the earth [H24, H25. K211. Taking a dust loading of about 50 p g m-' in surface air of populated areas and assuming an average 235U activity mass concentration in airborne dust as in soil of 25 Bq kg-' (Table 3), the activity concentration in ground-level air is estimated to be about 1.2 pBq m-'. The corresponding annual intake by adults through inhalation is approximately 0.01 Bq (Table 7). This result is applicable to all other radionuclides of the '3WU and 232Th series that are precursors of gaseous "?Rn and 220Rn.
47. The annual dietary intake of 13" has been found to be about 5 Bq in areas of normal natural activity (based on results from Japan. United Kingdom, United States). Recent measurements of uranium in the diet of New York City residents confirm the validity of this value [F12]. The contribution of drinking water to the total intake by ingestion varies over a wide range [H26]. According to the results of an extensive survey carried out in the United States, involving 90.000 measurements of domestic water supplies, average concentrations of uranium in ground water, for a given state, a re only slightly higher (up to a factor of 4) than in surface water. and the ratio of the activity concentration of Z34U to that of Z3sU usually ranges between 1 and 3, with an average value of 1.9 [DIO, H20, H211. It can be estimated from that survey that the population-averaged '38U concentra- tions in domestic water supplies range from 0.1 Bq m-' in several eastern states to 50 Bq m-' in a number of western states, the nation-wide average in ground-water supplies being 25 Bq m-3 [DlO, H211. Uranium-238 concentrations in European mineral water are similar to those observed in United States ground water. with median values of 12 Bq m-' for France and 24 Bq m-' for the Federal Republic of Germany. If the average daily consumption of drinking water is taken to be 0.5 litre, the average annual intake from drinking water containing 25 Bq of 23mU per m3 is about 5 Bq, which is the same value as that found for the intake from foodstuffs. This is an example of higher intake; however, the mean intake of uranium through ingestion of water is generally likely to be small in comparison with the mean dietary intake.
48. Measured values of the activity mass concentra- tion of Z38U in bone of adults who have lived in areas with normal dietary levels are currently more abundant [F13, F16, F18, Wig]; they lie in the range of 5-150 mBq kg-' of 23aU in dry bone. Analyses of this wider data base indicates that a better value of the average activity mass concentration is 50 mBq kg-', which is lower by a factor of 3 than the previous

estimate by the Committee. The activity mass concen- trations of 2'8U in soft tissues (Table 8) are much smaller, with the exception of the lungs, and previously measured high values in kidneys have not been confirmed [F 16. W 191. The estimated annual absorbed doses from the 13'U subseries are up to about I jiGy in bone lining cells (Table 9): the corresponding annual effective dose equivalent is 5 pSv.
(ii) Thorium-230
49. The activity intake of 130Th through inhalation. estimated in the same manner as that of 23eU, is about 0.01 Bq a-'. The dietary intake of *jOTh has been measured in the United States for the first time; i t is about 2 Bq a - ' [F12]. It can be derived from these values and ICRP models [I41 that inhalation accounts for about three quarters of the total uptake to the blood of " O n .
50. Thorium is a bone seeker having a long residence time in the skeleton and is assumed to remain on the bone surfaces [I4]. The distribution of 230Th in human tissues has been investigated by Wrenn and his collaborators [I3. S22, S55, W9]. A typical activity of "OTh in bone is 140 mBq, resulting in activity mass concentrations of approximately 20 mBq kg-' in dry cortical bone and 70 mBq kg-' in dry trabecular bone, assuming that the deposit of thorium is proportional to the bone area. In soft tissues, representative values of the activity mass concentrations could be 300 mBq kg- ' in lymph nodes, 20 mBq kg-' in the lungs, 10 mBq kg-' in kidneys, 7 mBq kg-' in liver and 0.3 mBq kg ! in other soft tissues. The corresponding annual absorbed doses (Table 9) range from 7 nGy to 7pGy. depending on the organ o r tissue considered. The annual effective dose equivalent is estimated to be about 7 pSv.
51. The doses in bone marrow and bone lining cells, as well as the effective dose equivalent, would be significantly lower if the activity of 230Th were distributed uniformly over the mass of the skeleton instead of being concentrated on the bone surfaces. The activity mass concentration of Z30Th would then be about 30 mBq kg-' in dry trabecular and cortical bone, while the calculated annual doses in bone marrow and bone lining cells would be 0.02 and 0.4 pGy. respectively, instead of 0.56 and 7.4 pGy (see Table 9). The annual effective dose equivalent would be reduced from 7 to 2 pSv.
(iii) Radium-226
52. Food is a much more important source of radium for intake and blood uptake than is inhalation. The Committee's previous estimate of the average annual dietary intake of 226Ra in areas of normal radiation background of 15 Bq has been recently confirmed in the USSR [Dl 11 and the United King- dom [S56] and is to be compared with 0.01 Bq for inhalation. The contribution of drinking water to the total intake is generally small when the drinking-water supplies are drawn from surface water: however. in ground-water supplies, which in many countries serve a large portion of the population, 226Ra concentrations vary widely and levels in excess of 200 Bq m-' are not uncommon (see, for example, [C18] and [H20]). Con-
centrations in bottled mineral water from European countries range up to 1,800 Bq m-' and have geo- metric means of 7, 44, 25 and 25 Bq m-' in Italy, France, Austria and the Federal Republic of Germany. respectively [F17, G27. M28, R8]. In the United States, the reported geometric mean of the "6Ra concentration in public water supplies is 22 Bq m-'. This leads to a n annual intake of 4 Bq. if a water consumption rate of 0.5 litre per day is assumed.
53. When radium is taken into the body. its metabolic behaviour is similar to that of calcium, and an appreciable fraction is deposited in bone [ES]. More than 70% of the radium in the body is contained in bone [I5, S571. the remaining fraction being distributed rather uniformly in soft tissues. Fisenne et al. [F4] have summarized the available data from 26 countries on measured activity mass concentrations of 226Ra in human bone. The 26 countries sampled have 1.4 10' per- sons and thus represent about 30% of the world popula- tion. The population-weighted distribution was found to have a median of 850 mBq per kg of calcium (corresponding to 170 mBq per kg of dry bone and to 850 mBq in the skeleton) and a geometric standard deviation of 1.6. If the fraction of "6Ra distributed in the soft tissues is taken to be 17%. as given in ICRPpublica- tion 20 [I5], the average activity mass concentration in human soft tissues is found to be 2.7 mBq kg-'.
54. The annual absorbed doses in tissues have been calculated assuming that an average retention factor of 0.33 applies to 222Rn in the skeleton (and also. conservatively, in soft tissues) and that the concentra- tion of radium and its decay products is uniform over the total mass of mineral bone. The results, presented in Table 9, show average annual absorbed doses of less than I p G y in all organs and tissues, with the exception of bone lining cells. The annual effective dose equivalent resulting from Iz6Ra intake in normal areas is found to be about 7 pSv.
55. Food samples grown in the high-radiation areas of India have been collected and analysed for several radionuclides. including Iz6Ra. The 'I6Ra concentra- tions were found to be higher in leafy and root vegetables than in fruits and fruit vegetables. The annual intake of 226Ra by populations living in the high background areas was assessed to be about 200 Bq [L19]. A similar survey performed in the Araxa-Tapira region of Brazil showed that the annual 226Ra intakes of the most exposed people ranged between 140 and 540 Bq [P25]. The corresponding annual effective dose equivalents are between 65 and 250 pSv.
(iv) Radon-222 and its short-lived decay products (218Po, 214Pb, 214Bi, 2 1 r P ~ )
56. Because of the current scientific interest in radon exposure, a detailed treatment is provided in chapter 11.
57. Average annual intakes, activity mass concentra- tions in lung tissues and absorbed doses are presented in Tables 7, 8 and 9, respectively. The resulting annual effective dose equivalents are estimated to be, on

average, 70 pSv for outdoor exposure and 1,000 pSv for indoor exposure. The variability around these average figures is very high.
(V) ~ o n ~ - l i v e d decay producrs of radon-222 (2'0Pb, zlog;, 210P0)
58. Radon-222 exhalation from the ground consti- tutes the main source of 210Pb in the atmosphere. With respect to 210Po, the volcanic output has been estimated to be about as important as lZZRn exhalation [LIO]. In the mid-latitudes of the northern hemisphere, the average concentration of 210Pb in surface air is 0.5 mBq m-', while that of ""Po is about 0.04 mBq m-', as shown in Table 10; this is lower than the value adopted in the UNSCEAR 1982 Report by a factor of 2.5. Assuming that the concentrations in air are the same indoors and outdoors. the annual intakes of non-smokers through inhalation would be 4 Bq of 210Pb and 0.3 Bq of 210Po. Cigarette smoking leads to an increase in the intake of llOPb and Z1OPo [M 13, P9]. -4 cigarette contains about 20 mBq of 210Pb and 15 mBq of "OPo [P9] and both nuclides are volatile at the burning temperature of tobacco. About 10% of the ?I0Pb and 20% of the "OPo contained in the cigarette will enter the lungs with the main smoke stream [P9]. Therefore. for a person smoking 20 cigarettes a day, the values of the estimated annual intakes are 15 Bq for 210Pb and 20 Bq for llOPo. In view of the short half-life of 'I0Bi (5.01 d), its activity intakes are of no importance, as *I0Bi may be assumed to be in radioactive equilibrium with lI0Pb in the body tissues; the absorbed doses from lI0Bi arise mainly from the intake of 'I0Pb and not from the intake of ?I0Bi itself.
59. Consumption of food is usually the most impor- tant route by which ?'OPb and 'loPo enter the human body. Concentrations of ?I0Pb and "OPo are usually low in meat and milk, intermediate in cereals and vegetables, and relatively high in aquatic organisms. Annual intakes reflect the composition of the diet of the population in question and are approximately 20 Bq in the United States [H13. H141, 30 Bq in the United Kingdom [S56], about 40 Bq in the Federal Republic of Germany [G17], the USSR [L9], India [L13] and Italy [C12], and about 200 Bq in Japan [07, T53. More recent data from Japan, however, seem to indicate a much lower annual intake of 11 Bq [K18]. Concentrations of 210Pb in drinking water are generally low [H20, (3271 and do not usually contribute significantly to the total intake by ingestion.
60. A well-documented case of elevated intake is that of the tens of thousands of individuals living on reindeer or caribou meat in the Arctic and sub-Arctic regions of the northern hemisphere. Their main food is the meat of these animals, which contains unusually high concentrations of llOPo because in the winter the animals graze on lichens, which accumulate ?I0Pb and 2'0Po. The annual intake of lI0Pb and "OPo by the populations living on reindeer or caribou meat are about 140 Bq for 210Pb and about 1,400 Bq for 210Po [H14, P12].
61. Lead is a bone seeker that is found incorporated in mineral bone and has a long residence time in the skeleton. In continental areas, a typical activity mass
concentration of llOPb in dry bone is about 3 Bq kg-', yielding a skeleton content of I5 Bq. The measured ratios of 2'0Po and 210Pb activity mass concentrations in bone are centred around 0.8, leading to a "OPo skeleton content of 12 Bq.
62. About 30% of the body content of 2'0Pb is found in soft tissues, with a relatively uniform distribution throughout the body. The degree of radioactive equilibriiim between 210Po and 'I0Pb depends on the organ considered; i t is about 0.5 in the lungs, 0.8 in red bone marrow, and definitely greater than 1 in the liver and kidneys. Additional intake due to smoking leads to increased concentrations, particularly in the lungs.
63. The absorbed doses from the 210Pb subseries depend mainly on the highly energetic alpha particles of 2'oPo, as the contribution from the beta emissions of 'I0Pb and Z1OBi amounts to about 10% of the total. The estimated annual absorbed doses of non-smokers in areas of normal dietary intake (Table 9) are about 5 pGy in soft tissues and 36 pGy in bone lining cells. The annual effective dose equivalents arising from the total intake of *lOPb, 210Bi and :loPo are about 120 pSv. The corresponding figure for the populations living on reindeer or caribou meat would be about 10 times higher.
(d) Thorium-232 series
(i) Thorium-232
64. Thorium-232 is the head of a series of 11 radio- nuclides (Figure VI). The Z32Th series has been divided into three subseries: 232Th itself; 2'8Ra - lZ4Ra; and 120Rn - 208Pb. For each subseries, the intakes and concentrations are estimated as in the case of 23BU and the results are presented in Tables 7 and 8. Estimates of annual absorbed doses are shown in Table 9.
65. The activity mass concentration of 232Th in soil is estimated to be on average 25 Bq kg-', the same as that of 238U and its decay product 230Th (Table 3). The annual intake from inhalation is estimated to be 0.01 Bq while that from ingestion, recently measured in the United States for the first time [F12], is about 2 Bq. Wrenn and his collaborators found the activity mass concentrations of 232Th in the body to be lower than those of 130Th by a factor of about 2 [S22, W9]. On the basis of their measurements, the body content of ?'?Th would be about 80 mBq, 60% of which is in the skeleton. The activity mass concentrations adopted in this Annex and the resulting annual absorbed doses are presented in Tables 8 and 9. respectively. The annual effective dose equivalent is calculated to be about 3 pSv.
66. The dose calculations have assumed that 232Th remains on bone surfaces. A volume distribution would yield an annual effective dose equivalent of about I pSv.
67. Radium is much more available to plants and to animals than 232Th, SO that the activity concentrations

of 228Ra in humans are mostly due to the dietary intake of 228Ra itself and not to the decay of Ij2Th in the body. Radium-228 can thus be considered to be the head of a subseries in which 22YTh (half-life: 1.91 a) and 224Ra (half-life: 3.66 d), both alpha emitters, are the most important contributors to the dose.
68. The annual activity intake arising from inhala- tion is estimated to be 0.01 Bq, while that from ingestion of foods is considerably larger, about 15 Bq in areas of normal radiation background and about 2,000 Bq in the high background area along the Kerala coast in India. Radium-228 concentrations in drinking water are comparable to those of '26Ra but not systematically correlated when individual water supplies are considered. They are low in surface water and extremely variable in ground water [H20]. The geometric mean of the "*Ra concentrations in public ground-water supplies in the United States is reported to be 85 Bq m-3 [H21], corresponding to an annual intake of 15 Bq for a daily drinking-water consump- tion of 0.5 litre.
69. The Committee estimated the average IZ8Ra activity mass concentrations in bone (dry weight) and in soft tissues (wet weight) of the human body to be 50 mBq kg-' and 4 mBq kg-', respectively. in areas of normal background radiation [ U l , U2]. Regarding 22'Th, Wrenn and Singh [W9] showed that approximately 80% of the body content (about 300 mBq) is in bone.
70. The annual absorbed doses in tissues have been calculated assuming that the 220Rn activity arising from the decay of 224Ra is retained in the body and that the concentrations of 228Ra and of its decay products are uniform over the total mass of bone. The results presented in Table 9 show annual absorbed doses greater than 1 pGy in the lungs, kidneys and bone lining cells. The corresponding annual effective dose equivalent for the subseries is found to be about 13 pSv.
(iii) Radon-220 and its decay products ("6Po, :I2Pb, 212Bi, Z12p0, z08TI)
71. As is the case of 222Rn, inhalation is the major pathway through which humans are exposed to 220Rn (thoron) and its short-lived decay products. In out- door air, the few available measurements of thoron decay products [Ul, Annex D, Table 231 point to an average 212Pb/222Rn activity concentration ratio of about 0.04. If the average 222Rn concentration is taken to be 5 Bq m-3, the average concentration of 2 '2Pb in outdoor air, representative of the equilibrium equi- valent concentration of thoron decay products, would be 0.2 Bq m-". The equilibrium equivalent concentra- tion (EEC) of thoron, or radon, is that activity concentration of thoron, or radon, in radioactive equilibrium with its short-lived decay products that has the same potential alpha energy concentration as the actual mixture of decay products. Ground-level air thoron concentrations in continental areas lie in the range of 2-10 Bq m-3 [Fl I].
72. The air exchange rate indoors is always much smaller than the radioactive decay constant of thoron
(half-life = 55.6 s), so that the thoron concentration in room air is relatively insensitive t o the value of the ventilation rate. The thoron concentration in room air is therefore mainly determined by the exhalation rate from the soil and building materials. As the diffusion length of thoron in these materials is of the order of 1 cm, it is expected that the nature of the surface layer covering the floor and the walls has a great influence on the thoron exhalation rate; however, measurements are needed to substantiate this assumption. The magnitude of the equilibrium factor between thoron and its decay products in room air has been theoretically estimated by Porstendorfer et al. [P4]. The difference between the concentrations of 2''Pb and *'?Bi is always found to be small but there is a factor of about 10-50, depending on the ventilation rate, between the concen- trations of "ORn (or Il6Po) and ?12Pb (or "'Bi), the concentrations of "ORn being higher. The unattached fraction of 2 '2Pb and "?Bi is very small (less than 1%) ~ 4 1 .
73. The number of indoor measurements of thoron decay products is small in comparison to that of radon decay products. Table 11 summarizes the available information on the potential alpha energy ratio of thoron and radon decay products measured simultaneously. The average values are around 0.5. Using this figure and assuming a typical equilibrium equivalent concentration of radon of 20 Bq m-' in temperate latitudes (paragraph 140). the average equilibrium equivalent concentration of thoron (Tn) is tentatively estimated to be
in temperate latitudes.
74. For equatorial regions measurements are unavail- able. Because of the different domestic conditions, the indoor concentrations of thoron decay products are expected to be lower than in temperate regions. T o estimate the population-weighted world average of the indoor concentrations of thoron decay products, account must be taken of the fact that the population in tropical regions is about half that in temperate latitudes. The range of possible values for that mean concentration for the world is from 0.47 Bq m-3 (assuming that the indoor concentration in tropical latitudes is equal to zero) to 0.7 Bq m-' (assuming that the indoor concentration in tropical regions is the same as that in the temperate zones). It is tentatively assumed that the population-weighted world average of the indoor concentration of thoron decay products is 0.5 Bq m-).
75. Regarding exposuredose relationships, like radon and its decay products (see chapter 11). thoron gas is considered separately from thoron decay products.
76. Inhaled thoron, as a noble gas. is constantly present in the air volume of the lungs a t the concentration in the inhaled air; in addition, it is partly dissolved in the lung tissues. Due to its short radioactive half-life (55.6 s). however, the equilibrium solubility in tissues other than that of the lungs will not be reached. Thus, the decay of thoron and of its

very short-lived decay product 2'6Po leads mainly to a dose in the lungs: the second decay product formed, 2'2Pb, is mainly transferred to blood cells, kidneys, and bone surfaces [IZ].
77. Values of annual absorbed doses per unit thoron concentrations have been derived from calculations by Jacobi and Eisfeld [J6]. They are presented in Table 12. For concentrations of thoron gas in air in the range of 2-20 Bq m-3, the annual doses are up to 5 pGy in the lungs, 4 pGy in bone lining cells and 2pGy in the kidneys. The corresponding annual effective dose equivalents are less than 20 pSv.
78. With respect to thoron decay products. the absorbed doses per unit inhaled activity have been adapted from calculations of Jacobi and Eisfeld [J 1 I] to fit the value of 0.7 Sv J-' used in the UNSCEAR 1982 Report [UI] for the effective dose equivalent per unit inhaled potential alpha energy. The results, presented in Table 12, show that the lungs, bone lining cells and kidneys are by far the most exposed organs and tissues. The absorbed doses per unit concentra- tion, also shown in Table 12, have been estimated using a mean breathing rate of 0.8 m3 h-' indoors and 1 m' h-' outdoors and an average occupancy factor of 0.8 indoors and 0.2 outdoors.
79- The dosimetric coefficients of Table 12 have been used to estimate average annual doses from inhalation of thoron decay products. Average annual doses in the lungs are 5 pGy outdoors and about 40pGy indoors. Annual doses in other organs and tissues are lower. The annual average effective dose equivalent resulting from outdoor and indoor inhalation of thoron is estimated to be 160pSv.
80. Because of the few data available, the distribu- tion of individual exposures, as well as the reliability of the estimated mean value, is difficult to assess at present.
C. SUMMARY
81. A summary of the various contributions to the annual effective dose equivalent from natural sources of radiation is given in Table 1. In order of importance, inhalation of short-lived decay products of radon comes first, with the average annual effective dose equivalent estimated to be 1,100pSv. A detailed discussion on the environmental behaviour of radon and of its dosimetry is provided in chapter 11. The second most important pathway is external irradiation. accounting for nearly 800 pSv, divided approximately equally between cosmic radiation and terrestrial sources. Less significant are the ingestion of 'OK (180,uSv). inhalation of decay products of thoron (160 pSv) and internal irradiation from 2'oPb-"0Po (120pSv). The other natural radionuclides contribute little to the total annual effective dose equivalent, which is estimated to be 2,400 pSv.
82. The variability around the mean dose from natural sources of radiation is dominated by the radon component, as the indoor radon concentrations span over four orders of magnitude.
11. RADON-222 AND ITS SHORT-LIVED DECAY PRODUCTS
83. In the UNSCEAR 1982 Report, it was estimated that inhalation of short-lived decay products of radon (222Rn) accounts on average for about one half of the effective dose equivalent from all natural sources of radiation and may sometimes lead to doses high enough to cause concern for human health. The awareness of the potential health problems that could be caused by radon and other pollutants in the indoor environment has been growing steadily in the past few years so that a large number of scientific papers, books, reports and meetings have been devoted to questions related to radon exposures, especially indoors (see. for example [A17], [C24], [H27], [N24] and w.51).
84. Following a brief overview of the outdoor situation, this chapter focuses mainly on indoor concentrations. The exposure-dose relationships for the outdoor and indoor conditions are then established, followed by an assessment of the annual doses.
A. OUTDOOR CONCENTRATIONS
85. Radon enters the atmosphere mainly by crossing the soil-air interface, but there are a number of other secondary sources. such as the ocean, ground water, natural gas, geothermal fluids and coal combustion. The atmospheric concentrations of radon at ground level are governed by the source term-the exhalation rate-and by atmospheric dilution processes, which are both affected by meteorological conditions. The degree of radioactive equilibrium between radon and its decay products in the atmosphere at ground level also depends to a large extent upon the meteorological conditions.
86. When 226Ra decays in soil particles, the resulting atoms of ?'IRn must first escape from the soil particles to air-filled pores and move through these pores in order to enter the atmosphere. The escape from the soil particles to the air-filled pores is thought to be mainly the result of recoil of the radon atoms following the decay of :16Ra [MI]: if they lie close to the surface of individual grains, they may be ejected into the pores between the grains. In comparison, the contribution from diffusion through the solid mineral grains is less important, as most of the radon atoms decay before escaping. The fraction of radon formed in the soil that escapes into the pores is known as the emanating power, coefficient, ratio or fraction; reported values range from about 1% to 80%.
87. In order to enter the free atmosphere. the radon gas must diffuse through the pores of the material, and a fraction of it will reach the surface before decaying. The diffusion path is tortuous and, of course, some radon atoms will be ejected into closed pores from which they cannot escape. Movement of radon atoms may be caused by diffusion or convec- tion. Convective movements, induced by pressure differences created by meteorological conditions, vary

with time and cannot be readily quantified. The diffusion process is described mathematically by the definition of an effective diffusion coefficient that includes an allowance for the convoluted path. As in the UNSCEAR 1982 Report (Annex D , paragraph 58). the area exhalation rate. defined as the activity transfer rate per unit area at the soil-air interface, is expressed as
= A RnFrCsoil.~a~so~l L ~ n (2.1)
where R is the area exhalation rate in Bq m-* s-I; i.,, is the decay constant of 222Rn (2.1 lom6 s-I); F, is the emanating power: Clod.b is the activity mass concen- tration of Iz6Ra in soil (Bq kg-I): p,, is the soil density (kg m-)); and LRn is the diffusion length of radon in soil (m), which can be expressed mathematically as the square root of AeM/iRnprotl.ps where A,ff is the effective bulk diffusion coefficient (m2 s-I) and p,,,,.,, is the soil porosity.
88. Published information on experimental values of R, F,, ACrr and p,,,,,, is summarized in Table 13. Using the representative values given in Table I3 for F,, Aen and P,,,~~,,, and assuming a 226Ra activity mass concen- tration In soil of 25 Bq kg-' (Table 3) and a soil density of 1.6 lo3 kg m-3. the diffusion length of radon LRn is approximately 1 m and the area exhalation rate is 1.7 lo-? Bq m-' s-I. in agreement with the estimated area-weighted average per unit area for soil. based on direct measurements, of 1.6 lo-? Bq m-: s-' [Wl]. Over the ocean, the area exhalation rate is about two orders of magnitude lower than that for soil.
89. The concentrations of radon in air vary depending on the place, time. height above the ground and meteorological conditions. Because the source of radon is the soil and radon has a rather short physical half- life, the radon concentration is in general constantly decreasing with height. The geographical location is important: radon concentrations are as a rule lower over locations, such as islands and Arctic areas, which have less soil capable of emanating radon than over continental temperate regions.
90. Detailed information on the variations of radon concentration at ground level over time was obtained from a six-year record of hourly radon measurements made at Chester. New Jersey, United States [F7]. The arithmetic mean for the six years of operation was found to be 8 Bq m-3 and the hourly data and three- hour averages of radon concentrations were log- normally distributed. A seasonal pattern of a summer maximum and a winter minimum was observed over the period 1977-1982 with little variation from year to year [F7]. The seasonal maximum in August was a factor of 3 higher than the February minimum (Figure VII). The diurnal variation (Figure VIII) shows a maximum in the night and a minimum at noon. The diurnal maximum is a factor of 2 greater than the minimum. The three-hour average radon concentra- tions were tested for correlation with five meteorological parameters measured at the site-temperature. dew- point temperature, wind speed. atmospheric pressure and precipitation-but no significant correlation was found [F2].
I I I I I I I I I I I t I
Jan Feb Mar Apr May Jun Jul Aug Sep Oct Nov Dec
MONTH
Flgure VII. Seasonal varlatlon of outdoor radon concentratlon at Cheater, New Jersey (1977-1982 average).
[ F l l

5 0 3 6 9 1 2 15 18 21 24
HOUR
Flgure VIII. Diurnal variation of outdoor radon concentration at Chester, New Jersey (1977-1983 average of three-hour data).
[Wl
91. The compilation obtained at Chester represents the most complete available set of data on outdoor radon concentrations at ground level. Less extensive series of measurements were reviewed in the UNSCEAR 1982 Report and by Gesell [GI]. With regard to the seasonal variations. other data from the United States showed lower values in the spring than in summer and autumn [W2, Cl , G3, L2]. Data from Hungary [G9] are in agreement with those obtained at Chester. Other seasonal patterns, however, were observed at Livermore, California [Ll], Bombay, India [M2]. Rio de Janeiro, Brazil [L2], and Japan [I8, M3, S47J; this may be due to the fact that those locations, being islands or coastal cities, are more affected by the annual wind rose.
92. The average value of outdoor atmospheric radon concentration for normal areas of the United States was estimated by Gesell [GI] to be about 9 Bq m-3 after the diurnal radon cycle was taken into account. This is probably representative of the continental areas in the temperate latitudes. Values lower by a factor of 2-4 are generally observed on islands and at coastal sites [C4, F3, 18. S47, W141. In this Annex it is tentatively estimated that the annual average of the population-weighted radon concentration in outdoor air is 5 Bq m-3. A lower value, 3 Bq m-3, was adopted in the UNSCEAR 1982 Report.
93. The equilibrium factor F between radon and its short-lived decay products is defined as the ratio of the equilibrium equivalent radon concentration to the radon activity concentration:
F = k c q . ~ n ) / ~ ~ n (2.2) with x ~ ~ . ~ ~ = 0.105 + 0.516 x Z + 0.379 x 3
where x, , x 2 and X , represent the activity concentra- tions of polonium-2 18. lead-2 14 and polonium-2 14, respectively. A few studies were devoted to the assessment of the equilibrium factor F between radon and its short-lived decay products. At Chester, New Jersey, George [G2] found an average value of 0.85 at I m above ground. In the Federal Republic of Germany, Jacobi obtained an equilibrium factor of
0.77 at 1-10 m above ground. Cox et al. [CI]. at Cincinnati. Ohio. reported an average value of 0.87. and measurements in New Jersey and New York at 0.3-1 m above ground gave an equilibrium factor of 0.79. It seems that 0.8 may be a representative value of the average equilibrium factor F at I m above ground. This is higher than the value of 0.6 assumed in the UNSCEAR 1982 Report. Combining the annual average of the population-weighted radon concentra- tion in outdoor air of 5 Bq m-' with an average equilibrium factor of 0.8 yields an average equilibrium equivalent concentration of radon of 4 Bq m-3. Annual averages of this value vary depending on the location; a typical range, excluding extreme values, is from 1 to 10 Bq rn-j.
B. INDOOR CONCENTRATIONS
94. There is no basic difference in the physical behaviour of radon and its decay products in a room and in the open air; however, the different nature of some of the sources and the magnitude of the indoor exposures warrant a separate discussion. In this section. the various sources of indoor radon are first discussed and quantified in order to estimate an average and a typical range of the rate of entry of radon into a hypothetical reference house. The prin- cipal mechanisms of transport and removal of radon and radon decay products are then considered in order to estimate average radon and radon decay product concentrations in the hypothetical reference house. In the last part of this section, the results of large-scale indoor surveys of radon or radon decay products are reviewed.
1. Sources of indoor radon
95. Radon enters buildings from different sources. such as the soil or rock under or surrounding the buildings. building materials, water supplies, natural gas and outdoor air. Characterizing the radon entry rate may require consideration of the rate at which radon is generated in source materials, of the modes of radon transport through various materials and, finally, of the manner in which radon actually enters indoor air. Several reviews of indoor radon sources have recently been prepared [N 1. B25, G24. N 131.
96. As in the UNSCEAR 1982 Report, reference will be made to a hypothetical reference house; its dimensions and relevant parameters are given in Table 14. In the UNSCEAR 1982 Report, the radon source in the reference house was estimated to be 74 kBq d-I, corresponding to a radon entry rate of about 15 Bq nl-3h-I. Figure IX presents the cumulative frequency distributions of' radon entry rates determined in dwellings in several countries as the product of the simultaneously measured ventilation rate and radon concentration [N8]. I t appears that the radon entry rates are approximately log-normally distributed and that there is in most countries a considerable spread between the minimum and the maximum values. The median radon entry rates presented in Figure IX range from 5 Bq m-I h-I in the Federal Republic of Germany

(a) Sweden (86) (b) Canada (9) (c) US (tirneaveraged) (73) (d) US (grabsample) (101) (8) Great Britain (87) (I) FR Germany (32)
(a) tinder/-ving soil
97. Radon can be transported into a building from the underlying soil via diffusion or via the pressure- driven flow of air through the structural elements o r through openings in the structural elements.
1 ' ' I I I I 1 I 1 I I
1 5 10 30 50 70 90 95 99
CUMULATIVE PROBAEI L I T Y (.'.)
Figure IX. Cumulative frequency distributions of radon entry rate in buildings in several countries determined from the product of simultaneously measured ventilation rate and radon concentration. (The number of residences In each sample is
indicated in parentheses.) [N81
[W6] to 102 Bq m-? h-I in Sweden [H16]: the cor- responding arithmetic means, assuming log-normal distributions, are 7 and 190 Bq m-3 h-I. respectively. Intermediate values have been obtained in Canada [S41], the United Kingdom [C4] and the United States [N8]. Figure X shows the histogram of the radon entry rates determined from the British survey [C4]. I t should be pointed out that the number of houses considered was relatively small in each of the surveys. The various sources of indoor radon are considered next.
RADON ENTRY RATE (Bq m-3 h - l )
0.3 1 3 10 30 100 300
-0.2 -0.1 0 1.0 2.0 3.0 4 . 0 5.0 6.0
L n (RADON ENTRY R A T E )
Figure X. Distribution of radon entry rater in rooms from a survey in the United Kingdom.
[C41
98. Diffusion. For an uncracked slab of concrete of thickness L lying on the ground, the area exhalation rate transmitted by diffusion from the underlying soil through the slab can be expressed as [Nl , C3]
Fsorl.pr L ~ n . r o l l LC sinh (- )I (2.3)
Fslab.pr LRnshb L~n.slab
where R is the area exhalation rate from uncovered soil (equation 2.1). Other formulations can be found in the literature on the subject (see. for example, [B26]). Taking the values already given in preceding paragraphs for the various parameters yields
0.2 RT = 1.7 Bq m-2 s-I / [cosh (-) t
0.15 0.15 X 1 0.2
0.2 X 0.15 sinh (-)I = 1.2 Bq m-' s-I (2.4) 0.15
Thus, only a small percentage of the activity exhaled from the soil is transmitted through 0.2 m of uncracked concrete, and this exhaled activity represents about one half of that due to the concrete itself. The corresponding radon entry rate in the reference house can be estimated as
UT = RTNSF/V (2.5)
or, in numerical terms,
99. The presence of cracks in the slab may con- siderably increase the transmission of the diffusive flux from the soil. Using a mathematical model of a cracked slab, Landman [L3] determined that 25% of the flux from uncovered soil would penetrate the slab by diffusion if a gap of 1 cm existed for every metre of slab.
100. Pressure-driven flow. The pressure-driven flow of radon-bearing air through structural elements is believed to be an important mechanism for radon entry [Nl]; it is often the predominant source of radon in dwellings with elevated concentrations (see, for example, [A 101. [E7], [N8]. [W 131 and [W8]), especially if the house is in direct contact with the ground [S65]. Flow through an intact concrete slab is likely to be negligible in comparison to flow through cracks, holes and other penetrations. In dry soil with a density of 1.6 lo3 kg m-3, porosity of 20%. Z26Ra activity mass concentration of 25 Bq kg-I and emanating power of 20%. the calculated equilibrium radon concentration in soil gas is 40 kBq m-3. If it is assumed that 0.25 m3 of soil gas enters a building per hour, representing about 0.1% of the total air exchange rate, the radon entry rate from that source is 40 Bq m-3 h-I.
101. Much attention has been given to the question of radon entry through convective flow in countries

such as Sweden [S7, SB]. the United States [Nl]. Canada [El] and the United Kingdom [02]. where a number of dwellings have been found to have unusually high radon concentrations. The radon entry rate through convective flow R, is simply the product of the radon concentration in soil gas X , and the infiltration rate from the soil Q,. The radon concen- tration in soil gas depends on the activity mass concentration of radium in soil. its emanating power and the porosity, permeability and moisture content of the soil. Investigations of radon concentrations in soil gas in Sweden, the results of which are presented in Table 15, show that there is usually no long- distance transport of radon in the soil and that the radon concentrations in soil gas can be explained assuming an emanating power of 10-30% [A 101.
102. The infiltration rate from the soil Q, depends on the degree to which indoor air is coupled to the soil, which, in turn, depends on the design and construction of the building structure, on meteorolo- gical parameters influencing radon movements in the soil and on the living habits of the occupants, which can affect the air exchange rate in the building. Mechanisms of radon transport from soil into a house having a vented crawl space are illustrated in Figure XI [NlO]. The two pressure-driven flows considered are those due to the indoor-outdoor temperature difference, including a stack effect in winter, and wind.
* * ~ n
Figure XI. Schematic diagram of mechanisms related to radon transport from soll, through a vented crawl space and into a
house. [NlOI
103. Experimental investigations in a house with a vented crawl space showed that a higher temperature difference, including an increasing infiltration rate, corresponded to a higher indoor radon concentration, suggesting that the increased infiltration rate is more than compensated for by an increase in the radon entry rate [NIO]; they also suggested that the infiltra- tion rate from the soil into the house was, in this case, more important than the infiltration rate from the walls. A high wind speed tended to reduce the indoor radon concentration, presumably by increasing the cross-ventilation of the crawl space and the infiltration rate of the living space. For this particular house, as well a s for two other houses with vented crawl spaces that were investigated in the study, it was found that
perhaps 50% o r more of the radon released into the crawl space from the soil beneath the house entered the living space [NlO]. This figure cannot, however, be applied to all types of construction: the floor of a crawl-space house, which is usually built of wood, is likely to have greater infiltration rates than the floor and walls of a basement, which are usually built of poured concrete and concrete blocks.
104. Another extensive investigation of radon entry through the soil was conducted in a single-family house with a basement; real-time measurements of the indoor radon concentration, air exchange rate, source- related parameters and meteorological factors were performed for a period of five months [N4]. The radon entry rate was calculated from the measured radon concentration and air exchange rate. Figure XI1 shows the results obtained during a week of that experiment with regard to the radon entry rate and the radon concentrations in the soil adjacent to the house and in the basement sump, which collects rainwater via a drain tile system surrounding the house at a level near that of the basement floor. The good correlation between the sump activity and the radon entry rate suggests that the sump is an important pathway for radon entry into the house, although it cannot account for the total radon activity [N4]. The main conclusion derived from this study is that the radon entry rate may have two components: one may be independent of the air exchange rate. acting in a way similar to entry by diffusion; the other may be proportional to the air exchange rate, behaving like pressure-driven entry [N4]. The corresponding radon entry rates in the house were calculated to be about 2 Bq n1-3 h-' for the diffusion process and about 60 Bq m-3 h-I for the pressure-driven force [Nl].
105. Computer modelling of radon movement of soil gas resulting from pressure differences between the underlying soil and indoor air has been carried out in Canada [E7, S9]. In a wind-tunnel study, variations in wind speed and direction, and not the wind speed o r direction itself, were found to cause large variations in the radon entry rate. The average radon entry rate was found to be mainly a function of the soil permeability and only secondarily a function of the area and resistance of the house used in the computer model to soil connections. The effect of seasonal differences on radon entry rate tvas approximately 4 to 1 from winter to summer. Stack-effect pressure differences due to temperature differences increased by a similar factor over this period. Because the ventilation rate of the house depends largely on the stack effect, these results suggest that summer and winter concentrations should be similar unless doors and \vindows are opened in summer to increase the ventilation rate. For the same geometry and weather, decreasing the soil permeability from I 0-4 cm2 to lo-' cm2 (a factor of 1,000) decreased the average radon entry rate into the house by a factor of about 25. This suggests that the radon entry rate is roughly proportional to the square root of soil permeability [D12]. Considerably more theoretical and experimental work is likely to be required to determine entry routes and transport mechanisms from underlying soil with some degree of confidence.

I A . ENTRY RATE
o t 1 I I I I rlednesdaylThursday Fr iday Saturday Sunday Monday Tuesday
1
(14-20 July 1982)
a. SUMPMONITOR
8000 i
(14-20 July 1982)
C. SOIL PROBE
8000 1
o ! I I I I I 1 I Wednesday Thursday Fr iday Saturday Sunday Monday Tuesday
(14-20 July 1982)
Flgure XII. Variation with tlme In a rlngle-famlly house with a basement ol (a) radon entry rate; (b) the radon concentratlon In the basement sump; and (c) In the roll adjacent
to the house. IN41

(6) Building marerials
106. A fraction of the radon activity produced by decay of 2'6Ra in building materials enters buildings by diffusion. The area exhalation rate can be expressed a s
R = j - ~ n ~ b , : l l d C b u , l d . R a F r L ~ n t a n h (LII/LRR) (2.6)
which is an equation very similar to that related to soil (equation 2. I ) , the only difference being the introduc- tion of a hyperbolic term to account for the fact that diffusion takes place in a medium of finite thickness. In equation (2.6). R is the area exhalarion rate (Bq m-' s-'1; F, is the emanating power; pburld is the density of the building material (kg m-9: CbulldR4 is the activity mass concentration of ::6Ra in the building material (Bq kg- I): L,, is the diffusion length (m); and Lh is the half-thickness of a slab of building material (m).
107. The mass activity exhalation rate, expressed in Bq kg-) s-I and defined as
is the quantity usually determined in laboratory measurements [JI]. The area exhalation rate from a wall o r a floor made of building material of half- thickness L,, diffusion length LRn and density p,_,,, can then be expressed as
108. Information on the mass exhalation rate. the diffusion length, the emanating power and the '26Ra activity mass concentration in building materials is presented in Table 16. Concrete and brick are probably the two most tvidely used building materials, at least in the temperate latitudes. Table 16 shotvs that even though the '26Ra concentrations in concrete seem to be lower than those in brick, the 222Rn mass exhala- tion rates appear to be higher for concrete than for brick. This is because of the high values of the emanating power for concrete, with o r without fly ash, in comparison to those for brick. The results presented for gypsum (Table 16) are difficult to analyse because the few measurements available give either high or I O U values of the emanating pourer. Further measurements are necessary to clarify this point.
109. some data on the emanating power of the concrete components are given in Table 16. Cement a n d fly ash have low emanating powers, probably due to their crystalline nature. Differences in the moisture content of the materials studied may also account in part for the wide disparity in the results of exhalation measurements from different countries [Nl]. I t is worth noting that the exhalation rate from concrete should not be derived from the emanating power of its constituents, as chemical changes occur during manu- facturing.
110. The adopted reference values for the parameters of interest in the calculation of the area exhalation rate from concrete and brick are indicated in Table 16. For building material with a thickness of 0.2 m, the reference area exhalation rates would be 2 mBq m-' s-I and 0.3 mBq m-l s-I for concrete and for brick,
respectively. The rate of entry of radon resulting from exhalation from building materials may be expressed as
U,, = N / V (2R,SF +- R,S,) (2.9)
where N is the number of seconds per hour; V is the volume of the reference house (250 m3); SF is the surface area of its floor or ceiling (100 m-): S, is the surface area of its external walls ( I00 m2); and RL and R, are the area exhalation rates from concrete and brick. respectively.
11 1. The rate of' entry of radon from the floor and the ceiling of the reference house would amount to about 6 Bq ni- h - I, while the contribution from the external walls would be about 0.4 Bq m- 'h - ' . The contribution from radon exhalation from the building materials to the radon concentration in the reference house is thus estimated to be 6.4 Bq n1-' if the air exchange rate is taken to be 1 h 'I.
112. Considerably greater values of the rate of entry of radon are expected to be obtained uhen building materials with high 226Ra concentrations and normal emanating power are extensively used. Examples ofsuch building materials are granite, Italian tuff and alum- shale lightweight concrete. Among these materials, Swedish alum-shale lightweight concrete has the highest '26Ra concentrations (about 1,300 Bq kg-' on average) [S19, S20] and probably the highest ?"Rn mass exhalation rate (440pBq k g 1 s - ' i n Table 16). Assuming a density of 2 lo3 kg m-3 and a diffusion length of 7.4 lo-' m (as measured in [J?]), a 0.2 m thick slab of 100 ni2 would lead to a rate of entry of radon of about 80 Bq m-' h-I in the reference house.
113. Techniques for reducing the radon entry rate due to exhalation from building materials have been investigated. In Swreden, aluminium foil has been applied to the walls of houses built with aerated concrete based on alum shale [S19]; the results showed a 50% reduction in the radon entry rate. In the United States. various radon sealants have been tested under conditions representative of normal construction con- ditions [EZ]. The radon exhalation rate was reduced from 20% to 80%. depending on the surface coating used. Because of the trapping of radon decay products in the wall, there is a relatively small increase in the external gamma dose rate [EZ, M8]. It was also noted that any cracks that later developed in a sealant such as paint may lead to leaks that negate a large portion of the sealing effectiveness of the paint [Ml9]. Similarly, the radon exhalation rate from any unpainted areas may be increased as they offer to radon a path of least resistance in comparison with painted areas [A I I].
(c) Outdoor air
114. Air exchange between the outdoor and the indoor environments brings some outdoor radon into buildings. Air exchange arises from natural ventilation through open doors and windows, mechanical ventila- tion and infiltration, the uncontrolled leakage of air through cracks in the building envelope. Unless otherwise stated, air exchange in this Annex is

assumed to consist of infiltration only. Outdoor radon can play a significant role in the indoor radon entry rate if the house is poorly sealed. The radon entry rate resulting from the infiltration of outdoor air may be written as
U O ~ = zOUI"~. (2.10)
where z,,, is the radon concentration in outdoor air (Bq ~ n - ~ ) : E., is the air exchange rate (h-I); and (1 is the fraction of the air exchange rate involving outdoor air, which in all cases is close to I . Assuming an outdoor concentration of 5 Bq m-' (see paragraph 92). an air exchange rate of I h-I and a value of 1 for a, the radon entry rate would be 5 Bq h ! mP3. I t is worth noting that the radon entry rate resulting from the infiltration of outdoor air is proportional to the air exchange rate.
(d) Cl'awr
115. Radon contained in water is to some extent transferred into room air as a result of agitation or heating. Radon concentrations are as a rule much lower in surface ivater than in ground water. In water- saturated soil with a density of 1.6 lo3 kg m--?, porosity of 20% and emanating power of 20% a 226Ra activity mass concentration of 25 Bq kg-' yields at equilibrium a I"Rn concentration in ground water of
25 Bq kg-Ix 1.6 lo3 kg nl-?x 0.2/0.2 = 4 lo4 Bq m-3
In surface water, radon concentrations are expected to be similar to those of ?26Ra, that is, about 10 Bq m-!.
116. The release of radon from water to air depends upon the circumstances in which the water is used, as the degassed fraction increases considerably with temperature [G5]. Studies of radon transfer from tap- water to indoor air reported a use-weighted transfer efficiency of 0.5-0.6 and an average water use of 0.2-0.4 m3 per day and 'per person [G5, P2]. Degassing of radon from tap-water has been found to lead to elevated indoor radon concentrations in Canada [M7], Finland [C2] and the United States [G6]. Taking the air-to-water concentration ratio to be typically lo-" [C6]. an indoor air concentration of 400 Bq m-j is obtained if the radon concentration in water is 4 MBq m-3. High concentrations in water are usually associated with deep wells drilled in granitic areas; the highest reported concentrations in water are 14 MBq rn-) in Canada [M7]. 77 MBq m-' in Finland [S68] and about 20 MBq m-3 in the United States [G6, S181. The use of aeration can reduce the radon concentration in water by a factor of about I00 [C2].
117. Measurements of radon concentrations in water have mostly been undertaken in regions where high levels were suspected. Measurements intended to estimate the weighted average radon concentration in water for a country or a community are rare. Results of that nature are only available for Finland, Sweden and the United States. In Finland, the population- weighted average has been estimated to be 25 kBq m-j for drinking water distributed by water-supply plants [A2, C2], and about 60 kBq m-3 when the contribu- tion of private wells is included [K4]. The correspond-
ing value in Sweden has been found to be 38 kBq m-' [K24]. In the United States. the geometric mean radon concentrations in municipal ground-water supplies in the central part of the United States and in Texas were found to be about 4 kBq m-3 [P3. W3] and 5 kBq m-I [W3]. respectively. I t was tentatively estimated in the UNSCEAR 1982 Report (Annex D, paragraph 163) that between 1% and 10% of the world's population consumes water containing radon concentrations of the order of 100 kBq m-j or higher, drawn from relatively deep wells. For the remainder, who consume water from aquifers or surface sources. the weighted world average concentration is probably less than 1 kBq mP3.
118. The radon entry rate due to water degassing may be expressed as
U , = ~ ~ Q , E / V (2.11)
where x , is the radon concentration in water (Bq m I);
Q, is the amount of water used per unit time (m3 h- I ) ;
E is the degassing efficiency; and V is the volume of the reference house (m'). Assuming a radon concen- tration of 1,000 Bq m-3 in tap-water. a degassing efficiency of 0.5, a water use rate of 0.07 m' h i . corresponding to 0.4 m' per day for each of the four persons living in the reference house. the radon entry rate is estimated to be about 0.1 Bq m-j h-I; the corresponding mean radon concentration is 0.1 Bq m-' in the reference house, with a very uneven distribution within the dwelling, the highest concentrations being expected in the rooms where radon is released (bathrooms and kitchen). In any case. average radon concentrations in tap-water do not bring a significant contribution to the total radon entry rate in buildings, except. however, when the water contains high con- centrations of radon. Figure XI11 shows the variation of concentrations in indoor air for a house with a radon concentration in tap-water of about 2 MBq m-' [G6]; the peaks are associated with periods of high use of water in the house. The integrated radon concentra- tions represented by each of the peaks in Figure XI11 are 200-400 Bq h m--'. Assuming that the characteristics of the surveyed house are the same as those of the reference house yields a water use of 0.05-0.1 m3 per peak.
( E ) Natural gas
119. Natural gas is sometimes mentioned as a potential significant source of indoor radon. The radon concentration in natural gas at production wells varies from undetectable values to levels of about 50 kBq m--' [G7, H2, 53, W4]. The industrial process- ing of natural gas involves the removal of impurities and separation of hydrocarbons. Some of these hydrocarbons are bottled under pressure for sale as liquefied petroleum gas (LPG) while others may be used for fuel. Some of the radon activity contained in the processed natural gas decays during the transit time between processing and use, or while it is stored in the bottles. When natural gas is burned in houses for cooking or space heating the radon that is released may enhance the radon level indoor if the appliances are unvented. If the combustion products are vented outside the house, this radon source is neghgible.

- I I
4:WPU O:WPM !zOoJU 4:WAU 0:W Arc l:WPL( 4:W PU 0:WPu Zm T I M E OF DAY
Figure XIII. Variation of the radon concentration in indoor alr of a house wlth radon concenlralion in water of about 2 MBq m-1
[G61
120. The radon entry rate from the use of natural is negligible o r the ventilation system in the basement gas may be expressed as is separate from that of the living areas of the
U n g = x n g ~ n g 1 V (2.12) building.
where z,, i+ the radon concentration in natural gas (Bq m-'); Q,, is the amount of natural gas used per unit time (m3 h-I); and V is the volume of the reference house (I) . Radon concentrations in natural gas and LPG have mainly been measured in the United States, where the average radon concentrations in either natural gas or LPG have been found to be about 1,000 Bq m-' [G8, 531. For a consumption rate of 2 m3 d-I in unvented appliances, the radon entry rate in the reference house is estimated to be about 0.3 Bq m-' h-I. The corresponding contribution to the radon concentration is 0.3 Bq m-'.
Il) Summary
121. Table 17 summarizes information on the esti- mates of radon entry rates in the reference house. The estimated arithmetic mean value obtained is 50 Bq m-' h-I, in agreement with arithmetic means of experimental surveys [NS]. High values can be traced to a substantial flow of soil gas from the underlying soil, the use of alum shale as a building material o r elevated radon concentrations in tap-water. It should be noted, however. that all other contributors remaining the same, the relative importance of the flow of soil gas is less in apartment buildings because the ratio of volume to ground-floor surface is much larger for them than for the reference house. Its relative importance is also less if dwellings are built in such a way that the contribution of the radon entry rate from underlying soil to the total radon entry rate in living areas is very small. because either the infiltration rate from the soil
2. Indoor behaviour of radon and radon daughters
122. Radon entering indoors accumulates as a func- tion of the air exchange rate in the bui!ding. The activity of radon that will accumulate within a building is limited by its removal through ventilation. normally expressed as the air exchange rate (measured in air changes per hour). Radon decay product concentrations are similarly limited; in addition, they can also be subject t o plate-out mechanisms. not directly connected with room ventilation rate, which will keep their concentration below that of radon.
(a) Radon
123. Assuming an instantaneous and homogeneous mixing of radon in the building, the variation of the indoor radon concentration can be described by
where x,(t) is the radon activity concentration at time t in Bq m-3; U(t) is the radon entry rate at time t in Bq m-3 h-I; A,, is the decay constant of radon, 7.6 lO-'h-': and iv is the air exchange rate a t time t in h-I.
124. If the radon entry rate (u) and the ventilation rate (I.,) are constant with time, the radon concentra- tion at equilibrium is given by

If the contributions from outdoor air and pressure- driven flows through the soil are small, the indoor radon concentration at equilibrium is, as a first approximation, inversely proportional to the air ex- change rate. This is illustrated in Figure XIV, which presents data from an experiment in which a balanced mechanical system-that is, one with equal intake and exhaust flows-was used to vary the air exchange rate i , without affecting the pressure-driven flow from the soil [N5].
125. E q u ~ t i o n (2.14) can only be used as a first approximation of the mean indoor radon concentra- tion, as it is based on assumptions that are usually not strictly valid. They are as follows: (a) the radon concentration within the building is assumed to be homogeneous. There is in fact essentially universal
I I 1 I
0.01 0.1 1 10
A I R EXCHANGE RATE ( h ' l j
Figure XIV. Average steady-state radon concentration in a residence as a function of ventilation rate. (The dashed line
indicates a constant radon source of 90 Bq rn-3 h-1). [N51
agreement that the radon concentrations decrease as the storey numbers of a multi-storey building increase, especially between the basement, first and second floor [ G I , G9, G10, SIO]. In the upper storeys of high-rise buildings. the radon concentration does not always decrease as the storey number increases. The presence of direct routes, such as lift shafts and service ducts between the basement, or even the sub-basement level, and higher storeys can distort the radon concentration gradient; (b) the air exchange rare is assumed to be constant with time. Actually, it is subject to important variations, as it is a function of human activities (opening or closing doors or windows. turning ventilation systems on o r off) and of meteoro- logical conditions (wind speed and direction, tempera- ture. pressure). Figure XV shows the measured varia- tion of the air exchange rate in an occupied house over a few days, together with the wind speed observed at a weather station 20 km away from the house [N6]. The air exchange rate is shown to vary from 0.5 h-' to more than 4 h-I in a matter of a feu hours: there is in that particular case a good correla- tion between the wind speed and the air exchange rate, as predicted by the model of Grimsrud et al. [G25]; (c) the radon entry rate is assumed to be constant with time. In fact, as shown in Figure XII, the entry rate may experience significant changes in the course of one day owing to variation with time of the different radon sources discussed in the previous section.
126. According to equation (2.14), there is a clear relationship between the radon concentration and the air exchange rate. However. simultaneous measure- ments of the air exchange rate and of the instantaneous radon concentration have been performed in three surveys involving 98 houses, including both energy- efficient and conventional houses. The surveys failed to reveal such a correlation between the indoor radon concentration and the air exchange rate, although each parameter varied over a wide range [N3]. Similar results were obtained from time-averaged measure- ments [DZ] (Figure XVI).
0 I I I I f
15 March :6 t larch 17 :,larch 18 March 19 March
Figure XV. Variation of the ventilation rate in an occupied house. The wind-speed data represent obse~ations at a weather station 20 krn away from the house.
IN61

(b) Radon decay products
Fargo Portland Charleston Colorado Springs
0.1 1 . o 10
A I R EXCHANGE RATE (!I-')
Figure XVI. Scatter plot of radon-222 concentratlons versus air exchange rate for 58 houses in four cities. Measurements were made during a four- to five-month period between
November 1981 and May 1982. ID21
127. Even though equation (2.14) is very simple and can be used to derive a typical value of the mean indoor radon concentration (for example, %,= 55 Bq mP3 with the radon entry rates given in Table 17 and i., = 1 h-I), it is clear that the prediction of the actual radon concentration (and of its variation as a function of time) in a given building cannot at this stage be made with accuracy. Figure XVII shows that the variation of the indoor radon concentration over one week has no consistent pattern [ G I I]. Further theore- tical and experimental work (as in [B26]) is required to derive the values of x,. U and i., from the measurements of environmental and technological parameters.
128. When an atom of 2'8Po is formed through the decay of radon, it is a free ion. Molecules of water vapour or trace gases coalesce almost immediately around the ion. forming a molecular cluster of 2-20 nm in diameter (Figure XVIII). The ion and the cluster are usually referred to as free, uncombined o r un- attached decay products. Unattached 218Po is highly mobile and, after 10-100 s, it attaches to an aerosol particle (normal size in the range of 50-500 nm: see Figure XIX); the other options offered to unattached '18Po are to plate out on the indoor surfaces, to be transported outdoors with the outgoing air o r to decay into unattached *I4Pb. Attached 2'8Po is relatively immobile and its plate-out on indoor surfaces is sometimes ignored. The various processes are illustrated in Figure XIX. The attached and the unattached decay products are often distinguished by their environmental behaviour and deposition pattern in the respiratory system. In a series of air samples, the position and size of the peak related to the unattached fraction may vary for reasons not yet completely elucidated [K 163.
129. Upon alpha decay of attached Z16Po. the decay product ?14Pb thus created may remain on the aerosol o r indoor surface o r become unattached as the result of its recoil energy. Subsequently, the behaviour of ?I4Pb is similar to that of ?I8Po. Upon the decay of attached *I4Pb, the *I4Bi created typically remains attached. since the recoil energy irom beta decay is not sufficiently large to promote detachment. The indoor behaviour of the radon decay products is illustrated in Figure XX, where subscripts 1, 2 and 3 relate to decay products 218Po. 214Pb and :IJBi, respectively, and superscripts fr, a and s designate the unattached state, the attached state and the presence on indoor surfaces [B I]. Dotted lines denote the processes that have been neglected in this treatment. This model of indoor behaviour of radon decay products was first proposed by Jacobi [J4] and has subsequently been extended and modified by a number
o L a I I I I I I 12h 24h 12h 24h 12h 24h 12h 24h 12h 24h 12h 24h 12h
14 December 15 December 16 December 17 December 18 December 19 December 20 December 1977
Figure XVII. Variation with time of Indoor radon concentrations. [ G H I

O I C Y d -
o * r r a -
1 2 4 1 0 2 0 4 0 1 0 0 2 0 0 4 0 0 1 0 0 0 PARTICLE DIAMETER (nm)
Flgure XVIII. Histograms of size distribution of radon decay products. [GI11
r - - - - - - - ' - - - - - - - - - - - - - - - - - - - - I RADON I I EXHALATION
RAOON
PLATEOUT
Flgure XIX. The basic processes lnfluendng the activity balance of radon decay products.
[PSI
RA00r.I + RADOll DECAY PRODUCTS
I RADON
I I
I N D O O R S I
Flgure XX. Flow chart of radon decay product behaviour under maraga condltlons.
[ B l l

of researchers. notably Porstendorfer et al. [P4. PSI, Shimo et al. [S46, S48, S49] and Bruno [Bl]. The plate-out rate constant of unattached radon decay products can be expressed as i. = v,S/V. where v, is r the deposition velocity (m h- ), S the total surface area in the room and V the volume of the room. The deposition velocity is about 2 m h-I for unattached daughters in still air [G12, K5, P5]. The surface to volume quotient S/V is estimated to range from 3 to 6 m-I in rooms of dwellings if the furniture is taken into account [PSI. The plate-out rate constant would therefore be about 10 h-I in still air. In ventilated rooms. the deposition velocity increases with the air speed so that the plate-out rate constant is expected to range from 10 to 30 h-I in dwellings. Values reported in the literature on the subject range from 2 h-I to 200 h-I [I7, I9,J4, K5, K 17, P4, S 1 I, S44, L+'5].
130. The deposition velocity for attached daughters is approximately two orders of magnitude less than that for unattached decay products. leading to plare- out rate constants of 0.1-0.3 h-I [K5, P5]. Conse- quently, plate-out of attached decay products is negligible as a removal mechanism relative to decay and ventilation.
131. The attachment rate X to aerosol particles has been shown by Porstendorfer and Mercer [P6] to be a linear function of the particle concentration
X = p Z (2.15)
where p is the attachment coefficient in cm3 h ' and Z is the particle concentration in ~ m - ~ . Reported values of the attachment coefficient range from 1.8 lo-' cm' h-I to 7.4 10-?cm3 h'-I [P5]. For indoor air. an average attachment coefficient of 5 10-'cm3 h-I may be assumed [P5]. The aerosol concentration indoor depends mainly on the outdoor particle concentration, the ventilation rate and the indoor sources of particles. Figure XXI presents the measured variation of aerosol concentra-
Outdoors
O Indoors
--a' c a o o ~ 6
00 - O0% 0 Ba. sa
==='oaoo 0 0 4
WINDOW CLOSED Y11100U SLIGHTLY OPtll
lo3 1 h i2 i 6 zb 4 4 b 12 i6 20 24
I
23 June 1983 24 June 1983
TINE OF DAY (hour)
Figure XXI. Diurnal variation of aerosol concentrations out- doors and indoors of a buildlng for different ventilation rates.
[PSI
tions indoor and outdoor for different ventilation rates [P5]. For high ventilation rates, the particle concentration ranges between lo4 and 10' cm-3 and is about the same indoors and outdoors. For low ventilation rates, the indoor particle concentration typically ranges from 2 10' to 2 lo4 cm-3 [PSI. There- fore the attachment rate X is expected to vary from 10 h-I to 500 h-I, according to the indoor particle concentration. Average values between 20 and 50 h-' may be expected in closed rooms with low ventilation rates [P5].
132. The probability for recoil detachment from aerosol particles upon alpha decay, also called recoil factor, has been studied from the theoretical and experimental point of view by Mercer [M4]. The recoil energy possessed by a daughter product after alpha decay is about 100 keV, corresponding to a range of about 0.1 pm in solid material. For a typical aerosol of median diameter 0.2 pm, the recoil factor is about 0.8 [M4]. Upon beta decay, the recoil energy is only a few electron volts. yielding a recoil factor of 0.01-0.02 [P4]. The detachment from walls and other surfaces has not been examined in detail in any work to date; i t would be expected that 25-50% of deposited activity could re-enter the room air mainstream upon alpha decay [Bl, MI].
133. As already indicated. the equilibrium factor F is defined as the ratio of the equilibrium equivalent radon activity concentration to the radon activity concentration:
F = CYeq.Rn)/%ttn (2.16) with
x c q , R n = 0 . 1 0 5 ~ ~ + 0 . 5 1 6 ~ ~ + 0 . 3 7 9 ~ ~
where 2, . x2 and x3 represent the activity concentra- tions of polonium-218, lead-214 and polonium-214, respectively. The unattached fraction f, is usually defined as the ratio of the equilibrium equivalent radon concentration in the unattached state and of the total:
It is also, however, sometimes defined as the ratio of the equilibrium equivalent radon concentration that is in the unattached state and of the radon concentra- tion:
Thc fact that two different definitions may be used for the same quantity leads to a certain amount of ambiguity in the interpretation of the results reported in the literature when the definition used is not clearly specified. The same ambiguity exists when the un- attached fraction of a given decay product of radon is reported, as the denominator of the equation call be the radon activity concentration, the total equilibrium equivalent radon activity concentration, or the equi- librium equivalent radon activity concentration of the decay product under consideration. In this Annex, it is assumed in all cases that the denominator of the equation consists of the equilibrium equivalent radon concentration, as, for example, in equation (2.17).
134. Bruno [BI ] used the results of the survey conducted by George et al. [GI I] on long-term

average concentrations of radon and radon decay product in 21 houses in the New York area to derive the best fit for the attachment rate and the plate-out constant rate. Assuming a ventilation rate of 1 h-I, an equilibrium factor of 0.5 and a relatively high unattached fraction of 0.07, Bruno obtained i p , = 8 h-I and X = 45 h-I, as shown in Figure XX, and indicated that the model would be more accuratelv validated with the help of simultaneous measurements of ventilation rate. radon concentrations and concentra- tions of attached and unattached 21BPo [B I].
135. Using another approach, Porstendorfer [P5] analysed the sensitivity of F and f, to the variations of some influencing parameters. H e concluded that F and f, are only slightly influenced by the outdoor concentrations of radon daughters (for i.,< 1 h-I), the value of the recoil factor, the radon exhalation rate and the plate-out rate of attached decay products; however, F and f, are greatly influenced by the plate- out rate of the unattached daughters and by the aerosol concentration in the room (Figure XXII). The theoretical curves shown in Figure XXII conform well to the experimental data for A, = 20-30 h-I. Since in most cases the aerosol concentrations in dwellings with low ventilation rates (i,,< 0.3 h-I) vary between 5 lo3 and lo4 cm-? (corresponding to attachment rates of 25-50 h-I [P5]), F values between 0.25 and 0.4 and f, values between 0.05 and 0.1 can be expected. This is in agreement with the experimental results of Wicke [W6] and Keller et al. [K6]. who measured median F values of 0.37 and 0.33, respectively. in buildings in the Federal Republic of Germany. In another study, however, it was claimed that the model tends to underestimate the equilibrium factor. as measured values of the deposition rates of unattached radon decay products in occupied buildings are found to be smaller than those obtained in laboratory experiments [S441.
1 0 l o o 1 0 0 0 ATTACWIEIIT RATE ( X ) ( h - l )
AEROSOL CO~.ICENTRAT ION ( x l o 3 , ) 2 4 6 1 0 2 0 4 0 8 0
Figure XXII. Equlllbrlum factor and unattached fraction tor radon decay producls as a tunction of aerosol concenlratlon.
[PSI
1 . 0
136. The influence of the particle concentration on the equilibrium factor is further illustrated in Figure XXIII [S43], which shows the results of a study in which the equilibrium factor increased from 0.1 to 0.8 as the particle concentration varied from 1,000 to 25,000 cm-'. a range typical of the indoor environment. Because of the great influence of the aerosol concentration in buildings on the equilibrium factor and on the unattached fraction, it is recommended that more simultaneous measurements of the equilibrium factor and the aerosol concentration be conducted.
PARTICLE CONCENTRATION ( p a r t i c l e s one3)
I I I I I
Flgure XXIII. Equilibrium factor Fversus partlcle concentratlon- Measured data and represenlatlve uncertainties are Indicated by the solld clrcles and error ban. The solld line Is based on calculated values for total radon decay products. while the dashed line Indicates calculated values for unattached radon
decay products. [S431
Room aerosol
0 Enhanced aerosol concentrat ion by c i g a r e t t e smoking
137. In summary, the basic processes influencing the concentrations of the radon decay products in indoor environments are qualitatively well known. Quantita- tively, i t seems that the largest uncertainty lies in the determination of the plate-out rate of unattached decay products A,,. Morc simultaneous measurements of the equilibrium factor and of the unattached fraction, together with the aerosol concentration and the ventilation rate, are necessary in order to obtain a clear and consistent picture.
6 . 2 5
138. Information on the equilibrium factors measured in several surveys is given in Table 18. In the Swedish survey [SIZ], simultaneous measurements of the air exchange rate and of the equilibrium factors were perforded; the equilibrium factor was found to increase as the air exchange rate decreased ( F = 0.33 for i , > 0.6 h-I: F = 0.51 for i.,.< 0.3 h-I). The average values obtained in the sunleys listed in Table 18 lie between 0.3 and 0.8, most of the values being o n the low side of this range. In this Annex, a value of 0.4 is adopted as the average equilibrium factor for radon

decay products in dwellings. This is slightly lower than the figure of 0.5 selected in the UNSCEAR 1977 and 1982 Reports [U2, Ul].
3. Results of indoor surveys
139. Large-scale surveys, usually involving more than 100 dwellings, have recently been completed or are in progress in several countries (Table 19). The purposes of these large-scale surveys are to study the distribution of population exposures, search for pro- blem areas, or suggest remedial action to reduce elevated natural levels or man-made enhancements. An analysis of the results presented in Table 19 shows that (a) in all cases, the radon and radon decay product concentrations fit as a first approximation, a log-normal distribution. As an example, Figure XXIV shows the histogram of indoor radon concentrations obtained in a survey in Sweden [M30, SS], which conforms reasonably well to a log-normal distribution with a geometric standard deviation of 3.4. The geometric standard deviations reported in Table 19 range from 1.6 to 5.2. The medians of the equilibrium equivalent concentrations of radon range from less than 4 Bq m-3 in Poland [GI31 to about 30 Bq m-' in Sweden [S8] and Switzerland [B4]: in the tail of the distribution, relatively high concentrations of the order of 100 Bq rn- j (EEC) or more were obtained; (b) the highest radon concentrations were caused by a high influx of radon from the soil, a high exhalation rate from building materials, a high radon concentra- tion in tap-water or a combination of the above factors, depending on environmental characteristics and the building design. In houses, a large fraction of the highest radon concentrations could be consistently attributed to high radon entry rates from the soil; in apartments, the influence of building materials was more important: (c) in most of the older surveys
radon and/or radon decay products were sampled under conditions leading to high concentrations (base- ments or unventilated rooms). I n more recent surveys, the sampling has been carried out over periods lasting from a few weeks to a year in order to average out the temporal variations: the spatial variations could also be taken into account by installing the measuring devices in two or three locations (living-room. bed- room, basement). Thus. the intention in recent surveys was to attempt to assess the exposures in buildings under realistic as opposed to worst-case conditions; and (d) owing to the large influence of the radon influx from the soil, radon concentrations tended on average to be greater in houses than in apartments. This was clearly shown in the Swedish survey [S8], as well as in the survey from the Federal Republic of Germany [W15], and may explain the relatively low radon concentrations in Poland [GI31 and Austria [S16. S171, where a large proportion of the dwellings are apartment buildings.
140. In the UNSCEAR 1982 Report (Annex D, paragraph 203) it was estimated that the mean indoor equilibrium equivalent concentration of radon was 15 Bq m-3 in the temperate regions of the world. The results presented in Table 19, although preliminary for a few surveys, make i t possible to reassess this value. The population-weighted mean of the indoor radon concentrations obtained in the nation-wide surveys was calculated assuming a log-normal distribution and a geometric standard deviation of 2.5 for countries that reported only the median concentration. The countries considered in the assessment are in the temperate and high latitudes and represent about 750 million people. The population-weighted mean indoor concentration is found to be 5 1 Bq m-) while the arithmetic mean of the country means is 55 Bq m-j. This is in agreement. perhaps as a coincidence, with the mean radon concentration of 50 Bq obtained
1 NOOOR RADON CONCENTRAT 1 ON ( Bq ~ n - ~ )
Flgure XXIV. Dlrtributlon of Indoor radon concontratlons In Swedish homes. [M30, SB]

for the reference house with a radon entry rate of 50 Bq h-I md3 and an air exchange rate of 1 h-I. Using that round value of 50 Bq m-3 and an average equilibrium factor between radon and its decay products of 0.4 yields an average indoor equilibrium equivalent concentration of radon of 20 Bq m-3 in the temperate regions of the world: the geometric standard deviation of the distribution is expected to be about 2.5.
141. There is little information on the indoor radon concentrations in the tropical regions. At Bombay, India, an indoor radon concentration of 19 Bq m-" and an equilibrium factor of 0.43 are reported as typical for normal areas [M29], while a mean radon concentration of 34 Bq m-I may be derived from indoor measurements at Hong Kong [T13], which is not thought to be representative of tropical regions. It is safe to assume that the mean indoor radon concentrations in tropical regions are smaller than in temperate latitudes but the data base available is too small to allow a reliable assessment to be made. Possible values of the population-weighted world average of the indoor conckntrations of radon gas, taking into account that the population in tropical regions is about half that in temperate latitudes, range from 33 Bq m-3 (assuming that the radon concentra- tion in tropical regions is equal to zero) to 50 Bq m-I (assuming that the niean radon concentration in tropical regions is the same as that in the temperate zones). I t is tentativelv assumed in this document that the population-weighted world average of the indoor radon concentrations is 40 Bq m-j. The same method can be used for the equilibrium equivalent radon concentration: the range of possible values is from 13 to 20 Bq m-3 and the mean population-weighted world average of the indoor equilibrium equivalent concentrations of radon is tentatively assumed to be 15 Bq m-3.
C. EXPOSURE-DOSE RELATIONSHIPS
1. Inhalation
(a) Relationships from rhe UNSCEAR 1982 Report
142. Because of their different physical properties, radon gas and radon decay products are considered separately. Inhaled radon, being a noble gas, is constantly present in the air volume of the lungs at the concentration in air and is partly dissolved in soft tissues. Taking the solubility factor for soft tissues to be 0.4 and assuming that the short-lived decay products decay in the same tissue as radon gas, the following relationship for soft tissues other than the lungs was derived from [I2]:
In the case of the lungs, in addition to the dissolved radon, the radon content of air in the lungs must be taken into account. Assuming the air volume in the lungs to be 3.2 lo-' m1 for Reference Man and assuming further that the short-lived decay products
will stay in the lungs. the dose rate due to alpha- radiation was obtained as [IZ]:
D,,,, (nGy h-I) = 0.04 xRn..,, (Bq m-3) (2.20)
Taking a quality factor of 20 for alpha-radiation and applying a weighting factor of 0.12 for the lungs and of 0.88 for the other tissues. the effective dose equivalent rate was calculated as
H ~ , ( n ~ v h-1) = 0.18 x ~ , . ~ , , ( ~ q m-3) (2.21)
143. For the short-lived decay products of radon. use was made of the potential alpha-energy intake by inhalation during time period T, which is given by
I,,, = Ei.4 I," T %,.R" (2.22)
where I,, is expressed in joules; E/A = 55.4 10-lo J Bq-' is the potential alpha energy per unit of inhaled equilibrium equivalent activity; I,, is the mean breathing rate, taken to be equal to 0.8 m3 h-I indoors and 1 m3 h-I outdoors; T is the time period in hours; %,,.R, is the equilibrium equivalent concentration of radon daughters in Bq m--'.
144. The dosimetry must consider two target tissues in the lung: the tracheo-bronchial basal cell layer (T-B) and the pulmonary epithelium (P), the latter including the alveolar region and the non-ciliated terminal bronchioles. In the UNSCEAR 1982 Report (Annex D, paragraphs 140-144), the conclusions of an expert group of the Nuclear Energy Agency (NEA) of OECD [N 151 were adopted after taking into conside- ration various dosimetric models [H3, H4, J5, 56, 573. The Committee indicated that from the dosimetric models, it follows that the conversion factors between the inhaled potential alpha-energy intake I,,, of the decay product mixture and the committed dose equivalent H to the tracheo-bronchial basal cell layer and to the pulmonary epithelium show nearly linear relations with the unattached fraction fp of the total potential alpha energy of the decay product mixture:
HFB/Iw = a,, + bT-, fp (2.23) and
Hp/l,, = ap(l-f,,) (2.24)
where the term a gives the conversion coefficient for the attached decay products, which depends on the activity median diameter (AMD) of the carrier aerosol. It should be noted that the calculated value of I,, applies only to the specified breathing rate.
145. Taking f, = 0.025 and AMD = 0.2 pm for the indoor environment. the different dosimetric models yield
DT-B/lpol = 1.2 - 1.7 GY J-I
and Dp/Ip,,= 0.13 - 0.4 Gy J-'
For the purpose of dose estimation, values of DT-B/Ipol = 1.5 Gy J-I and Dp/I,, = 0.2 Gy J-I were selected. Following the ICRP recommendations [I2], the Committee decided to split the weighting factor for the total lung and to apply a weighting factor w = 0.06 to each of the two target tissues in the lungs. As the doses to tissues other than the lungs can be

neglected. the effective dose equivalent per unit of inhaled potential alpha-energy intake of 222Rn decay products was found to be in the range of
Hcrr/I,,, = 1-3 SV J- ' A reference value of 2 Sv J-I was adopted in the UNSCEAR 1982 Report for indoor exposures.
146. For the exposures in outdoor air. AMD was taken to be 0.1 pm, leading to a dose equivalent per unit intake higher by a factor of 1.5 than those for indoor exposures:
DT-B/Ipot = 2.2 Gy J-I
Dp/I,, = 0.3 Gy J-I
147. Assuming steady-state conditions, the dose rates, in nGy h-I. are, for indoor exposures, approximately equal to
corresponding to effective dose equivalent rates, in nSv h-I, of
148. For outdoor exposures, the dose rates, in nGy h-I, are found to be
DT-B = 12Xcq.Rn and D P = 1.7 x,,.,"
while the effective dose equivalent rate. in nSv h-I, is
As indicated later (paragraph 153). this is an over- estimate.
149. All the dosimetric coefficients given above refer to adult members of the ~ubl ic . correction factors should be applied for infants and children, to account for the age-dependent change in lung mass and breathing rate. The UNSCEAR 1982 Report (Annex D, paragraph 151) estimated on the basis of the NEA expert report [N15] that the effective dose equivalent for the age group of up to ten years might on the average be a factor of 1.5-2 higher than for adults.
(6) Consideration of other information
150. NCRP [N14] estimated the variability of the bronchial dose from inhalation of radon decay pro- ducts due to the uncertainties attached to the many physical and biological parameters which are involved in the calculation of absorbed doses per unit concen- tration of radon decay products. The physical charac- teristics include the fraction of unattached =I6Po in the atmosphere, the daughter product equilibrium, particle deposition models, the particle size distribution in the atmosphere and the physical dose calculation. Among the biological characteristics are the breathing pattern (including nasal deposition), bronchial morphometry, the mucociliary clearance rate, the location of target cells and the mucus thickness.
151. The dosimetric model used by NCRP to derive the bronchial dose is different from that used in the UNSCEAR 1982 Report but the parameters are the same and the uncertainties should be qualitatively
similar. The results obtained by NCRP are given in Table 20 as per cent changes from the nominal annual dose for males. The standard deviation of the annual dose to an individual is estimated to be 120%. if the various factors other than the radon concentration are unspecified. and less than loo%, that is. better than a factor of 2, if some of the parameters are measured or reasonably well estimated [N 141.
152. According to Table 20, the estimate of bronchial dose is very sensitive to the particle size spectrum and to the location of target cells in the tracheo-bronchial tree. The per cent variation in annual dose for a very large shift in the median particle size from an average of 0.125 pm would range from + 100% for the 0.05 pm particle to -20% for the 0.17pm particle.
153. The values of AMD adopted in the UNSCEAR 1982 Report for the calculation of doses in the respiratory system from inhalation of radon decay products were 0.1 pm and 0.2pm for outdoor and indoor exposures, respectively. Reported indoor AMDs are 0.125 pm in the United States [G 1 I] and 0.17 pm (G,= 3.5) in the Federal Republic of Germany [B30, P5]. The doses calculated by the Committee for indoor exposures may thus be slightly underestimated. Regarding the situation outdoors, a significant shift to large particle sizes with a mean AMD of 0.39 pm and a mean G, of 2.3 [P5] was observed in the Federal Republic of Germany [B30]; a similar shift had also been measured in the United States [S45]. In another series of measurements in the United States, the AMD was found to range from 0.09 to 0.37 pm with a mean of 0.16pm [P23]. In the case of outdoor exposures, the doses calculated in the UNSCEAR 1982 Report andshown in paragraph 148 may thus be overestimated by a factor of about 2. If the dose coefficients related to outdoor exposures are divided by two, the resulting values are very similar to the dose coefficients for indoor conditions. In this Annex, the same dosimetric coefficients, in terms of absorbed dose rates per unit equilibrium equivalent radon concentrations, have been used for indoor and outdoor conditions. This implies similar values of the AMD. about 0.2 pm for both indoors and outdoors.
154. The dose factor of 9 nGy h ' per Bq m-< as derived in paragraph 147, is based on a median particle size of 0.2 AMD for both indoor and outdoor exposures and on breathing rates of 0.8 m3 h-I indoors and 1.0 m3 h-' outdoors. Other investigators have developed factors based on other reasonable sizes and rates. as well as other deposition models, without markedly changing the derived dose factors.
155. In the NCRP model [N14], based on the work of Harley and Pasternack [H3], the doses are calculated for the shallow basal cells lying 12pm below the epithelial surface of the fourth generation of the bronchial tree that was found to experience the maximum deposition density. The deposition model was based on the Weibel lung morphometry [W16] as used by several investigators. The average dose factor for adults was 6 mGy h-I per WLM or 10 nGy h-I per Bq m-3 (EEC). Inclusion of later information on morphometry has tended to smooth out the maximum
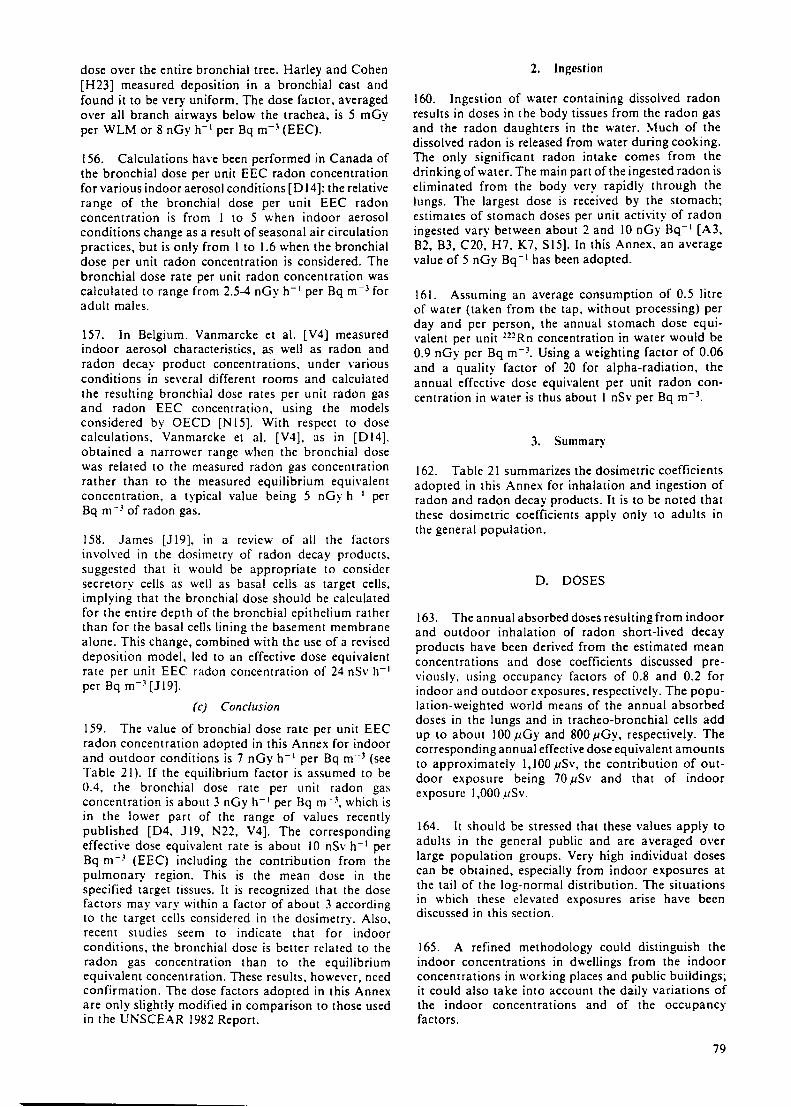
dose over the entire bronchial tree. Harley and Cohen [H23] measured deposition in a bronchial cast and found it to be very uniform. The dose factor. averaged over all branch airways below the trachea. is 5 mGy per WLM or 8 nGy h-I per Bq m-3 (EEC).
156. Calculations have been performed in Canada of the bronchial dose per unit EEC radon concentration for various indoor aerosol conditions [D14]: the relative range of the bronchial dose per unit EEC radon concentration is from 1 to 5 when indoor aerosol conditions change as a result of seasonal air circulation practices, but is only from I to 1.6 when the bronchial dose per unit radon concentration is considered. The bronchial dose rate per unit radon concentration was calculated to range from 2.5-4 nGy h-' per Bq m-3 for adult males.
157. In Belgium. Vanmarcke et al. [V4] measured indoor aerosol characteristics, as well as radon and radon decay product concentrations. under various conditions in several different rooms and calculated the resulting bronchial dose rates per unit radon gas and radon EEC concentration, using the models considered by OECD [NISI. With respect to dose calculations, Vanmarcke et al. [V4], as in [D14]. obtained a narrower range when the bronchial dose was related to the measured radon gas concentration rather than to the measured equilibrium equivalent concentration, a typical value being 5 nGy h- ' per Bq n l - b f radon gas.
158. James [J19]. in a review of all the factors involved in the dosimetry of radon decay products. suggested that i t would be appropriate to consider secretory cells as well as basal cells as target cells, implying that the bronchial dose should be calculated for the entire depth of the bronchial epithelium rather than for the basal cells lining the basement membrane alone. This change, combined with the use of a revised deposition model, led to an effective dose equivalent rate per unit EEC radon concentration of 24 nSv h-I per Bq m-3 [J19].
159. The value of bronchial dose rate per unit EEC radon concentration adopted in this Annex for indoor and outdoor conditions is 7 nGy h-I per Bq m -' (see Table 21). If the equilibrium factor is assumed to be 0.4, the bronchial dose rate per unit radon gas concentration is about 3 nGy h-I per Bq m '?, which is in the lower part of the range of values recently published [D4. J19, N22, V4]. The corresponding effective dose equivalent rate is about 10 nSv h-I per Bq m-' (EEC) including the contribution from the pulmonary region. This is the mean dose in the specified target tissues. I t is recognized that the dose factors may vary within a factor of about 3 according to the target cells considered in the dosimetry. Also, recent studies seem to indicate that for indoor conditions, the bronchial dose is better related to the radon gas concentration than to the equilibrium equivalent concentration. These results. however, need confirmation. The dose factors adopted in this Annex are only slightly modified in comparison to those used in the UNSCEAR 1982 Report.
2. Ingestion
160. Ingestion of water containing dissolved radon results in doses in the body tissues from the radon gas and the radon daughters in the water. Sluch of the dissolved radon is released from water during cooking. The only significant radon intake comes from the drinking of water. The main part of the ingested radon is eliminated from the body very rapidly through the lungs. The largest dose is received by the stomach; estimates of stomach doses per unit activity of radon ingested vary between about 2 and 10 nGy Bq-' [A3, B2. B3, C20, H7, K7, S151. In this Annex. an average value of 5 nGy Bq-I has been adopted.
161. Assuming an average consumption of 0.5 litre of water (taken from the tap, without processing) per day and per person, the annual stomach dose equi- valent per unit 2Z2Rn concentration in water would be 0.9 nGy per Bq m-'. Using a weighting factor of 0.06 and a quality factor of 20 for alpha-radiation, the annual effective dose equivalent per unit radon con- centration in water is thus about 1 nSv per Bq m-'.
3. Summary
162. Table 21 summarizes the dosimetric coefficients adopted in this Annex for inhalation and ingestion of radon and radon decay products. It is to be noted that these dosimetric coefficients apply only to adults in the general population.
D. DOSES
163. The annual absorbed doses resultingfrom indoor and outdoor inhalation of radon short-lived decay products have been derived from the estimated mean concentrations and dose coefficients discussed pre- viously, using occupancy factors of 0.8 and 0.2 for indoor and outdoor exposures, respectively. The popu- lation-weighted world means of the annual absorbed doses in the lungs and in tracheo-bronchial cells add up to about 100 pGy and 800pGy, respectively. The corresponding annual effective dose equivalent amounts to approximately 1,100 pSv, the contribution of out- door exposure being 70pSv and that of indoor exposure 1,000 pSv.
164. I t should be stressed that these values apply to adults in the general public and are averaged over large population groups. Very high individual doses can be obtained, especially from indoor exposures at the tail of the log-normal distribution. The situations in which these elevated exposures arise have been discussed in this section.
165. A refined methodology could distinguish the indoor concentrations in dwellings from the indoor concentrations in working places and public buildings; it could also take into account the daily variations of the indoor concentrations and of the occupancy factors.

Detached M u l t i - High r i s e houses fami ly bu i l d i ngs
houses
Flgure XXV. Median radon concentration levels In dlflerent types of houses.
~ 1 5 1
166. Some information is available on the dependence of indoor radon concentration upon the type of building (see, for example, Figure XXV [WlS]). Further surveys of this type should be encouraged.
167. There is abundant information on the daily variation of indoor radon concentrations. which could be reviewed and used in the refined methodology. Figure XXVI [C16] gives an example of measured diurnal variation of indoor radon concentrations.
168. A survey of diurnal variation of indoor and outdoor occupancy factors has been published in the United Kingdom [B23]: it is presented in Figure XXVII. Occupancy factors reported for populations in China [B24] are similar to those obtained in the United Kingdom.
169. Information of the type presented in Figures XXV, XXVI and XXVII can be combined to estimate refined annual absorbed doses from inhalation of
o Indoors Indoors ( a i rcondi t ioned)
1 I I 1 I I I I I I 1 I I
0 2 4 6 8 10 12 14 16 18 20 22 24
TIPE (hour)
Flgure XXVI. Diurnal variation of indoor radon-222 concentrations. [C161
- Indoors a t home - ..... 1 Indoors elsewhere
- - - - - Out o f doors
- I
I
- - - - - - L - - - - - - - - - - - -I I.. ............. , ............... I L - - - - -
p.r.n.-.r..tl 1 I
I I I I
TIHE OF DAY (hour)
Flgure XXVII. Average occupancy over a whole year In the Unlted Klngdorn. P231
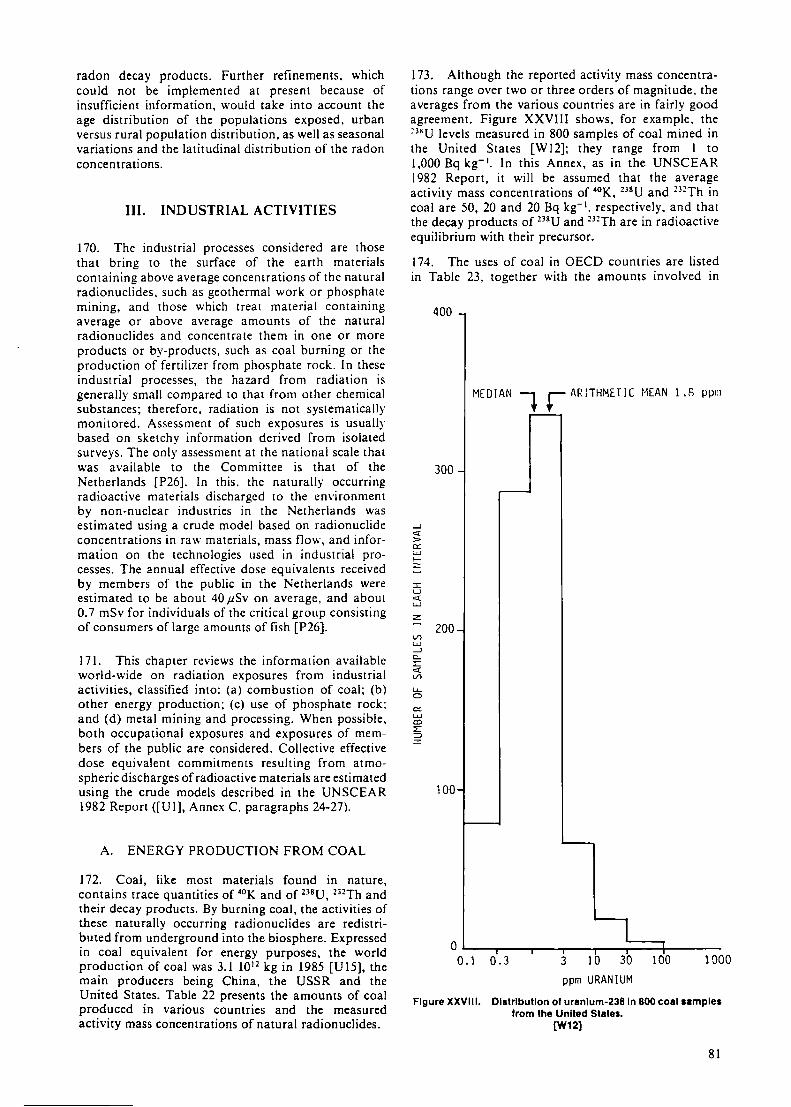
radon decay products. Further refinements, which could not be implemented at present because of insufficient information, would take into account the age distribution of the populations exposed. urban versus rural population distribution, as well as seasonal variations and the latitudinal distribution of the radon concentrations.
111. INDUSTRIAL ACTIVITIES
170. The industrial processes considered are those that bring to the surface of the earth materials containing above average concentrations of the natural radionuclides, such as geothermal work or phosphate mining, and those which treat material containing average or above average amounts of the natural radionuclides and concentrate them in one or more products or by-products, such as coal burning or the production of fertilizer from phosphate rock. In these industrial processes, the hazard from radiation is generally small compared to that from other chemical substances; therefore, radiation is not systematically monitored. Assessment of such exposures is usually based on sketchy information derived from isolated surveys. The only assessment at the national scale that was available to the Committee is that of the Netherlands [P26]. In this. the naturally occurring radioactive materials discharged to the environment by non-nuclear industries in the Netherlands was estimated using a crude model based on radionuclide concentrations in raw materials, mass flow, and infor- mation on the technologies used in industrial pro- cesses. The annual effective dose equivalents received by members of the public in the Netherlands were estimated to be about 40pSv on average, and about 0.7 mSv for individuals of the critical group consisting of consumers of large amounts of fish [P26].
171. This chapter reviews the information available world-wide on radiation exposures from industrial activities, classified into: (a) combustion of coal; (b) other energy production; (c) use of phosphate rock; and (d) metal mining and processing. When possible. both occupational exposures and exposures of mem- bers of the public are considered. Collective effective dose equivalent commitments resulting from atmo- spheric discharges of radioactive materials are estimated using the crude models described in the UNSCEAR 1982 Report ([Ul], Annex C. paragraphs 24-27).
A. ENERGY PRODUCTION FROM COAL
172. Coal. like most materials found in nature, contains trace quantities of 40K and of 238U, 232Th and their decay products. By burning coal, the activities of these naturally occurring radionuclides are redistri- buted from underground into the biosphere. Expressed in coal equivalent for energy purposes, the world production of coal was 3.1 loJ2 kg in 1985 [UIS], the main producers being China, the USSR and the United States. Table 22 presents the amounts of coal produced in various countries and the measured activity mass concentrations of natural radionuclides.
173. Although the reported activity mass concentra- tions range over two or three orders of magnitude. the averages from the various countries are in fairly good agreement. Figure XXVIII shows, for example, the 23XU levels measured in 800 samples of coal mined in the United States [W12]; they range from 1 to 1,000 Bq kg-'. In this Annex, as in the UNSCEAR 1982 Report, it will be assumed that the average activity mass concentrations of "OK, "SU and 23?Th in coal are 50, 20 and 20 Bq kg-'. respectively. and that the decay products of ?"U and ?j2Th are in radioactive equilibrium with their precursor.
174. The uses of coal in OECD countries are listed in Table 23. together with the amounts involved in
ppm URANIUM
Figure XXVIII. Dlstrlbution of uranium-238 in 800 coal samples lrom the United States.
w121

several countries 1061. Most of the coal is used in electric power stations and in coke ovens: even though the use of coal for space heating is not as important as it was years ago, i t is still significant in some countries. I t will be assumed that. on a world-wide basis. 70% of the coal produced is burned in electric power stations, 20% in coke ovens and 10% in houses.
175. Radiation exposures occur throughout the coal fuel cycle, which consists of (a) coal mining; (b) use of coal: and (c) use of fly ash. Occupational exposures and exposures of members of the public are estimated, in so far as data are available. It should be emphasized. however, that the contribution of radiation hazards to the overall health and environmental impact resulting from the exploitation of coal is generally estimated to be quite small (see, for example, [B39], [U16] and [M 1 71).
1. Coal mining
176. Coal miners are exposed to coal dust and the decay products of radon and thoron. Coal mines are usually well ventilated to keep the methane and dust levels low; consequently, the radon concentrations are also relatively low. Table 24 summarizes published measurements from several countries. Radon concen- trations in coal mines are comparable to those observed in dwellings. From measurements in British coal mines, a maximum individual effective dose equivalent of 1 mSv per year, and an upper limit for the normalized collective effective dose equivalent of 3 man Sv per GU' a have been calculated [C13, R4]. Unquantified additional exposures may result from the activity present in mine water [T8].
177. The global production of electrical energy by coal burning was about 600 GW a in 1980. resulting in an upper estimate of the total collective effective dose equivalent to coal miners of 2,000 man Sv. This figure is taken to represent the collective effective dose equivalent for the world for one year of mining coal. including the mining of coal for purposes other than electrical energy production.
178. Members of the public are exposed to the radon activity present in the exhaust air of coal mines. There are currently no measured data on emission of radon from coal mines. I t can be assumed, as in [S32], that 20% of the radon contained in the ore is released during the mining process and that the radon release rate from the exposed ore surface is a factor of 7 greater than that resulting from mining. Taking the mass of coal required to produce an electrical energy of I G W a to be 3 lo9 kg and a mean radon concentration in coal of 20 Bq kg-'. the normalized radon release from coal mines would be 36 GBq per GW a. Another method consists in scaling the radon releases from coal mines to the radon releases from uranium mines, taking into account an average factor of 1,000 between the average activities of 226Ra per unit mass of uranium ore and of coal [J15]. This method leads to a normalized radon release from coal mines of 600 GBq per GW a. The normalized collective effective dose equivalent commitments corresponding
to the two values of radon releases are 6 and man Sv per GW a.
179. Using the two methods described in the previous paragraph, the activity of radon released per year from coal mining all over the world is estimated to be 30 TBq and 800 TBq, resulting in collective effective dose equivalent commitments of about 0.5 and 10 man Sv, respectively. Although differing by a factor of 20, the latter values are small compared to other radiation exposures from the coal fuel cycle and do not deserve further investigation.
2. Use of coal
180. The uses of coal that are considered here are electrical energy production, carbonization and space heating in dwellings.
(a) Coal-fired pobcer planrs
181. In the production of electric power, coal is burned in furnaces operating at temperatures of up to 1,700" C. About 3 lo9 kg of coal is required to produce 1 GW a of electrical energy. In the combustion process, most of the mineral matter in the coal is fused into a vitrified ash. A portion of the heavier ash, together with incompletely burned organic matter. drops to the bottom of the furnace as bottom ash or slag. The lighter fly ash, however, is carried through the boiler, together with the hot flue gases and any volatilized mineral con~pounds, to the stack. where, depending on the efficiency of emission control devices, most is collected while the rest (escaping fly ash) is released to the atmosphere. Table 25 presents the ash content of coal burned in the United Kingdom in power stations and for other uses, together with the amounts of ash produced; it is clear that coal combustion in coal-fired power plants accounts for the bulk of the total ash production. The correspond- ing information on the atmospheric emissions of particulates (Table 26), however. indicates that the power stations are a small contributor to the total emissions of particulates, implying that the efficiency of the emission control devices used in power plants is rather high.
182. The radionuclides included in the non-combus- tible mineral matter of coal are partitioned between the bottom ash and fly ash, except for the gases and volatilized minerals, which are incorporated directly into the flue gases. In large power stations. there is about 20% bottom ash and, therefore, 80% fly ash. Owing mainly to the elimination of the organic component of the coal, there is approximately an order of magnitude enhancement of the activity concentrations from coal to ash. Consequently, the natural radionuclide concentrations in ash and slag from coal-fired power stations are significantly higher than the corresponding concentrations in the earth's crust. The arithmetic averages of the reported activity mass concentrations in escaping fly ash are 265 Bq kg-I for 40K, 200 Bq kg-' for 238U, 240 Bq kg-I for 226Ra, 930 Bq kg-' for 2'0Pb, 1,700 Bq kg-! foraOPo, 70 Bq kg-' for 232Th, 110 Bq kg-' for 22aTh and 130 Bq kg-' for

f"Ra ([Ul], Annex C , paragraph 11). There is an enrichment by a factor of about 3 for 210Pb and 5 for *"Po in relation to the rest of the "8U decay series. This is probably because of the volatilization of "'Pb and 210Po during the combustion and a condensation of these radionuclides down the flue line on the finer fly-ash particles.
183. The activities of natural radionuclides discharged to the atmosphere from a power plant per unit electrical energy produced depend on a number of factors such as the activity concentration in coal, the ash content of the coal, the temperature of combustion, the partitioning between bottom ash and fly ash, and the efficiency of the filtering system. Marked differen- ces should therefore be expected between the measured activities discharged per unit energy produced from different power plants. Most of the available informa- tion on the normalized atmospheric discharges is presented in Table 27. Apparently, there are two types of coal-fired power plants used throughout the world: older ones, which release about lo%, of the fly ash produced: and more modern ones. which are equipped with sophisticated retention devices and, as a result. release only about 0.5% of the fly ash. Table 27 presents estimates of normalized discharged activities for such older and more modern plants. They have been derived on the following assumptions: the combustion of 3 lo9 kg of coal is required to produce a n electrical energy of I GH' a; fly ash accounts for 80% of the total ash production; the activity mass concentration in coal is 20 Bq kg-' for the radio- nuclides of the 13'U and of the 232Th decay series; and there is an enrichment factor of 3 for "OPb and "'Po. Releases of '12Rn and of 220Rn must be estimated separately because radon is not collected by the particulate control devices. The activities of ::?Rn and of :"Rn released per GU' a have been assessed at 60 GBq on the basis of the conservative assumption that all of the radon activity contained in the coal is discharged to the atmosphere.
184. The main pathways through which the popula- tions living around coal-fired power plants are exposed to enhanced levels of natural radionuclides are inhala- tion during the cloud passage and external irradiation and ingestion follon~ing deposition of activity on the ground. The collective effective dose equivalent commit- ments due to those pathways, normalized to the genera- tion of 1 G W a ofelectrical energy, have been estimated using the crude models described in the UNSCEAR 1982 Report ([UI], Annex C, paragraphs 24-27). Tables 28 and 29 present the results obtained for the reference older and more modem coal-fired power stations, respectively: they amount to about 6 and 0.3 man Sv per G W a. Assuming that, on a world- wide scale, two thirds of the electrical energy provided by coal-fired pouter stations is due to old plants (and one third to modern plants), the average normalized collective effective dose equivalent commitment is approximately 4 man Sv per G W a, while the overall figure for the world for one year of practice is about 2.000 man Sv.
185. The release of I4C-free carbon dioxide emitted by the coal-fired power plants will have the effect of
diluting the natural concentration of IJC in the biosphere. The reduction in the natural 14C collective effective dose equivalent commitment resulting from the release of activity-free carbon dioxide is estimated to be about 60 man Sv per G W a assuming that: (a) the combustion of about 3 Tg of coal is required to produce an electrical energy of 1 G W a; (b) the coal contains 85% carbon by mass: (c) the natural activity mass concentration of I4C in coal is approximately 226 Bq kg-I; and (d) the collective effective dose equivalent commitment per unit release is 110 man Sv per TBq. This reduction in the natural effective dose equivalent commitment would be over thousands of years.
186. Annual individual effective dose equivalents resulting from inhalation during the cloud passage have been estimated. Assuming an effective stack height of 100 m and a uniform wind rose, the annual average of the ground-level air concentration per unit release rate is estimated to be about 4 lo-& Bq m-' per Bq s-'I at approximately I km from the stack. For an individual of the critical group living near a coal- fired power plant producing annually 1 G W a of elec- trical energy. the resulting annual effective dose equivalent would be about I pSv for a modern plant and about 2OpSv for an old plant. The annual effective dose equivalents from ingestion and external irradiation would be of about the same magnitude after 20-30 years of operation. Calculated doses from ingestion are very sensitive to the assumptions made about food-chain transfers. Annual individual doses are, in any case. small; it is worth noting that recent measurements in the environment surrounding coal- fired power plants show no statistically significant increases in the activity concentrations of natural radionuclides in samples of air [T7], precipitation [T7]. soil [B 15. S30, T7], vegetation [S30. T7] o r cattle organs [B16, S30. S31] that could be attributed to the operation of power stations.
187. Only atmospheric discharges have been con- sidered so far, as coal ash is not usually directly discharged into the aquatic environment. It may be stored in ash ponds. from where some activity may leach into the aquifer. Ground water may then carry the leachates into the nearest river. The leachability of the ash is quite low [S27]. however, s o aquatic discharges are not likely to pose a radiation problem. at least in the short term.
188. Radiation exposures of workers in coal-fired power plants are thought to be mainly caused by inhalation of airborne fly ash. Effective dose equi- valents of 150 pSv per year have been estimated in the United Kingdom for the most exposed groups of power station workers on the basis of exposure to a concentration of respirable fly ash in air a f 0.5 mg m-> [C14]. In Yugoslavia, significant concentrations of 210Pb in the urine of individuals working in a coal- fired power plant burning high activity coal have been reported [B 12, B221.
189. Values of collective effective dose equivalent received by workers in coal-fired power plants are not available. An upper estimate can be derived from the

individual effective dose equivalent of 150 pSv per year calculated in the United Kingdom, assuming that a labour force of 500 persons is required to produce an electrical energy of 1 GW a per year. The normalized annual collective effective dose equivalent would be at most 0.1 man Sv per GW a. The global production of electrical energy by coal burning was about 600 GW a in 1980. resulting in an upper estimate of the total collective effective dose equivalent to workers in coal- fired power plants of 60 man Sv.
/b) Domestic use . ,
190. Another major use of coal is domestic cooking and heating. No information has been found in the literature on the environmental discharges of natural radionuclides from this source. The use of coal for cooking and heating in private homes may, however, be estimated to result in high collective dose commit- ments since chimneys are generally low and not equipped with ash removal systems and the popula- tion densities around sources of emission are generally high. Figure XXIX [U16] presents trends in urban smoke concentrations in the United Kingdom and shows that domestic sources, which have decreased in importance since 1960, still remain substantial. I t is estimated that in a simple open fire burning coal, some 3 4 % of the coal is emitted as tarry smoke while in smoke-reducing appliances, which have only been marketed since the early 1970s. only 0.3-0.6% of the coal burned is emitted as smoke [U16]. Smoke is a mixture of soot, tarry matter and inorganic substances, produced when bituminous coal is incompletely burned. Measured activity mass concentrations of natural radionuclides in smoke have not been found, bul they
can be expected to be between those in coal and ash (without enrichment) and are likely to be closer to those in coal. Assuming that the activity mass concentrations in smoke are equal to those in coal and that 3.5% of the coal is emitted as smoke, the annual world-wide atmospheric releases caused by domestic burning of coal are estimated to be 0.7 TBq of 'OK and 0.3 TBq of each of the radionuclides of the and 232Th series (radon and thoron excepted): these figures become 20 times greater if it is assumed that the activity mass concentrations in smoke are equal to those in ash and that the coal burned has a 5% ash content. Taking the average population densities around the houses to be lo3 km-z leads to collective effective dose equivalent commitments resulting from a yearly world-wide use of coal in the range of 2,000-40.000 man Sv. This estimate is highly uncertain, as i t is not supported by any discharge or environ- mental data.
(c) Coke ovenx
191. Coal is also used in vast amounts in coke ovens: however, relevant information on the releases of natural radionuclides from coke ovens has not been found.
3. Use of fuel ash
192. Large quantities of coal ash (fly ash and bottom ash combined) are produced each year throughout the world. The global production of coal equivalent in 1985 was 3.1 1012 kg (Table 22); assuming that coal burned in power stations represents 70% of the total
600 lndus t ry ( i n c l u d i n g r a i l w a y s )
Donies t i c [ 550
Figure XXIX. Smoke: trends in emissions and average urban concentrations in the United Kingdom. tUl61

consumption and that its ash content is 13%, about 280 million tonnes of coal ash are produced annually in coal-fired power stations. Taking the average activity mass concentrations of natural radionuclides in coal to be 50 Bq kg-' for 'OK and 20 Bq kg-' for ?JbU and for '32Th, the average activity mass concen- trations of 'OK, 238U and "?Th in coal ash are estimated to be 400. 150 and 150 Bq kg-'. respectively. Compared with normal soil, the average activity mass concentration of 'OK is similar, but those of ="U and 232Th are six times higher.
193. Coal ash is used in a variety of applications. the largest of which is the manufacture of cement and concrete. I t is also used as a road stabilizer, as road fi l l . in asphalt rnix and as fertilizer. Data on the various uses of coal ash in several countries have been reported [G20]. I t can be estimated that about 5% of the total ash production from coal-burning power stations is used for constructing dwellings: this repre- sents an annual usage of 14 million tonnes.
194. The use of coal ash in building materials may result in changes in the indoor doses ouing to external irradiation and to inhalation of radon decay products. With respect to external irradiation. Siotis and Wrixon [S5], assuming that the use of concrete containing fly ash for constructing dwellings would result in an additional activity mass concentration of 22bRa in concrete of 13 Bq kg-', calculated that the additional effective dose equivalent from indoor exposure would amount to 20 11Sv per year. Stranden [S28], on the basis of additional activity mass concentrations of 10 Bq kg-I of lz6Ra and 8 Bq kg-' of 232Th, estimated that the additional absorbed dose in air would be 90pGy per year in concrete houses and 40pGy per year in wooden houses. These figures would be reduced to 70 and 30uSv for concrete and wooden houses, respectively. if the conversion coefficient from absorbed dose in air to effective dose equivalent were taken to be 0.7.
195. There are conflicting views on the impact of the use of fly ash on the dose from inhalation of radon decay products. Siotis and Wrixon [S5] measured the radon exhalation rates of concrete blocks made by a cement manufacturer under controlled conditions using cement containing varying proportions of fly ash of high 226Ra activity mass concentration (330 and 800 Bq kg-'). The concrete blocks containing fly ash were found to present radon exhalation rates higher than those of concrete blocks without fly ash. Siotis and Wrixon [SS] estimated. on the basis of these measurements, that the additional radon concentra- tion in a model dwelling would be 1.5 Bq m-j. resulting in an effective dose equivalent due to indoor exposure to radon decay products of about 40 pSv per year. Radon concentrations in Polish dwellings built with concrete blocks made almost entirely of fly ash were found to be higher than those in dwellings built with concrete blocks containing no fly ash [B14]. Stranden [S28], however, observed lower radon exhala- tion rates from concrete blocks containing 5% fly ash than from ordinary concrete blocks; the two types of blocks had been especially constructed for the experi- ment and differed only in the inclusion of fly ash. The
resulting reductions in the radon concentrations in model dwellings have been calculated by Stranden [S28] to be 3 Bq rn-' in a wooden dwelling and 10 Bq m-j in a concrete dwelling. The corresponding reduction in effective dose equivalent from indoor exposure to radon decay products would be 90pSv per year in a wooden building and 300 11Sv per year in a concrete dwelling. I n other controlled studies [U6. V3], the substitution of varying amounts of ordinary cement with fly ash cement yielded no significant change in the radon exhalation rate from the concrete obtained, in comparison with ordinary concrete.
196. The conflicting evidence may be attributed to differences in the properties of the components used in concrete, their relative activity mass concentrations of 226Ra or the manufacturing process. I t seems that for a given activity mass concentration of 22bRa, the radon exhalation rate of fly-ash is usually lower than that of concrete, so that enhanced indoor exposures to radon decay products may arise only when fly ash with a high activity mass concentration of ::('Ra is mixed with concrete.
197. In this Annex. the use of f ly ash in building materials is assumed to result only in additional exposures from external irradiation. Annual additional effective dose equivalents of 30pSv i n wooden dwellings and 70 jtSv in concrete dwellings are adopted as representative values on a world-wide basis. Taking the amount of fly ash concrete to be 1.3 tonnes in a wooden house and 4 tonnes in a concrete building (as in [S28]), the additional effective dose equivalents normalized per unit mass of fly ash concrete are found to be 23 and 18 pSv a-' per tonne for wooden and concrete dwellings, respectively. Using an intermediate value of 20pSv a-I per tonne and assuming that an average of four persons live in each house and that the lifetime of the house is 50 years, the collective effective dose equivalent commitment arising from external irradiation attributable to the annual use of fly ash for constructing the dwellings is estimated to be about 5 lo-'.
198. The use of fly ash as a component of cement and concrete for constructing dwellings represents only a small fraction of the total use of coal ash. The Committee has not found any published information on doses arising from other uses of fly ash (as a road stabilizer, in asphalt mix, as fertilizer, etc.).
199. The large fraction of coal ash that does not find a commercial application is usually dumped in the vicinity of the power plant. Two disposal methods are used. Ash mixed with water in a ratio of 2 to 3 is piped as slurry to lagoons created by adding walls to or otherwise modifying existing topographic features. When a lagoon is filled, it is allowed to drain and, if necessary, another lagoon is created on top. For dry ash dumps, the ash is conditioned with water to reduce dust and transported to the dumping site. The choice of disposal method depends on economic and environmental factors [U16]. When the dumping is finished, most dry ash dumps are covered by topsoil and converted into areas for agricultural or recreational use.

200. The main potential radiation hazards from ash disposal arise from resuspension and from contamina- tion of surface and underground water either as a result of leaching. i.e., as certain compounds are washed out of the ash by percolating rain water. or as a consequence of the physical erosion of the ash surface during run-off. Dose assessments taking into account these processes are lacking.
1. Summary
201. Radiation exposures resulting from the various steps in the coal fuel cycle are summarized in Table 30. The exposures are expressed in terms of collective effective dose equivalent commitments per year of practice around the ~ ~ o r l d . The highest exposures seem to stem from the use of coal in homes and the use of fly ash in concrete. It should be borne in mind that these estimates are fraught with large uncertainties that are difficult to quantify.
B. OTHER ENERGY PRODUCTION
202. The other types of energy production considered in this section are geothermal energy and combustion of oil and natural gas.
1. Geothermal energy
203. Geothermal energy is produced in Iceland, Italy. Japan, New Zealand. the USSR and the United States. In 1980. i t amounted to only 1.5 GW a of electrical energy production. but its relative importance may grow in the future. Geothermal energy makes use of hot steam or water derived from high-temperature rocks deep inside the earth. Most of the activity found in geothermal fluids is due to the uranium decay chain. Isotopes of solid elements may cause problems regarding water pollution or land disposal but only radon. which is released into the atmosphere when the water or steam contacts the air, is considered here. From measurements of radon in geothermal fluids in Italy [G18, M151, the annual releases of radon have been estimated to be I I0 TBq from the 400 MW Larderello plant, 7.0 TBq from the 15 MW plant at Piancastagnaio and 1.5 TBq from the 3 MW plant at Bagnore. The annual release of radon from the 1 1 units of the Geysers Pourer Plant in the United States, which has a net capacity of 502 MW of elcc- trical energy, was assessed to be 21 TBq [A16]. These figures point to an average atmospheric discharge per unit energy generated of about 150 TBq per GU' a. The corresponding collective effective dose equivalent commitment per unit energy generated is estimated to be about 2 man Sv per G W year if it is assumed that the equilibrium factor between radon and its short- lived decay products is 0.8, the population density around the plant is 100 km-', the effective dose equivalent per unit activity inhaled is 1.1 Sv Bq-I and that indoor and outdoor concentrations are the same. The annual world-wide production of geo- thermal energy would yield a collective effective dose equivalent commitment of approximately 3 man St'.
204. Annual individual effective dose equivalents resulting from inhalation of short-lived decay pro- ducts of radon is estimated to be of the order of l0pSv at 1 km from the stack of a 100 M W geothermal plant. The average additional radon concentration would be about 0.1 Bq m-', compared with a back- ground concentration of 1-10 Bq m-'. Measurements conducted near the Larderello plant in Italy and near other geothermal power plants in New Zealand and the United States failed to distinguish between the contribution of the radon activity from the plant and that from background [A 16. G18, S59. WZO].
2. Oil-fired power plants
205. As shown in Table 31, oil has a large number of applications, the most important being road transport, generation of electric power and domestic heating. Approximately 3 1012 kg of crude petroleum was produced in the world in 1980. In power plants, about 2 lo9 kg of oil is needed to produce I G W a of elec- trical energy. As the ash content of oil is very low, oil-fired power plants are usually not equipped with efficient ash removal systems. From measurements in two oil-fired power plants in France. normalized atmospheric discharges of about 200, 300, 150 and 1,000 MBq per G W a for Z'8U, 226Ra, 13'Th and 40K, respectively, have been estimated [A8]. These are very similar to the normalized discharges of coal-fired power plants fitted with efficient aerosol control devices. Measurements of activity mass concentrations of 232Th, 22bRa. 210Pb and 'OK in fuel ash from oil- burning power stations of the USSR led to the same conclusion [B13]. The collective effective dose equi- valent commitment per unit electrical energy generated has been found to be about 0.5 man Sv per GW a. Assuming that 15% of the world-wide production of crude petroleum is burned in electric power plants, the resulting annual collective effective dose equivalent commitment would be about 100 man Sv. The annual individual effective dose equivalent to a member of the critical group, calculated in the same way as for a coal-fired power plant. would be about 1 pSv.
206. Information on radiation exposures of workers in the oil industry is scarce. Kolb and Wojcik [K22. K23] measured a median ZZbRa concentration of 4.500 Bq m-' in thermal brine, which is raised to the surface together with oil. This brine can be used for the extraction of oil from its deposits without any radiation problem as long as the radium activity remains in solution. Salt from oversaturated brine is often precipitated after expansion, however. and scale is formed on the inner walls of tubing, pumps and separation and storage tanks [K23, S601. Such deposits can be detected with common radiation protection instruments; activity mass concentrations of up to lob Bq kg of 226Ra and l2%a have bcen detected i n some samples. Under normal conditions of operation, the annual effective dose equivalent for maintenance personnel resulting from external radiation from such sources is estimated to be less than 5 mSv [K23].
207. Oil shale is currently being considered for the production of synthetic oil that could be burned in

power plants. Oil shale is a sedimentary rock contain- ing kerogen, an organic substance originating from micro-organisms that accumulated in what were once large shallow lakes. When the rock is heated to a temperature of at least 400' C to bring about pyrolysis of the kerogen, synthetic shale oil is produced. The production of shale oil involves the processing of vast amounts of material. Retorting 1 tonne of shale can yield 110 Litres of retort water, 0.8 tonne of spent shale and 1-40 m' of retort gases [F6].
208. In the rich shale deposits of Colorado, Wyoming and Utah, known as the Green River formation, as well as in Estonian shale. measured radionuclide concentrations of raw oil shale (about 60 Bq kg-I of ?38U, 25 Bq kg-' of 232Th. 500 Bq kg-' of 'OK) corres- pond fairly closely to those observed in typical soils [G19]: Antrim shales from the eastern United States and Moroccan shales show higher uranium concentra- tions (about 350 Bq kg-]) [G19]. After retorting, nearly all of the activity content is found in the spent shale, with a marked increase with decreasing particle size for most radionuclides. Average concentrations in the respirable fraction of spent shale from the Green River formation are about 150 Bq kg-' of 'jbU, 130 Bq kg-' of 2'6Ra. 220 Bq kg-' of 210Pb, 40 Bq kg-I of 232Th and 740 Bq kg-' of "OK [G19]. Atmospheric discharges from an oil shale plant producing enough oil to generate 1 GW a of electrical energy have been estimated to be about 290 MBq of '38U, 250 MBq of '"Ra, 430 MBq of :I0Pb, 90 MBq of 23'Th and 1,500 MBq of 'OK [G19]. This is again very similar to the normalized discharges from a coal-fired power plant equipped with an efficient ash removal system. The collective dose equivalent commitment per unit electrical energy generated would be about 0.5 man Sv per GI%' a.
3. Natural gas
209. In 1980. the world-wide production of natural gas amounted to about 1012 m3. Like oil, natural gas has many fields of application. Its uses in OECD countries are summarized in Table 32, the major uses being domestic heating, generation of electric power and as a source of heat in various industries. As dis- cussed previously in this Annex. radon concentrations in natural gas may vary widely around a typica! value of 1,000 Bq m-" Since about 2 lo9 m3 of natural gas must be burned in order to produce 1 GW a of electrical energy, the corresponding radon emission is approximately 2 TBq.
210. The corresponding collective effective dose equi- valent commitment per unit energy generated is estimated to be about 0.03 man Sv per GW a. The assumptions for this estimate are that the equilibrium factor between radon and its short-lived decay pro- ducts is 0.8, the population density around the plant is 100 km-', the effective dose equivalent per unit activity is 1.1 Sv Bq-I and indoor and outdoor concentrations are the same. Assuming that 15% of the world production of natural gas is burned in electric power plants, the resulting collective effective dose equivalent commitment per year of practice would be about 3 man Sv.
211. The radon concentrations around a gas-fired power plant are expected to be, in most cases, undistinguishable from background; the individual doses are expected to be trivial.
4. Peat
212. Peat is burned for energy production in several countries. notably in Finland and Sweden [E9, E10, M311. Natural radionuclides are carried into the peat bogs by flowing surface and ground water and then adsorbed to peat matter. In Sweden, the normal "'U activity mass concentration in dried peat is about 40 Bq kg-', but some samples have shown concentra- tions up to 500 Bq kg-'; in one extreme case, the '"U concentration was more than 10,000 Bq kg-' [E9]. In Finland, samples of peat used as fuel in a power plant showed concentrations of 16 Bq kg-' 30 Bq kg-] of 210Pb, 5.3 Bq kg-' of 22BRa and 28 Bq-kg-] of 'OK [M31]. Since the ash content of peat normally lies between 3% and 8% [M31], the concentrations of natural radionuclides in peat ash are about 20 times those in peat.
2 13. There is little information on the environmental discharges of natural radionuclides from peat power plants. Assuming that 5 lo9 kg of peat is needed to produce 1 GW a of electrical energy and using an average 238U concentration in peat of 40 Bq kg-' and a dust control efficiency of 99%. as well as the general assumptions used for coal-fired power plants, the normalized collective effective dose equivalent commit- ment is tentatively estimated to be 2 man Sv per G W a. In the long term. storage and disposal of uranium-rich peat ash may have the greatest impact [E9].
5. Summary
214. Radiation exposures attributable to natural radionuclide discharges from various systems of elec- tricity production are summarized in Table 33. The exposures are expressed i n terms of collective effective dose equivalent commitments for one year of practice throughout the world and are normalized to the generation of 1 G W a of electrical energy. The highest radiation exposures result from the use of coal.
C. USE O F PHOSPHATE ROCK
215. Phosphate rock is the starting material for the production of all phosphate products; it is the main source of phosphorus for fertilizers. The world pro- duction of phosphate rock was about 130 million tonnes in 1982 [F9], the main producers being China. Morocco, the USSR and the United States. There are three types of phosphate rock: (a) phosphate rock of sedimentary origin: this type, which covers 85% of current needs for phosphorus, comes from deposits spread almost throughout the world, but especially in Morocco and Florida (United States) [Ill]; (b) phos- phate rock of volcanic origin: the principal deposit of this type is found in the Kola peninsula (USSR); (c) phosphate rock of biological origin: the accumulated

droppings of marine birds have given rise to deposits of guano. from which the leached phosphoric acid has recombined with calcium from the underlying rock to give tricalcium phosphate.
216. Activity mass concentrations of natural radio- nuclides in phosphate rock were reviewed by UNSCEAR in its 1977 and 1982 Reports [U2, UI]. Activity mass concentrations of lJ2Th and 40K in phosphate rocks of all types are similar to those observed normally in soil, whereas concentrations of 23sU and its decay products tend to be elevated in phosphate deposits of sedi- mentary origin. A typical concentration of in sedimentary phosphate deposits is 1,500 Bq kg-'. North American phosphate presents the highest concentra- tions of 238U. followed by north African phosphate. Uranium-238 and its decay products are generally found in close radioactive equilibrium in phosphate ore.
217. Exposures of members of the public result from the following: (a) effluent discharges of radioactive materials of the 238U decay series into the environment from phosphate rock mining and processing: (b) use of phosphate fertilizers: and (c) use of by-products and wastes.
218. Occupational exposures mainly occur during mining, processing and transportation of phosphate rock, as well as during transportation and utilization of phosphate fertilizers.
1. Effluent discharges during phosphate industrial operations
2 19. Phosphate industrial operations can be divided into mining and milling of phosphate ore, phosphate product manufacture by the wet process (in wet- process phosphoric acid plants) and phosphate pro- duct manufacture by the thermal process (in elemental phosphorus plants).
220. The technique used to mine phosphate ores varies from area to area depending on the type of deposit. In Florida phosphate ore is mined using the strip-mining technique. which involves stripping the overburden and mining the matrix with draglines creating mine cuts from 15 to 20 m in depth [R5]. Overburden is stored near mine cuts and used as backfill as subsequent cuts are made. Structures later built on reclaimed land may exhibit elevated radon concentrations, as discussed later in this Annex.
221. After mining, beneficiation, which is a physical separation process using screen flotation to remove non-phosphate components, is applied to phosphate ores not rich enough in P,O,. Exposures resulting from mining and beneficiation have not been assessed.
222. After phosphate rock has been mined and beneficiated, it is usually dried and ground to a uniform particle size to facilitate processing. Wet process plants produce phosphoric acid, the starting material for ammonium phosphate and triple super- phosphate fertilizers; in that process, phosphogypsum
is produced as waste or by-product. Thermal process plants produce elemental phosphorus, which is in turn used primarily for the production of high-grade phosphoric acid, phosphate-based detergents, and organic chemicals. Waste and by-products of the thermal process are slag and ferrophosphorus.
223. The drying and grinding operations that follo\v phosphate rock mining and beneficiation produce significant quantities of particulate material [U9]. Very limited data are available on actual field measure- ments of radioactive materials from drying and grinding operations. Measurements made by the United States Environmental Protection Agency (EPA) [PI61 were summarized in the UNSCEAR 1982 Report [Ul]. EPA has since established the parameiers of a reference phosphate rock d ~ i n g and grinding plant [U9]. which it used to calculate the emissions of radioactive materials into the atmosphere (see Table 34); they correspond to a particulate emission rate of about 0.1 kg per tonne of phosphate rock throughput and to radioactive equilibrium of ?'W with its solid decay products. The atmospheric release of 222Rn has not been estimated by EPA: assuming an activity mass concentration of226Ra in phosphate ore of 1.500 Bq kg-' and, conservatively, a 100% release of :"Rn, would yield 1.5 MBq per tonne of phosphate rock.
224. Some phosphate rock must be calcined before it can be processed. The need for calcining is determined primarily by the amount of organic material in the beneficiated rock, In the calcining operation, the rock is heated to about 800" C to remove unwanted hydrocarbons. Because calciners operate at a higher temperature than driers, they have the potential for volatilizing 2'0Pb and rloPo. Atmospheric releases from elemental phosphorus plants, which are mainly attributable to the operation of calciners, have been measured in the Netherlands and the United States [B3 1 , U9, U 10, U11, U12]. Estimated annual values are presented in Table 34. Discharges of *lOPb and 210Po are about two orders of magnitude higher than those of other solid radionuclides of the 23W decay series. Analyses of particles collected from the calciner off-gas streams at two plants in the United States showed that most of the 210Po activity was associated with submicron particles and that the dissolution rate of both Z1OPb and 210Po in simulated lung fluid was very small [U 10, U I I].
225. Results of measurements at calciners at wet- process phosphoric acid plants are not yet available [U9]. .4tmospheric discharges of natural radionuclides at two wet-process phosphoric acid plants not equipped with calciners, however, have been published by EPA [PSI and summarized in the UNSCEAR 1982 Report [Ul]. EPA has since defined the parameters of a reference wet-process phosphate fertilizer plant that are used to estimate the annual discharges of natural radionuclides into the atmosphere (Table 34). Those discharges result from the production processes of phosphate fertilizers and apparently do not include the discharges due to ore drying and grinding. Releases of 226Ra are estimated to be lower than those of 238U and 230Th because radium is chemically separated from uranium and thorium in the digestion

of phosphate rock and goes predominantly to phospho- gypsum.
226. Annual airborne discharges, normalized to the production or processing of one tonne of phosphate rock, are presented in Table 35. The normalized discharges apply mainly to the operation of phosphate industrial plants in the United States and may not be representative of the world-wide situation. Estimates of collective dose commitments corresponding to the normalized discharges have been calculated using the methods described in the section on coal-fired power plants and are also presented in Table 35.
227. Rough estimates of the collective dose commit- ments resulting from the world-wide operation of phosphate industrial facilities. using the experience of the United States as a guide, are presented in Table 36. The corresponding collective effective dose equivalent commitment is about 60 man Sv per year of practice.
228. Environmental concentrations of natural radio- nuclides and assessments of maximum individual doses have been published for a few plants. At a distance of about 2 krn from an elemental phosphorus plant in the Netherlands, the activity concentrations of 2'0Pb and *loPo in surface air have been found to be about 0.1 and 0.4 mBq m-' above background, respectively [D7]. For the same plant. the estimated maximum annual individual effective dose equivalents due to atmospheric discharges are about 40pSv [B31, S50]. In the United States, the atmospheric releases from the six elemental phosphorus plants in operation in 1983 were estimated to result in annual lung dose equivalents for nearby individuals ranging from 0.05 to 6 mSv [U9].
229. Discharges of radioactive materials into surface water have also been. occasionally reported. In the Netherlands, about 50 GBq of 2'0Pb and 30 GBq of 210Po were discharged from an elemental phosphorus plant into the Scheldt estuary [B31]. In that country, all phosphogypsum produced by fertilizer plants (2 million tonnes per year) is also disposed of into the Rhine 15 km from the North Sea [K19]; these annual discharges, which contain about 0.4TBq of 2 TBq of lZ6Ra. 0.7 TBq of "OPb and 2 TBq of Z'OPo. are estimated, in a preliminary assessment, to result in maximum individual effective dose equivalents of 150 pSv per year and annual collective effective dose equivalents to the Dutch population of 170 man Sv from ingestion of seafood; the main contributor to the dose is 2'0Po [K19]. In France, over 3 million tonnes of phosphogypsum was dumped into the Seine estuary [PI81 but the corresponding radiation exposures have not been estimated.
230. In other countries, such as India and the United States, phosphogypsum is retained in sludge ponds or stockpiles near phosphate fertilizer plants; occasional drainage or seepage of radioactive materials into nearby surface water has been reported [A 14. P 171.
23 1. Limited information is available on occupational exposures attributable to processing and transport
of rock phosphates. In Dutch wet-process phosphoric acid plants. higher than average external radiation doses in air, ranging from 2 to 100 pGy h-I, have been detected in the vicinity of some piping and vessels near gypsum filters [LIS]. Analysis of scaling samples revealed activity mass concentrations of IZ6Ra of up to 0.4 MBq kg-'; the potential radiation doses. attribut- able to external exposure and to inhalation of IZ6Ra during periodic cleaning, have been estimated in eight phosphoric acid plants to be less than 2.2 mSv per year [L15]. In the Federal Republic of Germany, Pfister and Pauly [PI51 estimated individual and collective external exposures for the small group of persons who handle rock phosphates as part of their job; their results correspond. in terms of effective dose equivalent, to individual exposures of 200 pSv a-' and collective exposures of 0.5 man Sv a-I. Extrapolating to the world's population by scaling over the phosphate fertilizer consumption results in an annual collective effective dose equivalent of approximately 20 man Sv. Exposures attributable to inhalation of phosphate rock, however. have not been taken into account.
2. Use of phosphate fertilizers
232. The world consumption of phosphate fertilizers was about 30 million tonnes of P20, in 1982 [F9]. The application rate of fertilizers depends on. among other things, the type of soil and the type of crop. The average consumption of phosphate fertilizer per unit area of agricultural land varied in 1982 from 3.6 kg P205 per hectare in the developing countries to 10.9 kg P20, per hectare in the developed countries. the world average being 6.7 kg P20, per hectare [F9].
233. Activity mass concentrations of natural radio- nuclides in phosphate fertilizers have been reviewed in the UNSCEAR 1982 Report [Ul]. For a given radionuclide and type of fertilizer. the activity mass concentrations vary markedly from one country to another, depending on the origin of the components. General features are that the activity mass concentra- tions of 'OK and of 212Th and its decay products are always low and that the activity mass concentrations of the radionuclides of the "'U decay series are 5-50 times higher than in normal soil. The degree of radioactive equilibrium between 238U and its decay products in a given type of fertilizer depends essentially on the relative contribution of phosphoric acid, since phosphoric acid usually has a very low IZ6Ra concen- tration. For the purposes of this Annex, it is assumed that "OTh and "'U are in radioactive equilibrium with "'U and that "OPb and 210Po are in radioactive equilibrium with 226Ra. Table 37 presents average activity mass concentrations of 238U and n6Ra in phosphate fertilizer from four countries [D8, M21, P15, U131: the levels range from 1,700 to 9,200 Bq per kg P205 for 238U and from 480 to 1,700 Bq per kg P20, for "6Ra. Typical values are 4,000 and 1,000 Bq per kg P20, for 238U and 226Ra, respectively.
234. Since the activity mass concentrations of 238U and Iz6Ra in phosphate fertilizers are several times higher than in normal soil, they constitute an additional

source of radiation exposure for workers and members of the public.
235. The annual application of phosphate fertilizers can be calculated to represent less than 1% of the normal soil content of 238U [M21, PIS]. Assuming an accumulation of lI6Ra in the soil during the past 80 years, Pfister and Pauly [PIS] have estimated that the mean additional absorbed dose in air above fertilized fields is about 0.8 nGy h-I, a small fraction of the normal natural background from terrestrial sources of 50 nGy h-'. Small additional doses also occur from ingestion of foodstuffs grown on fertilized agricultural areas: Drichko et al. [D8] have shown that although the transfer coefficient of 226Ra from soil to plants is practically the same whether 226Ra is included in fertilizer or soil structures, the activity mass concentrations of ?'OPb and 2'0Po in the aerial parts of plants seem to be independent of the corresponding activity mass concentrations in soil; this implies the predominance of the air-to-vegetation transfer for such radionuclides.
236. The collective dose commitments incurred after application of phosphate fertilizers have been roughly evaluated by comparison with the activity mass concentrations of natural radionuclides in soil and the corresponding dose rates. Table 38 shows the results obtained under the following assumptions: the avail- ability to plants of natural radionuclides is the same whether in fertilizer or in the normal constituents of the soil: the ploughed layer of soil is 0.3 m deep: the deposited activity becomes unavailable to the vegeta- tion with a mean life of 100 years for the long-lived natural radionuclides: the fraction of time spent by the populations exposed on or near fertilized fields is 1%; and one tonne of phosphate rock produces, on average. 0.3 tonne of PIO, in phosphate fertilizer. It can be inferred from Table 38 that the collective effective dose equivalent commitment per unit of phosphate rock is approximately 8 lo-' man Sv t - I . Taking the world-wide production of phosphate rock to be 120 million tonnes, the collective effective dose equivalent commitment resulting from the world-wide use of phosphate fertilizers during one year is roughly estimated to be 10,000 man Sv.
237. Occupational exposures arising from external irradiation during transport, storage and application of phosphate fertilizer were assessed by Pfister and Pauly [PI51 and reviewed in the UNSCEAR 1982 Report [Ul]. Mean additional absorbed dose rates in air ranging from 20 to 200 nGy h-I were measured for various transport and loading operations, with peak values of 800 nGy h-1 [P15]. From the number of workers involved or the time spent in the various operations considered, a total annual collective effec- tive dose equivalent of 1.3 man Sv can be derived [PIS]. A rough estimate of about 50 man Sv for the collective effective dose arising from occupational exposure to external irradiation resulting from world- wide handling of phosphate fertilizers can be inferred from the results of Pfister and Pauly, using the consumption of phosphate fertilizers as a reference scale.
3. Use of by-products and wastes
238. The main by-products resulting from phosphate industrial activities are phosphogypsum in wet-process fertilizer plants and calcium silicate slag in thermal process plants. Significant radiation exposures may occur if such by-products are used in the building industry. Another source of exposure stems from the reclamation of land on which phosphate mining has been completed and houses have been built. Since new information on radiation exposures has not been made available to the Committee in the past few years, the following is, to a large extent, a summary of the corresponding section in the UNSCEAR 1982 Report [Ul].
239. Large quantities of phosphogypsum (about 100 million tonnes per year) are produced in wet- process phosphoric acid plants. The activity mass concentrations of 226Ra in phosphogypsum, which depends on the origin of the phosphate ore processed. is typically about 900 Bq kg-I [Ul, U2]. Most of the phosphogypsum is considered waste and is either stored in ponds or stacks or discharged into the aquatic environment.
240. In the United States. a small amount of phosphogypsum (about 0.6 million tonnes per year) is used in agriculture to improve water movement in saline-alkaline soil and as a substitute for lime o r limestone in alkaline soil [L16, PIS].
241. Phosphogypsum is also used as a substitute for natural gypsum in the manufacture of cement. wall- board and plaster. Japan phased out its production of natural gypsum in 1976 and is currently recycling about 3 million tonnes of phosphogypsum per year [PIS]. In Japan, approximately one half of the by- product gypsum is used as cement set-retardant; the other half is used to make wallboard and plaster. In Western Europe, about 10% of the phosphogypsum production, that is 2.5 million tonnes, was used in 198 1 as by-product [P 181. Phosphogypsum is commonly used in construction blocks for floors and walls and in partition blocks for interiors in north Africa, the Mediterranean countries and the Middle East. I t will be assumed in this Annex that 5 million tonnes of phosphogypsum, representing 5% of the world-wide annual production. is used annually as building material in dwellings.
242. O'Riordan et al. [OS] estimated the additional doses that would be received by the occupants of a residential building in which 4.2 tonnes of by-product gypsum would have replaced the established materials; the additional absorbed dose rate in air was calculated to be 0.07 pGy h-I; the additional radon concentra- tion, using an air exchange rate of I h-I. was estimated to be about 10 Bq m-3, resulting in an annual effective dose equivalent of 0.6 mSv. If it is assumed that 5% of the by-product gypsum is used as building material in dwellings, on average four persons live in the dwellings and the mean life of the dwellings is 50 years, the collective effective dose equivalent commitments resulting from one year of world-wide use of phosphogypsum in the building industry are

estimated to be 10' man Sv from external irradiation and 2 10' man Sv from internal irradiation. These estimates are highly uncertain and need to be con- firmed by measurements in dwellings that have been constructed using known amounts of phosphogypsum.
243. Calcium silicate slag may be used as a com- ponent for concrete. Measured activity concentrations in slag samples range from 1.300 to 2,200 Bq kg-' of Z2bRa [ B l l . M161. Results from an indoor survey indicate that the gamma absorbed dose rate in air can be as high as 0.3pGy h-I above background in dwellings construcred with 43% by weight slag in concrete slabs [B I I]. In a similar survey carried out in Canada, absorbed dose rates of up to 0.2pGy h-I were obtained [M 161.
244. Residents in structures built on reclaimed phos- phate land in Florida, United States may also be exposed to significant radiation doses. About 600 km2 of Florida land has been mined for phosphate rock in the past 80 years. About 200 km2 of the land has been reclaimed to various degrees. The equilibrium equi- valent radon concentrations in houses built on reclaimed land were found to range from 4 to 500 Bq m-3 with a weighted average of about 40 Bq m-', which is estimated to be 26 Bq m-j above normal concentrations in houses in that area [G21]. This average additional concentration results in an annual effective dose equivalent of approximately 1.6 mSv. An experimental investigation and remedial action programme was carried out involving 10 houses and a mobile home on land that had phosphate mineralization o r had been affected by phosphate mining activities and for which the annual average radon equilibrium equivalent concentration was believed to be in excess of 100 Bq m-3 [S5 I].
4. Summary
245. Table 39 summarizes the radiation exposures attributable to the use of phosphate rock, expressed in terms of collective effective dose equivalent commit- ment resulting from one year of practice. The total collective effective dose equivalent commitment is estimated to be 300,000 man Sv, essentially from the use of by-product gypsum in dwellings.
D. NOK-URANIUM ORE MINING .4ND PROCESSING
246. Because of the presence of radon in confined spaces, metal and non-metal mining results in occu- pational exposures. Ventilation of mine air, in turn, results in environmental discharges of radon and exposures of members of the public. Ore processing gives rise to additional environmental discharges of natural radionuclides. Occupational exposures and exposures of members; of the public are discussed below.
1. Occupational exposures from non-uranium mining
247. Investigations of radon and radon decay pro- duct concentrations in non-uranium mines have been
conducted since the 1960s. This section is devoted to the discussion of occupational exposures in non- uranium mines other than coal mines, which are considered in another part of this Annex.
248. Measured concentrations of radon and radon decay products are presented in Table 40. The potential alpha energy concentrations of radon decay products range from 0.02 to more than 300 pJ m-', and there is no simple relationship between radon decay product concentration and type of mine. Mines extracting from sedimentary deposits usually have low radon decay product concentrations but this is not always true. Mines associated with igneous intrusions imply high uranium content and therefore high radon decay product concentrations. although ventilation can obscure this relationship. Geological and hydro- geological characteristics may also be of importance. Convective movements of air and water resulting from pressure differences between the mine and its environ- ment explain large radon entry rates into the mine [22]. Detailed studies of the characteristics of non- uranium mines in countries of the European Economic Community show that the primary indicator of high radiation exposures is a radon concentration in exhaust air in excess of 400 Bq m-3 1221.
249. Occupational exposures attributable to radiation in non-uranium mines have decreased with time [D6, S34. S351, as monitoring has led to action being taken to relieve high exposure situations. Personal dosimetry is now being used in Polish non-uranium mines [CIS] and is envisaged in Italy [S37] and the United Kingdom [M 181.
250. The degree of equilibrium between radon decay products and radon in non-uranium mines has been investigated in several countries. Measurements in an Italian lead mine at a location representative of the radiological characteristics of the mine show an average value of 0.70 with a range of 0.50-0.85 [S37]. In 15 mines in the Federal Republic of Germany, the equilibrium factor was found to vary from 0.28 t a 0.82 with a rather flat distribution [K15]. In Norway, the mean value of 210 measurements of the equilibrium factor in different mines was 0.46. with a minimum of 0.08 and a maximum of 0.93 (S381. A typical value of the equilibrium factor in non-uranium mines seems to be 0.6 with large variations around this figure.
25 1. Stranden and Berteig [BZO, S38] have established empirical relationships between theequilibrium factor F and the activity concentrations~ of the individual radon decay products "'Po, IL4Pb and 2MBi normalized to radon that seem to apply to most mining conditions when the value of F is in the range of 0.1-0.7:
%(2'ePo) / %(:lzRn) = 1.1 FO-55
~ ( ~ l ~ P b ) / x ( = ~ R ~ ) = 1.0 F0.94 ~ ( ~ l ' B i ) / %(12=Rn) = 0.77 F1.I2
252. The unattached fraction f, of the potential alpha energy of radon decay products in non-uranium mines was also studied by Berteig and Stranden [B20. S381; in most working conditions, the value of f, is usually found to be smaller than 0.05. The main factor

influencing the unattached fraction seems to be the aerosol particle concentration; high values of the unattached fraction are observed with low aerosol concentrations [G23, S381. Suggested empirical relation- ships between the value of f,and that of the unattached fraction of individual radon decay products are as follows [S38]:
f (21YPo) = 2.6 f
f ('IJPb) = 0.77 f:9i
f (?14Bi) = 0.27 f tB5 253. Radiation measurements other than those of radon and their decay products are limited. A study of the complete spectrum of radiation exposures was carried out in eight British non-uranium mines [D5]. Table 41 presents the reported concentrations and an estimate of the resulting effective dose equivalents. In mines associated with igneous intrusions, the calculated doses are almost entirely due to the inhalation of radon decay products. In sedimentary mines, the contribution to the normal dose from the inhalation of radon decay products is always greater than 5096, even for low concentrations of radon daughters. Similar results have been observed for mines in the Federal Republic of Germany [K15]. The effective dose equivalent from inhaled thoron decay products, however, may be higher than that from inhaled radon decay products if the ratio of the activity mass concentration of :j2Th to that of ?38U in the mined rock is substantially greater than one, which is sometimes the case [S39, S401.
254. On the basis of the results presented in Table 40, annual effective dose equivalents received by non- uranium miners in the course of their work are estimated to range from 0.1 mSv to about 0.2 Sv, most of the values being between 1 and 50 mSv. If the arithmetic mean of the annual effective dose equivalent is tentatively assumed to be 10 mSv and the fraction of non-uranium miners in the world population is taken to be 5 [U14], a very rough estimate of the annual collective effective dose equivalent would be 2 lo4 man Sv.
2. Occupational exposures from factory processes
255. Industrial processes are carried out for many purposes that use the materials extracted by non- uranium mining. In these factory processes, there are exposures to natural radioactivity but in most cases data on measured activities o r estimates of doses have not been reported in the literature. Examples given in the following sections are the industrial use of zircon sand and the processing of ilmenite; another example not discussed separately in this Annex is the use of thorium in coating optical lenses. Information in this field is extremely limited and no reliable assessment of the collective exposures can be made.
(a) Processing of raw ilmenite
256. The activity concentrations of natural radio- nuclides in samples collected a t an Australian titanium dioxide plant have been reported [C13]. In that plant.
the white pigment titanium dioxide is produced from raw ilmenite (a dark-coloured, fine-grained beach sand) containing monazite as an impurity (0.14% by mass). The activity concentrations in ilmenite feed are about 400 Bq kg-' of 228Ra and Z28Th and 75 Bq kg- ' of zz6Ra. These radionuclides have been followed throughout the pigment production process. It was established that in the presence of high sulphate ion concentrations in both the plant feed liquor and the effluent, thorium remains in solution whereas radium, which forms an insoluble sulphate compound, tends to co-precipitate and is found in solid residues throughout the process. Very high activity concentra- tions of 4 lo5 Bq kg-' of 226Ra and 1.5 lo0 Bq kg-I of 228Th were measured in a sample of scale scraped from a heat exchanger unit. The mass balance study of the activity entering and leaving the plant shows, however, that essentially all of the activity entering the plant (14 MBq d-I of 226Ra and 67 MBq d-I of 22SRa and of 228Th) is found in the acidic liquid effluent stream, which is pumped to disposal lagoons and is allowed to neutralize and drain away into an estuary. Effluent concentrations are about 6 Bq 1-1 of '28Ra and 228Th and 1.4 Bq I-' of 22bRa, whereas in the estuary they are approximately 0.01 Bq I-' for '?"Ra. 0.02 Bq I- ' for 228Th and 0.10 Bq I- ' for 22aRa. In contrast to the situation found in the plant and the effluent stream, radium is present in the estuary in a soluble form a n d thorium is not. leading to a possible accumulation of 232Th and of its decay products in the estuary. The radiation doses attributable to the operation of the plant have not been assessed.
(b) Indusrrial use of zircon sand
257. Zircon sand occurs in river and beach placers, usually with monazite. About 700,000 tonnes of zirconium minerals are produced each year, mainly in Australia and South Africa [B37]. The activity mass concentrations of 238U and '3'Th in zircon sand are in general well above 500 Bq kg-[ [B36, D l 3, N 181. Zircon sand is used in the zirconium extraction industry, foundry sands, refractories and ceramics. Use of the sand by foundries and the zirconium industry has resulted in the accumulation of large volumes of low-level radioactive waste.
258. Little information is available on the radiation protection aspects of the use of zircon sand [B36, N181. It seems clear, however, that inhalation of radon decay products is not a problem because the exhalation rate of radon from the zircon sand is low. Doses from external irradiation may be significant only in storage areas. Absorbed dose rates in air of about 700 nGy h-I have been measured at a distance of about I m from a stack of bags of zircon sand [B36]. In an Italian factory producing electro-fused refractory blocks. the absorbed dose rates in air were observed to be near background in all representative work places but reached about 500 nGy h-' on top of the sand storage tanks [N18].
259. The inhalation pathway, also assessed in the Italian factory, seems to be more important. The airborne concentrations of natural radionuclides near areas of high temperature processes were estimated

to be about 200 mBq m-' of 210Po (typical back- ground: 0.04 mBq m-9 and 20 mBq m-3 for very long-lived natural radionuclides (typical background: 0.001 mBq m-)). The particle size distribution was bimodal with a mode at approximately 0 .3pm and another between 5 and IOpm. The resulting annual effective dose equivalent, assuming constant occupancy in the most highly contaminated areas, would be of the order of 5 mSv [N 181.
260. No information on environmental discharges was made available to the Committee. Aquatic dis- charges would in most cases lead only to insignificant doses. as zircon compounds are extremely insoluble in water.
3. Esposures of members of the public
26 1. All industrial operations involving ore mining a n d processing release natural radionuclides into the environment. The results of radiation surveys con- ducted in several industrial facilities are given below.
(a) Zinc rn ining and processing
262. Zinc is usually found in nature as a sulphide ore called sphalerite. The ore, which usually contains impurities of lead. cadmium and traces of other elements. are processed at the mill to form concen- trates typically containing 62% zinc and 32% sulphur. These concentrates are processed at the smelter to recover zinc metal [U8].
263. Atmospheric emissions of naturally occurring radionuclides were measured from an underground mine and mill [A71 and estimated from a reference zinc smelter [U8]: the results are shown in Table 42. The releases from the smelter cannot be compared to those of the mine and mill, as they are different facilities and the capacity of the mine and mill was not indicated. It is clear, however, that the only significant emission is that of radon from the mine (8 TBq per year). A radiation survey was conducted in that particular zinc mine because a relatively high radon concentration of 2,600 Bq m-' had been measured at the mine portal exhaust. Concentrations of and 23ZTh. in the ore as well as in the concentrate, were fourid to be significantly below the corresponding average concentrations in soil; the relatively high radon concentrations observed in the mine were attributed to the large quantity of water that flows into the mine. The collective effective dose equivalent commitment resulting from inhalation of radon decay products released in one year was estimated to be about 0.1 man Sv. The very small releases of other natura: radionuclides due to low activity mass concen- trations and to efficient particle control d o not result in significant collective effective dose equivalent com- mitments.
(b) Firec1a.v mine and refracrory plan1
264. Clay mining and manufacturing is a large industry. Clay may be used to manufacture bricks and refractory materials. A clay mine and refractory plant was surveyed in the United States to estimate the
quantities of naturally occurring radionuclides emitted into the atmosphere during mining and manufacturing processes [A6]. Ore samples collected from the mine contained average 23W and lJ2Th concentrations of about 50 and 70 Bq kg-', respectively. Equilibrium equivalent concentrations of radon of approximately 1 kBq m-? were measured in the clay mine at the working face; the corresponding annual emission of radon is about I TBq. Particulate releases consist mainly of 210Po, which is partially vaporized at the kiln's operating temperature of 1,100" C . Annual atmospheric emissions are summarized in Table 43. Estimated collective effective dose equivalent com- mitments resulting from one year of operation of the fireclay mine and refractory plant are 0.02 man Sv from inhalation of radon decay products and less than 0.01 man Sv from inhalation and ingestion of :loPo.
(c) Aluminium ore processing
265. Bauxite is the principal aluminium ore found in nature. The ore is processed at mines to produce alumina (A1,0,), the basic feed in the aluminium reduction process. Aluminium metal is produced by the reduction of alumina in a molten bath of cryolite [U81.
266. Radionuclide measurements at both an alumina plant and an aluminium reduction plant have been carried out in the United States [A9, U8]. The '3'Th activities per unit mass measured in the process samples of the alumina plant are listed in Table 44. The levels in bauxite ore, red mud and brown mud are about 10 times higher than the average activities per unit mass in normal soil, whereas the radioactive content of alumina kiln feed and alumina product is less than that of normal soil.
267. Table 45 shows the estimated annual atmo- spheric emissions from the surveyed alumina plant and aluminium reduction plant. Again, radon emis- sions are much higher than those of other natural radionuclides. Among the particulates, :'OPb and "OPo are the most i m ~ o r t a n t contributors to the environ- mental releases. as the high temperatures of the kilns and of the reduction cells (above 950' C) cause these radionuclides to be volatilized [A9, U8].
268. The corresponding collective effective dose equivalent commitments are estimated to be about 0.1 man Sv; they are almost entirely due to the releases of 210Po and "OPb.
(d) Copper ore mining and processing
269. Copper ores are milled to produce a concentrate containing copper. sulphur. iron and some insoluble material (primarily silica and aluminium). This con- centrate is the basic feed to the copper smelter that eventually produces the refined copper product. Prior to smelting, part or all of the concentrates may receive a partial roast to eliminate some of the sulphur and other impurities [U8].
270. Radionuclide measurement studies at a n under- ground copper mine and mill. an open pit mine and mill and two copper smelters have been carried out in

the United States [A9, U8]. The activity mass concen- trations of 238U and 232Th in process samples from the mines and mills (Table 46) were found to be at or slightly above the corresponding levels in normal soil. Most of the ?)'Th content, however, seems to be removed from the ore in the milling process.
271. Estimated annual atmospheric releases are pre- sented in Table 47. Emissions from the copper smelter cannot be directly compared with those from the mine and from the mill, the capacity of which were not indicated. Calculated collective effective dose equi- valent commitments from one year of releases are about 1 man Sv, with nearly equal contributions from thorium isotopes and 210Pb-2L0Po.
(e) Lead ore processing
272. Galena (PbS), frequently containing cerussite (PbCO,) and anglesite (PbSO,), is the principal lead- bearing ore found in nature. Galena contains small amounts of copper, iron, zinc and other trace ele- ments. Lead smelting involves three distinct processes: sintering, to convert the ore from a sulphide to an oxide o r sulphate form and prepare the feed materials for furnacing; furnacing. to reduce the oxide feed to lead metal; and drossing, to reduce the copper content of the lead bullion from the furnace. Off-gases from the sintering machine and the blast furnace are the most significant sources of particulate emissions from the lead smelting process [U8].
273. As the activities of 238U and 232Th per unit mass of lead ore are similar to the corresponding values in normal soil. the atmospheric emissions of natural radionuclides estimated for a reference plant process- ing annually 0.22 million tonnes of lead [U9] are fairly small (about 1 GBq of 2'0Pb and of 2 1 0 P ~ ) . The resulting collective effective dose equivalent commit- ments per year of release from the reference plant are less than 0.1 man Sv.
(0 Other meral and non-nteral mining
274. Annual radon releases into the atmosphere have been reported for a few other United States mines: 30 GBq for a limestone mine. 70 GBq for a fluorspar
mine and 2,600 GBq for an iron mine [S32]. The resulting collective effective dose equivalent commit- ments from inhalation of radon decay products are less than 0.05 man Sv.
IV. SUMMARY
275. Estimates of per caput annual effective dose equivalents from external irradiation due to cosmic rays and terrestrial sources and from internal'irradia- tion due to the most important naturally occurring radionuclides are presented in Table 48. together with the subjectively estimated typical ranges of variation for all the sources taken into consideration. By far the most important source of exposure is indoor ad on, which leads t o a per caput effective dose equivalent of 1,100pSv and to a wide range of variation. The overall per caput annual effective dose equivalent is estimated to be about 2,400 pSv, corresponding to an annual collective effective dose equivalent of approximately lo7 man Sv. The current estimate of the overall per caput annual effective dose equivalent is 400pSv higher than the estimate provided in the UNSCEAR 1982 Report. This is mainly the result of a re-evaluation of the mean indoor radon concentration. The wide distribution of individual effective dose equivalents is dominated by the variability of the indoor radon concentrations, which span several orders of magnitude.
276. Individual exposures resulting from industrial activities are generally small in comparison to the overall exposure from natural sources of radiation. Their importance can best be characterized in terms of collective effective dose equivalent commitments. Table 49 provides estimates of collective effective dose equivalent commitments arising from one year of practice for most of the activities considered. Because of the scarcity, o r lack, of data for the industrial activities listed in the table, most of the estimates are very tentative. The total collective effective dose equivalent commitment arising from one year of practice is less than 5 1 0 man Sv, representing a per caput effective dose equivalent commitment of about I00 11 Sv.
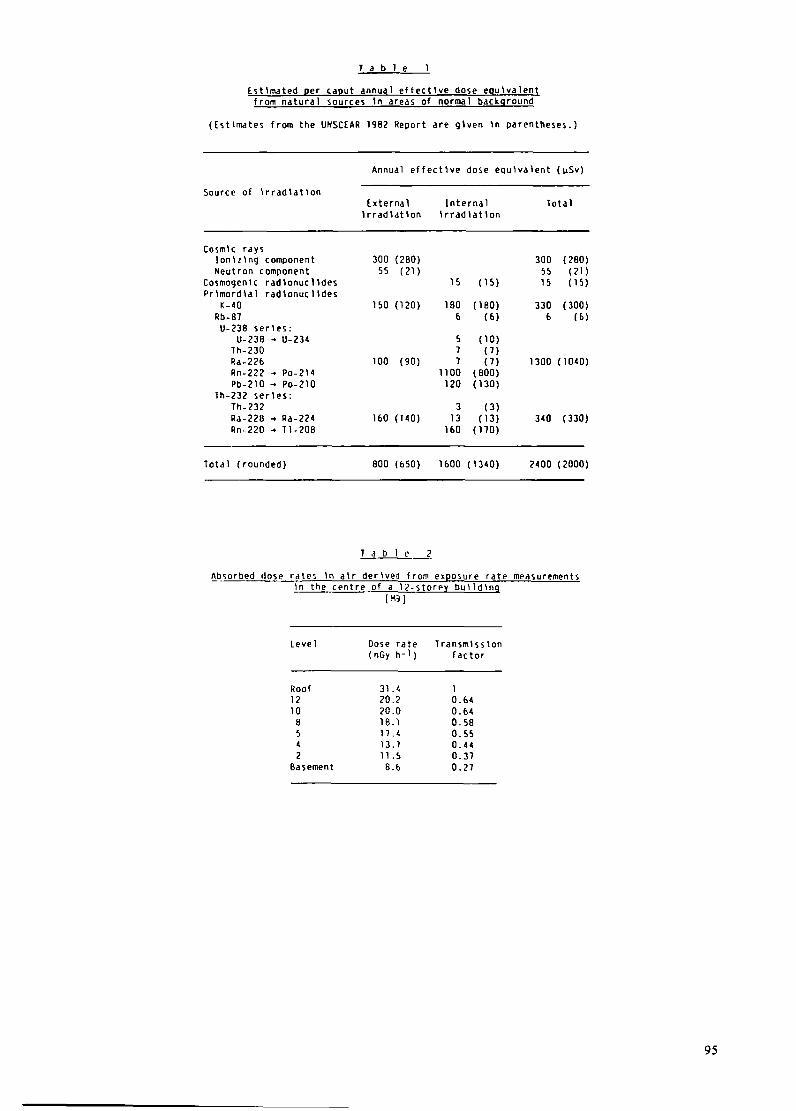
T a b l e 1
Cstlmated per caput annual effectlve dose epulvalent from natural sources In areas of normal background
(Estimates from the UNSCEAR 1982 Report are glven \ n parentheses.)
Annual effectlve dose e~ulvalent (uSv)
Source of lrradlatlon External Internal Total
lrradlatlon lrradlatlon
Cosmlc rays lonlzlng component Neutron component
Cosmogenlc radlonuclldes Prlmordlal radlonuclldes
1;-40 Rb-87 U-238 serles:
U-238 * U-234 7h-230 Ra-226 Rn-222 + Po-214 Pb-210 + Po-210
Th-232 serles: Th-232 Ra-228 -. Ra-224 Rn-220 + Tl-208
Total (rounded) 800 (650) 1600 (1340) 2400 (2000)
Lbbsorbed dose rates ln alr derlvel from exposure rate measurements In the centre of a 12-storey bulldlnq
I H9 I
Level Dose rate Transmlsslon (nGy h-1) factor
Roof 12 10 8 5 4 2
Basement

T a b l e 3
Averaqe actlvlty mass concentratlons of potasslum-40, uranlum-238 and thorlum-232
In sol1 and absorbed dose rate In alr 1 m above the ground surface [8321
Dose rate per unlt Average Radlonucllde actlvlty mass actlvlty mass Absorbed dose
or concentratlon concentration rate ln alr a/ decay serles In sol1 ln roll a_/
(nGy h-l (RQ kg-l) (nGy h-1) per Bp kg-1) (wet weight) (wet weight)
a/ The typlcal range ls glven In parentheses.
Dose rate per Average Radlonucl lde unit speclflc speclflc Absorbed dose
or concentration concentration rate ln alr a_/ decay series In sol1 In roll a_/
(nGy h-l (BQ k9-l) (nGy h-I j per BQ kg-)) (wet uelght) (wet welght)
a/ The typical range Is glven in parentheses.

T a b l e 4
Estlmates of outdoor absorbed dose rate In alr from terrestrlal radlatlon sources 1 m above ground level obtalned in larue-scale surveys
Absorbed dose Country Year Number of rate in alr
or reported measurements ( n G y h - I ) area Type of survey and instrumentation used Ref.
Average Range
Austria 1980 Ground survey In populated areas [Tg] ulth Gelger counter
Ground survey with thermolumlnescent [Dl51 doslmeters. gamna spectrometer and lonlzatlon chamber
Aerlal survey ulth a sclntlllatlon detector [G28] Ground survey ulth lonlzatlon chambers and [WZl]
sclntlllatlon detectors Analysls of sol1 samples uslng [W181
gamna spectrometry Ground survey wlth lonlzatlon [HI61
Canad2 1984 Chlna 1986
33 areas 38661
Chlna (Talwan 1972 Province)
Denmark 1980 14 sltes chamber and gamna spectrometer
[L17, R7] Ground survey wlth thermolumlnescent [ ~ s ,
dostmeters (prellmlnary results) R6 1
Flnland 1980 France 1985
German Democratlc Republic 1969
Germany, Federal Republic of 19'18
Hungary 1987
Ground survey with lonlzatlon chamber [013]
24739 123 sltes
Ground survey wlth sclntlllatlon detectors [D9] Ground survey wlth thermolumlnescent [N21 1
doslmeters [E8,R71
Ground survey ulth thermolumlnescent [Nlg] doslmeters
Ground survey u \ t h lonlzatlon chamber [n261 Ground survey wlth lonlzatlon chamber 1 ~ 1 7 1 Ground survey wtth lonlratton chamber [A151
and sclntlllatlon detectors Ground survey wlth lonlzatlon chamber [v2 1 Ground survey wlth lonlzatlon IS531
chamber placed ln a car Ground survey with thermolumlnescent 1 ~ 1 7 1
doslmeters Analysls of soil samples uslng [TI01
gamna spectrometry [JIB, R7]
Ground survey ulth ionlzatlon chamber In191 Ground survey with energy-compensated [G30]
Gelger counters (prellmlnary results) Aerlal survey wlth sclntlllatlon [0121
detectors
lceland 1982 lnd \ a 1986
Ireland ltaly Japan
Netherlands 1985 Norwdy 1977
Poland 1980
Roman la 1979
Sweden 1979 Switzerland 1964 UnltedKIngdom 1984 1400
25 areas Unlted States 1972
&/ Range of the means. b/ A contrlbutlon of 1.0 V R per hour from nuclear weapons fallout was subtracted from the total exposure rate. &/ Range of the arlthmetlc means for each province. d/ A contrlbutlon of 3.i uR per hour from nuclear weapons fallout was subtracted from the total exposure rate. g/ Inhabited by approxlmdtely 30% of the country's populatlon.

T a b l e 5
Population-uelqhted means of absorbed dose rate In alr 1 m above qround level
obtalned In a large-scale survey In Chlna (nGv h-I)
Number of City. measurements Indoors Outdoors provlnce or autonomous reglon Gamna Cosmic rays Gamna Cosmlc rays
Indoors Outdoors rays (lonlzlng rays (lonlzing component) component)
8eiJ lng 623 576 87 .O Shangha l 442 227 118.7 Tlanjln 308 236 117.1 Hebel 292 31 6 97.0 Shanxt 3454 1842 105.9 Inner Mongol la 1620 1620 106.5 HetlongJlang 2073 2650 109.1 Jll ln 1273 1107 109.9 Llaonlng 472 281 96.0 Shandong 2149 2149 115.7 Jlangsu 2331 808 107.0 Anhul 1549 1549 104.1 ZheJ lang 1312 1312 151.4 Jlangxl 2093 896 144.3 Fuj \an 6694 1276 161.6 Henan 4077 2236 118.1 Hubel 1462 1439 112.7 Hunan 1677 1534 130.4 Guangdong 1712 1712 158.2 Guangx\ 1555 1555 133.6 Shaanxl 89 4 901 108.3 Nlngxla 992 230 121.6 Gansu 850 853 118.6 Olnghal 230 257 113.9 Xlnjlang 3250 2510 124.1 Slchuan 6846 4707 116.5 Gulzhou 698 682 112.5 Yunnan 2198 2126 120.0 Tlbet 803 7 59 126.4
Total f o r Chlna 53952 38611 119.5

T a b l e 6
Resu l t s o f l a r q e - s c a l e surveys o f Indoor absorbed dose r a t e l n a l r due t o qamM t e r r e s t r l a l r a d l a t l o n
---
Absorbed dose r a t e I n a l r (nGy h -1 )
Country Year Nuniber o f Type o f Comnents Re f . r e p o r t e d d w e l l l n g s b u l l d l n g
P o p u l a t l o n - Average we igh ted p/
A u s t r i a 1980 1900 B r l c k 11 0 [ 19 1 Concrete 81 7 1 Wood 7 5 N a t u r a l s tone 110
China 1986 53952 Var ious t y p e s 120 Range of the means: [ wzl 1 90-160 nGy h-1
Denmark 1985 82 B r l c k 60 b/ P l l o t study [ 552 I Concrete 50 60 wood 30
F l n l a n d 1983 BO ( 8 0 ) Es t lma ted [ R l 1 France 1980 946 Var lous types 6 8 b / ( 8 8 ) [ M z z ]
1985 5198 Var lous i y p e s 75 (75 ) The study covered 43% r R b 1 o f t h e coun t ry and 50% o f t h e p o p u l a t l o n
German Democratic RepuDl l c 1969 667 Var lous t ypes 7 4 10131
Germany. Federa l Repub l l c o f 1978 29996 S o l i d 70 [ 09 1
Frame 7 1 7 0 P r e f a b r l c a t e d 4 0 Wood 45
Hungary 1981 123 Var lous t ypes 8 4 ( 8 4 ) Range 10-200 nGy h - l [HZ1] I c e l a n d 1982 - Concre te 2 3 ( 2 3 ) Range 14- 23 nGy h - 1 [E7.R71 I r e l a n d 1965 223 Var lous t ypes 62 b/ ( 6 2 ) Range 10-140 nGy h - l I n 2 3 1 Japan 1984 135 Var lous t ypes 5 0 C a l c u l a t e d f rom ou tdoor [ A l S ,
v a l u e o f 49 nGy h-1 [A151 A181 and lndoor /ou tdoor r a t l o o f 1.02 [A181 Range 20-110 nGy h - l [ 833 1 P l l o t study Range 30-100 nGy h-1 [ J171
[ 553 1 i s 5 4 1
The study covered about 10% [K20] o f t h e coun t ry . Outdoor doses f rom t e r r e s t r l a l r a d l a t l o n a r e h l g h e r t h a n t h e coun t ry average
I t a l y 1984 600 Var lous types -60 b/ -60
Ne ther lands 1955 399 Norway 1965 2026
1977 Poland 1984 1351
Sweden 1980 1282 1983
u n l r e c Klngdom 1985 2300
Var lous types B r l c k Concrete Coal b y - p r o d u c t
p r e f a b r l c a t e Red b r l c k Gravel -sand
p r e f a b r l c a t e Wood B r l c k Concre te Aerated c o n c r e t e Wood Var lous types L l v l n g areas and bedrooms [W22]
o f d w e l l l n g s . Standard d e v l a t l o n 24 nGy h-1.
a/ The numbers l n parentheses a r e t h e r e p o r t e d averages. assumed h e r e t o be equal t o the p o p u l a t l o n - u e l g h t e d average.
&/ The cosmlc-ray c o n t r l b u t l o n has been s u b t r a c t e d from t h e published va lue .

T a b l e 7
Intakes of uranlum-238, thorlum-232, and thelr decay products In normal areas
Annual Intake ( B Q ) Source
Inhalation lngestlon
U-238 serles: U-238 0.01 5
Th-230 0.01 2 Ra-226 0.01 15 Rn-222 200000 300 Pb-210 4 4 0 Po-210 0.3 4 0
Th-232 serles: Th-232 0.01 2 Ra-228 0.01 15 Rn-220 100000
T a b l e 8
Average actlvity mass concentratlons In organs and tissues of uranlum-238, thorlum-232 and thelr decay products
[mBg kg-1 (fresh uelght)]
Cortical Trabe- Red Source Gonads Breast Lungs bone cular bone Thyrold Kldney Llver Other
&/ bone a/ marrow tlssues
U-238 serles: U-238 7 2 15 50 50 2 2 5 3 2
lh-230 0.3 0.3 20 20 7 0 0.3 0.3 10 7 0.3 Ra-226 2.7 2.7 2.7 170 170 2.7 2.7 2.7 2.7 2.i Rn-222 - look/ Pb-210 200 200 200 3000 3000 140 200 200 200 200 PO-210 200 200 100 2400 2400 110 200 200 200 200
Th-232 serles: Th-232 0.15 0.15 20 6 2 4 0.15 0.15 3 2 0.15 Ra-228 0.5 0.5 15 50 50 0.5 0.5 10 5 0.5
(Th-228) Rn-220 40 c_/ - -
a/ Dry bone (5 kg dry bone yleldlng 2.7 kg ash per skeleton). b/ Radon gas. The radon concentratlons in tlssues other than that of the lungs are negllglble. - c/ Thoron gas. The thoron concentratlons In tlssues other than that of the lungs are negllglble. -

T a b l e 9
Annual absorbed doses resultlng from internal lrradlatlon by alpha emltters from the uranlum-238 and thorium-232 decay rerles
( UGY
Red Bone Other ~ f f e c t E Source Gonads Breast Lungs bone Ilnlng Thyrold Kldney Llver tlssues dose - -
marrow cells equlvalent (uSv)
lh-232 rerles: Th-232
Ra-228,Ra-224 Rn-22O+Pb-208
a/ lncludlng doses resultlng from the formation of Rn-222 and Its short-llved decay products In the body by decay of Ra-226 (retentlon factor of one thlrd).
b/ Tracheo-bronchlal tree. c_/ Lungs. d_/ Contrlbutlons to the annual effective dose equlvalent ( ~ S V ) .
T a b l e 10
Actlvlty concentratlon of polonlum-210 In ground-level alr rw131
Polonlum-210 concentratlon
Perlod of Number of ( ~ 8 9 m-3) Country and place measurements samples Ref
Mean Range
Flnland Nurmljarvl Helslnkl
France loulouse
Germany. Federal Rep. Munich-Neuherberg
Unlted Klngdom Harwell Chl lton Sutton
Unlted States Boulder
USSR Vl lnlus
32, dally 32. dally
37. monthly
207. weekly
4. dally 41, monthly 5. monthly
15. dally
?
3. monthly
- -
[MI) 1 [Mill
In121
[u131
[ 8 6 I I P7 I [OSI
[PSI
Quoted In [P9] 1 ~ 9 1
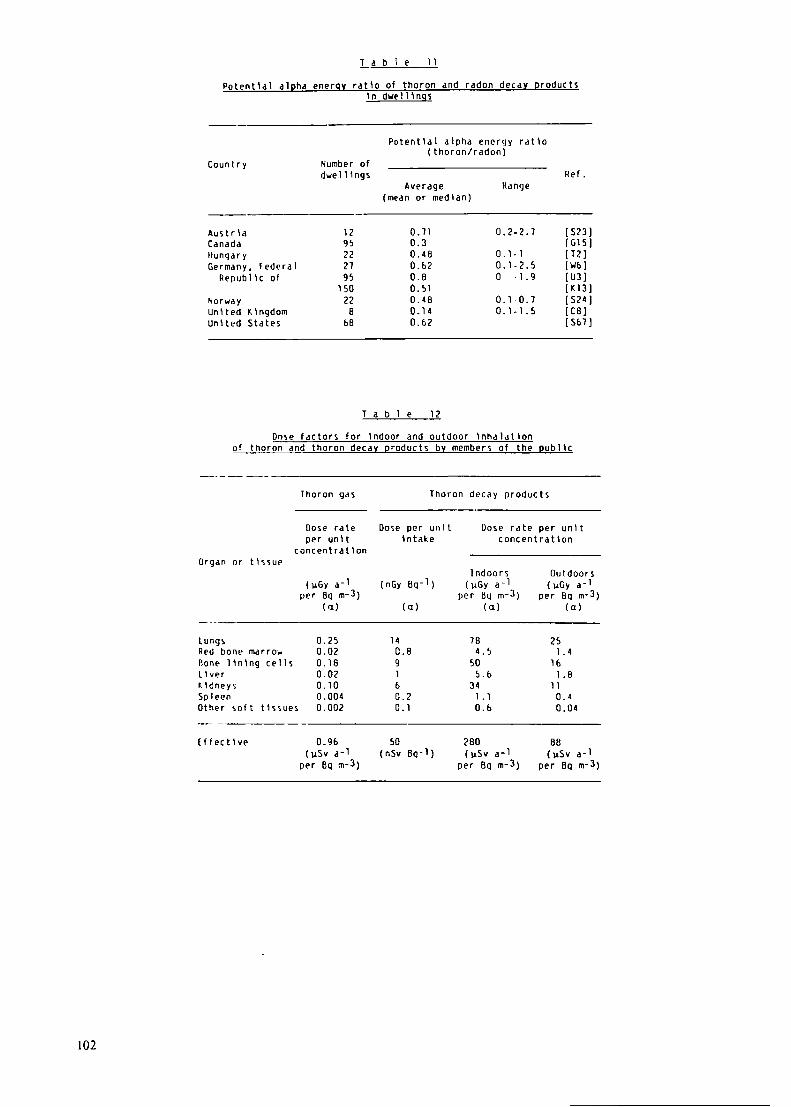
Potentlal alpha energy ratto of thoron and radon decay products in duelllngs
Potentlal alpha energy ratlo ( thoron/radon)
Country Number of dwelllngs Ref.
Average Range (mean or medlan)
Austrta Canada Hungdry Germany. federal
Reoubllc of
Norway Unlted Kingdom Unlted States
0.2-2.7 [S23] [GI 5 I
0 .1 - 1 [TZI 0.1-2.5 [ W b ] 0 -1.9 [U3]
[K131 0.1-0.7 [S24] 0.1-1.5 [CB]
[Sb71
T a b l e 12
Dnse factors for Indoor and outdoor lnhaldtlon of thoron and thoron decay products b y members of the publlc
Thoron gas Thoron decay products
Dose rate Dose per unlt Dose rate per unlt per unlt lntake concentratton
concentratlon Organ or t l r r u ~
Indoors Outdoors (uGy a-l (nGy Bq-l) (vGy a-1 (UGY a-'
per 8q 171-3) per Bq m-3) per Bq m-3) (a) (a) (a) ( a )
Lungs 0.25 14 7 8 2 5 Red bone marrow 0.02 0.8 4.5 1.4 Bone Ilntng cells 0.18 9 5 0 16 L l ver 0.02 1 5.6 1.8 Kldneys 0.10 b 3 4 11 Spleen 0.004 0.2 1. 1 0.4 Other soft ttsrues 0.002 0.1 0.6 0.04
Iffectlve 0.96 50 280 88 (u S v a-1 (nSv 80-1) ( u S v a-1 ( u S v a-1
per 8 9 m-3) per Bq m-3) per Bq m-3)

T a b l e 13
Ranqe and re~resentatlve values of parameters for estlmatlnq the area exhalation rate of radon-222 from sollr
Repre- Parameter Symbol Unl t Reported range sentative Ref.
va 1 ue
Lmanatlng power Fr 0.01-0.8 0.2 [01 ,s1 1
Lffcctlve bulk dlffuslon coef f lc lent Aeff m2 s-I 10-11-3 10-6 5 lo-' Lo1 .s1 1
Poros lty
-2 -1 Lxhalatlon rate R Bq m s 0.0002-0.07 0.016 [G2.M1]
T a b l e 11
Dlmenslons and relevant parameters of the reference house
------ A
Parameter Symbol Value --
Vo l ume (V) 250 m 3
Surtdce area ot floor (SF) 100 m 2
Surfdce area of external walls dnd celllng (s*) 3 0 0 m 2
Total surface area, lncludlng lntcrnal walls, furnlture, etc. (5) 450 rn2
- 1 Alr exchange rdte ( A V ) 1 h Thickness of floor and ceiling ( L F ) 0.2 m (concrete)
lhlckness of external walls (Lw) 0.2 m (br\cks)
T a b l e 15
Normal content of radlum-226 and radon-222 In Swedish sotl. measured at 1 m dept_?
[A101
Sol 1 type
Radlum-226 Radon-222 activlty Concentratlon
mass concentrat \on (Bq kg-\) (k8g m-3)
1111, normal 15- 6 2 5- 30 1111, wlth granltlc materlal 30- 175 10- 6 0 7111, with uranlum-rlch granlte materlal 125- 360 10- 200 Esker gravel 30- 7 5 10- 150 Sand. sllt 6- 70 10- 00 Sol1 contalnlng alum shale 175-2500 50->I000

T a b l e 16
Radon-222 source c h a r a c t e r l s t l c s f o r b u l l d l n q m a t e r i a l s
humber o f Radlum-226 Radon-222 mass Emanatlng D l f f u s l o n Ref . Coun t ry samples concentration e x h a l a t l o n r a t e power l e n g t h
( ~ q k g - 1 ) ( ~ ~ q k g - 1 s - 1 ) (m) M a t e r l a l
Concre te Heavy concrete USSR L i g h t w e l g h t conc re te USSR Ord \nary concrete Sweden Aerated conc re te based on alum shale Sweden Alum-shale conc re te Denmark f l y - a s h conc re te (4%) USA F ly -ash conc re te Greece Concrete Hungdry Concrete Oenmark Concrete Norway Concre te Greece Concre te USA Concrete USA Concre te USA (Adopted re fe rence
va lue )
B r l c k Red b r l c k Re0 b r l c k Red b r l c k Red b r l c k Br lCk 8 r l c k B r l c k S l l l c o n b r l c k Adobe b r l c k (Adopted re fe rence
v a l u e )
USSR Hungary Poland USA Denmark Norway Greece Poland USA
Gypsum Gypsum USA Gypsum board Denmark By-product gypsum
( a p d t l t e ) Poland By-product gypsum (phosphor \ t e ) Poland
L i g h t w e l g h t expanded c l a y aggregate Norway
S to rage rock
wood
f l y ash
S l a g
Cement
USA
USA
Poland
Poland
Poland USA
Sand USA USA
Grave l USA --
t h e r e f e r e n c e . assumlng a d l f f u s l o n l e n g t h o f 0 .2 m. a/ C a l c u l a t e d f rom da ta g i v e n I n

T a b l e 17
Sources of radon entry rates In the reference house
Source
Radon eltry rate (8q h-I)
Estlmated arlthmettc mean Typlcal range
Underlvlna sol1 0lff;ston 1.7 Pressure-driven flow 40
BulldIna materials 6.4 Outdoor -at r Water Natural gas 0.3 0- 1
Total (rounded) 50 2-200
a/ txcludlng alum shale: a radon entry rate of 8 0 8q rnm3 h-I Is estimated If aerated concrete based on alum shale Is used.
T a b l e 18
taulllbrlum factor F for radon daughters
tqulllbrlum factor F
Country Number of duelllngs Average Range Ref
Canada March Tounshlp 13 cltles
1 Inland Germany. Federal
Republlc of
Italy
Netherlands Norway Sweden Unlted Klngdom Unlted States
New Jersey
[ L ) I 0.19-0.67 b/ [Mb]
[ S 4 4 1 0.30-0.63 [Msl
g/ Arlthmetlc mean of the ratlo of the geometric means of the equlllbrlum equlvalent concentratlon and of the radon concentratlon ln 13 cltles.
b/ Range for the 1 3 citles. I/ Arlthmetlc mean; Gausslan dlstrlbutlon wlth o = 0.22. d/ Ratto of the medlans of equlllbrlum equlvalent concentratlon
and of radon concentratlon. g/ At mean ventllatlon rate of 2 alr changes h-1. Calculated
to be 0.40 at 1 alr change h-1. f/ Cellars. g/ Flrst and second floors.

T a b l e 19
Radon and equlllbrlum equivalent concentrations obtdlned In recent larqe-scale lndoor surveys
Average value (Ba n-3) C o u n t r y o r area Mwnber of Type o f Type o f sampllng Purpose of Date of Dlstrlbutlon Ref.
d n l l l n g s duelllng the survey completlon or range Radon Radon EIC
Argent lna
A u s t r l a Salzburg
Radon. pdssIve Populat Ion 1 9 8 5 37 (medldn) exoosure
Hones Radon and radon daughters, grab sampllng. usually 4 times a year
Populatlon 1980? 15 (sedldn) exposure
9 (medlan)
7 (medldn)
11 (medlan)
4 8 (medlan)
3 0 (medlan)
2 6 (medlan)
11 (medlan)
2 8 (medlan) 6 5 (medlan) 1 3 (medlan) 16 (medtan)
8 0 (mean)
1 3 (medlan)
L o g - n o r m 1 ? range 4 5 - 1 9 0 BQ m-3 (Rn)
13 houses and 6 apartments
Radon, passlve. one-year exposure
Matlo?-wlde 1984 41 (medlan) populatlon exposure (prellmlndry survey)
C a n a d a Rdd0n and radon daughters. grab samplings. preferably In basements
Matlon-wlde 1 9 0 0 3 3 (mean) vdrldbllIty o f exposures
Port H o p e Remedlal of 1976 3 b (medlan) lndustrlal contamlnatlon
U r a n l u m Clty Radon and radon daughters. grab sampllng. bastments and ilvlng areas
Causes of 1976 Increased radon levels In homes 1976 Elllot Lake
Bancroft Rddon daughters, grab sampllnq, bdsem4ntS and llvlng areas
S a s k a t c h e w a n Index map of 1980 radon problem drCdS
RddOn daughters. grab samollng
Log-normal 4 7 (medlan)
Population 1983 1 2 0 (mean) CXDOSUrC Populdt \on 1987 3 0 (mean) exposure
Range 0.6-259 8 q m - 3 (Rn)
Range 50-700 8 0 m-3
364 houses 113 apartments
Horns Radon. passlve 3-month exposure In sumner dnd In wlnter
Hdtlon-wide 1985 5 0 (medlan) populdt Ion exposure (pllol survey)
a r m d n y , Federal 5970 Homes R e p u b l l ~ o f
I l n l a n d 8 1 5 0 Homes
F r a n c e 765 Houses
m n g a r y 8 3 3 HOuSeS
Radon, pdsslve. 3-month erposure. 1 In bedroom. 1 In Ilvlng room
Mat lon-ulde 1984 4 0 (medlan) oopulat\on 4 9 (mean) exposure
Radon, passlve. 1-month exposure In llvlng room
Hat lor,-ulde 1982 64 (median) oopulatlon 9 0 (mean) erposLre
Radon, pdsslve dnd and RnOP. dctlve. one-month exposure
Hdtlor-ulde 1985 44 (medlan) populdt !on 76 (mean) eaposLre (vrellmlndry results)
Rddon ddughters. grab sampllng. llvlnq drear. data reduced to I h-1 ventllatlon rate
areland 7 3 6 Houses
I t a l y 1000 Houses
d a p d n 2 5 0 Houses
Radon, pcsslve 6-month exposure
Ndllon-wlde 1987 3 7 (medldn) population exposure (prellmlnary results)
Radon, Dasrlve. 3-12 month exposures.
natlon-ulde 1984 4 3 (medlan) populatlon erposure (partldl results)
Radon. electrostatic Integrdtlng. 2 months; total 1.5 year exposure
Ndt\on-wlde 1980 I0 (mean) pop~ldtlot! exposure
I + t h ~ r l d n d S 1 0 0 0 Houses
U o r w a y 1500 Houses
RddOn. PdSSlvC. exposure for 4 month5 In the Ilvlng room
Hatton-wide 1985 24 (medldn) populdtlon 2 9 (mean) exposure
1 0 (medlan) 1 2 (mean)
Radon. passlve. 1 week exposure
Assessment 1905 9 0 (mean) of geographical varlatlon

Table 19. continued
Average value (89 m-3) Country or drtd nu.ber of Type of Type of sampllnq Purpose of Oate of Dlstrlbutlon Ref
d n l l l n g s duelllng the survey c o w l e t l o n or range Radon Radon LEC
Poland 201 Apartments Radon and radon Hatlon-wlde 1918 9 (mean) 4 (mean) Log-normal 1 [GI31 daughters. grab population range 0.4-17 sanpllng In the worst exposure 89 m - 3 (Eft) ventllatlon condltlons
Sweden 5 Detached houses bullt before 1915
191 Apartments bullt Radon, passlve 2 - n e t before 1915 exposure. 1 In bedroom.
1 In llvlng room 9 6 OetdChed houses
bullt 1978-1980
38260 Oetached houses bullt before 1982 Varlous
BOO8 Apartment5 bullt before 1982
Sultzerland 123 Homes Radon. pdsslve. detec- tors. 1 ln b a s m n t . 1 In llvlng r o w . 1 In bedroom
105 HOWS
Hatlon-wlde 1982 populatlon exnoIure
Search for dwelllnqs ulth 1986 htgh radon levels
Coapdrlson of 1983 ueatherproofed and conventlonal houses
Unltcd Klnqdom 2300 nocacs Radon. passlve. 1-year Ndtlon-ulde 1985 exposure In llvlnq poculatlon r o w and In excosure maln bedroom
C o r n w a l l a n d 700 Homes Grab sampllnq of radon Setrch for 1985? other uranl- and radon daughters problem areas ferous regfons plus ventllatlon rate
plus I-year exposure wlth pdsslve radon detectors
122 (mean) Log-normal [SB. 6 5 (medlan) 5421
85 (mcan) 105 (mean) Log-normdl 4b (medlan)
59 (mean) L o g - n o r ~ l
bO (medlan) 150 (mean)
17 (medlan) In Ilvlng-rams 12 (medlan) In bedrooms
140 (medlan) 14 (medlan) Log-normal [YE. In llvlng. In llvlng- Og . 3.2 821. rooms r o w s o g (an) . 5.2 09 1
(tEC)
Unlted States 552 Slngle-famlly Var\ous homes
Naflon-wlde 1984 35 (medlan) ~ o p u l a t \on 61 (mean) exposure

T a b l e 20
Varlablllty of radon daughter bronchlal dose range as a per cent chanqe from nomlnal annual dose for males
[N141
Factor Varla- Corrments blllty
Unattached polonium-218 from 4% to 20% - 1 0 4% unattached polonlum-218 t30 20% unattached polonlum-218
Daughter product e ~ u l l i b r l u m - 20 (1/0.9/0.7/0.7 to 1/0.9/0.6/0.4)
Partlcle deposltlon models A few percent Partlcle slze (change In medlan size +lo0 For 0.05 run partlcles)
from 0.125 l im or 0.17 um) -20 For 0.17 u m particles) Calculated physlcal dose to a glven A few percent
slte In eplthellum Breathlng pattern (entirely actlve 420 Active pattern
pattern to entlrely restlng) -25 Restlng pattern (Mouth versus nose breathing) (-35)
Bronchlal morphometry +bO (chlld versus adult)
Mucoc l l lary clearance +lo (normal to complete stasls)
Mucus thickness (none to twlce + 2 0 No mucus normal) -30 Twlce normal mucus thlckness
locatlon of target cell (shallow -80 -22 w to average -45 w)
T a b l e 21
Dose and effectlve dose equivalent factors per unlt concentration of radon (or Its decay products) In alr (or water)
(Appllcable only to adults ln the general populatlon.)
Dose factor Effective (nGy h-1 per BQ m-3) dose
Pat hua y euulvalent Raln assumptlons factor
Tracheo- ( n ~ v h-I Stomach bronchlal Lungs per 8u m-3)
tree
lnhalatlon Radon gas 0.005
Radon decay products ( L E C )
1 ndoor s
Outdoors
Ingestion Radon gas 0.0001
0.04 0.2 Decay of radon and decay products in the same tlssue; solubll\ty factor of 0.4
10 Same doslmetrlc coefflclents for Indoor and outdoor condltlons
waier consumption rate = 0.5 1 d-1

T a b l e 22
Productlon of coal and reported actlvlty mass concentrations of natural radlonuclldes
Productlon of hard coal Actlvlty mass concentratlon 1985 [U15] (Bq kg-l)
Ref. Coa 1 X of the
equlvalent world U-238 Th-232 K-40 (109 kg) productlon
Austral la 118 4 30- 48 30 40 [BlO.F5] Austria 11-363 1-11 7-59 [ B 9 ] Brazll 8 0.3 100 6 7 370 [SZS] Canada 34 1 12 7 26 [T4,T7] Czechoslovakia 2 6 0.0 4-13
7 [J121
Chlna 81 0 2 6 16 30 [F5,J12] Germany, fed.Rep.
Blturnlnous coal 88 3 20 c 20 [J131 Brown coal 10 < 7 15131
Greece (llgnlte) 120-1300 0.7-0.9 [PlO,Pll] Hungary 3 0.1 1.5 [J121 lndla Average 150 5 24 3 8 83 [L12] Range 10-70 20-90 15-440 [LIZ]
Italy (llgntte) Central Italy 15-25 120-200 [Dl ,GI61 Sardinla 250 [Dl .GI 61
Poland Average 192 6 38 30 290 [T3] Range 2-140 7-!10 40-800 [T3]
South Afrlca 173 6 3 0 2 0 110 [S25] USSR
Average 494 16 2 8 25 120 [Lll] Unlted Klngdom
Yorkshlre area 2 0 2 0 240 [BJ] Country range 7-94 2.4-19 [ C ~ I Country average 94 3 15 13 150 [S29]
Unlted States Average 741 2 4 18 2 1 52 [BE] Range 1-540 2-320 1-710 [BE)
Venezuela 0.04 0.001 < 20 < 20 110 [S25] Yugoslavia 0.4 0.01 12-530 21-50 [891
World . 31 00 100
T a b l e 23
Uses of hard coal In OECD countrles. 1985 [U15]
OECO Unlted Un\ted Japan Klngdom States
Dornestlc 2 0 Comerclal/publlc servlce 7 Power statlons 835 Coke ovens 21 1 Iron and steel Industry 5 Chernlcal lndustrles 22 Other lndustrles 77 Rall transport 0.2 Other 55
Total

T a b l e 24
Radon and radon decay products In coal mlnes
(Uean values wlth range In parentheses.)
Potent la1 Annual Country or area Year Radon alpha energy potentlal Ref.
concentratlon concentratlon alpha energy of radon a/ exposure
(8q m-3) ( V J m-3)- ( m J )
European Comnunl tles 1981 0.09 0.2 [el91 b/ 1981 0.2 0.5 [ ~ 1 9 1
1981 0.5 1.2 [el91 Germany, federal 1976 105 [C61
Republlc of (up to 400) Indla 1981 0.02 [ N9 1
(0.01-0.04) Poland 1981 t 2 C/ [D41 Unlted Klngdom 1968 (20-500) 0.4 ID31
1976 ( u p to 2) [OlO] 1981 0.5 d/ [Oll]
a/ 1 115 m-3 corresponds to an equtllbrlum equlvalent concentratlon of radon of 1 8 0 Bq m-3.
b/ Radon decay product concentrations and annual exposures derlved from two-month measurements; log-normal dlstrlbutlons.
c/ Less than 2 pJ m-3 for 94% of the measurements. a/ Uean annual exposure In natlonallzed mlnes, employlng 185.200 mlners; the
mean annual exposure In prlvate mlnes, employ\ng 1,500 mlners, was 1.0 mJ
T a b l e 25
Ash productlon In the United Klnqdom LC11 I
Source Coa 1 A s h Ash productlon
consumption content
(lo9 kg) (XI (109 kg) (% o f total)
Domestic and manufactured fuels 15.0 4.7 0.7 4.5
Pouer stations 73.1 17.1 12.5 80.1 Cdrbonlzatlon (coke. . . . ) 17.5 6.0 1.1 7.1 Other Industry 12.1 9.6 1.2 7.7 0ther.lncludIngexport 1.5 6.3 0.1 0.6
Welghted Total 119.2 average 15.6 100.0
13.2
T a b l e 26
Total emiss\ons of 'esplrable particulates \ n the Urlted Kinqdom
[Cll I
Total emissions
Ortgtn lo6 kg x of total
Domest ic 3 37 7 4 Comnerclal/publlc service 12 3 Power stations 2 8 6 Other Industry 6 8 15 Rall tranrport 10 2
Total 455 100

T a b l e 27
Coal-flred power plants: estimates of annual a t m o s ~ h e r i c dlscharges per unit enerqv qenerated
(MBq per GW a)
U-238 Th-232 Fly-ash decay series decay serles removal K-40 Reference
efflclency ( X ) U-238 Ra-226 Pb-210 Po-210 Th-232 Th-228
Canada a/ Nantlcoke, 4000 HW 99.5 350 100 100 300 300 7 0
France ? 3500 7000 7000 6000 Germany, Federal Rep. of
Brown coal Bituminous coal Bltumlnous dry ash removal 9 9 Bltumlnous llquld ash remova 1 9 9 500 300 2000 6000 200 200 [HI?]
lndla 9 5 31 000 6400 10000 Italy
Llgnlte. 250 HW Llgnlte, 7 0 MU Coal, 1 2 8 0 H W
USSR Zaporozhje b/ 1200 MW
(old) 1000 nw (modern)
Unlted Ktngdom. 2000 MU
United States
M-1, 510 Mu r/ M-2. 450 HW r/ M-3. 125 MW c/ M-4, 12.5 MU c/ Mllllken, 270 MW Model plant (modern) Model plant (1970) Model plant (modern) Model plant (1972)
[Dl .GI61 [Dl ,6161 [01 .tlb]
[Ibl
[I61
[ c9 I [C141 ~ 4 1 4 1 ~ 7 1 [US1 [US1 [US1 [US I (K141 [ U s 1 [US I [BE] [eel
UHSCEAR 1982 Report 97.5 4000 1500 1500 5000 5000 1500 1500 [Ul]
lhls Annex modern old
a/ Assumlng a coal consumptlon of 3 7 9 per GW a. b/ Ash content of the coal of 30-39% (Donety. Kuznets coal field); annual coal consumptlon of 5 Tg c/ Derlved from the ratlo of emlssion rate to actlvlty feed rate for U-238.

T a b l e 28
L s t l m t e s of collecttve effectlve dose eaulvalent c o m l t m e n t s per unlt energy generated
resultlnq from atmospheric releases from a typlcal .oldm coal-fired power plant a/
(10-2 man Sv per GW a)
Internal External lnhalatlon lrradlatlon lrradlatlon
Radlonucllde durlng the due to due to Total cloud deposlted deposited
passage activity actlvlty
15 17 6 0 1.3
t daughters 0.1 -r Po-210 14
290 + daughters 6 0 + daughters
Total (rounded) 455 135 3 0 620
a_/ Releaslng about 10% of the fly-ash produced.
T a b l e 29
Fstimater of collectlve effectlve dose equivalent comnltment> per unlt energy generated
resultlnq from atmos~heric releases - from a t y ~ l c a l modern coal-flred power plant a_/
(10-2 man Sv per GW a)
Internal External lnhalatlon lrradlatlon lrradlatlon
Radlonuc l lde durlng the due to due to Total cloud deposlted deposlted
passage actlvlty actlvlty
U-238 U-234
Th-230 Ra-226 Rn-222 + daughters Pb-210 4 Po-210 Th-232 Ra-228 * daughters Rn-220 + daughters
Total (rounded) 2 3 2 6 1.5 5 0
a_/ Uslng emlsslon control devlces that allow only about 0.5% of the fly-ash produced to escape.

T a b l e 3 0
Estimates of collectlve effectlue dose epulvalent comnltments per vear of practlce In the coal fuel cycle
Source
Collective effectlve dose equlvdlent comnltment per year of practlce
(man Sv)
Pub1 lc Workers
Coal mlnlng 0.5-10 2 0 0 0 Use of coal
Electrlcal energy production 2000 6 0 Domestic use 2000-40000 Coke ovens Not estimated Not estlmdted
Use of fuel ash 50000 Not estlmdted
T a b l e 31
Use of oil In the OECD coun:rIer. 1918 [Obi
Use Type of fuel ass (lo9 kg)
Comnerclal/publ\c servlce Power statlons lron and steel Industry Chemlcals Industry Other lndustrles Alr transport Road transport Rallways
Gas/dlesel oil Llquefled gases Gas/dlesel oil Residual fuel oll Resldual fuel oll Resldual fuel oil Resldual fuel oil Jet fuel Motor gasol lne Gas/d\esel 011
T a b l e 32
Uses of natural gas i n O E C D l g u n t r l e s . 1% [U151
OECD (total) Unlted United Japan Klngdom Stater
Energy Share (PJ) (XI (XI ( X ) ( X I
p~ - ~
Domes t Ic 7980 Comnerclal/publlc servlce 4310 Power statlons 5850 Natural gas extractlon 2340 Petroleum reflnerles 6 7 0 lron and steel Industry ] Chemicals Industry ] 10000 Other lndustrles 1 Other 1550
Total 32700 100 100 100 100

T a b l e 3 3
Collectlve e f f e c t l v e d o s e equlvalent c o m n l t m e n t t o m e m b e r s of the public a t t r i b u t a b l e t o various systems o f e l e c t r l c l t y production
Collective effe c t l v e N o r m a l l z e d d o s e equlvalent c o l l e c t l v e e f f e c t l v e
T y p e of comnl tment d o s e e q u i v a l e n t plant per year of practlce c o r m 1 t m e n t
( m a n Sv) ( m a n S v per G W a)
Coal-fired 01 I-f ired Natural g a s Geothermal P e a t
T a b l e 3 4
Estlmated atmospheric dlscharqes f r o m p h o s p h a t e industrial plants
Annual R a d l o n u c l l d e d l s c h a r g e s ( G B q a-l) lnput of Ref.
T y p e of plant p h o s p h a t e and location rock U-238 7 h - 2 3 0 R a - 2 2 6 Rn-222 Pb-210 Po-210
(106 t) a/
Ore drying a n d g r l n d l n g Unlted States. reference p l a n t 2.7
Elemental phosphorus plant Vlisslngen, N e t h e r l a n d s 0.75 Unlted States
Pocatello, I d a h o j Soda Springs, I d a h o j Sllver Bow, Montana ] -4 K t . Pleasant, Tenn. ] Columbia, T e n n . 1 Coiumbta. Tenrr. 1
Wet-process f e r t l l l z e r plant Unlted States. reference plant 1
a/ Atmospherlc d l s c h a r q e s of Rn-222 estlmated by UNSCEAR.

T a b l e 35
Estimates of collective dose comnltments per unlt mass of ~hos~hate ore resultlnq from atmos~heric releases from phos~hate lndustrlal ~lants
Collective dose comnitment man Gy t-l) -
Radlonucllde AIrborne discharge Red Gastro- Other
Lungs Bone bone Llver Kldneys Spleen lntesttnal soft (Bq t-l) surfaces marrow tract tlssues
Ore drylng and grlndlng U-238 200 U-234 200 Th-230 200 Ra-226 200 Rn-222 1.5 106
Pb-210 200 Po-21 0 200
External lrradlatlon
Total
Elemental phosphorus plant U-238 100 U-234 100 Th-230 100 Ra-226 100 Rn-222 1.2 106
Pb-210 5.9 lo4 PO-210 2.9 105
External lrradlatlon
Total
Wet process fertlllzer U-238 U-234 Th-230 Ra-226 Pb-210 Po-21 0
External lrradlatlon
plant 250 3.2 0.5 0.07 0.03 0.3 0.01 0.01 0.01 2 50 3.8 0.4 0.05 0.02 0.3 0.02 0.02 0.02 250 3.6 28 2.1 0.05 0.06 0.007 0.007 0.007 4 0 0.04 0.2 0.02 0.005 0.005 0.005 0.005 0.005 100 0.1 1.6 0.2 0.3 0.2 0.2 0.2 0.2 100 0.1 1.002 0.002 0.002 0.06 0.1 0.001 0.002
0.9 0.9 0.9 0.9 0.9 0.9 0.9 0.9
Total 12 32 3.3 1.3 1.8 1.3 1.2 1.2
a/ Tracheo-bronchtal basal cell layer. b/ Pulmonary eplthellum.

T a b l e 36
Estimates of collective dose comnltments resultlnq from world-ulde annual atrnospherlc releases
from phosphate lndustrlal plants
Collectlve dose comnltment (10-3 man Gy)
Radlonucllde Airborne discharge Red Gastro- Other
Lungs Bone bone Llver Kidneys Spleen Intestinal soft (all t-l) surfaces marrow tract tlssues
Ore drying and grlndlng U-238 2 0 U-234 2 0
Th-230 2 0 Ra-226 200 Rn-222 130000
Pb-210 20 Po-210 20
External Irradlatlon
Total
Elemental phosphorus plant U-238 1.5 U-234 1.5
Th-230 1.5 Ra-226 1.5 Rn-222 16000
Pb-210 800 Po-210 4000
External lrradiatlon
Total
Wet process fertllizer plant U-238 10 130 19 2.7 1 1 1.3 0.01 1.3 1.3 U-234 10 150 17 2.1 0.7 10 0.7 0.7 0.7
Th-230 10 140 1100 8 5 2 2.2 0.3 0.3 0.3 Ra-226 2 2.1 1 1 0.3 0.3 0.3 0.3 0.3 Pb-210 6 9 94 15 16 14 12 12 12 PO-210 6 7 0.1 0.1 0.1 3.5 6.2 0.008 0.1
External Irradlatlon 4 7 4 7 4 1 4 7 47 47 4 7 47
Total 490 1300 150 67 8 8 6 8 62 62
a/ Tracheo-bronchlal basal cell layer. b/ Pulmonary eplthellum.

T a b l e 37
Averaqe activlty mass concentrations of uranium-238 and radlum-226 p e r n i t mass of P2g5 in phosphate fertilizer
Bq/kg P20s Country Ret
Flnland 1700 480 [M21 ] Germany, Fed.Rep.of 2600 1700 [PIS] United States 9200 1300 [U13] Unlon of Sovlet
Soclallst Republics 9 3 0 [OBI
T d b l e 3 8
Estlmated collective dose c o m ~ l t m e n t per mass of phosphate rock resultlnq from the use of phosphate fertlllzers
Organ or tlssue Collective dose c o m i t m e n t man Gy t-l)
U-238 U-234 Th-230 Ra-226 Rn-222 Pb-210 Total
Internal irradlatlon Lungs 1
Bone surfaces 20 Red bone marrow 3 LI ver 1 Kidneys 1 0 Other tissues 1
External irradldtlon All tissues
a_/ Tracheo-bronchtal basal cell layer. b/ Pulmonary eplthellum.
T a b l e 39
Estlmates of collectlve effectlve dose equlvalent comnltment to the world populatlon arislnq from one year of exploltatlon of phosphate rock
Source of exposure
Collectlve effectlve dose equlvalent comnltment
(man Sv)
Hembers of the Workers pub1 lc
Phosphate lndustrlal operations 6 0 a/ 20 b/ Use of phosphate fertlllzers 10000 5 0 b_/ Use of by-products and waste 300000 Not estimated
&/ An addltlonal 170 man Sv to the Dutch population Is estlmated to result from dumplng phosphogypsum Into the Rhlne.
b/ From external Irradlatlon only.

T a b l e 40
Radon and radon decay products In non-uranium mlnes
Year Country
Germany, 1984 Federal 1984 Rep. of 1984
United States
1981 19el 1981 1 gel 1981 1981 1981 1981 1981 1981 1981 1984
Poland 1966-1970 1966-1970 1966-1970 1966-1970 1972-1976 1977-1978
Sweden 1970-1980 1982
Unltrd 1973-1975 Kingdom 1973-1975
1973 1973-1975 1973-1975 1973 1973
1973-1975 1973
1973-1975 1973 1973
1973-1975 1975 1981 1978 1978 1978 1978 1978 1978
Potentlal Annual alpha potential
Radon energy alpha Type of mlne Ref. concen- concen- energy tratlon tratlon exposure
of radon (Bq m-3) (uJ m-3) (mJ)
9000-20000 40-330 Tln, copper. [s331 a/ d/ and tungsten
1 3 Lead and zlnc [KlS] 280 1 3 Iron [KlS] 20 0.2 0.4 Pyrlte, zlnc.
barlte [Kls] l I0 0.4 1 Barl te [K151
0.4; b 0.9; 14 Fluorspan, barlte [KlS] 4100 10 2 5 Fluorspan [ K1S 1 6600 2 0 60 Graphl te [K151 1200 b/ 2 &/ . 5 b/ 120 0.2 0.4 Clay tK151
80 200 ~eldspar [ ~ 1 5 ] 1 3 Slate [K15l 0.8 2 011 shale [K151 0.4 0.8 Rock salt [KlS] 0.02 0.04 Salt sallne iK151
0.04-0.3 Gold * I N9 1 1.4 -3.5 Copper [Ng]
4.8 Copper Ln291 0.07 Gold In291 0.7 Lead/Zlnc ~ ~ 2 9 1 0.15 Manganese ~4291 0.3 Mlca [H291 0.04 Amlanthlnlte [S361 1.2 Barite [ 536 1 2.5 Bauxlte [S36 ] 0.2 Chalcopyrlte S3b 1
0.04; 0.2 Feldspar 15361 1.5; 5.6 fluorspar [S361 0.08-11.4 p/ f luorspar [s361
4.8 Hagnetl te (5361 0.04- 5.4 a/ Slderlte is361 0.03- 0.7 a/ Steatlte [ 536 1 0.5: 3.4 Sulphur [S36] 0.4 - 10 c/ Not lndlcated [S37]
1.9 1 ron [D41 3.1 Pyrlte [D41 0.6 Barlte LO41 2.2 Zlnc-lead, copper [D4]
2.5 - 3.1 a/ Zlnc-lead, copper [D4] 2.5 Zinc-lead. copper [CIS]
3-20 a/ 50 mlnes [s35] 5 Iron, z l n c , copper[S58]
1 . 5 - 9 0 4-240g/Tln is34 1 0.4 - 20 &/ 0.6-30 a/ Haematlte [534 1
2 4 Iron [534 I 0.08-160 a/ 0.4-120 Fluorspar [53.11 0.2 - 14 a/ 0.7- 30 Limestone [534 1 0.2; I 0.4; 2 Calcspar 0.6; b 0.4: 15 Homestone [s34] 0.2 - 10 0.4- 20 Flreclay is341 0.1: 1 0.4 - 5 Ballclay [5-34 1 6; 30 10;55 Lead [534 1
i .s 3 Slate [=dl 15 40 Barite f S34 1
0.06; 0.4 0.4; 1 Salt 4
[534 I 2 Slllca sand [534 1
1 1 Other than coal [Oil] 5 - 8 Z I nc i 532 I
3 1 ron [S321 5 Flreclay [ 532 1 0.8 f luorspar [s321
Copper [S321 0.04-0.1 Limestone [s321
p/ Range of means. b/ Wlnter measurements. c / Assumlng an average equlllbrlum factor of 0.7. a/ Average exposures decreaslng wlth time from 20 mJ ln 1970 to 3 mJ In 1980.

T a b l e 41
Environmental radlatlon fields and occupational exposures ln non-uranium mlnes of the Unlted Klngdom
(Based on [05])
RADIATION CHARACTERISTICS
Ulne
2 3 8 ~ 232Th Potential Potent la1 actlvi ty attlvlty alpha energy alpha energy
per untt mass per unit mass concentratlon concentrdtlon of radon of thoron daughters daughters
(8s kg-I (0s kg-') ( u J m - 3 ( v J m-3)
1: sedlmentary 2: sedlmentary 3: sedlmentary 4: lgneous 5: redlmentary 6: lgneous 7: sedlmentary 8: lgneous
OCCUPATIONAL DOSES
Average Contrlbutlon (per cent of the total) annual
effectlve Ulne dose External Inhalatlon of Inhalation of Inhalatlon of
equlvalent lrradlatlon radon thoron ore dust ( mSv ) $1 daughters daughters b/
a/ Assumlng a 4 n geometry. b/ Assumlng an ore dust concentratlon of 3.8 mg m-3.
T a b l e 42
Estimated atmospheric releases of natural radlonuclldes from zinc mlnlnq and processlns facllltles
[AT, U81
Annual dtmos~herlc releases (Mas)
Rad l o- nuc l lde
Ulne Ulll Smelter
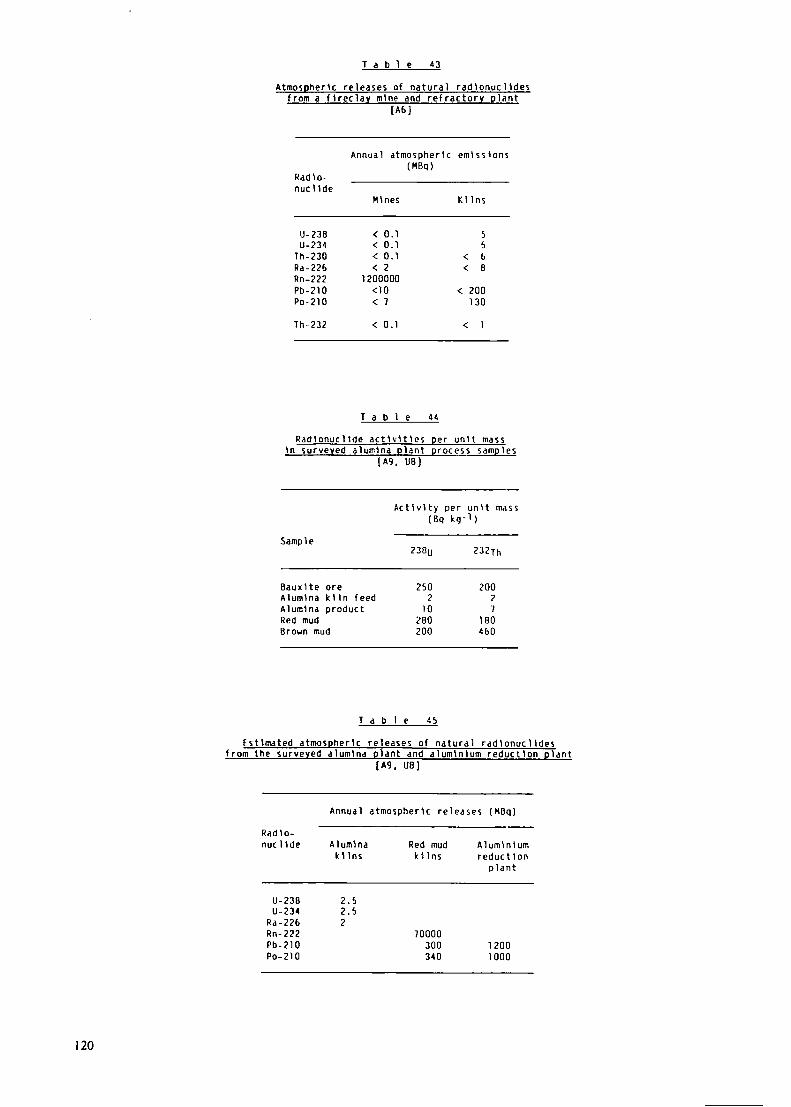
T a b l e 43
Atmospheric releases of natural radlonuclldes from a flreclav mlne and refractory plant
[A61
Annual atmospheric emissions (naq)
Rad l o- nuc l lde
Hlnes Kllns
T a b l e 44
Radtonucltde actlvltles per untt mass In surveyed alumlna plant process samples
[ ~ s , uei
Samp 1 e
Activlty per unlt mass (8q k g - ' )
Bauxlte ore 250 Alumlna klln feed 2 Alumlna product 1 0 Red mud 280 Broun mud 200
T a b l e 4 5
tstlmated atmospherlc releases of natural radlonuclldes from the surveyed alumina plant and alumlnlum reduction plant
lA9, U81
Annual atmospherlc releases (U8q)
Radlo- nucllde Alumina Red mud Alumlnlum
kllns kllns reduction plant

T a b l e 4 6
Radlonucllde actlvltles per unlt mass In surveyed copper mine and mlll process samples
[As, us1
Underground mlne and mlll Open plt mlne and mlll
Sample 23811 2 3 2 ~ h 2 3 8 ~ 232lh
(Bq kg-1) (Bq kg-1) (Bq kg-1) (Bq kg-1)
Ore 3 0 Concentrate 24
T a b l e 47
Estimated atmospheric releases of natural rad\onuclldes from copper ore mlnlng dnd processins facllltles
[A7, U81
Annual atmospheric releases (naq) . .
Radlo- nucl tde
Rlne Mill Smelter
T a b l e 4 8
Estimates of per c a ~ u t annual effective dose e~ulvalents and of ranges, excluding extreme values,
for the most Important natural sources of radlatlon
Annual effective dose equlvalent ( ~ S V )
Source of lrradlatlon
Mean Typlcal range
External Cosmlc rays 360 Terrestrlal sources 410
Internal K-40 180 U-238 + Ra-226 2 0
Rn-222 + Po-214 11 0 0 Pb-210 + Po-210 120 Th-232 + Ra-224 2 0 Rn-220 + 11-208 160
Total (rounded) 2400 1500-6000 a/
a/ The 90th. 95th and 99th percentlles are estlmated - to be 2300, 3300 and 6100 uSv, respectlvely, assumlng a log-normal dlstributlon wlth a geometrlc standard devlatlon of 2.5.
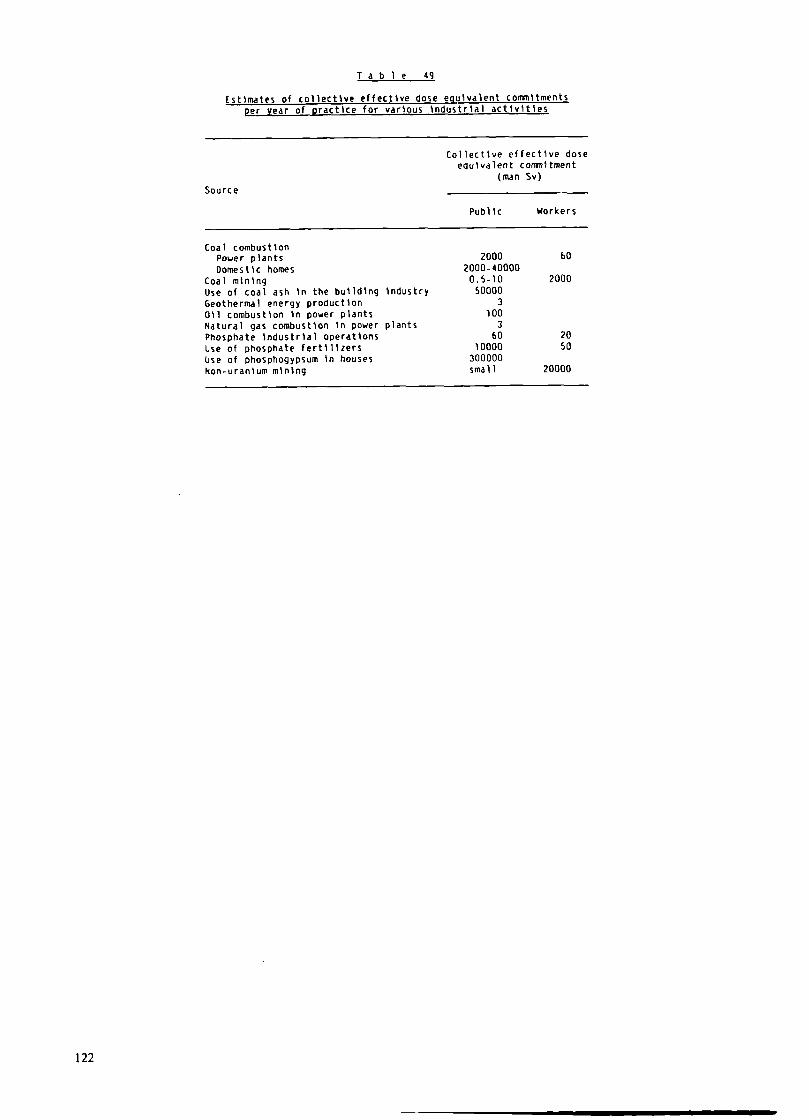
T a b l e 49
Istlmates of collective effectlve dose esulvalent comnltments per year of practlce for varlous lndustrlal actlvitles
Collective effectlve dose equivalent comnltment
(man Sv) Source
Publ lc Workers
Coal combustlon Power plants Domestlc homes
Coal mlnlng Use of coal ash ln the bulldIng lndustry Geothermal energy production 011 combustlon In power plants Natural gas combustlon In pouer plants Phosphate lndustrlal operattons Use of phosphate fertlllzers Use of phosphogypsum in houses Non-uranlum mining
2000 60 2000-40000 0.5-10 2000 50000
3 100 3 60 20
10000 5 0 300000 smal l 20000

REFERENCES
.4 1 Arabzedegan, M.. E.E. Carroll, Jr , and J.A. Wething- ton, Jr. Random noise techniques applied to radon flux measurements. p. 621-626 in: Natural Radiation Environment (K. Vohra et al.. eds.) Wiley Eastern Limited, 1982.
A2 Asikainen. M. and H. Kahlos. Natural radioactivity of drinking water in Finland. Health Phys. 39: 77-83 ( 1980).
A3 Andersson, 1.0. and I. Nilsson. Exposure following ingestion of water containing radon-222. p. 317-325 in: Assessment of Radioactivity in Man. Vol. 11. IAEA, Vienna, 1964.
A4 Andrasi, A. and E. Beleznay. Natural potassium content and internal radiation burden of the Hungarian adult population from potassium-40. Health Phys. 37: 591-592 (1979).
.45 Aigueperse, J.. J. Chalabreysse, R. Coulon et al. Impact radiologique des rejets atmosphtriques d'une centrale au charbon. p. 195-214 in: Health Impacts of Different Sources of Energy. IAEA, Vienna, 1982.
A6 Andrews, V.E. Emissions of naturally occurring radioactivity: fireclay mine and refractory plant. Technical Note EPA/ORP/LVF 8 1- 1 ( 198 1 ).
A7 Andrew, V.E. Emissions of naturally occurring radioactivity: under- ground zinc mine and mill. EPA/520-68-2020 (1982).
A8 .4igueperse, J. and F. Anguenot. Communication ( 1983).
A9 Andrews, V.E. and T. Bibb. Emission of naturally occurring radioactivity from aluminum and copper facilities. USEPA report EPA-520/6-82-08 1 (1982).
A10 Akerblom, G., P. Andersson and B. Clavensjo. Soil gas radon. A source for indoor radon daughters. Radiat. Prot. Dosirn. 7: 49-54 (1984).
A l l Abu-Jarad. F. Some factors affecting the concentra- tion of radon and its daughters inside houses. p. 93-98 in: The Proceedings of the 3rd International Con- ference on Indoor Air Quality and Climate. Vo1.5. Stockholm, Sweden, 1984.
A12 Andrews. V.E. and T. Bibb. Emission of naturally occurring radioactivity: Stauffer elemental phosphorus plant. USEPA EPA-520/6-82-019 ( 1982).
A13 Andrews, V.E. and T. Bibb. Emission of naturally occurring radioactivity: Monsanto elemental phos- phorus plant. USEPA EPA-520/6-82-021 (1982).
A14 Anonymous. Radioactivity in a gypsum pile. Chemical Week, 11-12 (March 30, 1983).
4 1 5 Abe, S., K. Fujitaka and K. Fujimoto. Natural radiation in Japan. p. 1034-1048 in: Natural Radiation Environment 111. CONF-780422 (Vo1.2). ( 1980).
A16 .4nspaugh. L.R. Final report on the investigation of the impact of the release of radon-222, its daughters, and precursors at the Geysers geothermal field and surrounding area. Lawrence Livermore Laboratory. 1978.
A 17 Air Pollution Control Association. Indoor radon- An APCA International Specialty Conference. Philadelphia, Pennsylvania, February 1986.
A18 Abe. S., K. Fujimoto and K. Fujitaka. Relationship between indoor and outdoor gamma-ray exposure in wooden houses. Radiat. Prot. Dosim. 7: 267-269 (1984).
B1 Bruno, R.C. Verifying a model of radon decay product behaviour indoors. Health Phys. 45: 471-480 (1983).
Bernard. S.R. On the (MPC)w for radon-222 and its comparison with natural levels. p. 192-196 in: ORNL- 3189 (1961). Bernard, S.R. (MPC)w radon-222. p. 166-169 in: ORNL-3492 (1963). Brunner, H.. W. Burkart, E. Nagel et al. Radon in Wohnraumen in der Schweiz. Ergebnisse der Vor- studie 1981/1982 (1982). Buttlar, H. von and W.F. Libby. Natural distribution of cosmic-ray produced tritium. Part 11. J. Inorg. Nucl. Chem. 1: 75-91 (1955). Burton, W.M. and N.G. Stewart. Use of long-lived natural radioactivity as an atmospheric tracer. Nature 186: 584 (1960). Barnes, J.N. and A.R. Ware. Natural radionuclide content of some U.K. coals and ashes. p. 293-298 in: Proceedings of the Third International Symposium of the Society for Radiological Protection. Radiological Protection Advances in Theory and Practice. Inver- ness, 1982. Beck. H.L., C.V. Gogolak, K.M. Miller et al. Per- turbations on the natural environment due to the utilization of coal as an energy source. p. 1521-1558 in: Natural Radiation Environment 111. CONF-780422 (1980). Bauman. A., D.J. Horvat, J. Kovac et al. Techno- logically enhanced natural radioactivity in a coal-fired power plant. p. 401-412in: Natural Radiation Environ- ment. (K. Vohra et al.. eds.) Wiley Eastern Limited, 1982. Bayliss. R.J. and H.W. Whaite. A study of the radium alpha activity of coal, ash and particulate emission at a Sydney power station. Air and Work Pollut. Int. J . 10: 813-819 (1966). Booth, G.F. The need for radiation controls in the phosphate and related industries. Health Phys. 32: 285-290 (1977). Barkhudarov, R.M. and B.K. Borisov. Exposure of the public to radiation from natural radionuclides in the atmospheric releases from coal-fired electrical power stations. p. 259-265 in: Health Impact of Different Sources of Energy. IAEA, Vienna. 1982. Borisov. B.K. et al. p. 42 in: Current Issues of Radiation Hygiene. Moscow. 1983. Blaton-Albicka, K. and J. Pensko. Assessment of radon exhalation rates in dwellings in Poland. Health Phys. 41: 548-551 (1981). Bunzl, K., H. Hotzl, G. Rosner et al. Spatial distribution of radionuclides in soil around a coal fired power plant: 2 10-lead, 210-polonium, 226radium, 232-thorium, 40-potassium emitted with the fly ash and 137-caesium from the worldwide weapon testing fallout. Sci. Total Environ. (in press). Bunzl. K., F. Dietl. W. Kracke et al. 210-polonium, 210-lead and stable lead in the organs of slaughtering cattle near several fossil fuel burning power plants. p. 49-56 in: Texkes des Confkrences du VIe Congrk Mordial pour la Qualite de 1'Air. Vo1.4. Paris, 1983. Benton. E.V. Summary of current radiation dosimetry results on manned spacecraft. MS no. F.8.1.4. in: Proceedings of 1984 COSPAR Meeting. Graz, Austria, 1984. Benton, E.V. STS-51 A Dosimetry Report. Tehnical Report No. 67. University of San Francisco, 1985. Bernhard, S., J.A. Le Gac, H. Seguin et al. Radon levels and radon daughter exposures of workers in

nonuranium mines of the E.C. p. 625-628 in: Radia- tion Hazards in Mining. Society of Mining Engineers, 1982. Berteig, L. and E. Stranden. Radon and radon daughters in mine atmospheres and influencing fac- tors. p. 89-94 in: Radiation Hazards in Mining. Society of Mining Engineers, 1982. Bauman, A. and D. Horvat. The impact of natural radioactivity from a coal-fired power plant. Sci. Total. Environ. 17: 75-8 1 (198 I). Bauman, A., D. Horvat and J. Hrsak. Exposure to radiation and chemical mutagenic agents at a coal- fired power station. p. 281-286 in: Proceedings of the Third International Symposium of the Society for Radiological Protection. Radiological Protection Advances in Theory and Practice. Inverness, 1982. Brown, L. National radiation survey in U.K.: indoor occupancy factors. Radiat. Prot. Dosim. 5: 203-208 (1983). Bai, G. and J. Teng. Investigation on the outdoor residence time and mode for Beijing residents. Radiat. Prot. 4: 33-38 (1984). Bruno, R.C. Sources of indoor radon in houses: a review. APCA J. 33: 105-109 (1983). Brown. K., P.J. Dimbylow and P. Wilkinson. Modelling indoor exposure to natural radiation. Radiat. Prot. Dosim. 7: 91-94 (1984). Brown, L.. B.M.R. Green, J.C.H. Miles et al. Radon exposure of the UK population. p. 61-66 in: Proceed- ings of the 3rd International Conference on Indoor Air Quality and Climate. Vol. 2. Stockholm, Sweden. 1984. Beck, H.L. Gamma radiation from radon daughters in the atmosphere. J. Geophys. Res. 79: 2215-2221 ( 1974). Brunner, H., W. Burkart, W. Gorlich et al. Indoor radon levels in Switzerland. Results of a national survey. p. 117-120 in: Proceedings of the 6th Inter- national Congress of IRPA. Berlin (Federal Republic of Germany), 1984. Becker, K.H., A. Reineing, H.G. Scheibel et al. Radon daughter activity size distributions. Radiat. Rot . Dosim. 7: 147-150 (1984). Bothof, J. Communication (1985).
Beck, H.L. The physics of environmental gamma radiation fields. p. 101-134 in: The Natural Radiation Environment 11. USERDA, CONF-720805-P2 (1982). Busuoli, G., L. Lembo, R. Nanni et al. Indoor gamma exposure measurements in Italy. Radiat. Prot. Dosim. 7: 313-316 (1984). Bradley. E.J. and B.M.R. Green. Outdoor gamma-ray dose rates in Great Britain. Preliminary results. Radiol. Prot. Bull. 59: 16-19 (1984). Beck, H.L. and C.V. Gogolak. Time-dependent cal- culations of the vertical distribution of radon-222 and its decay products in the atmosphere. J. Geophys. Res. 84: 3139-3148 (1979). Boothe, G.F., D. Stewart-Smith. D. Wagstaff et al. The radiological aspects of zircon sand use. Health Phys. 38: 393-398 (1980). British Geological Survey. World Mineral Statistics 1978-82. Production: Exports: Imports. National Environment Research Council. HMSO, London, 1984. Bouville. A. and W.M. Lowder. Human population exposure to cosmic radiation. Presented at the 4th Inter- na t ion~l Symposium on the Natural Radiation Environ- ment. I isbon, Portugal. 1987. Beck, H.L. Radiation exposures due to fossil fuel combustion. Unpublished (1988). Cox. W.M., R.L. Blanchard and B. Kahn. Relation of radon concentration in the atmosphere to total moisture retention in soil and atmospheric stability. p. 436-446 in: Radionuclides in the Environment, Advances in Chemistry Series 93 (1970).
CastrCn, 0. The contribution of bored wells to respiratory radon daughter exposure in Finland. p. 1364-1370 in: Natural Radiation Environment 111. CONF-780422 (1 980). Colle. R., R.J. Rubin, L.I. Knab et al. Radon transport through and exhalation from building materials: a review and assessment. NBS Technical Note 1139 (1981). Cliff, K.D.. A.D. Wrixon, B.M.R. Green et al. Radon daughter exposures in the U.K. Health Phys. 45: 323- 330 (1983). CastrCn, O., K. Winqvist, I. Makelainen et al. Radon measurements in Finnish houses. Radiat. Prot. Dosim. 7: 333-336 (1984). CastrCn, O., M. Asikainen. M. Annanmaki et al. High natural radio-activity of bored wells as a radiation hygienic problem in Finland. p. ... in: Proceedings of the Fourth International Congress of IRPA, Paris, April 1977. Chhabra, A.S. Radium-226 in food and man in Bombay and Kerala State (India). Br. J. Radiol. 39: 141-146 (1966). Cliff, K.D. Population exposure to the short-lived daughters of radon-222 in Great Britain. Radiol. Prot. Bull. 22: 18-23 (1978). Camplin, W.C. Coal-fired power station-the radio- logical impact of effluent discharges to atmosphere. NRPB-R107 (1980). Canada. Environmental levels in Canada. Clernente, G.F., A. Renzetti, G. Santori et al. Assessment of polonium-210 exposure for the Italian population. p. 1091-1094 in: Radiation Protection. A systematic approach to safety. Pergamon Press, 1980. Cooper, M.B., J.R. Slatham and G.A. Williams. Natural radio-activity in the production of titanium dioxide pigment: a study of the Laforte plant and environmental behaviour of radionuclides at Bunbury, Western Australia. ARL/TR037 (1981). Corbett, J.O. The radiation dose from coal burning: a review of pathways and data. Radiat. Prot. Dosim. 4: 5-19 (1983). Chruscielewski, W. and T. Domanski. System of personal dosimetry introduced in Polish nonuranium mines. p. 589-596 in: Radiation Hazards in Mining. Society of Mining Engineers, 1982. Chang Mei T.Y. and P.S. Weng. Measurement of environmental radon-222 in selected areas of Taiwan province of the Republic of China. p. 69-73 in: Proceedings of the Specialist Meeting on the Assess- ment of Radon and Daughter Exposure and Related Biological Effects. R D Press. 1982. Cardinale, A., G. Cortellessa, F. Gera et al. Distri- bution in the Italian population of the absorbed dose due to the natural background radiation. p. 421-440 in: The Natural Radiation Environment 11. CONF- 720805-PI (1972). Cline. W., S. Adamovits, C. Blackman et al. Radium and uranium concentrations in Georgia community water systems. Health Phys. 44: 1-12 (1983). Chinese Journal of Radiological Medicine and Pro- tection. Vol. 5 (Supplement) (1985). Cross, F.T., N.H. Harley and W. Hofmann. Health effects and risks from radon-222 in drinking water. Health Phys. 48: 649-670 (1985). Castrtn, O., A. Voutilainen, K. Winqvist et al. Studies of high indoor radon areas in Finland. Sci. Total Environ. 45: 3 11-3 18 (1985). Commission of the European Communities. Radiation protection, exposure to natural radiation in dwellings of the European Communities. CEC, Luxembourg, 1987. Castrkn, 0. Dealing with radon in dwellings: The Finnish experience. Presented at the Second Inter- national Specialty Conference on Indoor Radon. Air Pollution Control Association, New Jersey, April. 1987.
Commission of the European Communities. Proceed- ings of the 4th International Symposium on the Natural Radiation Environment. Lisbon, Portugal, 1987. Dall'Aglio. M., G.G. Mastino and A. Fontanella. Scarichi radioattivi nell'atmosfera consequenti all'eser- cizio di alcune centrali a carbone in Italia. Annali di Radioprotezione 97- 108 ( 198 1). Doyle, S.M.. W.W. Nazaroff and A.V. Nero. Time- averaged indoor radon concentrations and infiltration rates sampled in four U.S. cities. Health Phys. 47: 579-586 ( 1984). Duggan, M.J., D.M. Howell and P.J. Soilleus. Concentrations of radon-222 in coal mines in England and Scotland. Nature 219: 1 I49 only (1968). Domanski. T., J. Liniecki and W. Chruscielewski. Concentration of the radon progeny in the air of Polish nonuranium mines. p. 629-635 in: Radiation Hazards in Mining. Society of Mining Engineers, 1982. Dixon, D.Nf.. A.C. James, J.C. Strong et al. A review of all sources of exposure to natural radiation in UK mines. Presented at the International Conference on Occupationai Radiation Safety in Mining. Toronto, 1984. Dungey, C.J. The radon problem of two Cornish tin mines. p. 65-68 in: Radiation Hazard in Mining. Society of Mining Engineers, 1982. Dongen, R.v. and F.C.M. Mattern. Onderzoek naar de radioactiviteit van luchtstof in het Sloegebied. RIVM R/248103030 (1984). Drichko, V.F.. E.P. Lisachenko, T.M. Ponikarova et al. Isotopes of the uranium and thorium series in phosphorus-containing fertilizers, arable soils and agricultural plants. USSR State Committee on the Utilization of Atomic Energy. National Commission on Radiation Protection of the USSR Ministry of Public Health. K/80-22 ( 1980). Der Bundesminister des Innern. Die Strahlenexposi- tion von au5en in der Bundesrepublik Deutschland durch natiirliche radioaktive Stoffe im Freien und in Wohnungen unter Berucksichtigung des Einflusses von Baustoffen. Bericht uber ein von Bundesminister des Innern gefordertes Forschungvorhaben. 1978. Drury, J.S., S. Reynolds, P.T. Owen et al. Uranium in United States surface ground and domestic waters. EPA-370/9-81-001 (198 1). Drichko, V.F., E.P. Lisachenko and T.M. Ponikarova. Assessment of the amount of the uranium and thorium series incorporated by the RSFSR population with vegetable diet. p. 25 in: Current Issues in Radiation Hygiene. Moscow, 1983. (in Russian) Department of Health and Welfare. Ottawa, Canada. A computer study of soil gas movement into buildings. Report no. 1389/1333 (1985). Dixon. D.W. Hazard assessment of work with ores containing elevated levels of nattlral radioactivity. NRPB-R143 (1984). Department of Health and Welfare. Canada. A catalogue for determination of radon and thoron daughter c0ncentra:ion.s to tracheobronchial alpha dose conversion factors for both the public and miners. Draft report no. 1325/1296 ( 1984). Deworm, J.P.. W. Slegers, J . Giilard et al. Survey of the natural radiation of the Belgian territory as determined with different methods. Presented at the 4th International Symposiunl on the Natural Radia- tion Environment. Lisbon, Portugal, 1987. Department of the Environment. United Kingdom. Digest of environmental protection and waterstatistics. HMSO, London, 1988. Dixon, D.W., M.C. O'Riordan and R.L. Burnett. Monitoring exposures to radon daughters in places of work. Presented at the 4th International Symposium on the Natural Radiation Environment. Lisbon, Portugal, 1987.
Eaton. R.S. and A.G. Scott. Understanding radon transport into houses. Radiat. Prot. Dosim. 7: 251-253 ( 1984). Eichholz, G.G., M.D. Matheny and B. Kahn. Control of radon emanation from building materials by surface coating. Health Phys. 39: 301-304 (1980). Eaton, R.S. Radon and radon daughters in public, private and commercial buildings in communities associated with uranium mining and processing in Canada. p. 489-496 in: Natural Radiation Environ- ment. (K. Vohra et al.. eds.) Wiley Eastern Limited, 1982. Ericson. S.O., H. Schmied and B. Clavensjo. Modified technology in new constructions and cost effective remedial action in existing structures to prevent infiltration of soil gas carrying radon. Radiat. Prot. Dosim. 7: 223-226 ( 1984). Evans, R.D. Radium in man. Health Phys. 27: 497-5 10 (1974). Eicker, H. and G. Zimmermeyer. Radon measure- ments and valuation in German hard coal under- ground mines. p. 636-641 in: Radiation Hazards in Mining. Society of Mining Engineers, 1982. Eaton. R.S. and A.G. Scott. Understanding radon transport into houses. Radiat. Prot. Dosim. 7: 251- 253 ( 1984). Ennow. K.R. and S.M. Magnusson. Natural radiation in Iceland and the Faroe Islands. National Institute of Radiation Protection. SIS (1982). (-4s quoted in [R7]) Ehdwall. H., B.T. Holmberg and K. Farzar. Radio- logical and legal aspects of energy production by burning peat. Sci. Total Environ. 45: 69-75 (1985). Ericson, S.O. Radiological implications of coal and heat utilization in the Nordic countries. Final Report of NKA project REK-4. Nordic Liaison Committee for Atomic Energy, 1985. Fisenne. 1.M. Radon-222 measurements at Chester. p. 192-227 in: EML-411 (1982). Fisenne, I.M. Radon-222 measurements at Chester. p. 73-108 in: EML-383 (1980). Fisenne. I.M. Concurrent continuous measurements of radon at an urban and rural site. p. 80-81 in: EML- 416 (1983). Fisenne. I.M., H.W. Keller and N.H. Harley. World- wide measurements of radium-226 in human bone: estimate of skeletal and dose. Health Phys. 40: 163-171 (1981). Falster, H. and L. Jacobsen. Dust emission. its quantity and composition, depending on dust collec- tion; coal quality etc. p. 425-433 in: Proceedings of the International Conference on Coal Fired Power Plants and the Aquatic Environment. Copenhagen, 1982. Fox, J.P. The partitioning of major. minor and trace elements during simulated in-situ oil shale retorting. LBL-9062 ( 1980). Fisenne. I.M. Radon-222 measurements at Chester. p. 115-149 in: EML-422 (1984). Finck, R.R. and B.R.R. Persson. In situ Ge(Li)- spectrometric measurements of gamma radiation from radon daughters under different weather conditions. p. 357-369 in: CONF-780422 (1980). Food and Agriculture Organization. 1983 Fertilizer Yearbook. Vol. 33. F A 0 statistics series. 56. (1984). Fipov, R.A. and E.M. Krisiuk. Radiation dose of the population of the Soviet Union from cosmic radia- tion. Atomnaja Energiya 47: 420-421 (1979). (in Russian) Fontan, J., A. Birot and D. Blanc. Variation de la concentration des gaz radioactif naturels et de I'Cqui- libre entre les gaz et leurs descendants, dans l'air, au niveau du sol. Geofisica e Meteor. 13: 80-87 (1964). Fisenne. I.M., P.M. Perry, K.M. Decker et al. The daily intake of uranium-234, 235. 238; thorium-228. 230, 232 and radium-226. 288 by New York City residents. Health Phys. 53: 357-363 (1987).

Fisenne, I.M., P.M. Perry and G.A. Welford. Deter- mination of uranium isotopes in human bone ash. Anal. Chem. 52: 777-779 (1980). Fisenne. I.M., P.M. Perry and N.Y. Chu et al. Measured uranium-234, 238 and fallout plutonium- 239, 240 in human bone ash from Nepal and Australia: skeletal alpha dose. Health Phys. 44: 457- 467 (1983). Fisenne I.M., H.W. Keller and P.M. Perry. Uranium and radon-226 in human bone from Russia. Health Phys. 46: 438-440 ( 1984). Fisenne, 1.M. and G.A. Welford. Natural uranium concentrations in soft tissues and bone of New York City residents. Health Phys. 50: 739-746 (1986). Friedmann, H. and F. Hemegger. 2. f. Wasser- und Abwasser-Forschung 1 1 : 6 1-68 (1978). (as quoted in (G271) Fisenne, I.M.. P.M. Perry and N.H. Harley. Uranium in humans. Presented at the 4th International Sympo- sium on the Natural Radiation Environment. Lisbon, Portugal, 1987. Gesell. T.F. Background atmospheric radon-222 con- centrations outdoors and indoors: a review. Health Phys. 45: 289-302 (1983). George, A.C. Environmental radon and radon daughters. p. 61-71 in: EML-383 (1980). Gold, S., H.W. Barkham, B. Shleien et al. Measure- ment of naturally occurring radionuclides in air. p. 369-382 in: The Natural Radiation Environment (J.A.S. Adams and W.M. Lowder, eds.). 1964. Gallyas. IM. and I. Torok. Natural radioactivity of the raw materials and products in the cement industry. Radiat. Prot. Dosim. 7: 69-71 (1984). Gesell, T.F. and H.M. Prichard. The contribution of radon in tap waters to indoor radon concentrations. p. 1347-1363 in: Natural Radiation Environment 111. CONF-780422 ( 1980). Gesell. T.F., H.M. Prichard and C.T. Hess. Epidemio- logical implications of radon in public water supplies. p. 220-238 in: Proceedings of the Specialist Meeting on the Assessment of Radon and Daughter Exposure and Related Biological Effects. RD Press. 1982. Gesell, T.F. Occupational radiation exposure due to radon-222 in natural gas and natural gas products. Health Phys. 29: 68 1-687 ( 1975). Gesell. T.F., R.H. Johnson and D.E. Bernhardt. Assessment of potential radiological population health effects from radon in liquefied-petrbleum gas. EPA- 520/1-75-002 (1977). GCmesi, J.. D. Szy and A. T6th. Radon-222 content in the internal atmosphere of Hungarian residential buildings. p. 751-756 in: The Natural Radiation Environment 11. CONF-720805 (1975). George, A.C.. M. Duncan and H. Franklin. hleasure- rnents of radon in residential buildings in Maryland and Pennsylvania. USA. Radiar. Prot. Dosim. 7: 29 1-294 (1984). George, A.C. and A.J. Breslin. The distr~bution of ambient radon and radon daughters in residen- tial buildings in the New Jersey-New York area. p. 1272-1292 in: Natural Radiation Environment Ill. CONF-780422 (1980). George. A.C., E.O. Knutson and K.W. Tu. Radon daughter plateout.-I. Measurements. Health Ph>s. 45: 439-444 (1983). Gwiazdowski, B., K. Xlamont-Ciesla and M. Biernacka. Assessment of indoor exposure from gamma emitters and radon-222 in Poland. p. 557-561 in: Natural Radiation Environment. (K. Vohra et al., eds.) Wiley Eastern Limited, 1982. Guimond. R.J.. W.H. Ellett, J.E. Fitzgerald. Jr. et al. Indoor radiation exposure due to radium-226 in Florida phosphate lands. EPA-520/4-78-013 (1979). Gunning, C. and A.G. Scott. Radon and thoron daughters in housing. Health Phys. 42: 527-528 ( 1982).
Gragnani. R., G.G. Mastino and G. Paganin. Natural radioactivity releases from coal fired and geothermal power plants in Italy. p. 415-421 in: Natural Radia- tion Environment. ( K . Vohra et al., eds.) Wiley Eastern Limited, 1982. Gloebel. B.. H. Muth and E.Oberhausen. Intake and excretion of the natural radionuclides lead-210 and polonium-210 by humans. Strahlentherapie 131: 2 18-226 ( 1966). George, A.C., G. ScandifLo and A.J. Breslin. The distribution of radon and radon daughters in the geo- thermal region of Larderello. in: Proceedings Second DOE-ENEL Workshop for Cooperative Research in Geothermal Energy. Berkeley. California. 1981. Gogolak, C.V. An evaluation of the potential radio- logical impact of oil shale development. EML-406 (1982). Gutt, W. and P.J. Nixon. Use of waste materials in the construction industry. Analysis of the RlLEM Symposium by Correspondence. Building Research Establishment Reprint R2/79 (1979). Guimond. R.J. and S.T. Windham. Radiological evaluation of structures constructed on phosphate- related land. p. 1457-1475 in: Natural Radiation Environment 111. CONF-780422 (1980). Gates. W.L. and A.B. Nelson. A new (revised) tabulation of the Scripps topography on a 10 global grid. Part 1: Terrain heights. Rand report R-1276-1- ARPA (1975). George, A.C. and L. Hinchliffe. Measurement of uncombined radon daughters in uranium mines. Health Phys. 23: 791-803 (1972). George. A.C. Measurement of sources and air con- centrations of radon and radon daughters in residen- tial buildings. Presented at the American Society of Heating, Refrigerating and Air-Conditioning Engineers semiannual meeting. Honolulu. Hawaii. 1985. Grimsrud, D.T., M.P. Modera and M.H. Sherman. A predictive air infiltration model-Long-term field test validation. ASHRAE Trans. 88 (Pan 1): 1351-1369 ( 1982). Green, B.M.R., L. Brown, K.D. Cliff et al. Surveys of natural radiation exposure in United Kingdom dwellings with passive and active measurement tech- niques. Sci. Total Environ. 45: 459-466 (1985). Gans. I. Natural radionuclides in mineral waters. Sci. Total Environ. 45: 93-99 (1985). Grasty, R.L., J.M. Carson, B.W. Charbonneau et al. Natural background radiation in Canada. Geological Survey of Canada, Bullelin 360 (1984). Guo. M., P. Ziqiang. Z. Wencai et al. ~Measuremcnt of environmental external radiation gamma dose rate at part area in China. in: Level and Assessnlent of Environmental Radiation-Technical Reports in Second Conference of Chinese Radiation Level and Assessment. Li Deping and Pan Ziqiang. Radiation Protection Association, Beijing, 1985. (as quoted in [P221). Green, R.M.R.. P.R. Lomas, E.J. Bradley et al. Gamma radiation levels outdoors in Great Britain. NRPB-R 191 (1988). Hogeweg, B.. B.F. Bosnjakovic and W.M. Willart. Radiation aspects of indoor environments and related radioecological problems: a study of the situation in I he Netherlands. Radiat. Prot. Dosim. 7: 327-33 1 ( 1984). k-leijde, H.B. van der, H. Beens and A.R. de Monchy. The occurrence of radioactive elements in natural gas. Ecotoxicology and Environmental Safety 1: 49-87 (1977). Harley, N.H. and B.S. Pasternack. Environmental radon daughter alpha dose factors in a five-lobed human lung. Health Phys. 42: 789-799 (1982). Hofmann. W., F. Steinhausler and E. Pohl. Age-, sex-. and weight- dependent dose patterns due to inhaled natural radionuclides. p. 1 1 16-1 144 in: Natural Radia- tion Environment 111. CONF-780422 (1980).

Harley. N.H. Comparing radon daughter dose: entiron- mental versus underground exposure. Radiat. Prot. Dosim. 7: 371-375 (1984). Hofmann. W. Lung cancer induction by inhaled radon daughters. What is the relevant dose? Radiat. Prot. Dosim. 7: 367-370 (1984). Hems, G. Acceptable concentration of radon on drinking water. Air and Water Pollution International Journal 10: 769 (1966). Hildingson, 0.. J. Gustafsson and I. Nilsson. Locating and limiting radon in dwellings. Radiat. Prot. Dosim. 7: 403-406 ( 1984). Hinds, W.C., S.N. Rudnick, E.F. Maher et al. Control of indoor radon decay products by air treatment devices. Presented at the 75th Annual Meeting of the Air Pollution Control Association. New Orleans. 1982. Hewitt. J.E., L. Hughes, J.B. McCaslin et al. Exposure to cosmic-ray neutrons at commercial jet aircraft altitudes. p. 855-881 in: Natural Radiation Emiron- ment 111. CONF-780422 (1980). Hajnal. F., J.E. McLaughlin and M.S. Weinstein. 1970 sea-level cosmic-ray neutron measurements. HASL-241 (1971). Halbritter. G.. K.R. Brautigam. F.W. Fluck et al. Contribution to a com~arative environmental imoact assessment of the use bf coal and nuclear energ; for electricity generation for selected site conditions in the FRG. p. 229-247 in: Health Impact of Different Sources of Energy. IAEA. Vienna. 1982. Holtzman. R.B. Normal dietary levels of radium-226, radium-228, lead-2 10 and polonium-2 10 for man. p. 755-782 in: Natural Radiation Environment 111. CONF-780422 ( 1980). Holtzman, R.B. Application of radiolead to metabolic studies. p. 37-96 in: The Biogeochemistry of Lead in the Environment. Elsevier, North Holland, 1978. 1-Iajnal. F. Comnlunication (1988). Hildingson, 0. Radon measurements in 12,000 Swedish homes. Environ. Int. 8: 67-70 (1982). Hernandez. T.L., J.W. Ring and H.M. Sachs. The variation of basement radon concentration with barometric pressure. Health Phys. 46: 440-445 (1984). Huang. Y. et al. Radon and its daughters in the indoor and outdoor environmental air. Chin. J . Radiol. Med. Prot. 3: 72 (1983). Herbst. W. Investigations of environmental radiation and its variability. p. 781-796 in: The Natural Radiation Environment. University of Chicago Press. Chicago. 1964. Hess, C.T., J . Michel. T.R. Horton et al. The occurrence of radioactivity in public water supplies in the United States. Health Phys. 48: 553-586 (1985). Honon, T.lV. Methods and results of EP.4.s study of radon in drinking water. USEPA. EPA-520/5-83-027 ( 1983). Harley. S.H. Comparing radon daughter dosimetric and risk models. p. 69-77 in: Indoor Air and Human Health (R.B. Gammage and S.V. Kaye, eds.). Lewis Publishers Inc.. 1985. Harley, N.H. and B.S. Cohen. Updating radon dosimetry. p. 419-429 in: Radon and its Decay Pro- ducrs: Occurrence, Properties and Health Effects. (P.K. Hopke. ed.) American Chemical Society, Washington, 1987. Hotzl. H. and R. Winkler. Activity concentrations of Ra-226. Ra-228. Pb-210, K-40, and Be-7 and their temporal variations in surface air. J. Environ. Radio- act. 5: 445-458 ( 1987). Hirose. K. and Y. Sugimura. Thoriumisotopes in the surface air of the western north Pacific ocean. J . Environ. Radioact. 5: 459-475 ( 1987). Harley. J.H. Naturally occurring sources of radio- active contamination. Presented at Radionuclides in the Food Chain. Laxenburg, Austria, 1987.
Hopke, P.C.. ed. Radon and its decay products: occurrence. propenies and health effects. American Chemical Society. Washington. 1987. Ingersoll, J.G. A survey of radionuclide contents and radon emanation rates in building materials used in the U.S. Health Phys. 45: 363-368 (1983). International Commission on Radiological Protec- tion. Limits for inhalation of radon daughters by workers. ICRP Publication 32. Annals of the ICRP Vol. 6, No. 1 (1981). International Commission on Radiological Protec- tion. Report of the Task Group on Reference Man. ICRP Publication 23. Pergamon Press. 1975. International Commission on Radiological Protec- tion. Limits for intakes of radionuclides by workers. ICRP Publication 30. Annals of the ICRP. Pergamon Ress, 1979-1982. lnternational Commission on Radiological Protec- tion. Alkaline Earth Metabolism in Adult Man. ICRP Publication 20. Pergamon Press. 1973. Ilyin. L.A.. V.A. Knizhnikov. R.M. Barkhudarov et al. Population doses from natural radionuclides due to certain aspects of human activity. p. 1446-1456 in: Natural Radiation Environment 111. CONF-780422 ( 1980). Israeli. hf. Deposition rates of radon progency in houses. Health Phys. (in press). Ikebe. Y., S. Kojima and M. Shimo. On the origin and transport of 222-radon in the atmosphere. Research Letters on Atmospheric Electricity 3: 51-54 (1983). Iida, T. and Y. Ikebe. Measurements of the deposition rate of airborne radon daughter products by track etch detectors. J. Jap. Health Phys. Soc. 18: 29-36 (1983). International Commission on Radiological Protection. Radionuclide transformations. Energy and intensity of emissions. ICRP Publication 38. Pergamon Press. 1983. ISMA (International Superphospate and Compound Manufacturers Association, Ltd.) Handbook on Phos- phate Fertilization. Undated. International Commission on Radiological Protection. Statement from the 1985 Paris meeting of the Inter- national Comn~ission on Radiological Protection. Radiat. Prot. Dosim. 1 1 : 134-135 (1985). Ibrahim, S.A., M.E. Wrenn. N.P. Singh et al. Thorium concentration in human tissues from two United States populations. Health Phys. 44: 213-220 (1983). International Commission on Radiological Protec- tion. Data for protection against ionizing radiation from external sources: supplement to ICRP Publica- tion 15. ICRP Publication 21. Pergamon Press. 1973. International Civil Aviation Organization. Digest of Statistics-Traffic. Commercial Air Carriers 1986 1984 (1985). Jonassen. N. The determination of radon exhalation rates. Health Phys. 45: 369-376 (1983). Jonassen. N. and J.P. McLaughlin. Exhalation of radon-222 from building materials and walls. p. 121 1-1224 in: Natural Radiation Environment 111. CONF-780422 ( 1980). Johnson. R.H.Jr.. D.E. Bcrnhardt, N.S. Nelson et al. Assessment of potential radiological health effects from radon in natural gas. EPA-520/1-73-004 (1973). Jacobi. W. Activity and potential a-energy of radon- 222 and radon-220 daughters in different air armo- spheres. Health Phys. 22: 441-450 (1972). James. A.C., W. Jacobi and F. Steinhiusler. Respira- tory tract dosimetry of radon and thoron daughters. The state-of-the-art and implications for epidemiology and radiobiology. p. 42-54 in: Radiation Hazards in Mining: Control. Measurements and Medical Aspects. (M. Gomez, ed.), Soc. Mining Engineers, New York. 1982.


L5
L6
L7
L8
L9
LIO
L11
LIZ
L 13
LI4
L 15
L16
L17
L18
L19
MI
M 2
M 3
M4
M 5
M6
LCtourneau, E.G., R.G. McGregor and W.B. Walker. Design and interpretation of large surveys for indoor exposure. Radiat. Prot. Dosim. 7: 303-308 (1984). Lauterbach. U. and W. Kolb. Beitrag der kosmischen Strahlung zur natiirlichen Strahlenbelastung in Wohn- und Arbeitsraumen. Proceeedings of the 12th Annual Meeting of the Fachverband fur Strahlenschutz e.V.. "Radioaktivitat und Umwelt" 11/993, 1978. Lederer, C.M. and V.S. Shirley. Table of Isotopes (7th edition). John Wiley and Sons. New York, 1978.
Lal, D. and B. Peters. Cosmic-ray produced radio- activity on the earth. In: Encyclopaedia of Physics. Vol. XLVI/2 (Cosmic Rays). Springer Verlag, New York. 1967. Ladinskaya, L., Y.D. Parfenov. D.K. Popov et al. Lead-210 and polonium-210 content of air, water. foodstuffs and the human body. Arch. Environ. Health 27: 254-258 (1973). Lambert. G.. B. Ardouin and G. Polian. Volcanic output of long-lived radon daughters. J. Geophys. Res. 87: 1 1 103-1 1108 (1982). Lissachenko. E.P. and O.L. Obuchova. Radioacuvity of coals, ashes and slags in the USSR. p. 413-414 in: Natural Radiation Environment. (K. Vohra et al., eds.) Wile! Eastern Limited. 1982. Lalit, B.Y., V.K. Shukla, T.V. Ramachandran et al. Some technologically enhanced exposures to natural radiation environment in India. p. 422-429 in: Natural Radiation Environment. (K. Vohra et al.. eds.) Wiley Eastern Limited, 1982. Lalit, B.Y., T.V. Ramachandran and S. Rajan. Lead- 210 content of food samples in India. Radiat. Environ. Biophys. 18: 13-17 ( 1980). Lowder, W.31. and H.L. Beck. Cosmic ray ionization in the lower atmosphere. J . Geophys. Rcs. 71: 466 1-4668 ( 1966). Lardinoye. M.H., K. Weterings and W.B. van de Berg. Unexpected radon-226 build-up in wet-process phospheric-acid plants. Health Phys. 42: 503-514 (1982). Lindeken. C.L. Radiological considerations of phos- phogypsum utilization in agriculture. UCRL-84927 ( 1980). Lemmela. H. Measurements of environmental gamma radiation in Finland..Paper presented at the meeting of the Nordic Society for Radistion Protection. Geilo, Norway ( 1980). (as quoted in NR7)) Lu, C., Huang Jiaju, Liu Ruye et al. Investigation of natural radioactive level in five provinces (cities) of China. Radiat. Prot. 6: 24 1-327 ( 1986). Lalit. B.Y. and V.K. Shukla. Natural radioactivity in foodstuffs from high natural radioactivity areas of southern India. p. 43-49 in: Natural Radiation Environ- ment. (K. Vohra et al., eds.) Wiley Eastern Limited, 1982. hfeggitt. G.C. Radon and thoron in buildings. Radiat. Prot. Dosim. 5: 5-17 (1983). Mishra, V.C.. C. Rangarajan and C.D. Eapen. Natural radioactivity of the atmosphere over the Indian land mass, inside deep mines. and over adjoining oceans. p. 327-346 in: Natural Radiation Environment 111. CONF-780422 ( 1980). Murayama. N. Mean level of natural radioactivity in the surface air in Japan. J. Radial. Res. 7: 1-7 (1966). Mercer, T.T. The effect of particle size on the escape of recoiling RaB atoms from particulate surfaces. Health Phys. 3 1: 173- 175 (1976). Makelainen. I. Preliminary survey of radon in Finnish dwellings. Presented at the Nordic Society for Radia- tion Protection Meeting. Radiation in our Environ- ment, Gcilo, Norway, 1980. McGregor, R.G., P. Vasudev. E.G. Letourneau et al. Background concentrations of radon and radon daughters in Canadian homes. Health Phys. 39: 285-289 (1980).
M7 McGregor. R.G. and L.A. Gourgon. Radon and radon daughters in homes utilizing deep well water supplies. Halifax Country. Nova Scoria. J . Environ. Sci. Health A15: 25-35 (1980).
M8 Moeller. D.W.. D.W. Underhill and G.V. Gulezian. Population dose equivalent from naturally occurring radionuclides in building materials. p. 1424-1433 in: Natural Radiation Environment 111. CONF-780422 ( 1980).
M9 Miller. K.M. and H.L. Beck. Indoor gamma and cosmic ray exposure rate measurements using a Ge spectrometer and pressurised ionization chamber. Radiat. Prot. Dosim. 7: 185-189 (1984).
MI0 Myrick, T.E.. B.A. Bewen and F.F. Haywood. Determination of concentrations of selected radio- nuclides in surface soil in the U.S. Health Phys. 45: 63 1-642 (1983).
MI 1 hlattsson. R. Seasonal variation of short-lived radon progeny, lead-2 10 and polonium-2 10. in ground level air in Finland. J. Geophys. Res. 75: 1741 (1970).
MI2 3larenco. A. and J . Fontan. Sources of polonium-210 within the troposphere. Tellus 24: 38 (1972).
MI3 Martell, E.A. n-radiation dose at bronchial bifurca- tions of smokers from indoor exposure to radon progeny. Proc. Natl. Acad. Sci., U.S.A. 80: 1285-1289 ( 1983).
MI4 McBride, J.P.. R.E. hloore, J.P. %'itherspoon et al. Radiological impact of airborne effluents of coal-fired and nuclear power plants. ORNL-53 15 (1977).
MI5 Mastinu. G.G. The radiological impact of geothermal energy. p. 437-445 in: Seminar on the Radiological Burden of Man from Natural Radioactivity in the Countries of the European Communi~ies. CEC Report V/2408/80 ( 1980).
M 16 hlcGregor. R.G. and H. Taniguchi. Radiation survey of Long Harbour. Newfoundland. Appendix F. p. 1 17- 137 in: Final Report entitled Task Force on Fluoride. Canadian Public Health Association. Long Harbour, Newfoundland ( 1978).
M 17 Morris, S.C. and L.D. Hamilton. Health and environ- mental effects of coal-fired electric power plants. Presentation at the International Congress on Environ- mental Impacts of Coal-Fired Power Plants. Report BNL-35460. Brindisi. Italy. 1984.
M 18 hliles, J.C.H.. S.T. Gatley and K.D. Cliff. Trial of a passive radon dosemeter for miners in Wheil Jane mine. Radiat. Prot. Dosim. 5: 95-100 (1983).
MI9 Moeller. D.W. and K. Fujimoto. Cost evaluation of control measures for indoor radon progeny. Health Phys. 46: 1181-1 193 (1981).
M2O Mining Annual Review-1984. Published by Mining Journal. London, 1984.
M21 Mustonen, R. Radioactivity of fertilizers in Finland. Sci. Total Environ. 45: 127-134 (1985).
M22 Moroni, J.P.. P. Ervet and P. Pellerin. Niveau de I'exposition naturelle en France. p. 153- 174 in: Seminar on the Radiological Burden of Man from Natural Radioactivity in the Countries of the European Communities. CEC, V/2408/80 (1980).
M23 McAulay. 1.R. and J.P. McLaughlin. lndoor natural radiation levels in Ireland. Sci. Total Environ. 45: 319-325 (1985).
M24 Mjones. L. Measurements of gamma radiation in Swedish houses by means of mailed CaSO,/Dy dosi- meters. p. 1077-1083 in: Natural Radiation Environ- ment 111. CONF-780422 (1980).
M25 Madelmont. C.. A. Rannou. H. Renouard et al. Sources externes: cosmique, tellurique et domestique. p. 61 in: Congris sur les donnets actuelles sur la radioactivitk naturelle. Monte Carlo. 1984.
M26 McAulay, I.R. and P.A. Colgan. y-ray background radiation measurement in Ireland. Health Phys. 39: 821-826 (1980).
M27 Mishra, U.C. Natural and fallout gamma nuclides in Indian soils. p. 333-345 in: The Natural Radiation Environment 11. CONF-720805 (1972).

M28 Mastinu, G.G. and G.P. Santaroni. The exposure of the Italian population to natural radioactivity in drinking water and food. p. 349-368 in: Seminar on the Radiological Burden of Man from Natural Radio- activity in the Countries of the European Communities. CEC, V/2408/80 (1980).
M29 Mishra, O.C. and M.C. Subba Ramu. Natural radio- activity in indoor environments in India. Presented at the 4th International Symposium on the Natural Radiation Environment. Lisbon. Portugal, 1987.
M30 Mjones, L., A. Burin and G.A. Swedjemark. Radon- halter i svenska bostader. SSI-a 84-23 (1984).
M31 Mustonen, R. and M. Jantunen. Radioactivity of size fractionated fly-ash emissions from a peat- and oil- fired power plant. Health Phys. 49: 1251-1260 (1985).
N1 Nero, A.V. and W.W. Nazaroff. Characterizing the source of radon indoors. Radiat. Prot. Dosim. 7:23-39 (1 984).
N2 Nero, A.V. Airborne radionuclides and radiation in buildings: a review. Health Phys. 45: 303-322 (1983).
N3 Nero, A.V., M.L. Boegl, C.D. Hollowell et al. Radon concentrations and infiltration rates measured in convcntional and energy-efficient houses. Health Phys. 45: 401-405 (1983).
N4 Nazaroff, W.W., H. Feustel. A.V. Nero et al. Radon transport into a detached one-storey house with a basement. Atmos. Environ. 19: 31-46 (1985).
N5 Nazaroff. W.W., M.L. Boegel, C.D. Hollowell et al. The use of mechanical ventilation with heat recovery for controlling radon and radon-daughter concentra- tions in houses. Atmos. Environ. 15: 263-270 (1981).
N6 Nazaroff. W.W.. F.J. Offermann and A.W. Robb. .Automated system for measuring air-exchange rate and radon concentration in houses. Health Phys. 45: 525-537 (1983).
N7 National Council on Radiation Protection and Meas- urements. Radiation exposure from consumer pro- ducts and miscellaneous sources. NCRP repon No. 56 (1977).
N8 Nazaroff, W.W. and A.V. Nero. Transport of radon from soil into residences. p. 15-20 in: Proceedings of the 3rd International Conference on Indoor Air Quality and Climate. Vol. 2. Stockholm, Sweden, 1984.
N9 Nair, N.B., C.D. Eapen and C. Rangarajan. High radon levels detected in some non-uranium mines in India. p. 114-1 18 in: Natural Radiation Environment. (K. Vohra et al., eds.) Wiley Eastern Limited, 1982.
N10 Nazaroff. W.W. and S.M. Doyle. Radon entry into houses having a crawl space. LBL- 16637 ( 1983).
N l l Nero, A.V., M.B. Schwehr, W.W. Nazaroff et al. Distribution of airborne radon-222 concentrations in U.S. homes. LBL-18273 (1984) (as quoted in [GZJ].
N12 Nitschke. I..4., J.B. Wadach. W.A. Clarke et a1. A detailed study of inexpensive radon control techniques in New York State houses. p. 11 1 - 1 16 in: Proceedings of the 3rd International Conference on Indoor .Air Quality and Climate. Vol. 2. Stockholm, Sweden. 1984.
N13 National Council on Radiation Protection and Xfeas- urements. Exposures from the uranium series with emphasis on radon and its daughters. NCRP-R77 11984).
N14 National Council on Radiation Protection and Meas- urements. Evaluation of accupational and environ- mental exposures to radon and radon daughters in the United States. NCRP-R78 (1984).
N 15 Nuclear Energy .4gency. Dosimetry aspects of exposure to radon and thoron daughter products. NEA Expert Report. OECD, Paris, 1983.
N16 Nielsen. S.P. Terrestrial and cosmic radiation in Denmark. p. 101-110 in: Seminar on the Radiological Burden of Man from Natural Radioactivity in the Countries of the European Communities. CEC. V/2408/80 (1 980).
Niewadomski, T., J . Koperski and E. Ryba. Natural radiation in Poland and its disturbance in an urban environment. Health Phys. 38: 25-32 (1980). National Group for Studying Radiological Implica- tions of the Use of Zircon Sand. Radiation protection aspects of the use of zircon sand. Sci. Total Environ. 45: 135- 142 (1985). Nambi, K.S.V., V.N. Bapat, M. David et al. Natural background radiation and population dose distribu- tion in India. Health Physics Division, Bhabha Atomic Research Centre. Bombay, 1986. Nakamura, T., Y. Uwamino, T. Ohkubo et al. Altitude variation of cosmic-ray neutrons. Health Phys. 53: 509-517 (1987). Nikl, 1. and L.B. Sztanyik. External indoor and outdoor gamma exposures in Hungary during the period of 1983-86. Presented at the 4th International Symposium on the Natural Radiation Environment. Lisbon, Portugal. 1987. National Council on Radiation Protection and Meas- urements. Ionizing radiation exposure of the popula- tion of the United States. NCRP Report No. 93 (1987). National Institute of Radiological Sciences. Japan. Radon concentration in Japanese dwellings. Interim report (1988). National Council on Radiation Protection and Meas- urements. Exposure of the population in the United States and in Canada from natural background radiation. NCRP Report No. 94 (1987). O'Riordan, M.C., A.C. James and K. Brown. Some aspects of human exposure to radon-222 decay products. Radiat. Prot. Dosirn. 3: 75-82 (1982). O'Riordan. M.C., A.D. Wrixon. K.D. cliff et al. Natural radiation indoors: the problem of high exposures. p. 529-549 in: The Dose Limitation System in the Nuclear Fuel Cycle and in Radiation Protec- tion. IAEA Vienna, 1982. O'Brien, K. The cosmic ray field at ground level. p. 15-54 in: The Natural Radiation Environment 11. CONF-720805 (1 975). O'Brien, K. Human dose from radiation of terrestrial origin. p. 1163-1210 in: Natural Radiation Environ- ment 111. CONF-780422 (1980). Osborne, R.V. Plutonium-239 and other nuclides in ground-level air and human lungs during 1961. Nature 199: 143 (1963). Organisation for Economic Co-operation and Devel- opment (OECD). Energy Statistics 1974/1978. Nuclear Energy Agency, Paris, 1980. Okayabashi, H., M. Suzuki and S. Hongo. Evaluation of a polonium-210 bioassay as an index of the exposure of uranium mine u,orkers in Japan to radon daughters. J. Radiat. Res. 16: 142-151 (1975). O'Riordan, M.C., M.J. Duggan, W.B. Rose et al. The radiological implications of using by-product gypsum as a building material. NRPB-R7 (1972). O'Riordan, M.C.. -4.C. James, S. Rae et al. Human exposure to radon decay products inside dwellings in the United Kingdom. NRPB-RI52 (1983). O'Riordan. M.C. Operational radiation protection in U.K. mining. p. 171-179 in: Personal Dosimetry and Area Monitoring Suitable for Radon and Daughter Products. Elliot Lake, Canada, 1976. OECD, Paris. 1977. O'Riordan, M.C., S. Rae and G.H. Thomas. Radon in British mines. A Review. p. 73-81 in: Radiation Hazards in Mining. Society of Mining Engineers. 1982. Oakley, D.T. Natural radiation exposure in the United States. USEPA ORP/SID 72-1 (1972). Ohlsen, H. Determination of the mean population burden from natural external radiation in the German Democratic Republic. SZE-14/69; also translation AEC-tr-7216 (197 1).

Pensko, J., 2. Stpiczynska and K. Blaton-Albicka. Emanating power of radon-222 measured in building materials. p. 1407-1414 in: Radiation Natural Environ- ment Ill. CONF-780422 (1980). Partridge, J.E., T.R. Horton and E.L. Sensintaffer. A study of radon-222 released from water during typical household activities. Technical note USEPA-ORP/ EERF-79-1 (1979). Prichard, H.M. and T.F. Gesell. Radon-222 in munici- pal water supplies in the Central United States. Health Phys. 45: 991-993 ( 1983). Porstendorfer, J., A. Wicke and A. Schraub. The influence of exhalation, ventilation and deposition processes upon the concentration of radon, thoron and their decay products in room air. Health Phys. 34: 465-473 ( 1978). Porstendorfer. J. Behaviour of radon daughter pro- ducts in indoor air. Radiat. Prot. Dosini. 7: 107- 1 13 ( 1981). Porstendorfer. J. and T.T. Mercer. Influence of nuclei concentration and humidity upon the attachment rate of atoms in the atmosphere. Atmos. Environ. 12: 2223-2228 ( 1978). Peirson. D.H.. R.S. Cambray and G.S. Spicer. Lead- 210 and polonium-210 in the atmosphere. Tellus 27: 429-133 ( 1966). Poet. S.E., H.E. hloore and E.A. hiartell. Lead-210. bismuth-210 and polonium-210 in the atmosphere: accurate ratio measurement and application to aerosol residence time determination. J. Geophys. Res. 77: 65 16-6527 (1972). Parfenov. Y.D. Polonium-210 in the environment and in the human organism. At. Energy Rev. 12: 75 (1974). Papastefanou. C. and S. Charalambous. Hazards from radioactivity of fly ash of Greek coal power plants (CPP). p. 153-158 in: Radiation Protection. A systematic approach to safety. Pergamon Press. 1980. Papastefanou. C. and S. Charalambous. Radioactivity in the atmosphere by coal burning. p. 287-292 in: Proceedings of the Third International Symposium of the Society for Radiological Protection. Radiological Protection-Advances in Theory and Practice. lnver- ness. 1982. Persson, B.R. Radiolead (210-Pb), polonium (210-Po) and stable lead in the lichen, reindeer and man. p. 337-367 in: Thc Natural Radiation Environment 11. COSF-720805 ( 1975). Put, L.W. and R.J. de Meijer. Survey of radon concentrations in Dutch dwellings. p. 49-54 in: Proceedings of the 3rd International Conference on Indoor Air Quality and Climate. Stockholm. Sweden, 1984. Preston. F.S. Eight years' experience of Concorde operations. The medical aspects. J. Royal Soc. %led. 78: 193-196 (1985). Pfister, H. and H. Pauly. External radiation exposure due to natural radionuclides in phosphate fertilizers in the Federal Republic of Germany. p. 447-467 in: Seminar on the Radiological Burden of Man from Satural Radioactivit? in the Countries of the European Communities. CEC, V/2408/80 ( 1980). Panridge, J.E.. T.R. Horton. E.L. Sensintaffar et al. Radiation dose estimates due to air part~culate emissions from selected phosphate industry opera- tions. USEPA Tech. Note. ORP/EERF-78-1 (1978). Paul. .A.C.. P.51.B. Piliai. S.K. Nair et al. Studies on the leaching of radium and the emanation of radon from fertilizer process sludge. J. Environ. Radioact. I: 51-65 (1984). Presslcr. J.N'. "Byproduct Gypsum". p. 105-1 15 in: The Chemistry and Technology of Gypsum, ASTh! STP 861. (R.A. Kuntze. ed.). American Society for Testing and Materials. 1984. Poffijn. .4., R. Marijns. H. Vanmarcke et al. Results of a preliminary survey of radon in Belgium. Sci. Total Environ. 45: 335-342 (1985).
Put, 1. W.. R.J. De Meijer and B. Hogeweg. Sunley of radon concentrations in Dutch dwellings. Sci. Total Environ. 45: 44 1-448 ( 1985). Palacios. E. Communication (1987). Pan 2.. Yang Yin and Guo Mingqiang. Katural radiation and radioactivity in China. Presented at the 4th International Symposium on the Natural Radia- tion Environment. Lisbon. Portugal. 1987. Papastefanou. C. and E.A. Bondietti. Aerodynamic size associations of Pb-212 and Pb-214 in ambient aerosols. Health Phys. 53: 461-472 (1987). Pfeiffer, W.C.. E. Penna-Franca. C. Costa Ribeiro et al. Measurements of environmental radiation exposure dose rates at selected sites in Brazil. An. Acad. Bras. Ciinc. 53: 683-69 1 (198 1). Penna-Franca. E.. M. Fiszman, N. Lobao et al. Radioactivity in the diet in high background areas of Brazil. Health Phys. 19: 657-662 (1970). Peute, A.. R.J. de Meijer and L.W. Put. Radiological impact of releases by the Dutch non-nuclear industrial processes. Presented at the 4th International Sympo- sium on the Natural Radiation Environment. Lisbon. Portugal. 1987. Petterson. H., 0. Hildingson. C. Samuelsson et al. Radon exhalation from building materials. The Sational Institute for Materials Testing. Sweden. Report SP-RAPP 1982:32 (1982). Raghavayya, M.. A.H. Khan, N. Padmanabhan et al. Exhalation of radon-222 from soil: some aspects of variation. p. 584-591 in: Natural Radiation Environ- ment. (K. Vohra et al.. eds.) Wiley Eastern Limited. 1982. Rudnick. S.N.. E.F. Maher. W.C. Hinds ct al. Surface deposition of radon decay products uith and without enhanced air motion. Presented at the 17th DOE Nuclear Air Cleaning Conference. 1982. Rundo. J.. F. Markun and N.J. Plondke. Observation of high concentrations of radon in certain houses. Health Phys. 36: 729-730 (1979). Robson, A. The radiological impact of electricity generation by U.K. coal and nuclear systems. Sci. Total Environ. 35: 4 17-430 (1984). Ryan, M.T. and S.J. Cotter. An integrated assessment of the phosphate industry. ORNL-5583 (1980). Rannou. A.. C. Madelmont and H. Renouard. Survey of natural radiation in France. Sci. Total Environ. 45: 467-474 (1985). Radiation Protection Institutes in Denmark, Finland. Iceland, Norway and Sweden. Radiation Protection Information. Naturally Occurring Radiation in the Sordic Countries-Levels. 1983. Remy. M.L. and P. Pellerin. Radioactiviti naturelle de 250 sources hvdrominirales francaises. Bull. INSERM 23: 23-62 ( I 968). Schery, S.D. and A.G. Petschek. Exhalation of radon and thoron: the question of the effect of thermal gradients in soil. Earth Planet. Sci. Lett. 64: 56-60 (1983). Slade. D.H. Meteorology and Atomic Energy. USAEC (1968). Sciocchetti. G., G.F. Clemente. G. lngrao et al. Results of a survey on radioactivity of building materials in Italy. Health Php. 45: 385-388 (1983). Sorantin, H. and F. Steger. Natural radioactivity of building materials in Austria. Radiat. Prot. Dosim. 7: 59-6 1 ( 1984). Siotis. I . and A.D. Wrixon. Radiological consequences of the use of fly ash in building materials in Greece. Radiat. Prot. Dosim. 7: 101-105 (1984). Stranden, E. and 1. Berteig. Radon in dwellings and influencing factors. Health Phys. 39: 275-284 (1980). Swedjemark. G.A. Recent Swedish research on radon. p. 52-57 in: EM1416 (1983). Swedjemark, G.A. and 1. Mjones. Radon and radon daughter concentrations in Swedish homes. Radiat. Prot. Dosim. 7: 341-345 (1984).

S9 Scott, A.G. Computer modelling of radon movement. p. 82-85 in: EML-416 (1983).
S10 Spitz. H.B., M.E. Wrenn and N. Cohen. Diurnal variation of radon measured indoors and outdoors in Grand Junction, Colorado, and Teaneck, New Jersey, and the influence that ventilation has on the buildup of radon indoors. p. 1308-1330 in: Natural Radiation Environment 111. CONF-780422 (1980).
S11 Stranden, E. The influence of variations in the ventilation rate in rooms upon the respiratory dose from inhalation of radon daughters. Phys. Med. Biol. 24: 913-920 (1979).
S12 Swedjemark, G.A. The equilibrium factor F. Health Phys. 45: 453-462 ( 1983).
S13 Stranden, E.. L. Berteig and F. Ugletveit. A study on radon in dwellings. Health Phys. 36: 413-421 (1979).
S14 Sciocchetti, G.. F. Scacco, P.G. Baldassini et al. Indoor measurements of airborne natural radioactivity in Italy. Radiat. Prot. Dosim. 7: 347-351 (1984).
S15 Suomela. M. and H. Kahlos. Studies on the elimination rate and the radiation exposure following ingestion of radon-222 rich water. Health Phys. 23: 641-652 ( 1972).
S16 Steinhausler. F. Long-term investigations in Austria of environmental natural sources of ionizing radiation and their impact on man. Ber. Nat. Med. Ver. Salzburg (Band 6): 7-50 (1982).
S17 Steinhausler, F.. W. Hofmann, E. Pohl et al. Local and temporal distribution pattern of radon and daughters in an urban environment and determination of organ-dose frequency distributions with demo- scopical methods. p. 1145-1 162 in: Natural Radiation Environment 111. CONF-780422 ( 1980).
S l 8 Smith, B.H., W.N. Grune, F.B. Higgins et al. Natural radioactivity in ground water supplies in hlaine and New Hampshire. J. Amer. Water Works Assoc. 53: 75 ( 1961).
S19 Swedjemark, G.A. Buildings with enhanced radio- activity in Sweden. p. 535-543 in: Natural Radiation Environment. (K. Vohra et al., eds.) Wiley Eastern Limited. 1982.
S2O Swedjernark, G.A. Radioactivity in hou3es built of aerated concrete based on alum shale. p. 112-126 in: Proceedings of the Specialist Meeting on Assessment of Radon and Daughter Exposures and Related Bio- logical Effecrs. RD Press, 1982.
S21 Suess, H.E. Secular variations of the cosmic-ra) produced carbon-14 in the atmosphere and their inter- pretations. J . Geophys. Res. 70: 5937-5952 (1965).
S22 Singh, N.P., M.E. Wrenn. S.A. Ibrahim et al. Thorium concentration in human tissues from two geographical locations of the United States. p. 258-268 in: Natural Radiation Environment. (K. Vohra et al., eds.) Wiley Eastern Limited, 1982.
S23 Steinhausler, F. Long-term measurements of radon- 222, radon-220. lead-214 and lead-212 concentrations in the air of private and public buildings and their dependence on meteorological parameters. Health Phys. 29: 705-713 ( 1975).
S24 Stranden. E. Thoron and radon daughters in different atmospheres. Health Phys. 38: 777-785 (1980).
S25 Schmier, H. Communication. S26 Schmier, H. Strahlenexposition durch Kern- und
Kohlekraftwerke. p. 115-120 in: Umweltrisiko 80. Georg Thieme Verlag. Stuttgart. 1981.
S27 Styron, C.E., C.T. Bishop, V.R. Casella et al. Assessment of the impact of radionuclides in coal ash. p. 169- 184 in: Health Impacts of Different Sources of Energy. IAEA, Vienna, 1982..
S28 Stranden. E. Assessment of the radiological impact of using fly ash in cement. Health Phys. 44: 145-153 ( 1983).
S29 Salmon, L., A.E.R. Toureau and A.E. Lally. The radioactivity content of United Kingdom coal. Sci. Total Environ. 35: 403-415 (1984).
Smith-Briggs. J.L. Measurements of natural radio- activity in cattle liver, soil and grass. In: Proceedings of the 4th Symposium on the Determination of Radio- nuclides in Environmental and Biological Materials. Teddington, England, 1983. Smith-Briggs. J.L. Natural radionuclies near a coal- fired power station. Nucl. Instrum. Methods Phys. Res. 223: 590 ( 1984). Silhanek, J.S. and V.E. Andrews. Radioactive air emissions from non-uranium mining operations. p. 1001-1003 in: Radiation Hazards in Mining. Society of Mining Engineers, 1982. Sun. S., L. Yuan, J . Li et al. Radon accumulation in non-uranium mines and miner lung cancer. Kucl. Prot. 5: 1-4 ( 1980). (in Chinese). Strong, J.C.. A.J. Laidlaw and M.C. O'Riordan. Radon and its daughters in various British mines. NRPB-R39 ( 1975). Snihs, J.O. and H. Ehdwall. Radiation protection in Swedish mines. Special problems. p. 283-285 in: Radiation Hazards in Mining. Society of h l~n ing Engineers, 1982. Sciocchetti, G., F. Scacco and G.F. Clemente. The radiation hazards in Italian nonuranium mines. Aspects of radiation protection. p. 69-73 in: Radiation Hazards in Mining. Society of Mining Engineers. 1982. Sciocchetti, G., F. Scacco, P.G. Baldassini et al. Radiation monitoring program in Italian non-uranium mines. Presented at the International Conference on Occupational Radiation Safety in hlining. Toronto, 1984. Stranden, E. and L. Berteig. PI study of the radio- logical characteristics of Norwegian non-uranium mine atmospheres. Health Phvs. 43: 922-928 (1982). Stranden, E. Thoron daughter to radon daughter ratios in mines. Presented at the International Con- ference on Occupational Radiation Safety in hlining. Toronto. 1984. Stranden, E. Thoron (?'ORn) daughter to radon (222Rn) daughter ratios in thorium-rich areas. Health Phys. 47: 784-785 (1984). Smith, D. Ventilation rates and their influence on equilibrium factor. In Second Workshop on Radon and Radon Daughters in Urban Communities Associated with ~ r a n i u i Mining and Procesbing. Ottowa. AECL- 1 164 (1979). (as quoted in [N8]). Swedjemark, G.A. and 1 . Mjones. Exposure of the Swedish pop~ilation to radon daughters. p. 37-43 in: Proceedings of the 3rd International Conference on Indoor Air Quality and Climate. Vol. 2. Stockholm, Sweden, 1984. Sextro, R.G., F.J. Offermann, W.W. tiazaroff et al. Evaluation of indoor aerosol control devices and their effects on radon progeny concentrations. p. 23-28 in: Proceedings of the 3rd International Conference on Indoor Air Quality and Climate. Vol. 5. Stockholm, 1984. Scott, A.G. Radon daughter deposition velocities estimated from field measurements. Health Phys. 45: 481-485 (1983). Sinclair, D., A.C. George and E.O. Knutson. Appli- cation of diffusion batteries to measurement of submicron radioactive aerosols. p. 103-1 14 in: Air- borne Radioactivity. (D. Shaw. ed.) American Nuclear Society, La Grange Park, 11.. 1978. Shinlo, M., Y. Asano, K. Hayashi er al. On some properties of radon short-lived decay products in air. Health Phys. 48: 75-86 (1985). Shimo, M. and Y. Ikebe. "?Rn, "ORn and their shon- lived daughter product concentrations in the atmos- phere. Hoken-Butsuri 14: 251-259 (1979). Shimo, M., T. Katoh and Y. Ikebe. Radioactivit! of radon and its short-lived decay products in room air: the influence of collection efficiency of ventilation equipment at the side of air supply. J. Jap. Health Phys. SOC. 17: 119-126 (1982).

Shimo. hf. and T. Katoh. Radioactivity of radon and its short-lived decay products in room air (11): transient state of radioactivities after start and/or stop of ventilation equipment. J. Jap. Health Phys. SOC. 18: 133-143 (1983). Stoutjesdijk, J.F. Schatting van de stralingsbelasting t.g.v. lozingen van lead-210 en polonium-210 door de fosforfabriek van Hoechst in het Sloegebied. RlVM R/248 103033 ( 1984). Scott, A.G. and W.O. Findlay. Demonstration of remedial techniques against radon in houses on Florida phosphate lands. USEPA. EP.4/520/5-83-009 ( 1983). Sorensen, A., L. Botter-Jensen. B. Majborn et al. A pilot study of natural radiation in Danish houses. Sci. Total Environ. 45: 35 1-356 ( 1985). Stranden, E. Population doses from environmental gamma radiation in Norway. Health Phys. 33: 319-323 ( 1977). Storruste. A.. A. Reistad. T. Rudjord et al. Measure- ment of environmental gamma radiation in h'orwegian houses. Health Phys. 1 I: 261-269 (1965). Singh. N.P.. M.E. Wrenn and S.A. Ibrahim. Plutonium concentration in human tissues: comparison to tho- rium. Health Phys. 44: 469-476 (1983). Smith-Briggs, J.L. and E.J. Bradley. Measurement of natural radionuclides in United Kingdom diet. Sci. Total Environ. 35: 431-440 (1984). Schlenker, R.A., A.T. Keane and R.B. Holtzman. The retention of radium-226 in human soft tissue and bone: implications for the ICRP 20 alkaline earth model. Health Phys. 42: 671-693 ( 1982). Snihs, J.O. Communication (1985). Stoker, A.K. and P. Kruger. Radon in geothermal reservoirs. p. 1797-1803 in: Proceedings of the Second United Nations Svmposium on the Development and Use of Geothermal Resources. San Francisco. 1975. Stranden, E. Sources of exposure to technologically enhanced natural radiation. Sci. Total. Environ. 45: 27-45 ( 1985). Schmier, H. and A. Wicke. Results from a survey of indoor radon exposures in the Federal Republic of Germany. Sci. Total Environ. 45: 307-3 10 (1985). Sorensen, A., L. Botter-Jensen. B. Majborn et al. A pilot survey of natural radiation in Danish houses. Sci. Total Environ. 45: 351-356 (1985). Sciocchetti, G., F. Scacco, P.G. Baldassini et al. The Italian national survey of indoor radon exposure. Sci. Total Environ. 45: 327-333 (1985). Service Central de Protection contre les Rayonne- ments Ionisants. France. Rapport d'activiti (1984). Swedjemark, G.A. Radon and its decay products in housing. Estimation of the radon daughter exposure to the Swedish population and methods for evaluation of the uncertainties in annual averages. Dissertation. Stockholm. 1985. Stranden, E. Radon-222 in Norwegian dwellings. p. 70-83 in: Radon and its Decay Products: Occurrence, Properties and Health Effects. (P.K. Hopke. ed.). .4merican Chemical Society, Washington, 1987. Scherry, S.D. Measurements of airborne Pb-212 and Rn-220 at varied indoor locations within the United States. Health Phys. 49: 1061-1067 (1985). Saionen, L. Natural radionuclides in ground water in Finland. Presented at the 4th International Symposium on the Natural Radiation Environment. Lisbon, Portugal, 1987. Sunta, C.M., M. David. M.C. Abani et al. Analysis of dosimetry data of high natural radioactivity areas of sw coast of India. p. 35-42 in: Natural Radiation Environment. (K.G. Vohra et al., eds.) Wiley Eastern Limited. 1982. Swedjemark, G.A., H. Wahren. A. Makitalo et al. Experience from indoor radon-daughter limitation schemes in Sweden. Proceedings of the 4th Inter-
national Conference on Indoor Air Quality and Climate, Berlin (Federal Republic of Germany) (1987).
S71 Swedjemark, G.A. Radiation doses from radon in buildings. Med. Oncol. and Tumor Pharmacother. 4(3/4): 139- 150 ( 1987).
S72 Swedjemark, G.A. Communication (1988). TI Toth. A.. 1. FehCr, S. Novotny Lakatos et al.
Distribution of natural radioactive isotope concentra- tions and emanation factors measured in concrete and brick samples produced in Hungary. p. 1396-1406 in: Natural Radiation Environment 111. CONF-780422 (1980).
T2 Toth, A. A simple field method for determination of radon-220 and radon-222-daughter energy concentra- tions in room air. Radiat. Prot. Dosim. 7: 247-250 ( 1984).
T3 Tomczynska, J.. K. Blaton-Albicka, J. Pensko et a]. The results of measurements of the natural radio- nuclides in coal power plant wastes and light concrete samples. To be published in Nukleonika.
T4 Tracy, B.L. and F.A. Prantl. Radiological impiica- tions of thermal power production. p. 185-193 in: Health Impacts of Different Sources of Energy. IAEA, Vienna, 1982.
T5 Takata, N., H. Watanabe and R. Ichikawa. Lead-210 content in foodstuffs and its dietary intake in Japan. J. Radiat. Res. 9: 29-34 (1968).
T6 T6th, A. The natural radiation burden of the popula- tion. Recent results of radiation protection. Vol. I . (1. Fehir, ed.) Publishing House of the Hungarian Academy of Sciences, Budapest, 1983.
T7 Tracy, B.L. and F.A. Prantl. Radiological impact of coal-fired power generation. (Submitted to the J. of Environ. Radioact.).
T8 Tomza, I . and J. Lebecka. Radium-bearing waters in coal mines: occurrence, methods of measurement and radiation hazard. p. 945-948 in: Radiation Hazards in Mining. Society of Mining Engineers. 1982.
T9 Tschirf, E. External natural radiation exposure in Austria. p. 175-176 in: Seminar on the Radiological Burden of Man from Natural Radioactivity in the Countries of the European Communities. CEC. V/2408/80 ( 1980).
TI0 Toader, M. Iradiere a naturala externa a populatiei din R.S. Romania. Igiena 28(3): 2 15-222 ( 1979).
TI 1 Tveten, U. Radiological consequences of atmospheric releases from coal-fired power plants. A critical survey of calculations reported in literature. Institute for Energy Technology report IFE/KR/E-85/005+V (1985).
TI2 Tanaka, G., A. Tomikawa and H. Kawamura. Determination of rubidium in biological materials using atomic absorption spectroscopy. Bull. Chem. Soc. Jpn. 50: 2310-23 16 (1977).
TI3 Tso, M.W. and C. Li. Indoor and outdoor Rn-222 and Rn-220 daughters in Hong Kong. Health Phys. 53: 175-180 (1987).
U1 United Nations. Ionizing Radiation: Sources and Biological Effects. United Nations Scientific Com- mittee on the Effects of Atomic Radiation 1982 report to the General Assembly, with annexes. United Nations sales publication No. E.82.IX.8. New York, 1982.
U2 United Nations. Sources and Effects of Ionizing Radiation. United Nations Scientific Committee on the Effects of Atomic Radiation 1977 report of the General Assembly, with annexes. United Nations sales publication No. E.77.IX.1. New York, 1977.
U3 Urban, M., H. Kiefer and E. Piesch. A pilot study of indoor radon level using a short time filter tech- nique and a time integrating passive radon monitor. p. 528-534 in: Natural Radiation Environment. (K. Vohra et al., eds.) Wiley Eastern Limited, 1982.
U4 United Nations. 1981 Yearbook of World Energy Statistics. New York. 1983.
United States Environmental Protection .A:ens\. Radiological impact caused by emissions of r ~ d i o - nuclides into air in the United States. Preliminary report. EPA 520/7-79-006 ( 1980). Ulbak, K., N. Jonassen and K. Baekmark. Radon exhalation from samples of concrete with different porosities and fly ash additives. Radiat. Prot. Dosim. 7: 45-48 (1984). United Nations. The prospects of world urbanization. Revised a s of 1984-85. Population studies No. 101. Report ST/ESA/SER.A/IOI. New York, 1987. Unired States Environmental Protection Agency. Back- ground Information Document. Proposed Standards for Radionuciides. EPA 520/1-83-001 (1983). United States Environmental Protection Agency. Radionuciides. Background information document for final rules. EPA-520/1-84022-2 ( 1984). United States Environmental Protection Agency. Emission of lead-2 10 and polonium-2 10 from calciners a t elemental phosphorus plants: F M C plant, Pocatello. Idaho. Office of Radiation Programmes, Washington, 1984. United States Environmental Protection Agency. Emission of lead-210 and polonium-210 from calciners a t elemental phosphorus plants: Stauffer plant. Silver Bow, hlontana. Office of Radiation Programmes, Washington. 1984. United States Environmental Protection Agency. Emission of lead-210 and polonium-210 from calciners a t elemental phosphorus plants: Monsanto plant, Soda Springs. Idaho. Office of Radiation Programmes, Washington, 1984. United States Environmental Protection Agency. Radiological quality of the Environment in the United States, 1977. EPA-520/ 1-77-009 ( 1977). United Nations. Industrial Statistics Yearbook 1982. United Nations, New York. 1985. United Nations. Industrial Statistics Yearbook 1985. United Nations, New York, 1987. United Kingdom. Department of the Environment. Digest of Environmental Protection and Water Statistics. .4 publication of the Government Statistical Service, No. 10 (1987). Her Majesty's Stationery Office, Lr~ndon. 1988. Vorobyo\r, Ye.1. and Ye. Ye. Kovalyov. Radiation Safety of Crews of Flying Vehicles. Moscow. 1983. Van Dongen, R. and J.R.D. Stoute. Outdoor natural background radiation in the Netherlands. Sci. Total Environ. 45: 381-388 (1985). Van der Lugt. G. and L.C. Scholten. Radon emana- tion from concrete and the influence of using fly ash in cement. Sci. Total Environ. 45: 133-150 (1985). Vanmarcke, H.. A. Janssens, F. Raes et al. The behavior of radon daughters in the domestic environ- ment: Effect on the effective dose equivalent. p. 301-323 in: Radon and its Decay Products: Occurrence, Properties and Health Effects. (P.K. Hopke. ed.). American Chemical Society. Washington. 1987. Wilkening, M.H., W.E. Clemenrs a n d D. Stanley. Radon-1-22 flux measurements in widely separated regions. p. 717-730 in: CONF-72085 11975). Wilkening, M.H. Daily and annual courses of natural atmospheric radioactivity. J. Geophys. Res. 64: 521-526 ( 1959). Worden. A.E. The distribution of radon in the major aquifers of Texas as analysed from municipal ground water supplies. Master's Thesis, University of Texas School of Public Health. Houston, Texas (1982). .As quoted in [P3]. Wilkins, B.T. The assessment of radon and its daughters in North Sea gas used in the United Kingdom. p. 1133-1 146 in: Radiation Protection. Pergamon Press, 1980.
WS Wicke, A. and J. Porstcndorfer. Radon daughter equilibrium in dwellings. p. 481-488 in: Natural Radiation Environment. (K . Vohra et ai., eds.) Wiley Eastern Limited. 1982.
W6 Wicke, A. Untersuchungen zur Frage der natiirlichen Radioaktivitat der Luft in Wohn- und Aufenthalts- riiumen. Dissertation, Fachbereich Physik, Universitat Giessen, F.R.G. (1979).
W7 Wicke, A. Exposure of the population to radon daughters. Problems associated with the assessment of the annual dose. Radiat. Prot. Dosim. 7: 337-340 ( 1984).
W8 Wrixon, A.D., L. Brown, K.D. Cliff et al. Indoor radiation surveys in the U.K. Radial. Prot. Dosim. 7: 321-325 (1984).
W9 Wrenn, M.E. and N.P. Singh. Comparative distribu- tion of uranium, thorium and plutonium in human tissues of the general population. p. 144-154 in: Natural Radiation Environment. ( K . Vohra et al.. eds.) Wiley Eastern Limited, 1982.
W10 Wrenn, M.E., N.P. Singh, S.A. Ibrahim et al. Thorium in human tissues. p. 783-799 in: Natural Radiation Environment 111. CONF-780422 (1980).
W11 Wocol. Coal. Bridge to the future; Report of the world coal study. Ballinger Publ. Co.. Cambridge, Mass., 1980.
W12 Wagner, P. and N.R. Greiner. Third Annual Report. Radioactive enlissions from coal production and utilization. October I , 1980-September 30, 1981. LA-9359-PR Progress Report (1982).
W13 Winkler, R.. H. Hotzl and B. Chatterjee. Analysis of lead-210 and polonium-210 concentrations in surface air by an a spectrometric method. Health Phys. 41: 495-503 (198 1).
W14 Wolfs, F., H. Hofstede, R.J. de Meijer et al. Measurements of radon-daughter concentrations in and around dwellings in the Northern part of the Netherlands: a search for the influences of building materials, construction and ventilation. Health Phys. 47: 271-279 (1984).
W15 Wicke. A.. M. Urban and H. Kiefer. Radon concen- tration levels in homes of the Federal Republic of Germany. p. 77-80 in: Proceedings of the 6th Inter- national Congress of IRPA. Berlin (Federal Republic of Germany), 1984.
W16 Weibel. E.R. Morphometry of the human lung. Academic Press. New York. 1963.
W17 Wallace, R.W. and C.A. Sondhaus. Cosmic radiation esposure in subsonic air transport. Aviat. Space Environ. Med. 49: 610-623 (1978).
W18 Weng, P.S.. C.M. Tsai and T.C. Chu. Environmental radioactivity and radiation measurements in Taiwan, Republic of China. p. 375-392 in: The Natural Radiation Environment 11. CONF-720805 (1972).
W19 Wrenn. M.E.. P.W. Durbin, B. Howard et al. Metabolism of ingested U and Ra. Health Phys. 48: 60 1-633 ( 1985).
W2O Whitehead, N.E. Dispersion of radon-222 from two Nerv Zealand geothermal pourer plants. J. Environ. Radioactivity 2: 245-257 (1985).
W2I U'ang Qiliang, He Miaoting, Cui Guangzhi er al. Natural Environment Radiation in China. Laboratory of Industrial Hygiene, Ministry of Public Health. Beijing. Draft report (August 1986).
WZ? Wrison, A.D.. B.M.R. Green, P.R. Lomas et al. Natural radiation exposure in Uli dwellings. NRPB- R190 (1988).
Z1 Zapalac, G . H . A time-dependent method for charac- terizing the diffusion of radon-222 in concrete. Health Phys. 45: 377-383 (1983).
2 2 Zettwoog. P. Evaluation du risque radon chez les travailleurs des mines non uraniferes de la Commu- nautk Europeenne. CEA, 1984.


![CURRICULUM VITAE Prof Pai Obanya CV.pdf · PAI OBANYA – CURRICULUM VITAE 4 UNESCO [United Nations Educational, Scientific and Cultural Organisation]: 1988 – 1999. Deputy Director](https://img.pdfslide.us/doc/110x75/60110ea8532793063d31cc71/curriculum-vitae-prof-pai-obanya-cvpdf-pai-obanya-a-curriculum-vitae-4-unesco.jpg)