Embed Size (px)
Citation preview

8/8/2019 UNRWA_final_report-Socio-Economic Assessment NBC-Beddawi-Nov08
http://slidepdf.com/reader/full/unrwafinalreport-socio-economic-assessment-nbc-beddawi-nov08 1/78
Socio-Economic Assessment in Nahr El-Bared & Beddawi Camps
November 2008
Prepared by:

8/8/2019 UNRWA_final_report-Socio-Economic Assessment NBC-Beddawi-Nov08
http://slidepdf.com/reader/full/unrwafinalreport-socio-economic-assessment-nbc-beddawi-nov08 2/78
i
1 EXECUTIVE SUMMARY ________________________________________________________ 1
2 INTRODUCTION _______________________________________________________________ 3
3 METHODOLOGY ______________________________________________________________ 4
3.1 PROJECT TEAM ______________________________________________________________ 4
3.2 SURVEY TOOL _______________________________________________________________ 4 3.3 SURVEY SAMPLE _____________________________________________________________ 4 3.4 SURVEY IMPLEMENTATION _____________________________________________________ 7
4 HOUSEHOLD COMPOSITION AND DEMOGRAPHICS _____________________________ 8 5 HOUSING CONDITIONS _______________________________________________________ 10
5.1 RESIDENCE STATUS BEFORE AND AFTER THE CRISIS __________________________________ 10 5.2 LEVEL OF DESTRUCTION ______________________________________________________ 11 5.3 CROWDEDNESS _____________________________________________________________ 12
6 EDUCATION__________________________________________________________________ 13
6.1 ENROLMENT _______________________________________________________________ 13 6.2 EDUCATIONAL ATTAINMENT AND LITERACY _______________________________________ 14
7 HEALTH _____________________________________________________________________ 17
7.1 DISEASES__________________________________________________________________ 17 7.2 DISABILITIES _______________________________________________________________ 18
8 ECONOMIC PROFILE _________________________________________________________ 19
8.1 HOUSEHOLD INCOME ________________________________________________________ 20 8.2 LABOR FORCE PARTICIPATION AND UNEMPLOYMENT ________________________________ 21 8.3 SECTORS AND TYPES OF EMPLOYMENT ____________________________________________ 23 8.4 MAIN BREADWINNERS ________________________________________________________ 25
8.4.1 Future plans ____________________________________________________________ 27 8.4.2 Cash-for-work activities ___________________________________________________ 31 8.4.3 Micro-Credit ____________________________________________________________ 31
8.5 BUSINESS OWNERS ___________________________________________________________ 31 8.5.1 Ownership of work premises _______________________________________________ 32 8.5.2 Economic impact of the crisis ______________________________________________ 33 8.5.3 Perceptions of success ____________________________________________________ 33 8.5.4 Obstacles to enhancing business ____________________________________________ 34 8.5.5 Exchange with Lebanese businesses and households ____________________________ 34 8.5.6 Debt ___________________________________________________________________ 35 8.5.7 Needed assistance ________________________________________________________ 36
9 OPINIONS AND NEEDS ________________________________________________________ 38
9.1 EVALUATION OF ORGANIZATIONS _______________________________________________ 38 9.2 EVALUATION OF PUBLIC SERVICES _______________________________________________ 39 9.3 ASSESSMENT OF NEEDS FOR PUBLIC SERVICES_______________________________________ 40 9.4 RECEIVED ASSISTANCE________________________________________________________ 40 9.5 EXPECTED ASSISTANCE _______________________________________________________ 42 9.6 RATING OF PALESTINIAN-LEBANESE RELATIONS ____________________________________ 43
10 COMPARISON OF CAMP AND SURROUNDING AREA POPULATIONS _____________ 44

8/8/2019 UNRWA_final_report-Socio-Economic Assessment NBC-Beddawi-Nov08
http://slidepdf.com/reader/full/unrwafinalreport-socio-economic-assessment-nbc-beddawi-nov08 3/78
ii
11 CONCLUDING REMARKS _____________________________________________________ 47 APPENDIX ________________________________________________________________________ 50
Boxes
1. Sampling methodology of previous similar surveys 9 2. Who are the Unemployed? 23 3. A brief snapshot of the displaced outside North Lebanon 24 4. What are the Characteristics of Households with no Breadwinners? 26 5. A comparison of active business owners with those who were unable to reactivate 35
Figures 1 Status of residence after the crisis (percent) 10 2 Status of residence before the crisis (percent) 11 3 School enrolment by age group (percent) 13
4 Male/female ratio of school enrollees 14 5 Educational attainment and literacy among individuals aged 25-65 (percent) 15 6 Illiteracy rate for individuals aged 15-64 (percent) 16 7 Prevalence of disease by age groups (percent) 17 8 Types of disease (percent of individuals per group) 18 9 Types of disability (percent of individuals per group) 18 10 Unemployment rates (percent) 22 11 Major sectors of employment (percent) 23 12 Future employment-related plans (percent) 28 13 Types of assistance needed to reactivate businesses (percent) 30 14 Ownership of work premises (percent) 32 15 Assistance needed for business reactivation or improvement 36 16 Amount of assistance needed for business reactivation or improvement (thousand LBPs) 37 17 Service ratings of various organizations (entire sample) 38 18 Percent change in service ratings pre- and post-crisis 39 19 Assessment of need for various services 40 20 Percentage of households by type of assistance received 41 21 Percentage of households by source of assistance 42 22 Percentage of households by type of expected assistance and type of organization 42 23 Rating of Palestinian-Lebanese relations in the country (left) and in the North (right) 43
Tables 1. Sampling distribution 6 2. Characteristics of the sample 8 3. Age and gender distribution of the sample 9 4. Level of home destruction (percent) 11 5. Household total monthly income (thousand LBPs) 20 6. Labor force participation rates prior to and post crisis 21 7. Workload before and after the NBC crisis (n=working persons in each of the two phases) 22 8. Profile of main breadwinners 25

8/8/2019 UNRWA_final_report-Socio-Economic Assessment NBC-Beddawi-Nov08
http://slidepdf.com/reader/full/unrwafinalreport-socio-economic-assessment-nbc-beddawi-nov08 4/78
iii
9. Rating of work conditions (current working conditions) 27 10. Preferred work location of main breadwinners 30 11. Number of business owners prior and post crisis 32 12. Impact of crisis on business activity 33 13. Business-related debt 35 14. Sources of business-related debt (percent) 36 15. Selected target profiles 47 16. Assistance needed to restart businesses 49
Statistical Appendix Tables1. Relation to head of household (HoH) 51 2. Current residence status 51 3. UNRWA hardship case 51 4. Crowding index 52 5. Current sector of activity 52 6. Current profession 53 7. Current work place 54 8. Breadwinners age 55 9. Breadwinners professional membership 55 10. Organization rating (Satisfaction level) 56 11. Basic services rating (Satisfaction level) 57 12. Received assistance 58 13. Source of assistance 58 14. Expected assistance from UNRWA 59 15. Expected assistance from different organizations 59 16. Choosing the same type of work 60 17. Choosing the same type of work by gender 60
18. Choosing the same type of work by marital status 60 19. Choosing the same type of work by age 60 20. Choosing the same type of work by sector 61 21. Job searching measures 61 22. New profession seeking for 62 23. Choosing the same field of business 63 24. Choosing the same field of business by gender 63 25. Choosing the same field of business by marital status 63 26. Choosing the same field of business by age 63 27. Choosing the same field of business by sector 64 28. Business establishing measures 64 29. New sector seeking for 65 30. Assistance needed to restart/ improve the business 65 31. Interested of vocational training 66 32. Preferred work location 66 33. Interested in cash for work 67 34. Interested in cash for work by work status 67 35. Minimum daily expected income (thousand LBPs) 67 36. Interested in micro credit 68 37. Interested in micro credit 68

8/8/2019 UNRWA_final_report-Socio-Economic Assessment NBC-Beddawi-Nov08
http://slidepdf.com/reader/full/unrwafinalreport-socio-economic-assessment-nbc-beddawi-nov08 5/78
iv
38. Monthly installment (thousand LBPs) 68 39. Duration (Months) 68 40. Monthly installment by work status (thousand LBPs) 68 41. Duration by work status (Months) 68 42. Interested in micro credit by sector 69 43. Current status of work premises 70 44. Pre-status of work premises 70 45. War impact on work premises 70 46. War impact on business activity 71 47. War impact on productive assets: Vehicles 71 48. War impact on productive assets: Machines/generators 71 49. War impact on productive assets: Tools 71 50. War impact on productive assets: Raw materials 72 51. War impact on productive assets: Goods stocks 72 52. Business success perception 72 53. Current Lebanese contribution to the activity 72 54. Pre-Lebanese contribution to the activity 73

8/8/2019 UNRWA_final_report-Socio-Economic Assessment NBC-Beddawi-Nov08
http://slidepdf.com/reader/full/unrwafinalreport-socio-economic-assessment-nbc-beddawi-nov08 6/78
1
1 Executive Summary
This report presents the results of a field survey conducted by the Consultation and
Research Institute (CRI) in collaboration with UNRWA. The survey took placeduring the month of September 2008 and covered 1,800 Palestinian householdsdivided into three groups: Beddawi Camp (BC) Residents, households displaced fromNahr El Bared Camp (NBC) as a result of the 2007 conflict, and households whoreturned to the NBC adjacent area following the 2007 conflict. The aim of the surveyand the ensuing report is to provide an assessment of the pre- and post-conflictconditions of Palestinian households for a variety of livelihood aspects including:housing, health, education, and employment.
The survey found an average household size of 5 with returnees having the largestfamilies (5.26 members on average). The vast majority of households consist of nuclear families. Almost half of the population are below 20 years of age. Themajority of currently displaced families reside in rented apartments and a significantnumber (22.5%) continue to share living space. As expected, NBC households haveless space at their disposal, especially the returnees some of whom moved intotemporary UNRWA housing units whose average size is 20 square meters and houseentire families.
Primary school enrolment is fairly high and the gender gap is non-existent. Thedisplaced have the highest enrolment rate among 15-24 year olds. Literacy hasprogressed significantly especially among females: the illiteracy rate has decreasedfrom 24% in the older generation (55-65) to 1% among 15-24 year olds.
The health profile of the population revealed a disease incidence rate of 19% and adisability rate of 4%. The most common diseases are hypertension, diabetes, and heartdisease and the most common disabilities are motor impairments followed byhearing/speech disabilities.
Employment results were gathered and analyzed on two different levels: thehousehold (all household members) and the head of household in an attempt to assessthe current employment situation of the main breadwinners, the barriers that preventthem from resuming gainful employment, and the types of assistance they need toonce again be able to support their families.
The declared income of NBC returnee and displaced households dropped by around40% after the crisis while BC households only lost 4% of their income as a result of the crisis.
The overall labor participation rate is 37.4% and unemployment stands at 40% amongreturnees and 26% among the displaced, up from 12 and 9% respectively. Beddawi

8/8/2019 UNRWA_final_report-Socio-Economic Assessment NBC-Beddawi-Nov08
http://slidepdf.com/reader/full/unrwafinalreport-socio-economic-assessment-nbc-beddawi-nov08 7/78
2
Camp’s unemployment rate increased from 9% before the crisis to 13% after thecrisis.
Employment is concentrated in three major sectors: construction/public works,followed closely by commerce/trade/maintenance, and finally education/health with
construction/public works ranking first among Beddawi residents andcommerce/trade/maintenance ranking first among Nahr El-Bared households.
40% of Beddawi Camp workers work inside BC while 56% of NBC returnees workinside NBC. The displaced are scattered among Beddawi Camp (25%), NBC (19%),and other areas of North Lebanon (35%).
15% of households have no breadwinner and 22% of main breadwinners areunemployed or inactive. Households with no breadwinner are characterized by ahigher average age, a higher proportion of inactive members (retirees, home makers),and a higher prevalence of disease and disability, making them a high-vulnerability,
low-potential groups that is in need of long-term relief.Only 4% of Beddawi Camp main breadwinners are unemployed, compared to 17%among the displaced and 28% among the returnees. The unemployed and especiallyunemployed main breadwinners are a high-potential target for short-term job supportprograms especially since 88% of the unemployed had a job before the crisis. 52% of them were wage earners and 30% were self-employed. Hence a combination of back-to-work and business reactivation programs is expected to be highly effective inrestoring the livelihoods of not only the immediate targets but also their householdsand communities.

8/8/2019 UNRWA_final_report-Socio-Economic Assessment NBC-Beddawi-Nov08
http://slidepdf.com/reader/full/unrwafinalreport-socio-economic-assessment-nbc-beddawi-nov08 8/78
3
2 Introduction
The conflict that confronted the Lebanese Army to the militant group Fath Al-Islamerupted on May 20 2007 and lasted until September 2 2007. The effects of the fightingon the already disadvantaged camp residents were devastating. The entire camppopulation and hundreds of households from adjacent areas were displaced. TheRecovery and Reconstruction Appeal document that was published as a result of theVienna International Donor Conference held on June 23 2008 1 presents a series of recommendations focusing on three concentric areas surrounding the epicenter of theconflict i.e. Nahr el-Bared Camp. The “first ring” is delimited by the formalboundaries of the NBC refugee camp. The “second ring” encompasses the territory
just outside the camp boundary commonly known as the “New Camp” in addition tothe six municipalities closest to NBC. Finally, the “third ring” includes the areabordered by Halba in the North, Beddawi in the South and Abdeh and Muhammarain the East.
Exactly one year after the fighting ended, UNRWA and ILO-UNDP commissionedtwo separate but coordinated field surveys that aim to livelihood impact of theconflict on Palestinian and Lebanese populations. UNRWA’s survey attempts to assessthe conditions of the Palestinian refugees including Beddawi residents and Nahr El-Bared displaced and returnee populations while ILO’s survey focuses on the situationand needs of Lebanese populations residing in six municipalities located in the secondand third rings. This report presents the main findings of this field survey and takes acomparative approach whenever possible both temporally (pre and post conflict) andacross the three main sample groups (BC residents, NBC returnees, and NBCdisplaced). While reading the report, please note that all the results that are quoted inthe text and not presented in a table or figure are included in the annex. In addition,the percentages reported do not add up to 100% whenever the results of multiple or open questions are reported.
The report begins by outlining the survey methodology (section 3) after which itpresents the results pertaining to various livelihood aspects including householdcomposition and demographics (section 4), housing conditions (section 5), education
(section 6), health (section 7), economic profile (section 8), and opinions and needs(section 9). The report ends with concluding remarks (section 10).
1 Government of Lebanon. A Common Challenge, A Shared Responsibility: the International Donor Conference for the Recovery and Reconstruction of the Nahr El-Bared Palestinian Refugee Camp and Conflict-Affected Areas of North Lebanon . June 23 2008. Vienna.

8/8/2019 UNRWA_final_report-Socio-Economic Assessment NBC-Beddawi-Nov08
http://slidepdf.com/reader/full/unrwafinalreport-socio-economic-assessment-nbc-beddawi-nov08 9/78
4
3 Methodology
3.1 Project Team
The CRI team that carried out this project consisted of:
- Redha Hamdan acted as project coordinator and performed the statisticalanalysis;
- Rania Nader analyzed the results and drafted the report;
- Rami Kiwan assisted on various field and desk activities;
- Rima Oulleik supervised the field survey, coding, editing, and data entry;
- Roger El Hage supervised the design of the technical tools.
3.2 Survey Tool
The survey tool was designed by CRI based on a list of topics provided by UNRWA. Adraft questionnaire was generated and sent to UNRWA for review and comments. Apilot test involving 60 questionnaires was conducted between the 15 th and the 22 nd of August and minor adjustments were introduced based on feedback from the pilot test.The final version of the questionnaire (Arabic and English) was included in theappendix.
3.3 Survey Sample
Three sub-samples of 600 households each were selected from the latest UNRWAdatabase 2 (based on registration numbers of Palestinian families). The sub-samplesrepresent:
NBC returnees (distributed by sector of residence in NBC)
NBC displaced (distributed by location of displacement, i.e. BeddawiCamp (BC), outside BC in North Lebanon, or other regions of thecountry)
BC residents (distributed by sector of residence in BC).
2 Updated on May 15 2008.

8/8/2019 UNRWA_final_report-Socio-Economic Assessment NBC-Beddawi-Nov08
http://slidepdf.com/reader/full/unrwafinalreport-socio-economic-assessment-nbc-beddawi-nov08 10/78
5
The questionnaires were allocated to each area or sector based on the density of residents in that particular sector/area (table 1). For instance, since 38% of thedisplaced reside at Beddawi Camp (based on UNRWA’s lists), 230 out of the total 600displaced questionnaires were allocated to BC.
The questionnaires were designed to obtain data on two different units of analysis:the household, defined as ‘all individuals that usually live under the same roof, pooleconomic resources together and share meals regardless of blood relations’ 3, andhousehold members. The analysis was then conducted to generate information onthree different levels: the household (e.g. housing conditions), the member (e.g.marital status, age, education, health, employment, etc), and the main breadwinner (e.g. employment, future plans, etc). The analysis attempted to distinguish betweenthe traditional (head of household) and the economic (main breadwinner) head of thefamily in order to obtain the employment data from the most relevant source of information.
3 Tiltnes, Age A. December 2007. “Characteristics of Displaced Palestinian Refugees from the Nahr El-Bared Refugee Camp.” UNRWA-ILO.

8/8/2019 UNRWA_final_report-Socio-Economic Assessment NBC-Beddawi-Nov08
http://slidepdf.com/reader/full/unrwafinalreport-socio-economic-assessment-nbc-beddawi-nov08 11/78
6
Table 1: Sampling distribution
Sample distribution of NBC DISPLACED
Households Population %Original
Sample SizeFinal Sample
Size
Grand Total - Displaced 3553 16784 100% 600 619
Beddawi Camp Total 1363 6470 38% 230 228
Sector A 234 1070 17% 39 41
Sector B 254 1218 19% 43 41
Sector C 585 2744 43% 100 97
Sector D 284 1415 21% 48 49
other 6 23 0% 0 0
Outside BC - North Total 1847 8707 52% 312 329Outside BC - Other Areas Total 343 1607 10% 58 62
Sample distribution of NBC RETURNEES
Households Population %Original
Sample SizeFinal Sample
Size
Grand Total – Nahr El-Bared returnees 2000 10161 100% 600 599
Sector A 495 2546 25% 149 153
Sector B 247 1221 12% 74 73Sector C 827 4207 41% 248 248
Sector D 241 1166 12% 72 76
Sector E 190 1021 10% 57 49
Sample distribution of BEDDAWI RESIDENTS
Households Population %Original
Sample SizeFinal Sample
Size
Grand Total - Beddawiresidents 3149 100% 600 599
Sector A 760 24% 145 158
Sector B 614 19% 117 100
Sector C 1127 36% 215 218
Sector D 64 2% 12 48
other 585 19% 111 75
Grand Total - Survey 8,702 1,800 1,817
8/8/2019 UNRWA_final_report-Socio-Economic Assessment NBC-Beddawi-Nov08
http://slidepdf.com/reader/full/unrwafinalreport-socio-economic-assessment-nbc-beddawi-nov08 12/78
7
3.4 Survey Implementation
The survey team consisted of 25 surveyors all of whom are Palestinian camp residentswho have previous experience working with CRI on similar surveys. They weretrained by the CRI field supervisor on August 28 and the survey was conducted
between August 29 and September 15. Three trained operators were in charge of post-coding and editing questionnaires under the supervision of the CRI field supervisor.Data entry was performed over a period of two weeks by six data entry operators.

8/8/2019 UNRWA_final_report-Socio-Economic Assessment NBC-Beddawi-Nov08
http://slidepdf.com/reader/full/unrwafinalreport-socio-economic-assessment-nbc-beddawi-nov08 13/78
8
4 Household Composition and Demographics
The end result was a sample of 1,817 households and a total of 9,184 members (table
2). The 2007 UNRWA-ILO survey conducted on the displaced Nahr-el-Baredpopulation found an average household size of 5.15 which falls between the twonumbers obtained for the returnee and displaced sub-samples in this survey 4.Similarly, the Fafo Labor Force (2006) survey found a household size of 4.73 for Beddawi Camp which falls below this survey’s household size of 4.97 for the samegroup 5. These discrepancies are probably due to differences in the samplingmethodologies adopted by each of the studies (box 1).
Table 2: Characteristics of the sample
NBC Returnees NBC Displaced BC Residents Total/average
Total households 599 619 599 1,817
Total members 3,151 3,053 2,980 9,184
Household size 5.26 4.93 4.97 5.05
Almost all the surveyed subjects (97.8%) are members of a nuclear family, i.e. either the head of the household, or the spouse, or the child of the head of the householdand 96% of the members currently live within the household. Twice as many femalesas males moved permanently to another residence, possibly reflecting the reality thatyoung females leave their homes when they get married while many males continueto live in the parental household even after marriage. Moreover, quite expectedly,five times as many males as females are outside the country for work or studies.
The age structure (table 3) seems to be similar to that of previous surveys targetingthe same population: 33% of the surveyed sample are younger than 15 (in comparisonto 33% in the FAFO study and 35.3% in the ILO-UNRWA displaced survey) and 46%are younger than 20 (in comparison to 47% in the FAFO study and 48.8% in the ILO-UNRWA displaced survey).
The gender composition seems to be well balanced across all three sub-samples(around 50% male and 50% female) and across age groups. A puzzling findingemerged in the analysis of the gender distribution in two age groups especially withinthe returnee sub-sample. In the 25-34 age group, the male/female ratio remains stable
4 Tiltnes, Age A. December 2007. “Characteristics of Displaced Palestinian Refugees from the Nahr El-Bared Refugee Camp.” UNRWA-ILO.5 Tiltnes, Age A. 2007. “A Socio-economic profile of the Nahr El-Bared and Beddawi refugee camps of Lebanon.” Fafo.

8/8/2019 UNRWA_final_report-Socio-Economic Assessment NBC-Beddawi-Nov08
http://slidepdf.com/reader/full/unrwafinalreport-socio-economic-assessment-nbc-beddawi-nov08 14/78
9
at around 1 in Beddawi Camp but becomes 0.9 among the displaced and 0.8 amongthe returnees. The phenomenon becomes inverted in the 45-54 age group, with amale/female ratio of 1.2 among the returnees in comparison to 1 and 0.9 among thedisplaced and Beddawi residents respectively.
Table 3: Age and gender distribution of the sample
NBC Returnees NBC Displaced BC Residents Total
Percent%
M/FRatio
Percent%
M/FRatio
Percent%
M/FRatio
Percent%
M/FRatio
<3 years 6.11% 1.2 4.82% 1.1 4.78% 0.9 5.25% 1.1
[3-5] years 7.58% 0.9 6.36% 1.3 4.98% 0.9 6.33% 1.0
[6-9] years 9.81% 0.8 8.98% 1.0 8.08% 1.0 8.97% 0.9
[10-14] years 12.93% 1.0 11.83% 1.1 12.39% 1.1 12.39% 1.0
[15-19] years 12.89% 1.1 12.98% 1.0 12.35% 1.1 12.75% 1.1
[20-24] years 10.47% 1.1 11.47% 1.1 11.07% 1.1 11.00% 1.1
[25-34] years 14.10% 0.8 14.06% 0.9 14.00% 1.0 14.06% 0.9
[35-44] years 11.43% 0.9 13.27% 1.0 14.24% 1.0 12.95% 1.0
[45-54] years 7.55% 1.2 7.83% 1.0 8.68% 0.9 8.01% 1.0
[55-65] years 3.09% 1.1 3.74% 0.7 5.02% 0.8 3.93% 0.8
>65 years 4.04% 0.7 4.65% 0.7 4.41% 0.7 4.37% 0.7
Total 100% 100% 100% 100%
Finally, the results show that 35.7% of all households reported being registered ashardship cases, with NBC returnees and displaced households registering a slightlyhigher percentage (37.7 and 37%) when compared to Beddawi households with 32.2%registered as UNRWA hardship cases.
Box 1: Sampling methodology of previous similar surveys
Basic socio-demographic data were compared with the results of two previous studies whose
sampling methodologies are hereby outlined: The UNRWA-ILO 2007 survey on the displaced was performed on a sample of 999
families randomly selected from an UNRWA list of 4,855 displaced families
The Fafo Socio-Economic profile of NBC and BC compiled the data of 526 NBC and282 BC households drawn from the database of the Fafo 2006 Palestinian LaborForce Survey

8/8/2019 UNRWA_final_report-Socio-Economic Assessment NBC-Beddawi-Nov08
http://slidepdf.com/reader/full/unrwafinalreport-socio-economic-assessment-nbc-beddawi-nov08 15/78
10
5 Housing Conditions
5.1 Residence status before and after the crisis
As expected, Beddawi Camp residents reported the highest rate of ownership (78.7%)and displaced NBC households reported the lowest rate (3.2%). The vast majority of displaced households (65.7%) reported living in rented apartments and a significantnumber of them continue to share living space (22.5%). As for returnees, 31.4%reported living in UNRWA housing units and 28.7% currently live in owned homespossibly reflecting those who were able to return to their original homes in the newcamp (figure 1).
Figure 1: Status of residence after the crisis (percent)
When we compare this picture to the situation before the Nahr-el-Bared crisis (figure2), we find that the vast majority of NBC households owned their homes. Only 2 to3% lived in rented homes, compared to 8.6% among Beddawi Camp residents.However, a discrepancy appears between the displaced and returnee groups. Thepercentage of ownership was significantly higher among returnees, 76% compared to61% among displaced households. In contrast, the percentage of households that livedin free dwellings is higher among the displaced (35% vs. 21%). The explanation
29%
3%
79%
21%
66%
9%10%
4%
11%9%
23%
1%
31%
4%0%
0%
10%
20%
30%
40%
50%
60%
70%
80%
90%
NBC Returnees NBC Displaced BC Residents
Owned Rented Free Shared UNRWA temporary residence

8/8/2019 UNRWA_final_report-Socio-Economic Assessment NBC-Beddawi-Nov08
http://slidepdf.com/reader/full/unrwafinalreport-socio-economic-assessment-nbc-beddawi-nov08 16/78
11
behind this discrepancy might be that returnees are predominantly the residents of the new camp where the rate of ownership is higher and the prevalence of freehousing is lower compared to the old camp.
Figure 2: Status of residence before the crisis (percent)
5.2 Level of destructionWhen asked about the effect of the crisis on their old homes (table 4), most NBChouseholds reported that their homes were completely destroyed. However, asexpected the percentage of households with completely destroyed homes was higher among those who remain displaced (78.9%) in comparison to the returnees group(63.5%).
Table 4: Level of home destruction (percent)
NBC Returnees NBC Displaced BC Residents
No damages whatsoever 0.80% 1.00% 99.50%Some minor damages 3.70% 2.00% 0.00%Major damages 17.90% 6.50% 0.20%Partial destruction 14.10% 11.70% 0.00%Complete destruction 63.50% 78.90% 0.30%
100% 100% 100%
76%
61%
79%
2% 3%
9%
21%
35%
12%
1% 1% 1%
0%
10%
20%30%
40%
50%
60%
70%
80%
90%
NBC Returnees NBC Displaced BC Residents
Owned Rented Free Shared

8/8/2019 UNRWA_final_report-Socio-Economic Assessment NBC-Beddawi-Nov08
http://slidepdf.com/reader/full/unrwafinalreport-socio-economic-assessment-nbc-beddawi-nov08 17/78
12
5.3 Crowdedness
A crowding index was developed by dividing the total area of a dwelling by thenumber of persons residing in that particular dwelling. The results show a significantincrease in crowding for NBC households compared to the situation before the crisis.
Displaced households moved from 32 square meters per person to 20 square metersper person on average, a decrease of 37%. Similarly, the average crowding index moved from 29 to 16 square meters per person for returnee households 6. As expected,the crowding index remained constant for Beddawi Camp households.
6 Many returnee families currently live in 20 square-meter-UNRWA temporary units and thus enjoy muchless personal space than the reported average.

8/8/2019 UNRWA_final_report-Socio-Economic Assessment NBC-Beddawi-Nov08
http://slidepdf.com/reader/full/unrwafinalreport-socio-economic-assessment-nbc-beddawi-nov08 18/78
13
6 Education
6.1 EnrolmentSchool enrolment results (figure 3) show an expected declining trend as we move upthe age ladder, from close to 100% enrolment for 6-9 year olds to below 30% for 20-24 year olds. An inter-group comparison reveals that the returnees have the lowestenrolment rates for all age categories and quite surprisingly the displaced have thehighest enrolment rates especially beyond primary schooling. The enrolment rate for 15-19 year olds is 66% for the displaced, compared to 63% for Beddawi residents and52% for the returnees. The percentage of students among 20-24 year olds is 35% for the displaced in comparison to 31% for BC residents and 23% for returnees. Thesefigures show a significant improvement over the numbers of the 2007 UNRWA-ILOsurvey of the displaced which show an enrolment of 89% for 6-9 year olds, 55% for 15-19 year olds, and 24% for 20-24 year olds 7. Respondents were asked to identify thereason for non-enrolment. The highest ranking answer was learning difficulties,followed by disability.
Figure 3: School enrolment by age group (percent)
7 Tiltnes, Age A. December 2007. “Characteristics of Displaced Palestinian Refugees from the Nahr El-Bared Refugee Camp.” UNRWA-ILO.
23
98
91
52
35
9793
66
31
96
89
63
0%
20%
40%
60%
80%
100%
120%
6-9 years 10-14 years 15-19 years 20-24 years
NBC Returnees NBC Displaced BC Residents

8/8/2019 UNRWA_final_report-Socio-Economic Assessment NBC-Beddawi-Nov08
http://slidepdf.com/reader/full/unrwafinalreport-socio-economic-assessment-nbc-beddawi-nov08 19/78
14
The gender gap in school enrolment seems relatively narrow (figure 4) until 14 yearsof age, except for returnees among whom female students outnumber male studentsin the 6-9 age group. For students aged 15 and above, a discrepancy appears betweenNBC and Beddawi residents: females outnumber males among 15-19 year-oldBeddawi Camp students in comparison to a ratio of one to one among NBC returneesand displaced alike. Among the youth (20-24 year olds), males outnumber femalesamong NBC students in contrast to the situation among Beddawi residents wherefemales continue to slightly outnumber males.
Figure 4: Male/female ratio of school enrollees
6.2 Educational attainment and literacy
A comparison between NBC returnee and displaced individuals (figure 5) shows ahigher percentage with primary and intermediate education among the returnees anda higher percentage of secondary and college degrees among the displaced.
0.8
0.9 1.0
1.2
1.0 1.0 1.0
1.2
1.0 1.0
0.80.9
-
0.20
0.40
0.60
0.801.00
1.20
1.40
6-9 years 10-14 years 15-19 years 20-24 years
NBC Returnees NBC Displaced BC Residents

8/8/2019 UNRWA_final_report-Socio-Economic Assessment NBC-Beddawi-Nov08
http://slidepdf.com/reader/full/unrwafinalreport-socio-economic-assessment-nbc-beddawi-nov08 20/78
15
Figure 5: Educational attainment and literacy among individuals aged 25-65 (percent)
Finally, the trend of illiteracy rates for various cohorts (figure 6) shows the significantprogress of literacy especially among females that is typical of communities in theregion. From a 24% illiteracy rate among 55-65 year old females, illiteracy is down to1% among the 15-24 year olds, compared to a 2% rate for males of the same agegroup.
4
9
2
44
1
24
3
8
2
3
0
6
10
1
33
3
20
4
11
3
7
2
5
7
1
42
1
26
2
8
1
6
1
0% 5% 10% 15% 20% 25% 30% 35% 40% 45% 50%
Illiterate
Read and write
Kindergarten
Primary
Intermediate CAP or BP
Intermediate
Secondary BT/DS
Secondary
TS/LT
BA/BS
Graduate
NBC Returnees NBC Displaced BC Residents

8/8/2019 UNRWA_final_report-Socio-Economic Assessment NBC-Beddawi-Nov08
http://slidepdf.com/reader/full/unrwafinalreport-socio-economic-assessment-nbc-beddawi-nov08 21/78
16
Figure 6: Illiteracy rate for individuals aged 15-64 (percent)
6444
223
24
11
3211
4
0%
5%
10%
15%
20%
25%
30%
15-64years (All)
15-19years
20-24years
25-34years
35-44years
45-54years
55-65years
Male Female

8/8/2019 UNRWA_final_report-Socio-Economic Assessment NBC-Beddawi-Nov08
http://slidepdf.com/reader/full/unrwafinalreport-socio-economic-assessment-nbc-beddawi-nov08 22/78
17
7 Health
The survey reveals that 19% of the population have a disease and 4% are disabled.
7.1 Diseases
Figure 7 shows a clear progression of the prevalence of disease with age from 7%among those younger than 14 to 81% among those older than 65.
Figure 7: Prevalence of disease by age groups (percent)
The most common diseases (figure 8) are hypertension (27%), diabetes (16%), andheart disease (13%). It is noteworthy that the prevalence of hypertension is highestamong Beddawi residents (37%) compared to 31% among the displaced and only 17%among NBC returnees.
81
60
46
27
7 8
13
0%
10%
20%
30%
40%
50%
60%
70%
80%
90%
0.-14 years 15-24 years 25-34 years 35-44 years 45-54 years 55-65 years >65 years

8/8/2019 UNRWA_final_report-Socio-Economic Assessment NBC-Beddawi-Nov08
http://slidepdf.com/reader/full/unrwafinalreport-socio-economic-assessment-nbc-beddawi-nov08 23/78
18
Figure 8: Types of disease (percent of individuals per group)
7.2 DisabilitiesThe most prevalent disabilities (figure 9) are motor impairments (48%) followed byauditory/vocal disabilities (19%).
Figure 9: Types of disability (percent of individuals per group)
48
22
11
19
53
15 16 15
43
19 19 19
48
19
1518
0
10
20
30
40
50
60
Phyical dis ability Audio/vocal disability Optical disability Mental disability
NBC Returnees NBC Dis placed BC Res idents All
119
17
1311
3
10
8
11
31
18
14
6
9
14
10
37
19
15
46
11 10
27
16
13
4
8
0
5
10
15
20
25
30
35
40
Asthma Arthritis Hypertension Diabetes Heart disease Digestive
ulcers
Mental
diseases
NBC Returnees NBC Displaced BC Residents All
8/8/2019 UNRWA_final_report-Socio-Economic Assessment NBC-Beddawi-Nov08
http://slidepdf.com/reader/full/unrwafinalreport-socio-economic-assessment-nbc-beddawi-nov08 24/78
19
8 Economic profile
One of the most important objectives of this survey was to arrive at a fairly accurateeconomic picture of the three groups of interest, namely NBC displaced, NBCreturnees, and Beddawi residents. In pursuance of this objective, this section attemptsto present an assessment of the current employment situation, relay the obtainedfeedback on the work experience of the population, lay out their future plans for reactivation, and assess their needs.
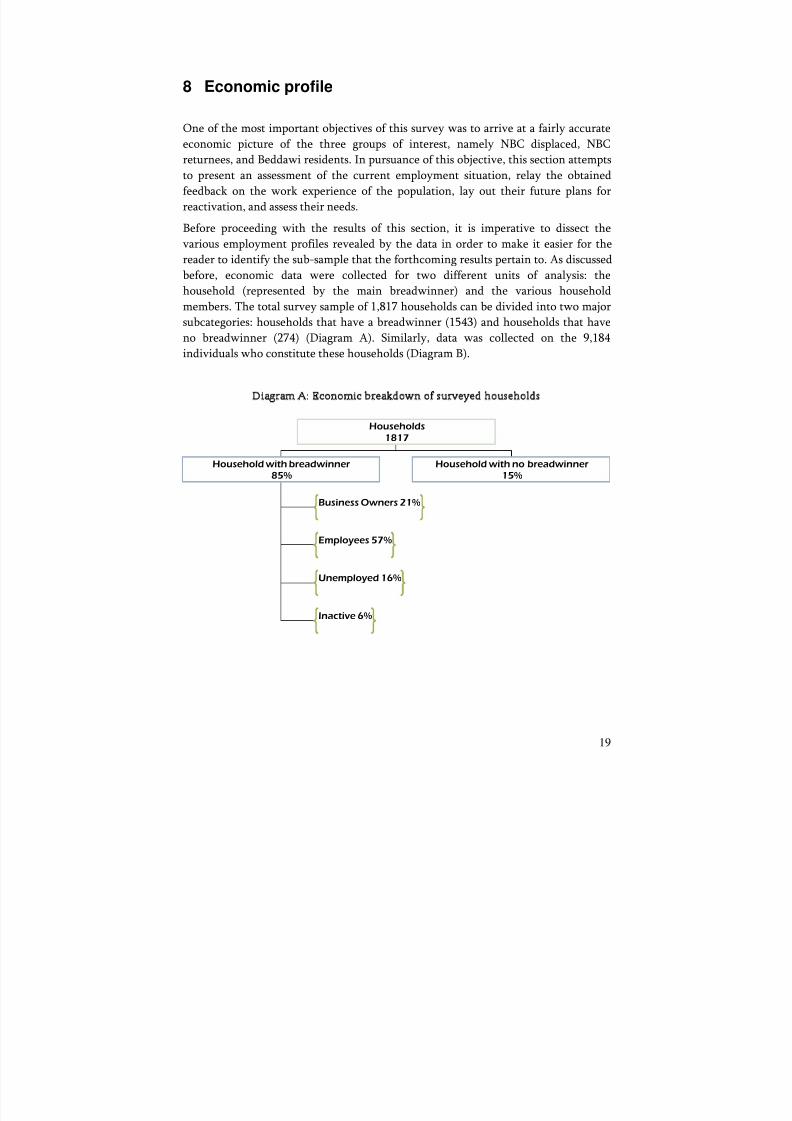
Before proceeding with the results of this section, it is imperative to dissect thevarious employment profiles revealed by the data in order to make it easier for thereader to identify the sub-sample that the forthcoming results pertain to. As discussedbefore, economic data were collected for two different units of analysis: thehousehold (represented by the main breadwinner) and the various householdmembers. The total survey sample of 1,817 households can be divided into two major subcategories: households that have a breadwinner (1543) and households that haveno breadwinner (274) (Diagram A). Similarly, data was collected on the 9,184individuals who constitute these households (Diagram B).
Diagram A: Economic breakdown of surveyed households
Households1817
Household with breadwinner85%
Household with no breadwinner15%
Business Owners 21%
Employees 57%
Unemployed 16%
Inactive 6%

8/8/2019 UNRWA_final_report-Socio-Economic Assessment NBC-Beddawi-Nov08
http://slidepdf.com/reader/full/unrwafinalreport-socio-economic-assessment-nbc-beddawi-nov08 25/78
20
Diagram B: Economic breakdown of surveyed members
8.1 Household income
The disastrous financial consequences of the crisis are made strikingly clear by theincome results (table 5). A comparison of pre- and post-crisis income figures 8 showsthat the income of NBC returnee and displaced households was cut by 39% and 38%in comparison to pre-crisis levels. In contrast, the income effect of the crisis on
Beddawi households is limited to 4%.
Table 5: Household total monthly income (thousand LBPs)
Post-crisis income Pre- crisis income Variation
NBC Returnees 296 489 -39.47%
NBC Displaced 371 600 -38.17%
BC Residents 382 397 -3.78%
All 350 496 -29.44%
8 It is important to emphasize that these figures refer to declared income and are likely to be understated.Hence, income was not used as a component in generating profiles and cross-tabulating data.
Members9184
Inactive 75%
Business Owners 4%
Employees 13%
Unemployed 5%
Other active 3%

8/8/2019 UNRWA_final_report-Socio-Economic Assessment NBC-Beddawi-Nov08
http://slidepdf.com/reader/full/unrwafinalreport-socio-economic-assessment-nbc-beddawi-nov08 26/78
21
8.2 Labor force participation and unemployment
The discussion begins with an explanation of the definitions that were adopted for thebasic employment indicators in order for the reader to be able to interpret the figuresproperly and compare comparables.
The actual labor force (active population) was calculated by combining the followingcategories as they appear in the questionnaire: business-owners, self-employed, wageearners/employees, unemployed, and first-time job seekers.
The potential labor force includes the entire working age population, i.e. everyonebetween 15 and 65 years of age.
The labor participation rate is the ratio between the “actual” and the “potential” labor forces.
The unemployment rate is the ratio of the number of unemployed and the total active
population. In this case the unemployed include those who referred to themselves as“unemployed” in the questionnaires in addition to first time job seekers.
The overall labor participation rate stands at 37.4% (table 6), a figure that is quitetypical in a region characterized by low female participation rates. There were nomajor discrepancies among the three subgroups, which contradicts the findings of the2006 Labor Force Survey 9 that reported a significantly higher labor force participationrate in Beddawi compared to Nahr-el-Bared (44 vs. 33%). However, there does seemto be an increase in the labor participation rate (between pre- and post-crisis) amongNBC returnees (2 percentage points) and among the displaced (1 percentage point).Upon further investigation, it was found that this increase is due to an inflow of first-time job seekers who described themselves as students before the crisis.
Table 6: Labor force participation rates prior to and post crisis
Before the crisis After the crisis
NBC returnees 37.6% 39.5%
NBC displaced 35.0% 35.9%
BC residents 37.0% 37.0%
Overall rate 36.5% 37.4%
The economic effect of the crisis is made screamingly clear by the upward movementof unemployment rates (figure 10). The overall unemployment rate increased from 10
9 Tiltnes, Age A. 2007. “A Socio-economic profile of the Nahr El-Bared and Beddawi refugee camps of Lebanon.” Fafo.

8/8/2019 UNRWA_final_report-Socio-Economic Assessment NBC-Beddawi-Nov08
http://slidepdf.com/reader/full/unrwafinalreport-socio-economic-assessment-nbc-beddawi-nov08 27/78
22
to 27%. Although unemployment increased in all three sub-populations, the degree of increase varied widely among them. Beddawi registered the smallest increase (4percentage points) while the rate tripled among NBC households. The unemploymentrate now stands at 40% among the returnees, which clearly indicates an urgent needfor intervention.
Figure 10: Unemployment rates (percent)
Finally, the results show that workloads decreased as a result of the crisis across allthree subgroups (table 7). The number of working hours per day dropped by 3.6% andthe number of working days per week dropped by 4.2%. This decrease is likely to because by the combined effect of a smaller number of workers and a smaller actualworkload per worker.
Table 7: Workload before and after the NBC crisis (n=working persons in each of the two phases)
Before the crisis After the crisis
Working hours per day 8.56 8.24
Working days per weak 5.46 5.23
12%
9% 9%10%
40%
26%
13%
27%
0%
5%
10%
15%
20%
25%
30%
35%
40%
45%
Returnee Displaced Beddawi Overall
Prior Post

8/8/2019 UNRWA_final_report-Socio-Economic Assessment NBC-Beddawi-Nov08
http://slidepdf.com/reader/full/unrwafinalreport-socio-economic-assessment-nbc-beddawi-nov08 28/78
23
Box 2: Who are the Unemployed?
8.3 Sectors and types of employment
Employment is concentrated in three major sectors that absorb 67% of displaced andBeddawi workers and 73% of returnee workers. These sectors arecommerce/trade/maintenance (28% of the sample), construction/public works (30%of the sample), and education/health (11% of the sample) (figure 11). Consistentlywith the results of the 2006 Labor Force Survey (Fafo), commerce/trade/maintenanceranks first among NBC workers while construction/public works ranks first amongBeddawi workers.
Figure 11: Major sectors of employment (percent)
2427
3335
24
31
8
16
9
0%5%
10%15%
20%
25%30%35%40%
NBC Returnees NBC Displaced BC Residents
Commerce/trade/ maintenance Construction/public w orks Education/health
Who are the Unemployed?
64% of the unemployed are the main breadwinners of their families The vast majority of the unemployed survey subjects lost their jobs as a
result of the NBC crisis: only 12% were unemployed before the crisis Before the crisis, 34% of them were business owners and 52% were
employees They do not differ from the rest of the population in terms of education or
prior sector of employment (25% were in construction and 34% in commerceand trade)
69% worked in NBC and its vicinity and 21% worked in North Lebanon.Only 5.4% worked in BC and its vicinity
53% of the unemployed are returnees (many of them in UNRWA housing),33% displaced ,and 15% are BC residents
40% of unemployed breadwinners plan to find a new job, 33% plan toopen/reopen a business, and 27% have no plans in this regard
33% of unemployed breadwinners are interested in micro-credits The unemployed are 39 years old on average compared to 40 for businessowners, 35 for employees, and 21 for those who are seeking their first job
42% of the unemployed are registered as hardship cases compared to 27% of employees and 26% of business owners

8/8/2019 UNRWA_final_report-Socio-Economic Assessment NBC-Beddawi-Nov08
http://slidepdf.com/reader/full/unrwafinalreport-socio-economic-assessment-nbc-beddawi-nov08 29/78
24
The three most common professions for all three sub-samples are:mining/construction worker (28%), manager/CEO of a small enterprise (15%), andnon-skilled sales/service worker (9%) 10.
A question about work location revealed that 84% of Beddawi Camp workers workeither inside BC (40%) or in other areas of North Lebanon (44%). 86% of NBCreturnees work either inside NBC (56%), in the vicinity of NBC (11%), or in other areas of North Lebanon (19%). Finally, 79% of NBC displaced work either in BeddawiCamp (25%), or in other areas of North Lebanon (35%), or surprisingly in NBC (19%).Although the sample size does not allow us to make intra-group comparisons (withinthe displaced category), it remains interesting that 22% of those displaced outsideNorth Lebanon currently work inside NBC (box 3).
Box 3: A brief snapshot of the displaced outside North Lebanon
10 These categories are based on ILO’s ‘International Standard Classification of Occupations’. In reality themining/construction category refers to construction workers and the manager/CEO of a small enterpriserefers in most cases to owners of micro-enterprises.
A brief snapshot of the displaced outside North Lebanon
Only 64 households representing 10% of the displaced and 3% of the entiresample, which does not allow for statistically valid comparisons. However, abrief qualitative description of these households is provided in this box.
A lower percentage registered as hardship cases: 27% compared to 33% amongthe displaced in BC and 41% among those displaced in the North.
A higher percentage of secondary degrees (14% vs. 7% for the rest) but thesame percentage of university degrees.
A higher percentage of divorced/separated main breadwinners: 10% vs. 1% for
all others. 18% of these families own their homes compared to only 1% for thosedisplaced in the North and 2% for those displaced in BC.
A lower crowding index both pre- and post-crisis: 30 m 2 per person post-crisisvs. 22 for the displaced in the North and 15 for the displaced in BC.
A higher percentage of employees among breadwinners: 72% vs. 55 and 57%for the displaced in BC and the North respectively.
A lower percentage received additional support following the crisis: 80% vs.96% for the rest. However, higher scores than the rest of the population weregiven to UNRWA both prior and post-crisis.
A higher rating to Palestinian-Lebanese relations, compared to the rest of thesample, in the North (2.7 vs. 2.4) and in the country (3.2 vs. 2.6).
Only 3% are interested in vocational training (10% for the rest) and 23% areinterested in cash-for-work compared to 34% for the rest of the sample.
Although the sample size does not allow any firm conclusions, the generalimpression is that this is a stable group with a low probability of return toNBC.

8/8/2019 UNRWA_final_report-Socio-Economic Assessment NBC-Beddawi-Nov08
http://slidepdf.com/reader/full/unrwafinalreport-socio-economic-assessment-nbc-beddawi-nov08 30/78
25
8.4 Main breadwinners
The survey reveals that, out of the total 1,817 surveyed households, 1543 have a mainbreadwinner and 274 do not. A profile of main breadwinners before and after thecrisis is laid out in table 8 and box 4 gives a brief snapshot of households with nobreadwinner.
Table 8: Profile of main breadwinners
The socio-demographic characteristics of the main breadwinners are as follows: Thevast majority (93%) is male and 81% are between 25 and 54 years of age. Their educational attainment is similar to the profile of the population at large with 37%having primary education and 22% intermediate education.
The overall unemployment rate among main breadwinners stands at 16% with widevariations among the three sub-samples: only 4% of BC main breadwinners areunemployed, compared to 17% among the displaced, and 28% among the returnees.
All main breadwinners who were gainfully employed were asked to evaluate variousaspects of their work conditions on a scale of one (extremely dissatisfied) to six (extremely satisfied). All the ratings (table 9) fell in the dissatisfied range with theworst ratings registered in the physical stress, mental stress, and pollution/noisecategories. It seems quite surprising that the dissatisfaction with salaries did notexceed the dissatisfaction with other characteristics. It is quite probable that in view
of the high unemployment rates, people are happy to be working at all and thereforeless likely to complain about their salaries. In addition, NBC displaced householdsreported slightly higher rates than the two other categories except for distance/transport where Beddawi residents were least dissatisfied.
11 87% of what is referred to as business owners reflects micro-enterprises with less than two employees orfamily helpers.
Before the crisis After the crisis
Business owner 11 498 318
Employee 960 876
Unemployed 11 250
Other inactive 72 90
No answer 2 9
Total 1,543 1,543

8/8/2019 UNRWA_final_report-Socio-Economic Assessment NBC-Beddawi-Nov08
http://slidepdf.com/reader/full/unrwafinalreport-socio-economic-assessment-nbc-beddawi-nov08 31/78
26
What are the Characteristics of Households with noBreadwinners?
Found among all three sub-samples (32% in BC, 40% displaced, 28%
returnees), these are in essence households with high need and low economicpotential. They consist of widows and their children or retired couples. Theyare characterized by a higher proportion of seniors and a higher prevalenceof disease and disability. In conclusion, this is a group that is in dire need forlong-term sustained relief.
- Breadwinner + BreadwinnerHousehold size 4.2 5.7Male/Female ratio 0.7 1.0Hardship cases 70% 30%Percentage of widows 14% 1.5%Percentage of housewives
45% 25%
Percentage over 65 22% 2.5%Percentage of retired 8.7% 1.4%Percentage with adisease
40% 17%
Percentage with adisability
10% 3%
Shared housing 21% 9%Pre-crisis income 170 thousand LBPs 554 thousand LBPsPost-crisis income 140 thousand LBPs 387 thousand LBPsInterest in vocationaltraining
2.5% 10.7%
Interest in cash-for-work
9.3% 38.4%
Interest in micro-credit
13% 30%
Box 4: What are the Characteristics of Households with no Breadwinners?

8/8/2019 UNRWA_final_report-Socio-Economic Assessment NBC-Beddawi-Nov08
http://slidepdf.com/reader/full/unrwafinalreport-socio-economic-assessment-nbc-beddawi-nov08 32/78
27
Table 9: Rating of work conditions (current working conditions)
NBC Returnees NBC Displaced BC Residents Average
Fairness of salary/income
2.29 2.67 2.18 2.37
Safety of workconditions
2.60 2.85 2.64 2.70
Distance/transport 2.50 2.63 2.95 2.72
Physical stress 2.05 2.31 1.78 2.03
Mental stress 2.04 2.26 1.79 2.01
Job stability 2.20 2.61 2.21 2.33
Pollution/noise 1.80 2.43 1.84 2.02
Work schedule 2.36 2.76 2.28 2.45
Average 2.23 2.56 2.21 2.33
Only 2.2% of main breadwinners reported being members of a union or a syndicate,0.2% are members of a cooperative, 1.3% are members of a community-basedassociation, and 5% participated in vocational/technical training. Of those whoparticipated in vocational training, 28% received training in electricity, car repairs,and electronics, 16% in first aid, and 14% in computers.
8.4.1 Future plans When main breadwinners were asked about their future plans (figure 12), 23%planned to find a new job, 19% planned to establish/reestablish a business, and 58%had no plans for changing their current situations. There were inter-group differenceshowever with a higher percentage of returnees planning to find new jobs or toestablish/reestablish a business.
Reasons for not wanting to change jobs or establish a business
This is the job that best fits my skills 25%
Stability and satisfaction with current position 19%
There are no other jobs that I qualify for 14%

8/8/2019 UNRWA_final_report-Socio-Economic Assessment NBC-Beddawi-Nov08
http://slidepdf.com/reader/full/unrwafinalreport-socio-economic-assessment-nbc-beddawi-nov08 33/78
28
Figure 12: Future employment-related plans (percent)
Breadwinners who are planning to find a new job were asked whether they wouldchoose the same type of work, 59% of displaced employees said that they would incomparison to 44% and 31% among returnees and Beddawi residents respectively. Inother words, Beddawi employees are the most eager to change professions.
Reasons for choosing the same profession
This is my field of education/experience 43%
Stability and comfort 23%
I have no other skills 23%
Reasons for choosing a different profession
Looking for a comfortable and productive profession 34%
Looking for a stable and productive profession 29%
Looking for a profession that does not ruin one’s health 23%
Among major sectors of activity, construction workers were the most eager to changethe type of work (69%) in comparison to 52% for commerce/trade and 19% for education/health. These figures are in line with the reasons given for wanting tochange professions, namely tiredness and health problems which are likely to be morecommon among construction workers than other professions. The most desired newprofessions were personal services/safety (22%) followed by vehicle operators (12%).
2324
16
29
1916
1923
5860
65
48
0%
10%
20%
30%
40%50%
60%
70%
NBC Returnees NBC Displaced BC Residents All
Find a (new) job Reopen a business No plans in this regard

8/8/2019 UNRWA_final_report-Socio-Economic Assessment NBC-Beddawi-Nov08
http://slidepdf.com/reader/full/unrwafinalreport-socio-economic-assessment-nbc-beddawi-nov08 34/78
29
The respondents were then asked about the methods they were using to find a new job, the most commonly given answer was asking UNRWA 12 for help (39%), followedby a large margin by asking friends and relatives for help (18%), and answeringadvertisements (14%). This shows once again the high degree of expectations directedat UNRWA. Finally, the most commonly requested assistance (72%) was help infinding employment opportunities.
Breadwinners planning to establish/reestablish a business were asked whether theywould choose the same sector of activity. Once again, Beddawi breadwinners werethe least satisfied with their current sector of activity (42% were satisfied) incomparison to 80% among NBC breadwinners. The most commonly given reason for remaining in the same field was experience and skill in that field (62%), whereaslooking for a comfortable and stable business (38%) and looking for a stable andproductive business (27%) were the most common reasons for changing the type of business.
There was little variability among the three subgroups regarding the desired sector of activity (88% of those who want to choose a new type of business were interested incommerce and trade) or regarding the means used to establish or reactivate thebusiness, most respondents answered requesting help from UNRWA for (60%) or from friends and relatives (24%).
There was however considerable variation when it comes to the kind of assistanceneeded to improve or reactivate the business (figure 13). For instance, only NBCbusiness owners needed easier access at army checkpoints and a much higher percentage of Beddawi business owners requested management training (26%compared to 4 and 8% among displaced and returnees). It is also noteworthy that thehighest need in terms of assistance for all three sub-groups was in the workingcapital/machines/tools category.
12 In the questionnaire, the answer reads “ UNRWA and other UN agencies.” However, the field revealedthat UNRWA is the UN agency that operates within the camps, and so only UNRWA will be referredto in the remainder of the report.

8/8/2019 UNRWA_final_report-Socio-Economic Assessment NBC-Beddawi-Nov08
http://slidepdf.com/reader/full/unrwafinalreport-socio-economic-assessment-nbc-beddawi-nov08 35/78
30
Figure 13: Types of assistance needed to reactivate businesses (percent)
It is quite interesting that very few breadwinners were interested in professional or technical training: 15% of respondents in Beddawi, 9% among the displaced, and 5%among the returnees. Most of those interested in professional or technical training(51%) requested computer training.
Breadwinners were then asked about their preferred work locations (table 10). Quiteexpectedly, 69% of returnees prefer to work in Nahr-el-Bared. 40% of the displacedprefer working in Nahr-el-Bared, followed by 32% who would rather work in North
Lebanon. Finally, 41% of Beddawi breadwinners prefer to work in their camp and39% would rather work in North Lebanon. These numbers show just how importantthe wider regional market is to Palestinian business owners.
Table 10: Preferred work location of main breadwinners
NBC Returnees NBC Displaced BC Residents
Nahr El-Bared Camp 68.93% 40.24% 0.61%
Beddawi Camp 1.51% 11.35% 40.70%
Vicinity of Camps 2.07% 3.19% 4.70%
North Lebanon 19.02% 31.87% 39.06%
Anywhere in Lebanon 5.84% 7.37% 10.43%
Abroad 2.64% 5.98% 4.50%
100% 100% 100%
6
19
37
30
8
46
4
21
1316
42
26
1
11
20
0%5%
10%15%20%25%30%35%40%
45%50%
Managementtraining
Easy access atarmy checkpoints
Working capital /machines/tools
Access to loans Other
Returnee to Nahr El-Bared Camp Still displaced from NBC Resident of Beddawi camp

8/8/2019 UNRWA_final_report-Socio-Economic Assessment NBC-Beddawi-Nov08
http://slidepdf.com/reader/full/unrwafinalreport-socio-economic-assessment-nbc-beddawi-nov08 36/78
31
8.4.2 Cash-for-work activities
A higher percentage of Returnee breadwinners were interested in cash-for-work(41%) compared to displaced (30%) and Beddawi (32%) breadwinners, possiblyreflecting the significantly higher unemployment rate among returnees. In fact, the
majority (51%) of the unemployed were interested in such opportunities incomparison to 40% among the employed and 31% among business owners. Finally,construction workers were more likely than commerce/trade workers to accept suchwork (58% vs. 34% said yes).
For those who were interested in cash-for-work, the minimum daily expected incomewas around 31,000 LBPs for all three sub-samples, which is the average daily rate for unskilled labor country-wide.
8.4.3 Micro-Credit Around 28% of the population were interested in micro-credits. There were no major differences among NBC and BC breadwinners. However, there seems to be a higher than average (43%) interest in the communications/transport sector and among smallbusiness owners (36%). Another interesting fact is that 33% of the unemployed areinterested in micro-credits possibly reflecting those who want to reactivate destroyedbusinesses.
The average monthly installment that respondents felt that they could afford was 126thousand LBPs. The displaced gave the highest installment amount (139 thousand
LBPs), followed by returnees (132 thousand LBPs). Beddawi breadwinners gave asignificantly lowest figure (108 thousand LBPs). Quite expectedly, business ownersgave the highest amount (147 thousand LBPs) compared to 121 thousand for employees and 118 thousand for the unemployed. The average loan duration wasaround 28 months with Beddawi residents requesting the shortest duration (24months).
8.5 Business owners 13
The results show that the number of business owners (table 11) decreasedsignificantly among Nahr el-Bared returnees (-44%) and displaced (-49%)populations. This means that the returnees have not been more successful atreactivating their businesses than those who remain displaced. A comparison of
13 Business owners include the following questionnaire categories: business owner (more than twoemployees) and self-employed (two employees or less/family helpers).

8/8/2019 UNRWA_final_report-Socio-Economic Assessment NBC-Beddawi-Nov08
http://slidepdf.com/reader/full/unrwafinalreport-socio-economic-assessment-nbc-beddawi-nov08 37/78
32
business owners who were unable to reactivate with currently active business ownersis provided in box 5.
Table 11: Number of business owners prior and post crisis
NBC Returnees NBC Displaced BC Residents Total
Before the crisis 218 213 140 571
After the crisis 123 108 136 367
Percent change -43.6% -49.3% -2.8% -35.7%
8.5.1 Ownership of work premises
Business owners were asked about the ownership status of their work premises
currently and before the NBC crisis (figure 14). A first look reveals that before thecrisis ownership rates seemed to be higher in Nahr-el-Bared than in Beddawi. Asexpected, the situation has remained unchanged for Beddawi business owners witharound 30% ownership and 50% rental both before and after the crisis. The changesare striking for NBC respondents however. 41% of returnee business owners said thatthey no longer had businesses. The situation is even worse for those who remaindisplaced with 51% who were no longer business owners at the time of the survey.
In addition while the rental rates have slightly dropped after the crisis, there was amajor drop in ownership rates. The reason is that those who were able to reactivatetheir businesses after the crisis were more likely to rent than buy new premises or rebuild their old premises.
Figure 14: Ownership of work premises (percent)
0%
20%40%
60%80%
100%
NBCReturnees-
pre
NBCDisplaced-
pre
BCResidents-
pre
NBCReturnees-
post
NBCDisplaced-
post
BCResidents-
post
Not a business owner Rented Mobile Ow ned Other

8/8/2019 UNRWA_final_report-Socio-Economic Assessment NBC-Beddawi-Nov08
http://slidepdf.com/reader/full/unrwafinalreport-socio-economic-assessment-nbc-beddawi-nov08 38/78
33
8.5.2 Economic impact of the crisis
When asked about the impact of the war on their work premises, 97% of BC businessowners replied that there was none, understandably so because of the absence of combat activity or shelling in Beddawi. In contrast, 68 and 76% of returnee and
displaced NBC business owners said that their work premises were completelydestroyed. Similarly, the impact on business activity (table 12) was much heavier onNBC business owners both displaced and returnees. More than sixty-five percent of NBC business owners reported complete closure, interruption of supply, loss of customers, and increased commodity prices. In contrast, a minority of BC businessowners said that they had to close their businesses as a result of the crisis or that their supply chain was interrupted despite the closure of the highway. Nonetheless, thecrisis did have a significant negative economic impact on Beddawi businesses: 37%report losing customers and 41% suffered from increased commodity prices.
Table 12: Impact of crisis on business activity
NBC Returnees NBC Displaced BC Residents
Complete closure 81.0% 75.7% 14.5%
Interruption of supplychain
65.5% 64.1% 17.9%
Loss of customers 81.5% 81.8% 36.8%
Increased commodityprices
68.6% 69.1% 40.7%
Other 29.9% 34.0% 2.8%
Business owners were then asked to report total, partial, or no loss in a variety of business assets. Beddawi business owners almost unanimously reported no losseswhatsoever. In contrast, more than 70% of NBC returnee and displaced businessowners reported losses in merchandise and tools. 63% of displaced and 70% of returnee business owners reported losses in machines/generators, and around 55% of both groups reported losses in raw materials. The only discrepancy found was in lossof vehicles with 38% of displaced business owners reporting losses in this category in
comparison to 61% among returnee business owners.
8.5.3 Perceptions of success
Perceptions of business success (on a scale of one to six) also declined as a result of thecrisis, especially among NBC business owners. Returnee and displaced households

8/8/2019 UNRWA_final_report-Socio-Economic Assessment NBC-Beddawi-Nov08
http://slidepdf.com/reader/full/unrwafinalreport-socio-economic-assessment-nbc-beddawi-nov08 39/78
34
described their businesses as successful (a rating of 5) prior to the crisis. This ratingdeclined to 3 for displaced business owners (a decrease of 41%) and 2.4 for returneebusiness owners (a decrease of 53%). Beddawi business owners rated their successbefore the crisis more conservatively (4.2) and perceived a lower decline (19%) intheir success reaching a rate of 3.4.
8.5.4 Obstacles to enhancing business
Business owners were asked to identify obstacles to the enhancement of their businesses by giving a one-to-six rate to a variety of options including premises, tools,know-how, access to loans, access to the external market, etc. None of the suggestedobstacles rated above 2 before the crisis. This remained true for the most part in thecase of Beddawi businesses whereas all the rates increased systematically for NBCbusinesses. The most highly rated obstacles by returnee business owners weretools/machines (4.0), access to the external market (3.6), premises (3.6), and transportvehicles (3.4). The most highly rated obstacles by displaced business owners werepremises (3.1), access to loans (3.1), and available income in the area (3.1). However,it seems quite surprising that no obstacle received a rating above 4.
8.5.5 Exchange with Lebanese businesses and households
NBC business owners reported that, prior to the crisis, around 52% of their customerswere Lebanese. This share decreased by more than 50% to eighteen percent for returnees and twenty-four percent for the displaced. The percentage of Lebaneseamong Beddawi businesses’ customer base deceased from 34 to 23%, a rather significant drop that reflects the deterioration of Lebanese-Palestinian relationsbeyond the narrow circle of the active conflict.

8/8/2019 UNRWA_final_report-Socio-Economic Assessment NBC-Beddawi-Nov08
http://slidepdf.com/reader/full/unrwafinalreport-socio-economic-assessment-nbc-beddawi-nov08 40/78
35
Box 5: A comparison of active business owners with those who were unable to reactivate
8.5.6 Debt
The percentage of business owners who reported having business-related debts (table13) was highest among returnees (59%), followed by the displaced (48%), andBeddawi residents. The average debt amount was similar for all NBC business-owners
(around 20 million LBPs) and considerably lower in Beddawi (6.2 million LBPs).
Table 13: Business-related debt
NBC Returnees NBC Displaced BC Residents
Percentage who havedebts 58.90% 47.80% 26.30%
Average debt amount(thousand LBPs) 20,000 19,800 6,200
The most often cited source of debt by all three groups of respondents (table 14) wasbusiness counterparts (60 to 70%) followed by friends and relatives (around 20%). Aninteresting observation is that the percentage of business owners who were able tobenefit from bank or micro-credit loans was very low (1 to 3%) and another interesting fact is that business owners who have UNRWA loans are concentratedamong the displaced population.
A Comparison of Active Business Owners with Those WhoWere Unable to Reactivate
50% of the business owners were unable to reactivate after the crisis.Currently, 33% of them are employees and 58% are unemployed
No major differences between active and inactive in: location (50% displacedand 50% returnees), sector of activity, or age (39 for active vs. 43 forinactive)
No major difference in pre-crisis declared income (810 and 787 thousandLBPs for inactive and active respectively). Significant differences in currentincome (272 vs. 476 thousand LBPs for inactive and active respectively)
Active business owners are more likely to have business-related debts andhave higher amounts of debt (25 vs. 13 million LBPs for active and inactiverespectively)
Possible explanatory factors for the inability to reactivate:o Heavier work damages and interruption of business activity as a
result of the crisis (appendix)o Work location: only 8% of the inactive worked in North Lebanon
before the crisis compared to 20% among active business owners.
8/8/2019 UNRWA_final_report-Socio-Economic Assessment NBC-Beddawi-Nov08
http://slidepdf.com/reader/full/unrwafinalreport-socio-economic-assessment-nbc-beddawi-nov08 41/78
36
Table 14: Sources of business-related debt (percent)
NBC Returnees NBC Displaced BC Residents
Business counterpart 74.81% 63.04% 68.57%
Friends/relatives 20.61% 22.83% 20.00%
UNRWA 0.00% 10.87% 2.86%
Bank/micro credit 1.53% 1.09% 2.86%
Money lender 0.00% 2.17% 0.00%
Other 3.05% 0.00% 5.71%
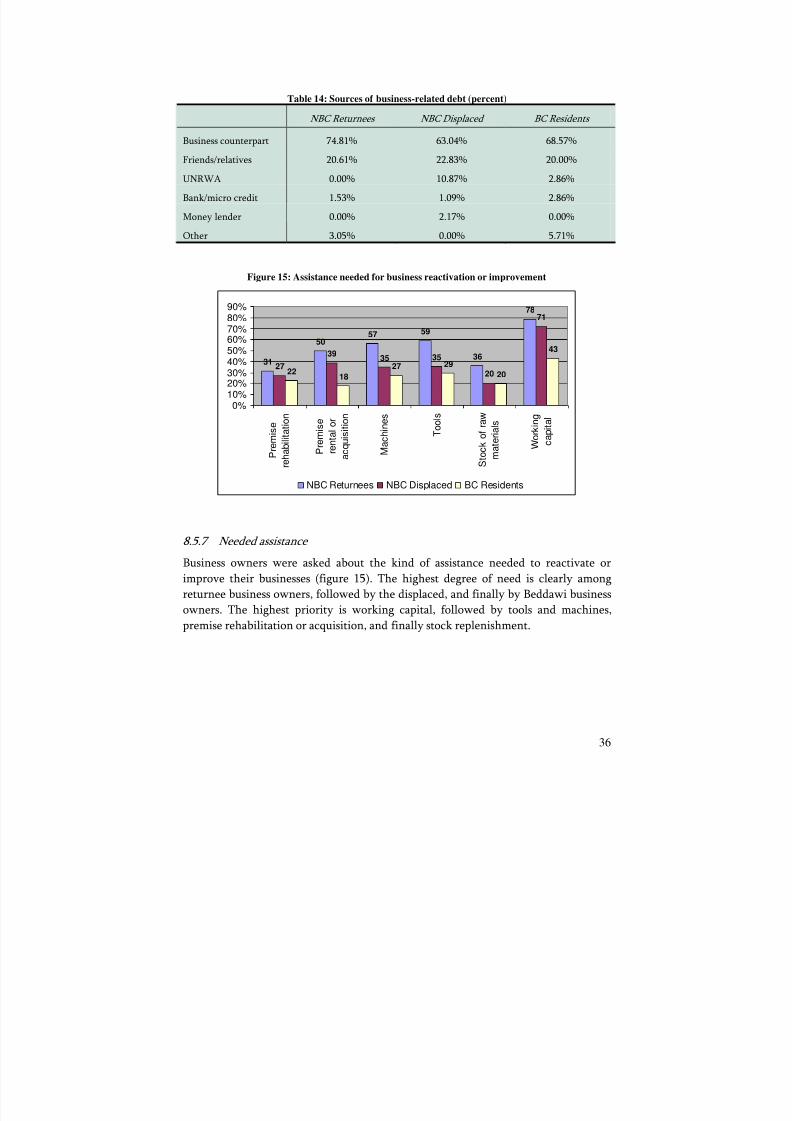
Figure 15: Assistance needed for business reactivation or improvement
8.5.7 Needed assistance
Business owners were asked about the kind of assistance needed to reactivate or improve their businesses (figure 15). The highest degree of need is clearly amongreturnee business owners, followed by the displaced, and finally by Beddawi businessowners. The highest priority is working capital, followed by tools and machines,premise rehabilitation or acquisition, and finally stock replenishment.
31
50
59
36
78
57
27
3935 35
20
71
1822
29
43
2027
0%10%20%30%40%50%60%70%80%90%
P r e m
i s e
r e h a b i l i t a t i o n
P
r e m i s e
r e n t a l o r
a c q u i s i t i o n
M
a c h i n e s
T o o l s
S t o c k o f r a w
m a t e r i a l s
W o r k i n g
c a p i t a l
NBC Returnees NBC Displaced BC Residents
8/8/2019 UNRWA_final_report-Socio-Economic Assessment NBC-Beddawi-Nov08
http://slidepdf.com/reader/full/unrwafinalreport-socio-economic-assessment-nbc-beddawi-nov08 42/78
37
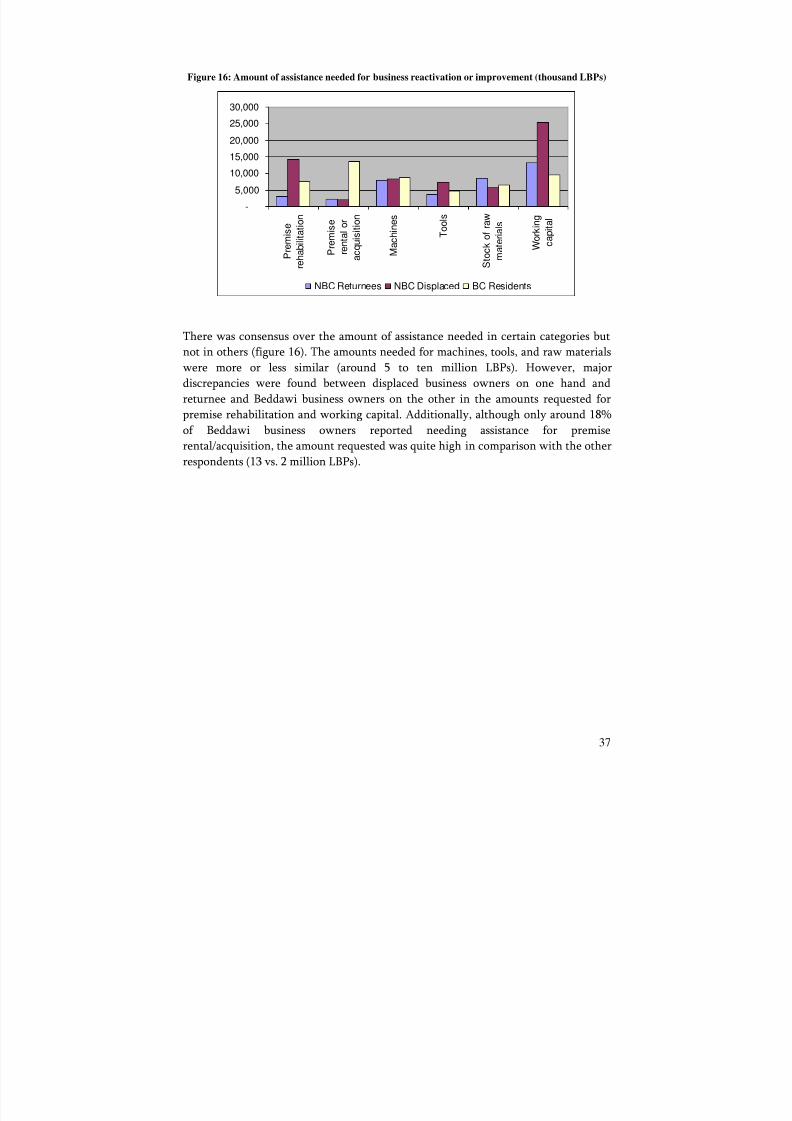
Figure 16: Amount of assistance needed for business reactivation or improvement (thousand LBPs)
There was consensus over the amount of assistance needed in certain categories butnot in others (figure 16). The amounts needed for machines, tools, and raw materialswere more or less similar (around 5 to ten million LBPs). However, major discrepancies were found between displaced business owners on one hand andreturnee and Beddawi business owners on the other in the amounts requested for premise rehabilitation and working capital. Additionally, although only around 18%of Beddawi business owners reported needing assistance for premiserental/acquisition, the amount requested was quite high in comparison with the other respondents (13 vs. 2 million LBPs).
-
5,000
10,000
15,000
20,000
25,000
30,000
P r e m
i s e
r e h a b i l i t a t i o n
P r e m
i s e
r e n t a l o r
a c q u i s i t i o n
M a c h i n e s
T o o l s
S t o c k o f r a w
m a t e r i a l s
W o r k i n g
c a p i t a l
NBC Returnees NBC Displaced BC Residents

8/8/2019 UNRWA_final_report-Socio-Economic Assessment NBC-Beddawi-Nov08
http://slidepdf.com/reader/full/unrwafinalreport-socio-economic-assessment-nbc-beddawi-nov08 43/78
38
9 Opinions and Needs
9.1 Evaluation of organizationsHouseholds were asked to rate the services provided by various organizations on ascale from 1 (very low) to six (very high). The results were then averaged for allhouseholds within the three main groups of analysis. These results revealedinteresting insights (figure 17). As shown in the figure below, the rating for allorganizations was relatively low (below 3 on a scale of 6) although this ratingimproved slightly after the crisis signifying that the relief efforts were somewhat feltby the camp population. UNRWA had by far the best service rating and the Lebanesegovernment and local municipalities received the lowest ratings.
Figure 17: Service ratings of various organizations (entire sample)
When we compare the three surveyed groups we find that the ratings given byBeddawi residents are systematically lower than those of the other two groups and
57.6% of them report no changes since the crisis. In contrast, around 50% NBCresidents (both returnees and displaced) report an improvement in services since thecrisis. Moreover, except for the Lebanese government and the municipalities, theratings given by NBC households, especially the returnees increase significantlybetween the pre and post-conflict periods. For instance, according to returneehouseholds, the rating of international NGOs increased from 1.3 before the crisis to
3.0
1.5 1.4 1.4 1.4 1.2 1.2
3.3
1.8 1.71.6 1.6 1.3 1.2
1.0 1.5 2.0
2.5 3.0 3.5 4.0 4.5 5.0 5.5 6.0
UNRWA Local NGOs InternationalNGOs
ReligiousNGOs
Political NGOs GOL Municipalities
Prior to crisis Post crisis

8/8/2019 UNRWA_final_report-Socio-Economic Assessment NBC-Beddawi-Nov08
http://slidepdf.com/reader/full/unrwafinalreport-socio-economic-assessment-nbc-beddawi-nov08 44/78
39
2.1 after which reflects their increased visibility since the crisis. However, it must bereemphasized that all ratings remain below average.
9.2 Evaluation of public servicesHouseholds were asked to rate a variety of public services (waste collection, sewage,drinking water, service water, electricity, irrigation infrastructure, roads,telecommunication, health services, educational services, relief services, socialservices, general hygiene, and environmental conditions) both before and after theNahr-el-Bared conflict (figure 18). The ratings for all public services moved from arange of 3.0 to 4.0 before the crisis to a range of 2.5 to 3.5 after the crisis. In other words the ratings of all public services moved from bad to worse.
Figure 18: Percent change in service ratings pre- and post-crisis
The ratings of all public services by Beddawi households witnessed a slight decreaseexcept for electricity whose rating dropped by 8.3% and social services whose ratingincreased slightly from 2.66 to 2.78 (+ 4.7%). In contrast, NBC displaced householdsreported a sharper deterioration of all services, in the order of 10%, with theexception of relief and social services whose rating dropped only slightly (-0.3% and -2.4% respectively). It is noteworthy that the majority of the displaced live in Beddawicamp and therefore there is a difference in perception regarding the change in the
quality of essentially the same services.However, the grimmest picture is painted by the answers of the returnees to NBCwho report very sharp declines in the quality of all the public services (except relief services) in comparison to the situation before the crisis. The worst declines (in excessof 50%) were reported in electricity, roads, and telecommunication services.Environmental conditions, general hygiene, sewage systems, and drinking water wereperceived to be more than 30% worse. Finally, the quality of waste collection, service
-70%
-60%
-50%
-40%
-30%
-20%
-10%
0%
10%
W a s t e
c o l l e c t i o n
S e w a g e
s y s t e m
D r i n k i n g
w a t e r
S e r v i c e w a t e r
I r r i g a t i o n
i n f r a s t r u c t u r e
E l e c t r i c i t y
R o a d s
T e l e c o m
H e a l t h
s e r v i c e s
E d u c a t i o n a l
s e r v i c e s
R e l i e f
s e r v i c e s
S o c i a l
s e r v i c e s
G e n e r a l
h y g i e n e
E n v i r o n m e n t a l
c o n d i t i o n s
Returnees to NBC Displaced from NBC Residents of BC

8/8/2019 UNRWA_final_report-Socio-Economic Assessment NBC-Beddawi-Nov08
http://slidepdf.com/reader/full/unrwafinalreport-socio-economic-assessment-nbc-beddawi-nov08 45/78
40
water, irrigation infrastructure, health, and education services declined more than20%. This grim picture reflects the reality of the defective infrastructure in Nahr-el-Bared and the need to rebuild that infrastructure and restore basic public services toacceptable levels.
9.3 Assessment of needs for public services
A question asking households to rate their needs in various sectors on a scale of one(low need) to six (high need) reveals the magnitude of the gaps in basic services(figure 19). The lowest reported need is in irrigation infrastructure probably due tothe low percentage of households that rely on agriculture for their livelihood. For allthe other sectors, need ratings are very high (around five on a scale of six) with somediscrepancy among the three groups of households. Once again the need is sharpestamong returnee NBC households and lowest among Beddawi residents. Thedifference is most significant in the telecommunications sector where Beddawiresidents rate their need at a level of 4 in comparison to 5.4 for returnees.
Figure 19: Assessment of need for various services
9.4 Received assistanceInterviewed households unanimously acknowledged receiving assistance followingthe crisis. Ninety nine percent of returnee households and ninety eight percent of BChouseholds reported receiving assistance. The percentage was relatively lower for households that remain displaced (91%) mainly because a lower percentage of
1.0
2.0
3.0
4.0
5.0
6.0
W a s t e
c o l l e c t i o n
S e w a g e
s y s t e m
D r i n k i n g
w a t e r
S e r v i c e w a t e r
I r r i g a t i o n
i n f r a s t r u c t u r e
E l e c t r i c i t y
R o a d s
T e l e c o m
H e a l t h
s e r v i c e s
E d u c a t i o n a l
s e r v i c e s
R e l i e f
s e r v i c e s
S o c i a l
s e r v i c e s
G e n e r a l
h y g i e n e
E n v i r o n m e n t a l
c o n d i t i o n s
Returnees to NBC Displaced from NBC Residents of BC

8/8/2019 UNRWA_final_report-Socio-Economic Assessment NBC-Beddawi-Nov08
http://slidepdf.com/reader/full/unrwafinalreport-socio-economic-assessment-nbc-beddawi-nov08 46/78
41
displaced households residing outside Beddawi Camp and especially outside the northreported receiving assistance.
As for the types of assistance received (figure 20), almost all households reportedreceiving cash (97%). The second most common type of assistance is food and water,
followed by health and medications, house appliances, and rent subsidies. An inter-group comparison shows that returnees report receiving the various types of assistance more often than displaced and BC households. The only exception is rentsubsidies where the highest percentage reporting such assistance is among displacedhouseholds. The reason is most likely that returnees no longer need rent subsidiesbecause they either returned to their own homes or to housing units built byUNRWA.
Figure 20: Percentage of households by type of assistance received
When asked about the source of assistance, more than eighty percent of householdscited UNRWA (figure 21). For Beddawi Camp residents, it appears as almost the onlysource of assistance. Relatives and friends in Lebanon come next with only 11.6% of respondents. As for NBC households, the second most cited source of assistance ispolitical organizations, followed by local NGOs. It is noteworthy that local NGOs,international NGOs and religious organizations were all more often cited by returneethan by displaced households. The reason could be that displaced households weremore difficult to locate and therefore less likely to receive assistance from the variousNGOs (with the exception of UNRWA).
0%20%40%60%80%
100%
C a s h
F o o d a n d
W a t e r
H e a l t h /
m e d i c a t i o n s
H o u s e
a p p l i a n c e s
R e n t ( c a s h )
E d u c a t i o n a l
s e r v i c e s
C l o t h e s
G a s / P o w e r
H o u s i n g
E m p l o y m e n t
B u s i n e s s
s u p p o r t
Returnees to NBC Displaced from NBC Residents of BC

8/8/2019 UNRWA_final_report-Socio-Economic Assessment NBC-Beddawi-Nov08
http://slidepdf.com/reader/full/unrwafinalreport-socio-economic-assessment-nbc-beddawi-nov08 47/78
42
Figure 21: Percentage of households by source of assistance
9.5 Expected assistance
It comes as no surprise that the highest expectations are directed toward the
UNRWA. Indeed, more than half of the surveyed households expect help from theUNRWA in all the domains of interest (figure 22). Local and international NGOscome next with around 20% of households expecting assistance in the various areas of interest. Finally, less than ten percent of the surveyed households had anyexpectations from the Lebanese local and central governments. The highestexpectation rate was in infrastructure with sixteen percent of households expectingassistance from the Lebanese government in that regard. All three groups of surveyedhouseholds seemed to have similar expectations in the various aspects of assistancewith returnee households registering more or less consistently higher expectationrates than the two other categories.
Figure 22: Percentage of households by type of expected assistance and type of organization
0%20%40%60%80%
100%
U N R W A a n d
o t h e r U N
a g e n c i e s
P o l i t i c a l
O r g a n i z a t i o n s
L o c a l N G O s
I n t e r n a t i o n a l
N G O s
R e l i g i o u s
O r g a n i z a t i o n s
R e l a t i v e s / F r i e n d
s i n L e b a n o n
R e l a t i v e s / F r i e n d
s a b r o a d
G o v e r n m e n t o f
L e b a n o n
M u n i c i p a l i t i e s
Returnees to NBC Displaced from NBC Residents of BC
0% 10% 20% 30% 40% 50% 60% 70% 80% 90%
Improvement of infrastructure
Health s ervices Education/training Employmentsupport
Business support
International NGOs Local NGOs GOL and municipalities UNRWA

8/8/2019 UNRWA_final_report-Socio-Economic Assessment NBC-Beddawi-Nov08
http://slidepdf.com/reader/full/unrwafinalreport-socio-economic-assessment-nbc-beddawi-nov08 48/78
43
4.8
3.9 4.2
1.8 2.0 2.3
1.0
2.03.04.0
5.0
6.0
Retur nees to NBC Dis plac ed fr om NBC Res idents of BC
Prior to crisis Post crisis
4.6
3.74.1
2.1 2.32.6
1.0
2.03.04.0
5.0
6.0
Re tur nees to NBC Dis plac ed fr om NBC Res iden ts of BC
Prior to crisis Post crisis
9.6 Rating of Palestinian-Lebanese relations
Respondents were asked to rate Palestinian-Lebanese relations in the North and inthe country at large (figure 23). The ratings ranged between 3.7 and 4.8 before thecrisis and between 1.8 and 2.8 after the crisis. All three groups reported a significant
deterioration of these relations in the country in general (43%) and especially in theNorth (52%). However, it is noteworthy that NBC returnees gave the highest ratingsbefore the crisis and the lowest after the crisis. According to this group, Palestinian-Lebanese relations are fifty-three percent worse in Lebanon and sixty-two percentworse in the North.
Figure 23: Rating of Palestinian-Lebanese relations in the country (left) and in the North (right)

8/8/2019 UNRWA_final_report-Socio-Economic Assessment NBC-Beddawi-Nov08
http://slidepdf.com/reader/full/unrwafinalreport-socio-economic-assessment-nbc-beddawi-nov08 49/78
44
10 Comparison of Camp and Surrounding AreaPopulations
A comparison of the populations that constituted the targets of these twosynchronized surveys reveals similar age structures: 30% of the surrounding arearesidents are younger than 15 (in comparison to 33% among camp households) and44% are younger than 20 (in comparison to 46% among camp households).Surprisingly enough, this is where the similarity ends. The two populations aredifferent in every other respect and especially in regards to the impact of the crisis onthe various aspects of livelihood. Following is a list of the comparative findings thatwere deemed most worthy of mention:
A larger household size in surrounding areas: 5.8 vs. around 5 in camps. Infact, even the highest recorded household size in the UNRWA survey (5.26 for returnees) falls below the smallest household size among surroundingmunicipalities (5.4 in Beddawi).
Displacement is much less severe in surrounding municipalities where a verysmall percentage of households remain displaced (2%) and the averagedisplacement period was around 2 months.
Ownership rates were rather similar prior to the conflict (72% in camps vs.81% in surrounding areas). However, the rate dropped to 37% among camphouseholds and remained relatively unchanged in the surroundingmunicipalities.
The UNRWA survey revealed much more significant home damages . Whereas75% of homes in surrounding municipalities were left completely intact after the crisis, only 33% of camp households reported no damages. In contrast, 48%of camp dwellings were completely destroyed compared with only 1% in
surrounding areas.
Whereas private space available per individual declined sharply among camphouseholds, the crowding index in the surrounding areas remained constant ataround 34 square meters per person. The reason is possibly that almost allsurrounding area families never left their homes or were displaced for a veryshort period during active conflict.

8/8/2019 UNRWA_final_report-Socio-Economic Assessment NBC-Beddawi-Nov08
http://slidepdf.com/reader/full/unrwafinalreport-socio-economic-assessment-nbc-beddawi-nov08 50/78
45
The enrollment rate in surrounding municipalities exceeds the same rate for camp residents for all age categories except the first years of schooling. Theenrollment rate in secondary education reaches 72% for surrounding area
residents compared to 60% among camp residents. The contrast, thoughsomewhat less sharp, remains valid for higher education where the enrolmentrate is 37% and 30% for the surrounding area and camps respectively.
The two populations show no difference in educational attainment beyondintermediate education: a similar percentage of members hold high school anduniversity degrees or their vocational training equivalents. However,significant differences appear in primary and intermediate education wherecamp residents hold a lead with 26% of them having intermediate educationvs. 17% among surrounding area residents and 40% having primary educationvs. 34% among surrounding area residents.
The picture is complemented by the higher illiteracy rate among surroundingarea residents: 9% vs. 4% among camp residents. In fact, a more in-depth lookshows higher illiteracy rates in the surrounding area population across gendersand age groups. The differences are especially sharp among 55-64 year olds:49% of 55-64 year old surrounding area females are illiterate compared to 24%of camp residents of the same age and gender. Similarly, 19% of 55-64 year oldsurrounding area males are illiterate compared to 6% among camp residents of the same age and gender.
Disease prevalence is consistently higher for camp residents (19 vs. 12%) andso is disability prevalence (4 vs. 2%).
The labor force participation rate is slightly higher in the surroundingmunicipalities: 40.6 vs. 37.4% among NBC and BC residents.
The differential impact of the crisis is clearly reflected by the unemployment
rate which increased from 9.7 to 26.6% among camp residents while it stayedrelatively stable (6.5 to 6.8%) in the surrounding municipalities.
Employment is clearly less concentrated in the surrounding municipalitieswhose workers are scattered across a variety of sectors. In contrast, 72% of Palestinian workers are concentrated in three major sectors (trade,

8/8/2019 UNRWA_final_report-Socio-Economic Assessment NBC-Beddawi-Nov08
http://slidepdf.com/reader/full/unrwafinalreport-socio-economic-assessment-nbc-beddawi-nov08 51/78
46
construction, and education/health). The reason is possibly the narrower rangeof employment opportunities that are available to Palestinians.
Whereas 15% of camp households have no breadwinners, all the surveyedsurrounding area households have a main breadwinner. Camp mainbreadwinners are younger and more educated than the main breadwinners inthe surrounding area.
Only 6% of surrounding area business owners reported losing their businessescompared to 36% among camp business owners. Also, while 55% of campbusiness owners reported complete destruction of their work premises, only3% of surrounding area business owners could say the same.
Palestinian businesses seem to be much more dependent on the local Lebanese
market than Lebanese businesses are on the Palestinian market. Prior to thecrisis, 71% of camp business owners reported frequent or normal exchangewith Lebanese businesses or customers compared to 35% among surroundingarea businesses. The percentage is now 21% for both populations. Another indicator of this asymmetrical dependency is the much larger share of Lebanese clients in the customer base of camp businesses (48%) whilePalestinian customers represent only 11% of the customer base of surroundingarea businesses.
UNRWA is the most prominent source of assistance for camp residents while
the Lebanese government and municipalities are the most prominent source of assistance for surrounding area residents.
The two populations gave similar ratings for the Palestinian-Lebanese relationsprior to the crisis. However, the ratings witnessed a much sharper deterioration among camp residents.
In conclusion, while the Nahr-El-Bared crisis had devastating effects on the livingconditions and livelihoods of NBC and BC residents, the impact on surrounding arearesidents was significantly less severe. When only the three contiguous municipalitiesof Bebnine, Bhanine, and Mhammara are taken into account, the consequences of thecrisis become more prominent. However, even in the case of these municipalities, theimpact was significantly weaker than it was for camp residents with significantly lessdestruction in homes and property, much less displacement, a significantly lower income effect, and a relatively low and stable unemployment rate.
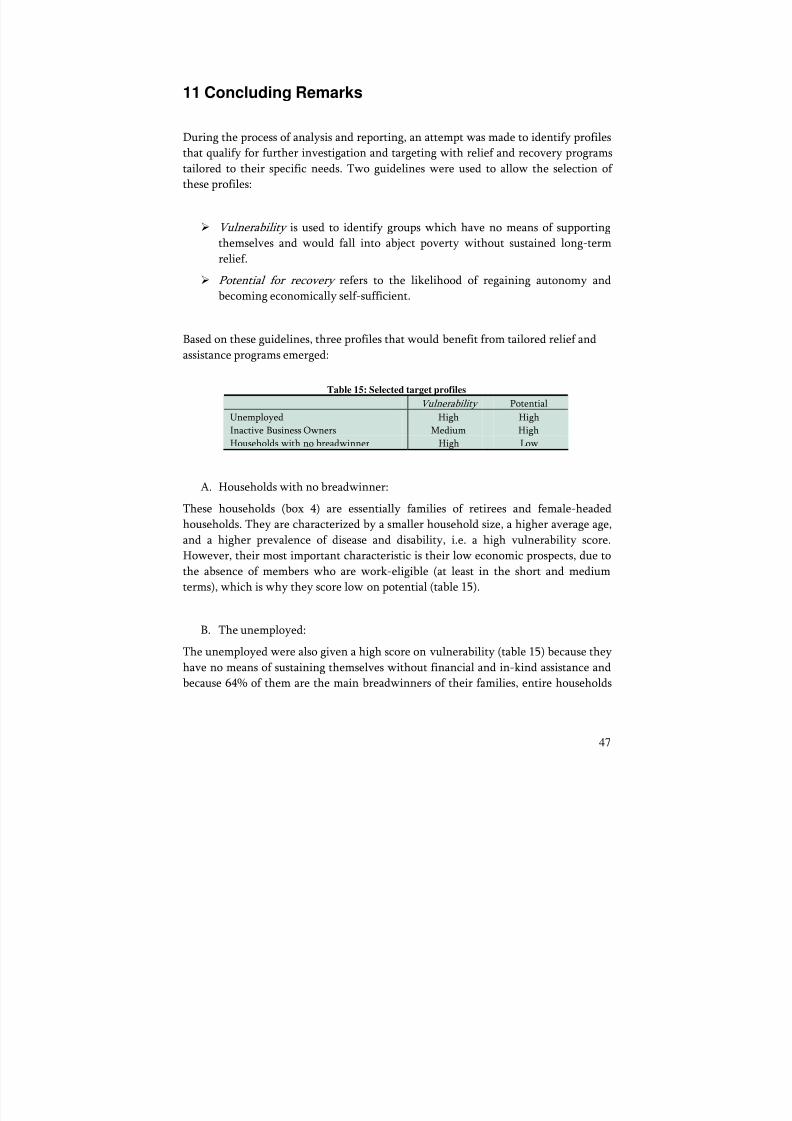
8/8/2019 UNRWA_final_report-Socio-Economic Assessment NBC-Beddawi-Nov08
http://slidepdf.com/reader/full/unrwafinalreport-socio-economic-assessment-nbc-beddawi-nov08 52/78
47
11 Concluding Remarks
During the process of analysis and reporting, an attempt was made to identify profiles
that qualify for further investigation and targeting with relief and recovery programstailored to their specific needs. Two guidelines were used to allow the selection of these profiles:
Vulnerability is used to identify groups which have no means of supportingthemselves and would fall into abject poverty without sustained long-termrelief.
Potential for recovery refers to the likelihood of regaining autonomy and
becoming economically self-sufficient.
Based on these guidelines, three profiles that would benefit from tailored relief andassistance programs emerged:
Table 15: Selected target profiles Vulnerability Potential
Unemployed High HighInactive Business Owners Medium HighHouseholds with no breadwinner High Low
A. Households with no breadwinner:
These households (box 4) are essentially families of retirees and female-headedhouseholds. They are characterized by a smaller household size, a higher average age,and a higher prevalence of disease and disability, i.e. a high vulnerability score.However, their most important characteristic is their low economic prospects, due tothe absence of members who are work-eligible (at least in the short and mediumterms), which is why they score low on potential (table 15).
B. The unemployed:
The unemployed were also given a high score on vulnerability (table 15) because theyhave no means of sustaining themselves without financial and in-kind assistance andbecause 64% of them are the main breadwinners of their families, entire households

8/8/2019 UNRWA_final_report-Socio-Economic Assessment NBC-Beddawi-Nov08
http://slidepdf.com/reader/full/unrwafinalreport-socio-economic-assessment-nbc-beddawi-nov08 53/78
48
are left in a high vulnerability state. However, unlike households with nobreadwinners, this category scores high on potential.
A very important finding was that only 12% of the currently unemployed wereunemployed before the crisis. This finding is significant for two reasons: 1) it indicates
that these individuals were working in the recent past and willing to resume gainfulemployment if given the opportunity, and 2) because 88% of the unemployed losttheir jobs as a direct consequence of the crisis, helping them find employmentopportunities ought to be part and parcel of the reconstruction effort.
Just like the rest of the surveyed population, the first instinct of unemployedbreadwinners is to turn to UNRWA for help: 42% of them said that they alreadyhave. When asked about the kind of assistance they need, 45% of them asked for helpfinding employment opportunities, followed at a distance by laws expanding thenumber of allowed professions (16%), easy access at army checkpoints (16%), andtransportation (16%). Only half of them are interested in cash-for-work activities.Half of them would like jobs inside NBC and 20% in North Lebanon. Finally, only 7%are interested in vocational training.
C. Inactive Business Owners:
Like the unemployed, inactive business owners scored high on potential (table 15)because they are equipped to generate their own livelihoods and all they lack isopportunity or starting capital. Similarly, because 86% of them are the mainbreadwinners of their families, helping them to reactivate their businesses would
secure livelihoods for their households. In other words, a program targeting businessowners would have an economic impact on a much wider circle of beneficiaries. Theonly difference between inactive business owners and the other two profiles lies intheir lower vulnerability score because some of them currently have wage-paying
jobs.
Once again, UNRWA seems to be the organization that most of them would turn tofor help (54%). 60% would like to work in NBC and 17% in North Lebanon. Only 5%are interested in vocational training. Like unemployed breadwinners, only half (45%)of the inactive business owners are interested in cash-for-work activities and 40% are
interested in micro-credit programs. For those interested in micro loans, the averagemonthly installment they could afford was 144 thousand LBPs and the averagerequested loan duration was 31 months.
Finally, a question about the types and size of assistance needed to restart their businesses revealed the following information:

8/8/2019 UNRWA_final_report-Socio-Economic Assessment NBC-Beddawi-Nov08
http://slidepdf.com/reader/full/unrwafinalreport-socio-economic-assessment-nbc-beddawi-nov08 54/78
49
Table 16: Assistance needed to restart businesses
Need assistance Amount needed (thousand LBPs)
Premise rehabilitation 35% 4,000Premise rental/acquisition 53% 1,600
Machines 50% 8,900Tools 53% 6,500Raw materials 34% 4,600Working capital 82% 16,400
In light of the above discussion, parallel efforts ought to be made to provide relief tovulnerable groups and to help categories with high potential and impact to secure totheir own livelihoods and become economically sufficient, therefore no longer relying on UNRWA relief.
For this purpose, two axes of intervention are suggested:
1. Long-term relief Programs targeting all vulnerable groups:
The newly developed social safety net program will be used to distribute relief to all households identified as vulnerable based on a proxy means-testingformula.
A survey should be foreseen around 6 months after implementation in order toassess whether the new targeting system is achieving its purpose, i.e. creating a
safety net that catches the vulnerable and ensures a minimum package of basicservices to all.
2. Short-term Back-to-Work programs targeting groups with high potential and highimpact. One fairly obvious option consists of hastening the reconstruction effortthereby generating employment for a large number of the unemployed. In fact,according to the survey, 25% of the currently unemployed worked in constructionbefore the crisis. Another option would be to establish a micro-credit program atno or low interest to help business owners restart their businesses. This effortshould however be preceded by an enterprise census that studies the market andproduces guidelines that can be used to advise business owners on the types of businesses that are likely to succeed and the best locations for them.

8/8/2019 UNRWA_final_report-Socio-Economic Assessment NBC-Beddawi-Nov08
http://slidepdf.com/reader/full/unrwafinalreport-socio-economic-assessment-nbc-beddawi-nov08 55/78
50
Appendix

8/8/2019 UNRWA_final_report-Socio-Economic Assessment NBC-Beddawi-Nov08
http://slidepdf.com/reader/full/unrwafinalreport-socio-economic-assessment-nbc-beddawi-nov08 56/78
51
Appendix Table 1: Relation to head of household (HoH)
Appendix Table 2: Current residence status
Male Female TotalPresently living with household N 4311 4509 8820
% 94.90% 97.20% 96.00%Sleep in different premise but still sharing household living N 15 11 26
% 0.30% 0.20% 0.30%Moved temporarily to another residence N 16 16 32
% 0.40% 0.30% 0.30%Moved permanently to another residence N 41 74 115
% 0.90% 1.60% 1.30%Temporarily absent for work/studies/health N 44 8 52
% 1.00% 0.20% 0.60%Outside the country for work N 78 6 84
% 1.70% 0.10% 0.90%Died N 31 12 43
% 0.70% 0.30% 0.50%No answers N 7 5 12
% 0.20% 0.10% 0.10%Total N 4543 4641 9184
% 100.00% 100.00% 100.00% Appendix Table 3: UNRWA hardship case
Returnee to NBC
Displaced from NBC
Resident of BC
Total
Yes N 226 229 193 648% 37.70% 37.00% 32.20% 35.70%
No N 366 382 398 1146% 61.10% 61.70% 66.40% 63.10%
Do not know N 7 8 8 23
% 1.20% 1.30% 1.30% 1.30%Total N 599 619 599 1817
% 100.00% 100.00% 100.00% 100.00%
Returnee to NBC
Displaced from NBC
Resident of BC
Total
HoH 591 605 554 1750Spouse 546 522 549 1617
Children 1968 1850 1800 5618Daughter/son in law 3 3 12 18Grand child 12 15 19 46Parents of HoH 18 45 34 97Relatives 4 7 7 18Others including maids 0 0 1 1No answers 9 6 4 19Total 3151 3053 2980 9184

8/8/2019 UNRWA_final_report-Socio-Economic Assessment NBC-Beddawi-Nov08
http://slidepdf.com/reader/full/unrwafinalreport-socio-economic-assessment-nbc-beddawi-nov08 57/78
52
Appendix Table 4: Crowding index
Appendix Table 5: Current sector of activity
Post Prior VariationReturnee to NBC Mean 16.4284 28.7821 -42.90%
N 597 596Displaced from NBC Mean 20.2503 32.1821 -37.10%
N 611 614Resident of BC Mean 23.9596 23.5317 1.80%
N 594 590Total Mean 20.2068 28.2209 N 1802 1800
Returnee to NBC
Displaced from NBC
Resident of BC
Total
Agriculture/fishing N 18 17 1 36% 2.90% 2.70% 0.20% 1.90%
Industry/craftwork N 21 37 46 104
% 3.40% 6.00% 6.90% 5.50%Water/electricity/gas N 14 11 34 59% 2.30% 1.80% 5.10% 3.20%
Construction/public works N 200 158 247 605% 32.50% 25.70% 37.00% 31.90%
Commerce/trade/maintenance N 215 176 166 557% 35.00% 28.60% 24.90% 29.30%
Hotels/restaurants N 17 15 33 65% 2.80% 2.40% 4.90% 3.40%
Communications/transport N 27 35 32 94% 4.40% 5.70% 4.80% 4.90%
Finance/real estate N 12 25 16 53% 2.00% 4.10% 2.40% 2.80%
Public administration/armedforces N 11 19 15 45% 1.80% 3.10% 2.30% 2.40%
Education/health N 57 102 59 218% 9.30% 16.60% 8.80% 11.50%
Other services N 23 20 18 61% 3.70% 3.30% 2.70% 3.20%
Total N 615 615 667 1897% 100.00% 100.00% 100.00% 100.00%

8/8/2019 UNRWA_final_report-Socio-Economic Assessment NBC-Beddawi-Nov08
http://slidepdf.com/reader/full/unrwafinalreport-socio-economic-assessment-nbc-beddawi-nov08 58/78
53
Appendix Table 6: Current professionReturnee to
NBC Displaced from NBC
Resident of BC
Total
Lebanese Army N 1 2 2 5% 0.20% 0.30% 0.30% 0.30%
Politicians, civil servant N 2 9 1 12
% 0.30% 1.40% 0.20% 0.60%Manager/CEO large Enterprise N 0 2 1 3% 0.00% 0.30% 0.20% 0.20%
Manager/CEO Small Enterprise N 101 89 97 287% 15.80% 14.30% 14.80% 14.90%
Physicists, mathematicians, chemists, N 4 12 5 21% 0.60% 1.90% 0.80% 1.10%
Biologist, Health professional N 7 16 11 34% 1.10% 2.60% 1.70% 1.80%
Education N 18 32 28 78% 2.80% 5.20% 4.30% 4.00%
Other professionals (administrative, legal) N 5 4 0 9% 0.80% 0.60% 0.00% 0.50%
Science technicians N 2 4 1 7% 0.30% 0.60% 0.20% 0.40%
Health technicians N 24 34 7 65% 3.80% 5.50% 1.00% 3.40%
Educational technicians N 2 12 6 20% 0.30% 1.90% 0.90% 1.00%
Other technicians N 7 9 0 16% 1.10% 1.40% 0.00% 0.80%
Offices workers N 7 18 10 35% 1.10% 2.90% 1.50% 1.80%
Personal services, safety N 37 44 34 115% 5.80% 7.10% 5.20% 6.00%
Salesmen and seals assistants N 31 26 16 73% 4.80% 4.20% 2.40% 3.80%
Professional farmers and fishermen N 17 14 1 32% 2.70% 2.20% 0.20% 1.70%
Mining & construction workers N 175 138 219 532% 27.40% 22.00% 33.40% 27.70%
Metal works, mechanics, electronics N 35 38 74 147% 5.50% 6.00% 11.30% 7.70%
Artisans N 6 5 2 13% 0.90% 0.80% 0.30% 0.70%
Craftsmen N 42 38 42 122% 6.60% 6.00% 6.40% 6.40%
Industry workers-machinery operators N 1 0 0 1% 0.20% 0.00% 0.00% 0.00%
Industry workers-large machinery N 0 1 1 2
% 0.00% 0.20% 0.20% 0.10%Vehicle operators N 42 31 26 99% 6.50% 4.90% 3.90% 5.20%
Nonskilled sales & services workers N 63 44 70 177% 9.90% 7.10% 10.70% 9.20%
Nonskilled agricultural workers N 9 4 0 13% 1.40% 0.60% 0.00% 0.70%
Unspecified N 1 0 1 2% 0.20% 0.00% 0.20% 0.10%
Total N 639 626 655 1920% 100.00% 100.00% 100.00% 100.00%

8/8/2019 UNRWA_final_report-Socio-Economic Assessment NBC-Beddawi-Nov08
http://slidepdf.com/reader/full/unrwafinalreport-socio-economic-assessment-nbc-beddawi-nov08 59/78
54
Appendix Table 7: Current work place
Returnee to NBC
Displaced from NBC
Resident of BC
Total
Nahr el Bared Camp (NBC) N 263 96 4 363% 55.70% 19.10% 0.70% 22.70%
Beddawi camp (BC) N 18 128 247 393% 3.80% 25.50% 39.70% 24.60%
Vicinity of BC N 4 12 40 56% 0.90% 2.40% 6.40% 3.50%
Vicinity of NBC N 53 22 2 77% 11.20% 4.40% 0.30% 4.80%
Other-North Lebanon N 89 176 275 540% 18.90% 35.00% 44.10% 33.80%
Other-Lebanon N 19 41 33 93% 4.00% 8.10% 5.30% 5.80%
Outside Lebanon N 26 28 22 76% 5.50% 5.50% 3.50% 4.80%
Total N 472 503 623 1598% 100.00% 100.00% 100.00% 100.00%
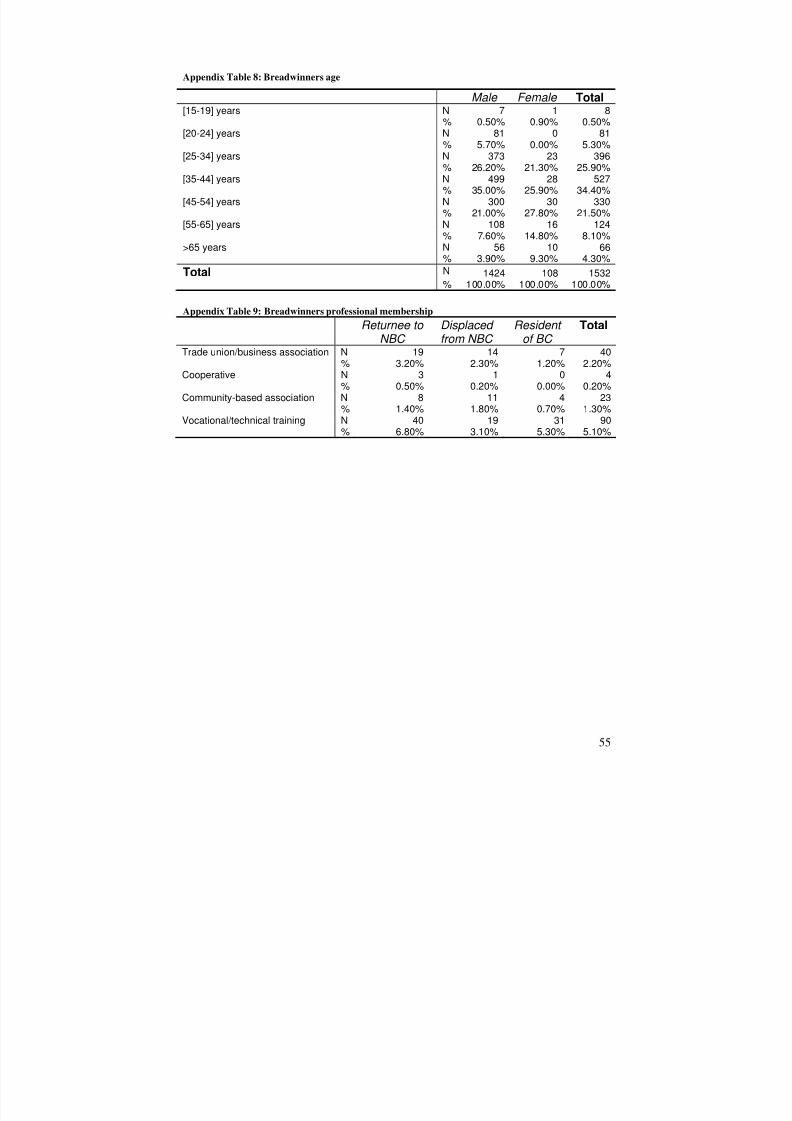
8/8/2019 UNRWA_final_report-Socio-Economic Assessment NBC-Beddawi-Nov08
http://slidepdf.com/reader/full/unrwafinalreport-socio-economic-assessment-nbc-beddawi-nov08 60/78
55
Appendix Table 8: Breadwinners age
Appendix Table 9: Breadwinners professional membership
Returnee to NBC
Displaced from NBC
Resident of BC
Total
Trade union/business association N 19 14 7 40% 3.20% 2.30% 1.20% 2.20%
Cooperative N 3 1 0 4% 0.50% 0.20% 0.00% 0.20%
Community-based association N 8 11 4 23% 1.40% 1.80% 0.70% 1.30%
Vocational/technical training N 40 19 31 90% 6.80% 3.10% 5.30% 5.10%
Male Female Total[15-19] years N 7 1 8
% 0.50% 0.90% 0.50%[20-24] years N 81 0 81
% 5.70% 0.00% 5.30%[25-34] years N 373 23 396
% 26.20% 21.30% 25.90%[35-44] years N 499 28 527
% 35.00% 25.90% 34.40%[45-54] years N 300 30 330
% 21.00% 27.80% 21.50%[55-65] years N 108 16 124
% 7.60% 14.80% 8.10%>65 years N 56 10 66
% 3.90% 9.30% 4.30%Total N 1424 108 1532
% 100.00% 100.00% 100.00%

8/8/2019 UNRWA_final_report-Socio-Economic Assessment NBC-Beddawi-Nov08
http://slidepdf.com/reader/full/unrwafinalreport-socio-economic-assessment-nbc-beddawi-nov08 61/78
56
Appendix Table 10: Organization rating (Satisfaction level)
Returnee to NBC
Displaced from NBC
Resident of BC
Total
UNRWA Prior 3.17 3.01 2.72 2.97Post 3.70 3.81 2.46 3.32
Local NGOs Prior 1.49 1.63 1.30 1.47Post 2.21 1.83 1.29 1.78International NGOs Prior 1.30 1.59 1.31 1.40
Post 2.09 1.78 1.31 1.73Religious associations Prior 1.33 1.56 1.42 1.43
Post 1.72 1.59 1.44 1.58Political parties Prior 1.30 1.52 1.34 1.39
Post 1.65 1.70 1.36 1.57Government of Lebanon Prior 1.19 1.38 1.18 1.25
Post 1.22 1.38 1.18 1.26Municipalities Prior 1.12 1.35 1.10 1.19
Post 1.17 1.34 1.11 1.21

8/8/2019 UNRWA_final_report-Socio-Economic Assessment NBC-Beddawi-Nov08
http://slidepdf.com/reader/full/unrwafinalreport-socio-economic-assessment-nbc-beddawi-nov08 62/78
57
Appendix Table 11: Basic services rating (Satisfaction level)
Returnee to NBC
Displaced from NBC
Resident of BC
Total
Waste collection Prior 4.54 3.79 4.19 4.17Post 3.37 3.49 4.09 3.65Current need 5.69 5.10 5.30 5.36
Sewage system Prior 4.57 3.80 4.28 4.21Post 3.07 3.43 4.23 3.57Current need 5.75 5.07 5.24 5.35
Drinking water Prior 4.54 3.92 4.27 4.24Post 3.07 3.44 4.12 3.55Current need 5.78 5.21 5.17 5.38
Service water Prior 4.58 3.93 4.17 4.22Post 3.46 3.47 4.06 3.66Current need 5.76 5.15 4.90 5.27
Irrigation infrastructure Prior 3.00 2.65 2.44 2.69Post 2.24 2.54 2.28 2.36Current need 4.62 4.60 2.70 3.97
Electricity Prior 4.65 3.64 3.87 4.05
Post 2.23 3.31 3.55 3.03Current need 5.64 5.20 5.33 5.39Roads Prior 4.60 3.50 3.53 3.87
Post 1.65 3.13 3.39 2.73Current need 5.62 5.05 4.68 5.12
Telecommunications Prior 4.83 3.59 3.21 3.91Post 1.64 3.20 3.15 2.64Current need 5.44 5.07 4.01 4.89
Health services Prior 4.06 3.40 3.84 3.76Post 3.02 3.13 3.88 3.34Current need 5.70 5.24 5.33 5.42
Educational services Prior 4.04 3.37 4.19 3.86Post 3.05 3.15 4.18 3.45Current need 5.70 5.16 5.36 5.40
Relief services Prior 2.96 3.04 2.94 2.98Post 3.06 3.03 2.97 3.02Current need 5.59 5.12 5.27 5.32
Social services Prior 2.82 3.05 2.66 2.84Post 2.52 2.98 2.78 2.76Current need 5.41 5.02 5.03 5.15
General hygiene Prior 3.60 3.14 3.60 3.44Post 2.34 2.88 3.48 2.90Current need 5.57 5.03 5.08 5.22
Environment Prior 3.31 2.89 2.80 3.00Post 2.03 2.55 2.66 2.41Current need 5.55 4.97 4.62 5.05

8/8/2019 UNRWA_final_report-Socio-Economic Assessment NBC-Beddawi-Nov08
http://slidepdf.com/reader/full/unrwafinalreport-socio-economic-assessment-nbc-beddawi-nov08 63/78
58
Appendix Table 12: Received assistance
Appendix Table 13: Source of assistance
Returnee to NBC
Displaced from NBC
Resident of BC
Total
Relatives/friends abroad N 62 70 50 182% 10.70% 12.30% 8.50% 10.50%
Relatives/friends in Lebanon N 68 105 68 241% 11.70% 18.50% 11.60% 13.90%
UNRWA N 535 491 467 1493% 90.50% 86.30% 79.70% 85.50%
Government of Lebanon N 39 25 19 83% 6.60% 4.40% 3.20% 4.80%
Municipalities N 36 17 5 58% 6.10% 3.00% 0.90% 3.30%
International NGOs N 194 74 8 276% 32.80% 13.00% 1.40% 15.80%
Local NGOs N 324 116 5 445% 54.70% 20.40% 0.90% 25.50%
Religious organizations N 169 73 16 258
% 28.60% 12.80% 2.70% 14.80%Political organizations N 343 352 30 72558.00% 61.90% 5.10% 41.50%
Returnee to NBC
Displaced from NBC
Resident of BC
Total
Cash N 586 535 574 1695% 98.80% 94.20% 97.80% 97.00%
Food and Water N 557 286 161 1004% 93.90% 50.30% 27.40% 57.40%Housing N 263 70 3 336
% 45.20% 12.30% 0.50% 19.30%Rent (cash) N 212 470 1 683
% 36.30% 82.60% 0.20% 39.30%Clothes N 259 201 3 463
% 43.90% 35.30% 0.50% 26.50%House appliances N 449 283 19 751
% 76.00% 49.70% 3.20% 43.00%Health services/medications N 444 172 223 839
% 75.10% 30.30% 38.00% 48.10%Educational services N 333 89 220 642
% 56.30% 15.70% 37.50% 36.80%Gas/Power N 338 87 18 443
% 57.20% 15.30% 3.10% 25.40%Employment N 37 17 2 56
% 6.30% 3.00% 0.30% 3.20%Business support N 32 22 2 56
% 5.40% 3.90% 0.30% 3.20%

8/8/2019 UNRWA_final_report-Socio-Economic Assessment NBC-Beddawi-Nov08
http://slidepdf.com/reader/full/unrwafinalreport-socio-economic-assessment-nbc-beddawi-nov08 64/78
59
Appendix Table 14: Expected assistance from UNRWA
Returnee to NBC
Displaced from NBC
Resident of BC
Total
Improvement of infrastructure N 518 445 403 1366% 86.50% 72.50% 67.50% 75.50%
Health services N 543 532 439 1514% 90.70% 86.50% 73.70% 83.60%
Education/training N 525 506 439 1470% 87.60% 82.30% 73.70% 81.20%
Employment support N 409 425 397 1231% 68.30% 69.10% 66.60% 68.00%
Business support N 280 391 334 100546.70% 63.60% 56.00% 55.50%
Appendix Table 15: Expected assistance from different organizations
UNRWAAgencies
International NGOs
Local NGOs
GOL and municipalities
Improvement of infrastructure N 1366 422 369 246% 75.50% 23.30% 20.40% 13.60%
Health services N 1514 375 360 177% 83.60% 20.70% 19.90% 9.80%
Education/training N 1470 405 431 151% 81.20% 22.40% 23.90% 8.40%
Employment support N 1231 425 399 132% 68.00% 23.50% 22.10% 7.30%
Business support N 1005 401 354 12055.50% 22.20% 19.60% 6.60%

8/8/2019 UNRWA_final_report-Socio-Economic Assessment NBC-Beddawi-Nov08
http://slidepdf.com/reader/full/unrwafinalreport-socio-economic-assessment-nbc-beddawi-nov08 65/78
60
Appendix Table 16: Choosing the same type of work
Appendix Table 17: Choosing the same type of work by gender
Male Female TotalYes N 145 8 153
% 43.30% 33.30% 42.60%No N 190 16 206
% 56.70% 66.70% 57.40%Total N 335 24 359
% 100.00% 100.00% 100.00% Appendix Table 18: Choosing the same type of work by marital status
Never been
married
Married Divorced/ separated
Widows Total
Yes N 18 131 1 2 152% 43.90% 42.40% 33.30% 40.00% 42.60%
No N 23 178 2 3 206% 56.10% 57.60% 66.70% 60.00% 57.40%
Total N 41 309 3 5 358% 100.00% 100.00% 100.00% 100.00% 100.00%
Appendix Table 19: Choosing the same type of work by age
[15-19] years
[20-24] years
[25-34] years
[35-44] years
[45-54] years
[55-65] years
>65 years
Total
Yes N 1 7 55 44 38 7 1 153% 33.30% 31.80% 46.20% 38.60% 45.80% 46.70% 33.30% 42.60%
No N 2 15 64 70 45 8 2 206% 66.70% 68.20% 53.80% 61.40% 54.20% 53.30% 66.70% 57.40%
Total N 3 22 119 114 83 15 3 359% 100.00% 100.00% 100.00% 100.00% 100.00% 100.00% 100.00% 100.00%
Returnee to NBC
Displaced from NBC
Resident of BC
Total
Yes N 70 54 37 161% 44.00% 59.30% 31.10% 43.60%
No N 89 37 82 208% 56.00% 40.70% 68.90% 56.40%Total N 159 91 119 369
% 100.00% 100.00% 100.00% 100.00%
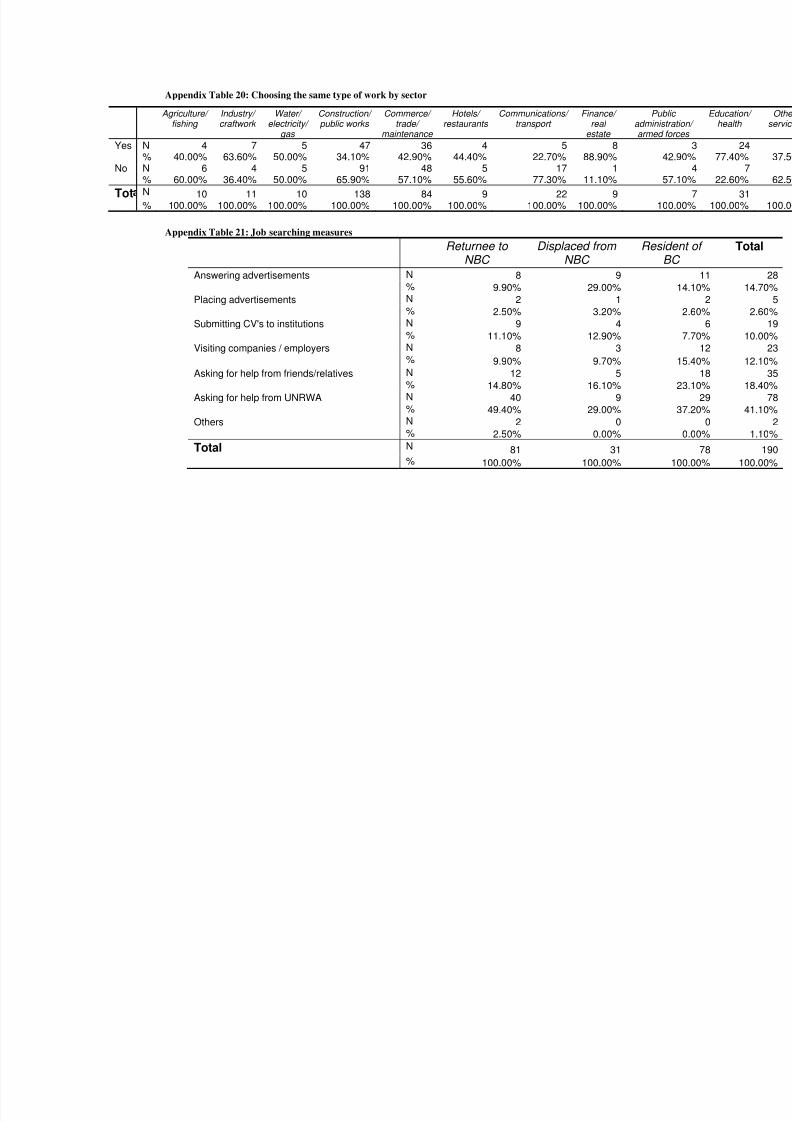
8/8/2019 UNRWA_final_report-Socio-Economic Assessment NBC-Beddawi-Nov08
http://slidepdf.com/reader/full/unrwafinalreport-socio-economic-assessment-nbc-beddawi-nov08 66/78
Appendix Table 20: Choosing the same type of work by sector
Appendix Table 21: Job searching measures
Returnee to NBC
Displaced from NBC
Resi
Answering advertisements N 8 9 % 9.90% 29.00%
Placing advertisements N 2 1 % 2.50% 3.20%Submitting CV's to institutions N 9 4 % 11.10% 12.90%Visiting companies / employers N 8 3 % 9.90% 9.70%Asking for help from friends/relatives N 12 5 % 14.80% 16.10%Asking for help from UNRWA N 40 9 % 49.40% 29.00%Others N 2 0 % 2.50% 0.00%
TotalN
81 31% 100.00% 100.00%
Agriculture/ fishing
Industry/ craftwork
Water/ electricity/
gas
Construction/ public works
Commerce/ trade/
maintenance
Hotels/ restaurants
Communications/ transport
Finance/ real
estate
Pubadminisarmed f
Yes N 4 7 5 47 36 4 5 8% 40.00% 63.60% 50.00% 34.10% 42.90% 44.40% 22.70% 88.90% 42.90%No N 6 4 5 91 48 5 17 1
% 60.00% 36.40% 50.00% 65.90% 57.10% 55.60% 77.30% 11.10% 57.10%Tot N 10 11 10 138 84 9 22 9
% 100.00% 100.00% 100.00% 100.00% 100.00% 100.00% 100.00% 100.00% 100.00%
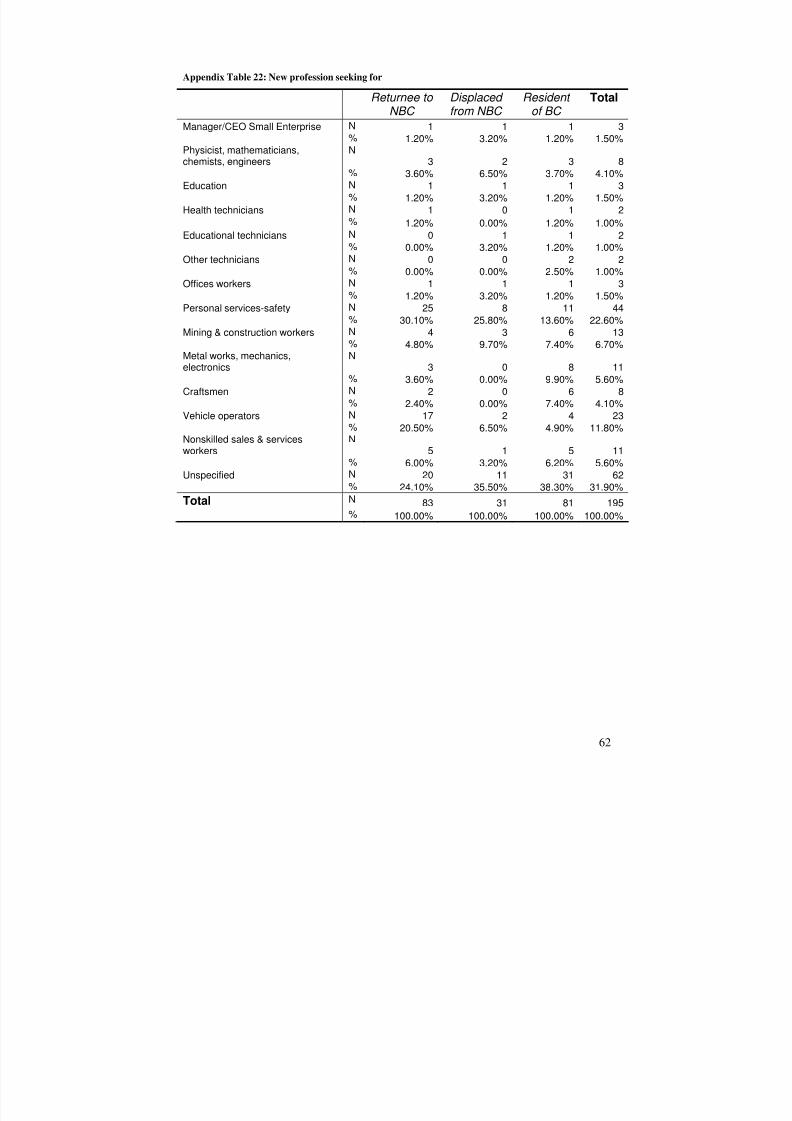
8/8/2019 UNRWA_final_report-Socio-Economic Assessment NBC-Beddawi-Nov08
http://slidepdf.com/reader/full/unrwafinalreport-socio-economic-assessment-nbc-beddawi-nov08 67/78
62
Appendix Table 22: New profession seeking for
Returnee to NBC
Displaced from NBC
Resident of BC
Total
Manager/CEO Small Enterprise N 1 1 1 3 % 1.20% 3.20% 1.20% 1.50%
Physicist, mathematicians,chemists, engineers
N3 2 3 8
% 3.60% 6.50% 3.70% 4.10%Education N 1 1 1 3 % 1.20% 3.20% 1.20% 1.50%Health technicians N 1 0 1 2 % 1.20% 0.00% 1.20% 1.00%Educational technicians N 0 1 1 2 % 0.00% 3.20% 1.20% 1.00%Other technicians N 0 0 2 2 % 0.00% 0.00% 2.50% 1.00%Offices workers N 1 1 1 3 % 1.20% 3.20% 1.20% 1.50%Personal services-safety N 25 8 11 44 % 30.10% 25.80% 13.60% 22.60%Mining & construction workers N 4 3 6 13 % 4.80% 9.70% 7.40% 6.70%Metal works, mechanics,electronics
N3 0 8 11
% 3.60% 0.00% 9.90% 5.60%Craftsmen N 2 0 6 8 % 2.40% 0.00% 7.40% 4.10%Vehicle operators N 17 2 4 23 % 20.50% 6.50% 4.90% 11.80%Nonskilled sales & services
workers
N
5 1 5 11 % 6.00% 3.20% 6.20% 5.60%Unspecified N 20 11 31 62 % 24.10% 35.50% 38.30% 31.90%Total N 83 31 81 195
% 100.00% 100.00% 100.00% 100.00%

8/8/2019 UNRWA_final_report-Socio-Economic Assessment NBC-Beddawi-Nov08
http://slidepdf.com/reader/full/unrwafinalreport-socio-economic-assessment-nbc-beddawi-nov08 68/78
63
Appendix Table 23: Choosing the same field of business
Appendix Table 24: Choosing the same field of business by gender
Male Female TotalYes N 183 12 195
% 69.30% 75.00% 69.60%No N 81 4 85
% 30.70% 25.00% 30.40%Total N 264 16 280
% 100.00% 100.00% 100.00% Appendix Table 25: Choosing the same field of business by marital status
Never been
married
Married Divorced/ separated
Widows Total
Yes N 17 171 2 5 195% 81.00% 69.00% 33.30% 100.00% 69.60%
No N 4 77 4 0 85% 19.00% 31.00% 66.70% 0.00% 30.40%
Total N 21 248 6 5 280% 100.00% 100.00% 100.00% 100.00% 100.00%
Appendix Table 26: Choosing the same field of business by age
[15-19] years
[20-24] years
[25-34] years
[35-44] years
[45-54] years
[55-65] years
>65 years
Total
Yes N 2 5 45 68 49 16 7 192% 100.00% 55.60% 64.30% 73.10% 72.10% 59.30% 87.50% 69.30%
No N 0 4 25 25 19 11 1 85% 0.00% 44.40% 35.70% 26.90% 27.90% 40.70% 12.50% 30.70%
Total N 2 9 70 93 68 27 8 277% 100.00% 100.00% 100.00% 100.00% 100.00% 100.00% 100.00% 100.00%
Returnee to NBC
Displaced from NBC
Resident of BC
Total
Yes N 94 73 31 198% 82.50% 76.00% 41.90% 69.70%
No N 20 23 43 86% 17.50% 24.00% 58.10% 30.30%Total N 114 96 74 284
% 100.00% 100.00% 100.00% 100.00%
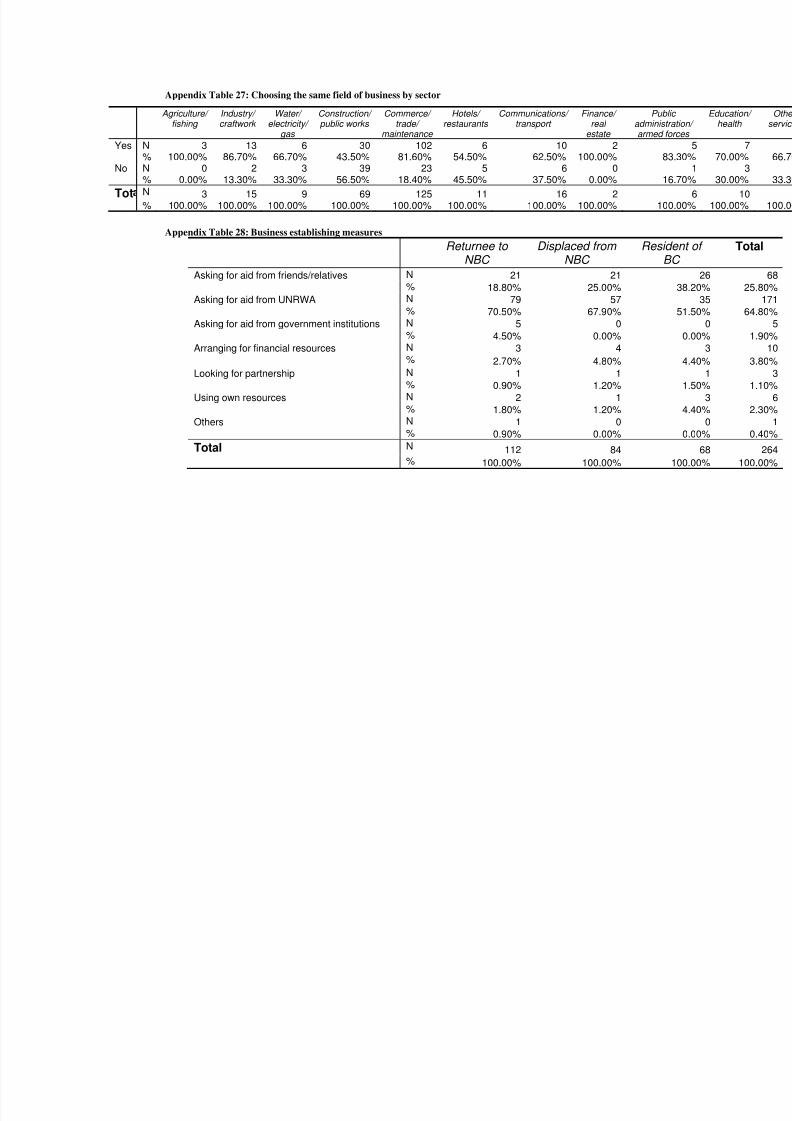
8/8/2019 UNRWA_final_report-Socio-Economic Assessment NBC-Beddawi-Nov08
http://slidepdf.com/reader/full/unrwafinalreport-socio-economic-assessment-nbc-beddawi-nov08 69/78
Appendix Table 27: Choosing the same field of business by sector
Appendix Table 28: Business establishing measures
Returnee to NBC
Displaced from NBC
Resi
Asking for aid from friends/relatives N 21 21 % 18.80% 25.00%
Asking for aid from UNRWA N 79 57 % 70.50% 67.90%Asking for aid from government institutions N 5 0 % 4.50% 0.00%Arranging for financial resources N 3 4 % 2.70% 4.80%Looking for partnership N 1 1 % 0.90% 1.20%Using own resources N 2 1 % 1.80% 1.20%Others N 1 0 % 0.90% 0.00%
TotalN
112 84% 100.00% 100.00%
Agriculture/ fishing
Industry/ craftwork
Water/ electricity/
gas
Construction/ public works
Commerce/ trade/
maintenance
Hotels/ restaurants
Communications/ transport
Finance/ real
estate
Pubadminisarmed f
Yes N 3 13 6 30 102 6 10 2% 100.00% 86.70% 66.70% 43.50% 81.60% 54.50% 62.50% 100.00% 83.30%No N 0 2 3 39 23 5 6 0
% 0.00% 13.30% 33.30% 56.50% 18.40% 45.50% 37.50% 0.00% 16.70%Tot N 3 15 9 69 125 11 16 2
% 100.00% 100.00% 100.00% 100.00% 100.00% 100.00% 100.00% 100.00% 100.00%

8/8/2019 UNRWA_final_report-Socio-Economic Assessment NBC-Beddawi-Nov08
http://slidepdf.com/reader/full/unrwafinalreport-socio-economic-assessment-nbc-beddawi-nov08 70/78
65
Appendix Table 29: New sector seeking for
Appendix Table 30: Assistance needed to restart/ improve the business
Returnee to NBC
Displaced from NBC
Resident of BC
Total
Business management training N 9 4 20 33
% 8.30% 4.80% 31.80% 13.00%Easy access at army checkpoints N 35 20 1 56 % 32.40% 24.10% 1.60% 22.00%Working capital/machinestools/material grants
N42 45 32 119
% 38.90% 54.20% 50.80% 46.90%Access to loans N 22 13 8 43 % 20.40% 15.70% 12.70% 16.90%Others N 0 1 2 3 % 0.00% 1.20% 3.20% 1.20%Total N 108 83 63 254
% 100.00% 100.00% 100.00% 100.00%
Returnee to NBC
Displaced from NBC
Resident of BC
Total
Construction/public works N 0 1 1 2 % 0.00% 7.70% 3.10% 3.30%
Commerce/trade/maintenance N 15 11 28 54 % 100.00% 84.60% 87.50% 90.00%Hotels/restaurants N 0 1 3 4
0.00% 7.70% 9.40% 6.70%Total N 15 13 32 60
% 100.00% 100.00% 100.00% 100.00%

8/8/2019 UNRWA_final_report-Socio-Economic Assessment NBC-Beddawi-Nov08
http://slidepdf.com/reader/full/unrwafinalreport-socio-economic-assessment-nbc-beddawi-nov08 71/78
66
Appendix Table 31: Interested of vocational training
Appendix Table 32: Preferred work location
Returnee to NBC
Displaced from NBC
Resident of BC
Total
In Nahr El-Bared Camp NBC N 366 202 3 571% 68.90% 40.20% 0.60% 37.50%
In Beddawi Camp BC N 8 57 199 264% 1.50% 11.40% 40.70% 17.40%
Vicinity of camps N 11 16 23 50% 2.10% 3.20% 4.70% 3.30%In North Lebanon N 101 160 191 452
% 19.00% 31.90% 39.00% 29.70%Anywhere in Lebanon N 31 37 51 119
% 5.80% 7.40% 10.40% 7.80%Abroad N 14 30 22 66
% 2.60% 6.00% 4.50% 4.30%Total N 531 502 489 1522
% 100.00% 100.00% 100.00% 100.00%
Returnee to NBC
Displaced from NBC
Resident of BC
Total
Yes N 27 53 90 170% 4.60% 8.90% 15.20% 9.60%
No N 561 540 501 1602% 95.40% 91.10% 84.80% 90.40%Total N 588 593 591 1772
% 100.00% 100.00% 100.00% 100.00%
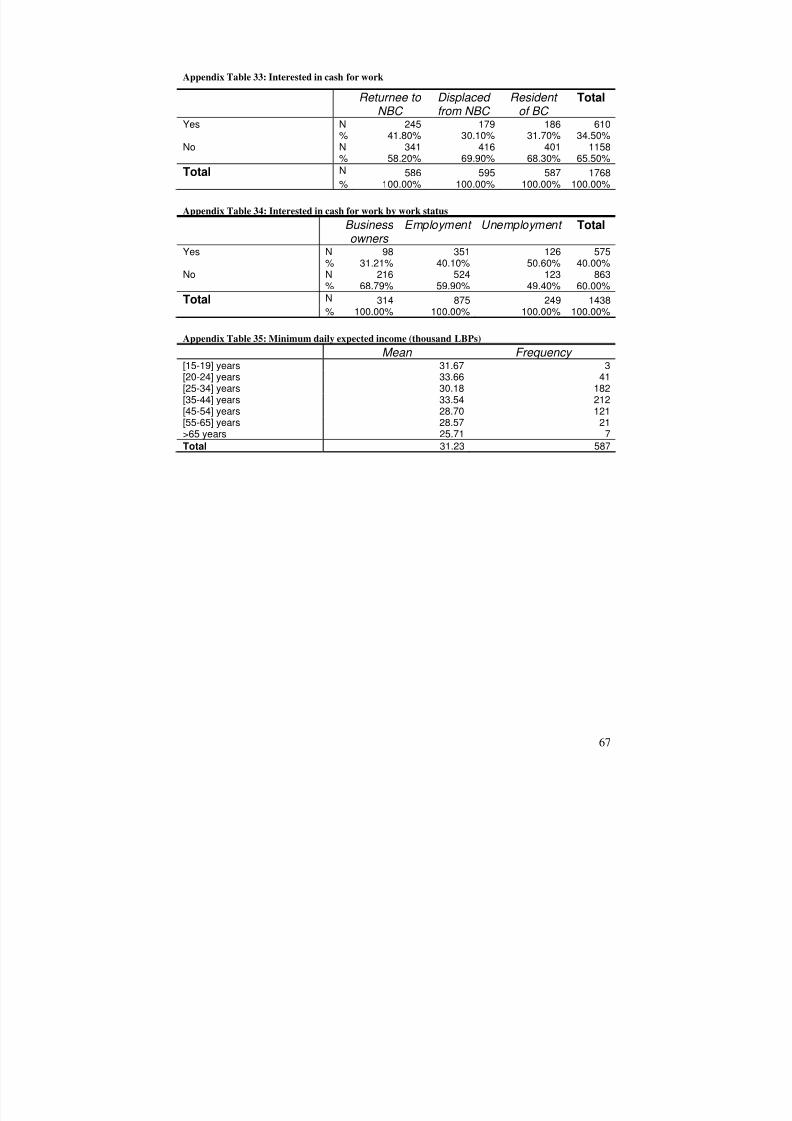
8/8/2019 UNRWA_final_report-Socio-Economic Assessment NBC-Beddawi-Nov08
http://slidepdf.com/reader/full/unrwafinalreport-socio-economic-assessment-nbc-beddawi-nov08 72/78
67
Appendix Table 33: Interested in cash for work
Appendix Table 34: Interested in cash for work by work status
Business owners
Employment Unemployment Total
Yes N 98 351 126 575% 31.21% 40.10% 50.60% 40.00%
No N 216 524 123 863% 68.79% 59.90% 49.40% 60.00%
Total N 314 875 249 1438% 100.00% 100.00% 100.00% 100.00% Appendix Table 35: Minimum daily expected income (thousand LBPs)
Mean Frequency [15-19] years 31.67 3[20-24] years 33.66 41[25-34] years 30.18 182[35-44] years 33.54 212[45-54] years 28.70 121[55-65] years 28.57 21>65 years 25.71 7Total 31.23 587
Returnee to NBC
Displaced from NBC
Resident of BC
Total
Yes N 245 179 186 610% 41.80% 30.10% 31.70% 34.50%
No N 341 416 401 1158% 58.20% 69.90% 68.30% 65.50%Total N 586 595 587 1768
% 100.00% 100.00% 100.00% 100.00%

8/8/2019 UNRWA_final_report-Socio-Economic Assessment NBC-Beddawi-Nov08
http://slidepdf.com/reader/full/unrwafinalreport-socio-economic-assessment-nbc-beddawi-nov08 73/78
68
Appendix Table 36: Interested in micro credit
Returnee to NBC
Displaced from NBC
Resident of BC
Total
Yes N 175 149 164 488% 30.10% 25.30% 27.90% 27.70%
No N 407 441 423 1271% 69.90% 74.70% 72.10% 72.30%
Total N 582 590 587 1759% 100.00% 100.00% 100.00% 100.00%
Appendix Table 37: Interested in micro credit
Business owners
Employee Unemployed Total
Yes N 112 247 81 440% 35.56% 28.50% 32.70% 30.80%
No N 203 619 167 989% 64.44% 71.50% 67.30% 69.20%
Total N 315 866 248 1429% 100.00% 100.00% 100.00% 100.00%
Appendix Table 38: Monthly installment (thousand LBPs)
Mean Frequency Returnee to NBC 131.93 175Still displaced from NBC 138.91 149Resident of BC 107.76 164Total 125.94 488 Appendix Table 39: Duration (Months)
Mean Frequency Returnee to NBC 31 175Still displaced from NBC 29 149Resident of BC 24 164Total 28 488 Appendix Table 40: Monthly installment by work status (thousand LBPs)
Mean Frequency Business owners 146.76 112Employment 120.63 247Unemployment 118.21 81Total 126.83 440 Appendix Table 41: Duration by work status (Months)
Mean Frequency Business owners 27 112Employment 28 247Unemployment 30 81Total 28 440

8/8/2019 UNRWA_final_report-Socio-Economic Assessment NBC-Beddawi-Nov08
http://slidepdf.com/reader/full/unrwafinalreport-socio-economic-assessment-nbc-beddawi-nov08 74/78
Appendix Table 42: Interested in micro credit by sector
Agriculture/ fishing
Industry/ craftwork
Water/ electricity/
gas
Construction/ public works
Commerce/ trade/
maintenance
Hotels/ restaurants
Communications/ transport
Finance/ real
estate
Pubadministarmed f
Yes N 10 30 15 124 138 15 35 8% 38.50% 41.10% 30.60% 27.70% 32.70% 34.10% 43.20% 20.50% 30.20%No N 16 43 34 323 284 29 46 31
% 61.50% 58.90% 69.40% 72.30% 67.30% 65.90% 56.80% 79.50% 69.80%Tot N 26 73 49 447 422 44 81 39
% 100.00% 100.00% 100.00% 100.00% 100.00% 100.00% 100.00% 100.00% 100.00%

8/8/2019 UNRWA_final_report-Socio-Economic Assessment NBC-Beddawi-Nov08
http://slidepdf.com/reader/full/unrwafinalreport-socio-economic-assessment-nbc-beddawi-nov08 75/78
70
Appendix Table 43: Current status of work premises
Appendix Table 44: Pre-status of work premises
Returnee to NBC
Displaced from NBC
Resident of BC
Total
No longer a business owner N 10 2 2 14% 4.90% 1.10% 1.70% 2.80%
Rented N 77 60 58 195% 37.90% 32.80% 49.60% 38.80%
Mobile N 25 18 14 57% 12.30% 9.80% 12.00% 11.30%
Owned N 79 97 39 215% 38.90% 53.00% 33.30% 42.70%
Other N 12 6 4 22% 5.90% 3.30% 3.40% 4.40%
Total N 203 183 117 503% 100.00% 100.00% 100.00% 100.00%
Appendix Table 45: War impact on work premises
Returnee to NBC
Displaced from NBC
Resident of BC
Total
No damages whatsoever N 15 22 114 151% 7.60% 12.00% 97.40% 30.30%
Some minor damages N 6 7 0 13% 3.00% 3.80% 0.00% 2.60%
Heavy damages N 22 9 1 32% 11.10% 4.90% 0.90% 6.40%
Partial destruction N 14 3 1 18% 7.10% 1.60% 0.90% 3.60%
Complete destruction N 135 140 0 275% 68.20% 76.10% 0.00% 55.10%
Was not a business owner 6 3 1 103.00% 1.60% 0.90% 2.00%
Total N 198 184 117 499% 100.00% 100.00% 100.00% 100.00%
Returnee to NBC
Displaced from NBC
Resident of BC
Total
No longer a business owner N 82 94 4 180% 40.80% 51.10% 3.40% 35.90%
Rented N 68 43 58 169% 33.80% 23.40% 50.00% 33.70%Mobile N 24 18 13 55
% 11.90% 9.80% 11.20% 11.00%Owned N 16 24 37 77
% 8.00% 13.00% 31.90% 15.40%Other N 11 5 4 20
% 5.50% 2.70% 3.40% 4.00%Total N 201 184 116 501
% 100.00% 100.00% 100.00% 100.00%

8/8/2019 UNRWA_final_report-Socio-Economic Assessment NBC-Beddawi-Nov08
http://slidepdf.com/reader/full/unrwafinalreport-socio-economic-assessment-nbc-beddawi-nov08 76/78
71
Appendix Table 46: War impact on business activity
Returnee to NBC
Displaced from NBC
Resident of BC
Total
Completely closed N 145 137 17 299% 81.00% 75.70% 14.50% 62.70%
Interruption of supply chain N 112 116 21 249% 65.50% 64.10% 17.90% 53.10%
Loss of clients N 145 148 43 336% 81.50% 81.80% 36.80% 70.60%
Increased commodity prices N 118 125 48 291% 68.60% 69.10% 40.70% 61.80%
Others N 38 48 3 89% 29.90% 34.00% 2.80% 23.70%
Appendix Table 47: War impact on productive assets: Vehicles
Returnee to NBC
Displaced from NBC
Resident of BC
Total
Total loss N 108 66 1 175% 61.40% 38.20% 0.90% 38.40%
Partial loss N 14 3 2 19% 8.00% 1.70% 1.90% 4.20%
No loss N 54 104 104 262% 30.70% 60.10% 97.20% 57.50%
Total N 176 173 107 456% 100.00% 100.00% 100.00% 100.00%
Appendix Table 48: War impact on productive assets: Machines/generators
Returnee to NBC
Displaced from NBC
Resident of BC
Total
Total loss N 123 109 0 232% 69.90% 63.00% 0.00% 50.90%Partial loss N 10 6 3 19
% 5.70% 3.50% 2.80% 4.20%No loss N 43 58 104 205
% 24.40% 33.50% 97.20% 45.00%Total N 176 173 107 456
% 100.00% 100.00% 100.00% 100.00% Appendix Table 49: War impact on productive assets: Tools
Returnee to NBC
Displaced from NBC
Resident of BC
Total
Total loss N 133 125 0 258% 73.50% 72.30% 0.00% 56.00%Partial loss N 10 3 3 16
% 5.50% 1.70% 2.80% 3.50%No loss N 38 45 104 187
% 21.00% 26.00% 97.20% 40.60%Total N 181 173 107 461
% 100.00% 100.00% 100.00% 100.00%

8/8/2019 UNRWA_final_report-Socio-Economic Assessment NBC-Beddawi-Nov08
http://slidepdf.com/reader/full/unrwafinalreport-socio-economic-assessment-nbc-beddawi-nov08 77/78
72
Appendix Table 50: War impact on productive assets: Raw materials
Returnee to NBC
Displaced from NBC
Resident of BC
Total
Total loss N 97 94 1 192% 55.70% 54.30% 0.90% 42.30%
Partial loss N 10 6 4 20% 5.70% 3.50% 3.70% 4.40%
No loss N 67 73 102 242% 38.50% 42.20% 95.30% 53.30%
Total N 174 173 107 454% 100.00% 100.00% 100.00% 100.00%
Appendix Table 51: War impact on productive assets: Goods stocks
Returnee to NBC
Displaced from NBC
Resident of BC
Total
Total loss N 131 128 2 261% 72.40% 74.00% 1.90% 56.60%
Partial loss N 6 3 4 13
% 3.30% 1.70% 3.70% 2.80%No loss N 44 42 101 187
% 24.30% 24.30% 94.40% 40.60%Total N 181 173 107 461
% 100.00% 100.00% 100.00% 100.00% Appendix Table 52: Business success perception
Returnee to NBC
Displaced from NBC
Resident of BC
Total
After crisis N 2.411 2.969 3.381 2.893Prior to crisis N 5.160 5.061 4.172 4.886 Appendix Table 53: Current Lebanese contribution to the activity
Returnee to NBC
Displaced from NBC
Resident of BC
Total
Frequent N 9 17 21 47% 4.50% 9.40% 18.10% 9.50%
Normal N 17 16 26 59% 8.50% 8.80% 22.40% 11.90%
Infrequent N 22 22 27 71% 11.00% 12.20% 23.30% 14.30%
None N 65 38 36 139% 32.50% 21.00% 31.00% 28.00%
Business closed N 87 88 6 18143.50% 48.60% 5.20% 36.40%
Total N 200 181 116 497% 100.00% 100.00% 100.00% 100.00%

8/8/2019 UNRWA_final_report-Socio-Economic Assessment NBC-Beddawi-Nov08
http://slidepdf.com/reader/full/unrwafinalreport-socio-economic-assessment-nbc-beddawi-nov08 78/78
Appendix Table 54: Pre-Lebanese contribution to the activity
Returnee to NBC
Displaced from NBC
Resident of BC
Total
Frequent N 100 101 35 236% 50.00% 55.50% 30.70% 47.60%
Normal N 48 38 32 118% 24.00% 20.90% 28.10% 23.80%
Infrequent N 13 16 17 46% 6.50% 8.80% 14.90% 9.30%
None N 27 23 27 77% 13.50% 12.60% 23.70% 15.50%
Was not a business owner N 12 4 3 196.00% 2.20% 2.60% 3.80%
Total N 200 182 114 496% 100.00% 100.00% 100.00% 100.00%


![Nmj Nov08[2]](https://img.pdfslide.us/doc/110x75/557a8b8fd8b42ac8638b4d86/nmj-nov082.jpg)


![Jaiib Bookkeeping Nov08[1]](https://img.pdfslide.us/doc/110x75/577d29501a28ab4e1ea671fb/jaiib-bookkeeping-nov081.jpg)
