Embed Size (px)
DESCRIPTION
Unraveling HESS J1745-303 with new results from the Fermi-LAT telescope. G.A. Caliandro 1 , L. Falletti 2 , J. Cohen-Tanugi 2 and E. Nuss 2 on behalf of the Fermi LAT Collaboration and the Pulsar Timing Consortium 1 Institut de Ciències de l'Espai (IEEC-CSIC) - PowerPoint PPT Presentation
Citation preview

G.Andrea Caliandro – CRISM 2011 1
G.A. Caliandro1, L. Falletti2, J. Cohen-Tanugi2 and E. Nuss2 on behalf of the Fermi LAT Collaboration and the Pulsar Timing Consortium
1Institut de Ciències de l'Espai (IEEC-CSIC)2LUPM – Université Montpellier 2 / CNRS-IN2P3
Unraveling HESS J1745-303 with new results
from the Fermi-LAT telescope

G.Andrea Caliandro – CRISM 2011 2
HESS J1745-303
• HESS J1745-303 is classified as unidentified extended source
• Very complex morphology, which presents 3 identified emission regions (A, B, and C)
– Not well understood yet whether the emission is composed of different or a single source
– Similar spectral indices have been found for the three peaks in the VHE range
Full emission Region A
3EG J1744-3011
F. Aharonian et al., A&A 483, 509–517 (2008)
• VHE counterpart candidates: – SNR G359.1-0.5– SNR G359.0-0.9– PSR J1747-2958– PSR B1742-30
G.Andrea Caliandro – CRISM 2011 3
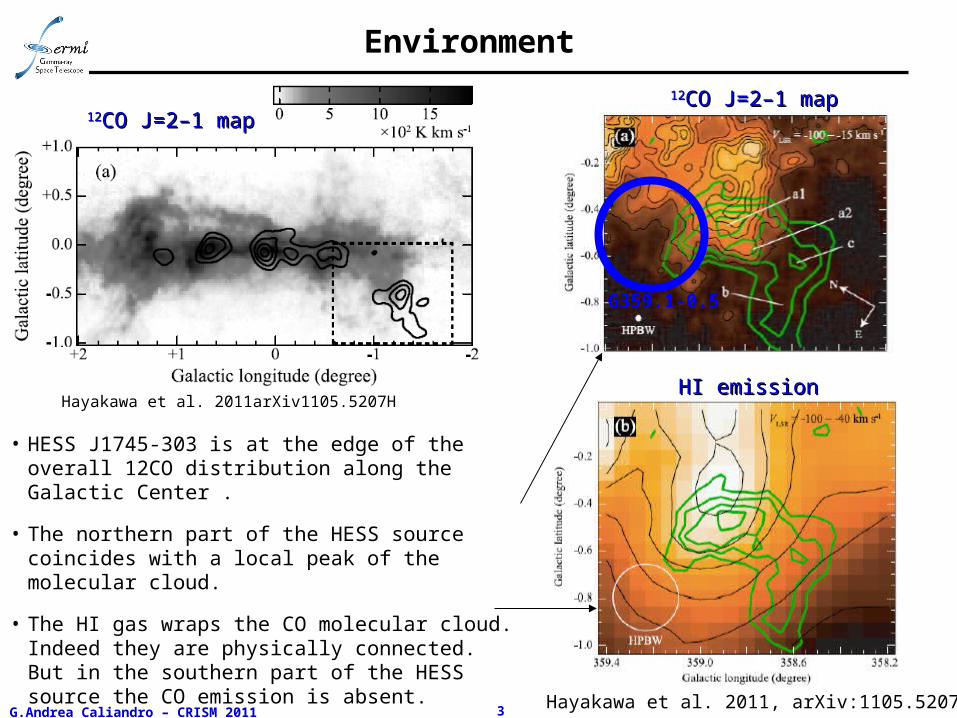
Environment
• HESS J1745-303 is at the edge of the overall 12CO distribution along the Galactic Center .
• The northern part of the HESS source coincides with a local peak of the molecular cloud.
• The HI gas wraps the CO molecular cloud. Indeed they are physically connected. But in the southern part of the HESS source the CO emission is absent.
Hayakawa et al. 2011arXiv1105.5207H
1212CO J=2–1 mapCO J=2–1 map
HI emissionHI emission
1212CO J=2–1 mapCO J=2–1 map
G359.1-0.5
Hayakawa et al. 2011, arXiv:1105.5207
G.Andrea Caliandro – CRISM 2011 4
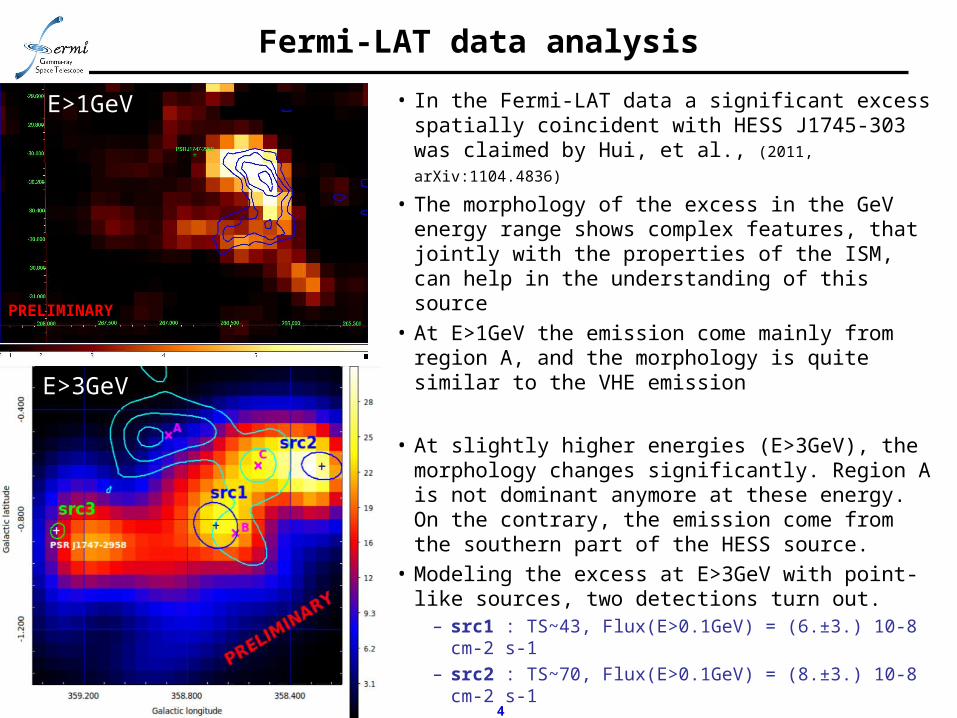
Fermi-LAT data analysis
• In the Fermi-LAT data a significant excess spatially coincident with HESS J1745-303 was claimed by Hui, et al., (2011, arXiv:1104.4836)
• The morphology of the excess in the GeV energy range shows complex features, that jointly with the properties of the ISM, can help in the understanding of this source
• At E>1GeV the emission come mainly from region A, and the morphology is quite similar to the VHE emission
• At slightly higher energies (E>3GeV), the morphology changes significantly. Region A is not dominant anymore at these energy. On the contrary, the emission come from the southern part of the HESS source.
• Modeling the excess at E>3GeV with point-like sources, two detections turn out.
– src1 : TS~43, Flux(E>0.1GeV) = (6.±3.) 10-8 cm-2 s-1
– src2 : TS~70, Flux(E>0.1GeV) = (8.±3.) 10-8 cm-2 s-1
PRELIMINARYPRELIMINARY
E>1GeV
E>3GeV
G.Andrea Caliandro – CRISM 2011 5
Summary
• A significant excess observed by Fermi-LAT is spatially coincident with HESS J1745-303. We studied the morphology of this excess, discovering that at high energies (E>3GeV) the emission is near the regions B, and C, while at lower energy the emission is close to region A, where the VHE gamma rays are dominant.
• The Fermi-LAT results, with the CO and HI maps, strongly point toward a different nature of the emission coming from region A, with respect to regions B and C.
• Further in-depth analyses are on-going within the Fermi-LAT collaboration to fully characterize the GeV emission spatially coincident with HESS J1745-303, especially with respect to region A.
G.Andrea Caliandro – CRISM 2011 6
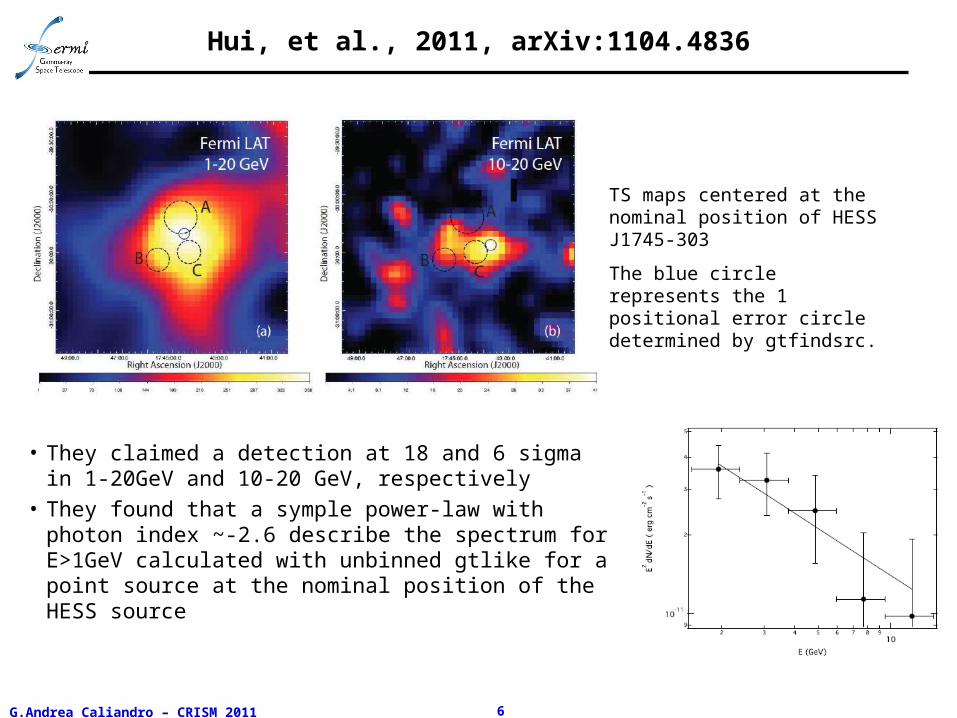
Hui, et al., 2011, arXiv:1104.4836
• They claimed a detection at 18 and 6 sigma in 1-20GeV and 10-20 GeV, respectively
• They found that a symple power-law with photon index ~-2.6 describe the spectrum for E>1GeV calculated with unbinned gtlike for a point source at the nominal position of the HESS source
TS maps centered at the nominal position of HESS J1745-303
The blue circle represents the 1 positional error circle determined by gtfindsrc.
G.Andrea Caliandro – CRISM 2011 7
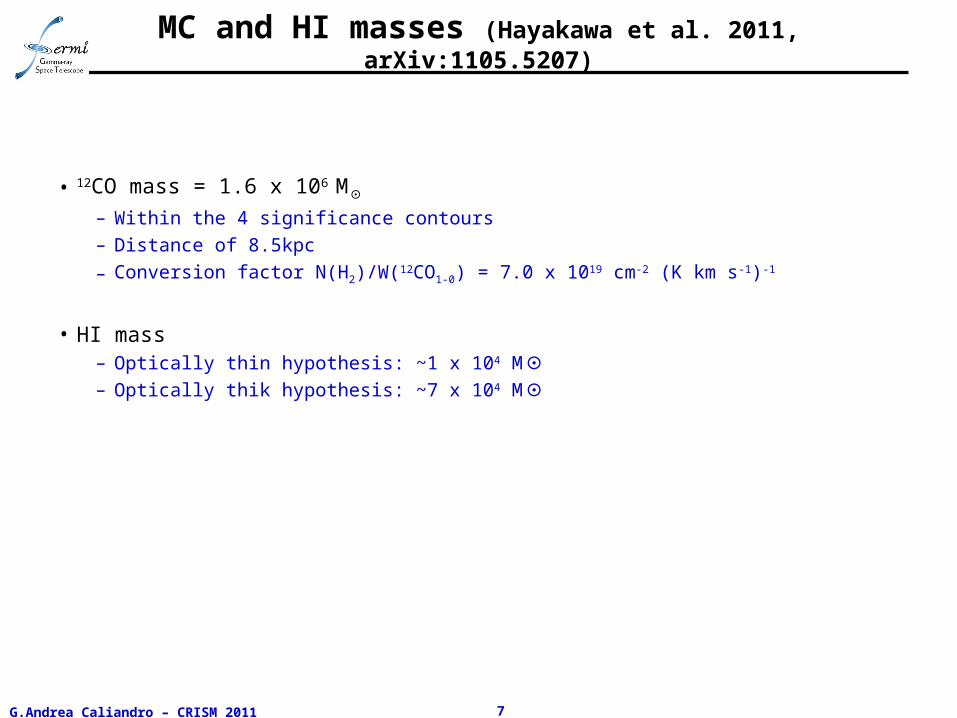
MC and HI masses (Hayakawa et al. 2011, arXiv:1105.5207)
• 12CO mass = 1.6 x 10⁶ M⊙
– Within the 4 significance contours– Distance of 8.5kpc
– Conversion factor N(H2)/W(12CO1-0) = 7.0 x 1019 cm-2 (K km s-1)-1
• HI mass – Optically thin hypothesis: ~1 x 10⁴ M⊙– Optically thik hypothesis: ~7 x 10⁴ M⊙