Embed Size (px)
Citation preview
Brain, Behavior, and Immunity 52 (2016) 132–144
Contents lists available at ScienceDirect
Brain, Behavior, and Immunity
journal homepage: www.elsevier .com/locate /ybrbi
Unraveling cognitive traits using the Morris water maze unbiasedstrategy classification (MUST-C) algorithm
http://dx.doi.org/10.1016/j.bbi.2015.10.0130889-1591/� 2015 The Authors. Published by Elsevier Inc.This is an open access article under the CC BY-NC-ND license (http://creativecommons.org/licenses/by-nc-nd/4.0/).
⇑ Corresponding author at: The Leslie and Susan Gonda Multidisciplinary BrainResearch Center, The Mina and Everard Goodman Faculty of Life Sciences, Building901, Room 312, Bar-Ilan University, Ramat Gan 5290002, Israel.
E-mail address: [email protected] (E. Okun).
Tomer Illouz a,b, Ravit Madar a,b, Yoram Louzon b,c, Kathleen J. Griffioen d, Eitan Okun a,b,⇑a The Mina and Everard Goodman Faculty of Life Sciences, Bar-Ilan University, Ramat Gan 5290002, Israelb The Leslie and Susan Gonda Multidisciplinary Brain Research Center, Bar-Ilan University, Ramat Gan 5290002, IsraelcDepartment of Mathematics, Bar-Ilan University, Ramat Gan 5290002, IsraeldDepartment of Biology and Chemistry, Liberty University, Lynchburg, VA 24515, USA
a r t i c l e i n f o a b s t r a c t
Article history:Received 8 September 2015Received in revised form 22 October 2015Accepted 22 October 2015Available online 24 October 2015
Keywords:Morris water mazeLearning and memorySpatial learningHippocampusSVMMachine learningStrategySpatial resolutionCognitive score
The assessment of spatial cognitive learning in rodents is a central approach in neuroscience, as it enablesone to assess and quantify the effects of treatments and genetic manipulations from a broad perspective.Although the Morris water maze (MWM) is a well-validated paradigm for testing spatial learning abili-ties, manual categorization of performance in the MWM into behavioral strategies is subject to individualinterpretation, and thus to biases. Here we offer a support vector machine (SVM) – based, automated,MWM unbiased strategy classification (MUST-C) algorithm, as well as a cognitive score scale. This modelwas examined and validated by analyzing data obtained from five MWM experiments with changingplatform sizes, revealing a limitation in the spatial capacity of the hippocampus. We have furtheremployed this algorithm to extract novel mechanistic insights on the impact of members of theToll-like receptor pathway on cognitive spatial learning and memory. The MUST-C algorithm can greatlybenefit MWM users as it provides a standardized method of strategy classification as well as a cognitivescoring scale, which cannot be derived from typical analysis of MWM data.
� 2015 The Authors. Published by Elsevier Inc. This is an open access article under the CC BY-NC-NDlicense (http://creativecommons.org/licenses/by-nc-nd/4.0/).
1. Introduction
Increasingly sophisticated and precise molecular genetic toolsare applied in rodents in general, and mice in particular, to studythe mechanisms underlying cognitive spatial learning and mem-ory. Several tasks that assess cognitive spatial memory weredescribed in the early 1980’s and have been heavily used since.Of the behavioral tests conceived to date, the Morris water maze(MWM) described by Richard Morris (Morris, 1984) is the mostwidely used paradigm for assessing spatial learning in rodents(Vorhees and Williams, 2006). The convenient and robust natureof the MWM has facilitated the investigation of spatial learningin both control and disease states. For example, assessing spatiallearning using the MWM has important implications for manypathologies in which learning is impaired such as aging (Krauseet al., 2008) and Alzheimer’s disease (AD) (Puzzo et al., 2014).The MWM also has advantages in assessing improvements in spa-tial capacity, such as following enriched environment (Bonaccorsi
et al., 2013), caloric restriction (Ma et al., 2014), or exercise(Inoue et al., 2015). To demonstrate the relevance of this task tohuman studies, variants of the MWM task were also successfullyreplicated with human subjects (Gazova et al., 2013).
In theMWM, rodents are trained to find a platformhidden underthe surface of an opaque water pool by relying on extra-maze cues(Sharmaet al., 2010). Performance in this task relies onhippocampalplace cells, validating its use as a task for spatial learning (Redish andTouretzky, 1998). The spatial capacity of themice is then quantifiedusing specific parameters such as the latency to reach the platform,swim distance, mean distance from the platform, and path effi-ciency. Additional attributes are typically used to control for the ani-mal’s behavior in the pool, such as immobility and swim speed.Performance in behavioral tasks used to assess spatial learningand memory, however, can be influenced by various non-cognitiveor non-spatial phenomena. These phenomena can result frommuta-tions that may or may not be related to the process of hippocampalmemory formation (Wolfer and Lipp, 2000). Both cognitive andnon-cognitive phenomena present as characteristic swim strategies,including changes to swim speed, path efficiency, duration, andbody rotations. The specific combination of strategies employed bythemice are often considered representative of the level of cognitive
T. Illouz et al. / Brain, Behavior, and Immunity 52 (2016) 132–144 133
resources being used for the task (Graziano et al., 2003). However,despite thorough assessment of swim parameters, non-spatialsearch strategies can increase in efficiency over time, resulting in adecreased latency to reach the hidden platform. Moreover, simplequantification of latency, swim speed, swim distance and otherparameters describing performance in theMWMoften result in onlya partial understanding ofmouse behavior and cognitive capacity. Inorder to avoid such erroneous or incomplete interpretation ofbehavioral data in the MWM, several attempts have been made todevelop an unbiased automatic tool for spatial swim strategy dis-crimination (Brown, 2012; Dalm et al., 2000). However, these algo-rithms require some prior knowledge of the animal behavior andintimate familiarization with the task.
We have previously conducted manual assessments of mousestrategies in MWM experiments used to characterize the cognitivecapacity of various transgenic mice (Barak et al., 2013; Okun et al.,2010). Such manual assessments however, are time-consuming,and different experimental conditions affect swimming attributesin the pool, hindering cross-experiment analysis of mouse behav-ior. Moreover, manual assessments are prone to experimenter-bias in analysis. Thus, manual assessment fails to reliably detectimportant aspects of cognitive spatial behavior in the MWM, dueto reduced sensitivity to nuances, bias, and environmental factors.
For these reasons, we constructed the MWM unbiased strategyclassification (MUST-C) tool, an automatic classification algorithmfor the analysis of mouse behavior. In order to validate and assessthe sensitivity of this algorithm, we have compared performance ofmice in a 150 cm diameter MWM pool. In order to assess the sen-sitivity of this algorithm in different spatial resolutions, we utilized5 different square platform sizes, which represent a wide range ofspatial resolutions. Here we show that a 5 � 5 cm platform is thesmallest platform that enables spatial learning, and demonstratea limit on the cognitive capacity of spatial learning in mice. Fur-ther, we present a tool that uses generic features of the mouseswim path to enable unbiased analysis of spatial learning strate-gies, and present a cognitive scoring scale based on the spatiallearning strategy used by the mice. Finally, we show that MUST-C is effective in analyzing and reinforcing known data in toll-likereceptor (TLR) 2, 3 and 4�/� mice, and provide novel insights onthe spatial capacity of mice deficient for interferon regulatory fac-tor (IRF)3, a signaling mediator for TLR3. Thus, MUST-C providesunbiased analysis of MWM results, and extends the capacity ofresearchers to understand the mechanisms of various interven-tions on spatial learning and memory in rodents.
2. Materials and methods
2.1. Animals
Congenic male C57bl/6 mice (n = 15 in each experimentalgroup) were purchased from Jackson Laboratories (Bar Harbor,ME). IRF3�/� mice generated by Sato et al. (Sato et al., 2000) ona C57bl/6 genetic background and their respective wild type(WT) strain (IRF3+/+) were generously provided by Dr. MichaelDiamond at Washington University. Animals were housed in areversed 12:12hr cycle to enable cognitive assessment during theanimals’ activity period. Animal care and experimental proceduresfollowed Bar Ilan University guidelines and were approved by theBar Ilan University Animal Care and Use Committee.
2.2. Morris water maze (MWM)
To evaluate spatial learning and memory, mice were tested inthe MWM at the age of 2 months. To test for spatial referencememory, mice were trained in a water-filled pool (150 cm in
diameter) and were given 4 trials per day for 6–13 consecutivedays. Training length was determined by the animal’s ability toreach optimal latency for 2 consecutive days. During tests, animalswere provided with spatial cues on the walls of the room. LCDcomputer screens (15inch) presented extra-maze cues on eachwall around the pool. Black and white cues were used to reducepossible effects of color discrimination differences in the mice. Fivesquare platforms were evaluated; 14 � 14 cm (196 cm2 area),12 � 12 cm (144 cm2 area), 8 � 8 cm (64 cm2 area), 5 � 5 (25 cm2
area) and 3 � 3 cm (9 cm2 area). The surface area of the platformswas 1.1%, 0.82%, 0.36%, 0.14% and 0.051%, respectively, of the totalsurface area of the pool. All experiments that included transgenicmice used the 14 � 14 cm platform. Prior to spatial learning, micewere subjected to a 3-day visible platform MWM variant, in whichmice were given 4 trials of 60 s to locate a visible platform with adistinct flag. The aim of the visible platform test was to excludemice with visual or motivational impairments, as well as to habit-uate them to the testing conditions. Following the visible platform,mice were tested with a hidden platform MWM task. In this phase,a fixed platform was hidden 0.5 cm below the water surface. Plat-form location was 25 cm from the pool wall and was not alteredthroughout the experiment. The entrance point into the mazewas changed every trial to avoid track memorization. At the endof the trial, either when the mouse had found the platform or when90 s had elapsed, mice were allowed to rest on the platform for60 s. Latency to reach the platform, swimming distance, swimmingspeed and mean distance from the platform were automaticallycalculated by the video tracking system (ANY-maze, Stoelting Co,Wood Dale, IL, USA). Twenty-four hours following training, micewere subjected to a probe test to evaluate memory retention. Inthis test, the platform was removed and mice were allowed toswim for 60 s. The time spent in each quadrant was measured.To test for spatial working memory, mice were tested in a similarformat as the reference memory variant, except that the locationof the hidden platform was changed every day. All tests were con-ducted under illumination conditions of 20 lux to reduce stress tothe mice. Water temperature was maintained at 27 ± 0.5 �C andwas made opaque using nontoxic white paint.
2.3. Support vector machine
Support vector machine (SVM) (Boser et al., 1992; Vapnik,1998) is a supervised learning classification technique. It has astrong theoretical basis and has been proven to be successful innumerous classification tasks from handwritten digit recognitionto bioinformatics (Osuna et al., 1997; Tong and Koller, 2002). Lin-ear SVM separates a binary-labeled training data set by a hyperplane (decision boundary) that maximizes the margin betweenthe two classes (Furey et al., 2000). A test set point is thereforelabeled according to its location in the feature space, relative tothe decision boundary. SVM is a kernel machine, and observationscan be projected by a kernel operator into a higher dimension (fea-ture space), in which the classifier is linear. The kernel functionused in this study is the radial basis function. We used the MATLABSVM function (The MathWorks, Inc., Natick, Massachusetts, UnitedStates) in this classifier.
Our Training set contains over 800 labeled trials, which includenine possible strategies. Input is generated by video tracking soft-ware (ANY-maze, Stoelting Co, Wood Dale, IL, USA) and contains acomputer-graphic X, Y coordinate of the animal’s center-point orhead location according to the user’s preference. Animal coordi-nates are converted into Cartesian coordinates to extract a set of11 factors (Table 1) such as trial duration, total distance, absoluteangles and path efficiency (PE, calculated as the distance betweenthe first and last locations divided by the total distance). All data
Table 1Features extracted from the X, Y coordinates of the animal’s location in the MWM pool.
Feature Calculation Expression
Duration Length of the x coordinates vector divided by the samplingfrequency
Duration ¼ lengthð�XÞsf
Distance traveled Sum of the Euclidean distance between each pair ofsequential locations
Distance ¼ PlengthðxÞi¼1
ffiffiffiffiffiffiffiffiffiffiffiffiffiffiffiffiffiffiffiffiffiffiffiffiffiffiffiffiffiffiffiffiffiffiffiffiffiffiffiffiffiffiffiffiffiffiffiffiffiffiffiffiffiffiðxiþ1 � xiÞ2 þ ðyiþ1 � yiÞ2
qMean speed Total distance divided by duration Velocity ¼ distanceðdi ;diþ1Þ
timeðdi ;diþ1ÞPath efficiency Euclidean distance between the starting point and final
point divided by the total distance traveledPE ¼
ffiffiffiffiffiffiffiffiffiffiffiffiffiffiffiffiffiffiffiffiffiffiffiffiffiffiffiffiffiffiffiffiffiffiffiffiðxend�x1Þ2þðyend�y1Þ2
pPlengthð�XÞi¼1
ffiffiffiffiffiffiffiffiffiffiffiffiffiffiffiffiffiffiffiffiffiffiffiffiffiffiffiffiffiffiffiffiffiffiðxiþ1�xiÞ2þðyiþ1�yiÞ2
p
Sum of absolute angles Sum of angles between pairs of sequential vectors SAA ¼ Parccos ð <�u;�v>
jj�ujj�jj�vjjÞ; �u; �v 2 sequencial vectors
Sum of relative angles Movements towards the positive x axis are mark positively;movements towards the negative x axis are markednegatively
SRA ¼ P þ arccosð <�u;�v>jj�ujj�jj�vjjÞ; x�u < x�v
� arccosð <�u;�v>jj�ujj�jj�vjjÞ; x�u > x�v
(
Mean distance fromperimeter
Mean distance to the closest point on the pool’s perimeter Mean distance from perimeter ¼P
ðEuclideanð½xi ;yi �;½xperi ;yperi �ÞÞlengthð�XÞ
Variance of distancefrom perimeter
Variance of distance from the pool’s perimeter Variance distance from perimeter ¼ varð�dÞ; �d ¼ Euclideanð½xi; yi�; ½xperi ; yperi�Þ
Number of circularmovements
Number of serial movements between adjacent quadrant of the pool
Location density Mean distance between all pairs of locations in the trial LD ¼P
Euclideanð½xi ;yi �;½xj ;yj �Þlengthð�XÞ
2
� �Maximal time at one
quadrantMaximal time spent in a single quadrant (%) MQ ¼ max time in qi
duration
h i; qi is a specific quadrant
Mean distance fromplatform (probeanalysis)
Mean of Euclidean distances from all positions to theplatform
MDP ¼P
Euclideanð½xi ;yi �;½xplat ;yplat �Þlengthð�XÞ
Variance of distancefrom platform (probeanalysis)
Variance of the vector of Euclidean distances from allpositions to the platform
VDP ¼ varð�dÞ; �d ¼ Euclideanð½xi; yi�; ½xplat; yplat�Þ
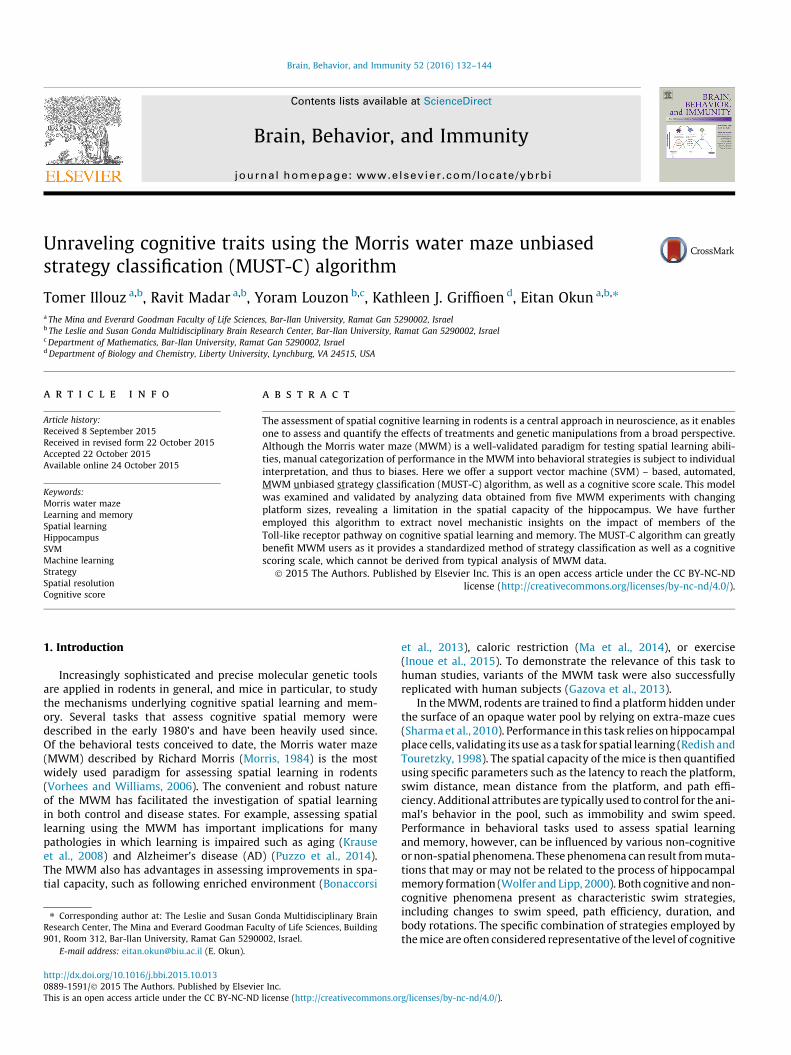
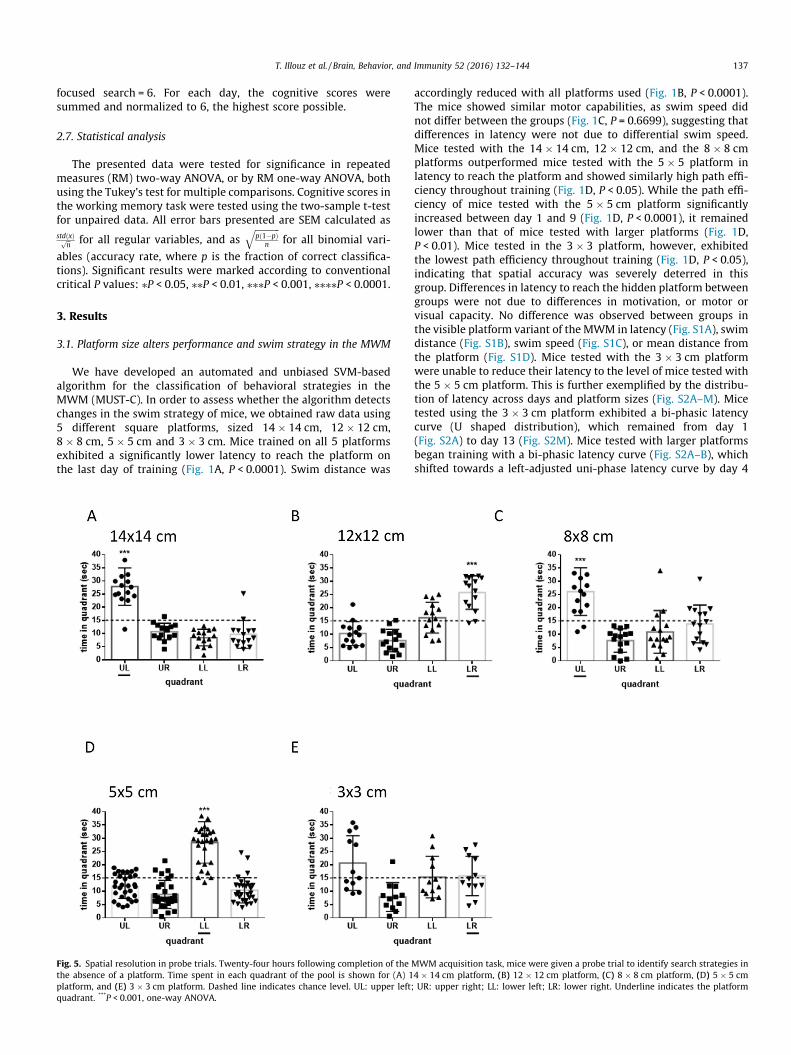
Fig. 1. Platform size alters performance in the MWM. Mice (n = 15 per experimental group) were tested in the MWM. Mice were trained on the task until optimalperformance was maintained for 2 consecutive days, measured by latency to reach the platform. The following parameters were measured: (A) latency to reach the platform,***P < 0.001, ****P < 0.0001 (B) swim distance, **P < 0.01, ****P < 0.0001 (C) swim speed, and (D) path efficiency, *P < 0.05, ****P < 0.0001. Two-way ANOVA repeated measures,two-way RM ANOVA.
134 T. Illouz et al. / Brain, Behavior, and Immunity 52 (2016) 132–144
T. Illouz et al. / Brain, Behavior, and Immunity 52 (2016) 132–144 135
was normalized using the Z-score method (X0!
¼ X�Eð~XÞstdð~XÞ , where ~X is a
vector of a single factors).
2.4. Multi-class classification
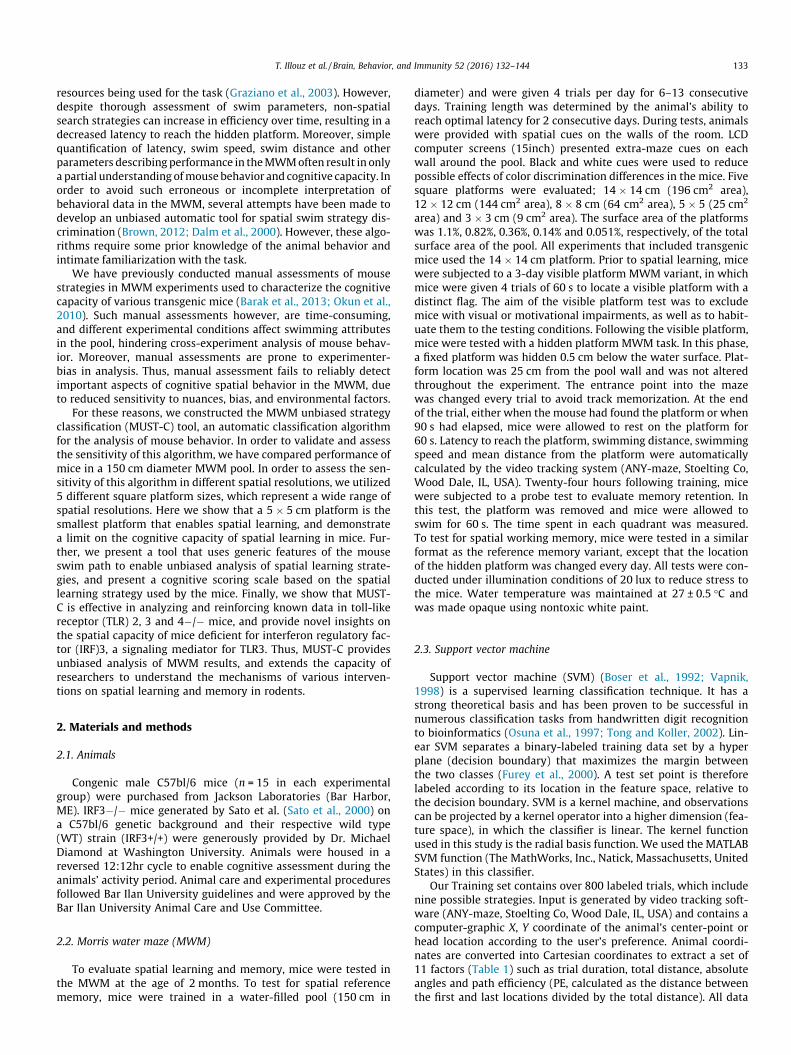
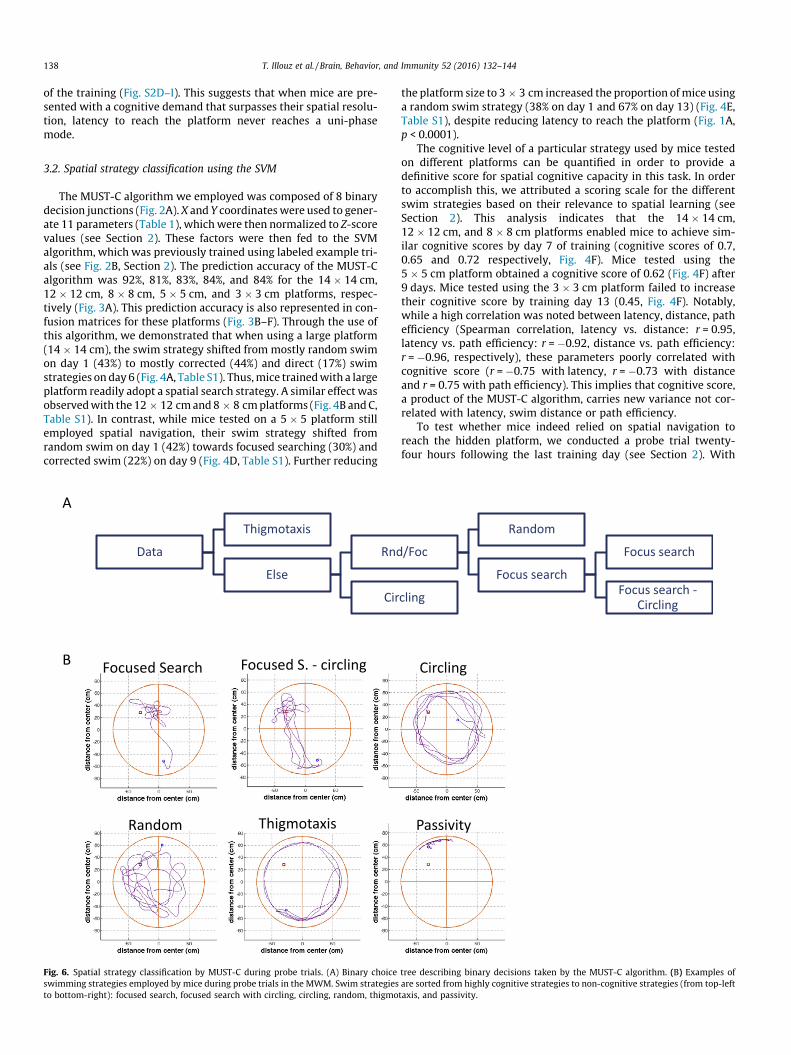
In order to categorize data into multiple classes, we performed aseries of hierarchically ordered binary decisions (Fig. 2A) to sepa-rate the data into one of several subclasses. The hierarchical treewas built according to the theoretical basis of each strategy.Related strategies are located closely in the tree, for example, directswim and corrected swim are both highly cognitive strategies andtherefore located at the same branch. However, they are also basedon the strategy’s actual features, for example, although accidentalcircling is theoretically related to circling, it was located near cor-rected swim due to its short duration. At each decision junction,the relevant features were selected in the same manner. In general,at the first layers, more general features were used, such as triallength to separate the data into short or long trials. At deeper layers,each decision was made by a different set of finer features relevantto the theoretical basis and actual characteristics of the junction,such as number of circles to separate circling from random swim.This type of hierarchical architecture is helpful when dealing withmultiple classes, although a mistake made in the first junction can-not be corrected. Classification of the probe trials was performed
Data
Short trialsDirect
IndirectC
C
Long trialsPassivity
Ac�ve
A
B Direct Corrected Focused
Chaining Random Thigm
Fig. 2. Spatial strategy classification by MUST-C during task learning. (A) Binary choicstrategies employed by mice in the MWM are sorted from highly cognitive strategies tosearch, circling, accidental circling, chaining, random, thigmotaxis, and passivity.
similarly, though due to a different set of strategies in the probetests (Table 1), some extracted features were different. We vali-dated this model by testing over 1000 labeled trials from 5experiments with 5 different platform sizes, and obtained highlysimilar success percentages (see Section 3). This suggests that wedid not over-fit the extracted features to a specific experiment,but rather selected spatial theory-derived generic features.
2.5. Prediction accuracy
Prediction accuracy of the MUST-C algorithm for both trainingand probe trials was compared to a consensus of trials pre-labeled by 3 independent investigators. These investigators wereexperienced with the MWM spatial task.
2.6. Cognitive score
Cognitive performance of each training trial was scored suchthat higher cognitive strategies received higher scores accordingto the following scale: thigmotaxis = 1, passivity = 1, random = 2,circling = 3, accidental circling = 3, chaining = 3, focused = 4, cor-rected = 5, and direct = 6. Cognitive performance of each probe trialwas calculated according to the following scale: thigmotaxis = 1,passivity = 1, random = 2, circling = 3, focused-search circling = 5,
haining
or / Acc
Corrected
Accidental circling
Thigmotaxis
CenterCircling
Randomness
Random
Focused Search
Circling Acc. circling search
otaxis Passivity
e tree describing binary decisions taken by the MUST-C algorithm. (B) Swimmingnon-cognitive strategies (from top-left to bottom-right): direct, corrected, focused
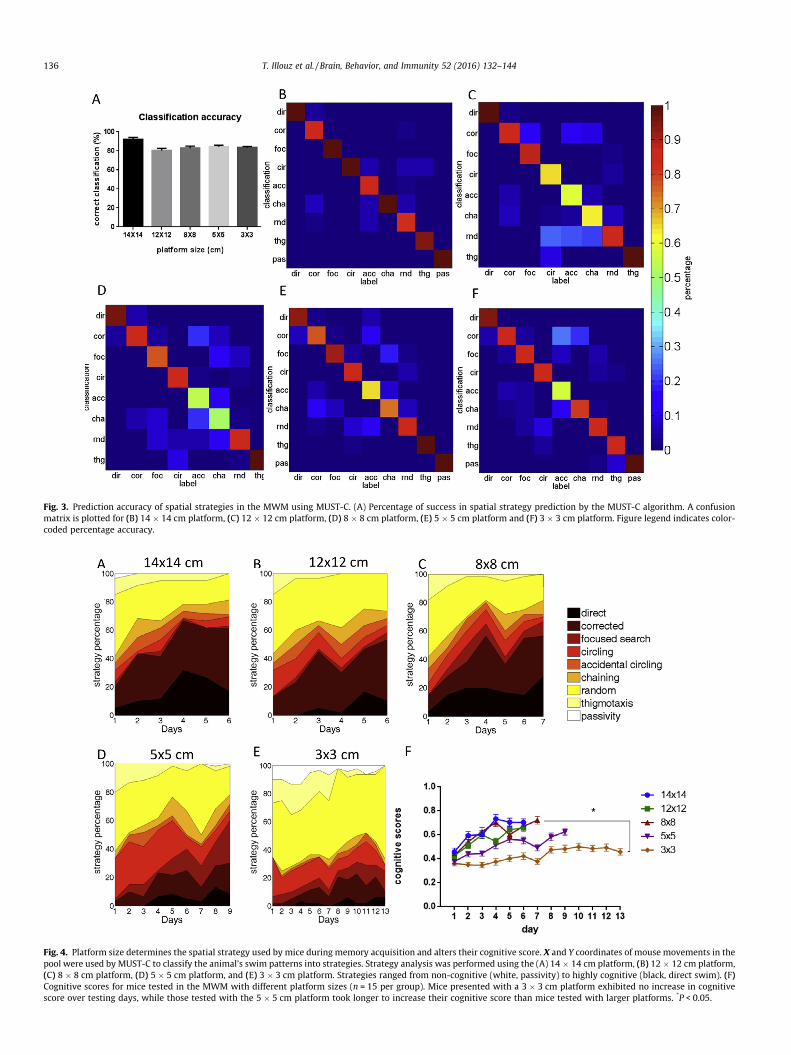
Fig. 3. Prediction accuracy of spatial strategies in the MWM using MUST-C. (A) Percentage of success in spatial strategy prediction by the MUST-C algorithm. A confusionmatrix is plotted for (B) 14 � 14 cm platform, (C) 12 � 12 cm platform, (D) 8 � 8 cm platform, (E) 5 � 5 cm platform and (F) 3 � 3 cm platform. Figure legend indicates color-coded percentage accuracy.
Fig. 4. Platform size determines the spatial strategy used by mice during memory acquisition and alters their cognitive score. X and Y coordinates of mouse movements in thepool were used by MUST-C to classify the animal’s swim patterns into strategies. Strategy analysis was performed using the (A) 14 � 14 cm platform, (B) 12 � 12 cm platform,(C) 8 � 8 cm platform, (D) 5 � 5 cm platform, and (E) 3 � 3 cm platform. Strategies ranged from non-cognitive (white, passivity) to highly cognitive (black, direct swim). (F)Cognitive scores for mice tested in the MWM with different platform sizes (n = 15 per group). Mice presented with a 3 � 3 cm platform exhibited no increase in cognitivescore over testing days, while those tested with the 5 � 5 cm platform took longer to increase their cognitive score than mice tested with larger platforms. *P < 0.05.
136 T. Illouz et al. / Brain, Behavior, and Immunity 52 (2016) 132–144
T. Illouz et al. / Brain, Behavior, and Immunity 52 (2016) 132–144 137
focused search = 6. For each day, the cognitive scores weresummed and normalized to 6, the highest score possible.
2.7. Statistical analysis
The presented data were tested for significance in repeatedmeasures (RM) two-way ANOVA, or by RM one-way ANOVA, bothusing the Tukey’s test for multiple comparisons. Cognitive scores inthe working memory task were tested using the two-sample t-testfor unpaired data. All error bars presented are SEM calculated asstdðxÞffiffi
np for all regular variables, and as
ffiffiffiffiffiffiffiffiffiffiffipð1�pÞ
n
qfor all binomial vari-
ables (accuracy rate, where p is the fraction of correct classifica-tions). Significant results were marked according to conventionalcritical P values: ⁄P < 0.05, ⁄⁄P < 0.01, ⁄⁄⁄P < 0.001, ⁄⁄⁄⁄P < 0.0001.
3. Results
3.1. Platform size alters performance and swim strategy in the MWM
We have developed an automated and unbiased SVM-basedalgorithm for the classification of behavioral strategies in theMWM (MUST-C). In order to assess whether the algorithm detectschanges in the swim strategy of mice, we obtained raw data using5 different square platforms, sized 14 � 14 cm, 12 � 12 cm,8 � 8 cm, 5 � 5 cm and 3 � 3 cm. Mice trained on all 5 platformsexhibited a significantly lower latency to reach the platform onthe last day of training (Fig. 1A, P < 0.0001). Swim distance was
Fig. 5. Spatial resolution in probe trials. Twenty-four hours following completion of thethe absence of a platform. Time spent in each quadrant of the pool is shown for (A) 1platform, and (E) 3 � 3 cm platform. Dashed line indicates chance level. UL: upper left;quadrant. ***P < 0.001, one-way ANOVA.
accordingly reduced with all platforms used (Fig. 1B, P < 0.0001).The mice showed similar motor capabilities, as swim speed didnot differ between the groups (Fig. 1C, P = 0.6699), suggesting thatdifferences in latency were not due to differential swim speed.Mice tested with the 14 � 14 cm, 12 � 12 cm, and the 8 � 8 cmplatforms outperformed mice tested with the 5 � 5 platform inlatency to reach the platform and showed similarly high path effi-ciency throughout training (Fig. 1D, P < 0.05). While the path effi-ciency of mice tested with the 5 � 5 cm platform significantlyincreased between day 1 and 9 (Fig. 1D, P < 0.0001), it remainedlower than that of mice tested with larger platforms (Fig. 1D,P < 0.01). Mice tested in the 3 � 3 platform, however, exhibitedthe lowest path efficiency throughout training (Fig. 1D, P < 0.05),indicating that spatial accuracy was severely deterred in thisgroup. Differences in latency to reach the hidden platform betweengroups were not due to differences in motivation, or motor orvisual capacity. No difference was observed between groups inthe visible platform variant of the MWM in latency (Fig. S1A), swimdistance (Fig. S1B), swim speed (Fig. S1C), or mean distance fromthe platform (Fig. S1D). Mice tested with the 3 � 3 cm platformwere unable to reduce their latency to the level of mice tested withthe 5 � 5 cm platform. This is further exemplified by the distribu-tion of latency across days and platform sizes (Fig. S2A–M). Micetested using the 3 � 3 cm platform exhibited a bi-phasic latencycurve (U shaped distribution), which remained from day 1(Fig. S2A) to day 13 (Fig. S2M). Mice tested with larger platformsbegan training with a bi-phasic latency curve (Fig. S2A–B), whichshifted towards a left-adjusted uni-phase latency curve by day 4
MWM acquisition task, mice were given a probe trial to identify search strategies in4 � 14 cm platform, (B) 12 � 12 cm platform, (C) 8 � 8 cm platform, (D) 5 � 5 cmUR: upper right; LL: lower left; LR: lower right. Underline indicates the platform
138 T. Illouz et al. / Brain, Behavior, and Immunity 52 (2016) 132–144
of the training (Fig. S2D–I). This suggests that when mice are pre-sented with a cognitive demand that surpasses their spatial resolu-tion, latency to reach the platform never reaches a uni-phasemode.
3.2. Spatial strategy classification using the SVM
The MUST-C algorithm we employed was composed of 8 binarydecision junctions (Fig. 2A). X and Y coordinateswere used to gener-ate 11 parameters (Table 1), whichwere then normalized to Z-scorevalues (see Section 2). These factors were then fed to the SVMalgorithm, which was previously trained using labeled example tri-als (see Fig. 2B, Section 2). The prediction accuracy of the MUST-Calgorithm was 92%, 81%, 83%, 84%, and 84% for the 14 � 14 cm,12 � 12 cm, 8 � 8 cm, 5 � 5 cm, and 3 � 3 cm platforms, respec-tively (Fig. 3A). This prediction accuracy is also represented in con-fusion matrices for these platforms (Fig. 3B–F). Through the use ofthis algorithm, we demonstrated that when using a large platform(14 � 14 cm), the swim strategy shifted from mostly random swimon day 1 (43%) to mostly corrected (44%) and direct (17%) swimstrategies on day 6 (Fig. 4A, Table S1). Thus,mice trainedwith a largeplatform readily adopt a spatial search strategy. A similar effect wasobservedwith the12 � 12 cmand8 � 8 cmplatforms (Fig. 4B andC,Table S1). In contrast, while mice tested on a 5 � 5 platform stillemployed spatial navigation, their swim strategy shifted fromrandom swim on day 1 (42%) towards focused searching (30%) andcorrected swim (22%) on day 9 (Fig. 4D, Table S1). Further reducing
Data
Thigmotaxis
Else
Rnd
Cir
A
B Focused Search Focused S. - circling
Random Thigmotaxis
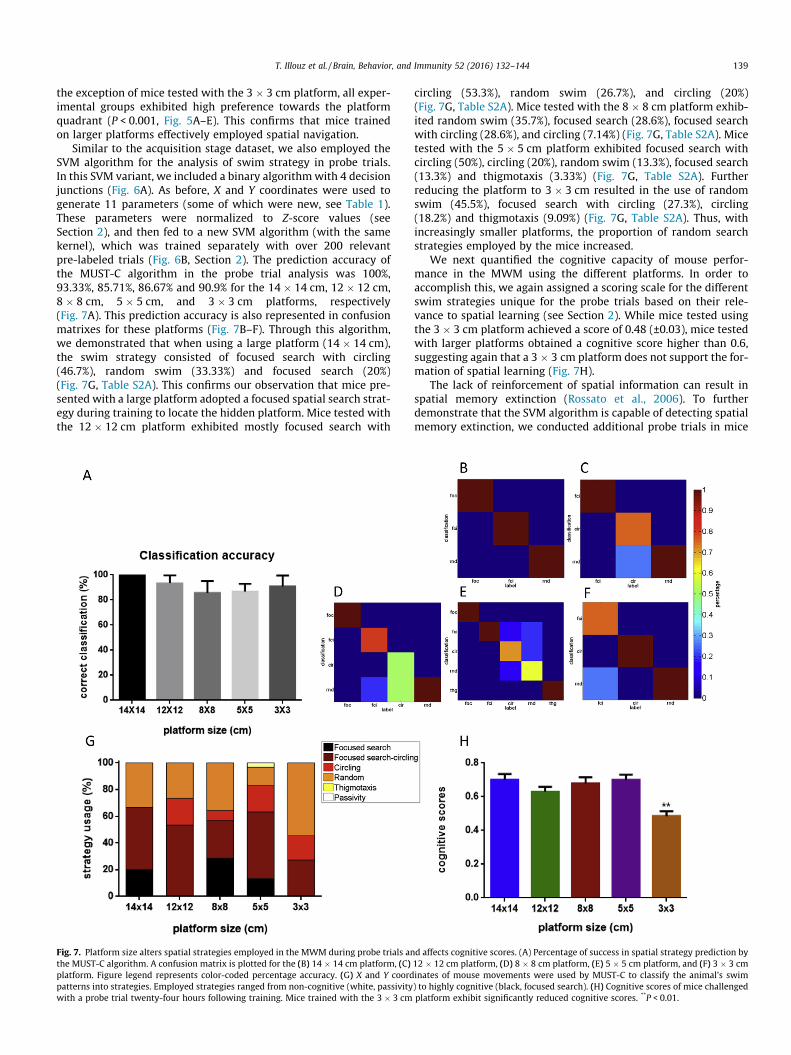
Fig. 6. Spatial strategy classification by MUST-C during probe trials. (A) Binary choiceswimming strategies employed by mice during probe trials in the MWM. Swim strategiesto bottom-right): focused search, focused search with circling, circling, random, thigmo
the platform size to 3 � 3 cm increased the proportion ofmice usinga random swim strategy (38% on day 1 and 67% on day 13) (Fig. 4E,Table S1), despite reducing latency to reach the platform (Fig. 1A,p < 0.0001).
The cognitive level of a particular strategy used by mice testedon different platforms can be quantified in order to provide adefinitive score for spatial cognitive capacity in this task. In orderto accomplish this, we attributed a scoring scale for the differentswim strategies based on their relevance to spatial learning (seeSection 2). This analysis indicates that the 14 � 14 cm,12 � 12 cm, and 8 � 8 cm platforms enabled mice to achieve sim-ilar cognitive scores by day 7 of training (cognitive scores of 0.7,0.65 and 0.72 respectively, Fig. 4F). Mice tested using the5 � 5 cm platform obtained a cognitive score of 0.62 (Fig. 4F) after9 days. Mice tested using the 3 � 3 cm platform failed to increasetheir cognitive score by training day 13 (0.45, Fig. 4F). Notably,while a high correlation was noted between latency, distance, pathefficiency (Spearman correlation, latency vs. distance: r = 0.95,latency vs. path efficiency: r = �0.92, distance vs. path efficiency:r = �0.96, respectively), these parameters poorly correlated withcognitive score (r = �0.75 with latency, r = �0.73 with distanceand r = 0.75 with path efficiency). This implies that cognitive score,a product of the MUST-C algorithm, carries new variance not cor-related with latency, swim distance or path efficiency.
To test whether mice indeed relied on spatial navigation toreach the hidden platform, we conducted a probe trial twenty-four hours following the last training day (see Section 2). With
/Foc
Random
Focus search
Focus search
Focus search - Circlingcling
Circling
Passivity
tree describing binary decisions taken by the MUST-C algorithm. (B) Examples ofare sorted from highly cognitive strategies to non-cognitive strategies (from top-lefttaxis, and passivity.
T. Illouz et al. / Brain, Behavior, and Immunity 52 (2016) 132–144 139
the exception of mice tested with the 3 � 3 cm platform, all exper-imental groups exhibited high preference towards the platformquadrant (P < 0.001, Fig. 5A–E). This confirms that mice trainedon larger platforms effectively employed spatial navigation.
Similar to the acquisition stage dataset, we also employed theSVM algorithm for the analysis of swim strategy in probe trials.In this SVM variant, we included a binary algorithmwith 4 decisionjunctions (Fig. 6A). As before, X and Y coordinates were used togenerate 11 parameters (some of which were new, see Table 1).These parameters were normalized to Z-score values (seeSection 2), and then fed to a new SVM algorithm (with the samekernel), which was trained separately with over 200 relevantpre-labeled trials (Fig. 6B, Section 2). The prediction accuracy ofthe MUST-C algorithm in the probe trial analysis was 100%,93.33%, 85.71%, 86.67% and 90.9% for the 14 � 14 cm, 12 � 12 cm,8 � 8 cm, 5 � 5 cm, and 3 � 3 cm platforms, respectively(Fig. 7A). This prediction accuracy is also represented in confusionmatrixes for these platforms (Fig. 7B–F). Through this algorithm,we demonstrated that when using a large platform (14 � 14 cm),the swim strategy consisted of focused search with circling(46.7%), random swim (33.33%) and focused search (20%)(Fig. 7G, Table S2A). This confirms our observation that mice pre-sented with a large platform adopted a focused spatial search strat-egy during training to locate the hidden platform. Mice tested withthe 12 � 12 cm platform exhibited mostly focused search with
Fig. 7. Platform size alters spatial strategies employed in the MWM during probe trials anthe MUST-C algorithm. A confusion matrix is plotted for the (B) 14 � 14 cm platform, (C)platform. Figure legend represents color-coded percentage accuracy. (G) X and Y coordpatterns into strategies. Employed strategies ranged from non-cognitive (white, passivitywith a probe trial twenty-four hours following training. Mice trained with the 3 � 3 cm
circling (53.3%), random swim (26.7%), and circling (20%)(Fig. 7G, Table S2A). Mice tested with the 8 � 8 cm platform exhib-ited random swim (35.7%), focused search (28.6%), focused searchwith circling (28.6%), and circling (7.14%) (Fig. 7G, Table S2A). Micetested with the 5 � 5 cm platform exhibited focused search withcircling (50%), circling (20%), random swim (13.3%), focused search(13.3%) and thigmotaxis (3.33%) (Fig. 7G, Table S2A). Furtherreducing the platform to 3 � 3 cm resulted in the use of randomswim (45.5%), focused search with circling (27.3%), circling(18.2%) and thigmotaxis (9.09%) (Fig. 7G, Table S2A). Thus, withincreasingly smaller platforms, the proportion of random searchstrategies employed by the mice increased.
We next quantified the cognitive capacity of mouse perfor-mance in the MWM using the different platforms. In order toaccomplish this, we again assigned a scoring scale for the differentswim strategies unique for the probe trials based on their rele-vance to spatial learning (see Section 2). While mice tested usingthe 3 � 3 cm platform achieved a score of 0.48 (±0.03), mice testedwith larger platforms obtained a cognitive score higher than 0.6,suggesting again that a 3 � 3 cm platform does not support the for-mation of spatial learning (Fig. 7H).
The lack of reinforcement of spatial information can result inspatial memory extinction (Rossato et al., 2006). To furtherdemonstrate that the SVM algorithm is capable of detecting spatialmemory extinction, we conducted additional probe trials in mice
d affects cognitive scores. (A) Percentage of success in spatial strategy prediction by12 � 12 cm platform, (D) 8 � 8 cm platform, (E) 5 � 5 cm platform, and (F) 3 � 3 cminates of mouse movements were used by MUST-C to classify the animal’s swim) to highly cognitive (black, focused search). (H) Cognitive scores of mice challengedplatform exhibit significantly reduced cognitive scores. **P < 0.01.
140 T. Illouz et al. / Brain, Behavior, and Immunity 52 (2016) 132–144
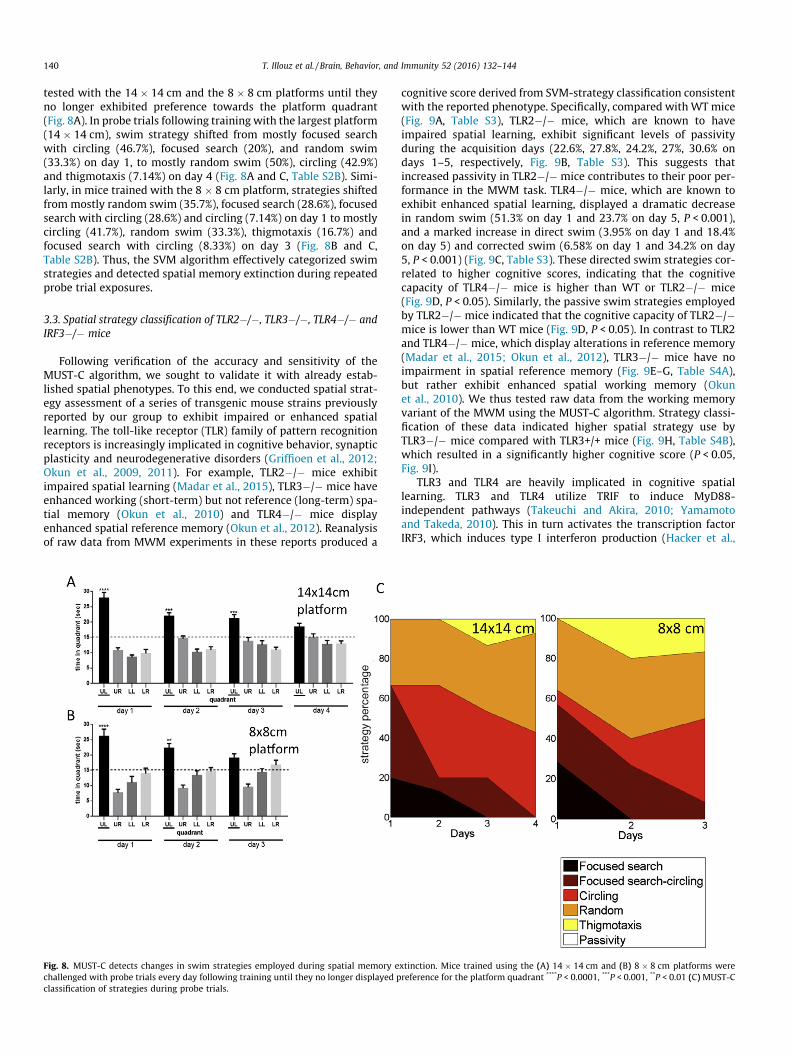
tested with the 14 � 14 cm and the 8 � 8 cm platforms until theyno longer exhibited preference towards the platform quadrant(Fig. 8A). In probe trials following training with the largest platform(14 � 14 cm), swim strategy shifted from mostly focused searchwith circling (46.7%), focused search (20%), and random swim(33.3%) on day 1, to mostly random swim (50%), circling (42.9%)and thigmotaxis (7.14%) on day 4 (Fig. 8A and C, Table S2B). Simi-larly, in mice trained with the 8 � 8 cm platform, strategies shiftedfrommostly random swim (35.7%), focused search (28.6%), focusedsearch with circling (28.6%) and circling (7.14%) on day 1 to mostlycircling (41.7%), random swim (33.3%), thigmotaxis (16.7%) andfocused search with circling (8.33%) on day 3 (Fig. 8B and C,Table S2B). Thus, the SVM algorithm effectively categorized swimstrategies and detected spatial memory extinction during repeatedprobe trial exposures.
3.3. Spatial strategy classification of TLR2�/�, TLR3�/�, TLR4�/� andIRF3�/� mice
Following verification of the accuracy and sensitivity of theMUST-C algorithm, we sought to validate it with already estab-lished spatial phenotypes. To this end, we conducted spatial strat-egy assessment of a series of transgenic mouse strains previouslyreported by our group to exhibit impaired or enhanced spatiallearning. The toll-like receptor (TLR) family of pattern recognitionreceptors is increasingly implicated in cognitive behavior, synapticplasticity and neurodegenerative disorders (Griffioen et al., 2012;Okun et al., 2009, 2011). For example, TLR2�/� mice exhibitimpaired spatial learning (Madar et al., 2015), TLR3�/� mice haveenhanced working (short-term) but not reference (long-term) spa-tial memory (Okun et al., 2010) and TLR4�/� mice displayenhanced spatial reference memory (Okun et al., 2012). Reanalysisof raw data from MWM experiments in these reports produced a
Fig. 8. MUST-C detects changes in swim strategies employed during spatial memory echallenged with probe trials every day following training until they no longer displayed pclassification of strategies during probe trials.
cognitive score derived from SVM-strategy classification consistentwith the reported phenotype. Specifically, compared with WTmice(Fig. 9A, Table S3), TLR2�/� mice, which are known to haveimpaired spatial learning, exhibit significant levels of passivityduring the acquisition days (22.6%, 27.8%, 24.2%, 27%, 30.6% ondays 1–5, respectively, Fig. 9B, Table S3). This suggests thatincreased passivity in TLR2�/� mice contributes to their poor per-formance in the MWM task. TLR4�/� mice, which are known toexhibit enhanced spatial learning, displayed a dramatic decreasein random swim (51.3% on day 1 and 23.7% on day 5, P < 0.001),and a marked increase in direct swim (3.95% on day 1 and 18.4%on day 5) and corrected swim (6.58% on day 1 and 34.2% on day5, P < 0.001) (Fig. 9C, Table S3). These directed swim strategies cor-related to higher cognitive scores, indicating that the cognitivecapacity of TLR4�/� mice is higher than WT or TLR2�/� mice(Fig. 9D, P < 0.05). Similarly, the passive swim strategies employedby TLR2�/� mice indicated that the cognitive capacity of TLR2�/�mice is lower than WT mice (Fig. 9D, P < 0.05). In contrast to TLR2and TLR4�/� mice, which display alterations in reference memory(Madar et al., 2015; Okun et al., 2012), TLR3�/� mice have noimpairment in spatial reference memory (Fig. 9E–G, Table S4A),but rather exhibit enhanced spatial working memory (Okunet al., 2010). We thus tested raw data from the working memoryvariant of the MWM using the MUST-C algorithm. Strategy classi-fication of these data indicated higher spatial strategy use byTLR3�/� mice compared with TLR3+/+ mice (Fig. 9H, Table S4B),which resulted in a significantly higher cognitive score (P < 0.05,Fig. 9I).
TLR3 and TLR4 are heavily implicated in cognitive spatiallearning. TLR3 and TLR4 utilize TRIF to induce MyD88-independent pathways (Takeuchi and Akira, 2010; Yamamotoand Takeda, 2010). This in turn activates the transcription factorIRF3, which induces type I interferon production (Hacker et al.,
xtinction. Mice trained using the (A) 14 � 14 cm and (B) 8 � 8 cm platforms werereference for the platform quadrant ****P < 0.0001, ***P < 0.001, **P < 0.01 (C) MUST-C
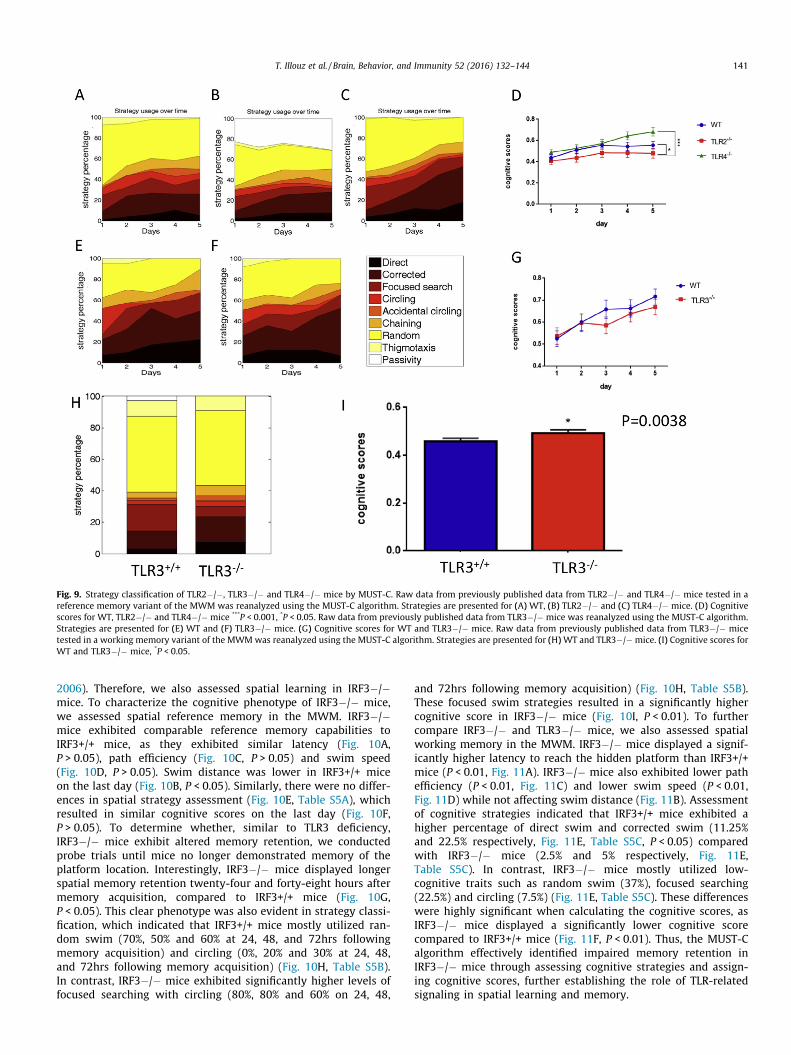
Fig. 9. Strategy classification of TLR2�/�, TLR3�/� and TLR4�/� mice by MUST-C. Raw data from previously published data from TLR2�/� and TLR4�/� mice tested in areference memory variant of the MWM was reanalyzed using the MUST-C algorithm. Strategies are presented for (A) WT, (B) TLR2�/� and (C) TLR4�/� mice. (D) Cognitivescores for WT, TLR2�/� and TLR4�/� mice ***P < 0.001, *P < 0.05. Raw data from previously published data from TLR3�/� mice was reanalyzed using the MUST-C algorithm.Strategies are presented for (E) WT and (F) TLR3�/� mice. (G) Cognitive scores for WT and TLR3�/� mice. Raw data from previously published data from TLR3�/� micetested in a working memory variant of the MWMwas reanalyzed using the MUST-C algorithm. Strategies are presented for (H)WT and TLR3�/�mice. (I) Cognitive scores forWT and TLR3�/� mice, *P < 0.05.
T. Illouz et al. / Brain, Behavior, and Immunity 52 (2016) 132–144 141
2006). Therefore, we also assessed spatial learning in IRF3�/�mice. To characterize the cognitive phenotype of IRF3�/� mice,we assessed spatial reference memory in the MWM. IRF3�/�mice exhibited comparable reference memory capabilities toIRF3+/+ mice, as they exhibited similar latency (Fig. 10A,P > 0.05), path efficiency (Fig. 10C, P > 0.05) and swim speed(Fig. 10D, P > 0.05). Swim distance was lower in IRF3+/+ miceon the last day (Fig. 10B, P < 0.05). Similarly, there were no differ-ences in spatial strategy assessment (Fig. 10E, Table S5A), whichresulted in similar cognitive scores on the last day (Fig. 10F,P > 0.05). To determine whether, similar to TLR3 deficiency,IRF3�/� mice exhibit altered memory retention, we conductedprobe trials until mice no longer demonstrated memory of theplatform location. Interestingly, IRF3�/� mice displayed longerspatial memory retention twenty-four and forty-eight hours aftermemory acquisition, compared to IRF3+/+ mice (Fig. 10G,P < 0.05). This clear phenotype was also evident in strategy classi-fication, which indicated that IRF3+/+ mice mostly utilized ran-dom swim (70%, 50% and 60% at 24, 48, and 72hrs followingmemory acquisition) and circling (0%, 20% and 30% at 24, 48,and 72hrs following memory acquisition) (Fig. 10H, Table S5B).In contrast, IRF3�/� mice exhibited significantly higher levels offocused searching with circling (80%, 80% and 60% on 24, 48,
and 72hrs following memory acquisition) (Fig. 10H, Table S5B).These focused swim strategies resulted in a significantly highercognitive score in IRF3�/� mice (Fig. 10I, P < 0.01). To furthercompare IRF3�/� and TLR3�/� mice, we also assessed spatialworking memory in the MWM. IRF3�/� mice displayed a signif-icantly higher latency to reach the hidden platform than IRF3+/+mice (P < 0.01, Fig. 11A). IRF3�/� mice also exhibited lower pathefficiency (P < 0.01, Fig. 11C) and lower swim speed (P < 0.01,Fig. 11D) while not affecting swim distance (Fig. 11B). Assessmentof cognitive strategies indicated that IRF3+/+ mice exhibited ahigher percentage of direct swim and corrected swim (11.25%and 22.5% respectively, Fig. 11E, Table S5C, P < 0.05) comparedwith IRF3�/� mice (2.5% and 5% respectively, Fig. 11E,Table S5C). In contrast, IRF3�/� mice mostly utilized low-cognitive traits such as random swim (37%), focused searching(22.5%) and circling (7.5%) (Fig. 11E, Table S5C). These differenceswere highly significant when calculating the cognitive scores, asIRF3�/� mice displayed a significantly lower cognitive scorecompared to IRF3+/+ mice (Fig. 11F, P < 0.01). Thus, the MUST-Calgorithm effectively identified impaired memory retention inIRF3�/� mice through assessing cognitive strategies and assign-ing cognitive scores, further establishing the role of TLR-relatedsignaling in spatial learning and memory.
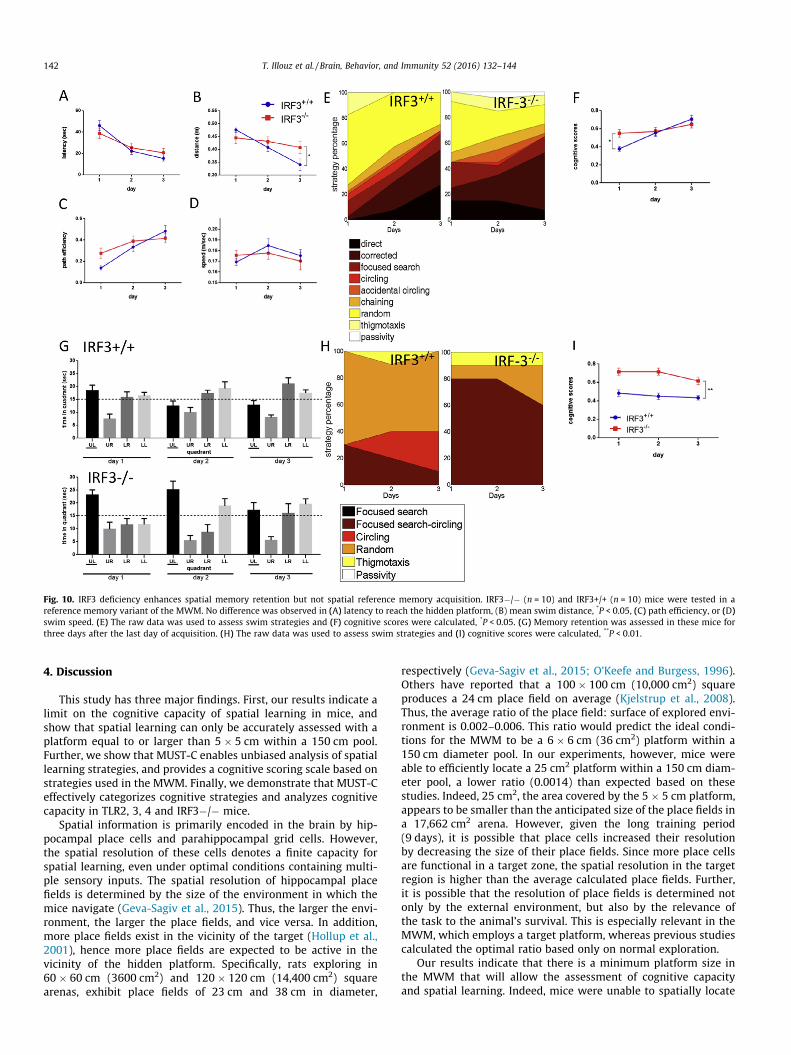
Fig. 10. IRF3 deficiency enhances spatial memory retention but not spatial reference memory acquisition. IRF3�/� (n = 10) and IRF3+/+ (n = 10) mice were tested in areference memory variant of the MWM. No difference was observed in (A) latency to reach the hidden platform, (B) mean swim distance, *P < 0.05, (C) path efficiency, or (D)swim speed. (E) The raw data was used to assess swim strategies and (F) cognitive scores were calculated, *P < 0.05. (G) Memory retention was assessed in these mice forthree days after the last day of acquisition. (H) The raw data was used to assess swim strategies and (I) cognitive scores were calculated, **P < 0.01.
142 T. Illouz et al. / Brain, Behavior, and Immunity 52 (2016) 132–144
4. Discussion
This study has three major findings. First, our results indicate alimit on the cognitive capacity of spatial learning in mice, andshow that spatial learning can only be accurately assessed with aplatform equal to or larger than 5 � 5 cm within a 150 cm pool.Further, we show that MUST-C enables unbiased analysis of spatiallearning strategies, and provides a cognitive scoring scale based onstrategies used in the MWM. Finally, we demonstrate that MUST-Ceffectively categorizes cognitive strategies and analyzes cognitivecapacity in TLR2, 3, 4 and IRF3�/� mice.
Spatial information is primarily encoded in the brain by hip-pocampal place cells and parahippocampal grid cells. However,the spatial resolution of these cells denotes a finite capacity forspatial learning, even under optimal conditions containing multi-ple sensory inputs. The spatial resolution of hippocampal placefields is determined by the size of the environment in which themice navigate (Geva-Sagiv et al., 2015). Thus, the larger the envi-ronment, the larger the place fields, and vice versa. In addition,more place fields exist in the vicinity of the target (Hollup et al.,2001), hence more place fields are expected to be active in thevicinity of the hidden platform. Specifically, rats exploring in60 � 60 cm (3600 cm2) and 120 � 120 cm (14,400 cm2) squarearenas, exhibit place fields of 23 cm and 38 cm in diameter,
respectively (Geva-Sagiv et al., 2015; O’Keefe and Burgess, 1996).Others have reported that a 100 � 100 cm (10,000 cm2) squareproduces a 24 cm place field on average (Kjelstrup et al., 2008).Thus, the average ratio of the place field: surface of explored envi-ronment is 0.002–0.006. This ratio would predict the ideal condi-tions for the MWM to be a 6 � 6 cm (36 cm2) platform within a150 cm diameter pool. In our experiments, however, mice wereable to efficiently locate a 25 cm2 platform within a 150 cm diam-eter pool, a lower ratio (0.0014) than expected based on thesestudies. Indeed, 25 cm2, the area covered by the 5 � 5 cm platform,appears to be smaller than the anticipated size of the place fields ina 17,662 cm2 arena. However, given the long training period(9 days), it is possible that place cells increased their resolutionby decreasing the size of their place fields. Since more place cellsare functional in a target zone, the spatial resolution in the targetregion is higher than the average calculated place fields. Further,it is possible that the resolution of place fields is determined notonly by the external environment, but also by the relevance ofthe task to the animal’s survival. This is especially relevant in theMWM, which employs a target platform, whereas previous studiescalculated the optimal ratio based only on normal exploration.
Our results indicate that there is a minimum platform size inthe MWM that will allow the assessment of cognitive capacityand spatial learning. Indeed, mice were unable to spatially locate
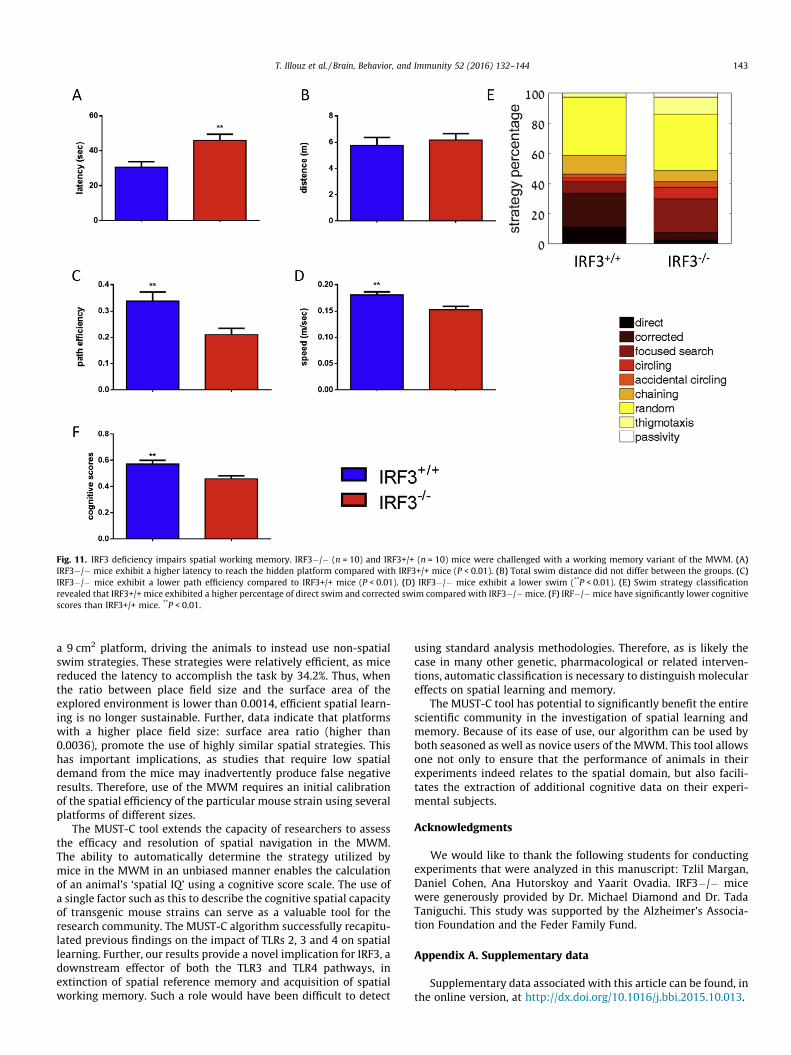
Fig. 11. IRF3 deficiency impairs spatial working memory. IRF3�/� (n = 10) and IRF3+/+ (n = 10) mice were challenged with a working memory variant of the MWM. (A)IRF3�/� mice exhibit a higher latency to reach the hidden platform compared with IRF3+/+ mice (P < 0.01). (B) Total swim distance did not differ between the groups. (C)IRF3�/� mice exhibit a lower path efficiency compared to IRF3+/+ mice (P < 0.01). (D) IRF3�/� mice exhibit a lower swim (**P < 0.01). (E) Swim strategy classificationrevealed that IRF3+/+ mice exhibited a higher percentage of direct swim and corrected swim compared with IRF3�/�mice. (F) IRF�/�mice have significantly lower cognitivescores than IRF3+/+ mice. **P < 0.01.
T. Illouz et al. / Brain, Behavior, and Immunity 52 (2016) 132–144 143
a 9 cm2 platform, driving the animals to instead use non-spatialswim strategies. These strategies were relatively efficient, as micereduced the latency to accomplish the task by 34.2%. Thus, whenthe ratio between place field size and the surface area of theexplored environment is lower than 0.0014, efficient spatial learn-ing is no longer sustainable. Further, data indicate that platformswith a higher place field size: surface area ratio (higher than0.0036), promote the use of highly similar spatial strategies. Thishas important implications, as studies that require low spatialdemand from the mice may inadvertently produce false negativeresults. Therefore, use of the MWM requires an initial calibrationof the spatial efficiency of the particular mouse strain using severalplatforms of different sizes.
The MUST-C tool extends the capacity of researchers to assessthe efficacy and resolution of spatial navigation in the MWM.The ability to automatically determine the strategy utilized bymice in the MWM in an unbiased manner enables the calculationof an animal’s ‘spatial IQ’ using a cognitive score scale. The use ofa single factor such as this to describe the cognitive spatial capacityof transgenic mouse strains can serve as a valuable tool for theresearch community. The MUST-C algorithm successfully recapitu-lated previous findings on the impact of TLRs 2, 3 and 4 on spatiallearning. Further, our results provide a novel implication for IRF3, adownstream effector of both the TLR3 and TLR4 pathways, inextinction of spatial reference memory and acquisition of spatialworking memory. Such a role would have been difficult to detect
using standard analysis methodologies. Therefore, as is likely thecase in many other genetic, pharmacological or related interven-tions, automatic classification is necessary to distinguish moleculareffects on spatial learning and memory.
The MUST-C tool has potential to significantly benefit the entirescientific community in the investigation of spatial learning andmemory. Because of its ease of use, our algorithm can be used byboth seasoned as well as novice users of the MWM. This tool allowsone not only to ensure that the performance of animals in theirexperiments indeed relates to the spatial domain, but also facili-tates the extraction of additional cognitive data on their experi-mental subjects.
Acknowledgments
We would like to thank the following students for conductingexperiments that were analyzed in this manuscript: Tzlil Margan,Daniel Cohen, Ana Hutorskoy and Yaarit Ovadia. IRF3�/� micewere generously provided by Dr. Michael Diamond and Dr. TadaTaniguchi. This study was supported by the Alzheimer’s Associa-tion Foundation and the Feder Family Fund.
Appendix A. Supplementary data
Supplementary data associated with this article can be found, inthe online version, at http://dx.doi.org/10.1016/j.bbi.2015.10.013.
and Immunity 52 (2016) 132–144
References
Barak, B., Okun, E., Ben-Simon, Y., Lavi, A., Shapira, R., Madar, R., Wang, Y., Norman,E., Sheinin, A., Pita, M.A., Yizhar, O., Mughal, M.R., Stuenkel, E., van Praag, H.,Mattson, M.P., Ashery, U., 2013. Neuron-specific expression of tomosyn1 in themouse hippocampal dentate gyrus impairs spatial learning and memory.Neuromolecular Med. 15, 351–363.
Bonaccorsi, J., Cintoli, S., Mastrogiacomo, R., Baldanzi, S., Braschi, C., Pizzorusso, T.,Cenni, M.C., Berardi, N., 2013. System consolidation of spatial memories inmice: effects of enriched environment. Neural Plast. 2013, 956312.
Boser, B.E., Guyon, I.M., Vapnik, V.N., 1992. A training algorithm for optimal marginclassifiers. In: Proceedings of the Fifth Annual Workshop on ComputationalLearning Theory. ACM, Pittsburgh, Pennsylvania, USA, pp. 144–152.
Brown, K.R.S.T.P.O.L.R.E., 2012. A Computer-Based Application for Rapid Un BiasedClassification of Swim Paths in the Morris Water Maze. In: Proceedings ofMeasuring Behavior 2012, 8th International Conference on Methods andTechniques in Behavioral Research (Utrecht, The Netherlands).
Dalm, S., Grootendorst, J., de Kloet, E.R., Oitzl, M.S., 2000. Quantification of swimpatterns in the Morris water maze. Behav. Res. Methods Instrum. Comput. 32,134–139.
Furey, T.S., Cristianini, N., Duffy, N., Bednarski, D.W., Schummer, M., Haussler, D.,2000. Support vector machine classification and validation of cancer tissuesamples using microarray expression data. Bioinformatics 16, 906–914.
Gazova, I., Laczo, J., Rubinova, E., Mokrisova, I., Hyncicova, E., Andel, R., Vyhnalek, M.,Sheardova, K., Coulson, E.J., Hort, J., 2013. Spatial navigation in young versusolder adults. Front. Aging Neurosci. 5, 94.
Geva-Sagiv, M., Las, L., Yovel, Y., Ulanovsky, N., 2015. Spatial cognition in bats andrats: from sensory acquisition to multiscale maps and navigation. Nat. Rev.Neurosci. 16, 94–108.
Graziano, A., Petrosini, L., Bartoletti, A., 2003. Automatic recognition of explorativestrategies in the Morris water maze. J. Neurosci. Methods 130, 33–44.
Griffioen, K.J., Wan, R., Brown, T.R., Okun, E., Camandola, S., Mughal, M.R., Phillips, T.M., Mattson, M.P., 2012. Aberrant heart rate and brainstem brain-derivedneurotrophic factor (BDNF) signaling in a mouse model of Huntington’s disease.Neurobiol. Aging 33 (1481), e1481-1485.
Hacker, H., Redecke, V., Blagoev, B., Kratchmarova, I., Hsu, L.C., Wang, G.G., Kamps,M.P., Raz, E., Wagner, H., Hacker, G., Mann, M., Karin, M., 2006. Specificity inToll-like receptor signalling through distinct effector functions of TRAF3 andTRAF6. Nature 439, 204–207.
Hollup, S.A., Molden, S., Donnett, J.G., Moser, M.B., Moser, E.I., 2001. Accumulation ofhippocampal place fields at the goal location in an annular watermaze task. J.Neurosci. 21, 1635–1644.
Inoue, K., Hanaoka, Y., Nishijima, T., Okamoto, M., Chang, H., Saito, T., Soya, H., 2015.Long-term mild exercise training enhances hippocampus-dependent memoryin rats. Int. J. Sports Med. 36, 280–285.
Kjelstrup, K.B., Solstad, T., Brun, V.H., Hafting, T., Leutgeb, S., Witter, M.P., Moser, E.I.,Moser, M.B., 2008. Finite scale of spatial representation in the hippocampus.Science 321, 140–143.
Krause, M., Yang, Z., Rao, G., Houston, F.P., Barnes, C.A., 2008. Altered dendriticintegration in hippocampal granule cells of spatial learning-impaired aged rats.J. Neurophysiol. 99, 2769–2778.
144 T. Illouz et al. / Brain, Behavior,
Ma, L., Zhao, Z., Wang, R., Zhang, X., Zhang, J., Dong, W., Xu, B., Zhang, J., 2014.Caloric restriction can improve learning ability in C57/BL mice via regulation ofthe insulin-PI3K/Akt signaling pathway. Neurol. Sci. 35, 1381–1386.
Madar, R., Rotter, A., Ben-Asher, H.W., Mughal, M.R., Arumugam, T.V., Wood 3rd, W.H., Becker, K.G., Mattson, M.P., Okun, E., 2015. Postnatal TLR2 activation impairslearning and memory in adulthood. Brain Behav. Immun. 48, 301–312 http://dx.doi.org/10.1016/j.bbi.2015.04.020, PubMed PMID: 26021559.
Morris, R., 1984. Developments of a water-maze procedure for studying spatiallearning in the rat. J. Neurosci. Methods 11, 47–60.
O’Keefe, J., Burgess, N., 1996. Geometric determinants of the place fields ofhippocampal neurons. Nature 381, 425–428.
Okun, E., Barak, B., Saada-Madar, R., Rothman, S.M., Griffioen, K.J., Roberts, N.,Castro, K., Mughal, M.R., Pita, M.A., Stranahan, A.M., Arumugam, T.V., Mattson,M.P., 2012. Evidence for a developmental role for TLR4 in learning and memory.PLoS One 7, e47522.
Okun, E., Griffioen, K., Barak, B., Roberts, N.J., Castro, K., Pita, M.A., Cheng, A., Mughal,M.R., Wan, R., Ashery, U., Mattson, M.P., 2010. Toll-like receptor 3 inhibitsmemory retention and constrains adult hippocampal neurogenesis. Proc. Natl.Acad. Sci. U.S.A. 107, 15625–15630.
Okun, E., Griffioen, K.J., Lathia, J.D., Tang, S.C., Mattson, M.P., Arumugam, T.V., 2009.Toll-like receptors in neurodegeneration. Brain Res. Rev. 59, 278–292.
Okun, E., Griffioen, K.J., Mattson, M.P., 2011. Toll-like receptor signaling in neuralplasticity and disease. Trends Neurosci. 34, 269–281.
Osuna, E., Freund, R., Girosi, F. (Eds.), 1997. Training support vector machines: anapplication to face detection. Computer Vision and Pattern Recognition,Proceedings, 1997 IEEE Computer Society Conference on, 17–19 Jun 1997.
Puzzo, D., Lee, L., Palmeri, A., Calabrese, G., Arancio, O., 2014. Behavioral assays withmouse models of Alzheimer’s disease: practical considerations and guidelines.Biochem. Pharmacol. 88, 450–467.
Redish, A.D., Touretzky, D.S., 1998. The role of the hippocampus in solving theMorris water maze. Neural Comput. 10, 73–111.
Rossato, J.I., Bevilaqua, L.R., Medina, J.H., Izquierdo, I., Cammarota, M., 2006.Retrieval induces hippocampal-dependent reconsolidation of spatial memory.Learn. Mem. 13, 431–440.
Sato, M., Suemori, H., Hata, N., Asagiri, M., Ogasawara, K., Nakao, K., Nakaya, T.,Katsuki, M., Noguchi, S., Tanaka, N., Taniguchi, T., 2000. Distinct and essentialroles of transcription factors IRF-3 and IRF-7 in response to viruses for IFN-alpha/beta gene induction. Immunity 13, 539–548.
Sharma, S., Rakoczy, S., Brown-Borg, H., 2010. Assessment of spatial memory inmice. Life Sci. 87, 521–536.
Takeuchi, O., Akira, S., 2010. Pattern recognition receptors and inflammation. Cell140, 805–820.
Tong, S., Koller, D., 2002. Support vector machine active learning with applicationsto text classification. J. Mach. Learn. Res. 2, 45–66.
Vapnik, V.N., 1998. Statistical Learning Theory. Wiley, New York.Vorhees, C.V., Williams, M.T., 2006. Morris water maze: procedures for assessing
spatial and related forms of learning and memory. Nat. Protoc. 1, 848–858.Wolfer, D.P., Lipp, H.P., 2000. Dissecting the behaviour of transgenic mice: is it the
mutation, thegeneticbackground, or theenvironment?Exp. Physiol. 85, 627–634.Yamamoto, M., Takeda, K., 2010. Current views of toll-like receptor signaling
pathways. Gastroenterol. Res. Pract. 2010, 240365.