Embed Size (px)
Citation preview
RESEARCH ARTICLE
Unraveling Chagas disease transmission
through the oral route: Gateways to
Trypanosoma cruzi infection and target tissues
Danielle Silva-dos-Santos1, Juliana Barreto-de-Albuquerque1, Barbara Guerra2, Otacilio
C. Moreira3, Luiz Ricardo Berbert1, Mariana Tavares Ramos1, Barbara Angelica
S. Mascarenhas1, Constanca Britto3, Alexandre Morrot4, Dea M. Serra Villa-Verde1,
Luciana Ribeiro Garzoni5, Wilson Savino1, Vinıcius Cotta-de-Almeida1, Juliana de Meis1*
1 Laboratory on Thymus Research, Oswaldo Cruz Institute, Oswaldo Cruz Foundation, Rio de Janeiro,
Brazil, 2 National Center of Structural Biology and Bio-imaging—CENABIO, Federal University of Rio de
Janeiro, Rio de Janeiro, Brazil, 3 Laboratory on Molecular Biology and Endemic Diseases, Oswaldo Cruz
Institute, Oswaldo Cruz Foundation, Rio de Janeiro, Brazil, 4 Department of Immunology, Microbiology
Institute, Federal University of Rio de Janeiro, Rio de Janeiro, Brazil, 5 Laboratory for Innovations in
Therapies, Education and Bioproducts, Oswaldo Cruz Institute, Oswaldo Cruz Foundation, Rio de Janeiro,
Brazil
Abstract
Oral transmission of Trypanosoma cruzi, the causative agent of Chagas disease, is the
most important route of infection in Brazilian Amazon and Venezuela. Other South American
countries have also reported outbreaks associated with food consumption. A recent study
showed the importance of parasite contact with oral cavity to induce a highly severe acute
disease in mice. However, it remains uncertain the primary site of parasite entry and multipli-
cation due to an oral infection. Here, we evaluated the presence of T. cruzi Dm28c luciferase
(Dm28c-luc) parasites in orally infected mice, by bioluminescence and quantitative real-time
PCR. In vivo bioluminescent images indicated the nasomaxillary region as the site of para-
site invasion in the host, becoming consistently infected throughout the acute phase. At later
moments, 7 and 21 days post-infection (dpi), luminescent signal is denser in the thorax,
abdomen and genital region, because of parasite dissemination in different tissues. Ex vivo
analysis demonstrated that the nasomaxillary region, heart, mandibular lymph nodes, liver,
spleen, brain, epididymal fat associated to male sex organs, salivary glands, cheek muscle,
mesenteric fat and lymph nodes, stomach, esophagus, small and large intestine are target
tissues at latter moments of infection. In the same line, amastigote nests of Dm28c GFP T.
cruzi were detected in the nasal cavity of 6 dpi mice. Parasite quantification by real-time
qPCR at 7 and 21 dpi showed predominant T. cruzi detection and expansion in mouse nasal
cavity. Moreover, T. cruzi DNA was also observed in the mandibular lymph nodes, pituitary
gland, heart, liver, small intestine and spleen at 7 dpi, and further, disseminated to other tis-
sues, such as the brain, stomach, esophagus and large intestine at 21 dpi. Our results
clearly demonstrated that oral cavity and adjacent compartments is the main target region in
oral T. cruzi infection leading to parasite multiplication at the nasal cavity.
PLOS Neglected Tropical Diseases | https://doi.org/10.1371/journal.pntd.0005507 April 5, 2017 1 / 26
a1111111111
a1111111111
a1111111111
a1111111111
a1111111111
OPENACCESS
Citation: Silva-dos-Santos D, Barreto-de-
Albuquerque J, Guerra B, Moreira OC, Berbert LR,
Ramos MT, et al. (2017) Unraveling Chagas
disease transmission through the oral route:
Gateways to Trypanosoma cruzi infection and
target tissues. PLoS Negl Trop Dis 11(4):
e0005507. https://doi.org/10.1371/journal.
pntd.0005507
Editor: Herbert B. Tanowitz, Yeshiva University
Albert Einstein College of Medicine, UNITED
STATES
Received: June 9, 2016
Accepted: March 20, 2017
Published: April 5, 2017
Copyright: © 2017 Silva-dos-Santos et al. This is
an open access article distributed under the terms
of the Creative Commons Attribution License,
which permits unrestricted use, distribution, and
reproduction in any medium, provided the original
author and source are credited.
Data Availability Statement: All relevant data are
within the paper and its Supporting Information
files.
Funding: This study was funded by the Rio de
Janeiro State Science Foundation (FAPERJ) and
the Brazilian National Research Council (CNPq).
Grant numbers: FAPERJ: E-26/010.001561/2014;
E-26/110.135/2014; E-26/110.042/2014. CNPq:
Author summary
Oral transmission of Trypanosoma cruzi associated with food/beverage consumption is
presently an important route of infection in Brazil and Venezuela. Colombia, Bolivia,
Argentina and Ecuador have also reported to have acute cases of Chagas disease transmis-
sion through the oral route. Significant studies about this form of T. cruzi infection are
largely lacking. In addition to the classic cardiac involvement, orally-infected patient
progress to a highly symptomatic disease and increased mortality rate (8–35%), surpassing
the calculated mortality produced by the disease resulting from the biting of infected
insect vectors (5–10%). Here, we explored by in vivo bioluminescent images, qPCR and
fluorescence microscopy the primary site of parasite entry and multiplication in oral
infection (OI). Our results clearly demonstrated that the oral cavity is the main T. cruzitarget region in OI, leading to parasite multiplication at the nasal cavity and parasite dis-
semination to the brain and peripheral tissues. Interestingly, facial edema, paraesthesia of
the tongue, gingivitis and dry cough were already described in affected patients. These
findings might be associated to our present data, which describe for the first time the
nasomaxillary region as the main target tissue following oral T. cruzi infection.
Introduction
Human Chagas disease (American trypanosomiasis) is a neglected tropical illness caused by
the protozoan Trypanosoma cruzi. Infection affects 6–8 million people worldwide and is con-
sidered a global health problem. Chagas disease is endemic in Mexico, Central America and
South America and is also spreading in non-endemic countries through migration of infected
people [1]. It can be transmitted by excreta deposition after biting of blood sucking Triatomi-nae bugs, blood transfusion; organ transplantation; laboratory accident; congenitally and
orally [2, 3].
Outbreaks of oral transmission of Chagas disease were described in Brazil, Venezuela,
Colombia, French Guyana, Bolivia, Argentina and Ecuador [4–9]. All of these outbreaks were
associated with contaminated food/beverage consumption as wild animal meat, vegetables,
sugar cane extract, acaı pulp, guava juice, bacaba, babacu and vino de palma [10–12]. From
1968 to 2000, 50% of acute cases in Amazon region were attributed to oral transmission [8]
and these numbers reached 70% between 2000–2010 [6]. Venezuela has also reported the big-
gest outbreak described so far, with two distinct occurrences affecting respectively 103 and 88
people. These outbreaks involved adults and children from urban and rural schools [5, 13].
Mortality rate in orally infected patients is reported as higher (8–35%) when compared to the
classical vectorial transmission, through triatomine excreta deposition after biting (<5–10%)
[14]. It is well known that both trypomastigotes and metacyclic trypomastigotes are associated
with oral Chagas transmission [15–17]. Regarding T. cruzi genotypes, isolates from DTUs I, II,
III, IV and VI have been associated with patients from oral Chagas outbreaks [18–25]. Although
relevant, there are few reports about T. cruzi oral transmission in the literature. Some authors
have demonstrated parasite-mucosa interaction, some aspects of immune response as well as
disease outcome after intragastric, pharyngeal or buccal parasite challenge. These models of oral
T. cruzi infections present both patent parasitemia and heart parasitism, which indicate systemic
infection [26–30]. In addition, T. cruzi glycoprotein gp82 seems to bind gastric mucin, promot-
ing invasion and replication in epithelial cells from the gastric mucosa [31]. This initial invasion
is related to establishment of a progressive gastritis and allows further systemic dissemination of
Target tissues in oral Chagas disease
PLOS Neglected Tropical Diseases | https://doi.org/10.1371/journal.pntd.0005507 April 5, 2017 2 / 26
467314/2014-4. The funders had no role in study
design, data collection and analysis, decision to
publish, or preparation of the manuscript.
Competing interests: The authors have declared
that no competing interests exist.
the parasite. Nonetheless, the short replication period at this mucosal site induces specific
immunity, as protection was observed after a secondary mucosal challenge, involving the pro-
duction of IgA and IgG antibodies [27]. In orally infected mice, inflammatory infiltrates are
observed in tissues such as pancreas, spleen, liver, bone marrow, heart, duodenum, adrenal
glands, brain and skeletal muscle. Moreover, it was suggested that intraepithelial and lamina
propria lymphocytes are involved in IFN-γ but not IL-4 production in orally infected hosts [27].
Following disease outbreaks caused by T. cruzi food contamination, a clear increase in severity
of clinical manifestations was observed in patients, as compared with other types of transmis-
sion routes [8, 14]. These observations raise important questions concerning the particular fea-
tures of T. cruzi entry via the mucosa, including the possible modulation of local immune
mechanisms and the impact on regional and systemic immunity [32, 33]. We have recently
demonstrated that the site of parasite entrance, through oral infection (OI)–directly in the
mouth, as observed in natural infection, or gastrointestinal infection (GI)–directly to the stom-
ach via gavage differentially affects host immune response and mortality. Thus, comparing to
GI mice, we observed that OI mice presented elevated infection rate and parasitemia, higher
TNF serum levels, more severe hepatitis and milder carditis [15]. This difference in immunolog-
ical response and infection severity between GI and OI mice raised important questions about
the primary site of T. cruzi infection by the oral route and its impact on disease progression.
Bioluminescent imaging is a promising technique that brings the opportunity to approach
the in vivo host-pathogen interactions through a highly sensitive and non-invasive way [34]. In
addition to allow the follow up of infection progression by keeping the animal alive, this tech-
nique also gives the possibility to observe new sites of infection and parasite distribution that
are hardly observed by histological techniques [35]. In the past years, some reports developed
in vivo bioluminescent analysis both in T. cruzi infected mice and in the invertebrate host [35–
37]. In the present work, by employing the bioluminescent technique and real-time qPCR, we
followed the dynamics of T. cruzi Dm28c luciferase (Dm28c-luc) distribution throughout the
host using our well-established model of OI in mice [15]. The bioluminescence results indi-
cated the nasal cavity as the main primary site of parasite invasion and multiplication in the
host. At later moments, luminescent signal progressively increased in the abdomen and genital
region, as a result of parasite dissemination. Quantification of parasite load, via T. cruzi satellite
DNA (SatDNA) detection by real-time qPCR at 7 and 21 dpi, corroborated the biolumines-
cence results, showing predominant T. cruzi detection in mouse nasal cavity. Parasite amplifi-
cation was also observed in the mandibular lymph nodes, pituitary gland, heart, liver, small
intestine and spleen at 7 dpi, and was disseminated to other tissues, such as the brain, stomach,
esophagus and large intestine at 21 dpi. Our results indicate the oral cavity and adjacent tissues
as the main target region for oral T. cruzi infection, leading to parasite multiplication at the
nasal cavity.
Methods
Mice and Trypanosoma cruzi infection
Male BALB/c mice, aged 6–8 weeks, were obtained from the animal facility of Oswaldo Cruz
Foundation (Rio de Janeiro, Brazil) and used in all experiments. Animals were handled
according to the rules of the Ethics Committee for Animal Research of Oswaldo Cruz Founda-
tion. The total number of mice used in each experimental set is described in S1 Fig flowchart.
Mice were infected via the oral cavity (OI) with trypomastigotes of a Dm28c (DTU- TcI)
genetically modified to express the firefly luciferase (Dm28c-luc), Dm28c-GFP or Tulahuen
(DTU- TcVI) strains [35, 38].
Target tissues in oral Chagas disease
PLOS Neglected Tropical Diseases | https://doi.org/10.1371/journal.pntd.0005507 April 5, 2017 3 / 26
Parasites were obtained from infected cultures of a monkey kidney epithelial cell line (Vero
cells) from the particular Cell Line Collection of the Laboratory on Thymus Research, Oswaldo
Cruz Institute. T. cruzi were counted using Neubauer’s chamber in phosphate buffered saline
(PBS). Mice were maintained starving for 4 hours and then infected with 1x10⁶ trypomasti-
gotes in 50 μL of parasite suspension into the mouth. At the infection moment, mice swallow-
ing time was respected to avoid parasite aspiration.
A control experiment was performed with injection of 50 μL of black ink suspension at the
oral cavity or intranasally to validate our protocol of oral infection and to exclude the possibil-
ity of an intranasal contamination (S2 Fig).
Ethics statement
This study was performed in strict accordance with the recommendations in the Guide for the
Care and Use of Laboratory Animals of the Brazilian National Council of Animal Experimen-
tation and the Federal Law 11.794 (10/2008). The Institutional Ethics Committee for Animal
Research of the Oswaldo Cruz Foundation (CEUA-FIOCRUZ, License: LW-23/12) approved
all the procedures used in this study.
Parasitemia
Mouse parasitemia was individually evaluated at different days post-infection (4, 7, 11, 14 and
21 dpi–S1 Fig) by counting trypomastigotes in 5 μL of tail vessels blood. Blood-parasite num-
ber was calculated according to the Brenner method.
In vivo and ex vivo bioluminescence imaging (BLI)
Photoluminescence signals were measured at different time points post-infection (15 and 60
minutes (min), 7 and 21 dpi–S1 Fig), in anesthetized animal, by ventral and lateral position
using the IVIS Lumina image system (Xenogen Corp, CA, EUA). D-luciferin potassium salt
(Xenogen) stock solution was prepared in PBS at 15 mg/mL and stored at -80˚C.
Analyses of 15 min post-infection imaging were performed with a 5 min pre-incubation of
Dm28c-luc with 0.15 mg in PBS (10 μL) of D-luciferin stock solution followed by mouse infec-
tion. Photoluminescent images of infected mice were acquired 15 min later.
Images at 60 min post-infection were carried out after intraperitoneal injection of D-lucif-
erin (150 mg/Kg of body weight) followed by an addition of 50 μL of D-luciferin (0.75 mg in
PBS) at the oral cavity, just before capturing the images.
At 7 and 21dpi analyses, photoluminescent signals were measured with images starting 15
min after an intraperitoneal injection of D-luciferin solution in potassium salt (150 mg/Kg of
body weight).
Mice were placed inside the animal chamber anaesthesia delivery system (Xenogen XGI-8
Gas Anaesthesia system). Isoflurane (1.5%) anaesthesia was applied until the mice became
recumbent. These animals were then placed into the image chamber of IVIS Lumina system
(Xenogen Corp, CA, USA) and controlled flow of isoflurane, with a nose cone device into the
chamber, maintained them anesthetized during the bioluminescence imaging acquisition.
For the analysis of T. cruzi presence in specific organs, mice were injected with D-luciferin
at different times post-infection (S1 Fig), and 10 min later mice were euthanized in order to
perform single tissue harvest. Tissues were removed, transferred to a culture dish and images
acquired at the IVIS Lumina image system.
Acquisition of bioluminescent images of both mice and tissues was performed by 5 min of
exposure and the photons emitted from luciferase-expression T. cruzi were quantified using
the Living Image 3.0 software program.
Target tissues in oral Chagas disease
PLOS Neglected Tropical Diseases | https://doi.org/10.1371/journal.pntd.0005507 April 5, 2017 4 / 26
Ex vivo analysis of parasite nests
Uninfected and six days post infection mice were euthanized, the nasal cavity were isolated
and tissue were included in tissue tek (OCT, Sakura, USA). Cryosections (5 μm) of frozen tis-
sues were analyzed using a fluorescent Zeiss microscope (Germany). Images were digitalized
using AxioCam HRm and Axio Vision Rel 4.8 software.
DNA extraction from tissues
DNA extraction was performed from nasal cavity, palate, tongue, esophagus, stomach, small
intestine, large intestine, liver, heart, spleen, mandibular lymph nodes, pituitary gland and brain,
using the QIAamp DNA Mini kit (Qiagen, CA). Tissues were obtained from dissected infected
mice at different time points (60 min, 7 and 21 dpi), individually weighted (maximum 10 mg for
spleen and 30 mg for other tissues was used), washed in PBS (except tissues from nasal cavity,
mandibular lymph nodes and pituitary gland) and stored at -20˚C until DNA extraction. Blood
was drawn via cardiovascular perfusion with PBS, immediately after euthanasia. Nasal cavity tis-
sue was obtained after scraping the region. Tissues and organs from non infected mice were
used for negative control. The protocol was carried out according to the manufacturer’s instruc-
tions and the DNA was eluted with 100 μL of elution buffer (AE). As a qualitative internal refer-
ence control, the exogenous internal amplification control (IAC), a pZErO-2 plasmid containing
an insert from the A. thaliana aquaporin gene, was used as reported by Duffy (2009). Before
DNA extraction, 5 μL (40 pg/mL) of linearized IAC were added to the samples. DNAs were
stored at −20 ◦C until use and their purity and concentration were determined using a Nano-
drop 2000c spectrophotometer (Thermo Scientific) at 260/280 and 260/320 nm.
Quantitative duplex real-time PCR (qPCR)
According to the international consensus for quantification of Trypanosoma cruzi DNA in
Chagas disease patients [39], Quantitative Real Time PCR Multiplex assays using TaqMan
probes were performed targeting the satellite region of the nuclear DNA (SatDNA) of T. cruziand the exogenous internal amplification control (IAC), as described in Duffy et al, 2009. The
qPCR reactions were performed in a final volume of 10 μL containing 1.5 μL of DNA template,
5 μL of 2X TaqMan Universal PCR Master Mix (Applied Biosystems, USA), 750 nM of both
cruzi1 (50ASTCGGCTGATCGTTTTCGA 30) and cruzi2 (50AATTCCTCCAAGCAGCGGAT
A30) primers and 50 nM cruzi3 probe (50FAM- CACACACTGGACACCAA-NFQ-MGB 30)
specific for T. cruzi SatDNA; 100 nM IAC Fw (50CCGTCATGGAACAGCACGTA30) and IAC
Rv (50CTCCCGCAACAAACCCTATAAAT 30) primers and 50 nM IAC Tq probe (50 VIC-AG
CATCTGTTCTTGAAGGT-NFQ-MGB 30). Cycling conditions were a first step at 95˚C for
10 min followed by 40 cycles at 95˚C for 15 seconds and 58˚C for 1 minute. The amplifications
were carried out in a ViiA7 Real-Time PCR System (Applied Biosystems, USA). Standard
curves for the absolute quantification were constructed by serial dilution of DNA, extracted
from 1 x 10⁶ trypomastigotes of T. cruzi (Dm28c-luc and Tulahuen strain), ranging from 105
to 0.5 parasite equivalents (par. eq). Normalization of the parasite load was performed by tissue
mass, after the absolute quantification of T. cruzi by real time qPCR and results were expressed
as parasite equivalents/tissue mass (g).
Statistical analyses
Kruskal-Wallis (Dunn’s post-test) or Mann-Whitney tests were used for the statistical analyses.
P values < 0.05 were considered statistically significant. Tests were performed using GraphPad
Prism 5.
Target tissues in oral Chagas disease
PLOS Neglected Tropical Diseases | https://doi.org/10.1371/journal.pntd.0005507 April 5, 2017 5 / 26
Results
Trypanosoma cruzi-luc inoculation through the oral route promotes
acute infection in mice
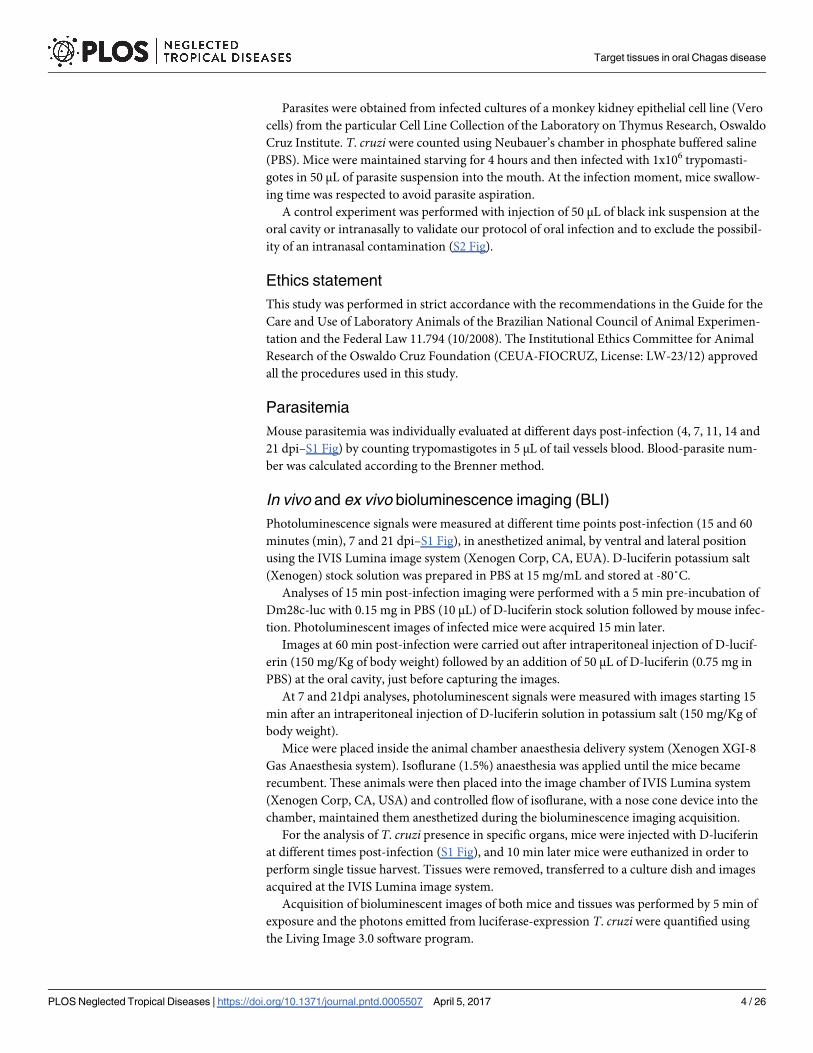
Mice orally infected with T. cruziDm28c-luc were examined for blood parasitemia during the
acute phase of infection. Peripheral blood parasites started to be detectable at 7 dpi, with a
peak of parasitemia at 11 dpi. At later moments, the number of circulating parasites gradually
decreased (Fig 1).
The head region is the main affected area in orally Trypanosoma cruzi
infected mice
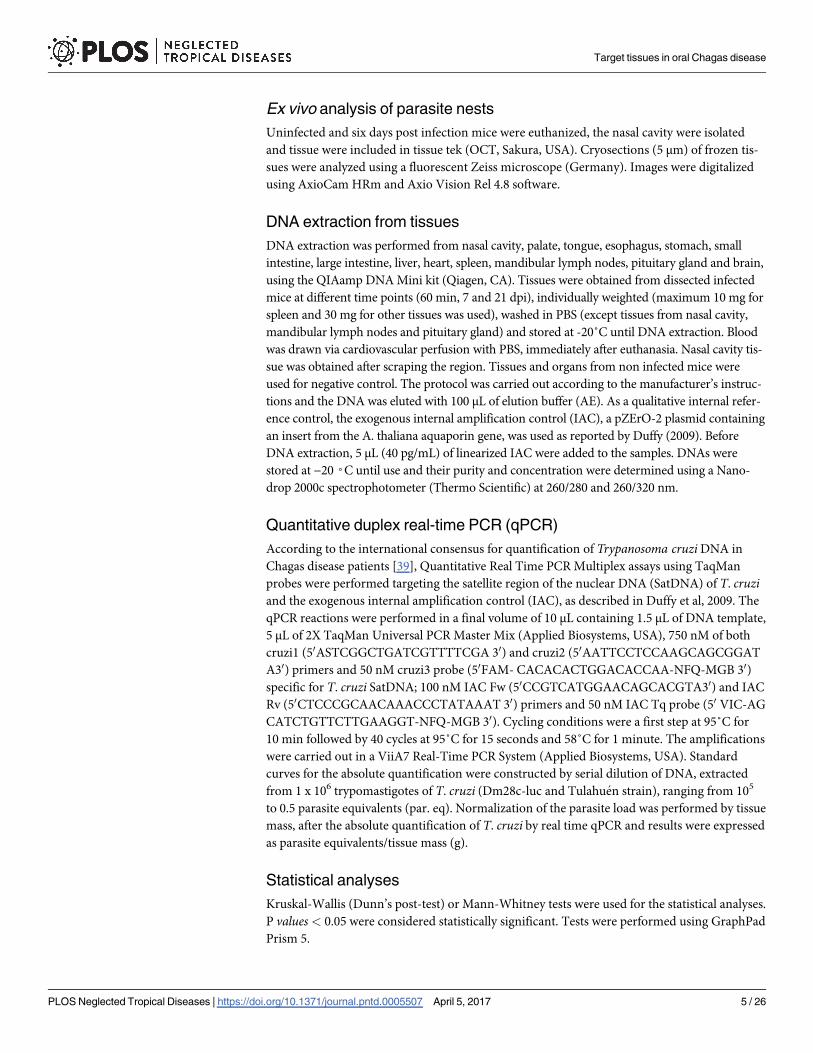
In order to determine the anatomical route of parasites entrance after OI, mice were infected
and evaluated by bioluminescence imaging. At 15 and 60 min after OI, mice were placed
inside the IVIS Lumina chamber and the images were obtained in ventral (upper panels) and
lateral (lower panels) position (Fig 2). Detection of bioluminescence images after 15 min of OI
showed that all infected mice analyzed had highest intensity of bioluminescence in the head
region, concerning the mouth, nose and eyes. Although less intensive, bioluminescence was
also observed in the neck, thorax and at the abdominal region. Bioluminescence signals were
consistently observed from either ventral or lateral viewpoints (Fig 2A and 2B). One hour after
infection, the major bioluminescence image detected remained in the head region (Fig 2C and
2D).
To confirm luciferase activity in living trypomastigotes, 5x10⁴ Dm28c-luc T. cruzi parasites
were incubated in vitro with medium or D-luciferin in 24 well plate (black circle). Medium or
D-luciferin (150 μg/mL) substrate was added to the well and, after 5 min of incubation, images
Fig 1. Parasitemia levels in mice orally infected with Dm28c-luc. Male BALB/c mice were infected with
1x10⁶ trypomastigotes forms of T. cruzi expressing luciferase (Dm28c-luc) through the oral cavity (OI).
Parasitemia was assessed during acute phase by couting parasites with light microscope and the number of
peripheral blood parasites was calculated by the Brener method. Values represent mean ± SEM. n: 4 and 11
dpi = 6; 7, 14 and 21 dpi = 16. The total number was obtained from two independent experiments.
https://doi.org/10.1371/journal.pntd.0005507.g001
Target tissues in oral Chagas disease
PLOS Neglected Tropical Diseases | https://doi.org/10.1371/journal.pntd.0005507 April 5, 2017 6 / 26
Fig 2. In vivo bioluminescence imaging of mice infected with Dm28c-luc at 15 and 60 min of infection. Male BALB/c mice were infected in the oral
cavity (OI) with 1x10⁶ trypomastigotes forms of T. cruzi expressing luciferase (Dm28c-luc). Evaluation of OI mice was performed at 15 (A and B) and 60
Target tissues in oral Chagas disease
PLOS Neglected Tropical Diseases | https://doi.org/10.1371/journal.pntd.0005507 April 5, 2017 7 / 26
were acquired. As demonstrated in S3 Fig, luminescent signals were only detected in D-lucif-
erin treated parasites. Moreover, as in vivo controls, non-infected mice were treated with D-
luciferin and bioluminescent signal analyzed. S4 and S5 Figs show that, in absence of T. cruziinfection, D-luciferin was incapable to promote bioluminescent signal.
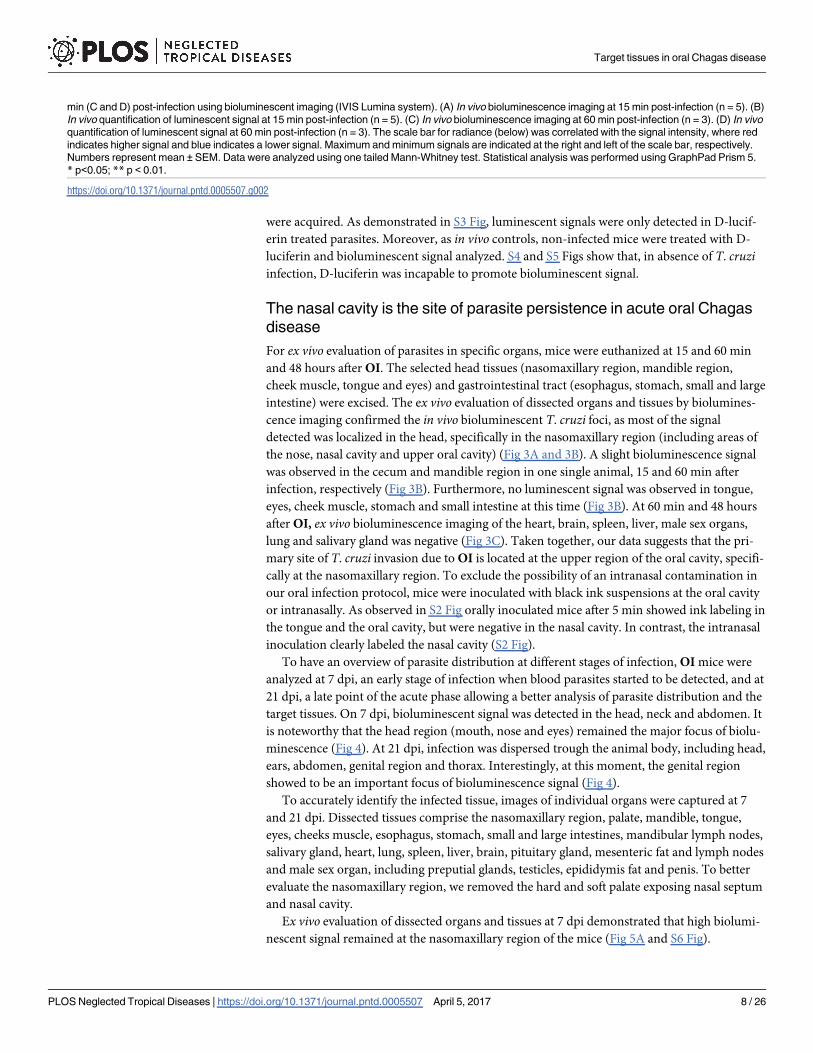
The nasal cavity is the site of parasite persistence in acute oral Chagas
disease
For ex vivo evaluation of parasites in specific organs, mice were euthanized at 15 and 60 min
and 48 hours after OI. The selected head tissues (nasomaxillary region, mandible region,
cheek muscle, tongue and eyes) and gastrointestinal tract (esophagus, stomach, small and large
intestine) were excised. The ex vivo evaluation of dissected organs and tissues by biolumines-
cence imaging confirmed the in vivo bioluminescent T. cruzi foci, as most of the signal
detected was localized in the head, specifically in the nasomaxillary region (including areas of
the nose, nasal cavity and upper oral cavity) (Fig 3A and 3B). A slight bioluminescence signal
was observed in the cecum and mandible region in one single animal, 15 and 60 min after
infection, respectively (Fig 3B). Furthermore, no luminescent signal was observed in tongue,
eyes, cheek muscle, stomach and small intestine at this time (Fig 3B). At 60 min and 48 hours
after OI, ex vivo bioluminescence imaging of the heart, brain, spleen, liver, male sex organs,
lung and salivary gland was negative (Fig 3C). Taken together, our data suggests that the pri-
mary site of T. cruzi invasion due to OI is located at the upper region of the oral cavity, specifi-
cally at the nasomaxillary region. To exclude the possibility of an intranasal contamination in
our oral infection protocol, mice were inoculated with black ink suspensions at the oral cavity
or intranasally. As observed in S2 Fig orally inoculated mice after 5 min showed ink labeling in
the tongue and the oral cavity, but were negative in the nasal cavity. In contrast, the intranasal
inoculation clearly labeled the nasal cavity (S2 Fig).
To have an overview of parasite distribution at different stages of infection, OI mice were
analyzed at 7 dpi, an early stage of infection when blood parasites started to be detected, and at
21 dpi, a late point of the acute phase allowing a better analysis of parasite distribution and the
target tissues. On 7 dpi, bioluminescent signal was detected in the head, neck and abdomen. It
is noteworthy that the head region (mouth, nose and eyes) remained the major focus of biolu-
minescence (Fig 4). At 21 dpi, infection was dispersed trough the animal body, including head,
ears, abdomen, genital region and thorax. Interestingly, at this moment, the genital region
showed to be an important focus of bioluminescence signal (Fig 4).
To accurately identify the infected tissue, images of individual organs were captured at 7
and 21 dpi. Dissected tissues comprise the nasomaxillary region, palate, mandible, tongue,
eyes, cheeks muscle, esophagus, stomach, small and large intestines, mandibular lymph nodes,
salivary gland, heart, lung, spleen, liver, brain, pituitary gland, mesenteric fat and lymph nodes
and male sex organ, including preputial glands, testicles, epididymis fat and penis. To better
evaluate the nasomaxillary region, we removed the hard and soft palate exposing nasal septum
and nasal cavity.
Ex vivo evaluation of dissected organs and tissues at 7 dpi demonstrated that high biolumi-
nescent signal remained at the nasomaxillary region of the mice (Fig 5A and S6 Fig).
min (C and D) post-infection using bioluminescent imaging (IVIS Lumina system). (A) In vivo bioluminescence imaging at 15 min post-infection (n = 5). (B)
In vivo quantification of luminescent signal at 15 min post-infection (n = 5). (C) In vivo bioluminescence imaging at 60 min post-infection (n = 3). (D) In vivo
quantification of luminescent signal at 60 min post-infection (n = 3). The scale bar for radiance (below) was correlated with the signal intensity, where red
indicates higher signal and blue indicates a lower signal. Maximum and minimum signals are indicated at the right and left of the scale bar, respectively.
Numbers represent mean ± SEM. Data were analyzed using one tailed Mann-Whitney test. Statistical analysis was performed using GraphPad Prism 5.
* p<0.05; ** p < 0.01.
https://doi.org/10.1371/journal.pntd.0005507.g002
Target tissues in oral Chagas disease
PLOS Neglected Tropical Diseases | https://doi.org/10.1371/journal.pntd.0005507 April 5, 2017 8 / 26
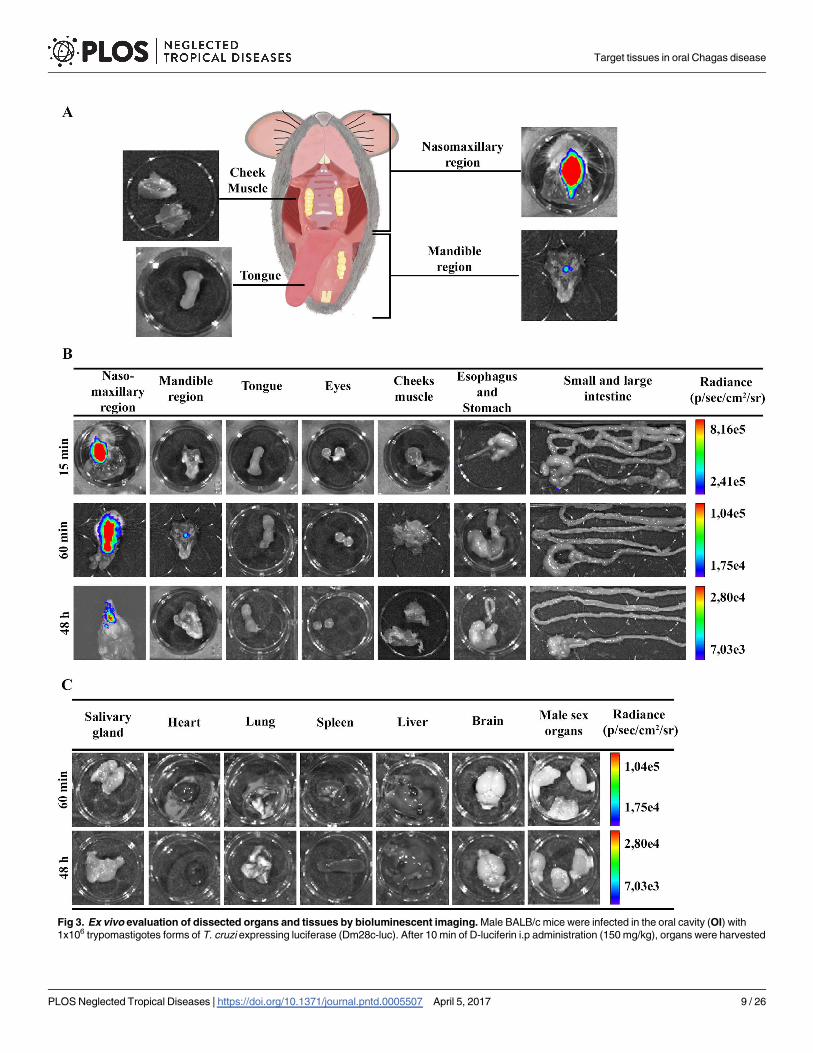
Fig 3. Ex vivo evaluation of dissected organs and tissues by bioluminescent imaging. Male BALB/c mice were infected in the oral cavity (OI) with
1x10⁶ trypomastigotes forms of T. cruzi expressing luciferase (Dm28c-luc). After 10 min of D-luciferin i.p administration (150 mg/kg), organs were harvested
Target tissues in oral Chagas disease
PLOS Neglected Tropical Diseases | https://doi.org/10.1371/journal.pntd.0005507 April 5, 2017 9 / 26
Furthermore, after removal of the entire palate, nasal cavity and nasal septum region showed
the major bioluminescence signal (Fig 5A). Light foci were also detected in the palate in 75%
of OI mice, shown in Table 1, which describes the percentage T. cruzi-positive tissues analyzed
(Fig 5A and Table 1 and S6 Fig). Interestingly, at this moment of infection, images of T. cruziwere detected in the brain, located in the olfactory bulb region (Fig 5C and S6 Fig). Biolumi-
nescence was also detected in the cheek muscle, mandibular lymph nodes and mandible in
50% of OI mice (Fig 5A and 5C and Table 1 and S6 Fig) and 66.6% of spleens (Fig 5D and
Table 1). A slight bioluminescence signal was observed in the esophagus, liver, large and small
intestines, mesenteric fat and lymph nodes (Fig 5B and 5D and S6 Fig). Bioluminescent foci
were also detected in male sex organs, specifically in the testicle and epididymis fat in 33.33%
of OI mice (Fig 5E and Table 1 and S6 Fig). The bioluminescence signal was undetected at this
time in the tongue, eyes, stomach, pituitary gland, salivary gland, lung and heart (Fig 5A, 5B,
5C and 5F and S6 Fig). In agreement with initial bioluminescent images, a large number of T.
cruzi Dm28c-GFP amastigote nests are detected in the nasal cavity of OI mice at 6 dpi (Fig 6).
At 21 dpi, bioluminescence was clearly observed in the nasomaxillary region, palate, mandi-
ble region, cheek muscle, esophagus, mandibular lymph nodes, spleen, liver, mesenteric fat
and lymph nodes and male sex organ (Fig 5A, 5B, 5C, 5D and 5E and S7 Fig). The major
affected tissues and organs in the genital region were penis and preputial gland (Fig 5E). In
addition, tissues such as the salivary glands, heart and lung started to reveal parasite presence
at this moment (Fig 5C and 5F and S7 Fig). At this time of infection, we also observed an
increased signal of bioluminescence in the gastrointestinal tract, mostly in the stomach, intes-
tines and mesenteric fat (Fig 5B and 5D and S7 Fig). Bioluminescence signal was observed in
75% of the intestines analyzed and in 50% of stomach and esophagus (Fig 5B and Table 1 and
S7 Fig). Finally, at 21 dpi, the ex vivo evaluation revealed that parasites were disseminated to
different organs of the body.
In conclusion, at 7 and 21 dpi, T. cruzi spreads to other parts of the body, infecting other
organs. The persistence of bioluminescence signal emitted from the nasomaxillary region sug-
gested the existence of a general maintenance of parasite proliferation in this region.
Quantitative PCR detected parasite loads correlated with ex vivo
bioluminescence and confirmed the nasal cavity as the major site of
parasite burden
In contrast to the classical techniques, bioluminescence imaging is able to identify small foci of
infection in the whole animal, but, in some cases, bioluminescent signal can be under detection
limits. Quantitative real-time PCR (qPCR) is an accurate technique to evaluate the presence of
parasites in tissues. To examine the parasite burden in target tissues, we collected tissues from
orally infected mice at 60 min, 7 and 21 dpi and performed qPCR to compute parasite load.
Initially, tissues of the oral cavity, the gastrointestinal tract and adjacent regions, such as the
nasal cavity, tongue, palate, mandibular lymph nodes, esophagus, stomach, large and small
intestines were all analyzed by qPCR.
and images were captured using an IVIS Lumina II system. (A) Schematic picture for anatomic localization of organs and tissues analyzed. Nasomaxillary
region includes all tissues from regions of the nose, nasal cavity and upper region of the oral cavity with exception of the cheek muscle. Mandible region
includes all tissues of the mandible and the lower region of the oral cavity, with exception of the tongue (B and C). Ex vivo bioluminescence imaging from
selected organs and tissues at 15 min (n = 3), 60 min (n = 4 in the nasomaxilary region; n = 2 in other organs) and 48 hours (n = 5) post-infection. The scale
bar for radiance (right) was correlated with the signal intensity, where red indicates higher signal and blue indicates a lower signal. Maximum and minimum
signals are indicated at the top and bottom of the scale bar, respectively.
https://doi.org/10.1371/journal.pntd.0005507.g003
Target tissues in oral Chagas disease
PLOS Neglected Tropical Diseases | https://doi.org/10.1371/journal.pntd.0005507 April 5, 2017 10 / 26
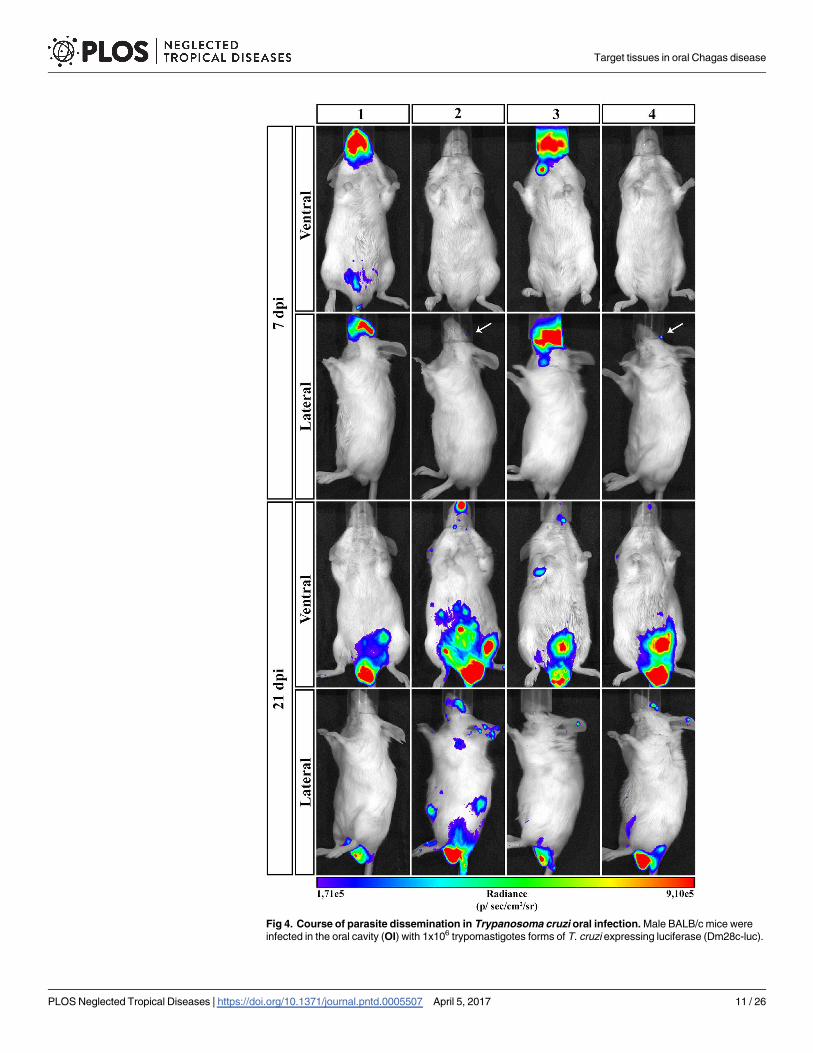
Fig 4. Course of parasite dissemination in Trypanosoma cruzi oral infection. Male BALB/c mice were
infected in the oral cavity (OI) with 1x10⁶ trypomastigotes forms of T. cruzi expressing luciferase (Dm28c-luc).
Target tissues in oral Chagas disease
PLOS Neglected Tropical Diseases | https://doi.org/10.1371/journal.pntd.0005507 April 5, 2017 11 / 26
Consistent with the bioluminescence results observed in the nasomaxillary region at 60 min
(Fig 3B) and 7 dpi (Fig 5A), T. cruzi foci were detected in elevated numbers at the nasal cavity
by qPCR. The first hour after infection showed T. cruzi Sat DNA detection in the nasal cavity
among 80% of OI mice, with parasite quantification up to 560 parasite equivalents/g (par.eq./
g) (mean of 180) (Fig 7A and Table 1). Parasite amplification was also detected in the esopha-
gus, stomach, small intestine and large intestine (Fig 7A), although these tissues were negative
by bioluminescence imaging (Fig 3B). Interestingly, at 60 min, SatDNA detection was
observed in one OI mouse at the esophagus, small intestine and large intestine (Fig 7A). Fur-
thermore, T. cruzi SatDNA was detected in 75% of the analyzed OI mice in the stomach and
mandibular lymph nodes at 60 min, with T. cruzi quantification up to 191.1 (mean of 52.0)
and up to 1.63 (mean of 1.0) par.eqs./g, respectively (Fig 7A and Table 1).
In addition, SatDNA T. cruzi quantification in the nasal cavity was much higher at 7 dpi,
ranging from 6.2x10³ to 7.5x10⁶ par.eqs./g (mean of 2.2x10⁶) (Fig 7A). In this time points after
infection, nasal cavity showed the highest parasite load among the analyzed tissues. Interest-
ingly, mandibular lymph nodes also showed high parasite loads, ranging from 31.2 to 6300
par.eqs./g (mean of 3.5 x 10³) (Fig 7A). It becomes evident that the mean parasite load detected
in the nasal cavity was 103 times higher than in the other organs (Fig 7A).
At 21 dpi, due to parasite dissemination, high levels of par.eqs./g were detected in all tissues
(Fig 7A), in accordance to the bioluminescence imaging. In addition, it was not possible to
detect parasite presence in the palate and tongue due to PCR inhibition (no amplification of
the qualitative exogenous internal amplification control (IAC). To evaluate parasite dissemina-
tion throughout the body and to determine if there was any correlation with the biolumines-
cence signal, we analyzed parasite load in the pituitary gland, brain, heart, spleen and liver at
60 min, 7 and 21 dpi. Ex vivo imaging of the brain, spleen and liver did not reveal any biolumi-
nescence signal at 60 min (Fig 3C). As expected, qPCR results confirmed the bioluminescence
imaging and T. cruzi DNA amplification was undetectable in these organs (Fig 7B). Low
amount of parasite detection was observed in the heart of a single animal (0.8 par.eq./g), at 60
min (Fig 7B). At 7 dpi, T. cruzi SatDNA was detected in the heart, spleen, liver and pituitary
gland (Fig 7B). Finally, at 21 dpi, parasite dissemination favored T. cruzi detection in all ana-
lyzed tissues (Fig 7B).
T. cruzi is highly genetically diverse and currently six Discrete Typing Units (DTU), TcI to
TcVI, are recognized [38]. TcI, TcII, TcIII, TcIV and TcVI genotype has been reported in oral
transmission of acute Chagas disease [18–25]. Because of this biological polymorphism, differ-
ent strains may present tropisms for distinct tissues (cardiac muscle, myoenteric plexuses in
the esophagus and rectum and others tissues) and consequently differences in the clinical
forms of the disease [40]. Due to this difference tissues tropism in T. cruzi strains, qPCR of gas-
trointestinal tract, nasal cavity and heart tissues from OI mice using a different strain (Tula-
huen strain, DTU—TcVI) was performed to compute parasite load. Tissues were collected at
60 min and 7 dpi from OI mice.
Consistent with the qPCR results observed in OI mice with Dm28c-luc strain (DTU- TcI)
(Fig 7), sixty minutes after infection, T. cruzi foci was detected in elevated numbers at the nasal
cavity in OI mice with Tulahuen strain (DTU- TcVI). T. cruzi presence was also detected in
the stomach at this time point (Fig 8). However, at 7dpi the highest SatDNA T. cruzi
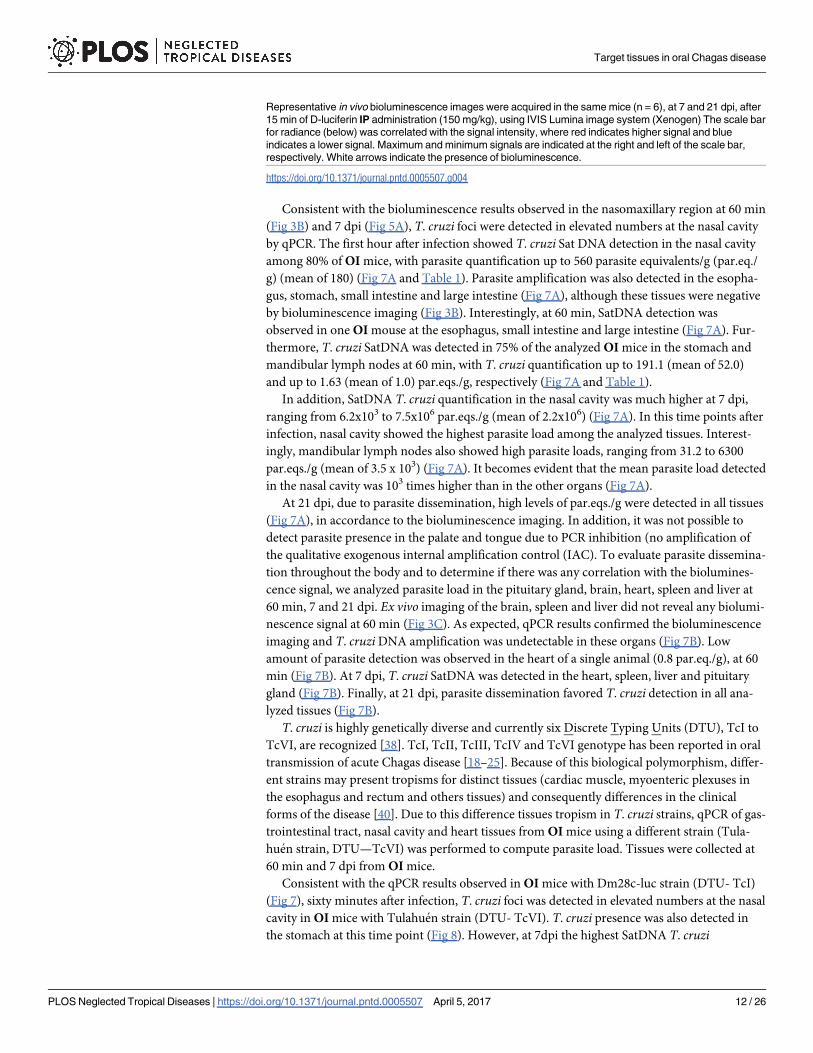
Representative in vivo bioluminescence images were acquired in the same mice (n = 6), at 7 and 21 dpi, after
15 min of D-luciferin IP administration (150 mg/kg), using IVIS Lumina image system (Xenogen) The scale bar
for radiance (below) was correlated with the signal intensity, where red indicates higher signal and blue
indicates a lower signal. Maximum and minimum signals are indicated at the right and left of the scale bar,
respectively. White arrows indicate the presence of bioluminescence.
https://doi.org/10.1371/journal.pntd.0005507.g004
Target tissues in oral Chagas disease
PLOS Neglected Tropical Diseases | https://doi.org/10.1371/journal.pntd.0005507 April 5, 2017 12 / 26
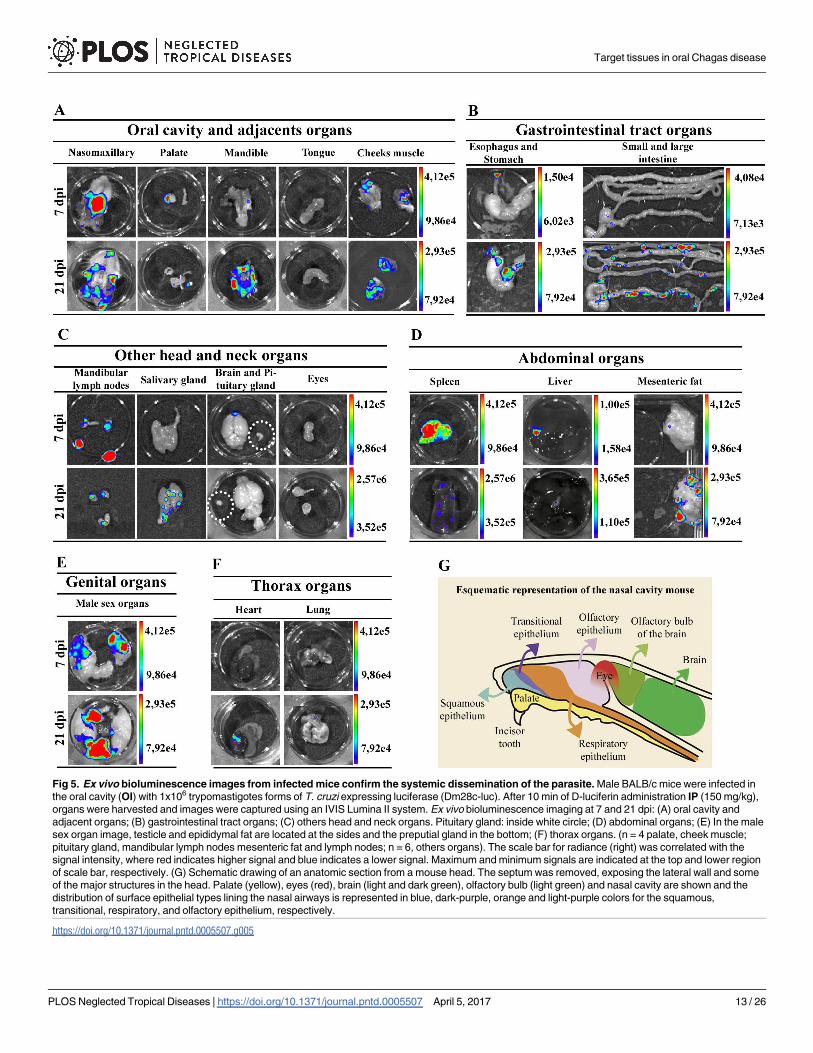
Fig 5. Ex vivo bioluminescence images from infected mice confirm the systemic dissemination of the parasite. Male BALB/c mice were infected in
the oral cavity (OI) with 1x10⁶ trypomastigotes forms of T. cruzi expressing luciferase (Dm28c-luc). After 10 min of D-luciferin administration IP (150 mg/kg),
organs were harvested and images were captured using an IVIS Lumina II system. Ex vivo bioluminescence imaging at 7 and 21 dpi: (A) oral cavity and
adjacent organs; (B) gastrointestinal tract organs; (C) others head and neck organs. Pituitary gland: inside white circle; (D) abdominal organs; (E) In the male
sex organ image, testicle and epididymal fat are located at the sides and the preputial gland in the bottom; (F) thorax organs. (n = 4 palate, cheek muscle;
pituitary gland, mandibular lymph nodes mesenteric fat and lymph nodes; n = 6, others organs). The scale bar for radiance (right) was correlated with the
signal intensity, where red indicates higher signal and blue indicates a lower signal. Maximum and minimum signals are indicated at the top and lower region
of scale bar, respectively. (G) Schematic drawing of an anatomic section from a mouse head. The septum was removed, exposing the lateral wall and some
of the major structures in the head. Palate (yellow), eyes (red), brain (light and dark green), olfactory bulb (light green) and nasal cavity are shown and the
distribution of surface epithelial types lining the nasal airways is represented in blue, dark-purple, orange and light-purple colors for the squamous,
transitional, respiratory, and olfactory epithelium, respectively.
https://doi.org/10.1371/journal.pntd.0005507.g005
Target tissues in oral Chagas disease
PLOS Neglected Tropical Diseases | https://doi.org/10.1371/journal.pntd.0005507 April 5, 2017 13 / 26
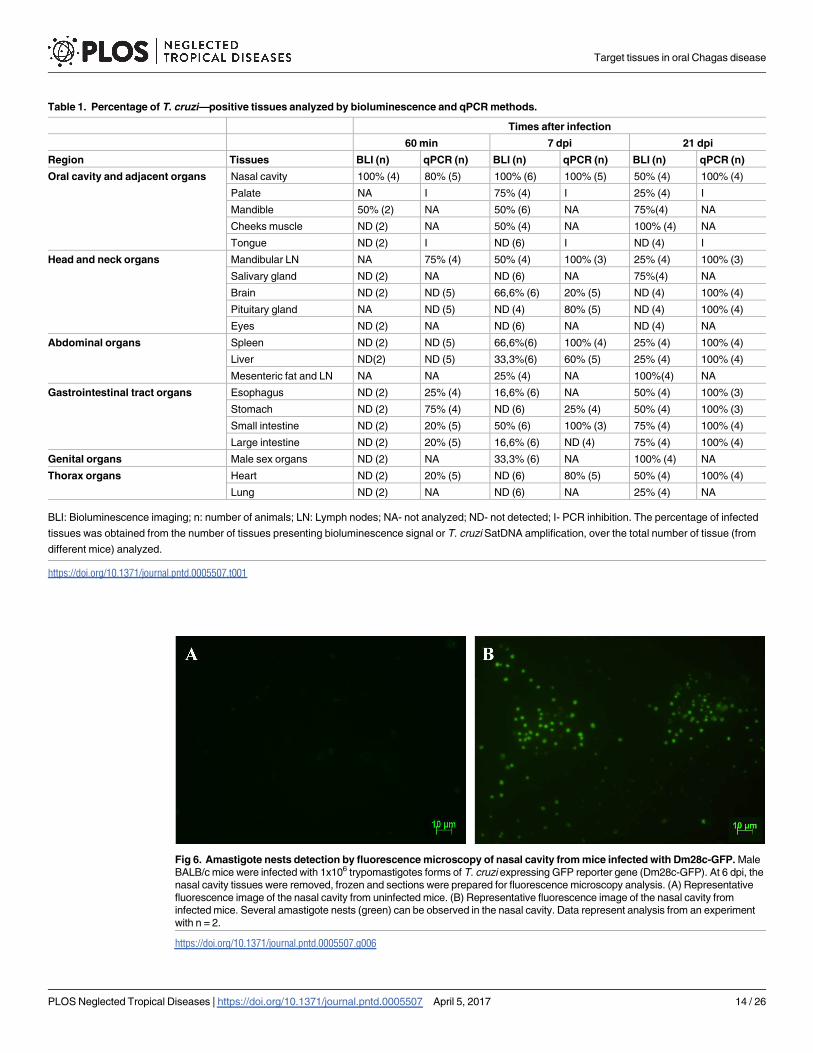
Table 1. Percentage of T. cruzi—positive tissues analyzed by bioluminescence and qPCR methods.
Times after infection
60 min 7 dpi 21 dpi
Region Tissues BLI (n) qPCR (n) BLI (n) qPCR (n) BLI (n) qPCR (n)
Oral cavity and adjacent organs Nasal cavity 100% (4) 80% (5) 100% (6) 100% (5) 50% (4) 100% (4)
Palate NA I 75% (4) I 25% (4) I
Mandible 50% (2) NA 50% (6) NA 75%(4) NA
Cheeks muscle ND (2) NA 50% (4) NA 100% (4) NA
Tongue ND (2) I ND (6) I ND (4) I
Head and neck organs Mandibular LN NA 75% (4) 50% (4) 100% (3) 25% (4) 100% (3)
Salivary gland ND (2) NA ND (6) NA 75%(4) NA
Brain ND (2) ND (5) 66,6% (6) 20% (5) ND (4) 100% (4)
Pituitary gland NA ND (5) ND (4) 80% (5) ND (4) 100% (4)
Eyes ND (2) NA ND (6) NA ND (4) NA
Abdominal organs Spleen ND (2) ND (5) 66,6%(6) 100% (4) 25% (4) 100% (4)
Liver ND(2) ND (5) 33,3%(6) 60% (5) 25% (4) 100% (4)
Mesenteric fat and LN NA NA 25% (4) NA 100%(4) NA
Gastrointestinal tract organs Esophagus ND (2) 25% (4) 16,6% (6) NA 50% (4) 100% (3)
Stomach ND (2) 75% (4) ND (6) 25% (4) 50% (4) 100% (3)
Small intestine ND (2) 20% (5) 50% (6) 100% (3) 75% (4) 100% (4)
Large intestine ND (2) 20% (5) 16,6% (6) ND (4) 75% (4) 100% (4)
Genital organs Male sex organs ND (2) NA 33,3% (6) NA 100% (4) NA
Thorax organs Heart ND (2) 20% (5) ND (6) 80% (5) 50% (4) 100% (4)
Lung ND (2) NA ND (6) NA 25% (4) NA
BLI: Bioluminescence imaging; n: number of animals; LN: Lymph nodes; NA- not analyzed; ND- not detected; I- PCR inhibition. The percentage of infected
tissues was obtained from the number of tissues presenting bioluminescence signal or T. cruzi SatDNA amplification, over the total number of tissue (from
different mice) analyzed.
https://doi.org/10.1371/journal.pntd.0005507.t001
Fig 6. Amastigote nests detection by fluorescence microscopy of nasal cavity from mice infected with Dm28c-GFP. Male
BALB/c mice were infected with 1x10⁶ trypomastigotes forms of T. cruzi expressing GFP reporter gene (Dm28c-GFP). At 6 dpi, the
nasal cavity tissues were removed, frozen and sections were prepared for fluorescence microscopy analysis. (A) Representative
fluorescence image of the nasal cavity from uninfected mice. (B) Representative fluorescence image of the nasal cavity from
infected mice. Several amastigote nests (green) can be observed in the nasal cavity. Data represent analysis from an experiment
with n = 2.
https://doi.org/10.1371/journal.pntd.0005507.g006
Target tissues in oral Chagas disease
PLOS Neglected Tropical Diseases | https://doi.org/10.1371/journal.pntd.0005507 April 5, 2017 14 / 26
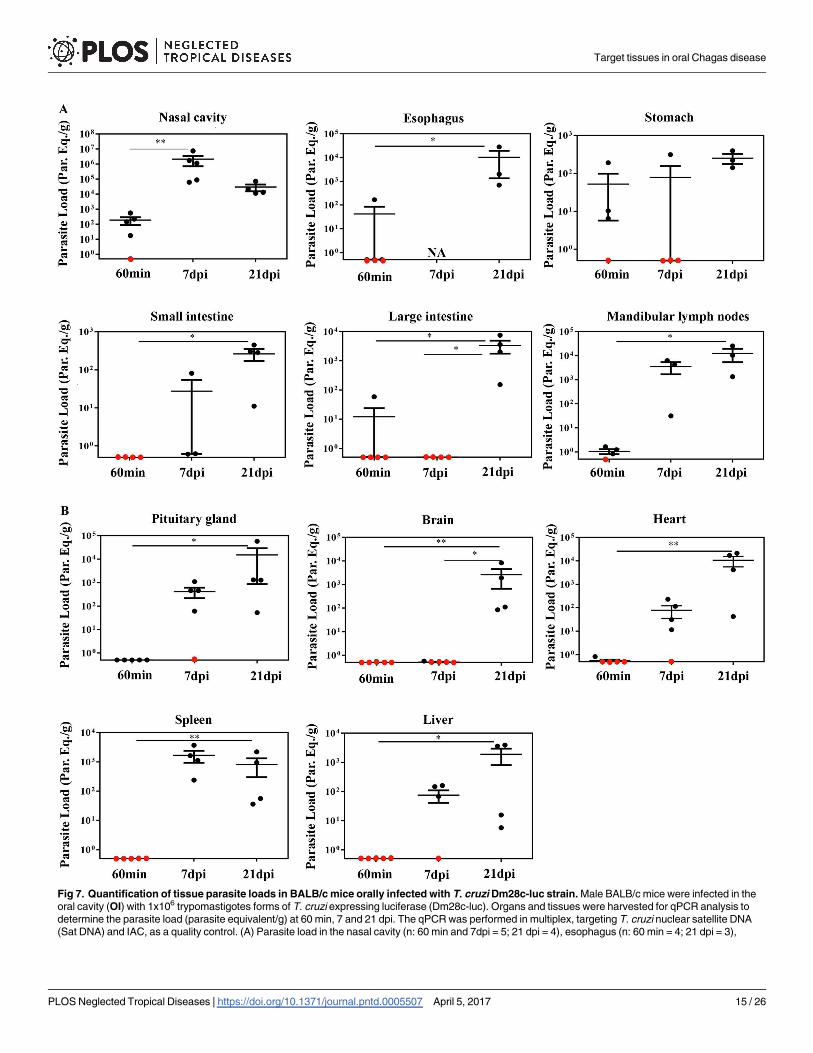
Fig 7. Quantification of tissue parasite loads in BALB/c mice orally infected with T. cruzi Dm28c-luc strain. Male BALB/c mice were infected in the
oral cavity (OI) with 1x10⁶ trypomastigotes forms of T. cruzi expressing luciferase (Dm28c-luc). Organs and tissues were harvested for qPCR analysis to
determine the parasite load (parasite equivalent/g) at 60 min, 7 and 21 dpi. The qPCR was performed in multiplex, targeting T. cruzi nuclear satellite DNA
(Sat DNA) and IAC, as a quality control. (A) Parasite load in the nasal cavity (n: 60 min and 7dpi = 5; 21 dpi = 4), esophagus (n: 60 min = 4; 21 dpi = 3),
Target tissues in oral Chagas disease
PLOS Neglected Tropical Diseases | https://doi.org/10.1371/journal.pntd.0005507 April 5, 2017 15 / 26
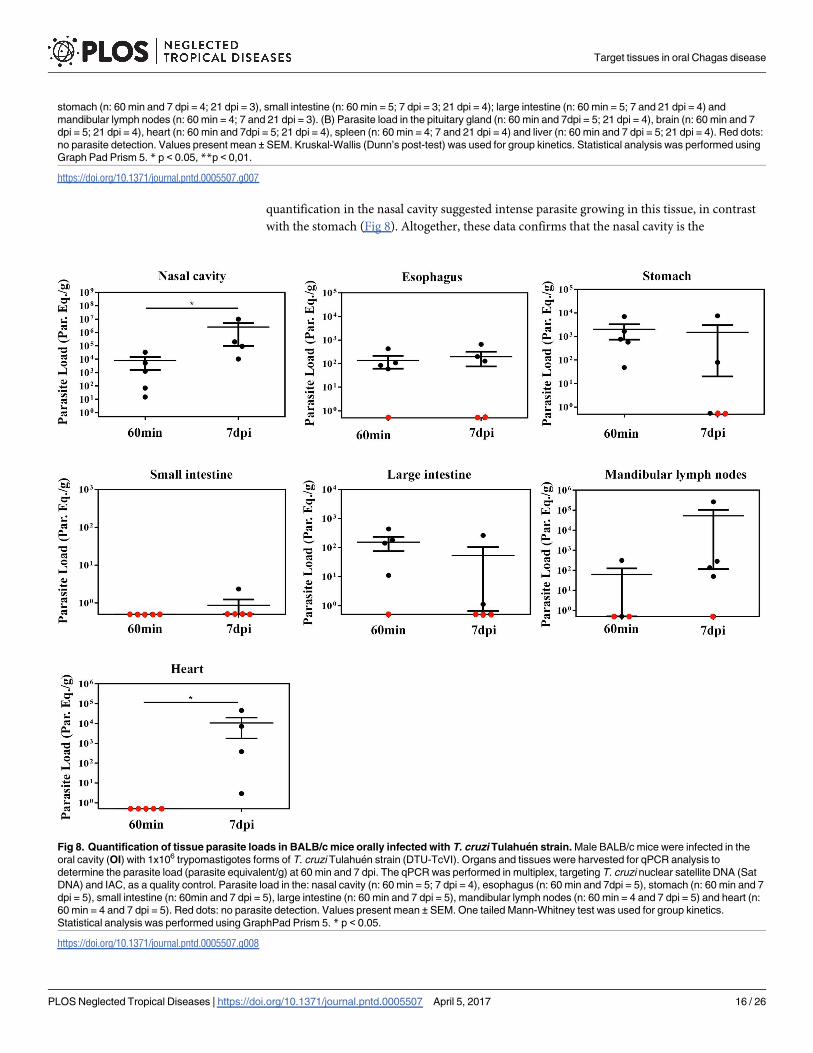
quantification in the nasal cavity suggested intense parasite growing in this tissue, in contrast
with the stomach (Fig 8). Altogether, these data confirms that the nasal cavity is the
stomach (n: 60 min and 7 dpi = 4; 21 dpi = 3), small intestine (n: 60 min = 5; 7 dpi = 3; 21 dpi = 4); large intestine (n: 60 min = 5; 7 and 21 dpi = 4) and
mandibular lymph nodes (n: 60 min = 4; 7 and 21 dpi = 3). (B) Parasite load in the pituitary gland (n: 60 min and 7dpi = 5; 21 dpi = 4), brain (n: 60 min and 7
dpi = 5; 21 dpi = 4), heart (n: 60 min and 7dpi = 5; 21 dpi = 4), spleen (n: 60 min = 4; 7 and 21 dpi = 4) and liver (n: 60 min and 7 dpi = 5; 21 dpi = 4). Red dots:
no parasite detection. Values present mean ± SEM. Kruskal-Wallis (Dunn’s post-test) was used for group kinetics. Statistical analysis was performed using
Graph Pad Prism 5. * p < 0.05, **p < 0,01.
https://doi.org/10.1371/journal.pntd.0005507.g007
Fig 8. Quantification of tissue parasite loads in BALB/c mice orally infected with T. cruzi Tulahuen strain. Male BALB/c mice were infected in the
oral cavity (OI) with 1x10⁶ trypomastigotes forms of T. cruzi Tulahuen strain (DTU-TcVI). Organs and tissues were harvested for qPCR analysis to
determine the parasite load (parasite equivalent/g) at 60 min and 7 dpi. The qPCR was performed in multiplex, targeting T. cruzi nuclear satellite DNA (Sat
DNA) and IAC, as a quality control. Parasite load in the: nasal cavity (n: 60 min = 5; 7 dpi = 4), esophagus (n: 60 min and 7dpi = 5), stomach (n: 60 min and 7
dpi = 5), small intestine (n: 60min and 7 dpi = 5), large intestine (n: 60 min and 7 dpi = 5), mandibular lymph nodes (n: 60 min = 4 and 7 dpi = 5) and heart (n:
60 min = 4 and 7 dpi = 5). Red dots: no parasite detection. Values present mean ± SEM. One tailed Mann-Whitney test was used for group kinetics.
Statistical analysis was performed using GraphPad Prism 5. * p < 0.05.
https://doi.org/10.1371/journal.pntd.0005507.g008
Target tissues in oral Chagas disease
PLOS Neglected Tropical Diseases | https://doi.org/10.1371/journal.pntd.0005507 April 5, 2017 16 / 26
preferential site T. cruzi infection and expansion in oral infection, regardless of DTU strain
specificity (Fig 8).
Interestingly, the percentage of OI mice with blood parasitemia at 7 and 21 dpi was 25%
and 56%, respectively. However, by assessing the percentage of infected mice in these same
points of infection using bioluminescent imaging (evaluating the presence of the biolumines-
cence signal) and qPCR (evaluating T. cruzi SatDNA amplification in tissue), 100% of OI mice
showed both bioluminescent signal and T. cruzi SatDNA amplification in tissues at 7 and 21
dpi. We conclude that the parasitemia is less sensitive to determine the percentage of infection
in animals inoculated by the oral route in our model, since the bioluminescence techniques
and qPCR showed signs of active infection in mice in these times.
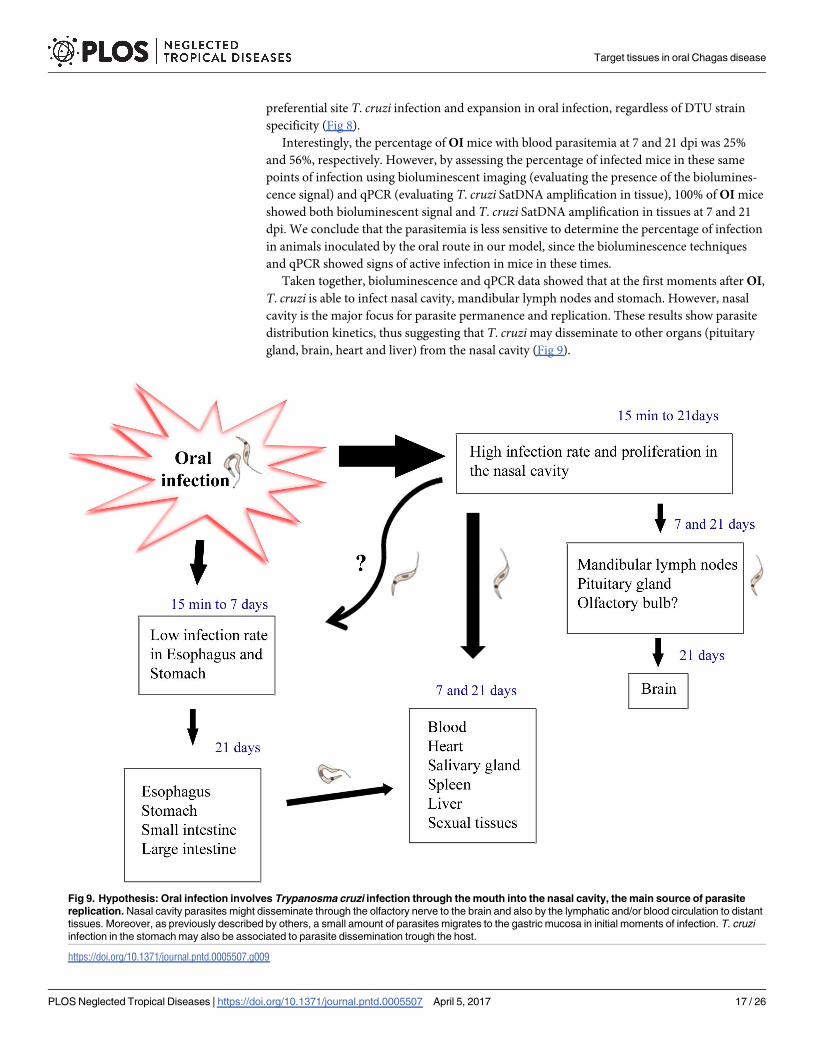
Taken together, bioluminescence and qPCR data showed that at the first moments after OI,
T. cruzi is able to infect nasal cavity, mandibular lymph nodes and stomach. However, nasal
cavity is the major focus for parasite permanence and replication. These results show parasite
distribution kinetics, thus suggesting that T. cruzi may disseminate to other organs (pituitary
gland, brain, heart and liver) from the nasal cavity (Fig 9).
Fig 9. Hypothesis: Oral infection involves Trypanosma cruzi infection through the mouth into the nasal cavity, the main source of parasite
replication. Nasal cavity parasites might disseminate through the olfactory nerve to the brain and also by the lymphatic and/or blood circulation to distant
tissues. Moreover, as previously described by others, a small amount of parasites migrates to the gastric mucosa in initial moments of infection. T. cruzi
infection in the stomach may also be associated to parasite dissemination trough the host.
https://doi.org/10.1371/journal.pntd.0005507.g009
Target tissues in oral Chagas disease
PLOS Neglected Tropical Diseases | https://doi.org/10.1371/journal.pntd.0005507 April 5, 2017 17 / 26
Discussion
In the past years, the number of oral Chagas disease outbreaks in Brazil and other Latin Amer-
ica countries are increasing. Presently, the most common pathway of T. cruzi infection in the
Brazilian Amazon is the oral route and, from 2000 to 2013, this pathway of infection was
responsible for 70% of acute cases in Brazil [4, 6].These outbreaks were associated with inges-
tion of contaminated food and beverage[11, 41]. Orally infected patients are frequently highly
symptomatic, presenting long-lasting fever, headache, facial and bipalpebral edema, lower
limb edema, myalgia, abdominal pain, meningoencephalitis and the classical cardiac involve-
ment [6, 9, 42–44]. Analysis of distinct outbreaks demonstrated that the mortality rate of
affected patients in the first two weeks of infection is estimated at 8–35%, considerably higher
than the mortality rate from the classical vectorial transmission (< 5–10%). The higher mortal-
ity rate can be associated with elevated prevalence of cardiac pathology and absence of an ear-
lier diagnosis [14, 43].
Despite being an important route of infection, there are few studies regarding T. cruzi oral
transmission in the literature. Previous data, using histopathology studies, showed signs of a
possible T. cruzi penetration in the oral, esophageal, gastric, and intestinal mucosa with a local
reaction with eosinophilia, infiltrated lymphocytes and monocytes after oral infection in dog
[45]. In contrast, some authors have demonstrated that orally T. cruzi infected mice involves
gastric mucosal invasion for the systemic infection. It has been shown, by histological analysis,
that T. cruzi infection is observed in the gastric mucosal epithelium. However, parasites were
not detected in other areas throughout the gastrointestinal tract, like esophagus and orophar-
ynx. These authors observed that T. cruzi initiates systemic parasite dissemination as a conse-
quence of an oral infection by gastric mucosal invasion [27]. By using intragastric or
intrapharyngeal challenge, another group observed that T. cruzi glycoproteins, such as gp82
and gp30, are important for gastric invasion. Prior to invasion, the parasite binds to gastric
mucin using these glycoproteins that allow T. cruzi to invade and replicate in the stomach [29,
31, 46, 47]. We have previously shown that the site of inoculation, through the oral cavity (OI)
or the stomach (by gavage-GI), differentially affects host immune response and mortality. OI
developed a highly severe acute disease with higher parasitemia, TNF serum levels, hepatitis
and mortality rates when compared to GI [15], suggesting that the inoculum site is a key factor
in Chagas disease progression, possibly modulating local immune mechanisms that impacts in
the systemic immunity. In addition, intraperitoneal (IP), intravenous and subcutaneous infec-
tion shows higher infection rates and mortality than mucosal ones (oral, intragastric, intrarec-
tal, genitalia or conjunctival) [33, 48, 49].
Here, we searched for the site of parasite entry in the host in orally infected mice. It is well
accepted that bioluminescence imaging is an innovative technique that helps the identification
of parasite distribution in distinct tissues, allowing a panoramic comprehension of T. cruzi dis-
semination in the entire animal body [34]. By using bioluminescence technique, we demon-
strated that, few minutes after OI, parasites are concentrated in the head region, specifically in
the nasomaxillary region (upper oral cavity, nose and nasal cavity). In a lesser intensity, para-
sites were also detected in the thorax and at the abdominal region. In addition, T. cruzi was
detected in the nasal cavity and draining lymph nodes at 60 min post-infection by qPCR, con-
firming that the nasal cavity has the highest parasite load among affected tissues, in contrast
with the stomach and intestines. In the same way, two and seven days after inoculums, images
revealed that the nasomaxillary region remains as the major focus of infection.
Interestingly, facial edema is a common feature in affected patients, being described in 57–
100% of cases in Brazilian outbreaks of oral infection [6]. Nevertheless, a contaminated sugar
cane juice outbreak of oral infection in Paraiba State (Brazil) revealed the presence of bilateral
Target tissues in oral Chagas disease
PLOS Neglected Tropical Diseases | https://doi.org/10.1371/journal.pntd.0005507 April 5, 2017 18 / 26
palpebral edema in 92% of orally infected patients [44]. An outbreak with contaminated fresh
guava juice in Venezuela showed that 40% of hospitalized patients had facial edema [50].
Moreover, another outbreak in Venezuela involving five members of the same family
described that all patients showed edema in the face, mouth and cheek, and edema and paraes-
thesia of the tongue [51]. Furthermore, other clinical finding in the face region, such as gingivi-
tis and dry cough has been attributed to the penetration of the parasite throughout the oral or
pharyngeal cavity [6, 43]. Interestingly, T. cruzi infection and gingival inflammatory foci has
been shown at the oral cavity from a chronic Chagas disease patient [52]. These findings might
be associated to our present data, which describe for the first time the nasomaxillary region as
the main target tissue following oral T. cruzi infection.
The mouth can be targeted by various infectious diseases, including viral, bacterial, and
fungal. The oral cavity contains distinct mucosal surfaces composed of sophisticated structures
and molecules, such as mucins, in which the microorganisms can bind and colonize the envi-
ronmental cells [53]. It has been shown that the soft palate is an important site of infection and
adaptation of influenza viruses. The soft palate infection may contribute to airborne transmis-
sion by providing a mucin-rich microenvironment and perhaps the initial region of infection.
In fact, the expression of α 2,3 sialic acids and viral hemagglutinin ligand is detected on the
soft palate in the regions of the oral surface, mainly at the basal cells, and the nasopharyngeal
tissues from humans and ferret [54]. Interestingly, α 2,3 sialic acids are the main molecule
involved in T. cruzi transialidase mediated binding. Transialidase has been considered as an
important virulence factor of T. cruzi, due to its ability to reduce host cell immune response
and mediate T. cruzi and host cells adhesion [55]. It has been shown that transialidase have
adhesive capacity with host sialoglycans, generating “eat me” signals in epithelial cells, facilitat-
ing the parasite entry into non-phagocytic cells [56]. Based in these previous studies we can
hypothesize that oral T. cruzi infection may occur on the palate, through the interaction of
transialidase molecules in the parasite membrane with α 2,3 sialic acids residues present in the
soft palate [54]. Other molecules may also be involved in T. cruzi adhesion with oral cavity
cells, such as mucins and glycoproteins such as gp82, gp30, gp90 [57].
Seven days after infection reveals that nasal cavity, nasal septum region, palate, cheek mus-
cles, mandible and mandibular lymph nodes are target tissues of the parasite. Surprisingly, the
mean parasite load detected by qPCR in the nasal cavity of OI mice with Dm28c-luc (DTU-
TcI), is 103 times higher than other tissues. This predominant T. cruzi detection in mouse
nasal cavity is also observed in OI mice with other T. cruzi strain (Tulahuen strain, DTU-
TcVI. Altogether this data suggesting that nasal cavity is the main site of T. cruzi maintenance
and replication following oral infection.
In the line with our findings, Giddings and colleagues demonstrated that nasal cavity is the
principal site of parasite infection and replication after conjunctival T. cruzi infection with
Tulahuen strain (DTU-TcVI). The predominant invasion occurs through epithelia lining nasal
cavity and nasolacrimal ducts. T. cruzi initially replicates within these sites and further spread
to draining lymphoid organs with systemic dissemination. In the nasal cavity, parasites were
detected in areas such as the submucosa of the epithelial lining the nasal septum, nasal
mucosa-associated lymphoid tissue and bone marrow of the facial bones surrounding the
nasal cavity [58]. Mice infected with the Tulahuen strain of T. cruzi by the intranasal route
shows higher brain parasitism than mice infected by the subcutaneous pathway [49]. It was
also observed that parasites gain access to the brain via olfactory nerve tissues. The authors
proposed that, within the first moments, parasites invade nasal cavity cells, multiply and then
migrate to the brain via the olfactory tissues [49]. Supporting this idea, we have observed that
after infection and multiplication of parasites in the nasal cavity of orally infected mice, biolu-
minescence imaging of T. cruzi at 7 dpi were detected in the bulbous olfactory region of the
Target tissues in oral Chagas disease
PLOS Neglected Tropical Diseases | https://doi.org/10.1371/journal.pntd.0005507 April 5, 2017 19 / 26
brain in orally infected mice. Interestingly, parasites were also detected by qPCR in the pitui-
tary gland at 7 and 21 dpi, but not in the central region of the brain at 7 dpi, turning positive at
21 dpi. Thus, we propose that brain infection is subsequent to the nasal cavity and the olfactory
nerve tissue commitment. Corroborating our results of T. cruzi detection in the pituitary gland
and in the brain, a previous study detected the parasite kinetoplast DNA in the pituitary gland
during the acute phase [59].
Despite bioluminescence imaging is able to identify small foci of infection in the tissues and
in the whole animal, this technique has limitations and some aspects that should be considered
[34, 37]. The detection sensitivity is dependent on several factors, such as the level of luciferase
expression, type of tissues, depth of labeled cells within the body and sensitivity of the detec-
tion system. Thus, in some cases, bioluminescent signal can be under the detection limit [37,
58–60]. As we have observed in our model, the percentages of T. cruzi-positive analyzed sam-
ples by bioluminescence and qPCR are different in some tissue (Table 1). Indeed in both pitui-
tary gland and the heart at 7 dpi the presence of T. cruzi was not detected by bioluminescence,
however it was detected by qPCR. This can be explained by higher sensibility of the qPCR
compared to bioluminescence, as the qPCR allows detection of at least 0.5 equivalents parasites
[61] and bioluminescence does not.
T. cruzi infection has been associated to disturbances in immune-endocrine systems, lead-
ing to activation in the hypothalamus–pituitary–adrenal (HPA) axis and high glucocorticoid
production. The high glucocorticoid secretion seems to limit the excessive production of pro-
inflammatory cytokines, protecting the host from tissue injury and metabolic alterations. Fur-
thermore, the elevated glucocorticoid production in the acute phase is involved in thymus
atrophy and immature T CD4+CD8+ cell apoptosis [60, 61].
In Fig 4 we observe that animals analyzed showed differences in bioluminescence signal.
Some animals present less intensity of bioluminescence signal in the head, demonstrating that
these animals have a lower parasitism in this region in that time point. Note that with 21dpi
these same animals presented a larger signal in the region in the nasal cavity, which shows that
they may have different evolution kinetics. This does not exclude the fact that they were
infected and presented high intensity of signal at the same regions as the others, but not exactly
at the same time. These differences between mice in T. cruzi infection can be observed also in
parasitemia (Fig 1) or in parasitism load at different tissues (Figs 7 and 8). Interestingly, we
can also see in Fig 7A a large difference in parasite load in the nasal cavity with 7 dpi between
animals analyzed by qPCR, although not analyzed in the same animals bioluminescence.
Interestingly, with the development of the infection and spread of T. cruzi, we observed the
presence of bioluminescence signal mainly in the male sexual organs (testicles, epedidimal fat,
preputial gland and epididymis). As described in previous studies, male sex organs are fre-
quently infected in T. cruzi experimental infections, including testes, penis, epididymis ducts
and accessory sex glands (prostate, preputial gland and seminal vesicle) of mice infected by IP
route [62–65]. In humans some cases of orchitis due to gonadal parasitism during the acute
phase of Chagas disease have been described. Furthermore, clinical manifestations of sexual
dysfunction such as decreased of libido, erection and ejaculation were reported [66–69].
Although the possibility of sexual transmission of T. cruzi has been suggested, few studies have
been published on this theme. In the acute phase of experimental infection, sexual transmis-
sion has been described, but with low transmission rates in uninfected and immunosuppressed
females through males infected by IP route [70]. Ribeiro and colleagues evaluated the potential
of sexually transmission of T. cruzi in the chronic phase with infected males to uninfected
females and vice versa by using mice infected via IP route. After copulation, 100% of the ani-
mals, both males as females seroconverted (ELISA and IF) and presented T. cruzi DNA in the
heart and skeletal muscle [71].
Target tissues in oral Chagas disease
PLOS Neglected Tropical Diseases | https://doi.org/10.1371/journal.pntd.0005507 April 5, 2017 20 / 26
In the present work, we have identified the site of T. cruzi initial invasion and replication
after infection through the oral route. Our results demonstrated that oral infection involves T.
cruzi passage through the mouth into the nasal cavity, where parasite replication occurs. Then,
nasal cavity parasites might disseminate through the olfactory nerve tissues and blood to dis-
tant tissues (Fig 9). Thus, the proper oral cavity operates as a potential source of infection, and
places the regional innate and adaptive immune systems as central players in the disease pro-
gression. Therefore, the elucidation of the tissue/organs targets and the molecular components
regulating the establishment of oral T. cruzi infection is critical to understanding the pathogen-
esis of this current form of Chagas’ disease.
Supporting information
S1 Fig. Flowchart of the total number of mice used in each experiment. Male BALB/c mice,
aged 6–8 weeks were used in all experiments and the number of animals used in each experi-
ment performed on different time post-infection was demonstrated in the flowchart.
n = number of animals, BLI = Bioluminescence imaging, LN = lymph nodes.
(TIF)
S2 Fig. Black ink inoculation via oral or intranasal cavity. Oral and intranasal inoculations
were performed using black ink suspension. Animals were analyzed after 5 min of inoculation,
the nasomaxillary region; tongue and nasal cavity were removed. To evaluate the nasal cavity
we removed the hard and soft palate exposing nasal septum and nasal cavity (n = 2).
(TIF)
S3 Fig. Bioluminescence of Dm28c-luc Trypanosoma cruzi trypomastigotes. In vitro activity
of luciferase of Trypanosoma cruzi Dm28c-luc strain. In a 24-well plate, 5x10⁴ trypomastigotes
were plated with D-luciferin (black circle) and negative control with medium RPMI with 10%
FBS (white circle). 150 μg / ml of D-luciferin substrate was added to the well and after 5 min of
incubation, image was acquired by IVIS Lumina system (Xenogen Corp., CA, USA). The scale
bar for radiance (below) was correlated with the signal intensity, where red indicates higher
signal and blue indicates a lower signal. Maximum and minimum signals are indicated at the
top at the right and left of the scale bar, respectively.
(TIF)
S4 Fig. Ex vivo evaluation of dissected organs and tissues from non-infected mice by biolu-
minescence imaging. Organs and tissues were removed after 10 min of D-luciferin (150 mg/
kg) IP administration from non-infected mice and images were acquired using IVIS Lumina
II system.
(TIF)
S5 Fig. In vivo bioluminescence imaging from non-infected mice. Male BALB/c mice were
inoculated with D-luciferin substrate, after 15 min of D-luciferin (150 mg/kg) IP administra-
tion images were acquired using IVIS Lumina II system. No background was visualized. The
scale bar for radiance (below) was correlated with the signal intensity, where red indicates
higher signal and blue indicates a lower signal. Maximum and minimum signals are indicated
at the top at the right and left of the scale bar, respectively.
(TIF)
S6 Fig. Ex vivo tissues bioluminescence images from OI mice at 7 dpi. Male BALB/c mice
were infected in the oral cavity (OI) with 1x10⁶ trypomastigotes forms of T. cruzi expressing
luciferase (Dm28c-luc). After 10 min of D-luciferin IP administration (150 mg/kg), organs
were harvested and images were captured using an IVIS Lumina II system. Ex vivo tissues
Target tissues in oral Chagas disease
PLOS Neglected Tropical Diseases | https://doi.org/10.1371/journal.pntd.0005507 April 5, 2017 21 / 26
bioluminescence imaging at 7 dpi of nasomaxillary region (n = 6), palate (n = 4), mandible
(n = 6), tongue (n = 6), cheek muscle (n = 4), esophagus and stomach (n = 6), small intestine
and large intestine (n = 6) male sex organs (n = 6), mandibular lymph nodes (n = 4), salivary
gland (n = 6), brain (n = 6) and pituitary gland (n = 4), eyes (n = 6), spleen (n = 6), liver
(n = 6), mesenteric fat and lymph nodes (n = 4), heart (n = 6) and lung (n = 6). In the male sex
organ image, testicle and epididymal fat are located at the sides and the preputial gland in the
bottom. Pituitary gland: inside white circle. The scale bar for radiance (right) was correlated
with the signal intensity, where red indicates higher signal and blue indicates a lower signal.
Maximum and minimum signals are indicated at the top and lower of scale bar, respectively.
White arrows indicate the presence of bioluminescence.
(TIF)
S7 Fig. Ex vivo tissues bioluminescence images from OI mice at 21 dpi. Male BALB/c mice
were infected in the oral cavity (OI) with 1x10⁶ trypomastigotes forms of T. cruzi expressing
luciferase (Dm28c-luc). After 10 min of D-luciferin IP administration (150 mg/kg), organs
were harvested and images were captured using an IVIS Lumina II system. Ex vivo biolumines-
cence imaging at 21 dpi of nasomaxillary region (n = 6), palate (n = 4), mandible (n = 6), ton-
gue (n = 6), cheek muscle (n = 4), esophagus and stomach (n = 6), small intestine and large
intestine (n = 6) male sex organs (n = 6), mandibular lymph nodes (n = 4), salivary gland
(n = 6), brain (n = 6) and pituitary gland (n = 4), eyes (n = 6), spleen (n = 6), liver (n = 6),
mesenteric fat and lymph nodes (n = 4), heart (n = 6) and lung (n = 6). In the male sex organ
image, testicle and epididymal fat are located at the sides and the preputial gland in the bottom.
Pituitary gland: inside white circle. The scale bar for radiance (right) was correlated with the
signal intensity, where red indicates higher signal and blue indicates a lower signal. Maximum
and minimum signals are indicated at the top and lower scale bar, respectively. White arrows
indicate the presence of bioluminescence.
(TIF)
Acknowledgments
We thank Dr. Christina Henriques and Mariana C. Waghabi from Oswaldo Cruz Foundation
for Trypanosoma cruzi Dm28c-luciferase and Dm28c-GFP supply.
Author Contributions
Conceptualization: JdM.
Formal analysis: JdM DSdS.
Funding acquisition: JdM.
Investigation: DSdS JBdA BG OCM DMSVV BASM MTR LRB.
Methodology: JdM BG OCM.
Project administration: JdM.
Resources: LRG WS VCdA.
Supervision: JdM.
Validation: CB AM LRG.
Writing – original draft: DSdS JdM.
Target tissues in oral Chagas disease
PLOS Neglected Tropical Diseases | https://doi.org/10.1371/journal.pntd.0005507 April 5, 2017 22 / 26
Writing – review & editing: JdM VCdA OCM CB.
References1. Coura JR, Vinas PA. Chagas disease: a new worldwide challenge. Nature. 465(7301):S6–7. https://
doi.org/10.1038/nature09221 PMID: 20571554
2. Gascon J, Bern C, Pinazo MJ. Chagas disease in Spain, the United States and other non-endemic
countries. Acta Trop. 2010; 115(1–2):22–7. Epub 2009/08/04. https://doi.org/10.1016/j.actatropica.
2009.07.019 PMID: 19646412
3. Schmunis GA, Yadon ZE. Chagas disease: a Latin American health problem becoming a world health
problem. Acta Trop. 2010; 115(1–2):14–21. Epub 2009/11/26. https://doi.org/10.1016/j.actatropica.
2009.11.003 PMID: 19932071
4. Toso MA, Vial UF, Galanti N. [Oral transmission of Chagas’ disease]. Rev Med Chil. 2011; 139(2):258–
66. Epub 2011/07/21. https://doi.org//S0034-98872011000200017 PMID: 21773665
5. Sanchez LV, Ramirez JD. Congenital and oral transmission of American trypanosomiasis: an overview
of physiopathogenic aspects. Parasitology. 2013; 140(2):147–59. Epub 2012/09/27. https://doi.org/10.
1017/S0031182012001394 PMID: 23010131
6. Shikanai-Yasuda MA, Carvalho NB. Oral transmission of Chagas disease. Clin Infect Dis. 2012; 54
(6):845–52. Epub 2012/01/13. https://doi.org/10.1093/cid/cir956 PMID: 22238161
7. Coura JR, de Abreu LL, Willcox HP, Petana W. [Comparative controlled study on the use of benznida-
zole, nifurtimox and placebo, in the chronic form of Chagas’ disease, in a field area with interrupted
transmission. I. Preliminary evaluation]. Rev Soc Bras Med Trop. 1997; 30(2):139–44. Epub 1997/03/
01. PMID: 9148337
8. Benchimol Barbosa PR. The oral transmission of Chagas’ disease: an acute form of infection responsi-
ble for regional outbreaks. Int J Cardiol. 2006; 112(1):132–3. https://doi.org/10.1016/j.ijcard.2005.11.
087 PMID: 16600406
9. Dias JP, Bastos C, Araujo E, Mascarenhas AV, Martins Netto E, Grassi F, et al. Acute Chagas disease
outbreak associated with oral transmission. Rev Soc Bras Med Trop. 2008; 41(3):296–300. Epub 2008/
08/23. PMID: 18719812
10. Ferreira CS, Martinho PC, Amato Neto V, Cruz RR. Pasteurization of human milk to prevent transmis-
sion of Chagas disease. Rev Inst Med Trop Sao Paulo. 2001; 43(3):161–2. Epub 2001/07/14. PMID:
11452325
11. Pereira KS, Schmidt FL, Guaraldo AM, Franco RM, Dias VL, Passos LA. Chagas’ disease as a food-
borne illness. J Food Prot. 2009; 72(2):441–6. Epub 2009/04/09. PMID: 19350996
12. Barbosa-Ferreira JM, Guerra JA, Santana Filho FS, Magalhaes BM, Coelho LI, Barbosa M. [Cardiac
involvement in Acute Chagas’ Disease cases in the Amazon region]. Arq Bras Cardiol. 2010; 94
(6):147–9. Epub 2010/07/14. PMID: 20625638
13. de Noya BA, Gonzalez ON. An ecological overview on the factors that drives to Trypanosoma cruzi oral
transmission. Acta Trop. 151:94–102. https://doi.org/10.1016/j.actatropica.2015.06.004 PMID:
26066984
14. Rassi A Jr., Rassi A, Marin-Neto JA. Chagas disease. Lancet. 2010; 375(9723):1388–402. Epub 2010/
04/20. https://doi.org/10.1016/S0140-6736(10)60061-X PMID: 20399979
15. Barreto-de-Albuquerque J, Silva-Dos-Santos D, Perez AR, Berbert LR, Santana-van-Vliet E, Farias-de-
Oliveira DA, et al. Trypanosoma cruzi Infection through the Oral Route Promotes a Severe Infection in
Mice: New Disease Form from an Old Infection? PLoS Negl Trop Dis. 9(6):e0003849. https://doi.org/
10.1371/journal.pntd.0003849 PMID: 26090667
16. de Noya BA, Gonzalez ON. An ecological overview on the factors that drives to Trypanosoma cruzi oral
transmission. Acta Trop.
17. Dias GB, Gruendling AP, Araujo SM, Gomes ML, Toledo MJ. Evolution of infection in mice inoculated
by the oral route with different developmental forms of Trypanosoma cruzi I and II. Exp Parasitol. 135
(3):511–7. https://doi.org/10.1016/j.exppara.2013.08.013 PMID: 23994765
18. Diaz-Bello Z, Thomas MC, Lopez MC, Zavala-Jaspe R, Noya O, BA DEN, et al. Trypanosoma cruzi
genotyping supports a common source of infection in a school-related oral outbreak of acute Chagas
disease in Venezuela. Epidemiol Infect. 142(1):156–62. https://doi.org/10.1017/S0950268813000757
PMID: 23544849
19. Steindel M, Kramer Pacheco L, Scholl D, Soares M, de Moraes MH, Eger I, et al. Characterization of
Trypanosoma cruzi isolated from humans, vectors, and animal reservoirs following an outbreak of
acute human Chagas disease in Santa Catarina State, Brazil. Diagn Microbiol Infect Dis. 2008; 60
(1):25–32. https://doi.org/10.1016/j.diagmicrobio.2007.07.016 PMID: 17889480
Target tissues in oral Chagas disease
PLOS Neglected Tropical Diseases | https://doi.org/10.1371/journal.pntd.0005507 April 5, 2017 23 / 26
20. Meza SK, Kaneshima EN, Silva Sde O, Gabriel M, de Araujo SM, Gomes ML, et al. Comparative patho-
genicity in Swiss mice of Trypanosoma cruzi IV from northern Brazil and Trypanosoma cruzi II from
southern Brazil. Exp Parasitol. 146:34–42. https://doi.org/10.1016/j.exppara.2014.08.014 PMID:
25296157
21. Monteiro WM, Magalhaes LK, Santana Filho FS, Borborema M, Silveira H, Barbosa MD. Trypanosoma
cruzi TcIII / Z3 genotype as agent of an outbreak of Chagas disease in the Brazilian Western Amazonia.
Trop Med Int Health.
22. Marcili A, Valente VC, Valente SA, Junqueira AC, da Silva FM, Pinto AY, et al. Trypanosoma cruzi in
Brazilian Amazonia: Lineages TCI and TCIIa in wild primates, Rhodnius spp. and in humans with Cha-
gas disease associated with oral transmission. Int J Parasitol. 2009; 39(5):615–23. https://doi.org/10.
1016/j.ijpara.2008.09.015 PMID: 19041313
23. Monteiro WM, Magalhaes LK, de Sa AR, Gomes ML, Toledo MJ, Borges L, et al. Trypanosoma cruzi IV
causing outbreaks of acute Chagas disease and infections by different haplotypes in the Western Bra-
zilian Amazonia. PLoS One. 7(7):e41284. https://doi.org/10.1371/journal.pone.0041284 PMID:
22848457
24. Ramirez JD, Montilla M, Cucunuba ZM, Florez AC, Zambrano P, Guhl F. Molecular epidemiology of
human oral Chagas disease outbreaks in Colombia. PLoS Negl Trop Dis. 7(2):e2041. https://doi.org/
10.1371/journal.pntd.0002041 PMID: 23437405
25. Andrade SG, Campos RF, Steindel M, Guerreiro ML, Magalhaes JB, Almeida MC, et al. Biological, bio-
chemical and molecular features of Trypanosoma cruzi strains isolated from patients infected through
oral transmission during a 2005 outbreak in the state of Santa Catarina, Brazil: its correspondence with
the new T. cruzi Taxonomy Consensus (2009). Mem Inst Oswaldo Cruz. 106(8):948–56.
26. Kirchhoff LV, Hoft DF. Immunization and challenge of mice with insect-derived metacyclic trypomasti-
gotes of Trypanosoma cruzi. Parasite Immunol. 1990; 12(1):65–74. PMID: 2107500
27. Hoft DF, Farrar PL, Kratz-Owens K, Shaffer D. Gastric invasion by Trypanosoma cruzi and induction of
protective mucosal immune responses. Infect Immun. 1996; 64(9):3800–10. Epub 1996/09/01. PubMed
Central PMCID: PMC174296. PMID: 8751932
28. Camandaroba EL, Pinheiro Lima CM, Andrade SG. Oral transmission of Chagas disease: importance
of Trypanosoma cruzi biodeme in the intragastric experimental infection. Rev Inst Med Trop Sao Paulo.
2002; 44(2):97–103. Epub 2002/06/06. PMID: 12048547
29. Cortez M, Neira I, Ferreira D, Luquetti AO, Rassi A, Atayde VD, et al. Infection by Trypanosoma cruzi
metacyclic forms deficient in gp82 but expressing a related surface molecule, gp30. Infect Immun.
2003; 71(11):6184–91. Epub 2003/10/24. PubMed Central PMCID: PMC219548. https://doi.org/10.
1128/IAI.71.11.6184-6191.2003 PMID: 14573635
30. Collins MH, Craft JM, Bustamante JM, Tarleton RL. Oral exposure to Trypanosoma cruzi elicits a sys-
temic CD8(+) T cell response and protection against heterotopic challenge. Infect Immun. 2011; 79
(8):3397–406. Epub 2011/06/02. PubMed Central PMCID: PMC3147593. https://doi.org/10.1128/IAI.
01080-10 PMID: 21628516
31. Covarrubias C, Cortez M, Ferreira D, Yoshida N. Interaction with host factors exacerbates Trypano-
soma cruzi cell invasion capacity upon oral infection. Int J Parasitol. 2007; 37(14):1609–16. Epub 2007/
07/21. https://doi.org/10.1016/j.ijpara.2007.05.013 PMID: 17640647
32. de Meis J, Morrot A, Farias-de-Oliveira DA, Villa-Verde DM, Savino W. Differential regional immune
response in chagas disease. PLoS Negl Trop Dis. 2009; 3(7):e417. https://doi.org/10.1371/journal.
pntd.0000417 PMID: 19582140
33. de Meis J, Barreto-de-Albuquerque J, Silva-dos-Santos D, Farias-de-Oliveira DA, Berbert LR, Cotta-
de-Almeida V, et al. Trypanosoma cruzi entrance through systemic or mucosal infection sites differen-
tially modulates regional immune response following acute infection in mice. Frontiers in Immunology.
2013; 4(216):1–7. Epub 2013/07/26.
34. Hutchens M, Luker GD. Applications of bioluminescence imaging to the study of infectious diseases.
Cell Microbiol. 2007; 9(10):2315–22. https://doi.org/10.1111/j.1462-5822.2007.00995.x PMID:
17587328
35. Henriques C, Castro DP, Gomes LH, Garcia ES, de Souza W. Bioluminescent imaging of Trypanosoma
cruzi infection in Rhodnius prolixus. Parasit Vectors. 5:214. https://doi.org/10.1186/1756-3305-5-214
PMID: 23013827
36. Hyland KV, Asfaw SH, Olson CL, Daniels MD, Engman DM. Bioluminescent imaging of Trypanosoma
cruzi infection. Int J Parasitol. 2008; 38(12):1391–400. https://doi.org/10.1016/j.ijpara.2008.04.002
PMID: 18511053
37. Henriques C, Henriques-Pons A, Meuser-Batista M, Ribeiro AS, de Souza W. In vivo imaging of mice
infected with bioluminescent Trypanosoma cruzi unveils novel sites of infection. Parasit Vectors. 7:89.
https://doi.org/10.1186/1756-3305-7-89 PMID: 24589192
Target tissues in oral Chagas disease
PLOS Neglected Tropical Diseases | https://doi.org/10.1371/journal.pntd.0005507 April 5, 2017 24 / 26
38. Zingales B, Andrade SG, Briones MR, Campbell DA, Chiari E, Fernandes O, et al. A new consensus for
Trypanosoma cruzi intraspecific nomenclature: second revision meeting recommends TcI to TcVI.
Mem Inst Oswaldo Cruz. 2009; 104(7):1051–4. PMID: 20027478
39. Ramirez JC, Cura CI, da Cruz Moreira O, Lages-Silva E, Juiz N, Velazquez E, et al. Analytical Valida-
tion of Quantitative Real-Time PCR Methods for Quantification of Trypanosoma cruzi DNA in Blood
Samples from Chagas Disease Patients. J Mol Diagn. 2015; 17(5):605–15. PubMed Central PMCID:
PMCPMC4698797. https://doi.org/10.1016/j.jmoldx.2015.04.010 PMID: 26320872
40. Andrade LO, Machado CR, Chiari E, Pena SD, Macedo AM. Differential tissue distribution of diverse
clones of Trypanosoma cruzi in infected mice. Mol Biochem Parasitol. 1999; 100(2):163–72. Epub
1999/07/03. PMID: 10391378
41. Bastos CJ, Aras R, Mota G, Reis F, Dias JP, de Jesus RS, et al. Clinical outcomes of thirteen patients
with acute chagas disease acquired through oral transmission from two urban outbreaks in northeastern
Brazil. PLoS Negl Trop Dis. 2010; 4(6):e711. PubMed Central PMCID: PMCPMC2886048. https://doi.
org/10.1371/journal.pntd.0000711 PMID: 20559542
42. Shikanai-Yasuda MA, Marcondes CB, Guedes LA, Siqueira GS, Barone AA, Dias JC, et al. Possible
oral transmission of acute Chagas’ disease in Brazil. Rev Inst Med Trop Sao Paulo. 1991; 33(5):351–7.
PMID: 1844961
43. Alarcon de Noya B, Diaz-Bello Z, Colmenares C, Ruiz-Guevara R, Mauriello L, Zavala-Jaspe R, et al.
Large urban outbreak of orally acquired acute Chagas disease at a school in Caracas, Venezuela. J
Infect Dis. 2010; 201(9):1308–15. https://doi.org/10.1086/651608 PMID: 20307205
44. da Silva NN, Clausell DT, Nolibos H, de Mello AL, Ossanai J, Rapone T, et al. [Epidemic outbreak of
Chagas disease probably due to oral contamination]. Rev Inst Med Trop Sao Paulo. 1968; 10(5):265–
76. PMID: 4178818
45. de Noya BAN O.; Robertson L. J. Trypanosoma cruzi as a foodborne pathogen: Springer 2015. 92 p.
46. Yoshida N. Molecular mechanisms of Trypanosoma cruzi infection by oral route. Mem Inst Oswaldo
Cruz. 2009; 104 Suppl 1:101–7.
47. Staquicini DI, Martins RM, Macedo S, Sasso GR, Atayde VD, Juliano MA, et al. Role of GP82 in the
selective binding to gastric mucin during oral infection with Trypanosoma cruzi. PLoS Negl Trop Dis.
2010; 4(3):e613. Epub 2010/03/09. PubMed Central PMCID: PMC2830468. https://doi.org/10.1371/
journal.pntd.0000613 PMID: 20209152
48. Marsden PD. Trypanosoma cruzi infections in CFI mice. II. Infections induced by different routes. Ann
Trop Med Parasitol. 1967; 61(1):62–7. Epub 1967/03/01. PMID: 6051540
49. Caradonna K, Pereiraperrin M. Preferential brain homing following intranasal administration of Trypano-
soma cruzi. Infect Immun. 2009; 77(4):1349–56. https://doi.org/10.1128/IAI.01434-08 PMID: 19168740
50. Alarcon de Noya B, Veas J, Ruiz-Guevara R, Martın A, Rojas C, Machado I, et al. Clinical and labora-
tory evaluation of hospitalized patients from the first oral transmitted urban outbreak of Chagas disease
in Venezuela. Rev Patol Trop 2013; 42:177–86.
51. Añez N, Crisante G, Rojas A, Davila D. Acute Chagas disease outbreak of possible oral transmission in
Merida, Venezuela. Boletın de malariologıa y salud ambiental. 2013; LIII(1):1–11.
52. Anez N, Crisante G, Caraballo F, Delgado W, Parada H. Trypanosoma cruzi persistence at oral inflam-
matory foci in chronic chagasic patients. Acta Trop. 2011; 117(3):207–11. https://doi.org/10.1016/j.
actatropica.2010.12.010 PMID: 21215250
53. Wu RQ, Zhang DF, Tu E, Chen QM, Chen W. The mucosal immune system in the oral cavity-an orches-
tra of T cell diversity. Int J Oral Sci. 2014; 6(3):125–32. PubMed Central PMCID: PMCPMC4170154.
https://doi.org/10.1038/ijos.2014.48 PMID: 25105816
54. Lakdawala SS, Jayaraman A, Halpin RA, Lamirande EW, Shih AR, Stockwell TB, et al. The soft palate
is an important site of adaptation for transmissible influenza viruses. Nature. 2015; 526(7571):122–5.
PubMed Central PMCID: PMCPMC4592815. https://doi.org/10.1038/nature15379 PMID: 26416728
55. Freire-de-Lima L, Fonseca LM, Oeltmann T, Mendonca-Previato L, Previato JO. The trans-sialidase,
the major Trypanosoma cruzi virulence factor: Three decades of studies. Glycobiology. 2015; 25
(11):1142–9. https://doi.org/10.1093/glycob/cwv057 PMID: 26224786
56. Butler CE, de Carvalho TM, Grisard EC, Field RA, Tyler KM. Trans-sialidase stimulates eat me
response from epithelial cells. Traffic. 2013; 14(7):853–69. PubMed Central PMCID:
PMCPMC3770925. https://doi.org/10.1111/tra.12078 PMID: 23601193
57. Barrias ES, de Carvalho TM, De Souza W. Trypanosoma cruzi: Entry into Mammalian Host Cells and
Parasitophorous Vacuole Formation. Front Immunol. 2013; 4:186. PubMed Central PMCID:
PMCPMC3730053. https://doi.org/10.3389/fimmu.2013.00186 PMID: 23914186
Target tissues in oral Chagas disease
PLOS Neglected Tropical Diseases | https://doi.org/10.1371/journal.pntd.0005507 April 5, 2017 25 / 26
58. Giddings OK, Eickhoff CS, Smith TJ, Bryant LA, Hoft DF. Anatomical route of invasion and protective
mucosal immunity in Trypanosoma cruzi conjunctival infection. Infect Immun. 2006; 74(10):5549–60.
PubMed Central PMCID: PMCPMC1594886. https://doi.org/10.1128/IAI.00319-06 PMID: 16988230
59. Correa-de-Santana E, Paez-Pereda M, Theodoropoulou M, Kenji Nihei O, Gruebler Y, Bozza M, et al.
Hypothalamus-pituitary-adrenal axis during Trypanosoma cruzi acute infection in mice. J Neuroimmu-
nol. 2006; 173(1–2):12–22. https://doi.org/10.1016/j.jneuroim.2005.08.015 PMID: 16494952
60. Roggero E, Perez AR, Bottasso OA, Besedovsky HO, Del Rey A. Neuroendocrine-immunology of
experimental Chagas’ disease. Ann N Y Acad Sci. 2009; 1153:264–71. https://doi.org/10.1111/j.1749-
6632.2008.03982.x PMID: 19236349
61. Roggero E, Perez AR, Tamae-Kakazu M, Piazzon I, Nepomnaschy I, Besedovsky HO, et al. Endoge-
nous glucocorticoids cause thymus atrophy but are protective during acute Trypanosoma cruzi infec-
tion. J Endocrinol. 2006; 190(2):495–503. https://doi.org/10.1677/joe.1.06642 PMID: 16899582
62. Carvalho LO, Abreu-Silva AL, Hardoim Dde J, Tedesco RC, Mendes VG, da Costa SC, et al. Trypano-
soma cruzi and myoid cells from seminiferous tubules: interaction and relation with fibrous components
of extracellular matrix in experimental Chagas’ disease. Int J Exp Pathol. 2009; 90(1):52–7. PubMed
Central PMCID: PMCPMC2669618. https://doi.org/10.1111/j.1365-2613.2008.00592.x PMID:
19200251
63. Carvalho TL, Ribeiro RD, Lopes RA. The male reproductive organs in experimental Chagas’ disease. I.
Morphometric study of the vas deferens in the acute phase of the disease. Exp Pathol. 1991; 41
(4):203–14. PMID: 1906405
64. Lenzi HL, Castelo-Branco MT, Pelajo-Machado M, Oliveira DN, Gattass CR. Trypanosoma cruzi: com-
promise of reproductive system in acute murine infection. Acta Trop. 1998; 71(2):117–29. PMID:
9821461
65. Lenzi HL, Oliveira DN, Lima MT, Gattass CR. Trypanosoma cruzi: paninfectivity of CL strain during
murine acute infection. Exp Parasitol. 1996; 84(1):16–27. https://doi.org/10.1006/expr.1996.0086
PMID: 8888730
66. Lamano Carvalho TL, Ferreira AL, Sahao MA. [Changes in the human testis in Chagas’ disease. II. Mor-
phometric study of the interstitial tissue]. Rev Inst Med Trop Sao Paulo. 1982; 24(4):214–21. PMID:
6818666
67. Lamano Carvalho TL, Ferreira AL, Sahao MA. [Changes in the human testis in Chagas’ disease. I. Eval-
uation of the kinetics of the spermatogenesis]. Rev Inst Med Trop Sao Paulo. 1982; 24(4):205–13.
PMID: 6818665
68. Haddad J, Raia A. [Sexual changes after surgical treatment of congenital acquired megacolon]. AMB
Rev Assoc Med Bras. 1969; 15(12):509–12. PMID: 4984967
69. Hartz PH, Toledano D. Specific orchitis in Chagas’s disease. Doc Med Geogr Trop. 1954; 6(2):124–30.
PMID: 13182980
70. Martin DL, Lowe KR, McNeill T, Thiele EA, Roellig DM, Zajdowicz J, et al. Potential sexual transmission
of Trypanosoma cruzi in mice. Acta Trop. 2015; 149:15–8. https://doi.org/10.1016/j.actatropica.2015.
05.002 PMID: 25982870
71. Ribeiro M, Nitz N, Santana C, Moraes A, Hagstrom L, Andrade R, et al. Sexual transmission of Trypano-
soma cruzi in murine model. Exp Parasitol. 2016; 162:1–6. https://doi.org/10.1016/j.exppara.2015.12.
017 PMID: 26724377
Target tissues in oral Chagas disease
PLOS Neglected Tropical Diseases | https://doi.org/10.1371/journal.pntd.0005507 April 5, 2017 26 / 26


![[Index FAC] [Index CCVC] Enfermedad de Chagas/Chagas ... · [Index curso]€€ €€ Prevención y Tratamiento Jorge Mitelman La profilaxis de la Enfermedad de Chagas sería el](https://img.pdfslide.us/doc/110x75/5bb65a8d09d3f2f7768b9fda/index-fac-index-ccvc-enfermedad-de-chagaschagas-index-curso.jpg)