Embed Size (px)
Citation preview

Field-deployable, Quantitative, Rapid Identification of Active Ebola Virus Infection in Unprocessed Blood.
Kavit Shah MSc,1, 2 Emma Bentley BSc,3 Adam Tyler PhD,4 Kevin S. Richards PhD,5 Edward Wright PhD,3 Linda Easterbrook MSc,5 Diane Lee MSc,6 Claire Cleaver MSc,6 Louise Usher MSc,1 Jane E. Burton PhD,5 James K. Pitman BSc,5 Christine B. Bruce PhD,5 David Edge PhD,4 Martin Lee PhD,6 Nelson Nazareth MBA,4 David A. Norwood PhD,6 and, Sterghios A. Moschos PhD.*1,
3, 8
1. Westminster Genomic Services, Department of Biomedical Sciences, Faculty of Science and Technology, University of Westminster, 115 New Cavendish Str. London W1W 6UW, UK.
2. BGResearch Ltd., 6 The Business Centre, Harvard Way, Harvard Industrial Estate, Kimbolton, Huntingdon PE28 0NJ, UK.
3. Department of Biomedical Sciences, Faculty of Science and Technology, University of Westminster, 115 New Cavendish Str. London W1W 6UW, UK.
4. BioGene Ltd., 8 The Business Centre, Harvard Way, Harvard Industrial Estate, Kimbolton, Huntingdon PE28 0NJ, UK.
5. Public Health England, National Infection Service, High Containment Microbiology Department, Porton Down, Salisbury, Wiltshire, SP4 0JG, UK.
6. Fluorogenics LIMITED, Building 227, Tetricus Science Park, Dstl Porton Down, Salisbury, Wiltshire, SP4 0JQ, UK.
7. Diagnostic Systems Division, and Virology Division, United States Army Medical Research Institute of Infectious Diseases, Fort Detrick, MD 21701-5011, USA.
8. Department of Applied Sciences, Faculty of Health and Life Sciences, Northumbria University, C4.03 Ellison Building, Ellison Place, Newcastle Upon Tyne, Tyne and Wear, NE1 8ST, UK.
Electronic Supplementary Material (ESI) for Chemical Science.This journal is © The Royal Society of Chemistry 2017
Electronic Supplementary Information
Standards and surrogate template construction.MS2 coliphage is a 20 nm, non-enveloped, icosahedral virion with a positive RNA genome commercially available as Armored RNA®. It is considered a highly resilient particle that is used as a process/spike-in control for laboratory-based RT-qPCR involving complex RNA extraction and purification steps, e.g. in the Cepheid Xpert® RT-qPCR tests for human immunodeficiency virus (HIV). Filoviruses, however, are distinct to MS2 as their 80 nm x 14 m, string-like particle consists of a negative RNA strand packaged into a ribonucleoprotein complex surrounded by a lipid bilayer studded with glyocoprotein. More importantly, filoviruses are considered very unstable and easily fragmentable.22 Given the higher stability of Armored RNA®, we reasoned that using recombinant MS2 as a model would set a more stringent performance bar to our work. We therefore procured commercially a custom Armored RNA® standard (AR14) engineered to contain the concatenated amplicon sequences corresponding to the Trombley GP and NP assay targets, as encoded in the reference genome of the West African EBOV outbreak strain, EBOV Guinea-Makona (ESI Fig. 1). As a fallback, however, we also produced in-house recombinant, pseudotyped lentivirus (PV) based on HIV using our established triple plasmid approach.23 Unlike MS2 coliphage or indeed EBOV, the HIV virion is a ~120 nm particle consisting of a double stranded RNA genome packaged in a capsid, which is itself encapsulated in a glycoprotein-studded, lipid-envelope. The AR14 standard was supplied at 1012 GE/ml stock concentration as determined by supplier RT-qPCR using synthetic RNA standard curves, whereas PV constructs were quantified using nanoparticle tracking analysis after dilution in serum-free phosphate buffer saline (PBS; ESI Fig. 1B).
Impact of EBOV genetic drift on the Trombley diagnostic assay.We also took the opportunity to explore the impact of EBOV genetic drift on molecular diagnosis through our in-house produced PV standards. Thus, epidemiological deep sequencing data from West African EBOV isolates24 indicated single point mutations in the 2014 outbreak EBOV Guinea Makona genome as compared to the 1976 EBOV Yambuka-Ecran reference that had been used to engineer the Trombley assays (ESI Fig. 1). These differences were suggested24 to have minimal impact on diagnostic assay performance but remained untested. In line with these reports, nearest neighbor primer/probe hybridization computational modelling in our hands also indicated minimal changes for the affected primer and probe hybridization free energies (ESI Table 1). To confirm this experimentally we therefore manufactured two PV constructs: one featuring the Trombley assay target insert corresponding to EBOV Guinea-Makona (PV14), and one featuring the polymorphisms found in EBOV Yambuka-Ecran (PV76; ESI Table 2; ESI Fig. 1B). After extracting RNA from PV construct cell culture supernatants using the QIAamp Viral RNA Mini Kit (Qiagen, Manchester, UK), we performed RT-qPCR assays on serial RNA dilutions to evidence minimal differences on the GP assay reaction efficiency between the 1976 reference genome (104%; %CV <1.07%) and the 2014 outbreak genome (102%; %CV <3.58). Differences in assay efficiency when using the AR14 template (98.0%) or synthetic RNA as reported elsewhere (93.8%),9 were attributed to the distinct sequences flanking the amplification template in each construct, the template virion production methodology, and the infectious virion:GE ratio effect.9,12,13 Thus, our assay template inserts had been cloned within the 9.2 KB dsRNA PV14 genome extracted from eukaryotic cell culture supernatant or the 3.6 KB single stranded RNA AR14 genome produced in bacterial broth culture supernatants, as opposed to the relatively high purity, 55bp synthetic RNA template for the GP assay used by others.7 However, given the limited variance observed between the two PV constructs, these data reinforced the premise that EBOV genomic drift effected limited impact on diagnostic assay reliability.
Modelling far red dye multiplexing in the presence of blood.Mathematical linear42 and non-linear43 unmixing are spectrophotometric approaches well-established in confocal microscopy and flow cytometry that allow for highly reliable44 deconvolution of individual fluorescent dye contributions to a composite fluorescence trace. In its simplest form,42 a composite spectrum is the sum of individual dye contributions at a given wavelength, each contribution being the product of dye concentration multiplied by its reference (i.e. normalized) emission at the specific wavelength. Consequently, the specific contributions of each dye can then be calculated via linear least squares fitting, assuming dye-dye interaction that would alter their spectra. To model whether this might be possible to implement in qPCR and RT-qPCR through spectrophotometric signal acquisition, we first compared the emission spectrum overlap for a selection of far-red dyes as measured in blood-containing solutions (ESI Fig. 5A). In conjunction with the established peak signal to noise ratios for these dyes within a blood matrix, this comparison indicated that adequate emission peak separation might facilitate spectrophotometric signal deconvolution, e.g. when combining Quasar 670 with Quasar 705 (duplex) and even CAL635 (triplex). Thus, we proceeded to test whether multiplexing the GP, NP and RP assays was readily possible. However, in the absence of any additional reaction optimization, we observed competitive inhibition that resulted to loss of sensitivity. Reasoning that alteration of the Trombley assay specifications to facilitate multiplexing (primer and probe concentrations, let alone oligonucleotide sequences) would require revalidation of analytical specificity, we proceeded to computationally determine the key parameters that would facilitate probe-based RT-qPCR multiplexing by spectrophotometry in the presence of blood.PCR is a kinetic process that requires accurate signal deconvolution at each cycle to efficiently detect the onset of exponential template amplification, and thereby derive an estimate of template quantity. Moreover, unlike the continuous nature of fluorogenic data in microscopy, in qPCR, the fluorogenic signal at the emission peak of each dye follows a discontinuous sigmoidal curve (e.g. Fig. 2), with the linear segment characterized by a 2-fold fluorogenic signal increase typically spanning 6 PCR cycles before a plateau is reached. This corresponds to an ~3 log10 range of fluorogenic signal increase from background. Interestingly, kinetic spectral ratiometry45 has been successfully used to improve deconvolution accuracy. As a result, the composite spectra of dye mixtures at defined concentration ratios are plotted and spectral waveform cross-correlation analysis is used to eliminate intensity artefacts; importantly, the method also accommodates linear and non-linear relationships. The resulting plots are then used as ratiometric references to define individual dye contributions in unknown spectra, expressed as dye::dye ratios. This is similar to the use of endogenous control genes in qPCR as reference points for determining relative gene expression levels (the 2-Ct approach).46 An added complexity in our application however, was the background emission spectrum of blood. Background (tissue) fluorescence is indeed an issue in fluorescence microscopy, however to the best of our knowledge, this has not been factored in kinetic spectral ratiometry. We therefore decided to model the utility of such computational approaches in probe-based qPCR and RT-qPCR spectral de-multiplexing, in the context of a blood-containing reaction. Using blood spectra as a background threshold, and the experimentally derived, fluorogenic emission data of the dyes in the presence of blood as maximum readings, we constructed composite emission spectrum reference tables for combinations of 2 and 3 dyes, spanning a range of 6 individual dye concentrations. These concentration ranges corresponded to the theoretical 2-fold fluorescence increase per PCR cycle across the 6 cycles typically involved in the exponential phase of 100% efficient qPCR. Focusing on the emission peak of each dye, we then compared the composite signal level to the background blood emission intensity. Importantly, we set 2.5 standard deviations over the local (+/- 1nm) emission in the blood spectrum as a background threshold, given this safely exceeded the local background

maximae for all dye peaks. This analysis indicated that for the CAL635-Quasar 670 combination, amplification would be clearly detected for either target, as the composite emission signal at either 635 nm or 670 nm would remain below the blood background only if neither target amplified (ESI Fig. 5B, C). Use of the Quasar 705 dye, however, would restrict the composite emission signal below background at 705 nm irrespective of the alternative dye used (ESI Fig. 5D, E). Moreover, Quasar 705 would also impact upon detection at 635 nm or 670 nm for CAL635 (e.g. ESI Fig. 4F) or Quasar 670, respectively. On the other hand, in triplex format, the effect of Quasar 705 would be limited only to the 705 nm peak (ESI Fig. 4H-J). These results suggested that Quasar 705 would be useful only for the detection of high copy number targets where a fluorogenic maximum would be guaranteed, such as endogenous control genes or spike in controls. Thus, a pre-requisite for using Quasar 705 effectively in combination with CAL635 and Quasar 670 would be ensuring early amplification of the Quasar 705 target to avoid any loss of sensitivity for the second or third fluorescent dyes.
Testing the compatibility of far red fluorescent probes with fresh blood.For these experiments, a dual core fiber set up was used, operating as a reflection probe and 5mW fiber coupled laser diode (ProPhotonix, Salem, NH, USA) at 635nm as the excitation source. The laser diode was coupled into an 0.22NA 200 m Y fiber. The excitation light was filtered with an in line 650nm shortpass filter (Edmund optics, York, UK). The collection fiber was placed 0.7mm from the clear lid of the vessel and the spectrophotometer leg had a 650nm longpass filter to reject the laser line. The readings were taken on a MAYA LSL (Ocean Optics, Edinburgh, UK) with a 100ms integration time. All probes exhibited substantial emission peak signal increases in the presence of 8% v/v fresh human blood, with the exception of the Quasar 670/BHQ3 combination (ESI Fig. 4H). Thus, whilst use of BHQ2 increased peak intensity by 66% (ESI Fig. 4G), use of BHQ3 reduced it by 54.5%. Although at first glance this was attributed to quencher strength and probe stability, this may not be the case. Thus, whilst BHQ3 is a more powerful quencher, it is considered less stable than BHQ2. Accordingly, substitution of BHQ2 with BHQ3 reduced the peak intensities of both Quasar 670 and Quasar 705 in the absence of blood. The effect, however, only applied to Quasar 705 in the presence of blood, which would suggest blood caused the loss of BHQ3 in the Quasar 670 probe. Yet loss of BHQ3 quenching would be expected to lead to fluorogenic signal increase rather than the observed decrease. Alternatively, as the same oligonucleotide was used across these experiments, these findings might be indicative of altered membrane permeability and/or protein::probe interactions with cellular, extracellular and exosomal components in the blood matrix, on account of the physicochemical properties of individual quenchers in the context of specific fluorophores. This is a frequently overlooked issue, even though it has previously been shown to dramatically alter observations in cell34 and animal35 assays.
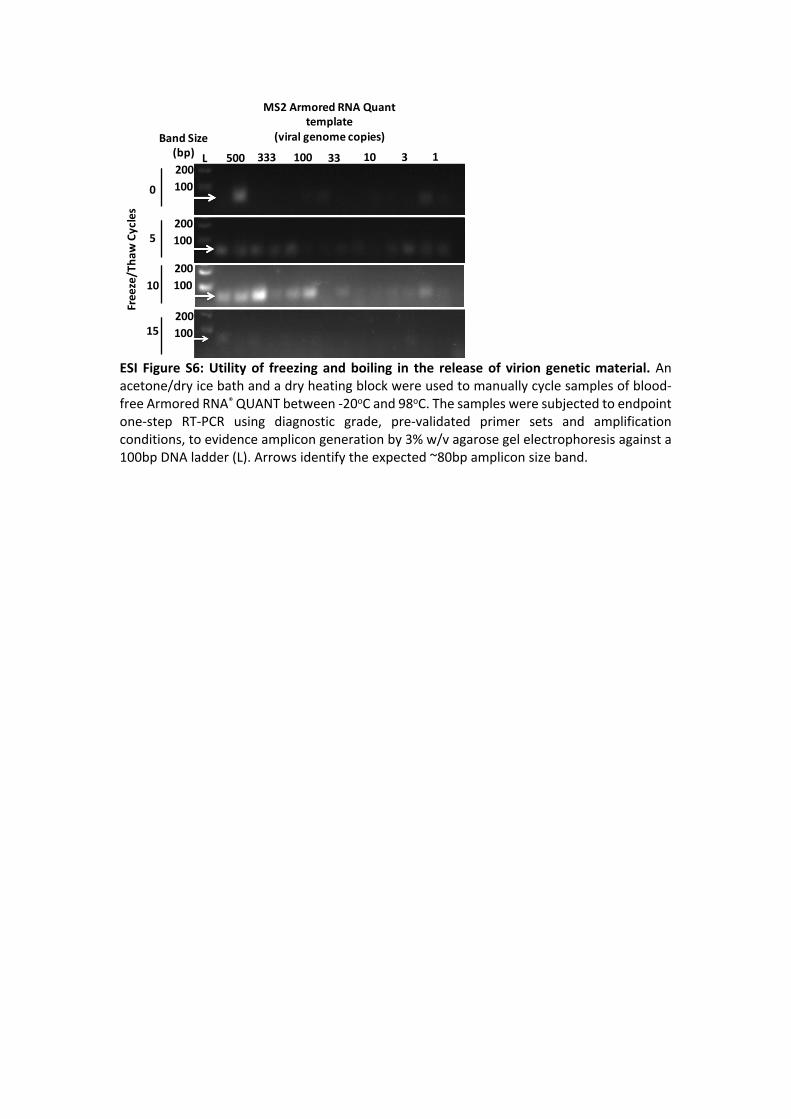
Freezing-denaturation release of virion genomes for RT-PCR: proof of principleNo thermal cycler, let alone a real-time instrument, was available at the time capable of cooling to sub-0oC to freeze an RT-PCR reaction mix. This restricted our studies to manual thermal cycling between -10oC and 95oC using an acetone/dry ice bath and dry heat block set to 105oC. To take advantage of the lead time to the production of our EBOV surrogate standards, we also used an alternative Armored RNA® QUANT construct and its diagnostic grade end-point RT-PCR primer set, as these materials were immediately available off-the-shelf. However, as this assay had not been evaluated for utility in DNA stain-based RT-qPCR, and to avoid delays thereto, we explored whether limiting virus copy number (500 copies or less) and the extent of freezing/denaturing (0-15 cycles) contributed to successful template detection. Thus, if viral RNA release occurred due to osmotic lysis, this should lead to detection even without freezing/denaturation.

Taking ~8 hrs to complete due to the 12-13 min ramping up and 2-3 min ramping down rates with 5 second holds at 95oC and -10oC, this preliminary experiment was supportive of our hypothesis and further indicated that ~10 freezing/denaturation cycles were optimal for viral RNA release from MS2 coliphage virions (ESI Fig. 6). Thus, faint bands were observed only at 500 GE/reaction at zero freezing/denaturation cycles, with similar levels of detection achieved after 5 cycles with 100 GE/reaction. Interestingly, at 10 cycles, strong bands were observed >100 GE/reaction, with faint bands detected with 10 and 3 GE/reaction, in line with the precept that freezing/denaturation and not osmotic shock was releasing viral RNA from the coliphage virions. However, no bands were detected at 15 cycles. As RNases operate across ambient to 85oC temperatures48 and RNase removal was not included in the preparation of AR14, we interpreted these results as indicative of RNase-mediated degradation during the protracted manual freezing/denaturing ramping procedure, especially after 10 freezing/denaturation cycles. Indeed, biofluids are very rich in RNases;49 we therefore reasoned that repeated ramping across the active temperature range of RNases would additionally compromise template integrity and undermine assay performance, even with automated, rapid thermal cycling. Therefore, we substituted 95oC ribonucleoprotein particle denaturation during viral particle disruption with simple thawing.

1976: 5’-…TTTTCAATCCTCAACCGTAAGGCAATTGATTTCTTGCTGCAGCGATGGGGCGGCACATGCCACATTCTGGGACCGGACTG…-3’5’-TTTTCAATCCTCAACCGTAAGGC-3’GP Forward Primer
GP Reverse Primer3’-GTGTAAGACCCTGGCCTGAC-5’
2014: 5’-…TTTTCAATCCTCAACCGTAAGGCAATTGACTTCCTGCTGCAGCGATGGGGTGGCACATGCCACATTTTGGGACCGGACTG-…-3’
Dye-5’-GCAGCGATGGGGTGGCACATG-3’-Quencher
GP Probe
2014: 5’-TCTGACATGGATTACCACAAGATCTTGACAGCAGGTCTGTCCGTTCAACAGGGGATTGTTCGGCAAAGAGTCATCC-3’1976: 5’-TCTGACATGGATTACCACAAGATCTTGACAGCAGGTCTGTCCGTTCAACAGGGGATTGTTCGGCAAAGAGTCATCC-3’
5’-TCTGACATGGATTACCACAAGATC-3’NP Forward Primer
NP Reverse Primer3’-CTAACAAGCCGTTTCTCAGTAGG-5’
5’-AGGTCTGTCCGTTCAA-3’NP Probe
a)
b)
[Par
ticle
] (1
0 6
parti
cles
/ml)
Size (nm)
0.0
0.5
1.0
1.5
2.0
2.5
0 200 400 600 800 1000
PV construct
Cell culture media
Average95% confidence bands
ESI Figure S1: Prediction of qRT-PCR assay performance impact due to genetic differences of Ebola virus Zaire Mayinga (1976) and Makona Guéckédou (2014). (A) Armored RNA ® and HIV1-based pseudotyped viruses were engineered to encode an 154 bp RT-PCR assay target site for the 1976 (PV76) or the 2014 (AR14, PV14) versions of the Ebola virus nucleoprotein (NP) and glycoprotein (GP) genes (NP and GP targets concatenated sequentially 5’3’) as surrogate Ebola virus assay standards. Construct characterisation (PV76) by nanoparticle tracking analysis (C) indicates an estimated PV virion size of ~124 nm, distinct from cell culture supernatant constituents (average and confidence bands of three independent tracking analyses).


0 10 20 30 40
0.00
0.25
0.50
0.75
1.00
Cycle
Nor
mal
ised
fluo
resc
ence
(R
FU)
0.0-ve C
2.55.0
[Blood] (%)
ESI Figure S2: Blood inhibits the fluorogenic signal of 10x Sybr Green but the onset of PCR amplification. Real time PCR reactions for 5.5 x 10³ copies of lambda phage DNA using 10x Intercalator dye (Sybr-Green 1) in the presence of increasing concentrations of fresh human blood result in comparable amplification onset but blood concentration-dependent inhibition of reaction fluorogenicity. Reaction progression is reported for each of two technical replicates in relative fluorescence units (RFU) normalised to no template control (-ve C) against PCR cycle value.

0
3500
7000
600 700 8000
3500
7000
600 700 8000
1000
2000
600 700 8000
600
1200
600 700 800
0
700
1400
600 700 8000
500
1000
600 700 8000
500
1000
600 700 8000
750
1500
600 700 800
0
1000
2000
600 700 8000
750
1500
600 700 8000
200
400
600 700 8000
200
400
600 700 800
Emiss
ion
Inte
nsity
(AFU
)
Wavelength (nm)
a) b) c) d)
e) f) g) h)
i) j) k) l)
CAL635 Quasar 670 Quasar 705 SYTO 17
SYTO 59 SYTO 60 SYTO 61 SYTO 62
SYTO 63 SYTO 64 DDB No dye
ESI Figure S3: Red / Far red dye fluorescence spectra in the presence and absence of 10% v/v blood. To determine the utility of red/far red fluorescent probes (A-C) and DNA stains (D-J) for qPCR and RT-qPCR in reactions containing blood, the fluorescence spectra of a range of commercially available compounds were determined in presence (red traces) and absence (blue traces) of human blood, with 1,2-Diamino-4,5-dimethoxylbenzene (DDB; k) and no dye measurements used as controls.

2000
8000
14000
600 700 8002000
32000
62000
600 700 8002000
23500
45000
600 700 8002000
17000
32000
600 700 800
2000
19500
37000
600 700 8002000
13500
25000
600 700 8002000
11000
20000
600 700 800
2000
8000
14000
600 800
2000
4000
6000
600 700 8002000
4000
6000
600 700 8002000
9000
16000
600 700 8002000
4000
6000
600 700 800
Wavelength (nm)
Emiss
ion
inte
nsity
(AFU
)
a) b) c) d)
e) f) g) h)
i) j) k) l)
ATTO620IWB
9.17 dB
ATTO633IWB
15.8 dB
ATTO647NDDQ2
11.8 dB
ATTO647NBHQ3
9.84 dB
ATTO647NIWB
13.4 dB
Cy5IWB
9.30 dB
Quasar 670BHQ2
7.86 dB
Quasar 670BHQ3
6.24 dB
Quasar 705BHQ2
5.93 dB
Quasar 705BHQ3
3.57 dB
Cy5.5IWB
10.2 dB
No probe control
ESI Figure S4: Red / Far red dye-quencher probe fluorescence spectra in the presence and absence of 5% v/v blood. The commercially available red/far red dyes ATTO (A-E), Cy (F, K) and Quasar (G-I) were synthesised on the Trombley EBOV GP probe in combination with Iowa black (IWB; A, B, E, F, K), deep dark quenchers (DDQ;C) or black hole quenchers 2 and 3 (BHQ; D,G-K) to triage blood compatible chemistry selection on the basis of synthesis cost, yield and fluorogenic potential in the presence (red) and absence (blue) of human blood. The signal to noise ratio at the emission peak relative to the blood only control is expressed in decibels (dB) for each probe chemistry.

0
2250
4500
600 700 800
Emiss
ion
inte
nsity
(AFU
)
Wavelength (nm)
a) CAL635Quasar 670Quasar 705Blood
Emission635 nm (AFU)
12
345
6
0 0 1 2 3 4 5 6
8000
4000
b) Emission670 nm (AFU)c)
12
345
6
0 0 1 2 3 4 5 6
8000
4000
12
345
6
0 0 1 2 3 4 5 6
Emission705 nm (AFU)
2000
1000
d)
12
345
6
0 0 1 2 3 4 5 6
Emission705 nm (AFU)
1000
2000
e)
12
345
6
0 0 1 2 3 4 5 6
Emission635 nm (AFU)
2500
5000
f)
12
345
6
0 0 1 2 3 4 5 6
Emission670 nm (AFU)
2000
4000
g)
12
345
6
0 0 1 2 3 4 5 6
Emission705 nm (AFU)
2000
1000
h)
12
345
6
0 0 1 2 3 4 5 6
Emission635 nm (AFU)
8000
4000
i)
12
345
6
0 0 1 2 3 4 5 6
Emission670 nm (AFU)
8000
4000
j)
ESI Figure S5: Modelling probe-based RT-qPCR and qPCR multiplexing in whole blood through spectral unmixing. The potential for multiplexing RT-qPCR in the presence of blood was determined through emission spectrum comparison for three red/far red dyes (A), demonstrating adequate peak separation relative to the background fluorescence of 10% v/v blood. Fluorogenic signal deconvolution modelling in the presence of blood for a duplex qPCR with CAL635 and Quasar 670 probes shows reliable signal detection potential at 635 nm (B) and 670 nm (C) from the first amplification cycle of either dye. Use of Quasar 705, however, restricts detection reliability at 705 nm whether CAL635 (D) or Quasar 670 (E) is used as the second dye. Use of Quasar 705 also impacts on amplification detection for the second dye as exemplied by composite signal detection at 635 nm in a CAL635 / Quasar 705 duplex (F) or at 670 nm in a Quasar 670 / Quasar 705 duplex (G), respectively. Triplexing the dyes does not bring composite signal strength above background at 705 nm as illustrated after 2 amplification cycles with CAL635 (H), however the signal exceeds background emission at either 635 nm (I) or 670 nm (J), making target quantification accurate in these two wavelengths, and necessitating full amplification at 705 nm ahead of 635 nm or 670 nm. The emission spectrum monitored in each graph (Y axis)is stated within each panel. Empty columns indicate composite signal levels below the blood background threshold.
Extr
actio
n in
tens
ity
(AU
)
15
5
0
10
MS2 Armored RNA Quant template (vg)
500 333 100 33 10 3 1 0 L
L: 100 bp; Amplicon ~80 bp
Free
ze/T
haw
Cyc
les
0
5
10
15
200100
Band Size (bp)
MS2 Armored RNA Quant template
(viral genome copies)
200100
200100
200100
500 333 100 33 10 3 1L
ESI Figure S6: Utility of freezing and boiling in the release of virion genetic material. An acetone/dry ice bath and a dry heating block were used to manually cycle samples of blood-free Armored RNA® QUANT between -20oC and 98oC. The samples were subjected to endpoint one-step RT-PCR using diagnostic grade, pre-validated primer sets and amplification conditions, to evidence amplicon generation by 3% w/v agarose gel electrophoresis against a 100bp DNA ladder (L). Arrows identify the expected ~80bp amplicon size band.

0 1 2 3 420
25
30
35
40
Template (log10 PFU/mL)
D
etec
tion
thre
shol
d (C
t)
EBOV Yambuka Ecran (1976)
2 3 4 5 6 7 8 920
25
30
35
40
Template (log10 GE/reaction)
Det
ectio
n th
resh
old
(Ct)
AR14
2 3 4 5 6 7 8 920
25
30
35
40
Template (log10 GE/reaction)
Det
ectio
n th
resh
old
(Ct)
EBOV Makona Guinea (2014)
-1 0 2 4 6 8 1010
15
20
25
[Final blood] (% v/v)
Cyc
le th
resh
old
(Ct)
Optimal performance
2 4 6 8 10 12 1420
25
30
35
Extraction intensity (freeze/thaw cycles)
Cyc
le th
resh
old
(Ct)
0
25
50
75
100
0 15 30 45
Rel
ativ
e flu
ores
cenc
e (%
)
Cycle
0246810
0
25
50
75
100
0 15 30 45
Rel
ativ
e flu
ores
cenc
e (%
)
Cycle
0
25
50
75
100
0 15 30 45
Rel
ativ
e flu
ores
cenc
e (%
)
Cycle
Freeze/thaw cycles
0
25
50
75
100
0 15 30 45
Rel
ativ
e flu
ores
cenc
e (%
)
Cycle
481012
[Blood] (% v/v)
a) b)
c) d)
e) f)
g) h)
0
25
50
75
100
0 15 30 45
Rel
ativ
e flu
ores
cenc
e (%
)
Cycle
i) j)

ESI Figure S7. Ct calls and amplification curves for key experiments on the QuRapID platform. The amplification curves (A, C, E, G, I) of experiments depicted in Fig. 5A, 5B, 5D and 5E (reproduced here in B, D, F, and H & J, respectively) illustrate reaction progression on account of incrementally higher levels of freeze-thaw cycling (A, B; 105 GE/reaction AR14) or fresh human blood concentration (C, D; 6.6 x 10⁸ GE/reaction AR14). These results (A-D) were obtained using electronic pipettes in experiments carried out under BSL2 conditions, and the resulting optimised settings of 10 freeze-thaw cycles and 8% v/v blood were independently tested by separate individuals using manual pipettes under BSL4 conditions (E-J), with foetal bovine serum (FBS) without stabilisation reagents used as a surrogate to fresh human blood at a final reaction concentration of 8% v/v. These experiments included calibration runs using ten-fold serial dilutions of starting at AR14 108 GE/reaction (G, H) and analytical runs on EBOV (E, F, I, J) diluted in tissue culture media starting at 700 PFU/ml and spiked with FBS (E, F) or diluted directly in FBS starting at 1.1 x 10⁵ PFU/reaction (I, J), as well as assays on other closely related filoviruses not detectable by the Trombley assay (ESI Table S2; negative data not shown). Independent replicates are shown in all panels, with grey lines (E, G, I) illustrating negative control reactions. All replicates in E-J were carried out on independent days whereas experiments in A-D were carried out on the same day. All amplification curves and Ct call points in corresponding panel pairs (AB, CD, etc.) are colour coded for easier data comparison between data presentation formats.
ESI Figure S8: The end-user SOP for QuRapID running a point of need EBOV qRT-PCR. A) Arm the reaction vessel consumable containing the lyophilised reagents by removing the protective film from the top of the puck. B) Place the puck into the puck cradle (blue arrow) in the fixed volume buffer dispenser station and dispense 57.5 ul of reaction buffer by pressing the red button actuator. C) Aspire (red arrow) a fixed volume, 5 ul digital venipuncture (finger capillary) blood sample using a sheathed lancet and fixed volume capillary, by pressing the capillary bulb (white arrow) to withdraw a fixed volume of blood. D) Dispense (red arrow) the blood sample into the consumable by compressing the capillary bulb (white arrow), and seal it with the detachable optical lid. E) Input user and patient ID on the touchscreen keyboard and place the consumable in the automatically pre-selected position highlighted on-screen (red square) F) Lower the corresponding heated sensor lid and press start (blue arrow). G) Read test outcome on-screen and dispose of the consumable as per health and safety regulations. The touchscreen screenshot shows a positive (red ‘+’ circle), negative (green ‘-’ circle) and failed (yellow ‘?’ circle) test example.

0 10 20 30 40
0
25
50
75
100
Cycle
Rel
ativ
e flu
ores
cenc
e (%
)10 %0 %
10 %
CSFCSF, - bloodCSF, + blood`
ESI Figure S9: Blood contamination does not affect RNA virion genome detection in cerebrospinal fluid. No significant Ct call difference was observed for 108 GE/reaction of AR14 in CSF-free (0%) reactions and reactions containing 10% v/v CSF from two independent subjects with no or high blood contamination during collection.


Tem
plat
e
Go
(kca
l/ml)
H
(kca
l/mol
)S
(c
a/m
ol/K
)G
o
(kca
l/ml)
H
(kca
l/mol
)S
(c
a/m
ol/K
)G
o
(kca
l/ml)
H
(kca
l/mol
)S
(c
a/m
ol/K
)
Ebol
a vi
rus -
May
inga
, Zai
re (1
976)
-7.1
7-8
9.6
-266
-25.
0-1
61-4
39-2
8.3
-173
-465
Ebol
a vi
rus -
Mak
ona-
Guec
kedo
u (2
014)
-8.1
0-9
3.0
-274
-21.
4-1
46-4
00-3
0.1
-181
-486
Targ
et m
onom
erG
P re
vers
e pr
imer
het
erod
imer
GP
prob
e he
tero
dim
er
ESI T
able
1: F
ree
ener
gy c
alcu
latio
ns o
n he
tero
dupl
ex st
abili
ty fo
r the
Tro
mbl
ey G
P re
vers
e pr
imer
and
pro
be se
quen
ces a
gain
st th
e re
fere
nce
and
Wes
t Af
rican
out
brea
k Eb
ola
viru
s gen
omes
.
ESI T
able
2: W
ild ty
pe fi
lovi
rus a
nd su
rrog
ate
viru
s sto
cks u
sed
in th
is w
ork
Viru
sTC
ID50
/ml*
PFU
/ml*
*pa
rtic
les/
ml
GE/
ml*
**Ac
cess
ion
no.
AR14
--
-1.
0 x
1012
BSL2
/ BS
L4KJ
6603
48PV
14-
--
1.0
x 10
9BS
L2KJ
6603
48PV
76-
-7.
5 x
108
-BS
L2AF
0868
33Za
ire e
bola
viru
s Ya
mbu
ka-E
cran
(197
6)1.
0 x
107
7.0
x 10
6-
-BS
L4AF
0868
33Za
ire e
bola
viru
s Gu
inea
Mak
ona
(201
4)3.
0 x
108
2.1
x 10
8-
-BS
L4KJ
6603
48Su
dan
ebol
aviru
s5.
6 x
107
3.9
x 10
7-
-BS
L4AY
7296
54.1
Bund
ibug
yo e
bola
viru
s5.
6 x
104
3.9
x 10
4-
-BS
L4FJ
2171
61.1
Taï F
ores
t ebo
lavi
rus
1.0
x 10
70.
7 x
106
--
BSL4
FJ21
7162
.1M
arbu
rg m
arbu
grvi
rus
(Rav
n vi
rus)
3.2
x 10
72.
2 x
107
--
BSL4
DQ21
7792
.1*
Actu
al v
irus t
itre
** E
stim
ated
viru
s titr
e**
* Ca
libra
ted
on e
xtra
cts a
gain
st sy
nthe
tic R
NA
Stoc
k co
ncen
trat
ion
Cont
ainm
ent
use
leve
l

ESI T
able
3: P
rimer
and
pro
be se
ts u
sed
in th
is st
udy.
Org
anis
mG
enom
e Ac
cess
ion
Targ
et G
ene
Assa
y na
me
Olig
onuc
leot
ide
nam
eSe
quen
ce &
mod
ifica
tions
Fina
l co
ncen
trat
ion
(nM
)M
anuf
actu
rer
Ebol
a vi
rus -
May
inga
, Zai
re (1
976)
AF08
6833
.2N
PTr
ombl
ey N
PN
P_F
5ʹ -
TCT
GAC
ATG
GAT
TAC
CAC
AAG
ATC
- 3ʹ
900
IDT-
DNA
NP_
R5ʹ
- G
GA
TGA
CTC
TTT
GCC
GAA
CAA
TC
- 3ʹ
900
IDT-
DNA
NP_
prob
e6F
AM -
AGG
TCT
GTC
CG
T TC
A A
- MG
BNFQ
200
Ther
mo
Fisc
her S
cien
tific
Ebol
a vi
rus -
May
inga
, Zai
re (1
976)
AF08
6833
.2G
PTr
ombl
ey G
PG
P76_
F5ʹ
- TT
T TC
A AT
C CT
C AA
C CG
T AA
G G
C - 3
ʹ10
00ID
T-DN
AG
P76_
R5ʹ
- CA
G T
CC G
GT
CCC
AGA
ATG
TG
- 3ʹ
1000
IDT-
DNA
GP7
6_pr
obe
6FAM
- CA
T G
TG C
CG C
CC C
AT C
GC
TGC
- TAM
RA -
3ʹ10
0ID
T-DN
AEb
ola
viru
s - M
akon
a-G
ueck
edou
(201
4) K
J660
348.
2G
PTr
ombl
ey +
GP1
4_F
5ʹ -
TTT
TCA
ATC
CTC
AAC
CGT
AAG
GC
- 3ʹ
1000
IDT-
DNA
GP1
4_R
5ʹ -
CAG
TCC
GG
T CC
C AA
A AT
G T
G -
3ʹ10
00ID
T-DN
AG
PG
P14_
prob
e 6
FAM
-GCA
GCG
ATG
GG
G T
GG
CAC
ATG
- BH
Q1
- 3ʹ
100
IDT-
DNA
GP+
GP1
4_T+
prob
e5'
- Q
uasa
r670
-GCA
GCG
ATG
GGG
TG
G CA
C AT
G - B
HQ2
- 3ʹ
200
Bios
earc
hHo
mo
sapi
ens
GRC
h37.
p8RP
P30
RPHU
RNAS
EP_F
5’ -
AGA
TTT
GG
A CC
T G
CG A
GC G
- 3’
300
IDT-
DNA
HURN
ASEP
_R5’
- G
AG C
GG
CTG
TCT
CCA
CAA
GT
- 3’
300
IDT-
DNA
HURN
ASEP
_pro
be1
6FAM
- TT
C TG
A CC
T G
AA G
GC
TCT
GCG
CG
- BH
Q1
- 3’
100/
200
IDT-
DNA
HURN
ASEP
_pro
be2
5’- C
y5 -
TTC
TGA
CCT
GAA
GG
C TC
T G
CG C
G -
BHQ
2 - 3
’10
0/20
0ID
T-DN
AHe
patit
is C
Viru
s AB
0309
075'
ITR
HCV
G2b
KY80
5' -
GCA
GAA
AG
C G
TC T
AG C
CA T
GG
CG
T - 3
'20
0ID
T-DN
AKY
785'
-CTC
GCA
AG
C AC
C CT
A TC
A G
GC
AGT
ACC
AC -
3'20
0ID
T-DN
ASu
dan
viru
sAY
7296
54G
PPH
E SD
V G
PF5
835’
- AG
G A
TG G
AG C
TT T
CT T
CC T
CT A
TG -
3’65
0ID
T-DN
AR6
595’
- TA
C CC
C CT
C AG
C AA
A AT
T GA
C T
- 3’
900
IDT-
DNA
p608
SB6F
AM -
CAG
GCT
GG
C TT
C AA
C TG
T AA
T TT
A CA
G A
GG
- BH
Q1
250
IDT-
DNA
Bund
ibuy
o vi
rus
FJ21
7161
NP
PHE
SDV
NP
F201
65’
- AT
G G
AA A
CC A
AG G
CG A
AA C
TG -
3’90
0ID
T-DN
AR2
089
5’ -
TAC
TTG
TG
G C
AT T
GG C
TT G
TC T
- 3’
900
IDT-
DNA
p204
5S6F
AM -
CGG
GTA
GCC
CCC
AAC
- M
GBN
FQ25
0Th
erm
o Fi
sche
r Sci
entif
icTa
ï For
est v
irus
FJ21
7162
NP
PHE
TF N
PF3
605’
- TT
T G
CC G
TG C
AT T
TA G
AA T
AA G
AG -
3’90
0ID
T-DN
AR4
385’
- CT
G CC
G G
GT
CTG
GTG
AG
A T
- 3’
650
IDT-
DNA
p385
KSR
6FAM
- CA
A CT
T AA
A CC
T CC
G A
TT C
GG
CAA
CAC
A -
BHQ
125
0ID
T-DN
ARa
vn v
irus
EF44
6131
NP
PHE
RAVN
NP
F119
05’
- CT
C CA
G A
AG A
CT G
AG A
TT A
CA C
AC A
GT
- 3’
650
IDT-
DNA
R126
95’
- G
CA G
CA A
GA
CGG
GCT
AG
T TT
- 3’
650
IDT-
DNA
P121
8KSR
6FAM
- AG
A CA
T TG
G CC
G T
CC T
CA G
CC A
GA A
- BH
Q1
250
IDT-
DNA