Embed Size (px)
Citation preview

8/7/2019 Unobtrusive Long-Range Detection of RFID Tag Motion
http://slidepdf.com/reader/full/unobtrusive-long-range-detection-of-rfid-tag-motion 1/10
IEEE TRANSACTIONS ON INSTRUMENTATION AND MEASUREMENT, VOL. 55, NO. 1, FEBRUARY 2006 187
Unobtrusive Long-Range Detection
of Passive RFID Tag MotionBing Jiang, Student Member, IEEE , Kenneth P. Fishkin, Sumit Roy, Member, IEEE , and Matthai Philipose
Abstract—This paper presents a novel method for detectingthe motion of passive radio-frequency-identification (RFID) tagswithin the field of a detecting antenna. The method allows theunobtrusive detection of human interactions with RFID-taggedobjects without requiring any modifications to existing commu-nications protocols or RFID hardware. We use the response rate(a metric in lieu of the true received RF-signal intensity) at thereader to study the impact of tag translation, rotation, and cou-pling, as well as environmental effects. Performance is improvedby introducing the idea of multiple tags/readers. Movement-detection algorithms are developed and integrated into the RFID
monitoring system, and verified by experiments that demonstrateexcellent results.
Index Terms—Movement detection, passive tags, radio-frequency identification (RFID), radio-frequency (RF)-signalprocessing, response rate.
I. INTRODUCTION
RADIO-FREQUENCY identification (RFID) is of growing
interest due to recent declines in cost and size and in-
creases in the working range. Current forecasts are for passive
tags to be available for about $0.10 in a few years, with detec-
tion ranges in the few meters, and consequent annual deploy-
ments in the billions.The RFID system consists of readers/interrogators and tags/
transponders. RFID operates in different frequency bands (e.g.,
125 kHz, 13.56 MHz, 868/915 MHz, 2.45 GHz, and 5.8 GHz).
RFID has several important advantages over the traditional
barcode.
1) It does not require line-of-sight (LoS) access to be read.
2) Multiple presenting tags can be read simultaneously.
3) Tags can be used in a rugged environment.
4) Tags can carry much more data.
5) Tags can be rewritable; they can modify their data as
required.
6) Tags can be coupled with sensors to supply environmentalinformation.
These features are enabling new RFID applications—e.g., to
track objects in a supply chain, monitor their status, and en-
hance security [1].
Manuscript received April 30, 2004; revised October 3, 2005.B. Jiang and S. Roy are with the Department of Electrical Engineering, Uni-
versity of Washington, Seattle, WA 98195 USA (e-mail: [email protected]; [email protected]).
K. P. Fishkin and M. Philipose are with the Intel Research Seattle, Seattle,WA 98105 USA (e-mail: [email protected]; [email protected]).
Digital Object Identifier 10.1109/TIM.2005.861489
Tags may be categorized as either active or passive. The for-
mer have their own power supply, whereas the latter do not: tags
are powered solely by radiated energy from an external source,
such as an antenna on a tag reader. This absence of a power
supply makes passive tags much cheaper and of much greater
longevity than active tags, although their operating range, data-
transfer rate, and computational abilities are much more lim-
ited. In this paper, we focus on passive tags, since these will
almost certainly be deployed for the tracking of small individual
objects.An early forerunner of RFID technology was described in
[2] that exploited the possibility of using reflected power to
communicate. One of the earliest uses of RFID was in the iden-
tify: friend or foe (IFF) systems used to identify aircraft during
World War II [3]. RFID became a commercial reality over the
ensuing decades, with widespread deployment starting in the
1990s. Some important applications include toll collection, ani-
mal tracking, supply-chain management, and access control [3].
An important class of RFID applications within the ubiqui-
tous computing framework consists of unobtrusively tracking
the interactions of tagged objects with a human. For example,
tagged medications could be monitored to avoid mismedica-
tion, tagged factory tools could be monitored to infer and
monitor production methods, and tagged medical instruments
could be monitored to prevent operating-room errors. However,
current RFID systems typically provide only a binary output
(presence/absence) for a particular tag.
In this paper, we use the RF-signal intensity that is backscat-
tered to the reader from passive tags to characterize system re-
sponse. Based on this method, algorithms for motion detection
are developed and tested.
II. SYSTEM-M ODELING PRINCIPLES
Interactions with RFID-tagged objects could be tracked in
several ways.
A. Use Wearable/Handheld Readers
One solution is use small wearable readers, with short-range
antennas in the palms [4]. When the user picks up an object,
the wearable reader detects and transmits that event. A short
operating range is preferred so that only the (single) tagged
object grasped is read. While such readers can be made today,
they require users to wear a special glove and reader apparatus,
which may be unacceptable for many scenarios.
0018-9456/$20.00 © 2006 IEEE
8/7/2019 Unobtrusive Long-Range Detection of RFID Tag Motion
http://slidepdf.com/reader/full/unobtrusive-long-range-detection-of-rfid-tag-motion 2/10
188 IEEE TRANSACTIONS ON INSTRUMENTATION AND MEASUREMENT, VOL. 55, NO. 1, FEBRUARY 2006
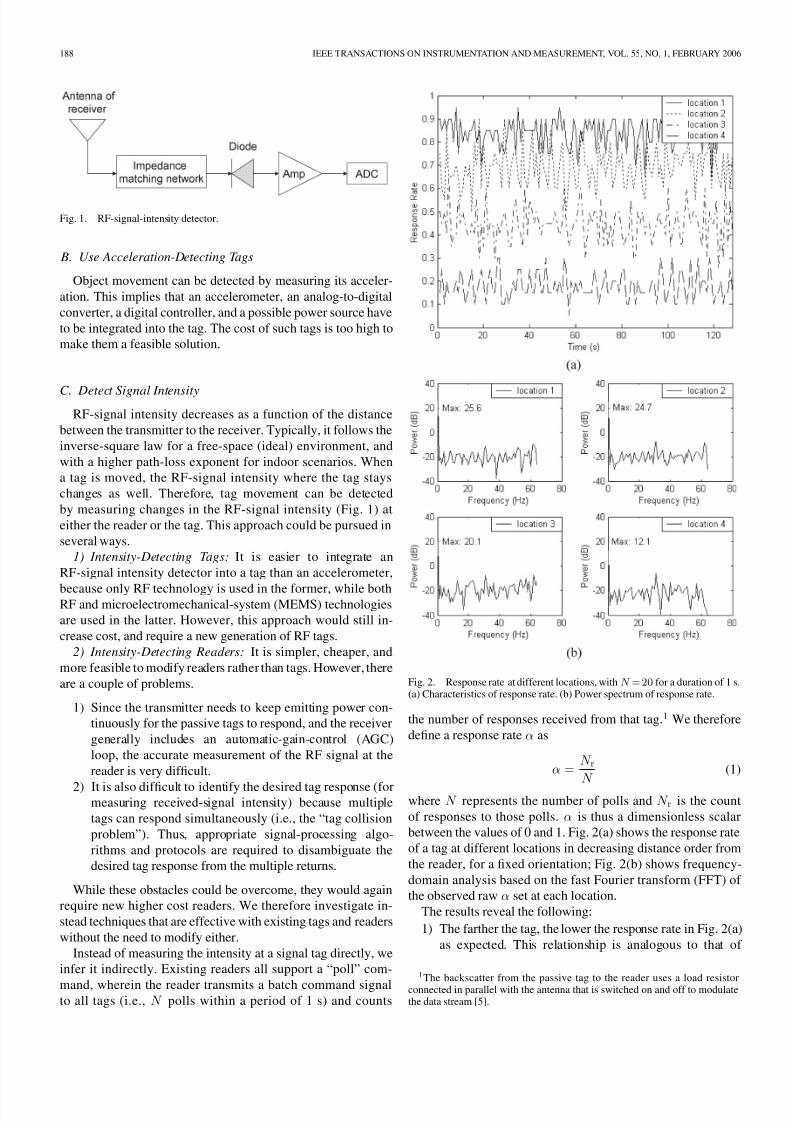
Fig. 1. RF-signal-intensity detector.
B. Use Acceleration-Detecting Tags
Object movement can be detected by measuring its acceler-
ation. This implies that an accelerometer, an analog-to-digital
converter, a digital controller, and a possible power source have
to be integrated into the tag. The cost of such tags is too high to
make them a feasible solution.
C. Detect Signal Intensity
RF-signal intensity decreases as a function of the distance
between the transmitter to the receiver. Typically, it follows the
inverse-square law for a free-space (ideal) environment, and
with a higher path-loss exponent for indoor scenarios. When
a tag is moved, the RF-signal intensity where the tag stays
changes as well. Therefore, tag movement can be detected
by measuring changes in the RF-signal intensity (Fig. 1) at
either the reader or the tag. This approach could be pursued in
several ways.
1) Intensity-Detecting Tags: It is easier to integrate an
RF-signal intensity detector into a tag than an accelerometer,
because only RF technology is used in the former, while bothRF and microelectromechanical-system (MEMS) technologies
are used in the latter. However, this approach would still in-
crease cost, and require a new generation of RF tags.
2) Intensity-Detecting Readers: It is simpler, cheaper, and
more feasible to modify readers rather than tags. However, there
are a couple of problems.
1) Since the transmitter needs to keep emitting power con-
tinuously for the passive tags to respond, and the receiver
generally includes an automatic-gain-control (AGC)
loop, the accurate measurement of the RF signal at the
reader is very difficult.
2) It is also difficult to identify the desired tag response (formeasuring received-signal intensity) because multiple
tags can respond simultaneously (i.e., the “tag collision
problem”). Thus, appropriate signal-processing algo-
rithms and protocols are required to disambiguate the
desired tag response from the multiple returns.
While these obstacles could be overcome, they would again
require new higher cost readers. We therefore investigate in-
stead techniques that are effective with existing tags and readers
without the need to modify either.
Instead of measuring the intensity at a signal tag directly, we
infer it indirectly. Existing readers all support a “poll” com-
mand, wherein the reader transmits a batch command signalto all tags (i.e., N polls within a period of 1 s) and counts
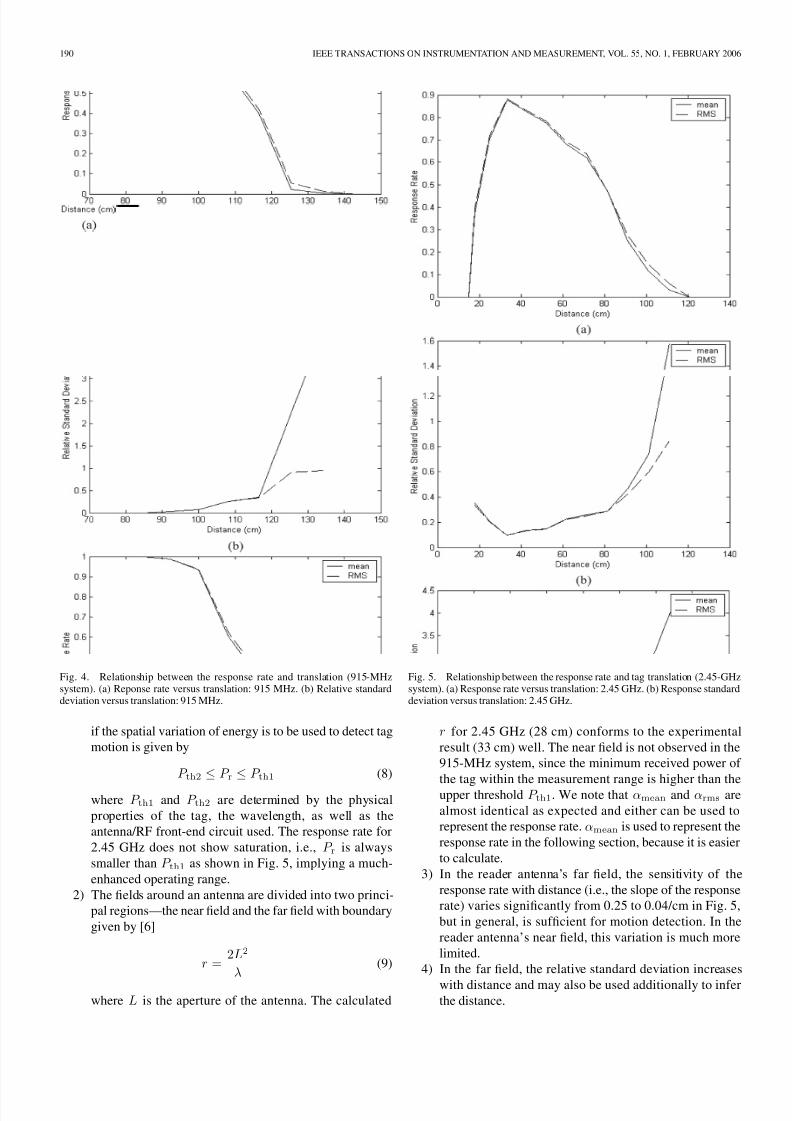
Fig. 2. Response rate at different locations, with N = 20 for a duration of 1 s.(a) Characteristics of response rate. (b) Power spectrum of response rate.
the number of responses received from that tag.1 We therefore
define a response rate α as
α =N rN
(1)
where N represents the number of polls and N r is the count
of responses to those polls. α is thus a dimensionless scalar
between the values of 0 and 1. Fig. 2(a) shows the response rate
of a tag at different locations in decreasing distance order from
the reader, for a fixed orientation; Fig. 2(b) shows frequency-
domain analysis based on the fast Fourier transform (FFT) of
the observed raw α set at each location.
The results reveal the following:
1) The farther the tag, the lower the response rate in Fig. 2(a)
as expected. This relationship is analogous to that of
1
The backscatter from the passive tag to the reader uses a load resistorconnected in parallel with the antenna that is switched on and off to modulatethe data stream [5].

8/7/2019 Unobtrusive Long-Range Detection of RFID Tag Motion
http://slidepdf.com/reader/full/unobtrusive-long-range-detection-of-rfid-tag-motion 3/10
JIANG et al.: UNOBTRUSIVE LONG-RANGE DETECTION OF PASSIVE RFID TAG MOTION 189
Fig. 3. Probability-density distribution of sample sets.
received RF-signal power with distance, and is the basisof our subsequent processing algorithm based on the
response rate.
2) From the frequency analysis in Fig. 2(b), there are no
significant periodic signal components in the response.
The dc component of the response rate is proportional
to the energy level and the variations about the mean
may be considered as independent random perturbations.
For a sample set Ω(α1, α2, . . . , αN s), we introduce the
following statistical parameters.
αmean =
1
N s
N s
i=1αi, αrms =
1
N s
N s
i=1α2
i (2)
σ =
1
N s − 1
N si=1
(αi − αmean)2 (3)
σrel =σ
αmean
, or σrel =σ
αrms
(4)
where N s is the size of Ω, and each element (αi) of Ω corre-
sponds to a set of N polls; αmean is the mean of Ω;
αrms is the root mean square (rms) of Ω; σ is the standard
deviation of Ω; σrel and σrel
are the relative standard deviations.
Fig. 3 shows the probability-density function of the samplesets as shown in Fig. 2, where the x-axis is normalized by the
standard deviation (x = αi − αmean/σ). A key observation is
that the normalized response rate is denser in the range |x| ≤ 1with a peak at zero, and there is almost no occurrence when
|x| ≥ 3. It follows that for sufficiently large N and N s, the
normalized response rate may be approximated by the standard
normal-distribution model.
III. CHARACTERIZATION OF THE RESPONSE RATE
From elementary wave-propagation theory [6], it follows that
P r = kP t (5)
where P r is the received power after one-way propagation
corresponding to a transmitted power of P t and k is a scalar
factor that is determined by the wavelength, distance, pos-
ture, and transmitting/receiving patterns. When the distance is
large compared to the wavelength and the dimensions of the
antennas, (5) can be written as the Friis transmission formula
P r =AetAer
d2λ2P t (6)
where Aet is the effective aperture of the transmitting antenna;
Aer is the effective aperture of the receiving antenna; d is the
distance between the two antennas; λ is the wavelength. Since
the impedance of the antenna is assumed to be matched, the
received power is equal to the reradiated power on the same
antenna [6]; therefore, the power P tr that is reflected by a tag
and received by the reader has the following relationship with
the transmitted power
P tr = P rk = P tk2. (7)
It is known that P t is typically of the order of 30 dBm, and
the superhet receiver that is usually employed in the readers
offers a typical sensitivity greater than −150 dBm [7]. It can
be derived from (5) and (7) that the minimum P r at the tag that
guarantees communication is of the order of −60 dBm, based
on the detector requirements of a superhet-type reader. Note
however that the tag IC will not respond until it receives enough
power from the reader, and the reported minimum P r required
is of the order of −20 dBm [8], which exceeds −60 dBm.
Therefore, the reader sees a detectable tag-response signal as
long as the interrogating power at the tag exceeds the minimum
power required.The above conclusion is based on an ideal scenario with
perfect impedance matching at the front end. In a real-world
scenario, the effects of tag translation, rotation, and coupling, as
well as the impact of environmental variation on the response
rate must be considered and are discussed next. Our goal is to
test the validity of the response rate as an index of signal in-
tensity with experimental measurements. All experiments were
performed by using the 915-MHz and 2.45-GHz RFID systems
with passive tags.
A. Tag Translation
Figs. 4 and 5 show the relationship between the response rate
and the distance for 915-MHz and 2.45-GHz systems, respec-
tively, where the distance is measured between the centers of
the tag and the reader’s antenna.
We note from Figs. 4 and 5 that the behavior of the (mean)
response rates for 915 MHz and 2.4 GHz are distinctly
different.
1) For the 915-MHz system, the response rate saturates at
both the low and high ends, suggesting two threshold
values P th1 and P th2, which determines the operating
range for the response rate. When the energy level is
higher than P th1, the tag is in the saturation mode cor-
responding to α = 1, while P th2 is the threshold for noresponse (i.e., α = 0). Thus, the effective operating range
8/7/2019 Unobtrusive Long-Range Detection of RFID Tag Motion
http://slidepdf.com/reader/full/unobtrusive-long-range-detection-of-rfid-tag-motion 4/10
190 IEEE TRANSACTIONS ON INSTRUMENTATION AND MEASUREMENT, VOL. 55, NO. 1, FEBRUARY 2006
Fig. 4. Relationship between the response rate and translation (915-MHzsystem). (a) Reponse rate versus translation: 915 MHz. (b) Relative standarddeviation versus translation: 915 MHz.
if the spatial variation of energy is to be used to detect tag
motion is given by
P th2 ≤ P r ≤ P th1 (8)
where P th1 and P th2 are determined by the physical
properties of the tag, the wavelength, as well as the
antenna/RF front-end circuit used. The response rate for
2.45 GHz does not show saturation, i.e., P r is always
smaller than P th1 as shown in Fig. 5, implying a much-
enhanced operating range.
2) The fields around an antenna are divided into two princi-
pal regions—the near field and the far field with boundary
given by [6]
r =2L2
λ(9)
where L is the aperture of the antenna. The calculated
Fig. 5. Relationship between the response rate and tag translation (2.45-GHzsystem). (a) Response rate versus translation: 2.45 GHz. (b) Response standarddeviation versus translation: 2.45 GHz.
r for 2.45 GHz (28 cm) conforms to the experimental
result (33 cm) well. The near field is not observed in the
915-MHz system, since the minimum received power of
the tag within the measurement range is higher than theupper threshold P th1. We note that αmean and αrms are
almost identical as expected and either can be used to
represent the response rate. αmean is used to represent the
response rate in the following section, because it is easier
to calculate.
3) In the reader antenna’s far field, the sensitivity of the
response rate with distance (i.e., the slope of the response
rate) varies significantly from 0.25 to 0.04/cm in Fig. 5,
but in general, is sufficient for motion detection. In the
reader antenna’s near field, this variation is much more
limited.
4) In the far field, the relative standard deviation increases
with distance and may also be used additionally to inferthe distance.

8/7/2019 Unobtrusive Long-Range Detection of RFID Tag Motion
http://slidepdf.com/reader/full/unobtrusive-long-range-detection-of-rfid-tag-motion 5/10
JIANG et al.: UNOBTRUSIVE LONG-RANGE DETECTION OF PASSIVE RFID TAG MOTION 191
Fig. 6. Relationship between the response rate and the tag orientation.
B. Rotation
Generally, the antennas of tags are λ/2 dipole antennas or
folded λ/2 dipole antennas. For a matched tag antenna, its
effective aperture Aer in (6) can be expressed as
Aer =Z 0h2
e cos2 θ
2Rr
(10)
where Z 0 is the intrinsic impedance of free space (377 Ω); θ is
the angle between the tag orientation and the propagating wave-
front from the reader; he is the effective height of the tag anten-
na, which is approximately 0.64 of the physical tag length [6].
Fig. 6 shows the variation of the response rate to tag orien-
tation θ; the results do not conform well to the predicted cos2 θvariation from (10). Further, the response rate is very sensitive
to orientation change, which is a useful property for motion
detection.
C. Coupling Between Tags
In the presence of other (interfering) tags around a desired
tag in the reader’s antenna field, the backscattered signal at the
reader is altered due to the introduced mutual impedance. This
can be expressed as
Z R = Z 11 + Z 12 = R11 −R12 + j(X 11 −X 12) (11)
where Z R is the radiation impedance, Z 11 (R11 and X 11 are
the resistive and reactive components of the self-impedance, re-
spectively); and Z 12 is the mutual impedance (R12 and X 12 are
the respective resistive and reactive components). The mutual-
impedance computation is complex even when only two tags
are in the field. For the special case of two λ/2 dipoles that are
parallel, the net resistance of the dipole is given by [6]
R11 −R12 = 592.2
dλ
2(12)
Fig. 7. Coupling effect on the response rate.
where d is the distance measured between tag centers. The
above equation is limited, only accurate within 5% when
d ≤ 0.1λ. Fig. 7 shows the coupling effect when a tag is moved
across a fixed distance. Two configurations were tested in ex-
periments based on the motion of the interfering tag: the config-
uration “| |” indicates that the interfering tag is moved along the
normal direction between the reader and desired tag while “- -”
indicates tag motion perpendicular to the normal.
The following observations are pertinent.
1) When the two tags are close enough, neither will respond
due to the mismatched radiation and load impedances.
The voltage standing-wave ratio (VSWR) can be ex-pressed as
VSWR =1 + |ρv|
1− |ρv|, ρv =
Z L − Z RZ L + Z R
(13)
where Z L is the load impedance and ρv is the voltage-
reflection coefficient. When Z R deviates from Z L, a
part of the energy is reflected. When the two tags
are completely overlapped (d = 0), (12) suggests that
R11 −R21 = 0. Since it is known that X 12 = X 11 =43 Ω for two λ/2 dipoles [6], it follows that Z R = 0,
and hence, VSWR = ∞. All the energy is thus reflectedin this case, i.e., no energy is received. Thus, a “safe” zone
is needed for the tags to be effective, i.e., only a limited
number of tags must be allowed in the reader’s antenna
field. For example, the operating range of the reader’s
antenna used in experiments is about 0.6× 0.6× 1 m3,
and the “safe zone” of a tag is about 0.2× 0.2× 0.2 m3;
so the maximum number of tags allowed in this antenna
field is about 45. The practical number may be much less
than this due to environment factors and tag placement.
Well-shaped tags could be used to alleviate the coupling
effect.
2) Note that is possible for the response rate to increase
when a second tag is nearby and is oriented parallel tothe first (e.g., the spike at 5 cm in Fig. 8). This is caused

8/7/2019 Unobtrusive Long-Range Detection of RFID Tag Motion
http://slidepdf.com/reader/full/unobtrusive-long-range-detection-of-rfid-tag-motion 6/10
192 IEEE TRANSACTIONS ON INSTRUMENTATION AND MEASUREMENT, VOL. 55, NO. 1, FEBRUARY 2006
Fig. 8. Ceiling effect on the response rate.
by the fact that the fixed tag receives additional energyreflected by the second tag behind it.
D. Environment
The RF environment also has an important effect on the re-
sponse rate, which is generally difficult to model. For example,
tagged objects have a material permittivity ε, which could alter
the radiation impedance of the tag’s antennas significantly. The
load impedance that is matched to the original (tag) radiation
impedance is therefore mismatched when tags are attached to
objects. This problem could be particularly serious when fluid
or metallic objects are tagged. Other present readers may alsohave undesirable effects on the response rate. It was observed
that a (second) remote interfering reader also negatively im-
pacted (i.e., decreased) the response rate of the desired tag,
although this tag is out of the formal range of second reader.
Fig. 8 shows an example of the response rate caused by the
superposition of a direct signal from the reader to tag along with
the reflected wave components from the metal-framed ceiling,
where the reader antenna is facing the ceiling and no other big
objects are around. The response rate would remain fixed at
one when there is no ceiling, which in Fig. 8 shows increased
sensitivity to distance. Generally, the RF energy distribution
fluctuates greatly in some indoor environments as compared toothers. As a result, the utility of using the response rate for the
detection of tag motion in such scenarios is greatly improved
due to the presence of the multipath.
In summary, these experiments demonstrate the principled
validity of using the response rate (which is an indirect metric
of the received-signal-intensity level) in careful laboratory en-
vironments for detecting tag motion. Though a strict functional
relationship between the response rate and the true received RF
energy is difficult to predict, the sensitivity of the response rate
to factors such as distance and tag orientation make this a useful
approach. Note further the advantage of this technique in not re-
quiring any hardware or communication-protocol modification.
Nonetheless, the limited resolution of the response rate over theoperating range of the system continues to be a major challenge.
Fig. 9. Standard deviation as a function of N (number of polls per sampleduration) with N s = 10.
IV. TAG-M OVEMENT-D ETECTION ALGORITHMS
We have argued that the change of the response rate can be
used to detect the movement of tagged objects. To make this
approach feasible in real time, two basic principles should be
met for any proposed algorithm.
1) It must be able to detect the movement quickly.
2) It must be able to distinguish true tag movement from the
false positives caused by the fluctuation of the response
rate due to extraneous factors, e.g., short-term occlusion
of the LoS connecting the reader and the desired tag
or due to mutual coupling effects when a second tag is
brought in the vicinity.
A. Selection of N and N s
We intended to divide a continuous sampling set into N selements, where each element corresponds to N polls. A small
N means a quick sampling action; therefore, a sudden change
can be detected more quickly with a small N than a big N .However, it is unable to describe the accurate status when
N is small, and a wrong decision could occur when several
consecutive samples with big deviations are observed. Based onthis point, a larger N is desired. Fig. 9 shows the relationship
between the standard deviation σ and the number of polls (N ).
σ broadly decreases with increasing N , although there are
local excursions. Therefore, a time-to-decision versus accuracy
tradeoff is implied.
Another important parameter is the size of the sample set N s.
A suitable N s value should be small enough for a quick decision
and big enough to reach stable values of αmean and σ. The
minimum values of N s required for the response rate to reach
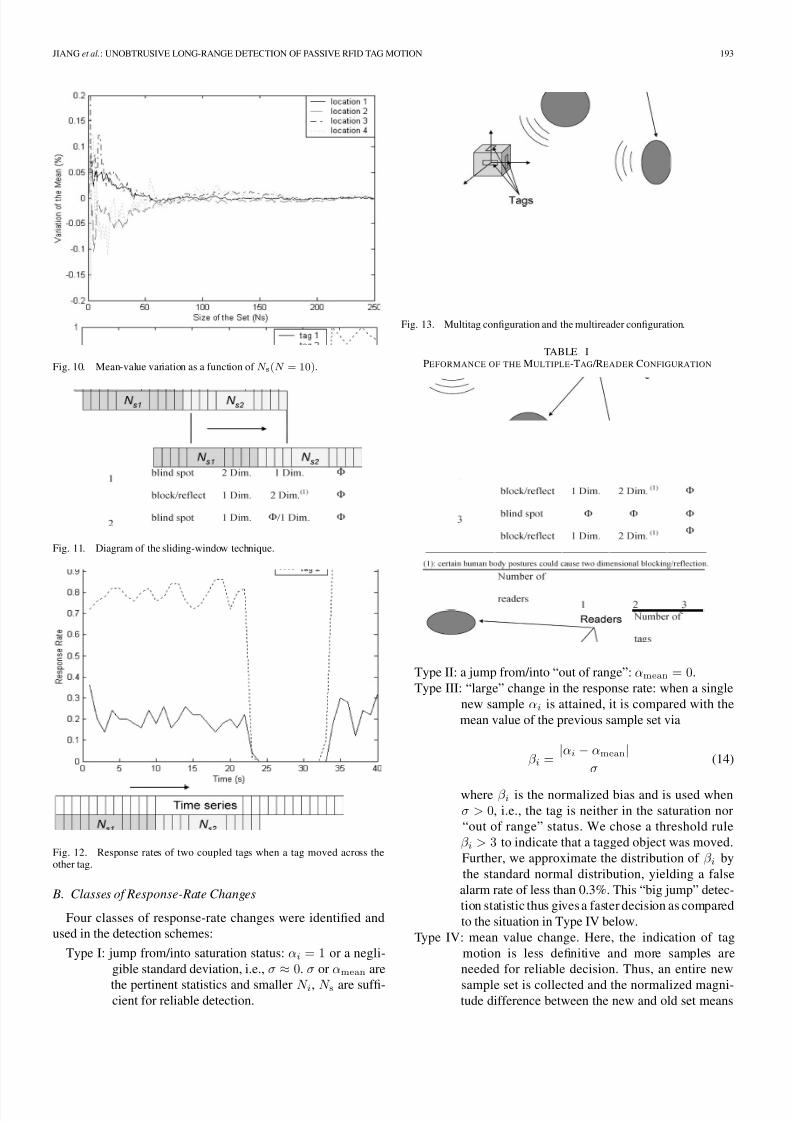
convergence varies as a function of location. Fig. 10 shows the
relationship between the size of set N s and the mean variation
(αN s
mean − αmean)/αmean, where αmean = limN s→∞ αN
s
mean. In
the motion-detection algorithm, the selection of N s should beadaptive to reach convergence with minimum delay.
8/7/2019 Unobtrusive Long-Range Detection of RFID Tag Motion
http://slidepdf.com/reader/full/unobtrusive-long-range-detection-of-rfid-tag-motion 7/10
JIANG et al.: UNOBTRUSIVE LONG-RANGE DETECTION OF PASSIVE RFID TAG MOTION 193
Fig. 10. Mean-value variation as a function of N s(N = 10).
Fig. 11. Diagram of the sliding-window technique.
Fig. 12. Response rates of two coupled tags when a tag moved across theother tag.
B. Classes of Response-Rate Changes
Four classes of response-rate changes were identified and
used in the detection schemes:
Type I: jump from/into saturation status: αi = 1 or a negli-
gible standard deviation, i.e., σ ≈ 0. σ or αmean are
the pertinent statistics and smaller N i, N s are suffi-cient for reliable detection.
Fig. 13. Multitag configuration and the multireader configuration.
TABLE IPEFORMANCE OF THE MULTIPLE-TAG /READER CONFIGURATION
Type II: a jump from/into “out of range”: αmean = 0.
Type III: “large” change in the response rate: when a single
new sample αi is attained, it is compared with the
mean value of the previous sample set via
β i =|αi − αmean|
σ(14)
where β i is the normalized bias and is used when
σ > 0, i.e., the tag is neither in the saturation nor
“out of range” status. We chose a threshold rule
β i > 3 to indicate that a tagged object was moved.
Further, we approximate the distribution of β i by
the standard normal distribution, yielding a false
alarm rate of less than 0.3%. This “big jump” detec-
tion statistic thus gives a faster decision as compared
to the situation in Type IV below.
Type IV: mean value change. Here, the indication of tag
motion is less definitive and more samples are
needed for reliable decision. Thus, an entire new
sample set is collected and the normalized magni-tude difference between the new and old set means
8/7/2019 Unobtrusive Long-Range Detection of RFID Tag Motion
http://slidepdf.com/reader/full/unobtrusive-long-range-detection-of-rfid-tag-motion 8/10
194 IEEE TRANSACTIONS ON INSTRUMENTATION AND MEASUREMENT, VOL. 55, NO. 1, FEBRUARY 2006
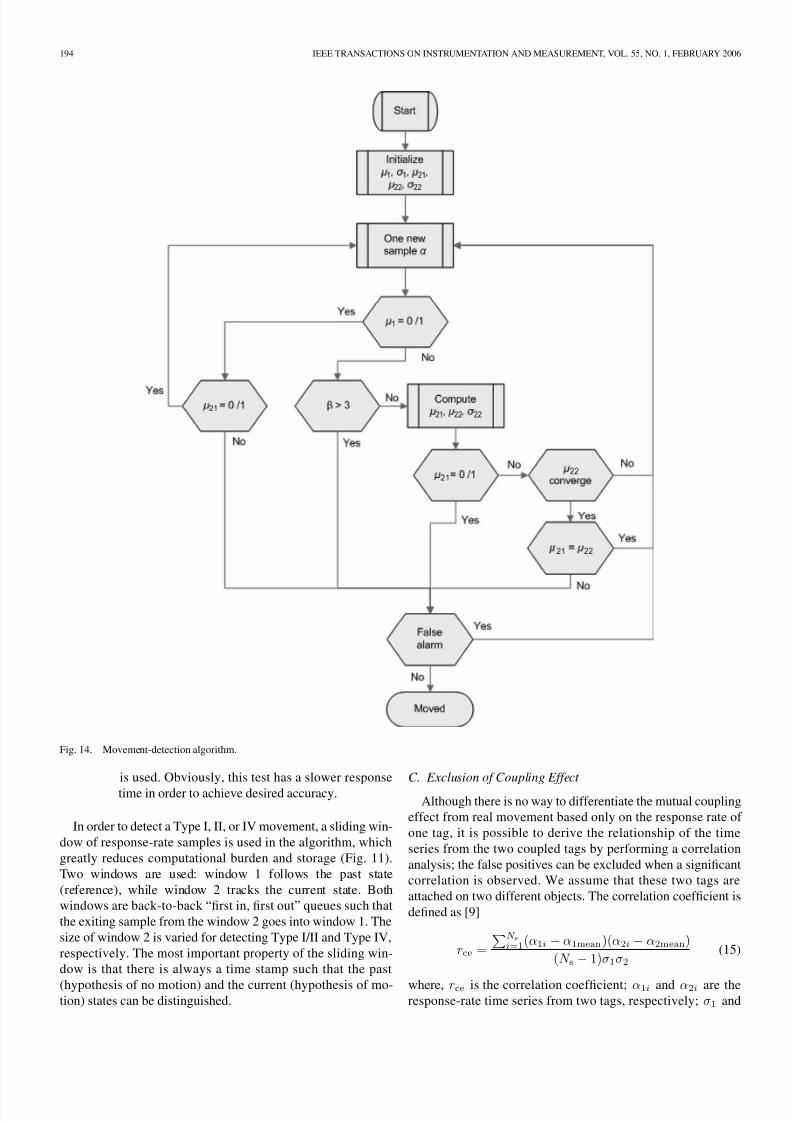
Fig. 14. Movement-detection algorithm.
is used. Obviously, this test has a slower response
time in order to achieve desired accuracy.
In order to detect a Type I, II, or IV movement, a sliding win-
dow of response-rate samples is used in the algorithm, which
greatly reduces computational burden and storage (Fig. 11).
Two windows are used: window 1 follows the past state
(reference), while window 2 tracks the current state. Both
windows are back-to-back “first in, first out” queues such that
the exiting sample from the window 2 goes into window 1. The
size of window 2 is varied for detecting Type I/II and Type IV,
respectively. The most important property of the sliding win-
dow is that there is always a time stamp such that the past
(hypothesis of no motion) and the current (hypothesis of mo-tion) states can be distinguished.
C. Exclusion of Coupling Effect
Although there is no way to differentiate the mutual coupling
effect from real movement based only on the response rate of
one tag, it is possible to derive the relationship of the time
series from the two coupled tags by performing a correlation
analysis; the false positives can be excluded when a significant
correlation is observed. We assume that these two tags are
attached on two different objects. The correlation coefficient is
defined as [9]
rce =
N
s
i=1(α1i − α1mean)(α2i − α2mean)
(N s − 1)σ1σ2(15)
where, rce is the correlation coefficient; α1i and α2i are theresponse-rate time series from two tags, respectively; σ1 and

8/7/2019 Unobtrusive Long-Range Detection of RFID Tag Motion
http://slidepdf.com/reader/full/unobtrusive-long-range-detection-of-rfid-tag-motion 9/10
JIANG et al.: UNOBTRUSIVE LONG-RANGE DETECTION OF PASSIVE RFID TAG MOTION 195
Fig. 15. Developed system for the movement detection of tagged objects.
σ2 are the associated standard deviation. In order to prove the
significance of rce, Fisher’s Z-transformation is used [9]
1
2ln
1 + ρ
1− ρ
=
1
2ln
1 + rce1− rce
± 1.96
1
N s − 3. (16)
When ρ1 and ρ2 are both large in amplitude with the same
sign ( ρ1 and ρ2 are solutions of (16) and ρ1 ≤ ρ2), the result
indicates a statistically significant relationship between the two
series at the 95% confidence level. Fig. 12 shows an exampleof the coupling effect; the potential false detect is success-
fully excluded by this test (since rce = 0.88, ρ1 = 0.78, and
ρ2 = 0.94).
D. Multiple Tags/Readers
We have seen that our approach using the response rate for a
single tag per object may only work within a short radial range
or over a limited azimuth (angular) directions. The response
rate can even include false movement due to reflection or block-
ing. We next propose using multitagged objects and/or multiple
readers for enhanced system performance. Fig. 13 shows the
configuration of the multitagged object and multiple readers.
In order to fully explore the ability of multiple tags/readers,
we need to place them along different independent axes due to
orientation sensitivity, and readers should be circularly polar-
ized antennas in order to overcome the orientation sensitivity of
linearly polarized tags. The final active operating range would
be the union of individual operating ranges; therefore, it results
in greatly improved performance (Table I).
Interaction of other interfering objects (including the human
body) and the desired tagged objects may be classified to a first
order, as follows:
1) blocking whereby the interfering object obstructs the LoS
between the reader and tag leading to a reduction of thepower received by the tag;
2) an object in the vicinity that does not block the LoS,
which nevertheless induces reflections that provide extra
energy to the tag.
Thus, while blocking generally decreases the response rate,
reflections may increase the response rate; nonetheless, both
may result in false-motion indication. When there is only one
tag/reader, there is no way to exclude such false positives. How-
ever, with multitags/readers, the occurrence of false positives
could be reduced. We assume the tagged objects are much
smaller than the human body, therefore it is impossible to haveblocking and reflection at the same time. In other words, if we
get both the increased and decreased response rates from the
same tagged object, it is highly likely that the object has moved.
E. Motion-Detection System
Fig. 14 shows a flowchart of the movement-detection al-
gorithms, where µ = αmean, µ21, and µ22 are means for the
two window 2’s, respectively. Fig. 15 shows the graphical
user interface (GUI) developed with LabView for the labo-
ratory testing of our movement-detection system. Our early
experiments show that the proposed method works well andreasonably quickly in detecting object motion in controlled en-
vironments. For example, when four tagged objects were placed
in the reader antenna’s field (Alien Technology Corporation’s
915-MHz system), the system had the following performance:
minimum (maximum) response time of 0.7 (7) s, respectively,
and an average response time of around 2 s. For a total of
1353 experimental tests under different scenarios, the overall
accuracy is 94% [10].
V. CONCLUSION
A novel approach to detect the movement of RFID-tagged
objects was presented. The method does not require add-onhardware or communication-protocol modification and works

8/7/2019 Unobtrusive Long-Range Detection of RFID Tag Motion
http://slidepdf.com/reader/full/unobtrusive-long-range-detection-of-rfid-tag-motion 10/10
196 IEEE TRANSACTIONS ON INSTRUMENTATION AND MEASUREMENT, VOL. 55, NO. 1, FEBRUARY 2006
by analyzing changes in an easily derived approximation of
signal-intensity level. System performance is greatly improved
by introducing a multitag/reader configuration. The effect of
tag movement on the response rate was categorized into four
cases, which allow prompt and accurate detection. Experi-
ments proved the validity of this cost-effective response-rate-
based passive RFID system as a sensor network for movementdetection.
REFERENCES
[1] V. Stanford, “Pervasive computing goes the last hundred feet with RFIDsystems,” IEEE Pervasive Comput., vol. 2, no. 2, pp. 9–14, Apr.–Jun.2003.
[2] H. Stochman, “Communication by means of reflected power,” Proc. IRE ,vol. 36, pp. 1196–1204, Oct. 1948.
[3] J. Landt, “Shrouds of time—The history of RFID,” in RFID Connections.Pittsburgh, PA: AIM Global, 2002, no. 2.
[4] M. Philipose, K. P. Fishkin, M. Perkowitz, D. Patterson, and D. Haehnel,“The probabilistic activity toolkit: Towards enabling activity—Awarecomputer interfaces,” Intel Research Seattle, Seattle, WA, Tech. Memo.IRS-TR-03-013, Dec. 2003.
[5] K. Finkenzeller, RFID Handbook: Fundamentals and Applications inContactless Smart Cards and Identification, 2nd ed. New York: Wiley,2003.
[6] J. Kraus, Antennas, 2nd ed. New York: McGraw-Hill, 1988.[7] Agilent Technologies Application Note 1089, Designing Detector for
RF/ID Tags, Palo Alto, CA: Agilent Corporate.[8] U. Karthaus and M. Fischer, “Fully integrated passive UHF RFID
transponder IC with 16.7 µW minimum RF input power,” IEEE J. Solid-State Circuits, vol. 38, no. 10, pp. 1602–1608, Oct. 2003.
[9] E. B. Mode, Elements of Probability and Statistics. Englewood Cliffs,NJ: Prentice-Hall, 1966.
[10] K. P. Fishkin, B. Jiang, M. Philipose, and S. Roy, “I sense a disturbancein the force: Long-range detection of interactions with RFID-tagged ob-
jects,” in Proc. 6th Int. Conf. Ubiquitous Computing, Nottingham, U.K.,2004, vol. 3205, Lecture Notes in Computer Science, pp. 268–282.
Bing Jiang (S’01) received the B.S. degree fromTianjin University, China, in 1995, and the M.S.E.E.degree from the University of Washington, Seattle, in2003. He is working toward the Ph.D. degree in theDepartment of Electrical Engineering, University of Washington.
He worked as an Intern at Intel Research, Seattle,from September 2003 to June 2004. He is interestedin research on radio-frequency identification (RFID),sensors, and robotics.
Kenneth P. Fishkin received the B.S. degree incomputer science and B.S. degree in mathematicsfrom the University of Wisconsin, Madison, and theM.S. degree in computer science from the Universityof California, Berkeley.
He was previously a Senior Researcher at IntelResearch, Seattle, when the work presented in thispaper was performed. He is currently a Software
Engineer at Google. He has published widely in thefields of radio-frequency identification (RFID), userinterfaces, and computer graphics.
Sumit Roy (S’96–M’98) received the B.Tech. de-gree in electrical engineering from the Indian Insti-tute of Technology, Kanpur, India, in 1983, and theM.S. and Ph.D. degrees in electrical engineering andthe M.A. degree in statistics and applied probabilityfrom the University of California, Santa Barbara, in1985, 1988, and 1988, respectively.
He is a Professor of electrical engineering at theUniversity of Washington, Seattle, and a VisitingFaculty Consultant to Intel Research, Seattle. Hisareas of technical interest involve wireless commu-
nication systems. He is currently exploring the use of radio-frequency identi-fication (RFID) and 802.11 wireless-local-area-network (WLAN) technologieswithin networked ubiquitous computing environments. He recently spent twoyearson academic leave at the Wireless Technology Development Group withinIntel Labs, Hillsboro, OR, working on next-generation WLAN and personal-area-network (PAN) systems.
Prof. Roy is an active member of the IEEE Communications Society.
Matthai Philipose received the B.S. degree fromCornell University, Ithaca, NY, in 1994, and the M.S.degree from the University of Washington, Seattle, in1996, both in computer science.
He is a Researcher at Intel Research, Seattle (IRS).His primary areas of interest are programming lan-guages and probabilistic reasoning. He is currentlyworking on human-activity inferencing at IRS.
![Localization of Compact Circularly Polarized RFID Tag ...Localization of Compact Circularly Polarized RFID Tag ... tion using sparsely distributed passive RFID tags. ... [12]DIGIAMPAOLO,](https://img.pdfslide.us/doc/110x75/5e79d0688d24f90ca522e9fc/localization-of-compact-circularly-polarized-rfid-tag-localization-of-compact.jpg)


![Joint Design of RFID Reader and Tag Anti-Collision ... · of RFID [2]. Two types of RFID MAC collision can be distinguished: tag and reader collision. A tag collision arises when](https://img.pdfslide.us/doc/110x75/5fb2d86ba87547679d65cd0f/joint-design-of-rfid-reader-and-tag-anti-collision-of-rfid-2-two-types-of.jpg)