Embed Size (px)
Citation preview
Unlocking the Mathematical Gate: Using Our Collective
Findings for Greatest Impact
Bernadine Chuck Fong, Sr. Managing Partner
Achieving the Dream Leadership Coach
HSI March 8, 2014
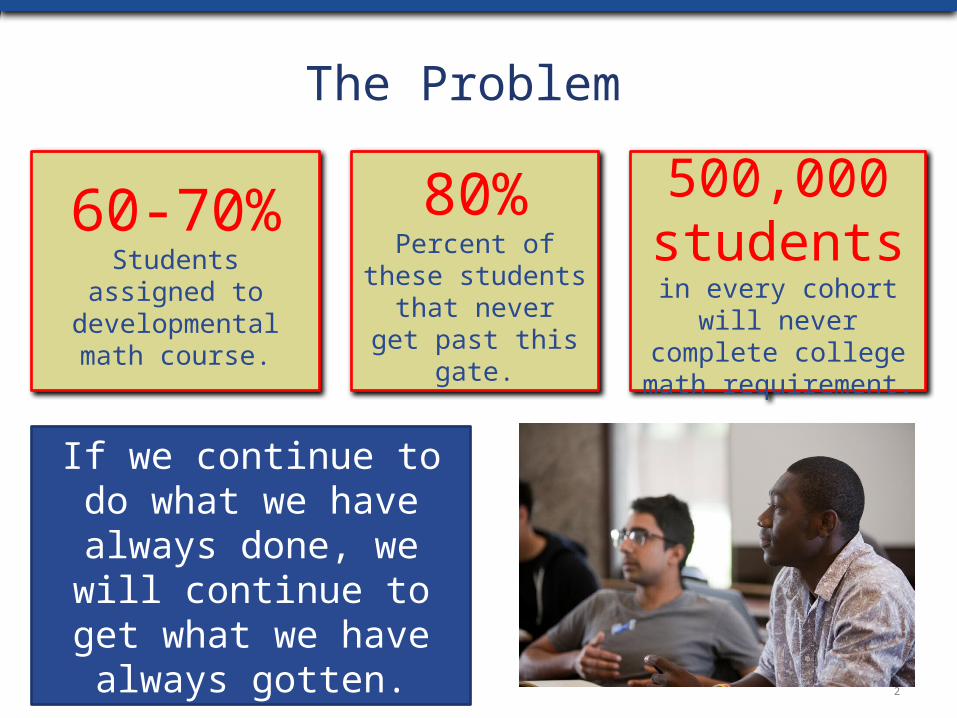
60-70%Students assigned to developmental math
course.
80%Percent of these
students that neverget past this gate.
500,000 students
in every cohort will never complete college math
requirement.
2
The Problem
If we continue to do what we have always done, we will continue to get what we have always gotten.
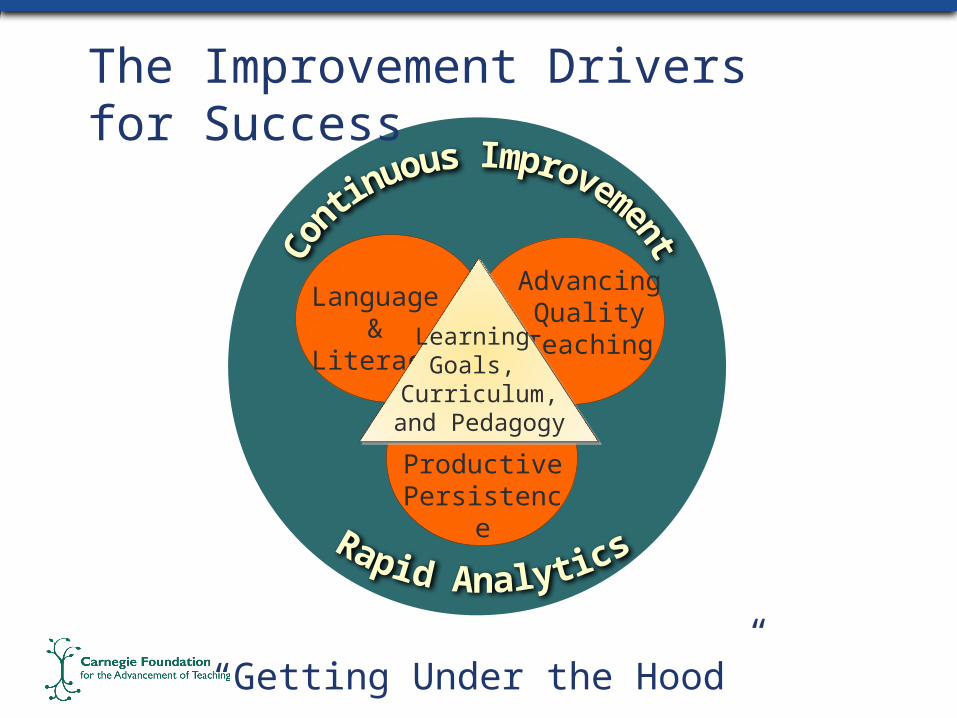
Language & Literacy
Productive Persistence
Advancing Quality
TeachingLearning Goals,
Curriculum, and Pedagogy
The Improvement Drivers for Success
“Getting Under the Hood”
4
Learning is a Cultural Activity
Teaching is a cultural activity, but so is learning…
Even if teachers can successfully create learning opportunities in the classroom, students need to be prepared to take advantage of them.
5
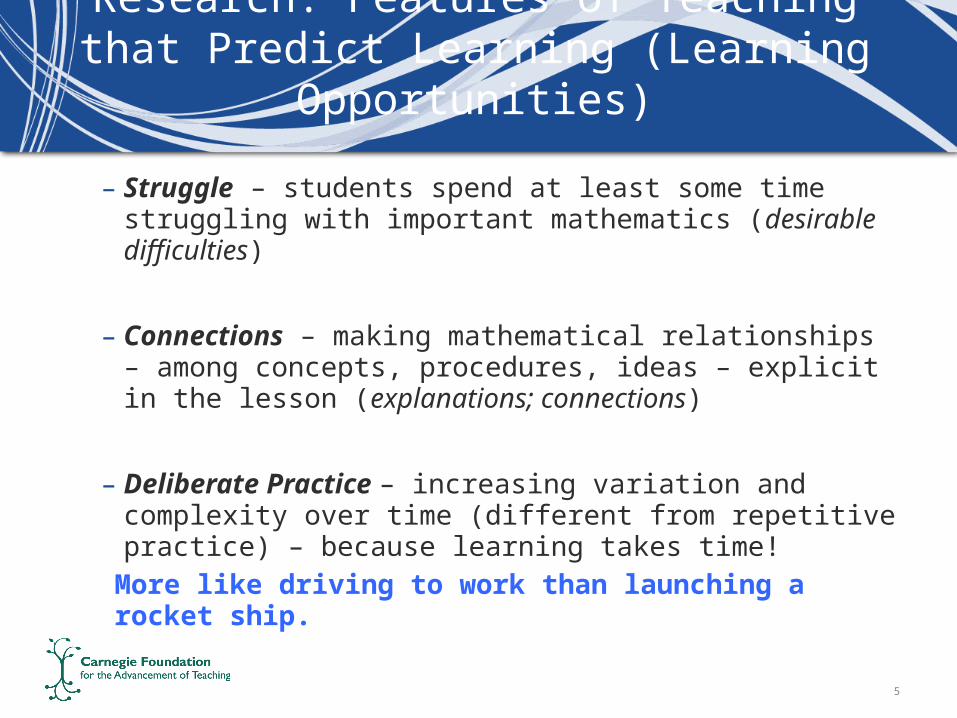
Research: Features of Teaching that Predict Learning (Learning
Opportunities)
– Struggle – students spend at least some time struggling with important mathematics (desirable difficulties)
– Connections – making mathematical relationships – among concepts, procedures, ideas – explicit in the lesson (explanations; connections)
– Deliberate Practice – increasing variation and complexity over time (different from repetitive practice) – because learning takes time!
More like driving to work than launching a rocket ship.
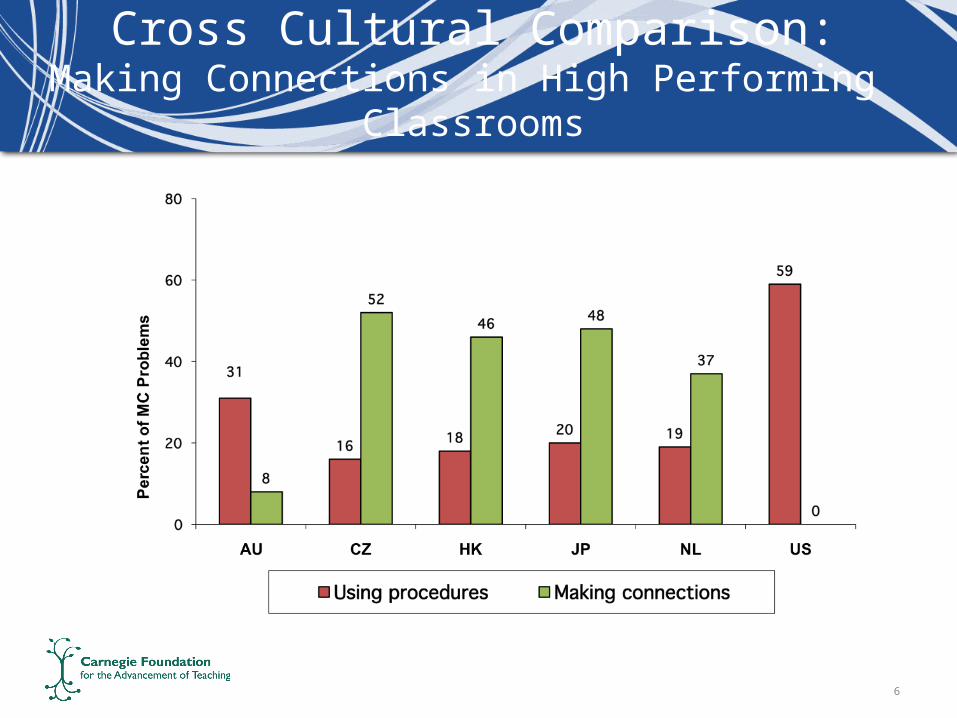
Cross Cultural Comparison:Making Connections in High Performing
Classrooms
6
7
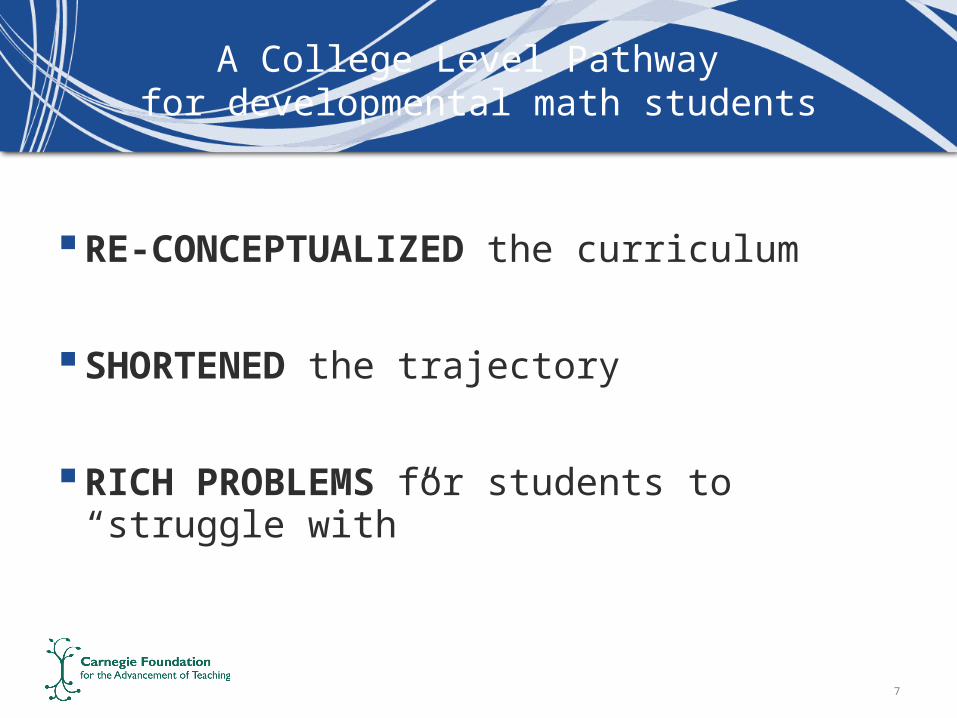
A College Level Pathway for developmental math students
RE-CONCEPTUALIZED the curriculum
SHORTENED the trajectory
RICH PROBLEMS for students to “struggle with”
8
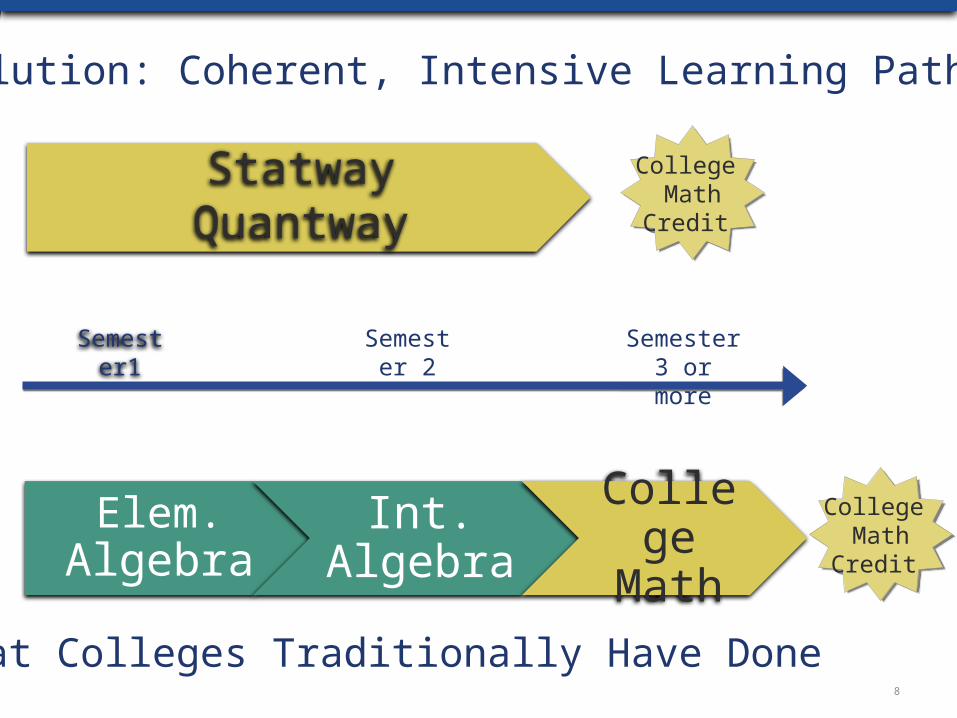
Elem. Algebra
Int. Algebra
College
Math
Semester1
Semester 2
Semester 3 or more
College Math
Credit
College Math
Credit
College Math
Credit
College Math
Credit
StatwayQuantway
A Solution: Coherent, Intensive Learning Pathways
What Colleges Traditionally Have Done
Trad
itio
nal
Seq
uen
ceSta
tway
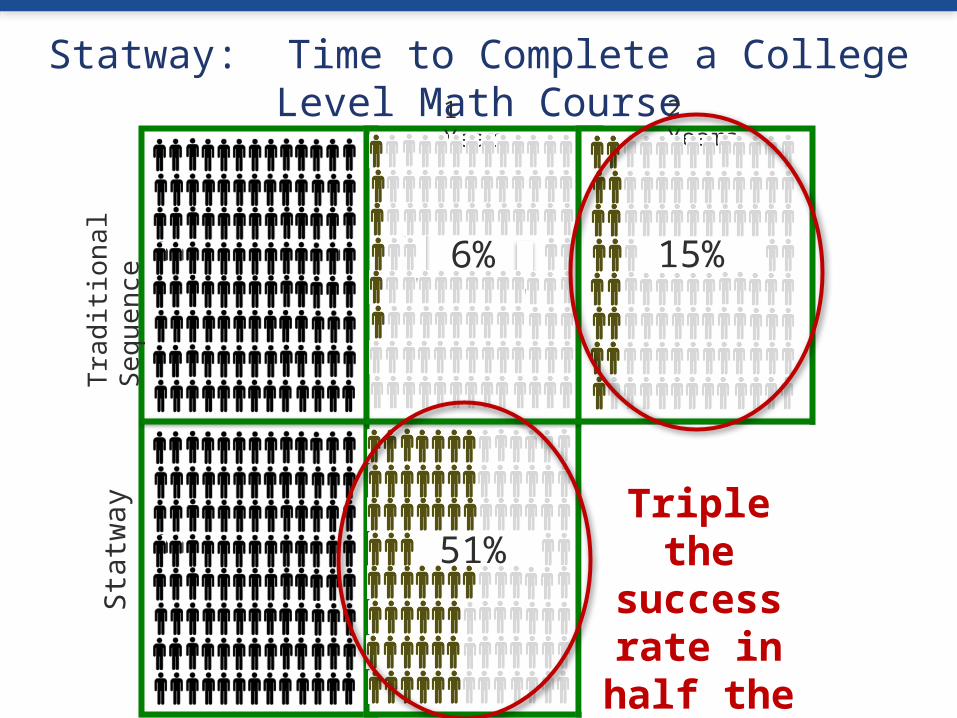
Statway: Time to Complete a College Level Math Course1 Year 2 Years
Triple the success rate in half the
time.
6%
51%
15%
Trad
itio
nal
Seq
uen
ceQ
uantw
ay 1
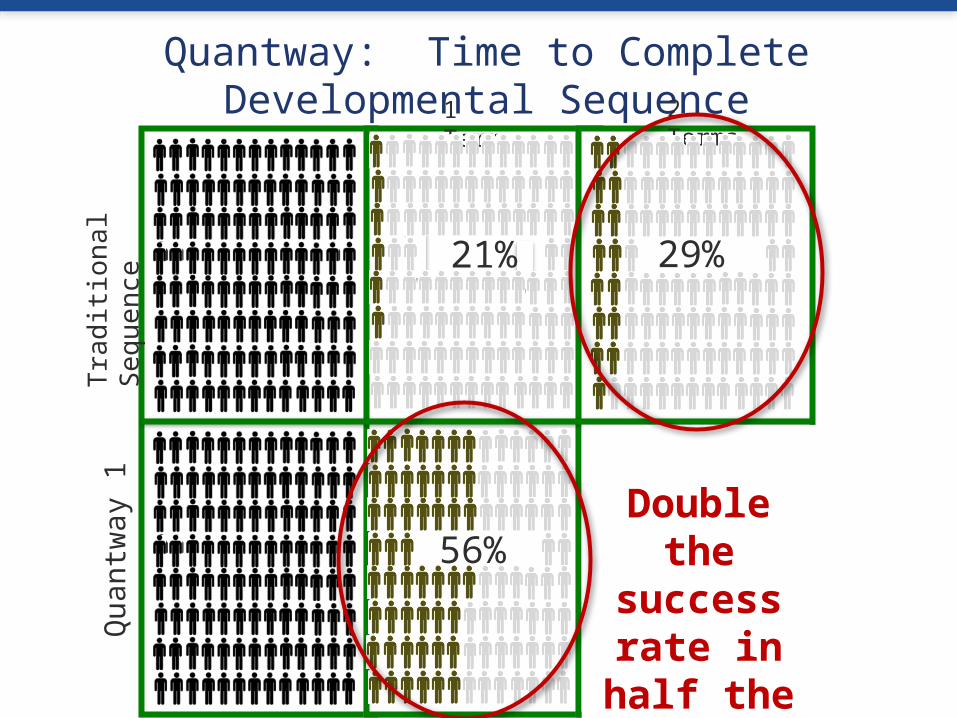
Quantway: Time to Complete Developmental Sequence1 Term 2 Terms
Double the
success rate in half the
time.
21%
56%
29%
11
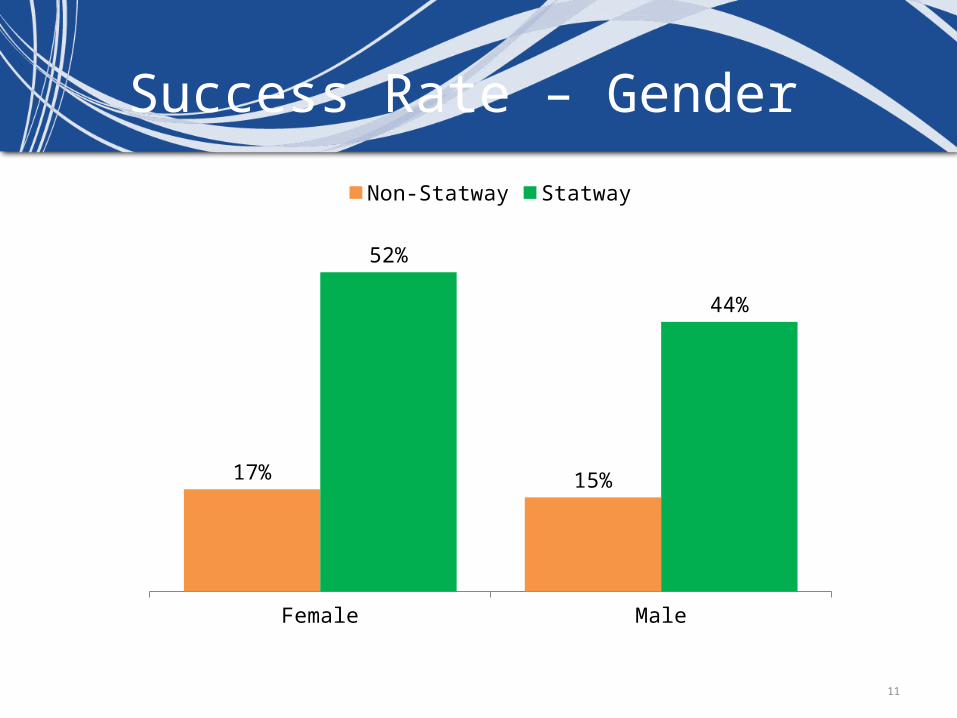
Success Rate – Gender
Female Male
17% 15%
52%
44%
Non-Statway Statway
12
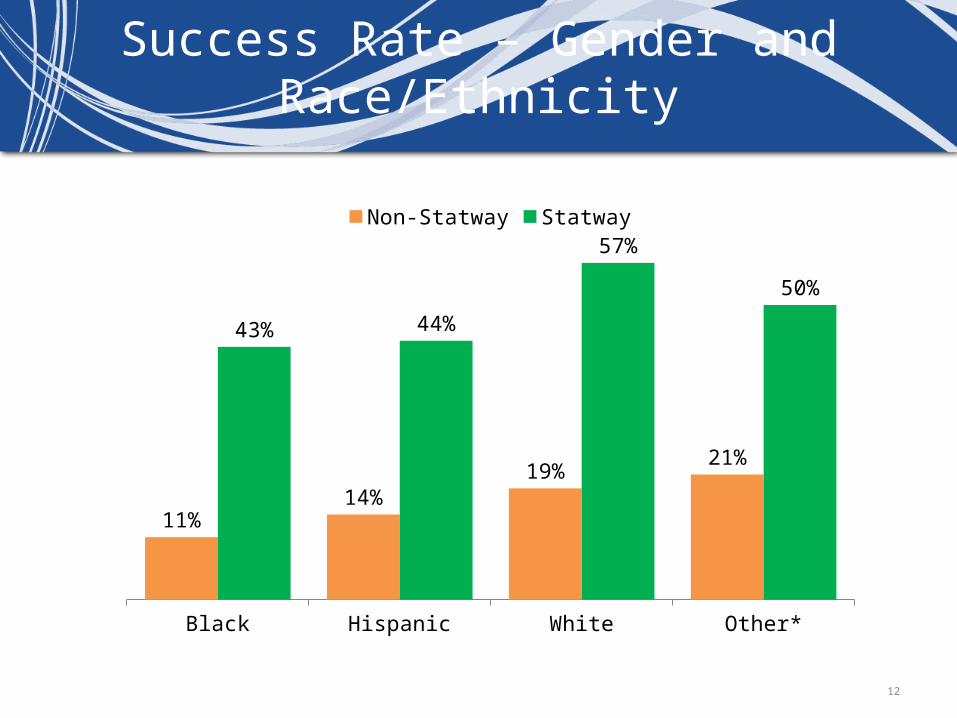
Success Rate – Gender and Race/Ethnicity
Black Hispanic White Other*
11%14%
19%21%
43% 44%
57%
50%
Non-Statway Statway
13
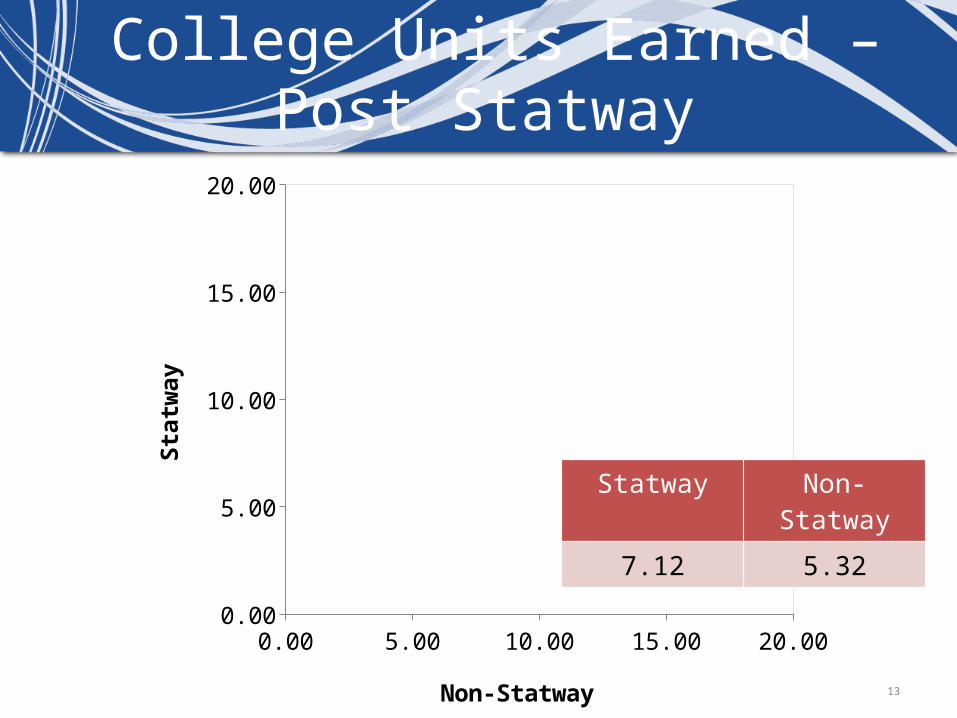
College Units Earned – Post Statway
0.00 5.00 10.00 15.00 20.000.00
5.00
10.00
15.00
20.00
Non-Statway
Statway
Statway Non-Statway
7.12 5.32
14
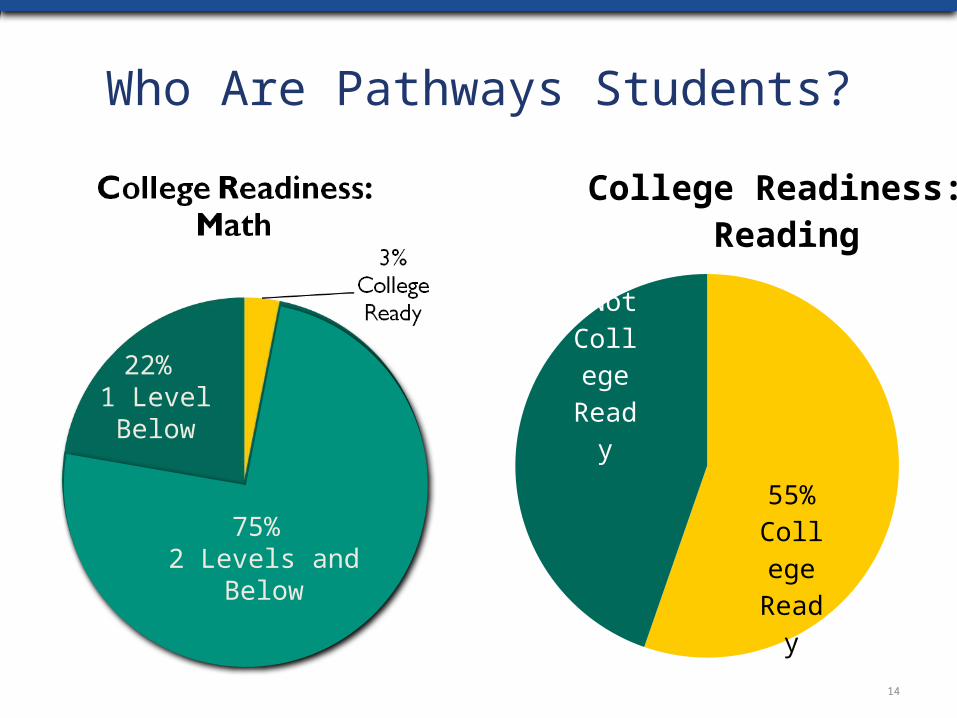
Who Are Pathways Students?
55% Col-lege Read
y
45% Not Col-lege
Ready
College Readiness: Reading
75% 2 Levels and
Below
22% 1 Level Below
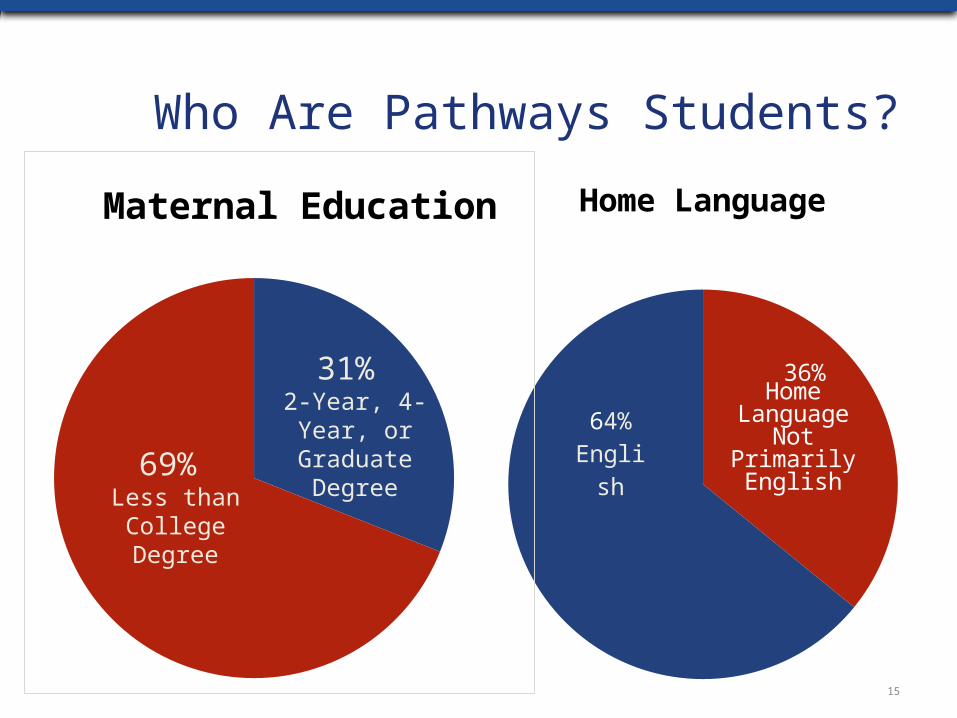
64% Eng-lish
36%
Home Language
Home Lan-guage Not Primarily English
15
Who Are Pathways Students?
Maternal Education
69% Less than
College Degree
31% 2-Year, 4-Year, or
Graduate Degree
16
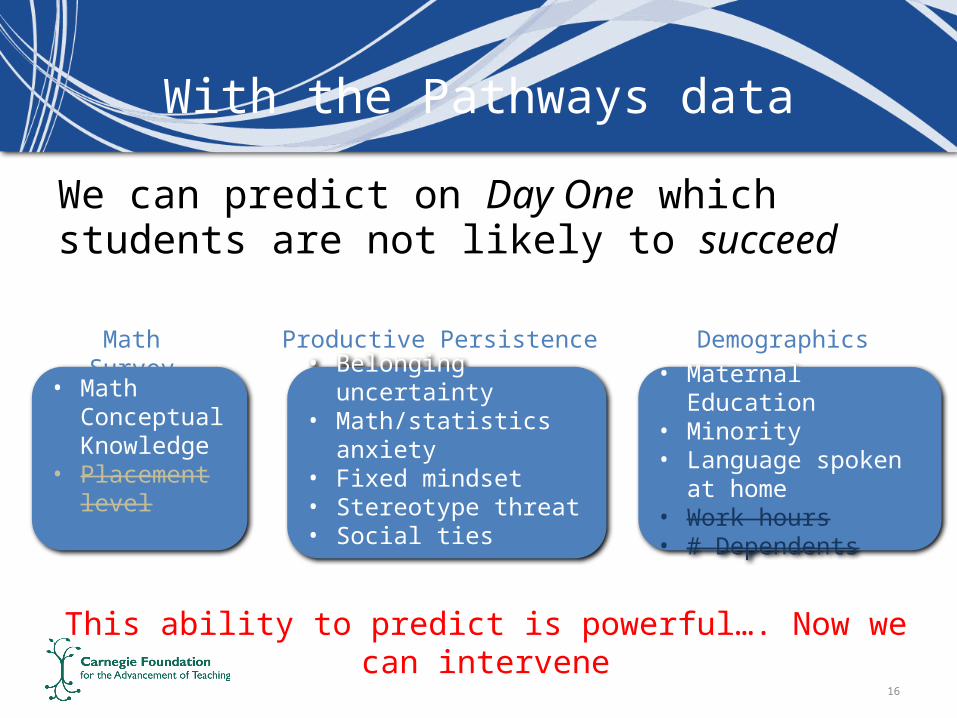
With the Pathways data
We can predict on Day One which students are not likely to succeed
• Belonging uncertainty• Math/statistics anxiety• Fixed mindset• Stereotype threat• Social ties
• Maternal Education• Minority • Language spoken at
home• Work hours• # Dependents
• Math Conceptual Knowledge
• Placement level
Math Survey
Productive Persistence Demographics
This ability to predict is powerful…. Now we can intervene
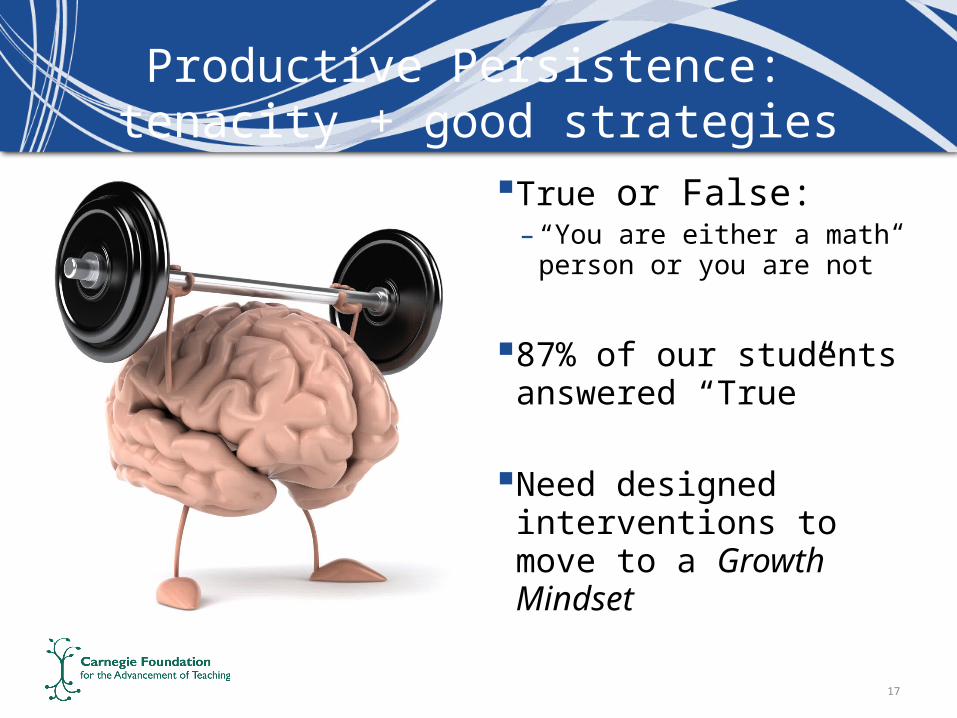
Productive Persistence: tenacity + good strategies
True or False: – “You are either a math
person or you are not”
87% of our students answered “True”
Need designed interventions to move to a Growth Mindset
17
18
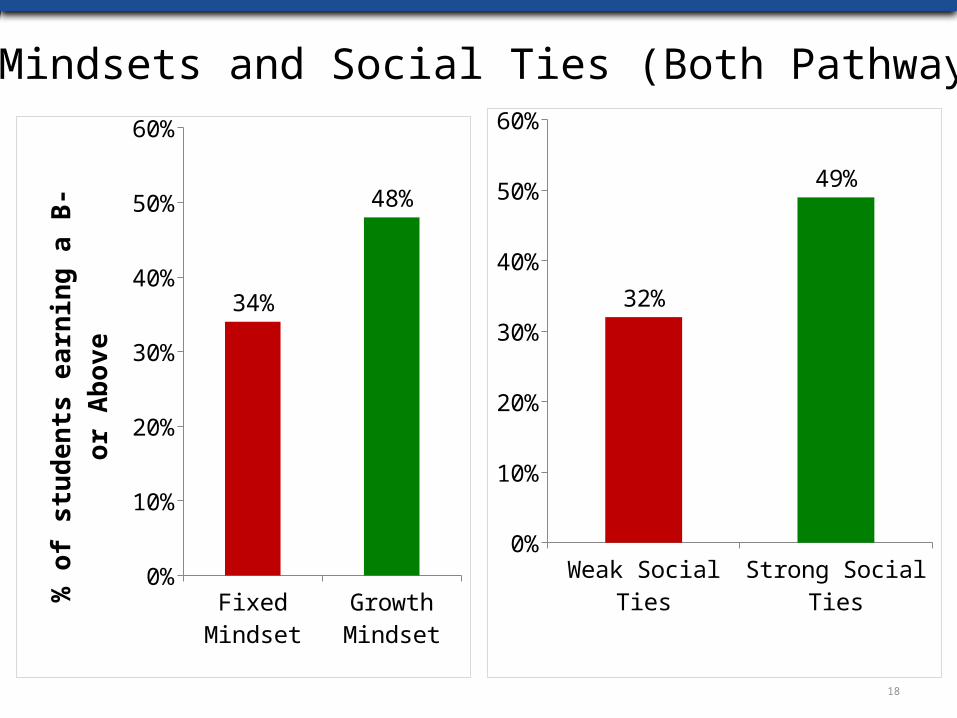
Social Ties and Mindsets
Fixed Mindset Growth Mindset
0%
10%
20%
30%
40%
50%
60%
34%
48%
% o
f stu
dent
s ea
rnin
g a
B- o
r Abo
ve
Weak Social Ties Strong Social Ties0%
10%
20%
30%
40%
50%
60%
32%
49%
Mindsets and Social Ties (Both Pathways)
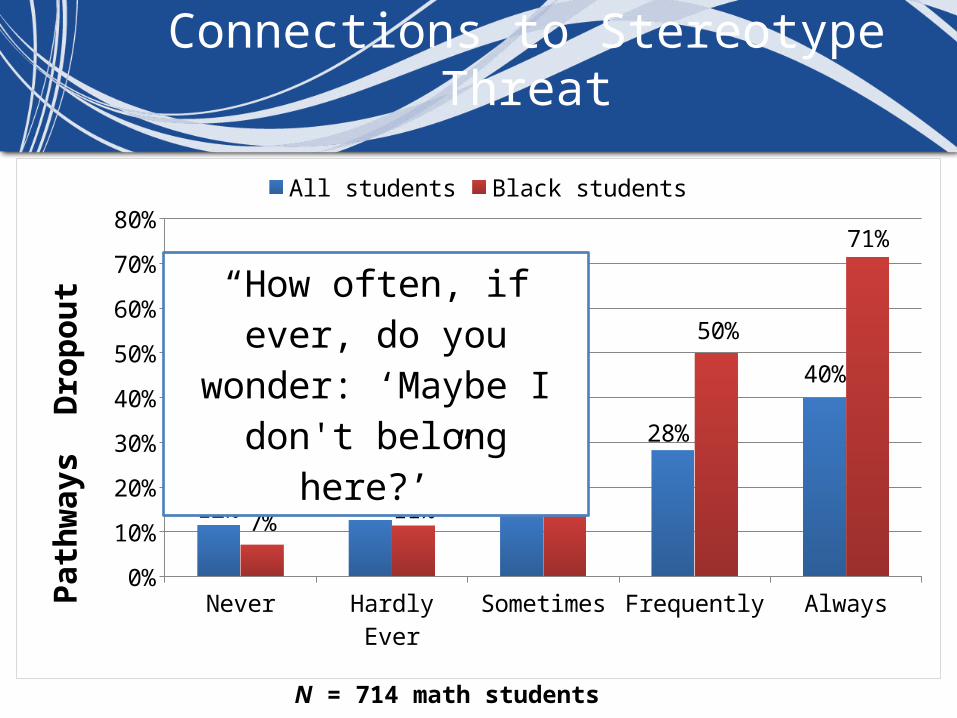
Connections to Stereotype Threat
Never Hardly Ever Sometimes Frequently Always0%
10%
20%
30%
40%
50%
60%
70%
80%
12% 13% 14%
28%
40%
7%11%
14%
50%
71%
All students Black students
Path
way
s D
ropo
ut
“How often, if ever, do you wonder: ‘Maybe I don't be-
long here?’”
N = 714 math students
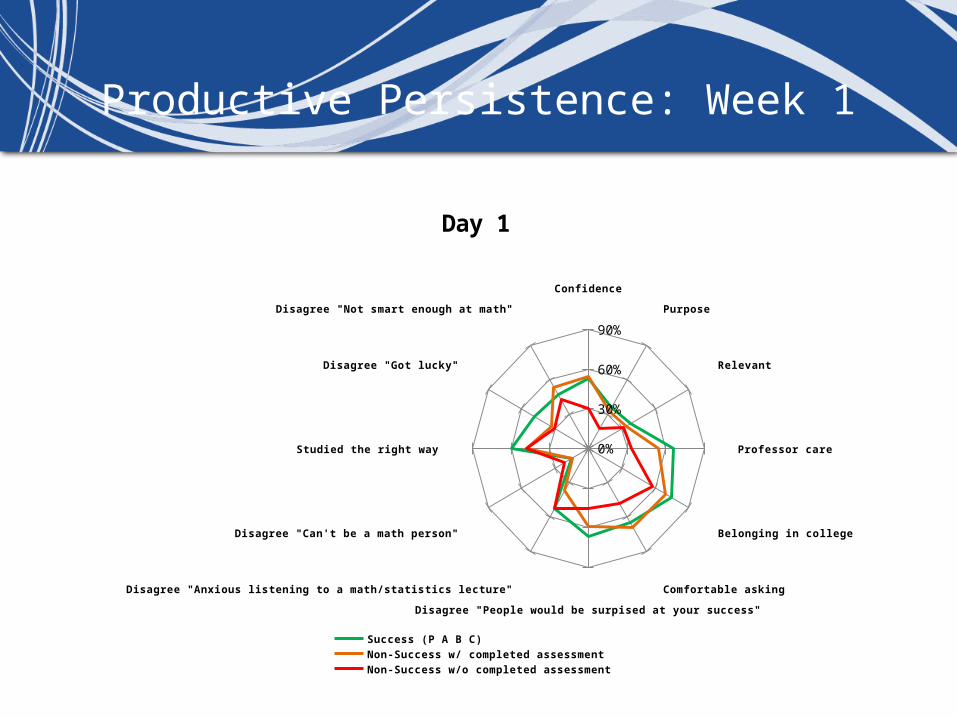
Productive Persistence: Week 1
Confidence
Purpose
Relevant
Professor care
Belonging in college
Comfortable asking
Disagree "People would be surpised at your success"
Disagree "Anxious listening to a math/statistics lecture"
Disagree "Can't be a math person"
Studied the right way
Disagree "Got lucky"
Disagree "Not smart enough at math"
0%
30%
60%
90%Day 1
Success (P A B C) Non-Success w/ completed assessment Non-Success w/o completed assessment
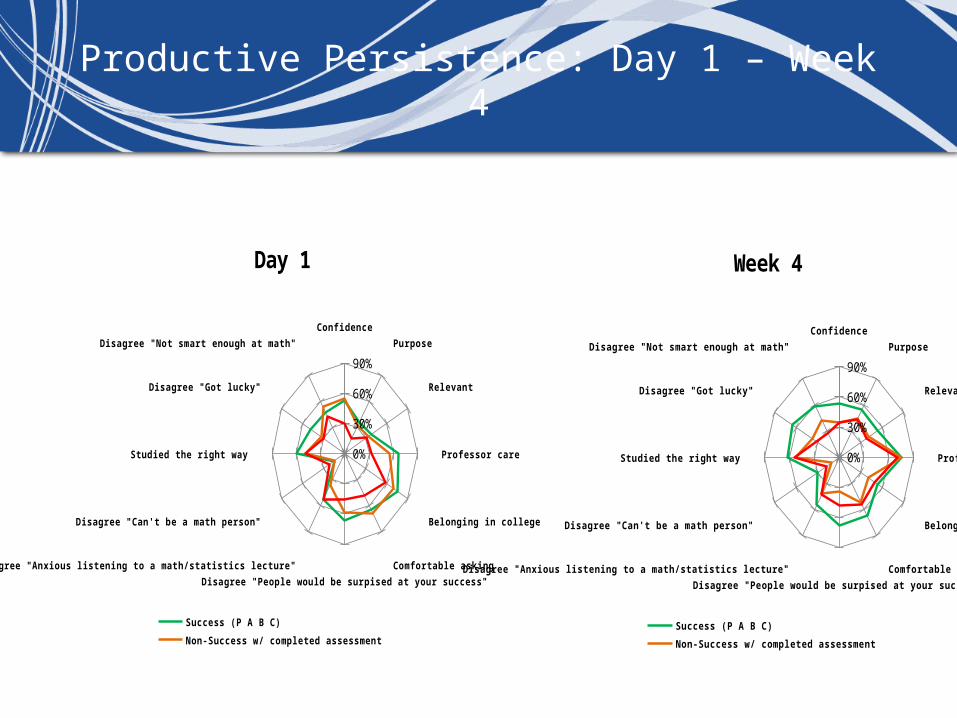
Productive Persistence: Day 1 – Week 4
Confidence
Purpose
Relevant
Professor care
Belonging in college
Comfortable asking
Disagree "People would be surpised at your success"
Disagree "Anxious listening to a math/statistics lecture"
Disagree "Can't be a math person"
Studied the right way
Disagree "Got lucky"
Disagree "Not smart enough at math"
0%
30%
60%
90%
Day 1
Success (P A B C)Non-Success w/ completed assessmentNon-Success w/o completed assessment
Confidence
Purpose
Relevant
Professor care
Belonging in class
Comfortable asking
Disagree "People would be surpised at your success"
Disagree "Anxious listening to a math/statistics lecture"
Disagree "Can't be a math person"
Studied the right way
Disagree "Got lucky"
Disagree "Not smart enough at math"
0%
30%
60%
90%
Week 4
Success (P A B C)Non-Success w/ completed assessmentNon-Success w/o completed assessment
22
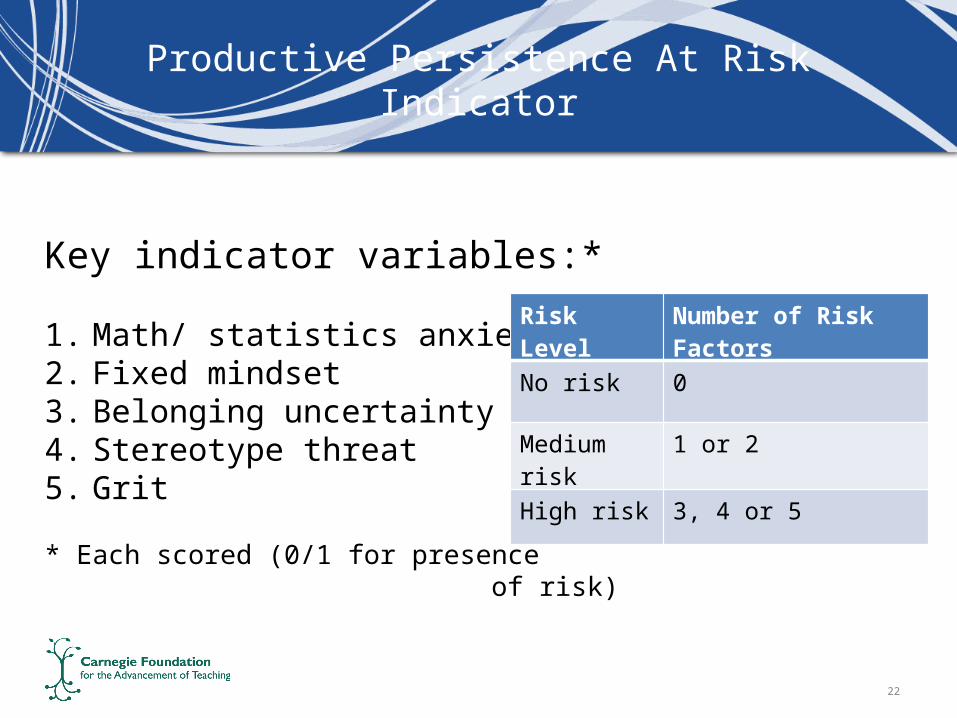
Productive Persistence At Risk Indicator
Key indicator variables:*
1. Math/ statistics anxiety2. Fixed mindset3. Belonging uncertainty4. Stereotype threat5. Grit
* Each scored (0/1 for presence of risk)
Risk Level Number of Risk Factors
No risk 0
Medium risk 1 or 2
High risk 3, 4 or 5
23
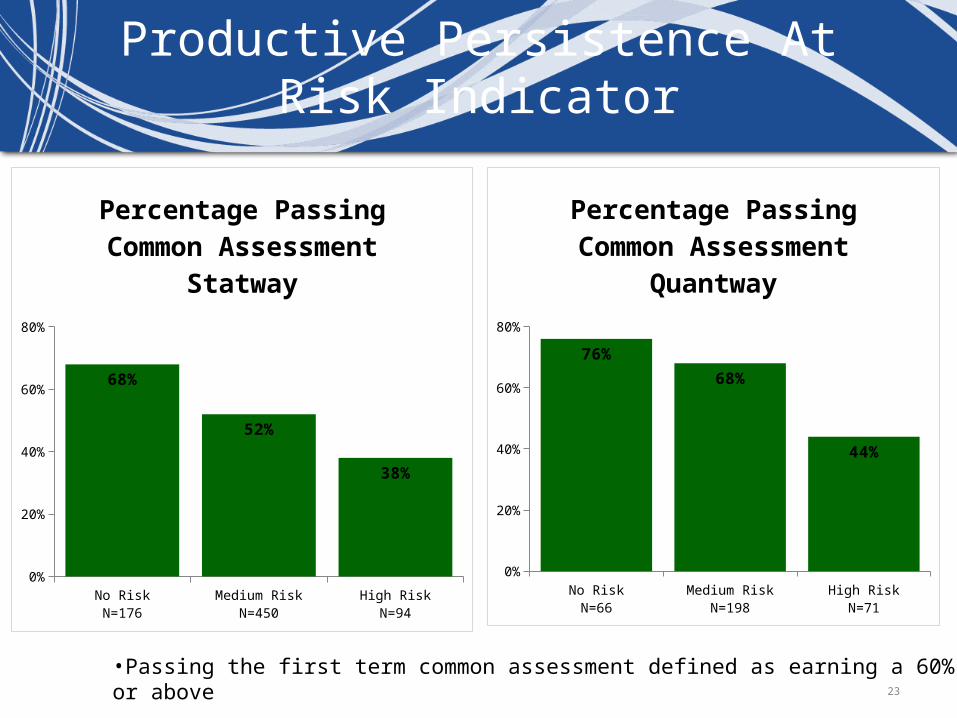
Productive Persistence At Risk Indicator
No RiskN=176
Medium RiskN=450
High RiskN=94
0%
20%
40%
60%
80%
68%
52%
38%
Percentage Passing Common Assessment Statway
No RiskN=66
Medium RiskN=198
High RiskN=71
0%
20%
40%
60%
80%
76%
68%
44%
Percentage Passing Common Assessment Quantway
•Passing the first term common assessment defined as earning a 60% or above
24
Leveling the Playing Field
We are finding that, given the right opportunities and supports, prompts and encouragements, developmental math students can perform as well as other students
“Developmental math” designation may create its own stereotype threat that militates against learning
26
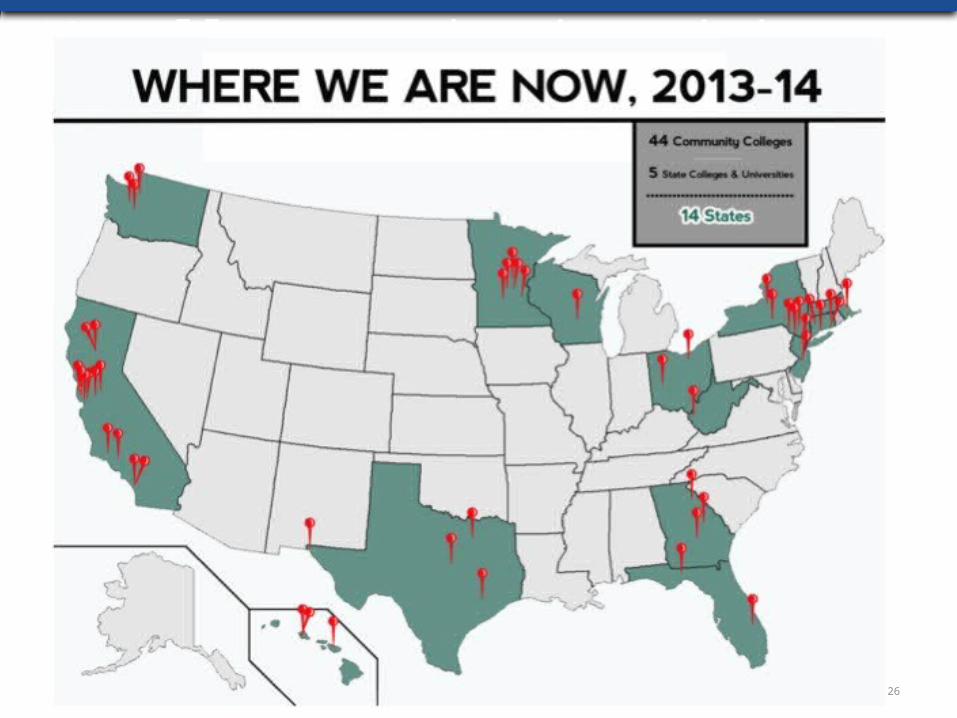
48 colleges and universities in 14 states
27
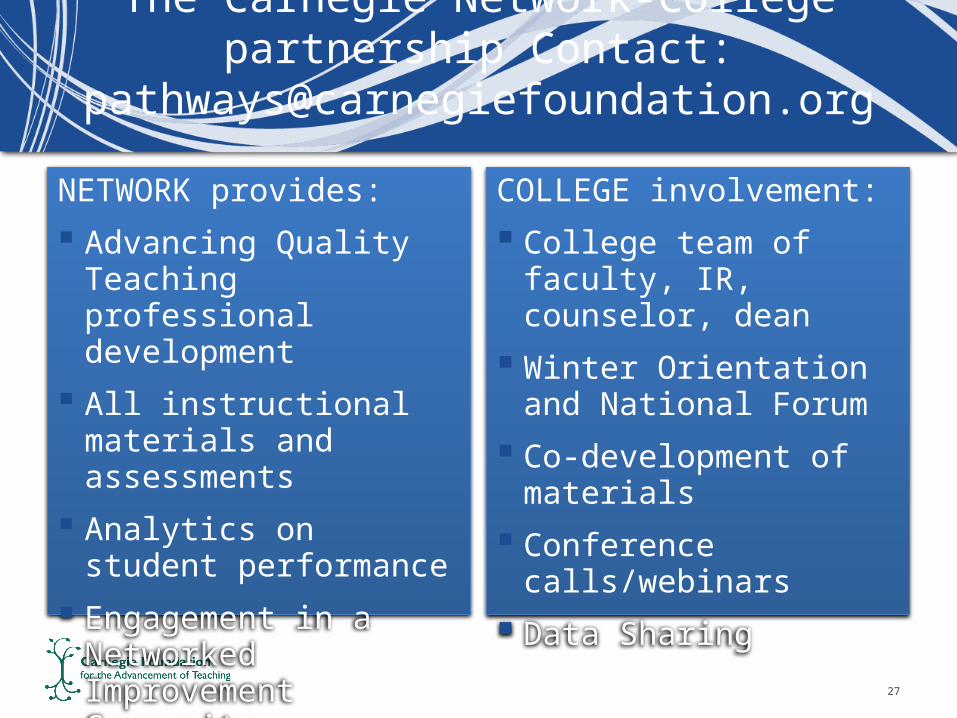
The Carnegie Network-College partnership Contact:
NETWORK provides:
Advancing Quality Teaching professional development
All instructional materials and assessments
Analytics on student performance
Engagement in a Networked Improvement Community
COLLEGE involvement:
College team of faculty, IR, counselor, dean
Winter Orientation and National Forum
Co-development of materials
Conference calls/webinars
Data Sharing