Embed Size (px)
Citation preview

Title Source analysis of short and long latency vestibular-evoked potentials
(VsEPs) produced by left versus right ear air-conducted 500 Hz pips
Type Article
URL http://ualresearchonline.arts.ac.uk/10436/
Date 2014
Citation Todd, Neil and Paillard, Aurora and Kluk, Karolina and Whittle, Elizabeth
and Colebatch, James (2014) Source analysis of short and long latency
vestibular-evoked potentials (VsEPs) produced by left versus right ear air-
conducted 500 Hz pips. Hearing Research, 312. pp. 91-102. ISSN 0378-
5955
Creators Todd, Neil and Paillard, Aurora and Kluk, Karolina and Whittle, Elizabeth
and Colebatch, James
Usage Guidelines
Please refer to usage guidelines at http://ualresearchonline.arts.ac.uk/policies.html or
alternatively contact [email protected].
License: Creative Commons Attribution Non-commercial No Derivatives
Unless otherwise stated, copyright owned by the author
Research paper
Source analysis of short and long latency vestibular-evoked potentials
(VsEPs) produced by left vs. right ear air-conducted 500 Hz tone pips
N.P.M. Todd a,*, A.C. Paillard a, K. Kluk b, E. Whittle a, J.G. Colebatch c
a Faculty of Life Science, University of Manchester, Manchester M13 9PL, UKb School of Psychological Sciences, University of Manchester, Manchester M13 9PL, UKc Prince of Wales Clinical School and Neuroscience Research Australia, University of New South Wales, Randwick, Sydney, NSW 2052, Australia
a r t i c l e i n f o
Article history:
Received 11 November 2013
Received in revised form
6 March 2014
Accepted 10 March 2014
Available online 1 April 2014
a b s t r a c t
Todd et al. (2014) have recently demonstrated the presence of vestibular dependent changes both in the
morphology and in the intensity dependence of auditory evoked potentials (AEPs) when passing through
the vestibular threshold as determined by vestibular evoked myogenic potentials (VEMPs). In this paper
we extend this work by comparing left vs. right ear stimulation and by conducting a source analysis of
the resulting evoked potentials of short and long latency. Ten healthy, right-handed subjects were
recruited and evoked potentials were recorded to both left- and right-ear sound stimulation, above and
below vestibular threshold. Below VEMP threshold, typical AEPs were recorded, consisting of mid-
latency (MLR) waves Na and Pa followed by long latency AEPs (LAEPs) N1 and P2. In the supra-
threshold condition, the expected changes in morphology were observed, consisting of: (1) short-
latency vestibular evoked potentials (VsEPs) which have no auditory correlate, i.e. the ocular VEMP
(OVEMP) and inion response related potentials; (2) a later deflection, labelled N42/P52, followed by the
LAEPs N1 and P2. Statistical analysis of the vestibular dependent responses indicated a contralateral
effect for inion related short-latency responses and a left-ear/right-hemisphere advantage for the long-
latency responses. Source analysis indicated that the short-latency effects may be mediated by a
contralateral projection to left cerebellum, while the long-latency effects were mediated by a contra-
lateral projection to right cingulate cortex. In addition we found evidence of a possible vestibular
contribution to the auditory T-complex in radial temporal lobe sources. These last results raise the
possibility that acoustic activation of the otolith organs could potentially contribute to auditory
processing.
� 2014 The Authors. Published by Elsevier B.V. This is an open access article under the CC BY license
(http://creativecommons.org/licenses/by/3.0/).
1. Introduction
Acoustic sensitivity of the human vestibular system has long
been established and can be demonstrated by means of evoked
electromyographic (EMG) signals (Bickford et al., 1964). Such EMG
responses can bemeasured either frommuscles of the neck, e.g. the
sternocleidomastoid muscle, reflecting the vestibular-collic reflex
pathways (the vestibular evoked myogenic potential or VEMP
(Colebatch et al., 1994)) or from extra-ocular eye muscles, reflecting
activation of the vestibular ocular reflex pathways (ocular VEMP or
OVEMP (Rosengren et al., 2005; Todd et al., 2007)). Although the
neck response is often now referred to as a cervical VEMP (or
CVEMP), in the rest of this text we use the original acronym ‘VEMP’.
In the last decade evidence has accumulated from electroen-
cephalographic (EEG) studies in humans that vestibular receptors
may also contribute to sound evoked potentials of central origin.
Following a study by de Waele et al. (2001), who showed the ex-
istence of short-latency potentials (8e15 ms) in response to elec-
trical stimulation, Todd et al. (2003) demonstrated a similar
response to 500 Hz bone-conducted (BC) sound. These acoustically
evoked short-latency vestibular evoked potentials (VsEPs) were
confirmed to have vestibular origin as they were absent in aves-
tibular patients but present in deaf subjects with intact VEMPs
(Rosengren and Colebatch, 2006). (Unlike AEPs for VsEPs there is no
well-established “brainstem” response hence really only two
epochs are recognized. The term “short latency VsEPs” has become
established in the literature as referring to early responses domi-
nated by the vestibular reflexes. These overlap in time with both
ABR and MLR AEPs.) Later Todd et al. (2008) used source analysis to
confirm that the short-latency VsEPs produced by air-conducted* Corresponding author. Tel.: þ44(0)161 306 5770.
E-mail address: [email protected] (N.P.M. Todd).
Contents lists available at ScienceDirect
Hearing Research
journal homepage: www.elsevier .com/locate/heares
http://dx.doi.org/10.1016/j.heares.2014.03.006
0378-5955/� 2014 The Authors. Published by Elsevier B.V. This is an open access article under the CC BY license (http://creativecommons.org/licenses/by/3.0/).
Hearing Research 312 (2014) 91e102

(AC) and BC sound are dominated by the pathways underlying the
vestibular-ocular reflex, but also suggested activity in frontal cor-
tex. More recently McNerney et al. (2011) used an alternative
source analysis method to suggest that a wider range of vestibular
cortical areas contribute to the short-latency potentials activated by
sound.
Most recently Todd et al. (2014) provided evidence that in
addition to short-latency effects there were likely vestibular con-
tributions at longer latencies. These were recognized by systematic
changes that take place in morphology and in the intensity depen-
dence of the responses in passing through the vestibular threshold.
Of particular interest was a medium-latency deflection, labelled
N42/P52, which exhibited a change in slope and latency function,
and was absent in an avestibular patient. The long-latency auditory
evoked potential (LAEP) N1 also showed some changes in passing
through the VEMP threshold. A source analysis indicated a possible
contribution of cingulate cortex to both the N42 and N1, as well as
temporal lobe, cerebellar and other sub-cortical sources. This study
was, however, limited to the left ear only. We wished, therefore, in
the present study to extend this work to both left and right ears and
to investigate any effects of ear or laterality of vestibular dependent
changes in sound evoked potentials, and in particular the N42/P52
and N1 waves, especially in light of lateralisation shown for
vestibular stimulation in imaging studies (Dieterich et al., 2003;
Janzen et al., 2008; Schlindwein et al., 2008; Lopez et al., 2012).
2. Material and methods
2.1. Subjects
Ten healthy subjects were selected for this study (mean
age¼ 27.5; SD¼ 7.21; 3 females and 7males). All subjects were first
screened for any neurological, vestibular or hearing impairment.
Prior to any testing, all participants gave written informed consent
according to the Declaration of Helsinki. The University of Man-
chester Ethics Committee approved the study.
2.2. Stimuli
The experimental stimuli employed for obtaining vestibular
responses were AC 2-ms, 500-Hz, single cycle tone pips. AC stimuli
were delivered by insert earphones (3A insert earphone, E-A-RTone
Gold, Guymark UK Limited). The maximum input voltage resulted
in a maximum output on the amplifier equivalent to a peak SPL
(pkSPL) of 136 dB re 20 mPa (as measured by the LLpk parameter
with linear frequency weighting). Stimulus calibration was carried
out using a GRAS IEC711 Coupler (RA0045) and a pressure-field
microphone (Model 4134) with a 2260 Investigator (Brüel and
Kjaer, Naerum, Denmark). The stimuli were generated using cus-
tomised software with a laboratory interface (power1401, Cam-
bridge Electronic Design, Cambridge, UK) and a commercial or
custom amplifier.
2.3. Auditory thresholds
Audiograms were obtained for both ears using an Amplivox
audiometer (Amplivox Ltd, UK) with Telephonics TDH 49
earphones (Telephonics Corp., Farmingdale, NY, USA). Each subject
satisfactorily achieved pure tone air conduction thresholds of
�20 dB HL at 125, 250, 500, 1000, 2000, 4000 and 8000 Hz bilat-
erally, according to British Society of Audiology (BSA) (2011) rec-
ommended procedures. The subjects had no history of otological or
neurological pathology.
Absolute auditory threshold measurements were performed
using PSYLAB (v2.0, Hansen, 2006) using 3-alternative forced choice
(3AFC), one-up two-down adaptivemethod to track the 79.4% point
on the psychometric function (Levitt, 1971). The signal, i.e. 2-ms,
500-Hz, single-cycle tone-pip, was randomly presented to the
subject in one of the three intervals and delivered unilaterally
through insert earphones (3A insert earphone, E-A-RTone Gold,
GuymarkUK Limited). The initial signal levelwas set to 81 dB pkSPL;
this was reduced by 4 dB after two successive correct responses and
increased by 4 dB after an incorrect response. After four reversals
the measurement phase began and the step size was reduced to
1dB. The thresholdwas taken as an average of the last four reversals.
2.4. Vestibular thresholds
Vestibular thresholds were obtained by means of VEMPs. Sub-
jects were tested lying supine on a couch, with the backrest
approximately tilted to 30e45� from the horizontal, and required
to lift their heads against gravity to activate the sternocleidomas-
toid (SCM)muscles. Surface EMGwasmeasured from the ipsilateral
SCM using self-adhesive Ag/AgCl electrodes. Active surface elec-
trodes were placed over the middle of the SCM muscle belly and
were referred to electrodes placed on the medial clavicle. EMG was
amplified, bandpass filtered (5 Hze1 kHz) and sampled using a
Power1401 interface (CED Ltd., Cambridge, UK). The EMG was
sampled at a rate of 5 kHz, starting 10 ms before to 80 ms following
stimulus onset, and averaged. Stimuli were delivered by insert
earphones (3A insert earphone, E-A-RTone Gold, Guymark UK
Limited). Up to 200 stimuli were presented at a rate of about 6 Hz.
VEMP thresholds (VT) were determined for each subject by
reducing the stimulus intensity in 5 dB steps over successive trials
and were defined as the smallest intensity at which a VEMP could
be produced in at least two trials. The procedure was performed for
left and right sides of stimulation independently and randomly
across subjects.
2.5. VsEPs
VsEPs were recorded with subjects comfortably seated with
their gaze directed straight ahead to a screen displaying silent
movies at a viewing distance (about 70 cm). AC pips were presented
with interstimulus intervals randomly varying between 600 and
1000 ms, up to a total of 400 stimuli per trial. Evoked potentials
(EPs) were recorded for three intensities: maximal intensity
(136 dB pkSPL), 0 re VT and �12 dB re VT. Left and right ears were
stimulated separately and randomly across subjects. EEG was
recorded using a 64-channel EEG system (Biosemi, Inc., USA).
Additional electrodes were also placed below each eye (i.e. infra-
ocular electrodes, IO1 and IO2), at deep frontal (F9 and F10) and
at ear-lobe locations (A1 and A2). Electrode offset (i.e. running
average of the voltage measured between CMS and each active
electrode) was maintained below 20 mV. Recordings were made
with a band-pass of between 0.16 Hz and 1 kHz. Artefact elimina-
tion, epoching and averaging of EPswere carried out using the BESA
5 software. Epochs were 350 ms in length, from 50 ms before to
300 ms following the stimulus onset. After collection, EPs were
filtered at 1e200 Hz and referenced either to linked ear-lobe
electrodes or to an average reference using Scan software (v4.3,
Neuroscan, USA). Amplitudes were measured at responses peaks.
Although all BESA was done using the average reference we
retained linked-ears for electrode measurements as this is a stan-
dard montage, including in the clinical setting.
2.6. Source analyses
BESA software (version 5.1 MEGIS Software GmbH, Germany)
was used for dipole modelling. The standard four-shell elliptical
N.P.M. Todd et al. / Hearing Research 312 (2014) 91e10292

head approximation was employed with the following parameters.
The radial thickness of the head, scalp, bone and CSF were 85, 6, 7
and 1mm, respectively, with conductivities set to 0.33, 0.33, 0.0042
and 1.0, respectively. Prior to conducting the source analysis
changes in the global field power with intensity were also evalu-
ated in order to determine the appropriate fitting epoch. After
extensive trials it was found appropriate to model the entire epoch
from 7 to 235 ms covering short- and long-latency effects. We
adopted a modelling strategy from previous occasions of using
pairs of regional sources and dipoles (Todd et al., 2008, 2014). This
approach was arrived at after extensive modelling using different
strategies. Ocular sources and temporal lobe sources are ubiquitous
for the stimuli employed and two pairs locate without fail to these
areas, irrespective of starting conditions. Regional sources are
appropriate to model the complexity of the (known) activation of
the bilateral extra-ocular eye muscles (EOM) in conjunction with
the retinal corneal dipole (RCD) associated with eye movement,
and for activity in bilateral temporal cortex, which includes inde-
pendent radial and tangential components. For the additional
dipole pair sources no constraint was applied other than symmetry,
the starting point for these being determined by previous solutions
indicating anterior and posterior regions, with the ocular and
temporal sources starting from their original positions from the
lower order solutions.
BESAwas the analytical approach of choice as althoughmethods
such as Low Resolution Electromagnetic Tomography (LORETA)
provide an alternative approach with different assumptions, BESA
is uniquely able to model both EEG and (extracranial) EMG sources.
LORETA solutions are also limited to cortical grey areas, and thus in
addition to misinterpreting signals from EOG or extra-ocular
muscle sources, it would fail to detect, or misinterpret signals
from sub-cortical sources such as the cerebellum or thalamus.
2.7. Statistical analysis
ANOVA were carried out on short latency amplitude measure-
ments on two recording regions of interest, using side of stimula-
tion as a factor, i.e. the infra-ocular leads IO1 and IO2, and the inion
related leads Iz, PO7 and PO8. The PO leadswere chosen as the scalp
analysis indicated that the expected short-latency effects were
maximal at these sites. As the ocular and inion related channels
showed a similarity in patterns of response, a joint analysis of the IO
and PO channels was also conducted. For the longer latency
response two regions of interest were: fronto-central leads Fpz and
FCz, and lateral fronto-central leads FC3 and FC4. The FC leads were
chosen as the N1 is maximal at these sites.
3. Results
3.1. Thresholds
VEMP thresholds (VT) were recorded in 10 healthy subjects, with
a mean (SD) threshold of 108.6 (5.2) dB and 109.5 (6.9) dB pkSPL for
left and right AC stimulation. Absolute auditory thresholds were
24.5 (3.1) dB and 26.0 (4.8) dB pkSPL for left and right AC stimu-
lation, respectively. Combined together these are equivalent to 84.1
and 83.5 dB sensation level (SL), similar values to those found
previously.
3.2. Properties of the averaged electroencephalography (EEG)
Grand means for EPs produced by supra- vs. sub-threshold
(�12 dB re. VT) intensities for left and right ear stimulation are
shown in Figs. 1 and 2 respectively (with details for selected
channels given in Fig. 3), and for left vs. right ear stimulation for
supra- and sub-threshold intensities in Figs. 4 and 5 (with details
for selected channels given in Fig. 6). As has been established for
left ear stimulation (Todd et al., 2014), the sub-threshold condition
shows a typical AEP pattern consisting of mid-latency (MLR) Na and
Pawaves followed by the long latency (LAEP) N1 and P2waves, well
illustrated in channel Cz (Fig. 5). In contrast, the supra-threshold
condition shows the expected changes in morphology. These are
characterised by the short-latency waves, which have no auditory
correlate, the OVEMP and inion related response N10 and P10
(Figs. 3A, B and 6B), and a later deflection, labelled N42/P52 fol-
lowed by the LAEP N1 and P2 (Figs. 3C, D and 6D).
Fig. 1. Grand means of evoked potentials produced by 500 Hz, 2 ms pips from left ear stimulation in 10 healthy subjects. For each electrode location the two traces show the supra-
threshold (maximal intensity) vs. sub-threshold (�12 dB re VT) conditions as black and grey traces respectively. All electrodes are referred to the auricle leads.
N.P.M. Todd et al. / Hearing Research 312 (2014) 91e102 93

3.3. Differences in the averaged EEG with ear of stimulation
As noted above, the effects of ear of stimulation are illustrated
in Figs. 4e6. The sub-threshold stimulation condition showed the
expected absence of vestibular components in the infra-ocular
and inion related leads (Fig. 5) and expected presence of AEPs
in the central leads (Fig. 6C). This condition also displayed an
asymmetry to left ear stimulation as previously described in the
literature (Hine and Debener, 2007). In contrast the supra-
threshold intensity exhibited VEMP-related responses in the
infra-ocular electrodes and inion region (Fig. 6B). Of interest, the
early wave patterns (N10/P10) in IO and PO leads appeared to be
mirroring each other especially on the contralateral side. Within
the central leads (Fig. 6D) there appeared to be a similar left ear
advantage in the central and lateral frontal waves as for the sub-
threshold case. In contrast for the VEMP-related responses
Fig. 2. Grand means of evoked potentials produced by 500 Hz, 2 ms pips from right ear stimulation in 10 healthy subjects. For each electrode location the two traces show the
supra-threshold (maximal intensity) vs. sub-threshold (�12 dB re VT) conditions as black and grey traces respectively.
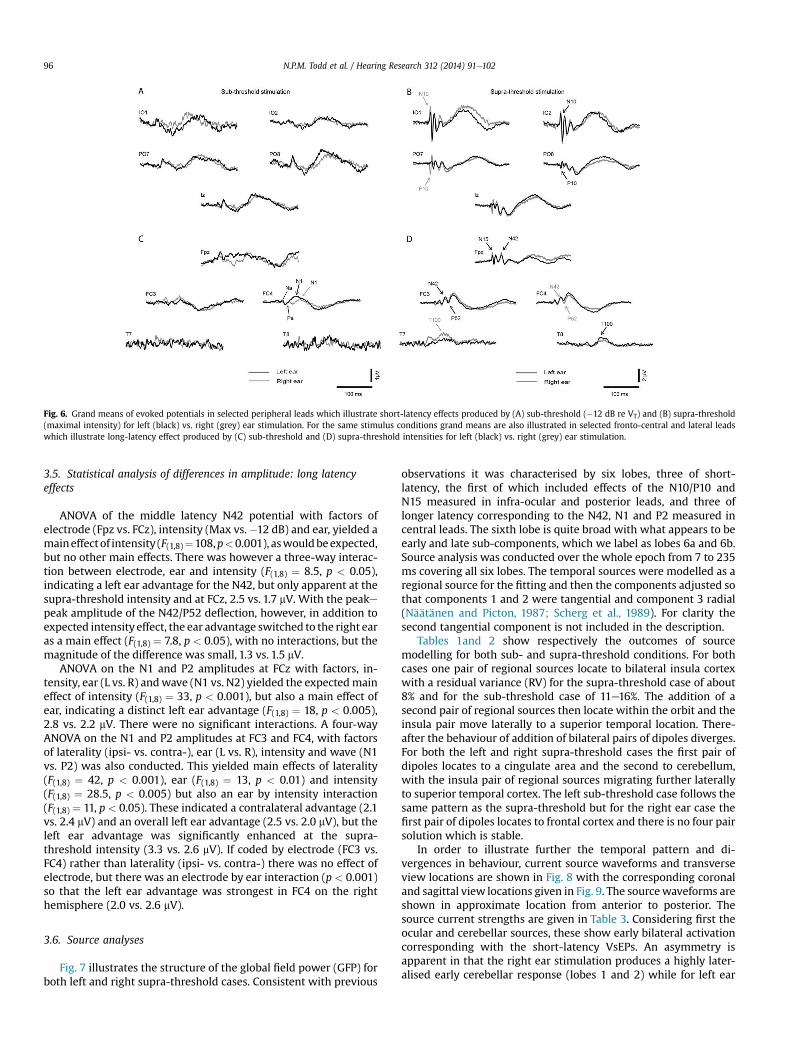
Fig. 3. Grand means of evoked potentials produced by 500 Hz, 2 ms pips in selected peripheral leads which illustrate short-latency effects from (A) left ear and (B) right ear
stimulation at supra-threshold (black) vs. sub-threshold (grey) intensities. For the same stimulus conditions grand means are also illustrated in selected fronto-central and lateral
leads which illustrate long-latency effects from (C) left and (D) right ear stimulation at supra-threshold (black) vs. sub-threshold (grey) intensities.
N.P.M. Todd et al. / Hearing Research 312 (2014) 91e10294
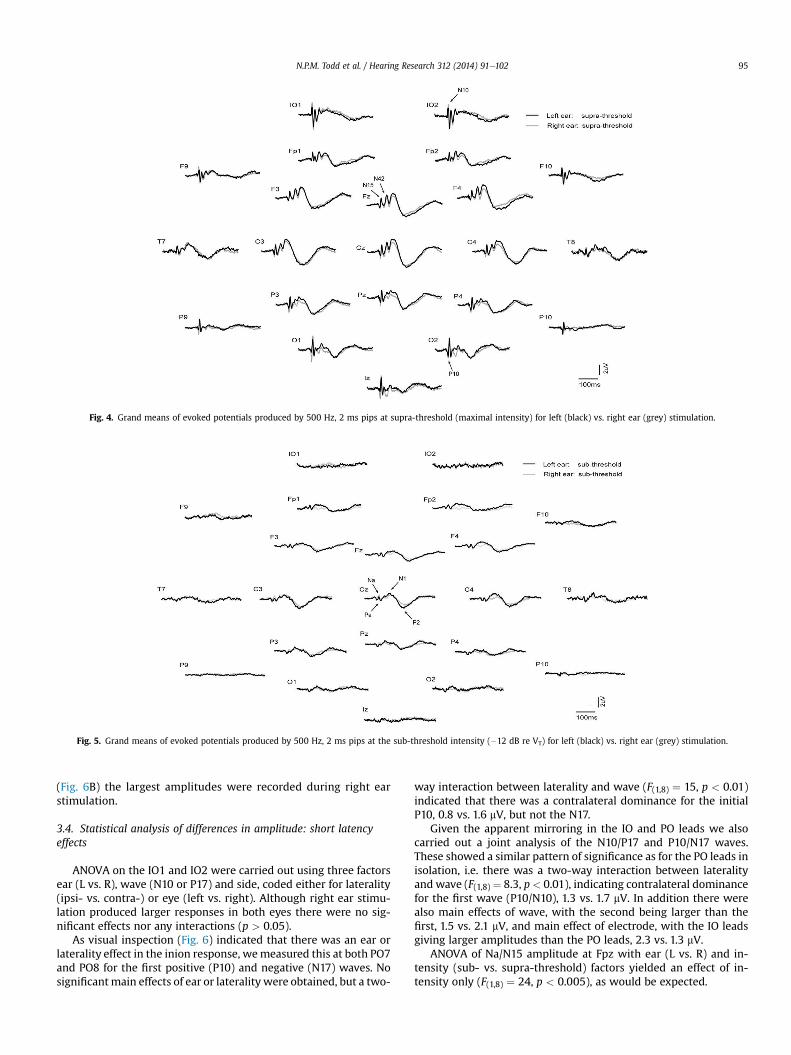
(Fig. 6B) the largest amplitudes were recorded during right ear
stimulation.
3.4. Statistical analysis of differences in amplitude: short latency
effects
ANOVA on the IO1 and IO2 were carried out using three factors
ear (L vs. R), wave (N10 or P17) and side, coded either for laterality
(ipsi- vs. contra-) or eye (left vs. right). Although right ear stimu-
lation produced larger responses in both eyes there were no sig-
nificant effects nor any interactions (p > 0.05).
As visual inspection (Fig. 6) indicated that there was an ear or
laterality effect in the inion response, wemeasured this at both PO7
and PO8 for the first positive (P10) and negative (N17) waves. No
significantmain effects of ear or laterality were obtained, but a two-
way interaction between laterality and wave (F(1,8) ¼ 15, p < 0.01)
indicated that there was a contralateral dominance for the initial
P10, 0.8 vs. 1.6 mV, but not the N17.
Given the apparent mirroring in the IO and PO leads we also
carried out a joint analysis of the N10/P17 and P10/N17 waves.
These showed a similar pattern of significance as for the PO leads in
isolation, i.e. there was a two-way interaction between laterality
and wave (F(1,8) ¼ 8.3, p< 0.01), indicating contralateral dominance
for the first wave (P10/N10), 1.3 vs. 1.7 mV. In addition there were
also main effects of wave, with the second being larger than the
first, 1.5 vs. 2.1 mV, and main effect of electrode, with the IO leads
giving larger amplitudes than the PO leads, 2.3 vs. 1.3 mV.
ANOVA of Na/N15 amplitude at Fpz with ear (L vs. R) and in-
tensity (sub- vs. supra-threshold) factors yielded an effect of in-
tensity only (F(1,8) ¼ 24, p < 0.005), as would be expected.
Fig. 4. Grand means of evoked potentials produced by 500 Hz, 2 ms pips at supra-threshold (maximal intensity) for left (black) vs. right ear (grey) stimulation.
Fig. 5. Grand means of evoked potentials produced by 500 Hz, 2 ms pips at the sub-threshold intensity (�12 dB re VT) for left (black) vs. right ear (grey) stimulation.
N.P.M. Todd et al. / Hearing Research 312 (2014) 91e102 95
3.5. Statistical analysis of differences in amplitude: long latency
effects
ANOVA of the middle latency N42 potential with factors of
electrode (Fpz vs. FCz), intensity (Max vs.�12 dB) and ear, yielded a
maineffectof intensity (F(1,8)¼108,p<0.001), aswouldbeexpected,
but no other main effects. There was however a three-way interac-
tion between electrode, ear and intensity (F(1,8) ¼ 8.5, p < 0.05),
indicating a left ear advantage for the N42, but only apparent at the
supra-threshold intensity and at FCz, 2.5 vs. 1.7 mV. With the peake
peak amplitude of the N42/P52 deflection, however, in addition to
expected intensity effect, the ear advantage switched to the right ear
as a main effect (F(1,8) ¼ 7.8, p < 0.05), with no interactions, but the
magnitude of the difference was small, 1.3 vs. 1.5 mV.
ANOVA on the N1 and P2 amplitudes at FCz with factors, in-
tensity, ear (L vs. R) andwave (N1 vs. N2) yielded the expectedmain
effect of intensity (F(1,8) ¼ 33, p < 0.001), but also a main effect of
ear, indicating a distinct left ear advantage (F(1,8) ¼ 18, p < 0.005),
2.8 vs. 2.2 mV. There were no significant interactions. A four-way
ANOVA on the N1 and P2 amplitudes at FC3 and FC4, with factors
of laterality (ipsi- vs. contra-), ear (L vs. R), intensity and wave (N1
vs. P2) was also conducted. This yielded main effects of laterality
(F(1,8) ¼ 42, p < 0.001), ear (F(1,8) ¼ 13, p < 0.01) and intensity
(F(1,8) ¼ 28.5, p < 0.005) but also an ear by intensity interaction
(F(1,8) ¼ 11, p < 0.05). These indicated a contralateral advantage (2.1
vs. 2.4 mV) and an overall left ear advantage (2.5 vs. 2.0 mV), but the
left ear advantage was significantly enhanced at the supra-
threshold intensity (3.3 vs. 2.6 mV). If coded by electrode (FC3 vs.
FC4) rather than laterality (ipsi- vs. contra-) there was no effect of
electrode, but there was an electrode by ear interaction (p < 0.001)
so that the left ear advantage was strongest in FC4 on the right
hemisphere (2.0 vs. 2.6 mV).
3.6. Source analyses
Fig. 7 illustrates the structure of the global field power (GFP) for
both left and right supra-threshold cases. Consistent with previous
observations it was characterised by six lobes, three of short-
latency, the first of which included effects of the N10/P10 and
N15 measured in infra-ocular and posterior leads, and three of
longer latency corresponding to the N42, N1 and P2 measured in
central leads. The sixth lobe is quite broad with what appears to be
early and late sub-components, which we label as lobes 6a and 6b.
Source analysis was conducted over the whole epoch from 7 to 235
ms covering all six lobes. The temporal sources were modelled as a
regional source for the fitting and then the components adjusted so
that components 1 and 2 were tangential and component 3 radial
(Näätänen and Picton, 1987; Scherg et al., 1989). For clarity the
second tangential component is not included in the description.
Tables 1and 2 show respectively the outcomes of source
modelling for both sub- and supra-threshold conditions. For both
cases one pair of regional sources locate to bilateral insula cortex
with a residual variance (RV) for the supra-threshold case of about
8% and for the sub-threshold case of 11e16%. The addition of a
second pair of regional sources then locate within the orbit and the
insula pair move laterally to a superior temporal location. There-
after the behaviour of addition of bilateral pairs of dipoles diverges.
For both the left and right supra-threshold cases the first pair of
dipoles locates to a cingulate area and the second to cerebellum,
with the insula pair of regional sources migrating further laterally
to superior temporal cortex. The left sub-threshold case follows the
same pattern as the supra-threshold but for the right ear case the
first pair of dipoles locates to frontal cortex and there is no four pair
solution which is stable.
In order to illustrate further the temporal pattern and di-
vergences in behaviour, current source waveforms and transverse
view locations are shown in Fig. 8 with the corresponding coronal
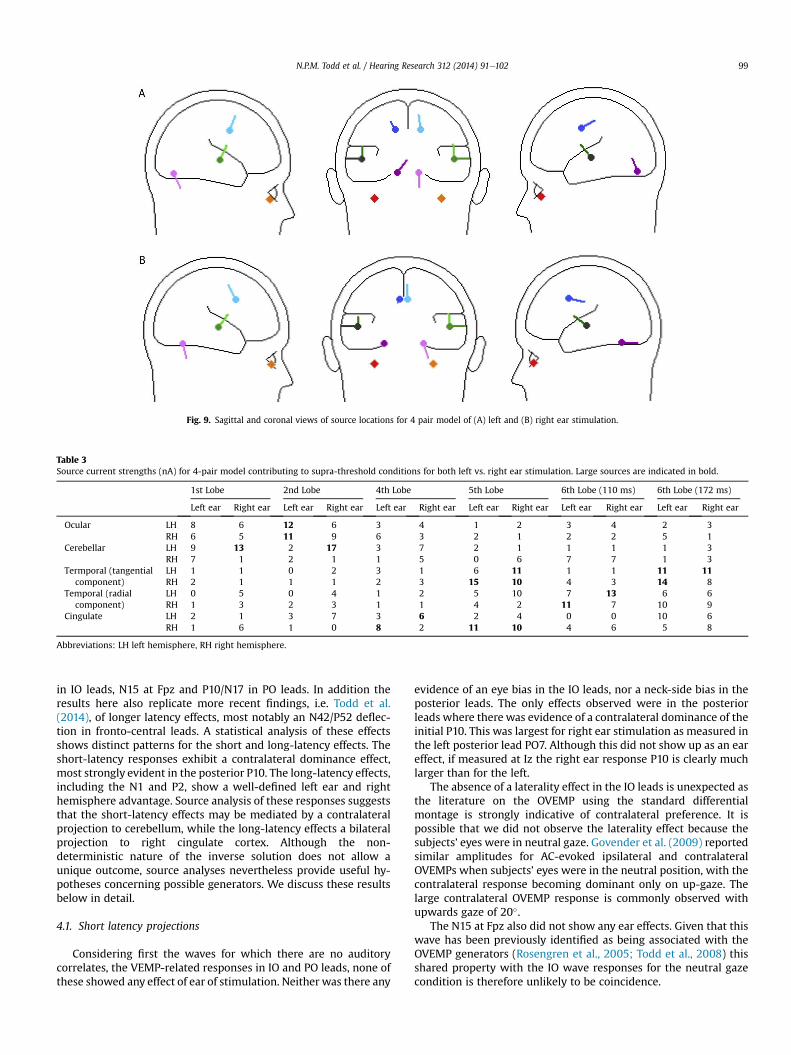
and sagittal view locations given in Fig. 9. The sourcewaveforms are
shown in approximate location from anterior to posterior. The
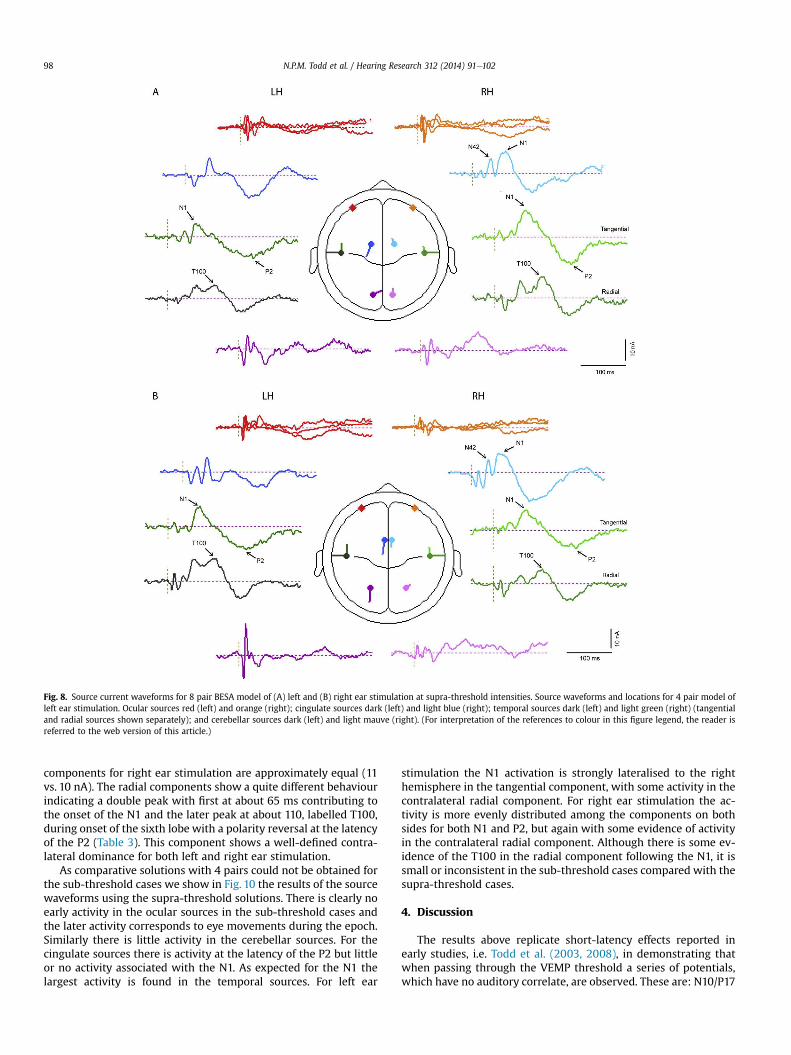
source current strengths are given in Table 3. Considering first the
ocular and cerebellar sources, these show early bilateral activation
corresponding with the short-latency VsEPs. An asymmetry is
apparent in that the right ear stimulation produces a highly later-
alised early cerebellar response (lobes 1 and 2) while for left ear
Fig. 6. Grand means of evoked potentials in selected peripheral leads which illustrate short-latency effects produced by (A) sub-threshold (�12 dB re VT) and (B) supra-threshold
(maximal intensity) for left (black) vs. right (grey) ear stimulation. For the same stimulus conditions grand means are also illustrated in selected fronto-central and lateral leads
which illustrate long-latency effect produced by (C) sub-threshold and (D) supra-threshold intensities for left (black) vs. right (grey) ear stimulation.
N.P.M. Todd et al. / Hearing Research 312 (2014) 91e10296

stimulation the cerebellar response is more bilateral (see also
Table 3). For the ocular sources the largest currents occur during the
second lobe bilaterally for left ear stimulation. The cingulate sour-
ces show activation over the whole epoch but the largest currents
occur during the later part of the epoch. For the N42 (lobe 4) the
cingulate contribution is contralateral. However, for the N1 waves
the right-hemisphere cingulate source is largest for both left and
right ear stimulation (2 vs. 11 nA for left ear and 4 vs. 10 nA for right
ear stimulation).
The last pair corresponds to the temporal cortex sources and in
this case the tangential and radial components are shown sepa-
rately. For left ear stimulation there is a well-defined asymmetry
between the ipsilateral and contralateral tangential components at
the latency of the N1 (about 74 ms) with the contralateral larger by
a factor of about 3 (6 vs. 15 nA). In contrast the tangential N1
Fig. 7. Global field power vs. FCz and IO leads for left vs. right stimulation. Lobes 1,2 and 3 correspond to the short-latency VsEPs, lobe 4 to the N42 and lobes 5 to the N1. Lobe 6
includes contributions from the T100 (indicated as 6a) and P2 (indicated as 6b).
Table 1
TTCs for 1, 2, 3 and 4 pair models (interval 7e235 ms) at max intensity.
Model RV Ear Source X Y Z Origin BA or region
1 pair 7.8 L RS1&2 �39 �15 11 Ins 13/40
7.8 R RS1&2 �36 �13 10 Ins/STG/TTG 13/41
2 pairs 3.2 L RS1&2 �39 59 �36 EOM þ RCD 13/41/22
RS3&4 �43 �18 8 Ins/STG/TTG
3.3 R RS1&2 �35 53 �32 EOM þ RCD
RS3&4 �39 �18 11 Ins/STG/TTG 13/41
3 pairs 2.4 L RS1&2 �39 58 �38 EOM þ RCD
DP1&2 �4 4 40 CG/MFG 24/32
RS3&4 �52 �18 3 STG/Ins 22/41/21/13
2.1 R RS1&2 �36 60 �36 EOM þ RCD
DP1&2 �4 �6 38 CG 24/31
RS3&4 �51 �16 4 STG/Ins 22/41/13/21
4 pairs 1.8 L RS1&2 �39 57 �38 EOM þ RCD
DP1&2 �15 �7 41 CG 24/32
RS3&4 �54 �14 3 STG/PCG 22/21/41/6
DP3&4 �12 �77 �21 Cerebellum Posterior lobe/
declive
1.5 R RS1&2 �34 61 �37 EOM þ RCD
DP1&2 �4 2 41 CG/MFG 24/32
RS3&4 �54 �14 3 STG/PCG 22/21/41/6
DP3&4 �23 �53 �25 Cerebellum Anterior lobe/
dentate
Abbreviations: Brodmann Area (BA), Cingulate Gyrus (CG), Dipole (DP), Extra Ocular
Muscles (EOM), Insula (Ins), Left (L), Medial Frontal Gyrus (MFG), Precentral Gyrus
(PCG), Retinal Corneal Dipole (RCD), Regional Source (RS), Right (R), Superior
Temporal Gyrus (STG), Transverse Temporal Gyrus (TTG), Talairach-Tournoux Co-
ordinates (TTC).
Table 2
TTCs for 1, 2, 3 and 4 pair models (interval 7e235 ms) at �12 dB re VT.
Model RV Ear Source X Y Z Origin BA or Region
1 pair 16.6 L RS1&2 �43 �19 19 Ins 13/40
11.3 R RS1&2 �40 �18 11 Ins/STG/TTG 13/41
2 pairs 4.1 L RS1&2 �33 62 �36 RCD
RS3&4 �43 �20 10 Ins/STG/TTG 13/41/22
6.1 R RS1&2 �36 63 �31 RCD
RS3&4 �47 �23 3 STG/Ins/MTG 22/13/41/22
3 pairs 3.2 L RS1&2 �34 61 �37 RCD
DP1&2 �12 �16 38 CG 24/31
RS3&4 �53 �17 5 STG/TTG 22/41/21/13
4.6 R RS1&2 �36 62 �33 RCD
DP1&2 �42 11 40 MFG/PCG 9/8/6
RS3&4 �46 �22 0 STG/Ins 22/13/21
4 pairs 2.8 L RS1&2 �33 61 �37 RCD
DP1&2 �10 �5 40 CG 24/31
RS3&4 �56 �18 1 STG/MTG 22/21/41
DP3&4 �20 �72 �19 Cerebellum Posterior
lobe/declive
e R RS1&2 e e e e e
DP1&2 e e e e e
RS3&4 e e e e e
DP3&4 e e e e e
Abbreviations: Brodmann Area (BA), Cingulate Gyrus (CG), Dipole (DP), (Ins), Left (L),
Medial Frontal Gyrus (MFG), Middle Temporal Gyrus (MTG), Precentral Gyrus (PCG),
Retinal Corneal Dipole (RCD), Regional Source (RS), Right (R), Superior Temporal
Gyrus (STG), Transverse Temporal Gyrus (TTG), Talairach-Tournoux Coordinates
(TTC).
N.P.M. Todd et al. / Hearing Research 312 (2014) 91e102 97
components for right ear stimulation are approximately equal (11
vs. 10 nA). The radial components show a quite different behaviour
indicating a double peak with first at about 65 ms contributing to
the onset of the N1 and the later peak at about 110, labelled T100,
during onset of the sixth lobe with a polarity reversal at the latency
of the P2 (Table 3). This component shows a well-defined contra-
lateral dominance for both left and right ear stimulation.
As comparative solutions with 4 pairs could not be obtained for
the sub-threshold cases we show in Fig. 10 the results of the source
waveforms using the supra-threshold solutions. There is clearly no
early activity in the ocular sources in the sub-threshold cases and
the later activity corresponds to eye movements during the epoch.
Similarly there is little activity in the cerebellar sources. For the
cingulate sources there is activity at the latency of the P2 but little
or no activity associated with the N1. As expected for the N1 the
largest activity is found in the temporal sources. For left ear
stimulation the N1 activation is strongly lateralised to the right
hemisphere in the tangential component, with some activity in the
contralateral radial component. For right ear stimulation the ac-
tivity is more evenly distributed among the components on both
sides for both N1 and P2, but again with some evidence of activity
in the contralateral radial component. Although there is some ev-
idence of the T100 in the radial component following the N1, it is
small or inconsistent in the sub-threshold cases compared with the
supra-threshold cases.
4. Discussion
The results above replicate short-latency effects reported in
early studies, i.e. Todd et al. (2003, 2008), in demonstrating that
when passing through the VEMP threshold a series of potentials,
which have no auditory correlate, are observed. These are: N10/P17
Fig. 8. Source current waveforms for 8 pair BESA model of (A) left and (B) right ear stimulation at supra-threshold intensities. Source waveforms and locations for 4 pair model of
left ear stimulation. Ocular sources red (left) and orange (right); cingulate sources dark (left) and light blue (right); temporal sources dark (left) and light green (right) (tangential
and radial sources shown separately); and cerebellar sources dark (left) and light mauve (right). (For interpretation of the references to colour in this figure legend, the reader is
referred to the web version of this article.)
N.P.M. Todd et al. / Hearing Research 312 (2014) 91e10298
in IO leads, N15 at Fpz and P10/N17 in PO leads. In addition the
results here also replicate more recent findings, i.e. Todd et al.
(2014), of longer latency effects, most notably an N42/P52 deflec-
tion in fronto-central leads. A statistical analysis of these effects
shows distinct patterns for the short and long-latency effects. The
short-latency responses exhibit a contralateral dominance effect,
most strongly evident in the posterior P10. The long-latency effects,
including the N1 and P2, show a well-defined left ear and right
hemisphere advantage. Source analysis of these responses suggests
that the short-latency effects may be mediated by a contralateral
projection to cerebellum, while the long-latency effects a bilateral
projection to right cingulate cortex. Although the non-
deterministic nature of the inverse solution does not allow a
unique outcome, source analyses nevertheless provide useful hy-
potheses concerning possible generators. We discuss these results
below in detail.
4.1. Short latency projections
Considering first the waves for which there are no auditory
correlates, the VEMP-related responses in IO and PO leads, none of
these showed any effect of ear of stimulation. Neither was there any
evidence of an eye bias in the IO leads, nor a neck-side bias in the
posterior leads. The only effects observed were in the posterior
leads where there was evidence of a contralateral dominance of the
initial P10. This was largest for right ear stimulation as measured in
the left posterior lead PO7. Although this did not show up as an ear
effect, if measured at Iz the right ear response P10 is clearly much
larger than for the left.
The absence of a laterality effect in the IO leads is unexpected as
the literature on the OVEMP using the standard differential
montage is strongly indicative of contralateral preference. It is
possible that we did not observe the laterality effect because the
subjects’ eyes were in neutral gaze. Govender et al. (2009) reported
similar amplitudes for AC-evoked ipsilateral and contralateral
OVEMPs when subjects’ eyes were in the neutral position, with the
contralateral response becoming dominant only on up-gaze. The
large contralateral OVEMP response is commonly observed with
upwards gaze of 20�.
The N15 at Fpz also did not show any ear effects. Given that this
wave has been previously identified as being associated with the
OVEMP generators (Rosengren et al., 2005; Todd et al., 2008) this
shared property with the IO wave responses for the neutral gaze
condition is therefore unlikely to be coincidence.
Fig. 9. Sagittal and coronal views of source locations for 4 pair model of (A) left and (B) right ear stimulation.
Table 3
Source current strengths (nA) for 4-pair model contributing to supra-threshold conditions for both left vs. right ear stimulation. Large sources are indicated in bold.
1st Lobe 2nd Lobe 4th Lobe 5th Lobe 6th Lobe (110 ms) 6th Lobe (172 ms)
Left ear Right ear Left ear Right ear Left ear Right ear Left ear Right ear Left ear Right ear Left ear Right ear
Ocular LH 8 6 12 6 3 4 1 2 3 4 2 3
RH 6 5 11 9 6 3 2 1 2 2 5 1
Cerebellar LH 9 13 2 17 3 7 2 1 1 1 1 3
RH 7 1 2 1 1 5 0 6 7 7 1 3
Termporal (tangential
component)
LH 1 1 0 2 3 1 6 11 1 1 11 11
RH 2 1 1 1 2 3 15 10 4 3 14 8
Temporal (radial
component)
LH 0 5 0 4 1 2 5 10 7 13 6 6
RH 1 3 2 3 1 1 4 2 11 7 10 9
Cingulate LH 2 1 3 7 3 6 2 4 0 0 10 6
RH 1 6 1 0 8 2 11 10 4 6 5 8
Abbreviations: LH left hemisphere, RH right hemisphere.
N.P.M. Todd et al. / Hearing Research 312 (2014) 91e102 99

Given the coincidence in latency of the PO contralateral
response with that of the contralateral IO waveform it is likely that
there is a relationship between these two responses, i.e. that there
is a common contralateral vestibular brain source which contrib-
utes to both. This is confirmed in the source analysis, which shows
that there is a large deep, possibly cerebellar, source co-active with
the ocular sources and with the N15. The strong asymmetry
observed for right ear stimulation provides an explanation for the
laterality effects observed and for the responses being larger with
right ear stimulation (although not significant in this case). The
appearance of a large contralateral cerebellar source is consistent
with the modelling of short-latency VsEPs by Todd et al. (2008).
4.2. Long latency projections
Turning now to the longer latency waves measured at central
locations, i.e. the N42/P52, N1 and P2, in all cases a very definite ear
preference is found. We have recently presented evidence (Todd
et al., 2014), that this waveform is generated by vestibular affer-
ents, when stimuli supra-threshold for vestibular receptors are
used. In all cases except one, the preference is for left ear over right,
the exception being the peakepeak N42/P52 measured at FCz,
where there is a right ear preference, although this is a relatively
weak effect. Given that the vestibular reflex contributions are
symmetrical with respect to ear, as noted above, then we must
assume that the ear preference is central, rather than peripheral, i.e.
it is a reflection of a central projection dominance from one side,
rather than the activation of the otolith organ from that side.
In the case of the N1 and P2 measured in lateral positions, the
ear effect interacted with intensity such that the left central-
projection dominance was only manifest at the supra-threshold
intensity. At supra-threshold intensity the left vs. right amplitude
was 3.3 vs. 2.6 mV compared with 1.6 vs. 1.4 mV at sub-threshold
intensity. Thus, the left central-projection dominance almost
certainly can be attributed to an additional vestibular effect, rather
than the previously observed auditory effect (Hine and Debener,
2007).
Of particular relevance to the above is that both N1 and P2 in the
lateral positions showed a well-defined laterality effect, so that the
left ear central-projection dominancewas a contralateral one to the
right hemisphere, and thus could be interpreted as a right hemi-
sphere dominance. Some caution is needed in making this
Fig. 10. Source waveforms and locations for 4 pair model of (A) left and (B) right ear stimulation at supra-threshold intensity applied to the sub-threshold data.
N.P.M. Todd et al. / Hearing Research 312 (2014) 91e102100

conclusion as, if coded by electrode rather than laterality, there was
no effect, i.e. overall the mean amplitude in left and right electrodes
was the same. However, there was also an interaction between ear
and electrode so that the contralaterality effect was only apparent
for the projection from left ear to right hemisphere. The above
interpretation is strengthened by the source analyses which indi-
cated that for N42, N1 and P2 waves the cingulate source contrib-
uted significantly, in addition to temporal cortex sources, and this
was clearly lateralised to right hemisphere for the N1. A vestibular
cingulate area is consistently indicated in imaging studies and in
more recent meta-analyses (Lopez and Blanke, 2011; Lopez et al.,
2012).
In the context of the previous literature our finding of evidence
for a dominant projection to the right hemisphere is consistent
with earlier studies (Dieterich et al., 2003), but it does not support
this being an ipsilateral projection, in contrast to the findings of
Schlindwein et al. (2008). This difference might be explained by the
fact that we have used an acoustic otolithic stimulus, rather than a
galvanic or caloric one which primarily activates canals. However,
more recent meta-analyses of vestibular imaging studies do not
fully support the view that vestibular cortical projections are pri-
marily ipsilateral (Lopez et al., 2012), and other electrophysiological
studies in animal models suggest a primarily contralateral projec-
tion (Ebata et al., 2004). Thus our data showing a contralateral
otolithic projection to the right hemisphere, over and above the
previously observed effect for AEPs is very plausible.
4.3. Auditory vs. vestibular projections
In healthy subjects the use of AC sound activates cochlear as well
as vestibular receptors. In the modelling process for two pairs of
regional sources similar solutions were found in all cases, strongly
implicating the dominance of auditory cortex plus a contribution
from the eyes. In the sub-threshold case the ocular contribution
might seem surprising, but given that we did not apply any addi-
tional filtering before the analysis, and that the subjects were
watching a movie to avoid alpha contamination, the presence of
ocular drift in the recordings should be expected. For right ear
stimulation there was a complete divergence in the behaviour of
the additional sources for the sub- and supra-threshold conditions,
with clear evidence of cingulate and cerebellar sources supra- but
not sub-threshold. This was not so for left ear stimulation. As noted
above though it is very likely that the VEMP threshold is an over-
estimate of the receptor threshold. McCue and Guinan (1994) found
a rate threshold in cat vestibular afferents of 90 dB SPL for 50 ms
tones, with a phase-locking threshold 10 dB lower. Combined with
the appropriate psychophysical correction for short tone bursts, e.g.
Meddis and Lecluyse (2011), this places the receptor rate threshold
at near 70 dB SL, about 12 dB below the SLs of our VEMP threshold.
It is quite possible, therefore, that wewere seeing vestibular effects
below VEMP threshold.
In carrying out an analysis of the temporal components we
observed some changes in the patterns of activation, most partic-
ularly the radial component which exhibited a distinct second peak
at about 100 ms, labelled T100. This component, although weakly
present contralaterally in sub-threshold conditions, is noticeably
more prominent and bilaterally present in the supra-threshold
conditions and suggestive of a vestibular projection to temporal
lobe, consistent with the imaging studies (Lopez et al., 2012). When
viewed directly in T7 and T8 leads, a peak at about 100 ms can be
observed (Fig. 2 c and d), but this peak is much more prominent
when an average reference is employed, hence its strong appear-
ance in the source analysis which is based on the average reference.
A vestibular radial temporal component has been suggested pre-
viously for short-latency VsEPs, which is measureable in T8
(McNerney et al., 2011). It is thus quite plausible that a vestibular
temporal lobe projection could extend to longer latencies. In the
auditory literature a late radial component has been referred to as
the “T-complex” (Hine and Debener, 2007), but T-complex studies
often use high intensity stimuli, e.g. Connolly (1993) who used AC
stimuli of 70 and 90 dB SL. It is also quite possible, therefore, that
vestibular contributions to the T-complex have been hitherto
unrecognized.
Previously we speculated that the cingulate component acti-
vated by vestibular receptors could contribute to the affective
quality of sound when above vestibular threshold (Todd et al.,
2014). However, the presence of a vestibular component in
cortical potentials from the temporal lobe, hitherto considered
purely cochlear in origin, also raises the possibility that acoustic
activation of the otolith organs could contribute to auditory
discrimination. There is now a growing literature which provides
evidence of a central vestibulareauditory interaction which allows
vestibular inputs to improve temporal and spatial aspects of hear-
ing (Emami and Daneshi, 2012; Brimijoin and Akeroyd, 2012;
Probst and Wist, 1990) and to contribute to speech perception
and in metrical aspects of musical perception (Emami et al., 2012;
Phillips-Silver and Trainor, 2008). Given the well-established
cross-over from vestibular to auditory pathways at the level of
the brainstem (e.g. Barker et al., 2012) and thalamus (Roucoux-
Hanus and Boisacq-Schepens, 1977; Blum et al., 1979), vestibular
effects at the level of temporal cortex should be expected, espe-
cially as activation of superior temporal lobe is consistently indi-
cated in vestibular imaging studies (Lopez et al., 2012).
Acknowledgements
The research reported in this article was supported by a grant
from the Wellcome Trust (WT091961MA). We wish to thank Aisha
McLean for assistance in the production of this manuscript.
References
Brimijoin, W.O., Akeroyd, M.A., 2012. The role of head movements and signal
spectrum in an auditory front/back illusion. i-Perception 3 (3), 179e182.Barker, M., Solinski, H.J., Hashimoto, H., Tagoe, T., Pilati, N., Hamann, M., 2012.
Acoustic overexposure increases the expression of VGLUT-2 mediated pro-
jections from the lateral vestibular nucleus to the dorsal cochlear nucleus. PLoSone 7 (5), e35955.
Bickford, R.G., Jacobson, J.L., Cody, D.T.R., 1964. Nature of average evoked potentialsto sound and other stimuli in man. Ann. N. Y. Acad. Sci. 112 (1), 204e218.
Blum, P.S., Day, M.J., Carpenter, M.B., Gilman, S., 1979. Thalamic components of theascending vestibular system. Exp. Neuro. 64 (3), 587e603.
Colebatch, J.G., Halmagyi, G.M., Skuse, N.F., 1994. Myogenic potentials generated by
a click-evoked vestibulocollic reflex. J. Neurol. Neurosurg. Psychiat. 57 (2), 190e197.
Connolly, J., 1993. The influence of stimulus intensity, contralateral masking andhandedness on the temporal N1 and the T complex components of the auditory
N1 wave. Electroencephalogr. Clin. Neurophysiol. 86 (1), 58e68.
de Waele, C., Baudonniere, P.M., Lepecq, J.C., Huy, P.T.B., Vidal, P.P., 2001. Vestibularprojections in the human cortex. Exp. Brain Res. 141 (4), 541e551.
Dieterich, M., Bense, S., Lutz, S., Drzezga, A., Stephan, T., Bartenstein, P., Brandt, T.,2003. Dominance for vestibular cortical function in the non-dominant hemi-
sphere. Cereb. Cortex 13 (9), 994e1007.Ebata, S., Sugiuchi, Y., Izawa, Y., Shinomiya, K., Shinoda, Y., 2004. Vestibular pro-
jection to the periarcuate cortex in the monkey. Neurosci. Res. 49 (1), 55e68.
Emami, S.F., Daneshi, A., 2012. Vestibular hearing and neural synchronization. ISRNOtolaryngol., 5. Article ID 246065.
Emami, S.F., Pourbakht, A., Sheykholeslami, K., Kamali, M., Behnoud, F., Daneshi, A.,2012. Vestibular hearing and speech processing. ISRN Otolaryngol., 7. Article ID
850629.
Govender, S., Rosengren, S.M., Colebatch, J.G., 2009. The effect of gaze direction onthe ocular vestibular evoked myogenic potential produced by air-conducted
sound. Neurophysiol. Clin. 120 (7), 1386e1391.Hine, J., Debener, S., 2007. Late auditory evoked potentials asymmetry revisited.
Neurophysiol. Clin. 118 (6), 1274e1285.Janzen, J., Schlindwein, P., Bense, S., Bauermann, T., Vucurevic, G., Stoeter, P.,
Dieterich, M., 2008. Neural correlates of hemispheric dominance and ipsila-
terality within the vestibular system. Neuroimage 42 (4), 1508e1518.
N.P.M. Todd et al. / Hearing Research 312 (2014) 91e102 101

Lopez, C., Blanke, O., 2011. The thalamocortical vestibular system in animals and
humans. Brain Res. Rev. 67 (1), 119e146.Lopez, C., Blanke, O., Mast, F.W., 2012. The human vestibular cortex revealed by
coordinate-based activation likelihood estimation meta-analysis. Neuroscience212, 159e179.
McCue, M.P., Guinan, J.J., 1994. Acoustically responsive fibres in the vestibular nerve
of the cat. J. Neurosci. 14, 6058e6070.McNerney, K.M., Lockwood, A.H., Coad, M.L., Wack, D.S., Buckard, R.F., 2011. Use of
64-channel electroencephalography to study neural otolith-evoked responses.J. Am. Acad. Audiol. 22 (3), 143e155.
Meddis, R., Lecluyse, W., 2011. The psychophysics of absolute threshold and signalduration: a probabilistic approach. J. Acoust. Soc. Am. 129, 3153e3165.
Näätänen, R., Picton, T., 1987. The N1 wave of the human electric and magnetic
response to sound e a review and analysis of the component structure. Psy-chophysiol 24 (4), 375e425.
Phillips-Silver, J., Trainor, L.J., 2008. Vestibular influence on auditory metricalinterpretation. Brain Cogn. 67 (1), 94e102.
Probst, T., Wist, E.R., 1990. Electrophysiological evidence for visual e vestibular
interaction in man. Neurosci. Lett. 108 (3), 255e260.Rosengren, S.M., Colebatch, J.G., 2006. Vestibular evoked potentials (VsEPs) in pa-
tients with severe to profound bilateral hearing loss. Neurophysiol. Clin. 117 (5),1145e1153.
Rosengren, S.M., Todd, N.P.M., Colebatch, J.G., 2005. Vestibular-evoked extraocular
potentials produced by stimulation with bone-conducted sound. Neurophysiol.Clin. 116 (8), 1938e1948.
Roucoux-Hanus, M., Boisacq-Schepens, N., 1977. Ascending vestibular projections efurther results at cortical and thalamic levels in cat. Exp. Brain Res. 29 (2), 283e
292.
Scherg, M., Vajsar, J., Picton, T.W., 1989. A source analysis of the late human auditoryevoked potentials. J. Cogn. Neurosci. 1 (4), 336e355.
Schlindwein, P., Mueller, M., Brandt, T., Stoeter, P., Dieterich, M., 2008. Corticalrepresentation of saccular vestibular stimulation: VEMPs in fMRI. Neuroimage
39 (1), 19e31.Todd, N.P.M., Rosengren, S.M., Colebatch, J.G., 2003. A short latency vestibular
evoked potential (VsEP) produced by bone-conducted acoustic stimulation.
J. Acoust. Soc. Am. 114 (6), 3264e3272.Todd, N.P.M., Rosengren, S.M., Aw, S.T., Colebatch, J.G., 2007. Ocular vestibular
evoked myogenic potentials (OVEMPs) produced by air- and bone-conductedsound. Neurophysiol. Clin. 118 (2), 381e390.
Todd, N.P.M., Rosengren, S.M., Colebatch, J.G., 2008. A source analysis of short-
latency vestibular evoked potentials produced by air- and bone-conductedsound. Neurophysiol. Clin. 119 (8), 1881e1894.
Todd, N.P.M., Paillard, A.C., Kluk, K., Whittle, E., Colebatch, J.G., 2014. Vestibular re-ceptors contribute to the cortical auditoryevokedpotentials. HearRes. 309, 63e74.
N.P.M. Todd et al. / Hearing Research 312 (2014) 91e102102


![Nymphalis KLUK [1780] sensu lato · 2013. 2. 14. · The names proposed for taxa in the genus Nymphalis KLUK [1780] sensu lato Anglewing Butterflies Papiliones angulati. compiled](https://img.pdfslide.us/doc/110x75/61190bf0fafe5823d92ad33c/nymphalis-kluk-1780-sensu-lato-2013-2-14-the-names-proposed-for-taxa-in-the.jpg)


![Nymphalis KLUK [1780] sensu lato · 2013-02-14 · The names proposed for taxa in the genus Nymphalis KLUK [1780] sensu lato Anglewing Butterflies Papiliones angulati. compiled by](https://img.pdfslide.us/doc/110x75/5e604db63ae8eb558e521700/nymphalis-kluk-1780-sensu-2013-02-14-the-names-proposed-for-taxa-in-the-genus.jpg)