Embed Size (px)
Citation preview
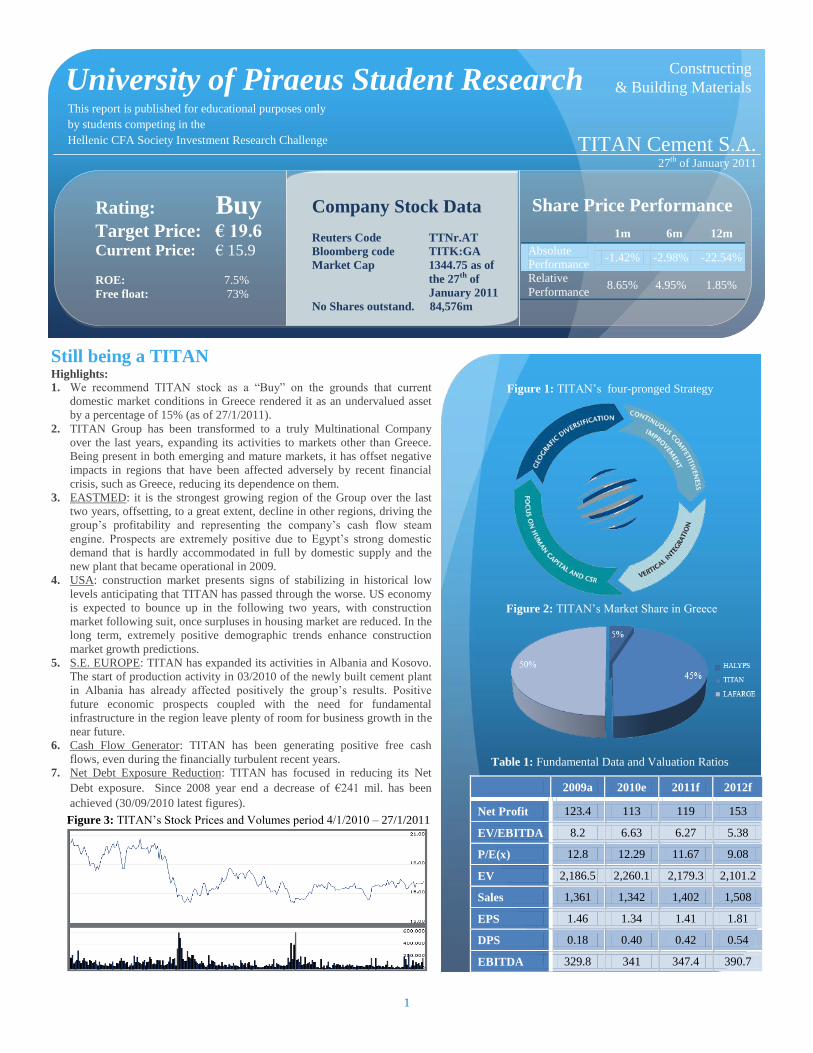
Figure 3: TITAN‟s Stock Prices and Volumes period 4/1/2010 – 27/1/2011
Figure 2: TITAN‟s Market Share in Greece
Table 1: Fundamental Data and Valuation Ratios
Highlights:
1. We recommend TITAN stock as a “Buy” on the grounds that current
domestic market conditions in Greece rendered it as an undervalued asset
by a percentage of 15% (as of 27/1/2011). 2. TITAN Group has been transformed to a truly Multinational Company
over the last years, expanding its activities to markets other than Greece.
Being present in both emerging and mature markets, it has offset negative
impacts in regions that have been affected adversely by recent financial
crisis, such as Greece, reducing its dependence on them. 3. EASTMED: it is the strongest growing region of the Group over the last
two years, offsetting, to a great extent, decline in other regions, driving the
group‟s profitability and representing the company‟s cash flow steam
engine. Prospects are extremely positive due to Egypt‟s strong domestic
demand that is hardly accommodated in full by domestic supply and the
new plant that became operational in 2009. 4. USA: construction market presents signs of stabilizing in historical low
levels anticipating that TITAN has passed through the worse. US economy
is expected to bounce up in the following two years, with construction
market following suit, once surpluses in housing market are reduced. In the
long term, extremely positive demographic trends enhance construction
market growth predictions. 5. S.E. EUROPE: TITAN has expanded its activities in Albania and Kosovo.
The start of production activity in 03/2010 of the newly built cement plant
in Albania has already affected positively the group‟s results. Positive
future economic prospects coupled with the need for fundamental
infrastructure in the region leave plenty of room for business growth in the
near future.
6. Cash Flow Generator: TITAN has been generating positive free cash
flows, even during the financially turbulent recent years. 7. Net Debt Exposure Reduction: TITAN has focused in reducing its Net
Debt exposure. Since 2008 year end a decrease of €241 mil. has been
achieved (30/09/2010 latest figures).
Still being a TITAN
University of Piraeus Student Research
This report is published for educational purposes only
by students competing in the
Hellenic CFA Society Investment Research Challenge
TITAN Cement S.A.
27th of January 2011
TITAN Cement S.A.
January 2011
Company Stock Data
Reuters Code TTNr.AT
Bloomberg code TITK:GA
Market Cap 1344.75 as of
the 27th of
January 2011
No Shares outstand. 84,576m
1m 6m 12m
Absolute
Performance -1.42% -2.98% -22.54%
Relative
Performance 8.65% 4.95% 1.85%
Rating: Buy
Target Price: € 19.6 Current Price: € 15.9
ROE: 7.5%
Free float: 73%
Constructing
& Building Materials
Share Price Performance
Share Price Performance
Figure 1: TITAN‟s four-pronged Strategy
2009a 2010e 2011f 2012f
Net Profit 123.4 113 119 153
EV/EBITDA 8.2 6.63 6.27 5.38
P/E(x) 12.8 12.29 11.67 9.08
EV 2,186.5 2,260.1 2,179.3 2,101.2
Sales 1,361 1,342 1,402 1,508
EPS 1.46 1.34 1.41 1.81
DPS 0.18 0.40 0.42 0.54
EBITDA 329.8 341 347.4 390.7
1
University of Piraeus Investment Research Challenge Student Research 27/1/2011
2
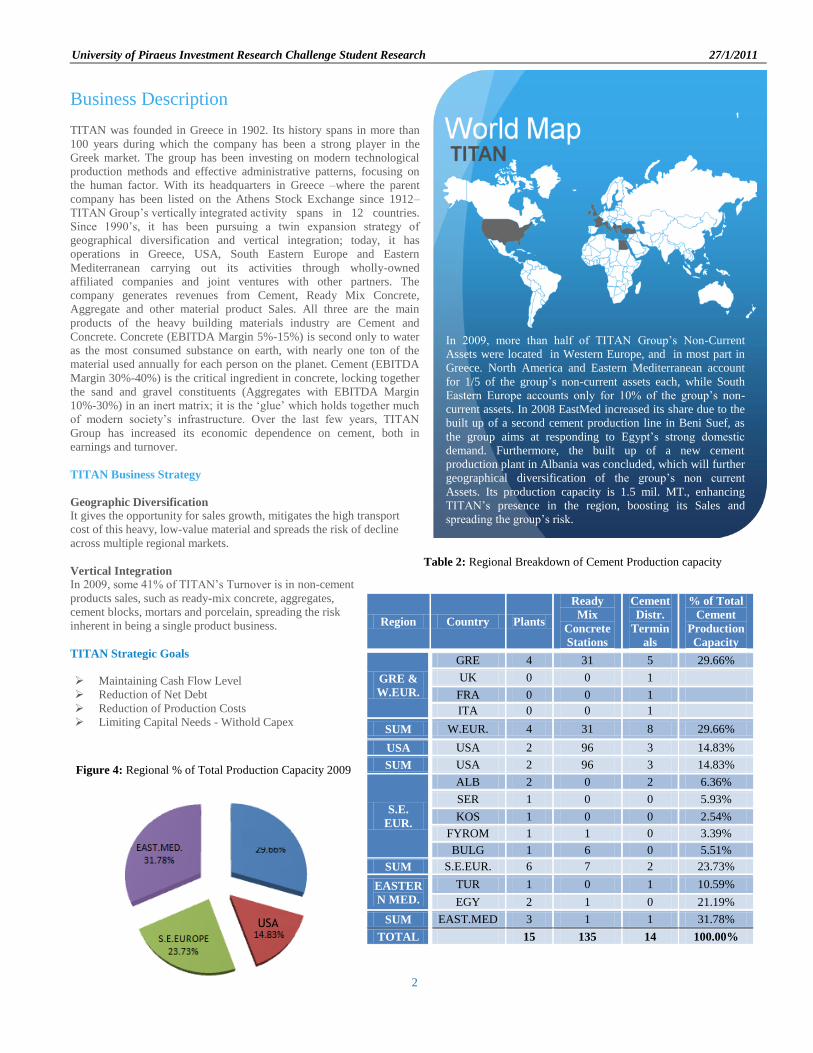
Business Description
TITAN was founded in Greece in 1902. Its history spans in more than
100 years during which the company has been a strong player in the
Greek market. The group has been investing on modern technological
production methods and effective administrative patterns, focusing on
the human factor. With its headquarters in Greece –where the parent
company has been listed on the Athens Stock Exchange since 1912–
TITAN Group‟s vertically integrated ac tivity spans in 12 countries.
Since 1990‟s, it has been pursuing a twin expansion strategy of
geographical diversification and vertical integration; today, it has
operations in Greece, USA, South Eastern Europe and Eastern
Mediterranean carrying out its activities through wholly-owned
affiliated companies and joint ventures with other partners. The
company generates revenues from Cement, Ready Mix Concrete,
Aggregate and other material product Sales. All three are the main
products of the heavy building materials industry are Cement and
Concrete. Concrete (EBITDA Margin 5%-15%) is second only to water
as the most consumed substance on earth, with nearly one ton of the
material used annually for each person on the planet. Cement (EBITDA
Margin 30%-40%) is the critical ingredient in concrete, locking together
the sand and gravel constituents (Aggregates with EBITDA Margin
10%-30%) in an inert matrix; it is the „glue‟ which holds together much
of modern society‟s infrastructure. Over the last few years, TITAN
Group has increased its economic dependence on cement, both in
earnings and turnover.
TITAN Business Strategy
Geographic Diversification
It gives the opportunity for sales growth, mitigates the high transport
cost of this heavy, low-value material and spreads the risk of decline
across multiple regional markets.
Vertical Integration
In 2009, some 41% of TITAN‟s Turnover is in non-cement
products sales, such as ready-mix concrete, aggregates,
cement blocks, mortars and porcelain, spreading the risk
inherent in being a single product business.
TITAN Strategic Goals
Maintaining Cash Flow Level
Reduction of Net Debt
Reduction of Production Costs
Limiting Capital Needs - Withold Capex
Region Country Plants
Ready
Mix
Concrete
Stations
Cement
Distr.
Termin
als
% of Total
Cement
Production
Capacity
GRE &
W.EUR.
GRE 4 31 5 29.66%
UK 0 0 1
FRA 0 0 1
ITA 0 0 1
SUM W.EUR. 4 31 8 29.66%
USA USA 2 96 3 14.83%
SUM USA 2 96 3 14.83%
S.E.
EUR.
ALB 2 0 2 6.36%
SER 1 0 0 5.93%
KOS 1 0 0 2.54%
FYROM 1 1 0 3.39%
BULG 1 6 0 5.51%
SUM S.E.EUR. 6 7 2 23.73%
EASTER
N MED.
TUR 1 0 1 10.59%
EGY 2 1 0 21.19%
SUM EAST.MED 3 1 1 31.78%
TOTAL 15 135 14 100.00%
Figure 4: Regional % of Total Production Capacity 2009
Table 2: Regional Breakdown of Cement Production capacity
USA
In 2009, more than half of TITAN Group‟s Non-Current
Assets were located in Western Europe, and in most part in
Greece. North America and Eastern Mediterranean account
for 1/5 of the group‟s non-current assets each, while South
Eastern Europe accounts only for 10% of the group‟s non-
current assets. In 2008 EastMed increased its share due to the
built up of a second cement production line in Beni Suef, as
the group aims at responding to Egypt‟s strong domestic
demand. Furthermore, the built up of a new cement
production plant in Albania was concluded, which will further
geographical diversification of the group‟s non current
Assets. Its production capacity is 1.5 mil. MT., enhancing
TITAN‟s presence in the region, boosting its Sales and
spreading the group‟s risk.
In 2009, more than half of TITAN Group‟s Non-Current
Assets were located in Western Europe, and in most part in
Greece. North America and Eastern Mediterranean account
for 1/5 of the group‟s non-current assets each, while South
Eastern Europe accounts only for 10% of the group‟s non-
current assets. In 2008 we note a significant increase in
Eastern Mediterranean‟s share due to the built up of a second
cement production line in Beni Suef, as the group aims at
responding to Egypt‟s strong domestic demand. Furthermore,
the built up of a new cement production plant in Albania was
concluded, which will rise the share of South Eastern Europe
in the group‟s non current Assets. Its production capacity is
1.5 mil. MT., enhancing TITAN‟s presence in the region and
boosting its Sales.
2
University of Piraeus Investment Research Challenge Student Research 27/1/2011
3
Industry Overview and Competitive
Positioning
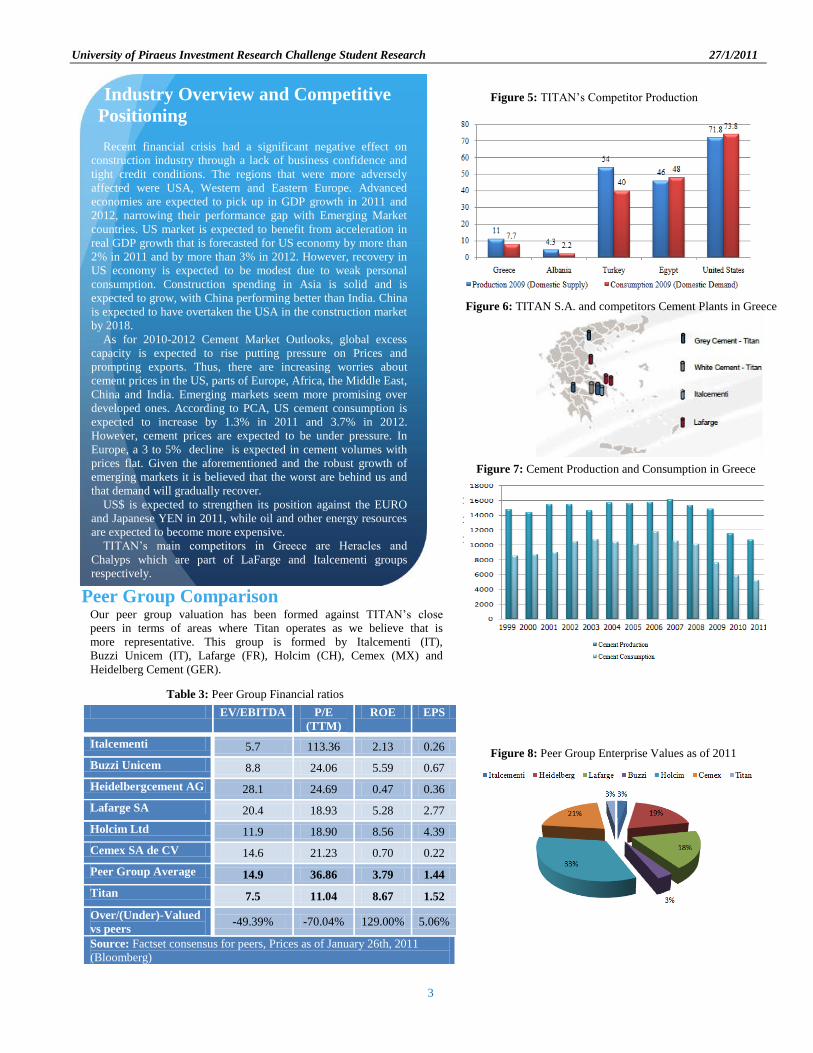
Recent financial crisis had a significant negative effect on
construction industry through a lack of business confidence and
tight credit conditions. The regions that were more adversely
affected were USA, Western and Eastern Europe. Advanced
economies are expected to pick up in GDP growth in 2011 and
2012, narrowing their performance gap with Emerging Market
countries. US market is expected to benefit from acceleration in
real GDP growth that is forecasted for US economy by more than
2% in 2011 and by more than 3% in 2012. However, recovery in
US economy is expected to be modest due to weak personal
consumption. Construction spending in Asia is solid and is
expected to grow, with China performing better than India. China
is expected to have overtaken the USA in the construction market
by 2018.
As for 2010-2012 Cement Market Outlooks, global excess
capacity is expected to rise putting pressure on Prices and
prompting exports. Thus, there are increasing worries about
cement prices in the US, parts of Europe, Africa, the Middle East,
China and India. Emerging markets seem more promising over
developed ones. According to PCA, US cement consumption is
expected to increase by 1.3% in 2011 and 3.7% in 2012.
However, cement prices are expected to be under pressure. In
Europe, a 3 to 5% decline is expected in cement volumes with
prices flat. Given the aforementioned and the robust growth of
emerging markets it is believed that the worst are behind us and
that demand will gradually recover.
US$ is expected to strengthen its position against the EURO
and Japanese YEN in 2011, while oil and other energy resources
are expected to become more expensive.
TITAN‟s main competitors in Greece are Heracles and
Chalyps which are part of LaFarge and Italcementi groups
respectively.
Our peer group valuation has been formed against TITAN‟s close
peers in terms of areas where Titan operates as we believe that is
more representative. This group is formed by Italcementi (IT),
Buzzi Unicem (IT), Lafarge (FR), Holcim (CH), Cemex (MX) and
Heidelberg Cement (GER).
EV/EBITDA P/E
(TTM)
ROE EPS
Italcementi 5.7 113.36 2.13 0.26
Buzzi Unicem 8.8 24.06 5.59 0.67
Heidelbergcement AG 28.1 24.69 0.47 0.36
Lafarge SA 20.4 18.93 5.28 2.77
Holcim Ltd 11.9 18.90 8.56 4.39
Cemex SA de CV 14.6 21.23 0.70 0.22
Peer Group Average 14.9 36.86 3.79 1.44
Titan 7.5 11.04 8.67 1.52
Over/(Under)-Valued
vs peers -49.39% -70.04% 129.00% 5.06%
Source: Factset consensus for peers, Prices as of January 26th, 2011
(Bloomberg)
Figure 5: TITAN‟s Competitor Production plants in Greece
Figure 5
Figure 8: Peer Group Enterprise Values as of 2011
Table 3: Peer Group Financial ratios
Peer Group Comparison
Figure 6: TITAN S.A. and competitors Cement Plants in Greece
plants in Greece
Figure 7: Cement Production and Consumption in Greece
plants in Greece
3
University of Piraeus Investment Research Challenge Student Research 27/1/2011
4
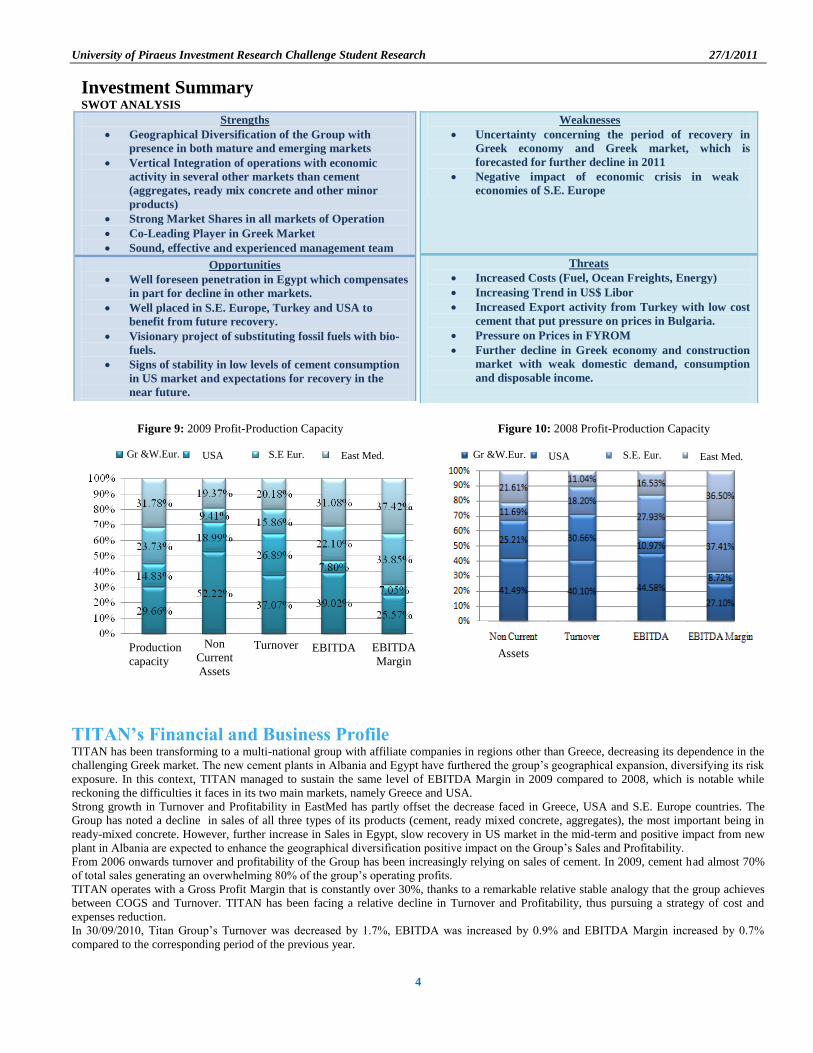
TITAN’s Financial and Business Profile TITAN has been transforming to a multi-national group with affiliate companies in regions other than Greece, decreasing its dependence in the
challenging Greek market. The new cement plants in Albania and Egypt have furthered the group‟s geographical expansion, diversifying its risk
exposure. In this context, TITAN managed to sustain the same level of EBITDA Margin in 2009 compared to 2008, which is notable while
reckoning the difficulties it faces in its two main markets, namely Greece and USA.
Strong growth in Turnover and Profitability in EastMed has partly offset the decrease faced in Greece, USA and S.E. Europe countries. The
Group has noted a decline in sales of all three types of its products (cement, ready mixed concrete, aggregates), the most important being in
ready-mixed concrete. However, further increase in Sales in Egypt, slow recovery in US market in the mid-term and positive impact from new
plant in Albania are expected to enhance the geographical diversification positive impact on the Group‟s Sales and Profitability.
From 2006 onwards turnover and profitability of the Group has been increasingly relying on sales of cement. In 2009, cement had almost 70%
of total sales generating an overwhelming 80% of the group‟s operating profits.
TITAN operates with a Gross Profit Margin that is constantly over 30%, thanks to a remarkable relative stable analogy that the group achieves
between COGS and Turnover. TITAN has been facing a relative decline in Turnover and Profitability, thus pursuing a strategy of cost and
expenses reduction.
In 30/09/2010, Titan Group‟s Turnover was decreased by 1.7%, EBITDA was increased by 0.9% and EBITDA Margin increased by 0.7%
compared to the corresponding period of the previous year.
Investment Summary SWOT ANALYSIS
Strengths
Geographical Diversification of the Group with
presence in both mature and emerging markets
Vertical Integration of operations with economic
activity in several other markets than cement
(aggregates, ready mix concrete and other minor
products)
Strong Market Shares in all markets of Operation
Co-Leading Player in Greek Market
Sound, effective and experienced management team
Opportunities
Well foreseen penetration in Egypt which compensates
in part for decline in other markets.
Well placed in S.E. Europe, Turkey and USA to
benefit from future recovery.
Visionary project of substituting fossil fuels with bio-
fuels.
Signs of stability in low levels of cement consumption
in US market and expectations for recovery in the
near future.
Figure 9: 2009 Profit-Production Capacity
Figure 10: 2008 Profit-Production Capacity
Assets
Production
capacity
Non
Current
Assets
Turnover EBITDA EBITDA
Margin
Greece Greece USA USA S.E Eur. Eur.Euro
pe
S.E. Eur. East Med. East Med.
Weaknesses
Uncertainty concerning the period of recovery in
Greek economy and Greek market, which is
forecasted for further decline in 2011
Negative impact of economic crisis in weak
economies of S.E. Europe
Threats
Increased Costs (Fuel, Ocean Freights, Energy)
Increasing Trend in US$ Libor
Increased Export activity from Turkey with low cost
cement that put pressure on prices in Bulgaria.
Pressure on Prices in FYROM
Further decline in Greek economy and construction
market with weak domestic demand, consumption
and disposable income.
Gr &W.Eur. Gr &W.Eur.
University of Piraeus Investment Research Challenge Student Research 27/1/2011
5
Table 5: Debt Structure
2009 % 2008 % 2007 % 2006 %
Short Term
Loans 261,835 26.51% 263,145 21.78% 146,405 19.89% 139,045 29.90%
Long Term
Loans 725,665 73.49% 945,193 78.22% 589,833 80.11% 326,040 70.10%
Total Loans 987,500 100.00% 1,208,338 100.00% 736,238 100.00% 465,085 100.00%
Table 6: Debt Maturity (excluding leasing)
Table 4: Net Debt / EBITDA
2010
Q3
2010
Q2
2010
Q1 2009 2008 2007 2006
Net Debt /
EBITDA 2.94 2.93 1.33 0.68
Net Debt
(mil. €) 873 917 988 971 1,114 569 327
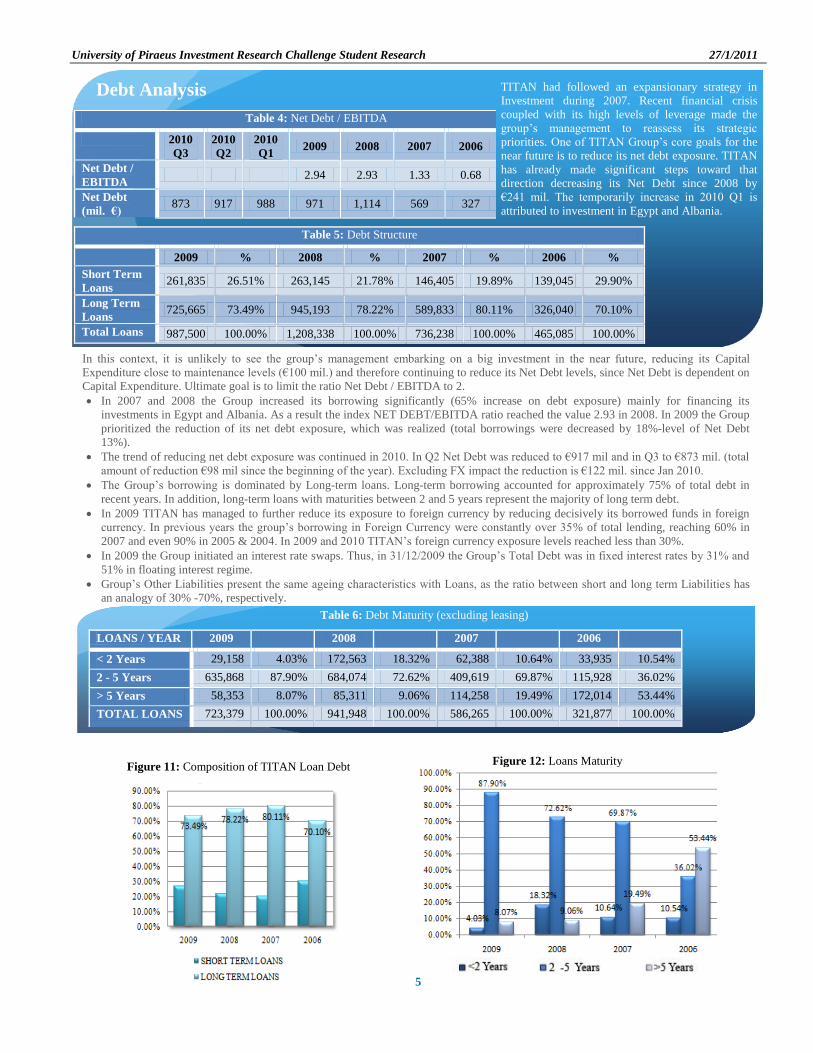
Debt Analysis
In this context, it is unlikely to see the group‟s management embarking on a big investment in the near future, reducing its Capital
Expenditure close to maintenance levels (€100 mil.) and therefore continuing to reduce its Net Debt levels, since Net Debt is dependent on
Capital Expenditure. Ultimate goal is to limit the ratio Net Debt / EBITDA to 2.
In 2007 and 2008 the Group increased its borrowing significantly (65% increase on debt exposure) mainly for financing its
investments in Egypt and Albania. As a result the index NET DEBT/EBITDA ratio reached the value 2.93 in 2008. In 2009 the Group
prioritized the reduction of its net debt exposure, which was realized (total borrowings were decreased by 18%-level of Net Debt
13%).
The trend of reducing net debt exposure was continued in 2010. In Q2 Net Debt was reduced to €917 mil and in Q3 to €873 mil. (total
amount of reduction €98 mil since the beginning of the year). Excluding FX impact the reduction is €122 mil. since Jan 2010.
The Group‟s borrowing is dominated by Long-term loans. Long-term borrowing accounted for approximately 75% of total debt in
recent years. In addition, long-term loans with maturities between 2 and 5 years represent the majority of long term debt.
In 2009 TITAN has managed to further reduce its exposure to foreign currency by reducing decisively its borrowed funds in foreign
currency. In previous years the group‟s borrowing in Foreign Currency were constantly over 35% of total lending, reaching 60% in
2007 and even 90% in 2005 & 2004. In 2009 and 2010 TITAN‟s foreign currency exposure levels reached less than 30%.
In 2009 the Group initiated an interest rate swaps. Thus, in 31/12/2009 the Group‟s Total Debt was in fixed interest rates by 31% and
51% in floating interest regime.
Group‟s Other Liabilities present the same ageing characteristics with Loans, as the ratio between short and long term Liabilities has
an analogy of 30% -70%, respectively.
LOANS / YEAR 2009 2008 2007 2006
< 2 Years 29,158 4.03% 172,563 18.32% 62,388 10.64% 33,935 10.54%
2 - 5 Years 635,868 87.90% 684,074 72.62% 409,619 69.87% 115,928 36.02%
> 5 Years 58,353 8.07% 85,311 9.06% 114,258 19.49% 172,014 53.44%
TOTAL LOANS 723,379 100.00% 941,948 100.00% 586,265 100.00% 321,877 100.00%
TITAN had followed an expansionary strategy in
Investment during 2007. Recent financial crisis
coupled with its high levels of leverage made the
group‟s management to reassess its strategic
priorities. One of TITAN Group‟s core goals for the
near future is to reduce its net debt exposure. TITAN
has already made significant steps toward that
direction decreasing its Net Debt since 2008 by
€241 mil. The temporarily increase in 2010 Q1 is
attributed to investment in Egypt and Albania.
Figure 11: Composition of TITAN Loan Debt
Figure 12: Loans Maturity

University of Piraeus Investment Research Challenge Student Research 27/1/2011
6
WACC 9,0%
PV of Cash Flows 1,168.250
Residual Value 1,388.655
Firm Value 2,556.905
Less: Net Debt end 2010E 876.472
Less: Minority rights 20,830
Equity Value 1,659.603
Number of shares (in million) 84,576
Per share Year End 2011 19.6
Assumptions for Constant Growth Period
13 - '20
Expected growth in EBIT 4.0%
Return on capital 14.6%
Reinvestment rate 27.4%
(In mill except
stock price and
ratio)
Explicit
Estimates
Terminal
Value
2011 2012 2013 2014 2015 2016 2017 2018 2019 2020
Risk Free rate 6.5% 6.5% 6.5% 6.5% 6.5% 6.5% 6.5% 6.5% 6.5% 6.5%
Risk premium 3.5% 3.5% 3.5% 3.5% 3.5% 3.5% 3.5% 3.5% 3.5% 3.5%
Market return 10.1% 10.1% 10.1% 10.1% 10.1% 10.1% 10.1% 10.1% 10.1% 10.1%
Beta 0.97 0.97 0.97 0.97 0.97 0.97 0.97 0.97 0.97 0.97
Rate on Debt 7.4% 7.4% 7.4% 7.4% 7.4% 7.4% 7.4% 7.4% 7.4% 7.4%
Debt/(Debt+Market
Value) 38.0% 38.0% 38.0% 38.0% 38.0% 38.0% 38.0% 38.0% 38.0% 38.0%
Ke=Rf+B(Rm-Rf) 10.0% 10.0% 10.0% 10.0% 10.0% 10,0% 10,0% 10,0% 10.0% 10.0%
WACC= 9.0% 9.0% 9.0% 9.0% 9.0% 9.0% 9.0% 9.0% 9.0% 9.0%
Discounting Factor 0.92 0.84 0.77 0.71 0.65 0.60 0.55 0.50 0.46 0.42
EBIT 225.301 267.994 278.714 289.862 301.457 313.515 326.056 339.098 352.662 366.768 381.439
Less: Tax 39.026 50.179 63.937 66.494 69.154 71.920 74.797 77.789 80.901 84.137 87.502
After tax EBIT 186.275 217.815 214.777 223.368 232.303 241.595 251.258 261.309 271.761 282.632 293.937
Less: Working
Capital additions 12.772 43.584 45.327 47.140 49.026 50.987 53.027 55.148 57.354 59.648 0.000
Plus: depreciation 122.100 122.711 127.619 132.724 138.033 143.554 149.296 155.268 161.479 167.938 0.000
Less: Cap ex 105.280 95.320 85.190 88.598 92.142 95.827 99.660 103.647 107.793 112.104 0.000
Free Cash Flow 190.323 201.621 155.979 162.218 168.707 175.455 182.473 189.772 197.363 205.258 293.937
Discounted Free
Cash Flows 174.660 169.801 120.551 115.056 109.810 104.804 100.026 95.466 91.114 86.960
We calculate our target price through the DCF Valuation method. Our
WACC assumption is 9%. We forecasted cash flows up to 2012 and by
considering a growth rate of 4% up to 2020 we structure the rest Cash
Flows. The risk free rate was calculated considering a weighted average
of the 10-year government bonds in the countries in which TITAN has
presence. A Risk Premium of 3.5% is assumed, based on the „sales per
region‟ used as a weighted factor multiplied by spreads of treasury bonds
(using the German T-bond as a basis) in the areas where TITAN S.A
operates. Our beta is calculated considering data provided by the Athens
Stock Exchange (where Titan S.A. is listed).
Our DCF Model
Valuation DCF Valuation Model
University of Piraeus Investment Research Challenge Student Research 27/1/2011
7
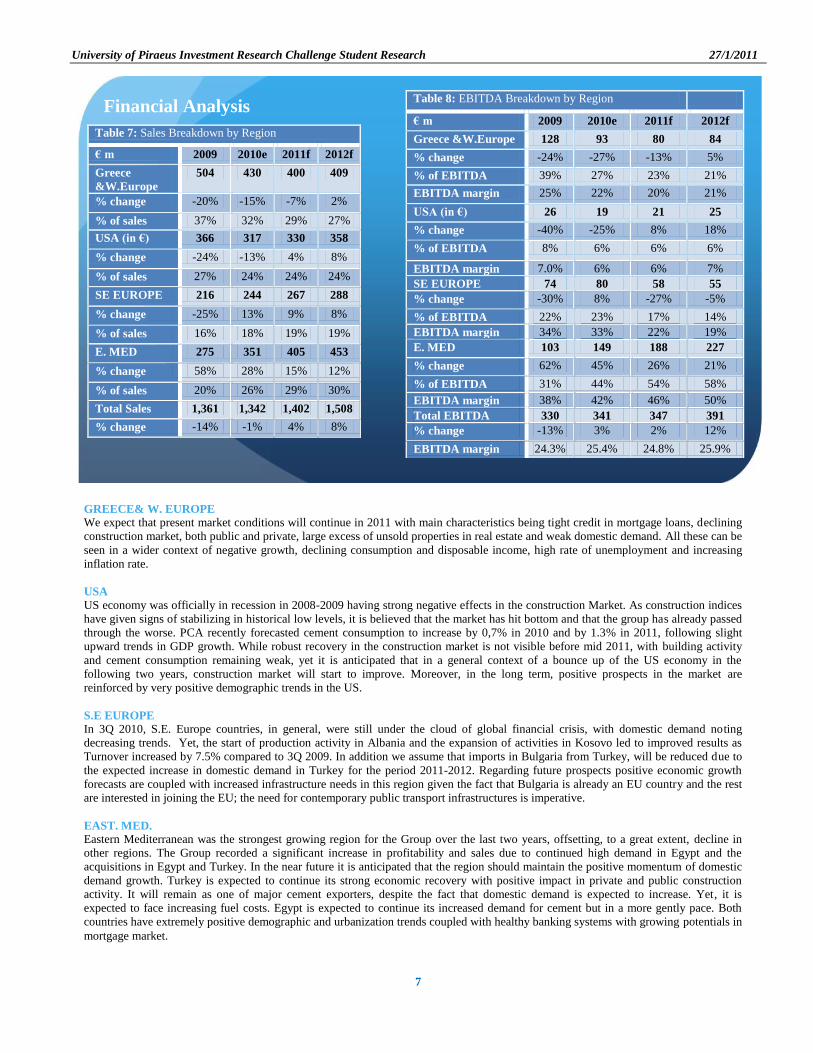
Table 7: Sales Breakdown by Region
€ m 2009 2010e 2011f 2012f
Greece
&W.Europe
504 430 400 409
% change -20% -15% -7% 2%
% of sales 37% 32% 29% 27%
USA (in €) 366 317 330 358
% change -24% -13% 4% 8%
% of sales 27% 24% 24% 24%
SE EUROPE 216 244 267 288
% change -25% 13% 9% 8%
% of sales 16% 18% 19% 19%
E. MED 275 351 405 453
% change 58% 28% 15% 12%
% of sales 20% 26% 29% 30%
Total Sales 1,361 1,342 1,402 1,508
% change -14% -1% 4% 8%
Titan 6.63 11.042 8.674 1.517
Over/(Under)-Valued vs peers -25.14% -70.04% 129.00% 5.06%
Source: Factset consensus for peers, Prices as at January 20, 2011
Table 8: EBITDA Breakdown by Region
€ m 2009 2010e 2011f 2012f
Greece &W.Europe 128 93 80 84
% change -24% -27% -13% 5%
% of EBITDA 39% 27% 23% 21%
EBITDA margin 25% 22% 20% 21%
USA (in €) 26 19 21 25
% change -40% -25% 8% 18%
% of EBITDA 8% 6% 6% 6%
EBITDA margin 7.0% 6% 6% 7%
SE EUROPE 74 80 58 55
% change -30% 8% -27% -5%
% of EBITDA 22% 23% 17% 14%
EBITDA margin 34% 33% 22% 19%
E. MED 103 149 188 227
% change 62% 45% 26% 21%
% of EBITDA 31% 44% 54% 58%
EBITDA margin 38% 42% 46% 50%
Total EBITDA 330 341 347 391
% change -13% 3% 2% 12%
EBITDA margin 24.3% 25.4% 24.8% 25.9%
Financial Analysis
GREECE& W. EUROPE
We expect that present market conditions will continue in 2011 with main characteristics being tight credit in mortgage loans, declining
construction market, both public and private, large excess of unsold properties in real estate and weak domestic demand. All these can be
seen in a wider context of negative growth, declining consumption and disposable income, high rate of unemployment and increasing
inflation rate.
USA
US economy was officially in recession in 2008-2009 having strong negative effects in the construction Market. As construction indices
have given signs of stabilizing in historical low levels, it is believed that the market has hit bottom and that the group has already passed
through the worse. PCA recently forecasted cement consumption to increase by 0,7% in 2010 and by 1.3% in 2011, following slight
upward trends in GDP growth. While robust recovery in the construction market is not visible before mid 2011, with building activity
and cement consumption remaining weak, yet it is anticipated that in a general context of a bounce up of the US economy in the
following two years, construction market will start to improve. Moreover, in the long term, positive prospects in the market are
reinforced by very positive demographic trends in the US.
S.E EUROPE
In 3Q 2010, S.E. Europe countries, in general, were still under the cloud of global financial crisis, with domestic demand noting
decreasing trends. Yet, the start of production activity in Albania and the expansion of activities in Kosovo led to improved results as
Turnover increased by 7.5% compared to 3Q 2009. In addition we assume that imports in Bulgaria from Turkey, will be reduced due to
the expected increase in domestic demand in Turkey for the period 2011-2012. Regarding future prospects positive economic growth
forecasts are coupled with increased infrastructure needs in this region given the fact that Bulgaria is already an EU country and the rest
are interested in joining the EU; the need for contemporary public transport infrastructures is imperative.
EAST. MED.
Eastern Mediterranean was the strongest growing region for the Group over the last two years, offsetting, to a great extent, decline in
other regions. The Group recorded a significant increase in profitability and sales due to continued high demand in Egypt and the
acquisitions in Egypt and Turkey. In the near future it is anticipated that the region should maintain the positive momentum of domestic
demand growth. Turkey is expected to continue its strong economic recovery with positive impact in private and public construction
activity. It will remain as one of major cement exporters, despite the fact that domestic demand is expected to increase. Yet, it is
expected to face increasing fuel costs. Egypt is expected to continue its increased demand for cement but in a more gently pace. Both
countries have extremely positive demographic and urbanization trends coupled with healthy banking systems with growing potentials in
mortgage market.

University of Piraeus Investment Research Challenge Student Research 27/1/2011
8
Table 9: Balance Sheet 2009 2010E 2011F 2012F
Net fixed assets 1,915 1,916 1,919 1,942
Current Assets 510 548 573 637
Cash & cash equivalent 16 55 58 62
TOTAL ASSETS 3,006 3,045 3,073 3,160
Net debt position 970 876 791 713
Shareholders' equity 1,449 1,576 1,661 1,779
Non Current liabilities 1,019 1,079 995 910
Long-term Debt 726 792 708 623
Current liabilities 527 364 378 416
Liabilities to banks 262 139 142 153
TOTAL EQUITY & LIABILITIES 3,006 3,045 3,073 3,160
Balance Sheet (In mill except stock rice and ratio)
Table 10: Cash Flow (Cf) Statement 2009 2010E 2011F 2012F
Pre-tax profits 158 166 171 220
Gross cash flow 322 291 307 352
Operating Cash Flow 417 261 294 308
Free Cash Flow 332 139 169 162
Chng in Cash Position -78 39 2 4
Cash Position 16 55 58 62
Cash Flow (CF) Statement (In mill except stock rice and ratio)
Table 11: Profit & Loss (P&L) Items 2009 2010E 2011F 2012F
Sales 1,361 1,342 1,402 1,508
Total gross profit 485 494 507 563
EBITDA 330 341 347 391
Operating profit (EBIT) 217 219 225 268
Pre-tax profit 158 166 171 220
Profit after tax 123 113 119 153
Dividends 36 34 36 46
Profit & Loss (P&L) Items (In mill except stock rice and ratio)
Table 12: Ratio Analysis 2009 2010E 2011F 2012F
Liquidity: Current ratio 0.97 1.51 1.52 1.53
Acid Test 0.94 1.35 1.36 1.38
Activity: Avg receivables to turnover days 76 67 63 64
Avg trade creditors to purchases days 101 92 83 84
Avg inventories to turnover days 107 101 104 104
Cash Conversion Cycle 82 76 83 85
Financial Structure: Liabilities to equity 0.86 0.73 0.65 0.58
Bank debt to equity 0.68 0.59 0.51 0.44
Net debt / EBITDA 2.94 2.56 2.28 1.82
Profitability: return on total assets 4.0% 3.7% 3.9% 4.9%
return on equity 8.7% 7.5% 7.4% 8.9%
return on invested capital 6.9% 6.6% 6.9% 8.1%
Reinvestment rate -72.82% 18.66% 9.02% 32.39%
Sustainable growth in EBIT -5.01% 1.23% 0.62% 2.62%
Actual growth in EBIT -19.67% 0.91% 2.72% 18.95%
Return on capital 14.89% 13.69% 13.25% 14.61%

University of Piraeus Investment Research Challenge Student Research 27/1/2011
9
Risk Assessment
WACC
19,6 -1,0% -0,5% 0,0% 0,5% 1,0% 1,5% 2,0% 2,5% 3,0% 3,5% 4,0% 4,5% 5,0% 5,5%
7,0% 22,8 23,4 24,0 24,7 25,3 26,0 26,7 27,4 28,2 28,9 29,7 30,6 31,4 32,3
7,5% 20,7 21,2 21,7 22,3 22,8 23,4 24,0 24,7 25,3 26,0 26,6 27,3 28,1 28,8
8,0% 18,8 19,2 19,7 20,2 20,7 21,2 21,7 22,2 22,8 23,4 23,9 24,5 25,2 25,8
8,5% 17,1 17,5 17,9 18,3 18,7 19,2 19,6 20,1 20,6 21,1 21,6 22,1 22,6 23,2
9,0% 15,6 15,9 16,3 16,7 17,0 17,4 17,8 18,2 18,6 19,1 19,5 19,9 20,4 20,9
9,5% 14,3 14,6 14,9 15,2 15,5 15,8 16,2 16,5 16,9 17,3 17,6 18,0 18,4 18,9
10,0% 13,1 13,3 13,6 13,9 14,1 14,4 14,7 15,0 15,3 15,7 16,0 16,3 16,7 17,0
10,5% 12,0 12,2 12,4 12,7 12,9 13,2 13,4 13,7 13,9 14,2 14,5 14,8 15,1 15,4
11,0% 11,0 11,2 11,4 11,6 11,8 12,0 12,2 12,5 12,7 12,9 13,2 13,4 13,7 13,9
11,5% 10,1 10,2 10,4 10,6 10,8 11,0 11,1 11,3 11,5 11,7 11,9 12,2 12,4 12,6
12,0% 9,2 9,4 9,5 9,7 9,8 10,0 10,2 10,3 10,5 10,7 10,8 11,0 11,2 11,4
12,5% 8,4 8,6 8,7 8,8 9,0 9,1 9,3 9,4 9,5 9,7 9,8 10,0 10,1 10,3
13,0% 7,7 7,8 8,0 8,1 8,2 8,3 8,4 8,5 8,7 8,8 8,9 9,0 9,2 9,3
13,5% 7,1 7,2 7,3 7,4 7,5 7,6 7,7 7,8 7,9 8,0 8,1 8,2 8,3 8,4
14,0% 6,5 6,5 6,6 6,7 6,8 6,9 6,9 7,0 7,1 7,2 7,3 7,4 7,4 7,5
14,5% 5,9 6,0 6,0 6,1 6,2 6,2 6,3 6,4 6,4 6,5 6,6 6,6 6,7 6,8
15,0% 5,3 5,4 5,5 5,5 5,6 5,6 5,7 5,7 5,8 5,8 5,9 5,9 6,0 6,0
Expected growth in EBIT
Risk
Risk Assessment
Figure 13: Probability density diagram of Titan share price
The outline of the risk assessment analysis provides support that the estimated price of 19.6 is indeed in the range of acceptable range of
confidence.
The diagram below defines the probability density of Titan‟s share according to Mode Carlo simulation with input parameter the expected
annual growth rate on EBIT from 2013 up to 2020. Based on our initial forecast of a 4% EBIT growth and assuming an annual volatility of
1.5% the target price of Titan‟s share is by 95% within the range of €18.8 and €20.5. …………………………
The current stock price is 15,9 which is less than the lower limit of the probability density diagram. This justifies our BUY
recommendation as we expect the value of Titans share to increase and stabilized within the 95% confident interval of the probability
diagram.
The outcome of the risk assessment analysis provide support for the estimated price of the 19.6 is within the range of acceptable range of
confidence.
Table 13: Titan share price according to various WACC and Expected growth in EBIT combinations
University of Piraeus Investment Research Challenge Student Research 27/1/2011
10
Risk Analysis
Our risk analysis can be affected by the following unexpected risks:
POLITICAL:
Recent developments in the Arab world, such as in Egypt where civil unrest broke out, creating a volatile political environment in the
group‟s strongest growing market.
Turkey‟s peculiar domestic political environment with the long-standing clash of the military versus the political power, always
comprises a factor of unpredictable developments in the region of Eastern Mediterranean.
GEOPOLITICAL:
TITAN‟s presence in the Balkan region is subjected to the risk of unforeseeable developments in respect to the Kosovo issue
ENVIROMNENTAL:
The Group keeps CO2 trade rights reserves in order to comply with future legislation and have the ability to trade in Climate Exchanges
whenever is necessary. …………………………………………………………………………………………………………………..
MACROECONOMIC:
One of the most important cost factors is energy. The inflation in energy prices, the increase of the fuel cost and freight rates could affect
the operational function of the Group. Mm mmmmmmmmmmmmmmmmmmmmmmmmmmmmmmmmmmmmmmmmmmmm
Greek inflation rate that exceeds the Euroarea average figure, increased public debt and deficits in trade balance and balance of payments,
all comprise a very challenging macroeconomic environment for TITAN's base country.……………………………………………
An essential part of the analysis is the risk assessment section. That allows us a range of confidence of the static estimated share price.
FX:
The recent rally of EURO seems to go for an end, because of the positive announcement of the US GDP. This number reminds that the US
economy seems to retreat from the recent financial crisis and has an upside trend for the coming years. The debt problems of the peripheral
countries in EUROPE seems to weigh the euro in the near future, causing the single currency to level such as EURUSD=1.11.
CREDIT RISK:
Possible risk could be generated by lack of liquidity, rise of interest rates, transaction exposures and increase of outstanding accounts
receivables due to global slowdown.
University of Piraeus Investment Research Challenge Student Research 27/1/2011
11
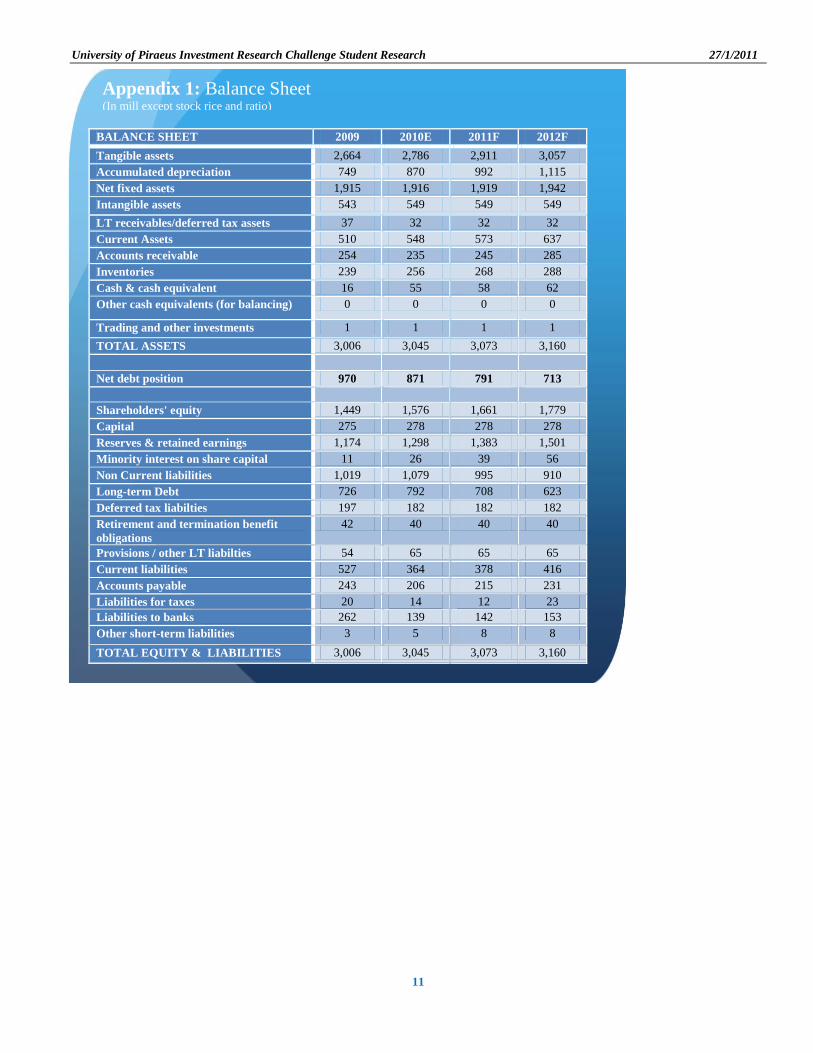
BALANCE SHEET 2009 2010E 2011F 2012F
Tangible assets 2,664 2,786 2,911 3,057
Accumulated depreciation 749 870 992 1,115
Net fixed assets 1,915 1,916 1,919 1,942
Intangible assets 543 549 549 549
LT receivables/deferred tax assets 37 32 32 32
Current Assets 510 548 573 637
Accounts receivable 254 235 245 285
Inventories 239 256 268 288
Cash & cash equivalent 16 55 58 62
Other cash equivalents (for balancing) 0 0 0 0
Trading and other investments 1 1 1 1
TOTAL ASSETS 3,006 3,045 3,073 3,160
Net debt position 970 871 791 713
Shareholders' equity 1,449 1,576 1,661 1,779
Capital 275 278 278 278
Reserves & retained earnings 1,174 1,298 1,383 1,501
Minority interest on share capital 11 26 39 56
Non Current liabilities 1,019 1,079 995 910
Long-term Debt 726 792 708 623
Deferred tax liabilties 197 182 182 182
Retirement and termination benefit
obligations
42 40 40 40
Provisions / other LT liabilties 54 65 65 65
Current liabilities 527 364 378 416
Accounts payable 243 206 215 231
Liabilities for taxes 20 14 12 23
Liabilities to banks 262 139 142 153
Other short-term liabilities 3 5 8 8
TOTAL EQUITY & LIABILITIES 3,006 3,045 3,073 3,160
Appendix 1: Balance Sheet (In mill except stock rice and ratio)
University of Piraeus Investment Research Challenge Student Research 27/1/2011
12
Table 13
2009 2010E 2011F 2012F
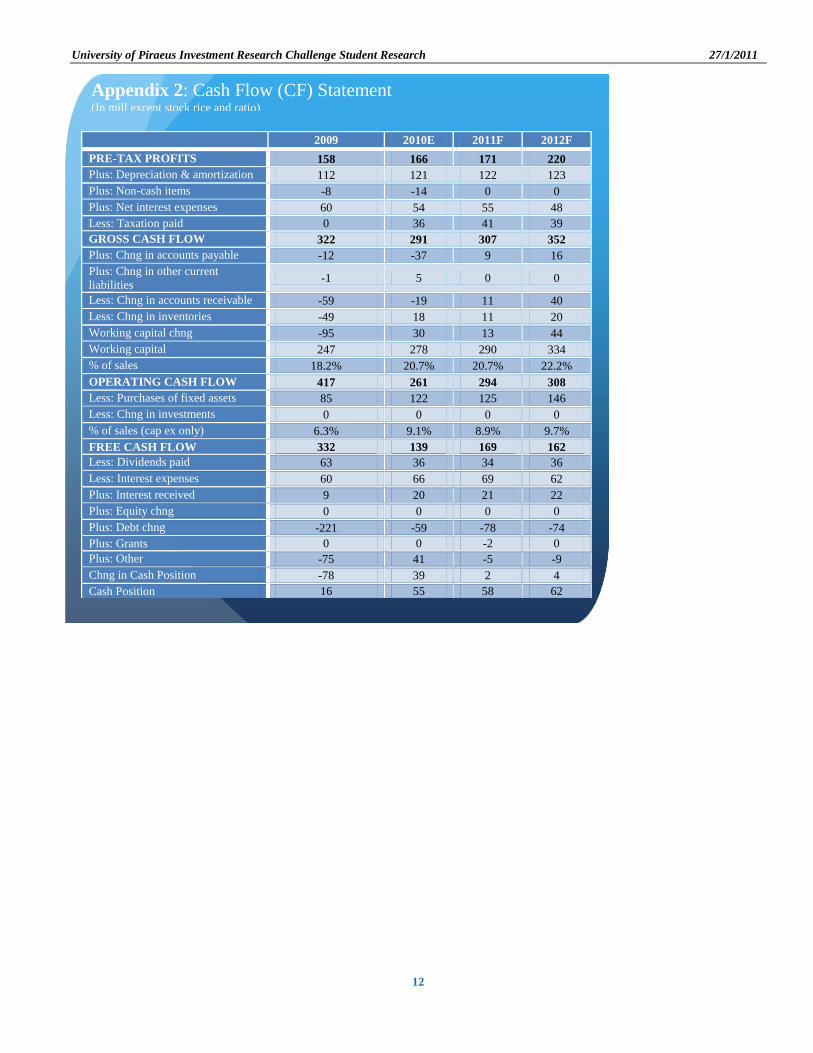
PRE-TAX PROFITS 158 166 171 220
Plus: Depreciation & amortization 112 121 122 123
Plus: Non-cash items -8 -14 0 0
Plus: Net interest expenses 60 54 55 48
Less: Taxation paid 0 36 41 39
GROSS CASH FLOW 322 291 307 352
Plus: Chng in accounts payable -12 -37 9 16
Plus: Chng in other current
liabilities -1 5 0 0
Less: Chng in accounts receivable -59 -19 11 40
Less: Chng in inventories -49 18 11 20
Working capital chng -95 30 13 44
Working capital 247 278 290 334
% of sales 18.2% 20.7% 20.7% 22.2%
OPERATING CASH FLOW 417 261 294 308
Less: Purchases of fixed assets 85 122 125 146
Less: Chng in investments 0 0 0 0
% of sales (cap ex only) 6.3% 9.1% 8.9% 9.7%
FREE CASH FLOW 332 139 169 162
Less: Dividends paid 63 36 34 36
Less: Interest expenses 60 66 69 62
Plus: Interest received 9 20 21 22
Plus: Equity chng 0 0 0 0
Plus: Debt chng -221 -59 -78 -74
Plus: Grants 0 0 -2 0
Plus: Other -75 41 -5 -9
Chng in Cash Position -78 39 2 4
Cash Position 16 55 58 62
Appendix 2: Cash Flow (CF) Statement (In mill except stock rice and ratio)
University of Piraeus Investment Research Challenge Student Research 27/1/2011
13
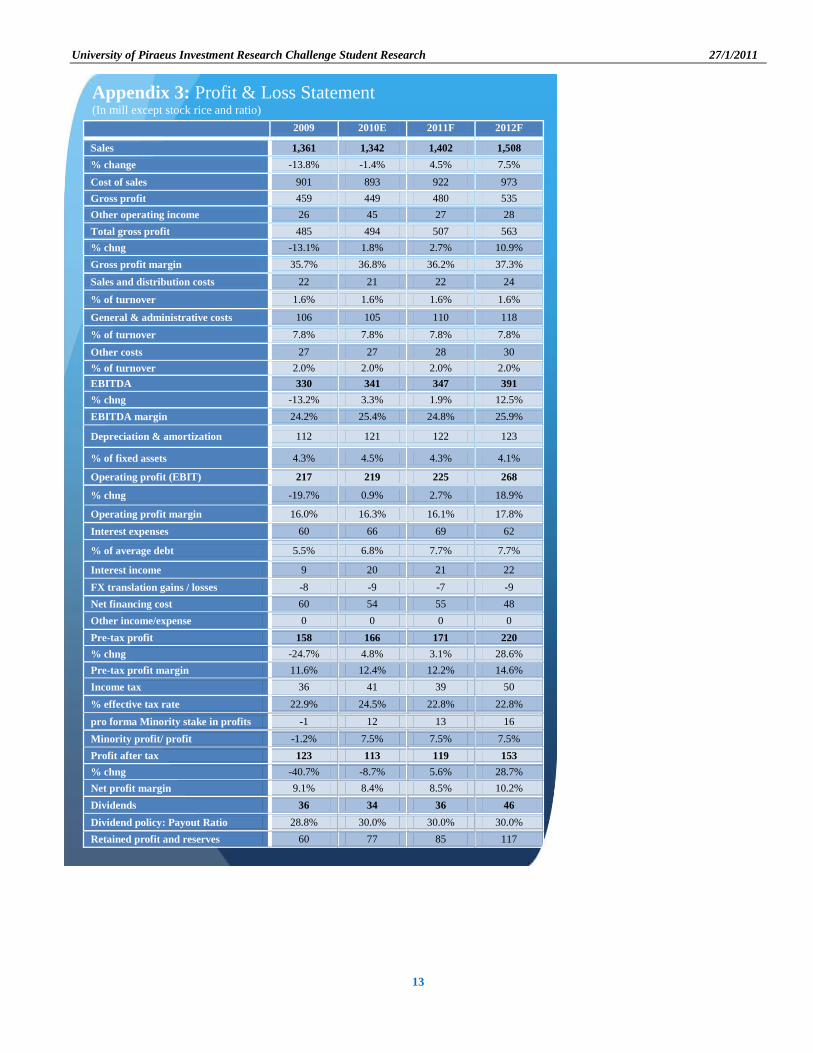
Appendix 3: Profit & Loss Statement (In mill except stock rice and ratio)
2009 2010E 2011F 2012F
Sales 1,361 1,342 1,402 1,508
% change -13.8% -1.4% 4.5% 7.5%
Cost of sales 901 893 922 973
Gross profit 459 449 480 535
Other operating income 26 45 27 28
Total gross profit 485 494 507 563
% chng -13.1% 1.8% 2.7% 10.9%
Gross profit margin 35.7% 36.8% 36.2% 37.3%
Sales and distribution costs 22 21 22 24
% of turnover 1.6% 1.6% 1.6% 1.6%
General & administrative costs 106 105 110 118
% of turnover 7.8% 7.8% 7.8% 7.8%
Other costs 27 27 28 30
% of turnover 2.0% 2.0% 2.0% 2.0%
EBITDA 330 341 347 391
% chng -13.2% 3.3% 1.9% 12.5%
EBITDA margin 24.2% 25.4% 24.8% 25.9%
Depreciation & amortization 112 121 122 123
% of fixed assets 4.3% 4.5% 4.3% 4.1%
Operating profit (EBIT) 217 219 225 268
% chng -19.7% 0.9% 2.7% 18.9%
Operating profit margin 16.0% 16.3% 16.1% 17.8%
Interest expenses 60 66 69 62
% of average debt 5.5% 6.8% 7.7% 7.7%
Interest income 9 20 21 22
FX translation gains / losses -8 -9 -7 -9
Net financing cost 60 54 55 48
Other income/expense 0 0 0 0
Pre-tax profit 158 166 171 220
% chng -24.7% 4.8% 3.1% 28.6%
Pre-tax profit margin 11.6% 12.4% 12.2% 14.6%
Income tax 36 41 39 50
% effective tax rate 22.9% 24.5% 22.8% 22.8%
pro forma Minority stake in profits -1 12 13 16
Minority profit/ profit -1.2% 7.5% 7.5% 7.5%
Profit after tax 123 113 119 153
% chng -40.7% -8.7% 5.6% 28.7%
Net profit margin 9.1% 8.4% 8.5% 10.2%
Dividends 36 34 36 46
Dividend policy: Payout Ratio 28.8% 30.0% 30.0% 30.0%
Retained profit and reserves 60 77 85 117
University of Piraeus Investment Research Challenge Student Research 27/1/2011
14
[Type a quote from the document or the summary of an interesting point. You can position the text box anywhere in the document. Use the Text Box Tools tab to change the formatting of the pull quote text box.]
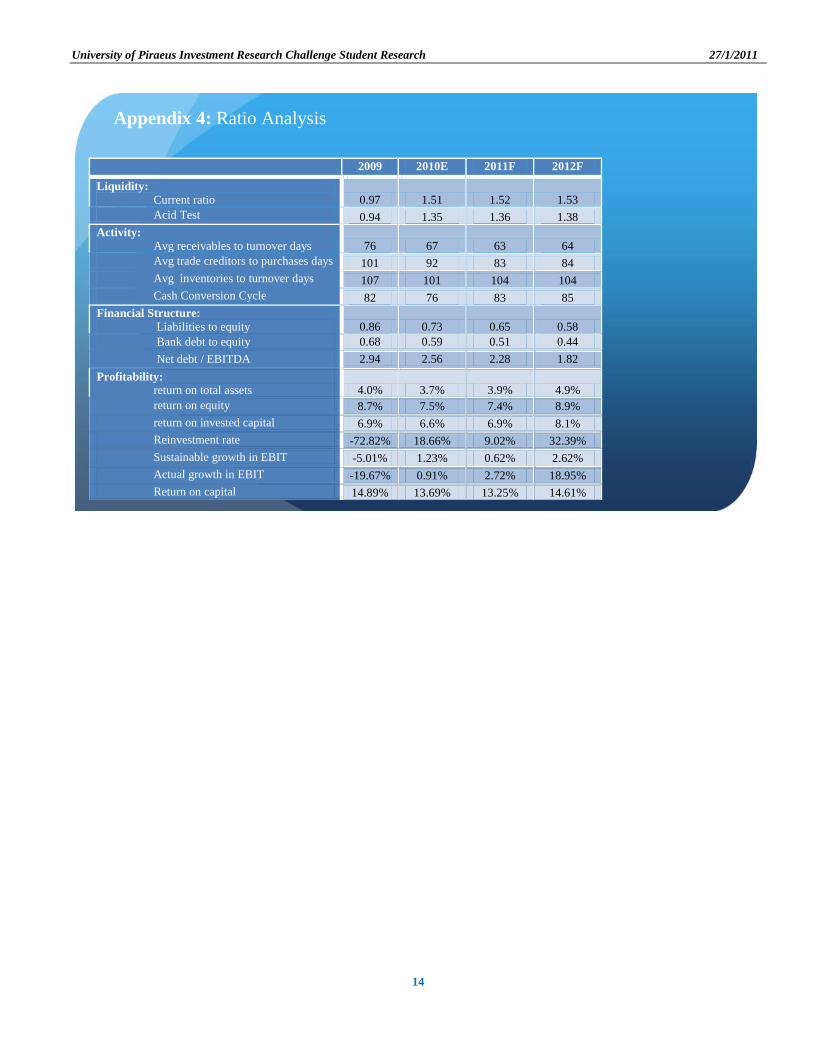
2009 2010E 2011F 2012F
Liquidity:
Current ratio 0.97 1.51 1.52 1.53
Acid Test 0.94 1.35 1.36 1.38
Activity:
Avg receivables to turnover days 76 67 63 64
Avg trade creditors to purchases days 101 92 83 84
Avg inventories to turnover days 107 101 104 104
Cash Conversion Cycle 82 76 83 85
Financial Structure:
Liabilities to equity 0.86 0.73 0.65 0.58
Bank debt to equity 0.68 0.59 0.51 0.44
Net debt / EBITDA 2.94 2.56 2.28 1.82
Profitability:
return on total assets 4.0% 3.7% 3.9% 4.9%
return on equity 8.7% 7.5% 7.4% 8.9%
return on invested capital 6.9% 6.6% 6.9% 8.1%
Reinvestment rate -72.82% 18.66% 9.02% 32.39%
Sustainable growth in EBIT -5.01% 1.23% 0.62% 2.62%
Actual growth in EBIT -19.67% 0.91% 2.72% 18.95%
Return on capital 14.89% 13.69% 13.25% 14.61%
HELP ROWS
Appendix 4: Ratio Analysis


