Embed Size (px)
Citation preview

2015 REPORT ON ANNUAL INDICATORS
THE UNIVERSIT Y OF MASSACHUSETTSA M H E R S T • B O S T O N • D A R T M O U T H • L O W E L L • M E D I C A L S C H O O L • U M A S S O N L I N E
University Performance Measurement System
July 2015

UMASS AMHERST
HEADLINES FROM THE 2015 ANNUAL INDICATORS
ACADEMIC QUALITY
The Top American Research Universities (TARU - The Center) identifies nine performance indicators as measures of academic quality to evaluate the comparative performance of public and private research universities that generate over $40 million in federal research annually. Included in this group are ten public research universities with a Carnegie classification of very high research activity (RU/VH) with which UMass Amherst is comparing its progress on these and other indicators. All but two of the peers, the Universities of Connecticut and Delaware, are among the 62 members of the Association of American Universities (AAU). AAU institutions are recognized for their excellence in research and education. Therefore, the benchmark for the Amherst campus is quite high. In 2013, the University of Oregon, an AAU institution, replaced the University of Nebraska among UMass Amherst’s institutional peers. Historical data have been adjusted to reflect this change.
Student Academic Quality. The academic profile of entering students has made impressive gains in recent years, evidenced by growth in both high school GPA and SAT scores. The high school GPA of entering students increased from 3.61 in 2010 to 3.78 in 2014. Virtually all (99%) students entered UMass Amherst with a high school GPA of 3.0 and above. Average SAT scores improved by 51 points over the five-year period (and continue to rise) and are converging on the peer group at the 75th percentile. Further, seniors report high satisfaction with their undergraduate experience. Results from the 2014 National Survey of Student Engagement (NSSE) show that 88% of seniors rated their UMass Amherst educational experience positively, and increasing numbers rated it as excellent. Advanced Training. The campus has demonstrated strength in the education and training of pre- and post-doctoral researchers. UMass Amherst is below the peer median for the number of doctoral degrees awarded. The number of post-doctorates receiving training has declined, some of which can be attributed to the 2012 implementation of the campus’s first post-doc collective bargaining agreement, which narrowed the definition of the post-doc category and increased salary and benefits. Research and Creative Activity. Total and federal research dollars (R&D) are key measures of an institution’s commitment to, and success in research. UMass Amherst faculty have been successful in competing for these dollars. Total R&D spending increased by 18%, and per faculty expenditures
increased by 1% in the past five years. Recent decreases were primarily reflective of federal and state budget restrictions as well as the expiration of most American Recovery and Reinvestment Act (ARRA) grants, but the numbers are now rebounding, exceeding $200 million for the first time. The number of academic honors and awards earned by the faculty is another indicator of an institution’s quality. The number of National Academy members has remained fairly stable, but below the peer median. A more comprehensive view of awards from Academic Analytics, another source of awards data, shows a steady increase in prestigious awards received by UMass Amherst faculty, up to 345 in FY 2014. In recent years, the campus invested in tenure-system faculty, and the number of faculty has grown by 7% since 2010. Nevertheless, it is considerably smaller than top public research universities. Continued growth in the tenure-system faculty will be required for the campus to make significant progress in improving academic quality and research productivity, and to advance in the research university rankings.
ACCESS AND AFFORDABILITY
Providing an affordable and accessible education of high quality is central to the University’s mission. In AY 2013-14, 28% of full-time, in-state students qualified for Pell grants. Eighty-two percent of financial need was met for in-state students who applied for aid. The campus continues to recognize its commitment to students with financial need, and has increased institutional need-based aid accordingly.
STUDENT SUCCESS AND SATISFACTION
Most UMass Amherst students have a positive educational experience. Ninety percent of students return for their sophomore year, 76% graduate within six years from UMass Amherst, the highest graduation rate since the campus began tracking this statistic. The campus has seen rapid improvement in the four-year graduation rate which has increased from 54% for the Fall 2006 cohort to 67% for the Fall 2010 cohort. Retention and graduation rate improvement have closed much of the gap with peer institutions. The campus is implementing and expanding programs that will enrich the college experience with a goal of increasing retention and graduation rates. The Exploratory Track program will begin in September with all undeclared first-year students placed in one of eight academic advising tracks each affiliated with an academic school
University of Masachusetts 2015 Performance Measurement System
23

UMASS AMHERST
or college. This new program is expected to give students a stronger sense of belonging within the schools and colleges while still encouraging them to explore options across campus. The students will receive more defined advising assistance and support to help them in their exploration of a major. The campus has also instituted First Year Seminars for all incoming freshmen this Fall. All incoming first-year students will select a first year seminar to take their very first semester on campus as part of their transition to the university. This will provide them with an opportunity to explore interesting topics and connect with the campus community including faculty, graduate students and peers. The Excellence through Student Enhanced Learning (ExSEL) program is being launched in nine STEM gateway courses and applies the peer-led team learning model that promotes deeper learning and true mastery of problem-solving. Students participating in ExSEL will develop their skills in discipline-based problem solving that will translate into improved performance in the course, and will learn from each other the habits of mind and discipline needed for success in their courses. The STEM Ambassadors Program invites students during their freshman first semester to learn about life in the laboratory and engage in research projects together. The STEM Ambassadors also engage in diverse offerings of workshops and participate in community service activities. Through these offerings the STEM Ambassadors strengthen the skills needed to succeed in STEM coursework while building connections with other UMass Amherst students. The University is partnering with the Education Advisory Board (EAB), a best-practices research and consulting firm through its Student Success Collaborative. The Collaborative provides access to the predictive analytics advising platform, best practice research studies and collaborative projects that will enhance our ability to understand and improve student advising, retention and degree completion. The project was fully implemented during AY 2014-15. UMatter at UMass continues to be an important initiative intended to increase students’ connection to campus by affirming the values the university set in motion over 150 years ago: care, compassion and active engagement. Expanded research and scholarship opportunities are also available for undergraduates. Changes in the design and delivery of the General Education curriculum, including an integrative experience requirement for all upper division students also serve to enhance and enrich the student academic experience. The campus has made progress in increasing the diversity of the student body. The Fall 2014 entering class was the most diverse group of students in history (24% ALANA); overall, over 22% of enrolled undergraduates were students of color. Also, around
one-quarter are the first in their families to pursue a college degree. The campus will continue to attract a diverse student body and encourage greater appreciation for diverse populations.
SERVICE TO THE COMMONWEALTH
UMass Amherst has invested in programs to promote the enrollment and graduation of undergraduate and graduate students in the sciences and mathematics. In Fall 2014, over one-third of baccalaureate and 29% of graduate students were enrolled in Science, Technology, Engineering and Mathematics (STEM) programs, and over one-quarter of degrees awarded at the undergraduate and graduate levels were in STEM programs. The STEM Diversity Institute (SDI), established in 2012 at UMass Amherst, facilitates the diversification of the science, technology, engineering, and mathematics (STEM) workforce. SDI activities serve undergraduate students, graduate students, postdoctoral fellows, and faculty. These investments will continue.
FINANCIAL HEALTH
The financial indicators of the Amherst campus demonstrate a commitment to prudent use and investment of state appropriation, student tuition and fees, and other income streams. The campus continues to support the academic enterprise by increasing growth in net revenues from graduate students, increasing summer and continuing and professional education revenue, attracting more donor support, and increasing out-of-state enrollment. Investment in capital infrastructure, faculty growth, and student success initiatives remain cornerstones of the campus strategic plan. The strategic plan identifies three overarching themes: 1) establish the campus as a “destination of choice” for the best and brightest students; 2) establish the campus as an “investment of choice” with a broad range of stakeholders vital to the campus; 3) mobilize resources to achieve these goals. The campus is currently engaged in implementing specific action plans emanating from these themes. Continued state support for general operations and capital remains critical to achieve these goals and to remain financially healthy. The campus launched UMass Rising, a comprehensive fundraising campaign with a goal of $300 million in 2013. The campaign is designed to enhance excellence and contribute to the long-term sustainability of the campus. To date, the campus has raised $310 million, exceeding the goal more than a year ahead of schedule. The campaign continues with three priorities: student scholarships, faculty endowments, and restoration of the Old Chapel.
University of Masachusetts 2015 Performance Measurement System
24

UMASS AMHERST
2015 ANNUAL INDICATORS AT A GLANCE
ACADEMIC QUALITY
Average HS GPA of Freshmen 3.78
Average SAT Scores of Freshmen
Arithmetic Mean 1218
25th – 75th Percentile 1130 – 1300
Average GPA of Entering Transfer Students 3.32
Student Satisfaction with Educational Experience 88%
Student-Faculty Ratio 17:1
Technology-Enhanced Classrooms 288
No. of Doctoral Degrees Awarded 306
No. of Postdoctoral Appointees 153
Total R&D Expenditures $200.2M
Total R&D Expenditures Ranking 105
Total R&D Expenditures Ranking
among Carnegie Peers, US Publics, Non-Medical 9
Federal R&D Expenditures $110.2M
Total R&D Expenditures per
Tenure System Faculty $170,270
Patent Applications 40
License Income $753,000
Percent Tenured/Tenure-Track Faculty 74%
New Tenured/Tenure-Track Faculty Hired 68
As Percent of Total T/TT Faculty 6%
Change in Tenured/Tenure-Track Faculty +21
Change in Faculty FTE +60
Full-Time Instructional Faculty
Percent Faculty-of-Color 21%
Percent Women Faculty 43%
Faculty Awards 8
National Academy Members 8
ACCESS AND AFFORDABILITY
Percent In-State Pell Grant Recipients 28%
Percent of Need Met for In-State Students Awarded
Need-Based Aid 82%
Average Debt of Students $30,453
(UG Graduating Class)
Percent Graduating Class with Debt (UG) 72%
Percent Undergraduates from Massachusetts 77%
Online Course Enrollments 22,139
Annual Growth in Online Course Enrollments 13%
STUDENT SUCCESS AND SATISFACTION
Percent Undergraduates who are Students of
Color 22%
Percent Undergraduates who are First
Generation in College 25%
Percent Undergraduates with English as a
Second Language 11%
Percent Undergraduates who are International 3%
Number of Students who Participated in a
Study Abroad Program 1,194
Freshmen One-Year Retention Rate 90%
Freshmen Four-Year Graduation Rate 67%
Freshmen Six-Year Graduation Rate 76%
Transfer (Full-time) One-Year Retention Rate 86%
Transfer (Upper Division) Four-Year
Graduation Rate 76%
Alumni Participation Rate 10%
SERVICE TO THE COMMONWEALTH
Incoming Class 5,800
Percent Freshmen 80%
Percent Transfers 20%
University of Masachusetts 2015 Performance Measurement System
25

UMASS AMHERST
Degree Completions 7,389
Bachelor’s 5,674
Master’s 1,409
Doctorates 306
Percent Alumni who Remain in MA 54%
Enrollment in STEM Programs 9,477 (34%)
Undergraduate 7,775 (36%)
Graduate 1,702 (29%)
Degrees Awarded in STEM Fields 2,118 (29%)
Undergraduate 1,631 (29%)
Graduate 487 (28%)
Degrees Awarded in Healthcare Fields 587
Undergraduate 420
Graduate 167
MTEL Science and Math Test-Takers 25
FINANCIAL HEALTH
Total Endowment $307.1M
Annual Growth in Endowment 13%
Endowment per Annualized Student FTE $11,107
Private Funds Raised Annually $45.7M
Primary Reserve 27.9%
Debt Ratio 6.2%
Deferred Maintenance per GSF $143
University of Masachusetts 2015 Performance Measurement System
26

UMASS AMHERST
2010 2011 2012 2013 20143.61 3.64 3.66 3.73 3.78
Average SAT Scores of Freshmen
Fall 2010 Fall 2011 Fall 2012 Fall 2013 Fall 2014
75th Percentile 1250 1270 1280 1290 1300
25th Percentile 1080 1100 1110 1120 1130
Peer Median75th Percentile 1305 1310 1305 1315 132525th Percentile 1075 1085 1075 1075 1085
UMA Rank
75th Percentile 10 8 8 7 7
25th Percentile 8 5 4 4 4
Fall 2010 Fall 2011 Fall 2012 Fall 2013 Fall 2014
3.25 3.29 3.27 3.32 3.32
ACADEMIC QUALITY
High School GPA of Freshmen
Average GPA of Entering Transfer Students
Student Satisfaction with Educational Experience
Average SAT Scores of Freshmen
Average HS GPA
Avg. GPA Entering Transfers
UMass Amherst entering first-year students are strong academically with an average high school GPA of 3.78. The Fall 2014 entering class was at a historical high with 99% of students earning a GPA of 3.0 and above. This was the eighth consecutive year of increases. There were 4,642 students in the Fall 2014 entering class.
The transfer GPA remains high. It consistently surpasses the mandated Department of Higher Education minimum of 2.00 for transfer students.
Seniors evaluate their UMA educational experience quite positively in the National Survey of Student Engagement (NSSE). In 2014, almost 90% of students rated their experience as good or excellent. These rates were comparable with other Carnegie RUVH schools. The proportion of students who rated the experience as excellent has shown strong gains since 2005, increasing from 28% in 2005 to 42% in 2014. The next administration of NSSE will be in 2017.
First-year students entered UMA with a mean SAT of 1218, posting a 5-year increase of 51 points. This is another historical high for the campus. SAT scores have improved by 50 points at both the 25th and 75th percentile since Fall 2010. The campus is above the Fall 2014 median of the peer group at the 25th percentile, but still lags behind the peers at the 75th.
0%
20%
40%
60%
80%
100%
≥ 3.00 98% 99% 99% 99% 99%
2.51-2.99 2% 1% 1% 1% 1%
≤ 2.50 0% 0% 0% 0% 0%
Fall 2010 Fall 2011 Fall 2012 Fall 2013 Fall 2014
0%
20%
40%
60%
80%
100%
% Excellent 28% 35% 34% 41% 41% 41% 42% 44%
% Good 54% 50% 53% 46% 46% 45% 46% 44%
UM A 2005
Carnegie Peers 2005
UM A 2008
Carnegie Peers 2008
UM A 2011Carnegie
Peers 2011
UM A 2014
Carnegie Peers 2014
University of Masachusetts 2015 Performance Measurement System
27

UMASS AMHERST
Student-Faculty Ratio 2010 2011 2012 2013 2014
UMA 19:1 18:1 18:1 18:1 17:1
No of Classrooms
Percent of Total
288 100%226 78%
90 31%16 6%
288 100%
UMA Doctoral Degrees Awarded
2009-10 2010-11 2011-12 2012-13 2013-14
Research/Scholarship Doctorates 259 258 268 295 287Professional Practice Doctorates 22 24 37 39 19Total Doctoral Degrees Awarded 281 282 305 334 306
Research/Scholarship Doctorates 2009-10 2010-11 2011-12 2012-13 2013-14
UMA 259 258 268 295 287
Peer Median 301 359 345 363 354
Rank 9 9 8 9 9
Student-Faculty Ratio
Doctoral Degrees Awarded
Technology-Enhanced Classrooms
Technology-Enhanced Classrooms
BasicMedium HighVery HighTotal Classrooms Teaching Spaces
AY 2013-2014
The number of doctorates awarded at UMA, both research scholarship and professional practice degrees, decreased in 2013-14, after anunusually high number of degrees awarded the previous year. Professional practice doctorates have decreased for the first time since the campus began reporting this award. UMA remains well below the peer median on the research/scholarship measure.
The student-faculty ratio has been slowly trending downward in recent years. Since 2010 the ratio has improved from 19:1 to 17:1 in 2014.
Basic classroom technology:All 288 classrooms scheduled by the UMA campus registrar, IT, and Isenberg School of Management have projectors and media players available.Medium classroom technology:In addition to Basic technology, more than three-quarters of classrooms at UMA have a digital projector (or large screen), HDMI & VGA connections for laptop projection, audio connection and room speakers. 205 of these rooms are considered to be Medium Plus and also include a blu-ray player, wireless microphone and AV control cabinet.High classroom technology:In addition to Medium and Medium Plus technology, nearly a third of UMA teaching spaces are equipped with technology to record lectures. These rooms include lecture capture (Echo360), 1-2 motion-tracking cameras (for speaker & students), and audience microphones (portable or installed). Twenty-one of these rooms are considered to be High Plus and also include a point-to-point video conferencing unit and large screen monitors.Very High classroom technology:Team-based classrooms include the features of High technology rooms, an instructor podium with document camera, touchscreen AV controls and the following technology at each table of nine students: 3 laptops, 1 large screen, 3 built-in microphones with “talk” button, AV connections for student laptops, and 1 whiteboard camera and microphone.Computer Classrooms contain 20-39 seats with desktop computers (Mac & Windows) and an instructor desktop with projector connection.
University of Masachusetts 2015 Performance Measurement System
28

UMASS AMHERST
Postdoctoral Appointees 2009-10 2010-11 2011-12 2012-13 2013-14
UMA 209 215 209 165 166
Peer Median 167 196 177 233 NA
Rank 5 6 5 7 NA
Total R&D Expenditures ($000's)
2010 2011 2012 2013 2014
S&E UMA $164,854 $176,545 $178,207 $172,217 $183,210
S&E Peer Median $209,899 $232,565 NA NA NA
Rank 7 8 NA NA NA
Federal R&D Expenditures ($000's)
2010 2011 2012 2013 2014
UMA $97,937 $107,683 $115,280 $111,448 $110,189
S&E UMA $88,860 $101,940 $106,470 $103,233 $102,682
S&E Peer Median $114,136 $128,714 NA NA NA
Rank 9 9 NA NA NA
Total R&D Expenditures Rank
FY 2009 FY 2010 FY 2011 FY 2012 FY 2013
Overall Ranking 105 105 107 104 105Ranking based on Carnegie Peers 9 9 9 8 9
Total R&D Expenditures Rankings
Total Research & Development (R&D) Expenditures
Postdoctoral Appointees
n.b. Ranking based on Carnegie Peers is further standardized by US Publics and Non-Medical Schools.
Total R&D spending for the campus in FY 2014 was about $200 million, of which over $183 million was in science and engineering (S&E). S&E spending has increased 11% in total dollars and 13% in federal dollars since FY 2010.
UMass Amherst senior faculty mentor recent PhDs with science and engineering degrees. The number of post-doctoral scholars dropped in the past few years, and continues its slide. This can be explained in part by the 2012 implementation of the campus’s first postdoc union contract. The negotiated stipend increases and benefits resulted in some postdoc layoffs, non-reappointments, and, for some PIs, a decrease in the number of new hires.
$130,000$140,000$150,000$160,000$170,000$180,000$190,000$200,000$210,000
Tot
al (
in $
000'
s)
UMA $169,143 $181,297 $194,775 $190,739 $200,199
FY 2010 FY 2011 FY 2012 FY 2013 FY 2014
Over the past five years, UMA has remained stable for overall R&D expenditure rankings and in relation to our peers.
University of Masachusetts 2015 Performance Measurement System
29

UMASS AMHERST
Total R&D Per Tenure System Faculty
2010 2011 2012 2013 2014
Total $168,805 $173,253 $172,681 $163,239 $170,270
Federal $89,235 $105,675 $103,169 $97,851 $95,429
FY 2010 FY 2011 FY 2012 FY 2013 FY 2014
28 29 26 32 40
FY 2010 FY 2011 FY 2012 FY 2013 FY 2014
$2,353,519 $513,500 $952,738 $1,200,000 $753,000
Percent Tenured/Tenure-track
FacultyFall 2010 Fall 2011 Fall 2012 Fall 2013 Fall 2014
% Tenured/Tenure-track 77.2% 76.3% 76.3% 76.1% 74.3%
% Non Tenure-track/PT 22.8% 23.7% 23.7% 23.9% 25.7%
AY 2010-11 AY 2011-12 AY 2012-13 AY 2013-14AY 2014-
15
34 59 55 60 68
New T/TT Faculty as Percent of Total Fall 2010 Fall 2011 Fall 2012 Fall 2013 Fall 2014
Total T/TT Faculty 978 993 1,009 1,026 1,047Total New Hires 34 59 55 60 68Percent of Total 3% 6% 5% 6% 6%
Percent Tenured/Tenure-Track Faculty
New Tenured/Tenure-Track Faculty Hired
Patent Applications
License Income
Patent Applications
Total R&D Expenditures per Tenure System Faculty
New Tenured/Tenure-Track Faculty Hired
License Income
New Tenured/Tenure-Track Faculty Hired as Percent of All Tenured/Tenure-Track Faculty
The campus has made significant investments in tenure system faculty hires in recent years. There were 68 such hires in FY 2014. The campus remains committed to supporting the strongest faculty possible and increasing the number of tenure-system faculty.
The total R&D expenditures dollars per faculty increased by 1% between FY 2010 and FY 2014. Federal dollars per faculty increased by 7% during the same period.
In FY 2014, UMass Amherst filed 1 patent application for every $5 million in research expenditures.
After two years of gains, license income has dipped back down to about $750K. (Note: FY 2010 licensing income included a large one-time payment for a paid-up license).
The percent of tenured/tenure-track faculty (full-time and part-time) has been steadily decreasing over the past five years. This is explained by the steady expansion of the non-tenure stream faculty at UMA.
Over the past several years the new hires have hovered around 6% of the total T/TT faculty. When compared to Fall 2010, the Fall 2014 number of new hires doubled, while the total count only experienced a 7% percent change.
University of Masachusetts 2015 Performance Measurement System
30

UMASS AMHERST
Fall 2010 Fall 2011 Fall 2012 Fall 2013 Fall 2014
978 993 1,009 1,026 1,047
Fall 2010 Fall 2011 Fall 2012 Fall 2013 Fall 2014
1,264 1,300 1,320 1,346 1,406
Faculty Of Color Fall 2010 Fall 2011 Fall 2012 Fall 2013 Fall 2014Number 209 222 225 233 251Percent 19.2% 19.5% 19.8% 20.1% 21.1%
Women Faculty Fall 2010 Fall 2011 Fall 2012 Fall 2013 Fall 2014Number 456 487 507 527 552Percent 38.9% 39.9% 41.1% 41.8% 42.6%
Does not include Unknowns and Non Resident Aliens.
2009 2010 2011 2012 2013
12 8 6 8 8
Peer Median 14 13 11 11 N/A
Rank 6 8 8 9 N/A
Faculty by Race and Gender
Full-Time Instructional Faculty
Change in Tenured/Tenure-Track Faculty
Change in T/TT Faculty
Change in Faculty FTE
Faculty Awards
Change in Faculty FTE
Faculty Awards
n.b. Faculty-of-Color based on US Citizens/Permanent Residents reporting Race/Ethnicity according to new IPEDS definitions.
UMass Amherst faculty members are recipients of many prominent awards in the arts, humanities, science, engineering and health fields. The number of awards remained stable in 2013, but the UMA rank remains near the bottom of the peer group. Another source, Academic Analytics, which defines awards more broadly shows that the number of awards has increased steadily from 239 in FY 2010 to 345 in FY 2014.
Fall 2014 saw a one-year increase of 21 in the tenure-system faculty, and an increase of 69 since Fall 2010. Investment in faculty is required to maintain the campus as a nationally competitive public research university.
Faculty full-time equivalent (both full and part-time) showed a one-year increase of 60 and has grown by 142 since Fall 2010. About three-fifths of the growth has been accounted for by tenure system faculty.
The number and percent of both faculty of color and women faculty have been steadily increasing. The number of faculty of color has shown a 20% increase since fall 2010, and now comprises over one-fifth of all faculty. The number of women faculty has increased by 21% in the last five years.
University of Masachusetts 2015 Performance Measurement System
31

UMASS AMHERST
2009 2010 2011 2012 2013
9 9 9 8 8
Peer Median 11 11 11 12 12
Rank 7 7 7 8 7
Fall 2009 Fall 2010 Fall 2011 Fall 2012 Fall 2013
28% 31% 31% 28% 28%
2009-10 2010-11 2011-12 2012-13 2013-14
91% 87% 86% 84% 82%
2010 2011 2012 2013 2014Average Debt Load $25,420 $26,893 $27,945 $28,999 $30,453Percent Graduating Class with Debt 68% 69% 71% 70% 72%
Percent Need Met (In-State)
National Academy Members
Percent (In-State) Pell Grant Recipients
National Academy Members
Percent Need Met for In-State Students Awarded Need-Based Aid
ACCESS AND AFFORDABILITY
Percent (In-State) Pell Grant Recipients
Student Debt Load of Graduating Class
Several UMass faculty members have been elected to some of the most prestigious disciplinary organizations: the National Academy of Science, the National Academy of Engineering, and the Institute of Medicine. These are some of the highest honors academic faculty can receive. This number remained stable in 2013. The campus ranks below its peers on this measure. The absence of a medical school limits the ability of UMA faculty to be elected to the IOM.
The proportion of full-time, in-state students receiving Pell Grants dipped in Fall 2012 to 28% and has stayed there for Fall 2013. The campus has significantly increased its need-based institutional grant aid to support students from families with the lowest income. This rate is competitive with other flagship campuses.
The campus remains committed to providing need-based aid for in-state undergraduates as it strives to provide a quality and affordable education.
The percentage of students graduating from UMA with debt is gradually trending upward. Since 2010, there has been an increase of 4% of the graduating class that has a debt load and the average debt load has increased by almost 20%.
University of Masachusetts 2015 Performance Measurement System
32

UMASS AMHERST
Percent Undergraduates from Massachusetts
Fall 2010 Fall 2011 Fall 2012 Fall 2013 Fall 2014
Number 16,046 16,211 16,090 15,999 16,016
Percent 80% 79% 78% 77% 77%
AY 2009-10 AY 2010-11 AY 2011-12 AY 2012-13AY 2013-
14
10% 10% 10% 8% 13%
Percent UGs Students of Color
Fall 2010 Fall 2011 Fall 2012 Fall 2013 Fall 2014
Number 3,924 3,943 3,960 4,117 4,332
Percent 20.9% 20.9% 21.0% 21.9% 22.4%
Annual Growth in Online Course Enrollments
Percent Undergraduates who are Students of Color
STUDENT SUCCESS AND SATISFACTION
Percent Undergraduates from Massachusetts
Online Course Enrollments
Annual Growth in Online Course Enrollments
The campus is committed to maintaining access to a quality education for residents of the Commonwealth. Over three-fourths of UMass Amherst students enrolled in state-supported programs are residents of the state. The percent has declined in recent years as the campus strives to increase enrollment of out-of-state and international students.
The Amherst campus offers eight undergraduate, eight graduate degrees and five certificate programs that can be completed partially or fully online. These programs range from certificates in Sustainable Business Practice to a B.S. in Hospitality and Tourism Management, a Master's in Business Administration and a Doctorate in Nursing Practice. In addition, a variety of other courses are offered. Online course enrollments grew by 13% in the most recent year, and 49% since AY 2009-10.
There has been considerable growth in online course enrollment on the Amherst campus in recent years. Enrollments have almost doubled since 2007-08. Online programs afford students flexibility in course-taking.
The Amherst campus is committed to enrolling a diverse student body. This is evidenced by the growth in the proportion of undergraduates (including CPE) who are students of color. Undergraduates enrolled in the past year were the most diverse group of students in recent history.
0
5,000
10,000
15,000
20,000
25,000
UMA 14,856 16,408 18,076 19,569 22,139
AY 2009-10 AY 2010-11 AY 2011-12 AY 2012-13 AY 2013-14
University of Masachusetts 2015 Performance Measurement System
33

UMASS AMHERST
Percent UGs First
Generation in CollegeFall 2010 Fall 2011 Fall 2012 Fall 2013 Fall 2014
Percent 27% 29% 27% 25% 25%
Percent UGs ESL Fall 2010 Fall 2011 Fall 2012 Fall 2013 Fall 2014
Percent 9% 10% 10% 12% 11%
Percent UGs International
Fall 2010 Fall 2011 Fall 2012 Fall 2013 Fall 2014
Number 304 378 421 537 681
Percent 1% 2% 2% 2% 3%
Fall 2009- Summer 10
Fall 2010- Summer 11
Fall 2011- Summer 12
Fall 2012- Summer 13
Fall 2013- Summer 14
1,023 1,143 1,074 1,128 1,194
Percent Undergraduate Students who are International
Total Number of Students who Participated in a Study Abroad Program
Total Number of Students who
participated in Study Abroad
Percent Undergraduates who are First Generation in College
Percent Undergraduates with English as a Second Language
Although most entering students have parents who are college-educated, many UMass Amherst students will be the first in their families to earn the baccalaureate. About one-fourth of entering first-year students are first generation according to information reported on the Common Application.
English is not the first language of about 11% of first-year students entering UMass Amherst. This is another indicator of the diversity of the campus.
The Amherst campus attracts a small number of undergraduate international students, some of whom are studying on the campus as part of an international exchange program. The numbers have more than doubled since Fall 2010 as the campus has increased its recruitment of international students. In contrast, almost one-fourth (1,546) of graduate students are international.
1,194 UMass students participated in a study abroad experience during the 2013-14 academic year. The campus encourages students to take advantage of these enriching globallearning opportunities.
University of Masachusetts 2015 Performance Measurement System
34

UMASS AMHERST
Fall 2010 Fall 2011 Fall 2012 Fall 2013 Fall 2014
7 7 7 8 6
4-Yr Graduation Rates 2010 2011 2012 2013 2014
Cohort Entering Year (2006) (2007) (2008) (2009) (2010)
4-Year Graduation Rate
54% 59% 63% 66% 67%
Fall 2010 Fall 2011 Fall 2012 Fall 2013 Fall 2014
8 9 8 6 6
Freshmen Six-Year Graduation Rate
Freshmen One-Year Retention Rate Peer
Rank
Four -Year Graduation Rates
Freshmen One-Year Retention Rate
Freshmen Six-Year Graduation Rate
The one-year retention rate has been consistently high, and the relative position of UMass with respect to its peers in Fall 2014 improved by two positions. New strategies are being developed and implemented to improve the first-year experience and hence student retention.
Seventy-six percent of full-time Amherst campus students graduate within six years of entrance, and another 10% receive their degree from another institution. This is the third consecutive year in which the rate has exceeded 70% since the campus began tracking graduation rates beginning with the Fall 1984 entering cohort (64%). The 2014 rate remains just slighly below the peer median; but improvements in the four-year graduation rates (67% for the 2010 cohort) suggest that the 6-year rates will continue to improve. Numbers reflect rates for the Fall 2004-Fall 2008 entering cohorts. The campus implemented a Student Success Collaborative in partnership with the Educational Advisory Board in AY 2014-15. This is a predictive analytics advising platform that will enhance our ability to understand and improve student advising, retention and degree completion.
0%
20%
40%
60%
80%
100%
UMA 89% 89% 88% 89% 90%
Peers 91% 91% 91% 91% 90%
Fall 2010 Fall 2011 Fall 2012 Fall 2013 Fall 2014
The four-year graduation rate continues to improve every year at UMA. In fact, the 2014 rate is 12.4 percentage points higher than the 2010 rate of 54.2%. Currently two-thirds of entering first-time first-year students are graduating in four years or less.
0%
20%
40%
60%
80%
100%
UMA 69% 67% 70% 73% 76%
Peers 73% 74% 77% 75% 77%
Fall 2010 Fall 2011 Fall 2012 Fall 2013 Fall 2014
University of Masachusetts 2015 Performance Measurement System
35

UMASS AMHERST
Fall 2010 Fall 2011 Fall 2012 Fall 2013 Fall 2014
86% 86% 86% 86% 86%
Fall 2010 Fall 2011 Fall 2012 Fall 2013 Fall 2014
73% 74% 74% 74% 76%
2008-09 2009-10 2010-11 WITHIN 4 YRS.
WITHIN 5 YRS.
WITHIN 6 YRS.
0% 0% 1% 63% 74% 76%0% 0% 0% 0% 0% 0%0% 0% 1% 63% 74% 76%
0% 0% 0% 4% 7% 9%
0% 0% 0% 1% 1% 1%
0% 0% 0% 5% 8% 10%
98% 88% 81% 18% 4% 1%
0% 7% 10% 7% 4% 3%
0% 3% 3% 2% 2% 1%
1% 10% 13% 9% 6% 4%
1% 2% 5% 5% 8% 9%
Enrolled at Another 2-yr Institution
Transfers (Full-Time) One-Year Retention Rate
Transfers (Upper Division) Four-Year Graduation Rate
Outcomes for Student Starting at UMA in Fall 2008 by Summer 2014
Transfers (Full-time) One-Year Retention
Rate
Transfers (Upper Division) Four-Year
Graduation Rate
GRADUATEDFIRST-TIME FULL-TIME FRESHMEN
Total Graduated from UMass Amherst
Bachelor's degree from another Institution
Associate degree from another Institution
Student Achievement Measure (SAM Data - Bachelor's Seeking Model)
Total Transferred and Enrolled at another Institution
Bachelor's degree from UMass AmherstAssociate degree from UMass Amherst
Number of Students in Cohort: 4,131
Total Graduated from another Institution
Enrolled at UMass Amherst
Enrolled at Another 4-yr Institution
Current Status Unknown
The one-year retention rate for transfers has remained steady at 86%. This includes a small number of students who graduate in one year. Transfer students represent approximately one-fifth of the entering fall class.
Approximately three quarters of upper division transfers who enroll complete the baccalaureate degree within four years of entry. Many have already earned an Associate's degree. This matches the freshman six-year graduation rate. Upper Division transfers represent less than half of total transfer students. The rate has remained fairly stable over time. Numbers are reported for the Fall 2006-2010 cohorts.
The Student Achievement Measure tracks entering first-time first-year students, by cohort, throughout their college careers. After 4 years, 68% graduated from UMA or another institution, 18% were still enrolled at UMA, and 9% were enrolled at another institution. This means that 95% of the entering cohort either earned a degree or were still actively seeking one. After 6 years, 86% earned a degree and an addittional 5% were still working toward one.
University of Masachusetts 2015 Performance Measurement System
36

UMASS AMHERST
2010 2011 2012 2013 201412% 11% 11% 10% 10%
Incoming Class Composition
Fall 2010 Fall 2011 Fall 2012 Fall 2013 Fall 2014
Total Incoming Class 5,597 5,815 5,628 5,773 5,800Entering Freshmen 4,469 4,688 4,592 4,621 4,642Percent Entering Freshmen 80% 81% 82% 80% 80%
Transfers 1,128 1,127 1,036 1,152 1,158Percent Transfers 20% 19% 18% 20% 20%
Degree Completions 2009-10 2010-11 2011-12 2012-13 2013-14Bachelor's degrees 4,851 5,036 5,203 5,363 5,674Masters degrees 1,221 1,361 1,334 1,362 1,409Doctoral degrees 281 282 305 334 306
Res./Sch. Doctorates 256 258 268 295 287Professional Practice 25 24 37 39 19
Total Degrees 6,353 6,679 6,842 7,059 7,389
Percent Alumni Who Live in MA
Fall 2010 Fall 2011 Fall 2012 Fall 2013 Fall 2014
Undergraduate 56% 56% 54% 57% 57%
Graduate 41% 41% 39% 41% 42%
All 53% 53% 51% 54% 54%
Alumni Participation Rate
Percent Alumni Who Live in Massachusetts
Degree Completions
SERVICE TO THE COMMONWEALTH
n.b. State-supported only.
Alumni Participation Rate
Incoming Class Composition
Over half of the undergraduate students who earned a degree from UMA, and about two-fifths of the recipients of the master's and doctorate degrees reside in Massachusetts. The overall proportion increased to 54% in 2013 and stayed steady for 2014, but it is too soon to determine if this is an upward trend.
The alumni participation rate is slowly declining for UMA. Since 2010 there has been a full 2% decline in the percent of alumni giving to the university.
The split between freshman and transfers in the incoming class remains stable at 80% freshman and 20% transfers. Despite slight fluctuations in 2011 and 2012, the composition is the same this year as it was in Fall 2010.
The total number of degrees continues to increase every year. The largest gains are at the bachelor's and master's levels. There has been more fluctuation in the number of doctoral degrees, but they have grown by 9% since 2009-10.
University of Masachusetts 2015 Performance Measurement System
37
UMASS AMHERST
Fall 2010 Fall 2011 Fall 2012 Fall 2013 Fall 2014
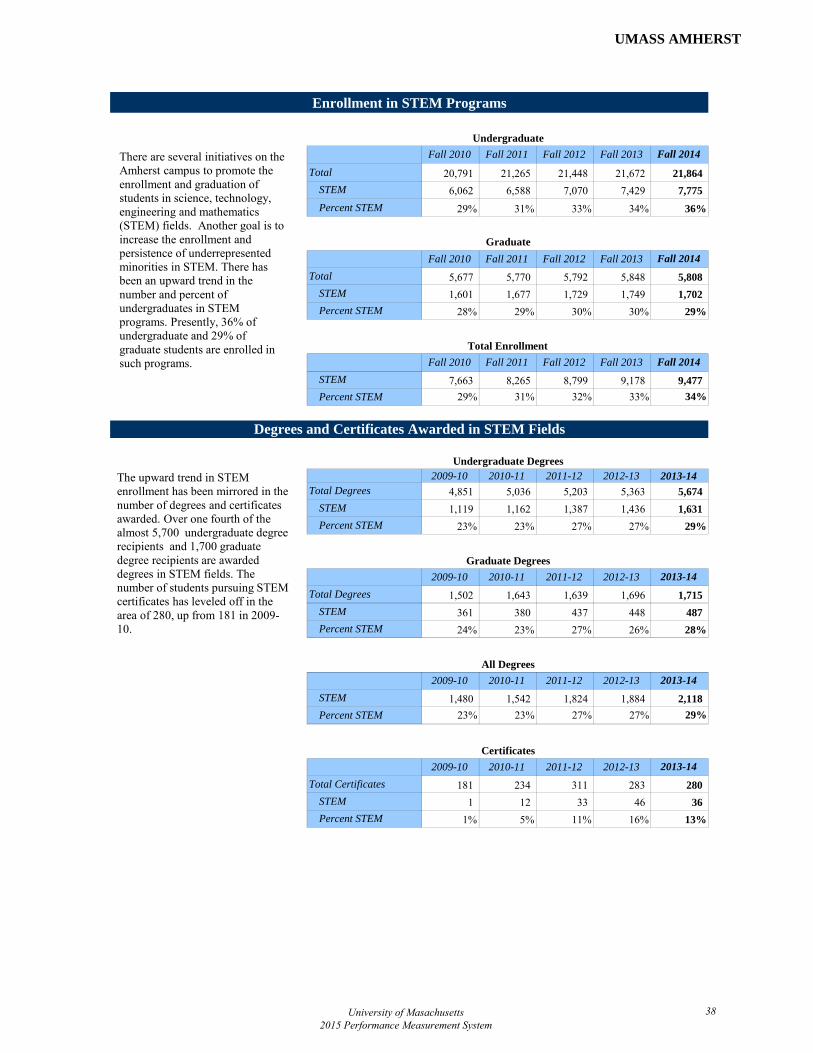
Total 20,791 21,265 21,448 21,672 21,864
STEM 6,062 6,588 7,070 7,429 7,775
Percent STEM 29% 31% 33% 34% 36%
Fall 2010 Fall 2011 Fall 2012 Fall 2013 Fall 2014
Total 5,677 5,770 5,792 5,848 5,808
STEM 1,601 1,677 1,729 1,749 1,702
Percent STEM 28% 29% 30% 30% 29%
Fall 2010 Fall 2011 Fall 2012 Fall 2013 Fall 2014
STEM 7,663 8,265 8,799 9,178 9,477
Percent STEM 29% 31% 32% 33% 34%
2009-10 2010-11 2011-12 2012-13 2013-14Total Degrees 4,851 5,036 5,203 5,363 5,674
STEM 1,119 1,162 1,387 1,436 1,631
Percent STEM 23% 23% 27% 27% 29%
2009-10 2010-11 2011-12 2012-13 2013-14
Total Degrees 1,502 1,643 1,639 1,696 1,715
STEM 361 380 437 448 487
Percent STEM 24% 23% 27% 26% 28%
2009-10 2010-11 2011-12 2012-13 2013-14
STEM 1,480 1,542 1,824 1,884 2,118
Percent STEM 23% 23% 27% 27% 29%
2009-10 2010-11 2011-12 2012-13 2013-14
Total Certificates 181 234 311 283 280
STEM 1 12 33 46 36
Percent STEM 1% 5% 11% 16% 13%
Enrollment in STEM Programs
Degrees and Certificates Awarded in STEM Fields
Total Enrollment
Undergraduate Degrees
Graduate Degrees
All Degrees
Certificates
Undergraduate
Graduate
There are several initiatives on the Amherst campus to promote the enrollment and graduation of students in science, technology, engineering and mathematics (STEM) fields. Another goal is to increase the enrollment and persistence of underrepresented minorities in STEM. There has been an upward trend in the number and percent of undergraduates in STEM programs. Presently, 36% of undergraduate and 29% of graduate students are enrolled in such programs.
The upward trend in STEM enrollment has been mirrored in the number of degrees and certificates awarded. Over one fourth of the almost 5,700 undergraduate degree recipients and 1,700 graduate degree recipients are awarded degrees in STEM fields. The number of students pursuing STEM certificates has leveled off in the area of 280, up from 181 in 2009-10.
University of Masachusetts 2015 Performance Measurement System
38

UMASS AMHERST
Health Care Degrees
and Certificates2009-10 2010-11 2011-12 2012-13 2013-14
Bachelor's degrees 256 290 252 355 420
Masters degrees 124 129 116 159 145
Doctoral degrees 25 31 48 44 22
Res./Sch. Doctorates 3 7 11 5 3
Professional Practice 22 24 37 39 19
Total Degrees 405 450 416 558 587
Total Certificates 0 0 0 0 0
Endowment Assets and Growth in Endowment
FY 2010 FY 2011 FY 2012 FY 2013 FY 2014
Total Endowment $181.6M $210.1M $230.6M $272.1M $307.1M
Annual Growth 12% 16% 10% 18% 13%
Endowment per Annualized Student
FTEFY 2010 FY 2011 FY 2012 FY 2013 FY 2014
Peers $10,840 $12,309 $14,226 $13,548 N/A
FINANCIAL HEALTH
Degrees and Certificates Awarded in Healthcare Fields
Endowment per Annualized Student FTE
Endowment Assets and Annual Growth in Endowment
The campus endowment is one of the lowest in the country for a public flagship campus. In FY 2014 the endowment increased due to gifts and better investment performance. The campus is in the midst of a fundraising campaign that has raised over $310 million and expects to see growth in the endowment from increased gifts.
The campus endowment is one of the lowest in the country for a public flagship campus. The campus average per student continues to increase as the market value outpaces student FTE growth.
The total number of health care degrees has shown a 45% increase since 2009-10. The bulk of this has come at the bachelor's level due to the new Public Health Sciences program that started being offered in fall 2007. There has been fluctuation, but no sustained increase at the graduate level. UMAstarted offering a certificate program in Nursing Education in Fall 2014.
$0
$2,000
$4,000
$6,000
$8,000
$10,000
$12,000
Per
Stu
den
t F
TE
UMA $6,407 $7,204 $8,140 $8,544 $9,951 $11,107
FY 2009 FY 2010 FY 2011 FY 2012 FY 2013 FY 2014
University of Masachusetts 2015 Performance Measurement System
39
UMASS AMHERST
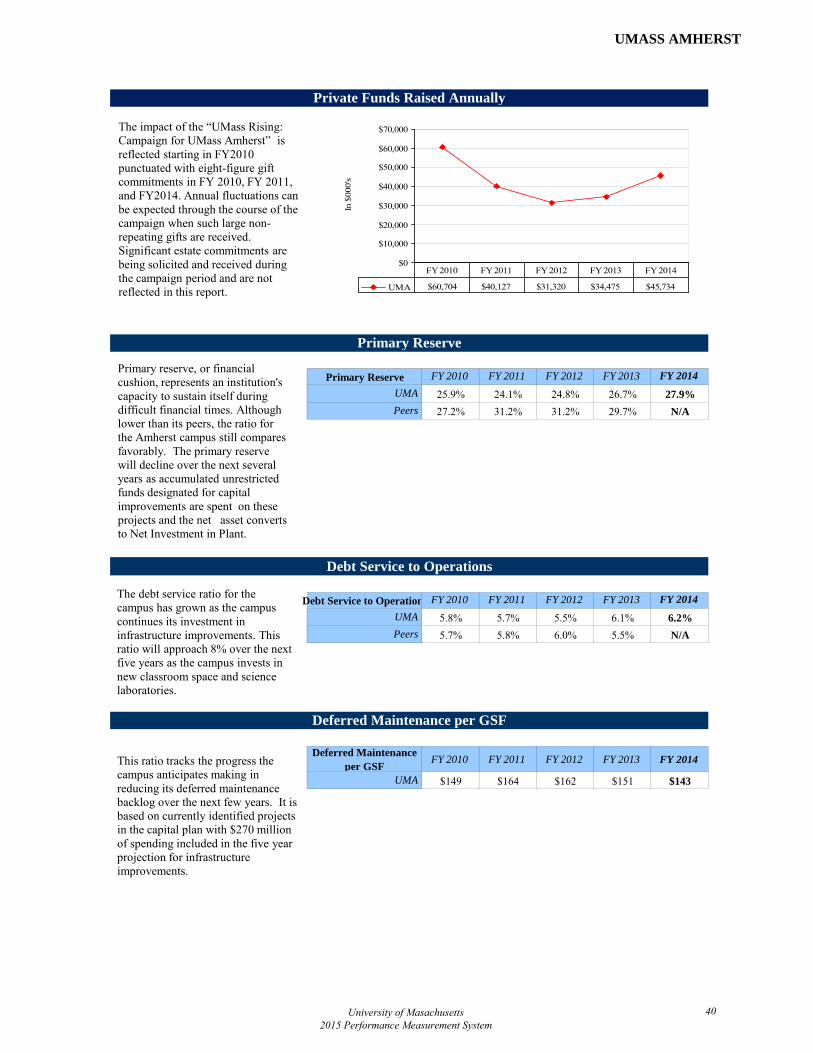
Primary Reserve FY 2010 FY 2011 FY 2012 FY 2013 FY 2014
UMA 25.9% 24.1% 24.8% 26.7% 27.9%
Peers 27.2% 31.2% 31.2% 29.7% N/A
Debt Service to Operation FY 2010 FY 2011 FY 2012 FY 2013 FY 2014
UMA 5.8% 5.7% 5.5% 6.1% 6.2%
Peers 5.7% 5.8% 6.0% 5.5% N/A
Deferred Maintenance per GSF
FY 2010 FY 2011 FY 2012 FY 2013 FY 2014
UMA $149 $164 $162 $151 $143
Debt Service to Operations
Deferred Maintenance per GSF
Private Funds Raised Annually
Primary Reserve
The debt service ratio for the campus has grown as the campus continues its investment in infrastructure improvements. This ratio will approach 8% over the next five years as the campus invests in new classroom space and science laboratories.
Primary reserve, or financial cushion, represents an institution's capacity to sustain itself during difficult financial times. Although lower than its peers, the ratio for the Amherst campus still compares favorably. The primary reserve will decline over the next several years as accumulated unrestricted funds designated for capital improvements are spent on these projects and the net asset converts to Net Investment in Plant.
This ratio tracks the progress the campus anticipates making in reducing its deferred maintenance backlog over the next few years. It is based on currently identified projects in the capital plan with $270 million of spending included in the five year projection for infrastructure improvements.
The impact of the “UMass Rising: Campaign for UMass Amherst” is reflected starting in FY2010 punctuated with eight-figure gift commitments in FY 2010, FY 2011, and FY2014. Annual fluctuations can be expected through the course of the campaign when such large non-repeating gifts are received. Significant estate commitments are being solicited and received during the campaign period and are not reflected in this report.
$0
$10,000
$20,000
$30,000
$40,000
$50,000
$60,000
$70,000
In $
000's
UMA $60,704 $40,127 $31,320 $34,475 $45,734
FY 2010 FY 2011 FY 2012 FY 2013 FY 2014
University of Masachusetts 2015 Performance Measurement System
40

UMASS AMHERST
DEFINITIONS AND SOURCES ACADEMIC QUALITY INDICATORS
Average High School GPA of Freshmen. Cumulative GPA for college prep courses with additional weight to honor and AP courses, according to BHE admissions policy, reported on all first-year students. Average SAT Scores of Freshmen. Average SAT Scores of freshmen are based on the Arithmetic Mean. The 25th & 75th percentiles are based on combined SAT scores of all first-year students. Peer data are from IPEDS. Average GPA of Entering Transfer Students. Cumulative GPA for college-level courses transferred to UMass Amherst according to admissions policy. Student-Faculty Ratio. The ratio of FTE students to FTE instructional faculty. Faculty and students in stand-alone graduate or professional programs such as medicine, law, veterinary, dentistry, social work, business, and public health in which faculty teach virtually only graduate-level students are excluded. Teaching assistants are not counted as faculty. Data and definition are from CDS. Student Satisfaction with Educational Experience. Percent of seniors who responded “good” or “excellent” to the question, “How would you evaluate your entire educational experience at this institution?” on the National Survey of Student Engagement. Technology-Enhanced Classrooms. Classification of the campus’s total classroom capacity in terms of the level of technology-support. Categories of classification are campus-specific. Doctoral Degrees Awarded. Number of Doctorates awarded each academic year, which includes September, February, and May award dates (e.g. AY 2013-14 includes Sept. 2013, February and May 2014). These include both Research/Scholarship and Professional Practice Doctorates. Peer comparison data are based on Research/Scholarship doctorates only. Postdoctoral Appointees. The number of postdoctoral appointees as reported to NSF. Total R&D Expenditures. R&D expenditures in all academic fields, from all sources (federal, state, local governments, industry, private and institutional) as reported to NSF. Peer data reported in The Top American Research Universities. Beginning 2010 data are from NSF. Peer comparison data are based on S&E R&D. Federal R&D Expenditures. R&D expenditures in all academic fields from all federal sources, as reported to NSF.
Total R&D Expenditures Ranking. Annual NSF ranking of Total R&D expenditures, for all postsecondary institutions participating in the NSF HERD Survey. Data source NCES WebCaspar/NSF HERD data tables. Total R&D Expenditures Ranking Among Carnegie Peers, US Publics, Non-Medical Institutions. UMass Amherst’s rank in the annual NSF ranking of Total R&D expenditures among public institutions of higher education with a Carnegie classification of “Research University/Very High” and with no medical school. Data source NCES WebCaspar/NSF HERD data tables. Ranking computed by campus. Total Research Expenditures per Tenure System Faculty. R&D expenditures in all academic fields from all sources (federal, state, local governments, industry, private and institutional) as reported to NSF, divided by total tenure system faculty as reported to IPEDS. Peer data reported in The Top American Research Universities. Beginning in 2010, data reported by NSF. Patent Applications. Number of U.S. Patent applications filed per year. Data Source: Data reported by campuses to UMass President’s Office, Office of CVIP. License Income. Amount of annual income from license agreements. Data Source: Data reported by campuses to UMass President’s Office, Office of CVIP. Percent Tenured/Tenure-Track Faculty. Percent based on the ratio of Tenured/Tenure-Track Faculty FTE to Total Faculty FTE. New Tenured/Tenure-Track Faculty Hired. The number of new tenured/tenure-track faculty members hired to start their new positions in the academic year. New Tenured/Tenure-Track Faculty Hired as Percent of Total Tenured/Tenure-Track Faculty. Definition of 'New' Hires per IPEDS Definitions. Number of 'Newly hired' Tenured/Tenure-track faculty divided by Total Tenured/Tenure-track Faculty of an IPEDS reporting cycle. Change in Tenured/Tenure-Track Faculty. The difference in the number of tenured/tenure-track faculty from one Fall semester to the next. Includes faculty members who are on paid leave. Does not include individuals whose primary responsibility is administrative. For the 2015 PMS report, the difference will be between the figure for Fall 2014 and Fall 2013. Change in Faculty FTE. The difference in the total FTE, from one Fall semester to the next, for all full-time and
University of Masachusetts 2015 Performance Measurement System
41

UMASS AMHERST
part-time instructional faculty teaching state-supported courses. Includes faculty members who are on paid leave. Does not include individuals whose primary responsibility is administrative. For the 2015 PMS report, the difference will be between the figure for Fall 2014 and Fall 2013. Definition of Faculty FTE is per the Common Data Set, and includes all faculty teaching credit courses, including credit courses offered via Continuing Education. Percent Faculty-of-Color (based on Full-time Instructional Faculty). The proportion of full-time instructional faculty who are U.S. citizens or permanent residents and report their race/ethnicity to be one or more of the following: Hispanic/Latino, American Indian or Alaska Native, Asian, Black or African-American, Native Hawaiian or Other Pacific Islander, or Two or More Races. Race/ethnicity definition is based on IPEDS. Percent Women Faculty (based on Full-time Instructional Faculty). The proportion of full-time instructional faculty who identify themselves as female. Faculty Awards. Number of faculty with awards from a list of 24 prominent grant and fellowship programs in the arts, humanities, science, engineering and health fields (e.g., Fulbright American Scholars, Guggenheim Fellows, MacArthur Foundation Fellows, National Endowment for the Humanities Fellows, NSF Career Awards, Sloan Research Fellows). Data reported in The Top American Research Universities and were obtained from directories or web based listings. National Academy Members. Number of faculty with active or emeritus status who have been elected to membership in the National Academy of Sciences, the National Academy of Engineering, or the Institute of Medicine. Data reported in The Top American Research Universities.
ACCESS AND AFFORDABILITY INDICATORS
Percent (In-State) Pell Grant Recipients. Federal Pell Grants are awarded to low-income undergraduates based on their expected family contribution. Data as reported by campuses to the UMass President’s Office of in-state, full-time students with Pell Grants in the Financial Aid Template. Percent Need Met for In-State Students Awarded Need-Based Aid. The average percentage of demonstrated financial need that is met by the institution’s award of need-based financial aid to undergraduate students. Data as reported to the UMass President’s Office in the Financial Aid Template. Average Debt of Students for Graduating Class (UG). The average debt load is based on the total debt borrowed by an Institution's UG graduating class divided by the
number of students of that graduating class that carried any amount of debt. It does not include those students with no debt load. Data is from CDS. Percent Graduating Class (UG) with Debt. The total number of students in the UG graduating class that carried a debt load at the institution divided by the total number of graduating students in that institution. Data is from CDS. Percentage Undergraduates from Massachusetts. Percentage of total undergraduate students who currently reside in Massachusetts based on tuition residency and/or permanent address for continuing education students. Online Course Enrollments (Registrations). Enrollments or course registrations for the academic year for online credit courses. Academic year includes Summer, Fall, intersession, and Spring. These do not include hybrid courses, but fully online only offered via UMassOnline. Annual Growth in Online Course Enrollments (Registrations). Percentage rate of growth in enrollments or course registrations for the fiscal year for online credit courses. Fiscal year includes Summer, Fall, intersession, and Spring. These do not include hybrid courses, but fully online only offered via UMassOnline. STUDENT SUCCESS AND SATISFACTION INDICATORS Percent Undergraduates who are Students of Color. Undergraduates who are African American/Black, American Indian/Alaska Native, Asian, Hawaiian/Pacific Islander, More than One Race, or Hispanic/Latino divided by total U.S. citizens and permanent residents who report race/ethnicity. Due to recent changes in IPEDS race and ethnicity classifications, trend data on students of color should be viewed with caution. Percent Undergraduates who are First Generation in College. First-generation college students are defined as those students with neither parent having earned a bachelor’s degree. Data are reported on the Fall 2014 Common Application form required of all entering first year students who apply to UMass Amherst. Percent Undergraduates with English as a Second Language. Percentage of undergraduates whose first language was not English. Data are from the 2014 Common Application form. Percent Undergraduates who are International. Percentage of all undergraduates who are studying at the university on a student visa. International students include all eligible visa types as long as they are enrolled for a credit course; i.e., international students do not include U.S. citizens, U.S. permanent residents or refugees.
University of Masachusetts 2015 Performance Measurement System
42
UMASS AMHERST
Number of Students who Participated in a Study Abroad Program. Data are for the total number of students who participated in a credit bearing, study abroad program as reported on the Institute of International Education Open Doors survey for Fall 2013 through Summer 2014. Freshmen One-Year Retention Rate. Percent of first-time, full-time freshmen who entered in the previous Fall and were still enrolled at UMass Amherst as of the next Fall. Peer data as reported to IPEDS. Freshmen Four-Year Graduation Rate. Percent of first-time, full-time freshmen who entered in a given Fall term and who graduated within four years from UMass Amherst. Freshmen Six-Year Graduation Rate. Percent of first-time, full-time freshmen who entered in a given Fall and had graduated within six years from UMass Amherst. Peer data as reported to IPEDS. Transfer (Full-Time) One-Year Retention Rate. Percent of full-time transfer students at any level who entered in the prior Fall and were still enrolled at UMass Amherst or graduated as of the next Fall. Transfer (Upper-Division) Four-Year Graduation Rate. Percent of full-time upper division transfers (60+ credits) who entered in a given Fall and had graduated within four years from UMass Amherst. Student Achievement Measure (SAM Data – Bachelor’s Seeking Module). Report on first-time, full-time freshmen cohort based on data sent to National Student Clearinghouse and reported to the Student Achievement Measure project. Alumni Participation Rate. Average alumni giving rate: The average percentage of undergraduate alumni of record who donated money to the college or university. Alumni of record are former full- or part-time students who received an undergraduate degree and for whom the college or university has a current address. The alumni giving rate is calculated by dividing the number of alumni donors during a given academic year by the number of alumni of record for that same year. These two separate alumni giving rates are then averaged for the last two academic years. Graduates who earned only a graduate degree are excluded. Undergraduate alumni donors are alumni with undergraduate degrees from an institution who made one or more gifts for either current operations or capital expenses during the specified academic year. The percentage of alumni giving serves as a proxy for how satisfied students are with the school. A higher average alumni giving rate percentage scores better in the ranking model than a lower average alumni giving rate. Data is from US News and World Report.
SERVICE TO THE COMMONWEALTH INDICATORS
Percent of Incoming Class that are Transfers/Freshmen. The percent of an incoming degree-seeking undergraduate class that is entering freshmen vs. transfers.
Degree Completions. The number of degrees (not including certificates) awarded in the previous academic year, by degree level. As reported to IPEDS. Percent Alumni Who Remain in Massachusetts. Percentage of total alumni who currently reside in Massachusetts based on alumni records. Enrollment in Science, Technology, Engineering, and Mathematics (STEM) Programs. Unduplicated count of students enrolled in STEM programs. STEM programs are those fields of study defined in the National Science & Mathematics Access to Retain Talent (SMART) Grant with the exclusion of foreign languages. Enrollment count includes undergraduate, graduate and certificate students. Degrees and Certificates Awarded in STEM Fields. Number of undergraduate and graduate degrees awarded in STEM fields. STEM fields are those defined in the National Science & Mathematics Access to Retain Talent (SMART) Grant with the exclusion of foreign languages. Certificates data also included separately. Degrees and Certificates Awarded in Healthcare Fields. Health Care designation as defined by Campus IR; and based on CIP classification. All of CIP 51 and specific 6-digit CIPs unique to each campus. Certificates data also included separately. MTEL Science & Math Test-Takers. Total number of students who took the Massachusetts Tests for Educator Licensure (MTEL) subject tests in science and math fields.
FINANCIAL HEALTH INDICATORS
Endowment Assets and Annual Growth in Endowment. Annual growth in total UMass Amherst endowment balance. Endowment per Annualized Student FTE. Total UMass Amherst endowments per annualized FTE student, where FTE of peer institutions is standardized to UMass formula. Private Funds Raised Annually. Private funds raised includes restricted and unrestricted revenues from individuals, foundations, corporations and other organizations. Includes private grant revenues but not private contract revenues. Totals for each year include pledges made in that year as well as the value of in-kind contributions.
University of Masachusetts 2015 Performance Measurement System
43
UMASS AMHERST
Primary Reserve. Unrestricted net assets as a percentage of total operating expenditures. Peer data are from published financial statements. Debt Service to Operations. Debt service as a percentage of total operating expenditures. Peer data are from published financial statements. Deferred Maintenance per GSF. Deferred Maintenance per Gross Square Footage includes deferred and other maintenance dollars needed to maintain the current function of the campus, calculated by the “Sightlines” Return on Physical Assets methodology (ROPA sm) and shown per square foot of space. PEER INSTITUTIONS FOR UMASS AMHERST Indiana University-Bloomington *Iowa State University *Rutgers University System Stony Brook University *University of California-Santa Barbara *University of Colorado-Boulder *University of Connecticut System University of Delaware *University of Maryland-College Park University of Oregon *Financial Peer Please Note: Unless otherwise specified, all data are from the UMass Amherst Office of Institutional Research.
University of Masachusetts 2015 Performance Measurement System
44