Embed Size (px)
Citation preview
University of ZurichZurich Open Repository and Archive
Winterthurerstr. 190
CH-8057 Zurich
http://www.zora.uzh.ch
Year: 2009
Genetic structure of the high dispersal Atlanto-Mediterreaneansea star Astropecten aranciacus revealed by mitochondrial DNA
sequences and microsatellite loci
Zulliger, D E; Tanner, S; Ruch, M; Ribi, G
Zulliger, D E; Tanner, S; Ruch, M; Ribi, G (2009). Genetic structure of the high dispersal Atlanto-Mediterreaneansea star Astropecten aranciacus revealed by mitochondrial DNA sequences and microsatellite loci. Marine Biology,156(4):597-610.Postprint available at:http://www.zora.uzh.ch
Posted at the Zurich Open Repository and Archive, University of Zurich.http://www.zora.uzh.ch
Originally published at:Marine Biology 2009, 156(4):597-610.
Genetic structure of the high dispersal Atlanto-Mediterreaneansea star Astropecten aranciacus revealed by mitochondrial DNA
sequences and microsatellite loci
Abstract
To investigate the impact of potential marine barriers on gene-flow in high dispersal marineinvertebrates, we assessed the population genetic structure of the sea star Astropecten aranciacus.Samples were obtained from nine locations within the Atlantic and the Mediterranean Sea includingpopulations east of the Siculo-Tunisian Strait. We obtained both DNA sequence data of themitochondrial control region and genotype data at four microsatellite loci. Both markers were highlypolymorphic and showed a great level of genetic diversity. Genetic differentiation between populations(F (ST)) was in general low, particularly for nuclear data, as is often the case in high dispersal marineinvertebrates. Nevertheless, both marker sets indicated a significant genetic differentiation of thepopulation from the island of Madeira to most other populations. Our results also demonstrate a clearpattern of isolation-by-distance supported by both mitochondrial and nuclear markers. Therefore, weconclude that larval dispersal of A. aranciacus is somewhat limited even within the basins of theAtlantic, the west Mediterranean and the east Mediterranean. Microsatellite loci further revealed geneticdifferentiation between the three basins; however, it is not clear whether this is truly caused by marinebarriers. Genetic differentiation between basins might also be a result of isolation-by-distance allowingfor any grouping to be significant as long as geographical neighbors are clustered together. Althoughlevels of genetic differentiation were less pronounced in mirosatellite data, both datasets were coherentand revealed similar patterns of genetic structure in A. aranciacus.
1
Genetic structure of the high dispersal Atlanto-Mediterreanean sea star Astropecten
aranciacus revealed by mitochondrial DNA sequences and microsatellite loci
Deborah E. Zulliger, Samuel Tanner, Markus Ruch and Georg Ribi
Abstract
To investigate the impact of potential marine barriers on gene flow in high dispersal marine
invertebrates, we assessed the population genetic structure of the sea star Astropecten aranciacus. Samples
were obtained from nine locations within the Atlantic and the Mediterranean Sea including populations east
of the Siculo-Tunisian Strait. We obtained both DNA sequence data of the mitochondrial control region and
genotype data at four microsatellite loci. Both markers were highly polymorphic and showed a great level of
genetic diversity. Genetic differentiation between populations (FST) was in general low, particularly for
nuclear data, as is often the case in high dispersal marine invertebrates. Nevertheless, both marker sets
indicated a significant genetic differentiation of the population from the island of Madeira to most other
populations. Our results also demonstrate a clear pattern of isolation-by-distance supported by both
mitochondrial and nuclear markers. Therefore, we conclude that larval dispersal of A. aranciacus is
somewhat limited even within the basins of the Atlantic, the west Mediterranean and the east Mediterranean.
Microsatellite loci further revealed genetic differentiation between the three basins; however, it is not clear
whether this is truly caused by marine barriers. Genetic differentiation between basins might also be a result
of isolation-by-distance allowing for any grouping to be significant as long as geographical neighbors are
clustered together. Although levels of genetic differentiation were less pronounced in microsatellite data,
both datasets were coherent and revealed similar patterns of genetic structure in A. aranciacus.
2
Introduction
Marine species with extended planktonic larval stages have a high capacity for dispersal and as such are
expected to display less genetic structure than species without a long stage in the plankton (Palumbi and
Wilson 1990). Nevertheless, gene flow in marine species can be constrained by dispersal barriers, such as
narrow water passages between land masses, sharp salinity gradients or different types of currents e.g.,
circular currents (eddies) or downward currents. As marine barriers are not always easily identified, they
might lead to population structure even in high dispersal species (Quesada et al. 1995; Palumbi et al. 1997).
The role of the Atlantic-Mediterranean division as a potential barrier to gene flow has increasingly been
investigated for various planktotrophic invertebrate species (e.g., Borsa et al. 1997; Launey et al. 2002; Diaz-
Almela et al. 2004; Duran et al. 2004a; Stamatis et al. 2004, 2006; Saavedra and Pena 2005; Calderon et al.
2008). While the Strait of Gibraltar geographically divides the two basins, the Almería-Oran front is thought
to be a genetic separation area. This large-scale density front is formed by the convergence of two distinct
water masses in the east Alboran Sea, which is located in the westernmost region of the Mediterranean Sea
(Tintore et al. 1988). Other barriers to gene flow within the Mediterranean may also exist in the form of an
east–west divide at the Siculo-Tunisian Strait and/or hydrogeographic isolation of the Aegean, Ionian and
Adriatic Seas (Perez-Losada et al. 2007).
Many studies have used indirect genetic tools such as mitochondrial DNA (mtDNA), nuclear DNA or a
combination of the two to analyze genetic structure in high dispersal Atlanto-Mediterranean invertebrates
(e.g., Féral et al. 1995; Zane et al. 2000; Launey et al. 2002; Diaz-Almela et al. 2004; Duran et al. 2004a;
Roman and Palumbi 2004; Stamatis et al. 2004; Triantafyllidis et al. 2005; Peijnenburg et al. 2006; Calderon
et al. 2008). Differing conclusions regarding the influence of the Atlantic–Mediterranean division on
population structuring were drawn in these studies depending not only on the species investigated but also on
the genetic markers used and the sampling pattern. For instance, only moderate genetic differentiation was
revealed between Atlantic and Mediterranean populations of the sea urchin Paracentrotus lividus based on
mtDNA sequences (Duran et al. 2004a), whereas a sharp break was detected between the two basins when
combining mitochondrial and nuclear markers and applying a more extensive sampling (Calderon et al.
2008). Based on allozymes and 28S rRNA sequence data, a clear separation was also detected in the sea
urchin Echinocardium cordatum (Féral et al. 1995). Patarnello et al. (2007) discovered that even between
closely related taxa with comparable biologies the Atlanto-Mediterranean transition does not always induce a
congruent population genetic structure, which could be due to the differences in demographic history
between these species. Restriction fragment length polymorphism (RFLP) of mtDNA in the Norway lobster
Nephrops norvegicus, for example, showed no genetic differentiation between the Atlantic and the
Mediterranean (Stamatis et al. 2004). However, pronounced differentiation between Atlantic and
Mediterranean populations was detected in the closely related European lobster Homarus gammarus
(Triantafyllidis et al. 2005) using also RFLP of mtDNA. Two other crustaceans, the high dispersal green crab
3
Carcinus maenas (Roman and Palumbi 2004) and the pelagic Northern krill Megenyctiphanes norvegica
(Zane et al. 2000), again showed genetic differentiation between the basins based on mtDNA sequences.
Gene flow in marine species with long planktonic larval stages may be more restricted than generally
assumed. In such cases, random drift occurs locally, and genetic structure can develop in the form of
isolation-by-distance. This genetic pattern has been revealed in some high dispersal marine invertebrates,
such as in the European flat oyster Ostrea edulis using microsatellite loci and mtDNA sequence data
(Launey et al. 2002; Diaz-Almela et al. 2004) and in the pelagic crustacean Megenyctiphanes norvegica
(Zane et al. 2000) using mtDNA data only.
Here we present data from another high dispersal Atlanto-Mediterranean echinoderm: the sand star A.
aranciacus. A. aranciacus is a broadcast spawning sea star, which undergoes a long planktotrophic larval
stage. Due to its large body size of up to 60 cm in diameter and the potential for high population densities, it
is believed to be an important benthic predator (Burla et al. 1976). In the Mediterranean, this sea star was
once abundant (Burla et al. 1972). However, over the past 20 years a decline in populations of A. aranciacus
has been observed in several areas within the Mediterranean (G. Ribi unpublished; H. Lessios, H. Massé, H.
Moosleitner, L. Santella, personal communications). The present distribution of A. aranciacus includes the
Mediterranean Sea and the east Atlantic coast from northern Portugal to Angola, including the Canary
Islands, Cape Verde and Madeira (e.g., Koehler 1921; Tortonese 1980). This sea star usually lives in depths
of 1-100 m (Zavodnik 1960), but has been found at depths of up to 183 m (Hörstadius 1938). Migration of
adult sea stars is therefore bound to the continental shelf and does not tend to occur in any particular
direction (Pabst 1986); hence, adult movements are likely to be only a minor factor for dispersal. In southern
Portugal, A. aranciacus is still highly abundant (C. Almeida, personal communication). With a planktonic
larval stage of up to 60 days (Hörstadius 1938), A. aranciacus larvae can likely disperse up to 400 km
following the calculations of Shanks et al. (2003). This high potential for dispersal might allow populations
in the east Atlantic, such as for instance from southern Portugal, to replenish the Mediterranean populations
along the prevailing water exchange direction, if there are no barriers to larval dispersal between these two
basins.
While sea stars have been subject to several population genetic studies using mitochondrial and/or
nuclear markers (Hunt 1993; Williams 2000; Williams and Benzie 1997, 1998; Williams et al. 2002;
Matsuoka and Asano 2003; Waters et al. 2004; Waters and Roy 2004; Colgan et al. 2005; Harper and Hart
2005; Harley et al. 2006; Harper et al. 2007; Gerard et al. 2008), only one study was conducted in the
Atlanto-Mediterranean region (Baus et al. 2005). This study found high genetic structure between Atlantic
and Mediterranean populations of Asterina gibbosa, a sea star which is expected to have a low dispersal
capacity, as it lacks a planktotrophic larval stage. The present study investigates potential marine barriers to
gene flow in a high dispersal marine invertebrate by analyzing the population genetic structure of A.
aranciacus employing both mitochondrial and nuclear markers. The comparison of these two marker types
allows a more comprehensive investigation of genetic diversity, as markers of these two physically unlinked
genomes do not always show congruent patterns (e.g., Hansen et al. 1999; Lemaire et al. 2005; Costantini et
4
al. 2007). In this study, we sequenced the complete control region of the mitochondrial DNA, a region that
has the highest rate of evolutionary change of any mtDNA region (Aquadro and Greenberg 1983; Parsons et
al. 1997). As nuclear markers, we used four polymorphic microsatellite loci, which are believed to be neutral
and have been shown to be more variable compared to e.g., allozyme data (Shaw et al. 1999; Estoup et al.
1998; Perez-Losada et al. 2002).
Employing these methods we (1) investigate a possible genetic separation between A. aranciacus
populations of the Atlantic and the Mediterranean basin and between populations in the eastern and the
western Mediterranean; (2) test existing populations for isolation-by-distance versus panmixia within and/or
among the basins; and (3) determine the degree of correlation between genetic differentiation patterns
estimated from mtDNA sequence data and patterns resulting from microsatellite loci.
Materials and methods
Sampling and molecular methods
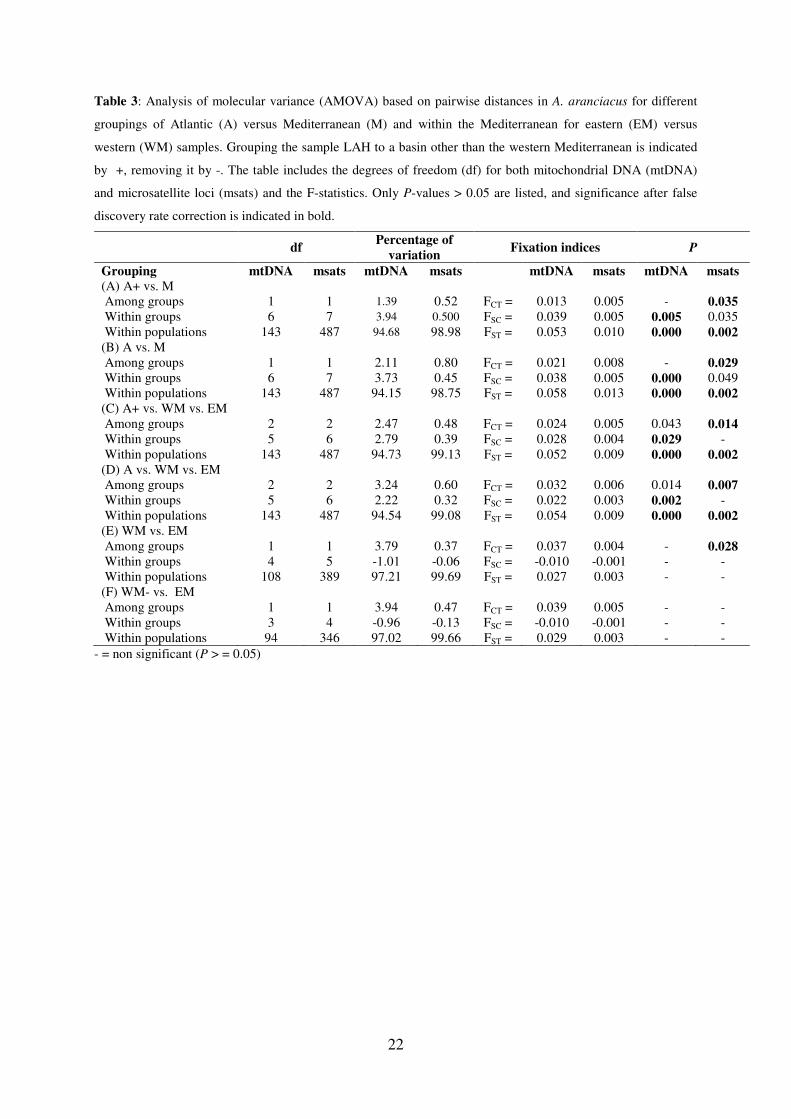
We sampled a total of 254 individuals from 9 locations within the Mediterranean Sea and the east
Atlantic as shown in Fig. 1. Specimens were obtained by scuba diving and from commercial trawl and gill
net operations within the years 2002 to 2006. Samples were preserved in 96% ethanol or in 80% ethanol
buffered with DMSO until processed. We extracted DNA of approximately 30 mg of arm tip tissue or tube
feet using a DNeasy Tissue Kit® (QIAGEN) following the manufacturer’s instructions for extraction of
animal tissue for a final volume of 400 µL. Extracted DNA was stored at -20°C.
We amplified fragments of the mitochondrial DNA (mtDNA) for 15-20 specimens per location
according to Table 1 using the forward primer E12Sa and the reverse primer E16Sb as described in Smith et
al. (1993). These primers amplify a fragment of approximately 1,200 base pairs (bp) in A. aranciacus and
contain part of the 16S ribosomal RNA region, the entire non-coding control region (CR), the tRNA-Thr/Glu
regions and part of the 12S ribosomal RNA region. DNA amplifications were performed in 30 µL -volume
reactions with 1.67 U Taq DNA Polymerase, 3 µL 10x PCR reaction buffer, 0.4 mM dNTPs, 0.2 µM of each
primer, 1 mM MgCl2 and 6 µL of DNA. The PCR protocol consisted of an initial denaturation step at 95°C
for 3 min, 40 amplification cycles (95°C for 30 s, 48°C for 30 s and 72°C for 1 min) and a final elongation
step at 72°C for 10 min performed in a Whatman Biometra T1 Thermocycler. We purified the PCR products
with the QIAquick® PCR Purification Kit (Qiagen) or NucleoSpin® Extract II (Macherey-Nagel AG,
Oensingen, Switzerland), following the supplier’s instructions. Forward and reverse sequencing using E12Sa
and E16Sb were carried out separately using BigDye® Terminator (PE-Applied Biosystems) chemistry. The
cycle-sequencing protocol consisted of an initial step at 96°C for 3 min and 24 sequencing cycles (96°C for
15 s, 50°C for 10 s and 60°C for 3 min). Cycle sequencing products were purified with a DyeEx™ 2.0 Spin
Kit (Qiagen) or a NucleoSeq® (Macherey-Nagel) Purification Kit and sequenced on an ABI 3730 DNA
5
Analyzer. Sequences were edited and aligned using the software SEQUENCHER™ 3.0 (Gene Codes
Corporation) and adjusted by eye.
We analyzed nuclear DNA variation for all samples at four polymorphic microsatellite loci (Aaran06,
Aaran09, Aaran2/05 and Aaran2/25) as previously characterized for A. aranciacus by Zulliger et al. (2008).
DNA amplifications, fragment analyses and scoring were performed as described by Zulliger et al. (2008).
Genetic diversity within populations
MtDNA haplotypic diversity h (Nei 1987) and nucleotide diversity π (Tajima 1983) were calculated
using ARLEQUIN version 3.11 (Excoffier et al. 2005). Moreover, we constructed a haplotype network using
the statistical parsimony procedure of Templeton et al. (1992) implemented in TCS version 1.21 (Clement et
al. 2000) with gaps coded as 5th character state and a 95% connection limit. To test for possible nucleotide
saturation, we obtained saturation plots using the program DAMBE (Data Analysis in Molecular Biology and
Evolution; Xia and Xie 2001).
Microsatellite allelic diversity (Na), allele frequencies and allelic richness corrected for differences in
samples size (RS; ElMousadik and Petit 1996) were determined per locus and per sampling location using the
software FSTAT version 2.9.3.2 (Goudet 1995). Further, we calculated observed (HO) and expected
heterozygosity (HE) in ARLEQUIN and tested for significant deviations from Hardy-Weinberg equilibrium
(HWE) as described in Guo and Thompson (1992) using 1,000,000 steps in the Markov chain and 50,000
dememorization steps. Tests for linkage disequilibrium were also performed in ARLEQUIN using a
likelihood-ratio test (Slatkin and Excoffier 1996) and 16,000 random permutated samples. To detect
microsatellite scoring errors, large allele dropout, occurrence of null alleles and estimates of null allele
frequency, we used the software MICRO-CHECKER version 2.2.1 (Van Oosterhout et al. 2004).
As the haplotype diversity (h) and the allelic richness (RS) were noticeably lower in Madeira (MAD) than
in the other locations, we performed a one-sample t test using the statistics software SPSS 14.0 to test for
statistical significance of this difference.
Bayesian clustering
STRUCTURE version 2.0 (Pritchard et al. 2000) was used to infer population genetic structure testing the
consistency with microsatellite genetic information. This Bayesian clustering method takes a sample of
genotypes and uses the assumption of HWE and linkage equilibrium within subpopulations to find the
number of populations (K) that fits the data best and the individual assignments that minimize Hardy-
Weinberg and linkage disequilibrium in those populations. 10 replicates of this analysis were performed with
K ranging from 1 to 12 for 1,000,000 generations (burn-in 100,000) and assuming an admixture model.
6
Genetic differentiation among populations
Population pairwise FST estimates (Weir and Cockerham 1984; Michalakis and Excoffier 1996) were
calculated using ARLEQUIN for mtDNA and microsatellite data applying 16,000 permutations and Kimura 2-
parameter corrected distances for mtDNA. Estimates of FST based on microsatellite data were also carried
out without locus Aaran2/25, as null alleles are likely to be present at this locus (see below). To test whether
FST using all four loci and FST without locus Aaran2/25 differed significantly, a paired sample t test was
performed with the statistics software SPSS. This test was not significant (P = 0.648, correlation = 0.948),
and thus, all further calculations based on FST were carried out using all four loci. For microsatellite data we
also calculated the standardized genetic differentiation measure as proposed by Hedrick (2005) which
accounts for the level of genetic variation. To calculate this measure, all alleles were recoded as being
population specific using the program RECODEDATA (Meirmans 2006).
We examined the partitioning of the total variance between various groups of samples in ARLEQUIN by
performing hierarchical analysis of molecular variance (AMOVA; Excoffier et al. 1992). Based on allelic
frequencies for microsatellite loci and applying Kimura 2-parameter corrected distances for mtDNA,
multilevel AMOVAs were performed to examine the proportion of genetic variance among the Atlantic and
Mediterranean basins and within the Mediterranean among the west and the east basins separated by the
Siculo-Tunisian strait (see Fig. 1). As the sampling location La Herradura (LAH) is located in the Alboran
Sea, west of the Almería-Oran front, AMOVAs were carried out both with LAH belonging to the Atlantic
and with LAH belonging to the west Mediterranean (16,000 permutations).
To estimate the effects of isolation-by-distance, we calculated the correlation between pairwise genetic
differentiation (FST) and geographic distance using the software IBD version 1.52 (Bohonak 2002). IBD uses
a Mantel-test to find relationships between genetic and geographic distance matrices. As proposed by
Rousset (1997) for a two-dimensional dispersal, we compared FST /(1 - FST) with the logarithm of the
geographic distance. Isolation-by-distance was tested for distances measured as the direct sea path between
sampling locations (10,000 randomizations). As pairwise genetic differentiation (FST) of Madeira (MAD) to
most other locations was significant, we performed a second analysis without this location to test whether the
correlation was an artefact caused by the high genetic differentiation to MAD.
Correlation between mtDNA and microsatellite FST
We determined the correlation between the two matrices of population pairwise genetic differentiation
(FST) resulting from mtDNA and microsatellite loci using a Mantel-test as applied in IBD (10,000
randomizations).
When multiple tests were performed, we corrected the level of significance according to the number of
tests in a given set applying the control of false discovery rate (FDR) method (Benjamini and Hochberg
1995) as suggested by Narum (2006).
7
Results
Genetic diversity within populations
We successfully amplified a 1,017 bp fragment of mtDNA containing the control region in 151
individuals across eight Atlantic and Mediterranean sampling locations (see Fig. 1, Table 1). All sequences
were deposited in GenBank under accession numbers EU450469–EU450582. The sample from Banyuls
(BAN) was not included in the mtDNA analyses, because it was not possible to amplify the desired fragment
of enough individuals from this location.
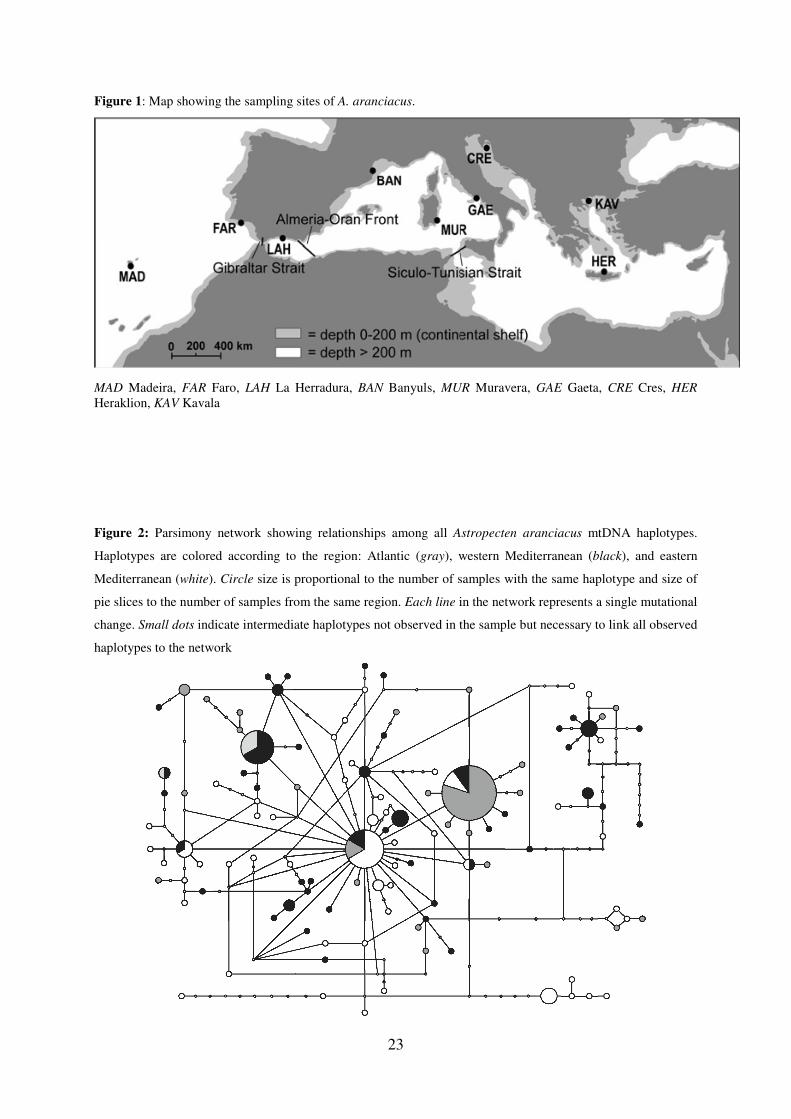
A total of 114 unique haplotypes were identified of which the two most common haplotypes (no. 1 and
72) were found in all three regions (see Appendix for absolute haplotype frequencies). We observed 96
polymorphic sites (9.4% variable sites), of which 12 contained gaps, and the number of nucleotide
substitutions between any pair of sequences ranged from 1 to 25. Mean haplotype diversity (h) equalled 0.99
with the highest h observed in the sample from Muravera (MUR; h = 1.00) and the lowest h in Madeira
(MAD; h = 0.84). A one-sample t test revealed a significantly lower h in MAD compared to other
populations (mean difference = 13.385; P < 0.001). Mean nucleotide diversity (π) was 0.0064, and no
evidence of nucleotide saturation was present in the saturation plot produced by DAMBE (results not shown).
One minimum spanning haplotype network with numerous ambiguous connections was obtained using
TCS (Fig. 2). A central haplotype could be identified in all three regions, and the most frequent haplotypes
were generally closely linked to each other.
For the majority of the individuals, all four microsatellite loci amplified successfully and were scored
unambiguously (Table 1). At loci Aaran06 and Aaran2/05 one individual each did not amplify, and at locus
Aaran2/25 amplifications for 13 individuals from five different sampling locations were not successful. All
loci were polymorphic at each sampling location, and allelic diversity (Na) within populations ranged from
three alleles in Aaran09 to 28 alleles in Aaran2/25 (Table 1). There was no evidence of scoring errors due to
stutter or large allele dropout. Observed (HO) and expected heterozygosity (HE) ranged from 0.429 to 0.933
and from 0.547 to 0.968, respectively. Except for locus Aaran2/25, none of the loci showed evidence of the
presence of null alleles. Deviations from Hardy-Weinberg equilibrium (HWE) were detected at locus
Aaran2/25 after correcting for multiple testing (initial α = 0.05, k = 4) for the samples Madeira (MAD), Faro
(FAR), La Herradura (LAH), Banyuls (BAN), Muravera (MUR), Kavala (KAV) and for all samples
combined. The presence of one or more null alleles at locus Aaran2/25 was indicated by an excess of
homozygotes over most size classes, detected by the program MICRO-CHECKER, and by the failure to
amplify this locus in several specimens. In contrast, a significant excess of heterozygotes was detected at
locus Aaran09 within the population MUR. Evidence of linkage disequilibrium between pairs of loci among
populations was only significant at Gaeta (GAE) for loci Aaran06 and Aaran2/25 (P = 0.005), while over all
populations no loci were significantly linked. Allelic richness adjusted for differences in sample size ranged
from 3.000 in MAD at Aran09 to 23.131 in KAV at Aaran2/25 (Table 1). Overall allelic richness as an
8
average of the four loci was the highest in Heraklion (HER) with 12.054 and the lowest in MAD with 8.975
(Table 1). A one-sample t test showed a significantly lower allelic richness in MAD compared to the other
locations (mean difference = 2.180; P < 0.001). Over all microsatellite loci, 18.7% of the alleles were
population specific, whereas the lowest percentage of population specific alleles equalled 15.2% at locus
Aaran2/25. The number of population specific alleles ranged from two at Aaran09 to seven at Aaran2/25 and
amounted to a total of 17 alleles over all loci.
Bayesian clustering
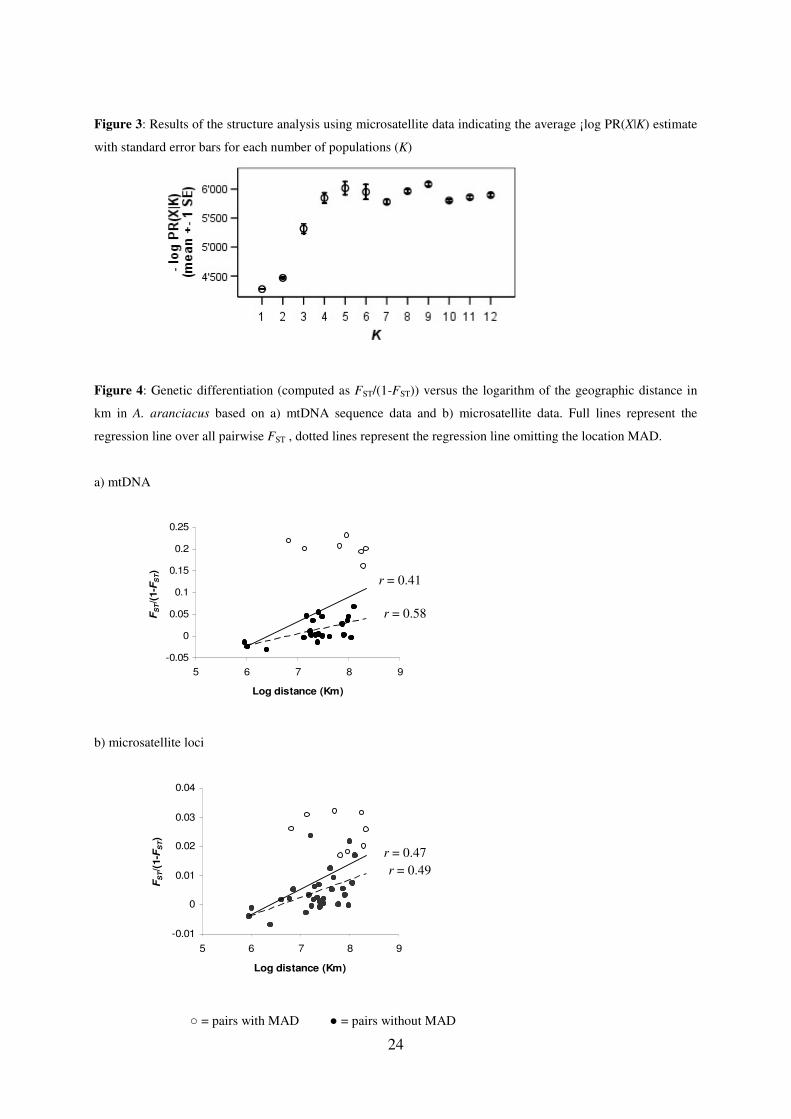
Structure analysis of microsatellite data failed to distinguish among the nine locations, as all ten runs
exhibited the best -log PR(X|K) estimates for K = 1 (lnL = -4273.5; Fig. 3). We repeated this analysis without
locus Aaran2/25, since this locus demonstrated deviation from HWE, however, the best -log PR(X|K)
estimates remained for K = 1 (5 runs; lnL = -2781.7; results not shown).
Genetic differentiation among populations
MtDNA pairwise FST ranged from 0 to 0.19 and provided evidence of a genetic subdivision between
MAD and all other locations (Table 2). Microsatellite loci revealed a similar genetic differentiation pattern,
but in addition to MAD, FST were also significant between FAR and several Mediterranean populations. FST
in microsatellites ranged from zero to 0.0312 and were on average 5.9-fold lower than in mtDNA (Table 2).
Nevertheless, a Mantel-test showed significant correlation between mitochondrial and microsatellite FST (r =
0.84; P = 0.0127). Standardized genetic differentiation in microsatellite data ranged from 0 to 0.15 and was
on average 1.5-fold lower than in mtDNA.
Analyses of molecular variance (AMOVA) revealed high levels of variation within populations for both
mtDNA and microsatellites ranging from 94.15 to 97.21% and from 98.75 to 99.69%, respectively (Table 3).
In mtDNA, variation among populations was the highest when comparing the west Mediterranean (without
LAH) versus the east Mediterranean populations (3.94%). However, none of the groupings showed
significant among group variation in mtDNA after correcting for multiple testing. In microsatellites, the
highest percentage of among group variation was achieved when clustering the Atlantic versus the
Mediterranean populations (0.8%; Table 3). Control of false discovery rate (FDR) left all groupings
significant, except for one (WMed without LAH vs. EMed).
Isolation-by-distance analysis by the nearest sea path resulted in a significant correlation of genetic
differentiation and geographic distance in both mtDNA (P = 0.0043; Fig. 4a) and microsatellite loci (P =
0.0023; Fig. 4b). Even when omitting the sample MAD from the analysis, this correlation remained
significant in both markers (PmtDNA = 0.0261; Pmsat = 0.0038). As shown in Fig. 4b, pairs with MAD (empty
dots) clearly have higher FST than could be expected by the geographic distance, as well as one outlier pair
with FAR and BAN (filled dot).
9
Discussion
In this study we used both mitochondrial and microsatellite markers to investigate the genetic structure
in a high dispersal echinoderm in the Atlanto-Mediterranean region. Our results showed that the
mitochondrial control region is highly variable and the four microsatellite loci Aaran06, Aaran09, Aaran2/05
and Aaran2/25 are also highly polymorphic in A. aranciacus. The comparison of these two markers allows
us to determine the population structure in this sea star in a comprehensive manner, as our mitochondrial and
nuclear data in general exhibit a congruent pattern of genetic differentiation.
Within population variability
While nucleotide diversity was low in mtDNA sequence data, haplotype diversity was high, indicating a
high degree of polymorphism in the mitochondrial control region. Other studies on echinoderms have
obtained similar results for sequences of the mitochondrial cytochrome c oxidase subregion I (COI) (e.g.,
McCartney et al. 2000; Uthicke and Benzie 2003; Duran et al. 2004a). In marine invertebrates with large
population sizes numerous haplotypes can be retained during periods of population growth or expansion
(Watterson 1984). A rapid population expansion could therefore lead to high haplotype and low nucleotide
diversity as new mutations are retained (Avise et al. 1984; Watterson 1984). In the present case, the results of
the parsimony network analysis for A. aranciacus seem to support this hypothesis. The network showed a
star-shaped pattern with a central haplotype and various alternative connections. The star-shape possibly
indicates a common ancestral haplotype (Templeton et al. 1995), supported by the occurrence of a central
haplotype in all three basins (Atlantic, western and eastern Mediterranean).
Microsatellite loci were also highly polymorphic and showed a high mean allelic richness per population
(Rs = 21.9), but only few alleles were population specific. The lowest percentage of population specific
alleles was found at locus Aaran2/25 (15.2%). Together with the high allelic richness at this locus, this could
be an indication of size homoplasy. According to Estoup et al. (2002), this would not necessarily be a
significant problem for many types of population genetic analyses. However, highly polymorphic loci due to
high mutation rates can lead to lower estimates of FST (Slatkin 1995), and high levels of heterozygosity may
reduce the relationship between statistical and biological significance (Hedrick 1999). As FST estimates with
and without locus Aaran2/25 showed no significant difference, we can assume that neither homoplasy nor
the presence of null alleles skew the results of this study. Moreover, multiallelic FST is based on a weighted
mean of the contribution to the overall variance of each allele considered separately (Weir and Cockerham
1984). It is therefore not likely to be biased by an invisible allele, which is expected to be randomly
associated with size scored alleles (Launey et al. 2002).
For some groups of invertebrates the proportion of microsatellite loci without null alleles is often low
(McGoldrick et al. 2000; Launey et al. 2002; Peijnenburg et al. 2006; Costantini et al. 2007). Possibly, this
could be due to a less effective DNA repair mechanism in the nuclear DNA of some invertebrates, especially
10
in echinoderms. Primers for amplification of microsatellite loci have been developed for several other
echinoderms, such as Acanthaster plancii (Yasuda et al. 2006), Amphipholis squamata and Echinocardium
cordatum (Chenuil et al. 2003), Strongylocentrotus spp. (Addison and Hart 2002), Parastichopus
californicus (Nelson et al. 2002), Apostichopus japonicus (Zhan et al. 2007), Tripneustes gratilla (Carlon
and Lippe 2007) and Evechinus chloroticus (Perrin and Roy 2000).
Haplotype and allelic diversity are significantly lower in the sample from Madeira (MAD) than in all
other samples, which could reflect either a founder event during the colonization of Atlantic islands or a
recent bottleneck. The population from MAD was most likely not closely linked to the coastal populations in
the past, as the island of Madeira emerged volcanically at the most 5 Mio years ago (Geldmacher and
Hoernle 2000). Lower allelic richness has also been found in populations of Crambe crambe in the Canaries
and Madeira archipelagos compared to Mediterranean populations (Duran et al. 2004b). Along with a
reduction of alleles, an excess of heterozygosity would be a sign of a recent bottleneck, as allele number
usually decreases faster than heterozygosity (Cornuet and Luikart 1996). We tested for a recent reduction in
population size applying the software BOTTLENECK version 1.2.02 (Cornuet and Luikart 1996), but could not
detect a bottleneck for MAD. Nevertheless, this possibility can not be completely ruled out, and additional
microsatellite loci would be necessary to gain more clarity. Furthermore, genetic patterns are similar both in
founder events and recent bottlenecks, and thus both possibilities still remain. Using mtDNA we performed a
mismatch distribution analysis and Tajima’s D test of selective neutrality (Tajima 1989) in ARLEQUIN to
explore the demographic past of A. aranciacus in Madeira. This test showed that the population in MAD has
undergone a recent population expansion, as it did not differ significantly from the sudden expansion model
by Rogers and Harpending (1992).
Spatial structure
While Bayesian clustering (STRUCTURE) of microsatellite data failed to detect any genetic structure in A.
aranciacus, pairwise genetic differentiation (FST) was significant mainly between MAD and all the other
samples. These results are not contradictory given the low estimates of FST in microsatellites and that
STRUCTURE tries to assign individuals to a population without any initial information about the true sampling
location. Mitochondrial and nuclear data in general showed congruent genetic differentiation patterns. The
significant genetic differentiation between MAD and the other populations revealed by mitochondrial and
microsatellite data can be explained by the remoteness of MAD to the other sites and possibly also by
currents which are unfavourable to movement from the shelf to Madeira and vice versa. The Portugal
current, which flows along the east Atlantic coast from northern Portugal southwards to northern Africa, is a
possible marine barrier to gene flow from the Mediterranean and east Atlantic coast to the island of Madeira.
Moreover, the Mediterranean out-flow tends to stratify in the Atlantic Ocean at a depth of 600–1,400 m due
to its greater density (Mougenot and Vanney 1982) and might impede larval dispersal to Madeira. On the
11
other hand, larvae dispersing from Madeira are prone to be directed southward along with the Canary
current, restricting gene flow to the east Atlantic coast and the Mediterranean.
Although highly correlated, FST (θ) were several times higher in mitochondrial than in nuclear markers.
The average cytoplasmic/nuclear ratio (θC/ θN) equalled 5.9. Similar results have been found in several other
studies comparing mtDNA and microsatellite data (e.g., Shaw et al. 1999; Krafsur 2002; Diaz-Almela et al.
2004; Lemaire et al. 2005; Peijnenburg et al. 2006). As the effective mitochondrial population size (Ne) is
expected to be four times smaller than the nuclear Ne, assuming both 1:1 sex ratios and diploidy (Birky et al.
1983), there is a higher potential for genetic drift in mtDNA, which leads to a higher θ. Ratios significantly
higher than fourfold can be caused by sex bias in migration, reproduction or population size or by a
difference in the mutation rate of the two markers (Turan et al. 1998; Shaw et al. 1999). The average θC/ θN
ratio in A. aranciacus is slightly higher than fourfold, for which the mentioned possibilities of sex bias or
differences in mutation rates, combined or separately, could be partly responsible. A sex bias in migration
though is an improbable factor, given the non-migratory behaviour of A. aranciacus. The standardized
measure of genetic differentiation for microsatellite data (Table 2) is almost comparable to FST in mtDNA
and shows that low values of FST in microsatellite loci are mostly due to the high polymorphism in these
markers.
Mitochondrial data failed to indicate any significant among group variation for any of the groups formed
for the analysis of molecular variance (AMOVA) after correcting for multiple testing. In microsatellite loci,
however, significant among group variation was found for all groupings except for one, indicating some
differentiation between the basins. Since the Atlantic versus Mediterranean differentiation might be skewed
by the sample from Madeira (MAD), further sampling along the east Atlantic coast, e.g., North Africa, is
needed in order to clarify whether there is a true genetic differentiation between these two basins, or if the
pattern observed here is limited to offshore islands. As for the Mediterranean, our data suggest significant
among group variation between populations of A. aranciacus in the west and the east Mediterranean basins.
A similar differentiation between eastern (Adriatic) and western Mediterranean populations has been found
in other high dispersal marine species, such as the chaetognath Sagitta setosa (Peijnenburg et al. 2006) and
the bivalve Cerastoderma glaucum (Mariani et al. 2002). Although AMOVA indicate some genetic
differentiation between basins in populations of A. aranciacus, this variation could be connected to the clear
isolation-by-distance pattern found in A. aranciacus, as grouping populations by basin includes a strong
geographical component. This hypothesis deserves further consideration, as in most cases significance of
among group variation did not depend on whether LAH was assigned to the Mediterranean or to the Atlantic
group.
Analyses of isolation-by-distance (IBD) were significant in both mtDNA and microsatellite data
regardless of whether MAD was included in the analysis or not. We can therefore rule out a possible artefact
caused by MAD, which showed a significant genetic differentiation (FST) to most other populations.
However, pairwise FST comparisons between MAD and the other study sites are much higher than expected
from the regression line resulting from IBD analyses (see Fig. 4). In fact, FST values between MAD and the
12
other populations are about five times higher in mtDNA and twice as high in microsatellites. Besides the
large geographic distance, other isolation mechanisms must therefore be acting on the population of MAD,
such as the unfavourable current regime discussed above. Why the pair FAR-BAN also exhibits such a high
FST in microsatellites still needs to be further investigated by either obtaining comparable mtDNA data from
BAN or by sampling other populations of the west coast of the Mediterranean. Isolation-by-distance patterns
have been detected in other Atlanto-Mediterranean invertebrates (Zane et al. 2000; Launey et al. 2002; Diaz-
Almela et al. 2004) but not yet in high dispersal echinoderms. In contrast to our results, genetic
investigations on the high dispersal sea urchin Paracentrotus lividus (Duran et al. 2004a) suggested panmixia
within the Mediterranean and within the east Atlantic basin. This discrepancy is most likely due to the
sampling scheme, as the presented study included populations in the eastern Mediterranean while the
sampling by Duran et al. (2004a) was limited to the west coast of the western Mediterranean. While
mitochondrial and nuclear datasets reveal similar levels of significant genetic differentiation between
samples, and both support an isolation-by-distance pattern, mtDNA showed higher population differentiation
(FST) than microsatellite loci. However, when accounting for the high polymorphism in nuclear markers
using the standardized genetic differentiation measure, this difference was less pronounced. On the other
hand, microsatellite loci were more sensitive in detecting genetic differentiation between groupings by basins
(AMOVA).
Conclusions
Our results indicate that while genetic differentiation may be mostly absent in A. aranciacus, the
dispersal of marine invertebrates with extended planktonic larval stages could be more restricted than is often
assumed. In contrast to previous studies on echinoderms suggesting panmixia in the Atlantic and
Mediterranean basin, our data revealed a pattern of isolation-by-distance in A. aranciacus over the sampled
area. Microsatellite data further detected some differentiation of Atlantic versus Mediterranean and western
versus eastern Mediterranean populations of A. aranciacus. Nevertheless, our data did not allow to identify
specific marine barriers, such as the Strait of Gibraltar, the Almería-Oran front or the Siculo-Tunisia Strait,
as isolation-by-distance might be sufficient to explain the majority of the genetic differences found here.
Further sampling, particularly along the Atlantic coast, is necessary to gain more clarity on this matter. The
present study highlights how the comparison of mitochondrial and microsatellite markers can provide a more
complete picture of genetic differentiation, allowing for more comprehensive data analyses and
interpretation.
13
Acknowledgments
We thank Luigia Santella, Teresa Cerveira Borges and the BIOPESCAS team (CCMAR, University of
Algarve), Paulo Morais, Martin von Arx, Heinz Maag and Till Danckwart for providing specimens from
Gaeta, Naples, Faro, Banyuls, Muravera and Cres. Santi Diliberto and Susanna Tassis enabled further
sampling in Greece. Thomas Bucher, Andy Pemberton, Heinz Maag and Marco Bernasconi all provided lab
and technical support. We are grateful for the assistance with data analyses that we received from Peter
Wandeler, Tony Wilson and Rob Toonen and for helpful suggestions from anonymous reviewers. This
project was funded in part by the Swiss National Science Foundation.
References
Addison JA, Hart MW (2002) Characterization of microsatellite loci in sea urchins (Strongylocentrotus
spp.). Mol Ecol Notes 493–494. doi:10.1046/j.1471-8286.2002.00295.x.
Aquadro CF, Greenberg BD (1983) Human mitochondrial-DNA variation and evolution-analysis of
nucleotide-sequences from 7 individuals. Genetics 103:287–312.
Avise JC, Neigel JE, Arnold J (1984) Demographic influences on mitochondrial-DNA lineage survivorship
in animal populations. J Mol Evol 20: 99–105. doi:10.1007/BF02257369.
Baus E, Darrock DJ, Bruford MW (2005) Gene flow patterns in Atlantic and Mediterranean populations of
the Lusitanian sea star Asterina gibbosa. Mol Ecol 14: 3373–3382. doi:
10.1111/j.1365294X.2005.02681.x.
Benjamini Y, Hochberg Y (1995) Controlling the false discovery rate - a practical and powerful approach to
multiple testing. J R Stat Soc B Methodol 57: 289–300.
Birky CW, Maruyama T, Fuerst P (1983) An approach to population and evolutionary genetic theory for
genes in mitochondria and chloroplasts, and some results. Genetics 103: 513–527.
Bohonak AJ (2002) IBD (isolation by distance): a program for analyses of isolation by distance. J Hered 93:
153–154. doi:10.1093/jhered/93.2.153.
Borsa P, Blanquer A, Berrebi P (1997) Zoogéographie intraspécifique de la mer Méditerranée. Analyse des
données génétiques populationnelles sur seize espèces atlanto-méditerranéennes (Poissons et
Invertèbres). Vie Milieu 47: 95–305.
Burla H, Pabst B, Stahel W (1976) Environmental-conditions affecting occurrence of Astropecten-
Aranciacus (Asteroidea, Echinodermata). Helgol Wiss Meeresunters 28: 167–182. doi:
10.1007/BF01610351.
Burla H, Ribi G, Ferlin V, Pabst B (1972) Notes on ecology of Astropecten-Aranciacus. Mar Biol (Berl) 14:
235.
14
Calderon I, Giribet G, Turon X (2008) Two markers and one history: phylogeography of the edible common
sea urchin Paracentrotus lividus in the Lusitanian region. Mar Biol (Berl) 154: 137–151. doi:
10.1007/s00227-008-0908-0.
Carlon DB, Lippe C (2007) Eleven new microsatellite markers for the tropical sea urchin Tripneustes
gratilla and cross-amplification in Tripneustes ventricosa. Mol Ecol Notes 7: 1002–1004. doi:
10.1111/j.1471-8286.2007.01755.x.
Chenuil A, Le Gac M, Thierry M (2003) Fast isolation of microsatellite loci of very diverse repeat motifs by
library enrichment in echinoderm species, Amphipholis squamata and Echinocardium cordatum. Mol
Ecol Notes 3: 324–327. doi: 10.1046/j.1471-8286.2003.00434.x.
Clement M, Posada D, Crandall KA (2000) TCS: a computer program to estimate gene genealogies. Mol
Ecol 9: 1657–1659. doi: 10.1046/j.1365-294x.2000.01020.x.
Colgan DJ, Byrne M, Rickard E, Castro LR (2005) Limited nucleotide divergence over large spatial scales in
the asterinid sea star Patiriella exigua. Mar Biol (Berl) 146: 263–270. doi: 10.1007/s00227-004-1415-
6.
Cornuet JM, Luikart G (1996) Description and power analysis of two tests for detecting recent population
bottlenecks from allele frequency data. Genetics 144: 2001–2014.
Costantini F, Fauvelot C, Abbiati M (2007) Genetic structuring of the temperate gorgonian coral (Corallium
rubrum) across the western Mediterranean Sea revealed by microsatellites and nuclear sequences. Mol
Ecol 16: 5168–5182.
Diaz-Almela E, Boudry P, Launey S, Bonhomme F, Lapegue S (2004) Reduced female gene flow in the
European Xat oyster Ostrea edulis. J Hered 95: 510–516. doi:10.1093/jhered/esh073.
Duran S, Palacin C, Becerro MA, Turon X, Giribet G (2004a) Genetic diversity and population structure of
the commercially harvested sea urchin Paracentrotus lividus (Echinodermata, Echinoidea). Mol Ecol
13: 3317–3328. doi: 10.1111/j.1365-294X.2004.02338.x.
Duran S, Pascual M, Estoup A, Turon X (2004b) Strong population structure in the marine sponge Crambe
crambe (Poecilosclerida) as revealed by microsatellite markers. Mol Ecol 13: 511–522. doi:
10.1046/j.1365-294X.2004.2080.x.
ElMousadik A, Petit RJ (1996) High level of genetic differentiation for allelic richness among populations of
the argan tree Argania spinosa (L) Skeels endemic to Morocco. Theor Appl Genet 92: 832–839. doi:
10.1007/BF00221895.
Estoup A, Rousset F, Michalakis Y, Cornuet JM, Adriamanga M, Guyomard R (1998) Comparative analysis
of microsatellite and allozyme markers: a case study investigating microgeographic differentiation in
brown trout (Salmo trutta). Mol Ecol 7: 339–353. doi:10.1046/j.1365-294X.1998.00362.x.
Estoup A, Jarne P, Cornuet JM (2002) Homoplasy and mutation model at microsatellite loci and their
consequences for population genetics analysis. Mol Ecol 11: 1591–1604. doi: 10.1046/j.1365-
294X.2002.01576.x.
15
Excoffier L, Laval G, Schneider S (2005) ARLEQUIN (version 3.0): an integrated software package for
population genetic data analysis. Bioinformatics Online 1: 47–50.
Excoffier L, Smouse PE, Quattro JM (1992) Analysis of molecular variance inferred from metric distances
among DNA haplotypes-application to human mitochondrial-DNA restriction data. Genetics 131: 479–
491.
Féral J-P, Poulin E, Derelle E, Gallardo S, Chambon C (1995) Genetic differentiation of Echinocardium
chordatum as revealed by allozymes and RNA sequencing. In: Emson R, Smith A, Campbell A (eds)
Echinoderm research 1995. Balkema, Rotterdam, pp 41–42.
Geldmacher J, Hoernle K (2000) The 72 Ma geochemical evolution of the Madeira hotspot (eastern North
Atlantic): recycling of Palaeozoic (≤500 Ma) oceanic lithosphere. Earth Planet Sci Lett 183: 73–92.
doi: 10.1016/S0012-821X(00)00266-1.
Gerard K, Roby C, Chevalier N, Thomassin B, Chenuil A, Feral JP (2008) Assessment of three
mitochondrial loci variability for the crown-of-thorns starfish: a first insight into Acanthaster
phylogeography. C R Biol 331: 137–143. doi: 10.1016/j.crvi.2007.11.005.
Goudet J (1995) FSTAT (Version 1.2): a computer program to calculate F-statistics. J Hered 86: 485–486.
Guo SW, Thompson EA (1992) Performing the exact test of Hardy-Weinberg proportion for multiple alleles.
Biometrics 48: 361–372. doi: 10.2307/2532296.
Hansen MM, Mensberg KLD, Berg S (1999) Postglacial recolonization patterns and genetic relationships
among whitefish (Coregonus sp.) populations in Denmark, inferred from mitochondrial DNA and
microsatellite markers. Mol Ecol 8: 239–252. doi: 10.1046/j.1365-294X.1999.00557.x.
Harley CDG, Pankey MS, Wares JP, Grosberg RK, Wonham MJ (2006) Color polymorphism and genetic
structure in the sea star Pisaster ochraceus. Biol Bull 211: 248–262. doi: 10.2307/4134547.
Harper FM, Addison JA, Hart MW (2007) Introgression versus immigration in hybridizing high-dispersal
echinoderms. Evolution 61: 2410–2418. doi: 10.1111/j.1558-5646.2007.00200.x.
Harper FM, Hart MW (2005) Gamete compatibility and sperm competition affect paternity and hybridization
between sympatric Asterias sea stars. Biol Bull 209: 113–126. doi: 10.2307/3593129.
Hedrick PW (1999) Perspective: highly variable loci and their interpretation in evolution and conservation.
Evolution 53: 313–318. doi: 10.2307/2640768.
Hedrick PW (2005) A standardized genetic differentiation measure. Evolution 59: 1633–1638.
Hörstadius S (1938) Über die Entwicklung von Astropecten aranciacus L. Pubbl Stn Zool Napoli 17: 221–
312.
Hunt A (1993) Effects of contrasting patterns of larval dispersal on the Genetic connectedness of local-
populations of 2 intertidal star-fish, Patiriella-Calcar and P-Exigua. Mar Ecol Prog Ser 92: 179–186.
doi: 10.3354/meps092179.
Koehler R (1921) Echinodermes. Faune de France, Lechevalier, Paris, pp 1–210.
16
Krafsur ES (2002) Population structure of the tsetse fly Glossina pallidipes estimated by allozyme,
microsatellite and mitochondrial gene diversities. Insect Mol Biol 11: 37–45. doi: 10.1046/j.0962-
1075.2001.00307.x.
Launey S, Ledu C, Boudry P, Bonhomme F, Naciri-Graven Y (2002) Geographic structure in the European
flat oyster (Ostrea edulis L.) as revealed by microsatellite polymorphism. J Hered 93: 331–338. doi:
10.1093/jhered/93.5.331.
Lemaire C, Versini JJ, Bonhomme F (2005) Maintenance of genetic differentiation across a transition zone
in the sea: discordance between nuclear and cytoplasmic markers. J Evol Biol 18: 70–80. doi:
10.1111/j.1420-9101.2004.00828.x.
Mariani S, Ketmaier V, de Matthaeis E (2002) Genetic structuring and gene flow in Cerastoderma glaucum
(Bivalvia : Cardiidae): evidence from allozyme variation at different geographic scales. Mar Biol
(Berl) 140: 687–697. doi: 10.1007/s00227-001-0753-x.
Matsuoka N, Asano H (2003) Genetic variation in northern Japanese populations of the starfish Asterina
pectinifera. Zool Sci 20: 985–988. doi: 10.2108/zsj.20.985.
McCartney MA, Keller G, Lessios HA (2000) Dispersal barriers in tropical oceans and speciation in Atlantic
and eastern Pacific sea urchins of the genus Echinometra. Mol Ecol 9: 1391–1400. doi:
10.1046/j.1365-294x.2000.01022.x.
McGoldrick DJ, Hedgecock D, English LJ, Baoprasertkul P, Ward RD (2000) The transmission of
microsatellite alleles in Australian and North American stocks of the Pacific oyster (Crassostrea
gigas): selection and null alleles. J Shellfish Res 19: 779–788.
Meirmans PG (2006) Using the AMOVA framework to estimate a standardized genetic differentiation
measure. Evolution 60: 2399–2402.
Michalakis Y, Excoffier L (1996) A generic estimation of population subdivision using distances between
alleles with special reference for microsatellite loci. Genetics 142:1061–1064.
Mougenot D, Vanney J-R (1982) The Plio-Quarternary sediment drifts of the south Portuguese continental
slope. Bull Inst Geologie Bassin Aquitaine 31: 131–139.
Narum SR (2006) Beyond Bonferroni: less conservative analyses for conservation genetics. Conserv Genet
7: 783–787. doi: 10.1007/s10592-005-9056-y.
Nei M (1987) Molecular evolutionary genetics. Colombia University Press, New York
Nelson RJ, Cooper G, Garner T, Schnupf P (2002) Polymorphic markers for the sea cucumber Parastichopus
californicus. Mol Ecol Notes 2: 233–235. doi: 10.1046/j.1471-8286.2002.00205.x.
Pabst B (1986) Eigenschaften der Dislokation bei drei Seesternarten der Gattung Astropecten. Inaugural-
Dissertation, Universität Zürich.
Palumbi SR, Grabowsky G, Duda T, Geyer L, Tachino N (1997) Speciation and population genetic structure
in tropical Pacific Sea urchins. Evolution 51: 1506–1517. doi: 10.2307/2411203.
Palumbi SR, Wilson AC (1990) Mitochondrial-DNA diversity in the Sea-Urchins Strongylocentrotus-
Purpuratus and Strongylocentrotus-Droebachie. Evolution 44: 403–415. doi: 10.2307/2409417.
17
Parsons TJ, Muniec DS, Sullivan K, Woodyatt N, AllistonGreiner R, Wilson MR, Berry DL, Holland KA,
Weedn VW, Gill P, Holland MM (1997) A high observed substitution rate in the human mitochondrial
DNA control region. Nat Genet 15: 363–368. doi: 10.1038/ng0497-363.
Patarnello T, Volckaert F, Castilho R (2007) Pillars of Hercules: is the Atlantic–Mediterranean transition a
phylogeographical break? Mol Ecol 16: 4426–4444. doi: 10.1111/j.1365-294X.2007.03477.x.
Peijnenburg K, Fauvelot C, Breeuwer AJ, Menken SBJ (2006) Spatial and temporal genetic structure of the
planktonic Sagitta setosa (Chaetognatha) in European seas as revealed by mitochondrial and nuclear
DNA markers. Mol Ecol 15: 3319–3338. doi: 10.1111/ j.1365-294X.2006.03002.x.
Perez-Losada M, Guerra A, Carvalho GR, Sanjuan A, Shaw PW (2002) Extensive population subdivision of
the cuttlefish Sepia offcinalis (Mollusca : Cephalopoda) around the Iberian Peninsula indicated by
microsatellite DNA variation. Heredity 89: 417–424. doi: 10.1038/sj.hdy.6800160.
Perez-Losada M, Nolte MJ, Crandall KA, Shaw PW (2007) Testing hypotheses of population structuring in
the Northeast Atlantic ocean and Mediterranean sea using the common cuttlefish Sepia officinalis. Mol
Ecol 16: 2667–2679. doi: 10.1111/j.1365-294X.2007.03333.x.
Perrin C, Roy MS (2000) Rapid and efficient identification of microsatellite loci from the sea urchin,
Evechinus chloroticus. Mol Ecol 9: 2221–2223. doi: 10.1046/j.1365-294X.2000.105335.x.
Pritchard JK, Stephens M, Donnelly P (2000) Inference of population structure using multilocus genotype
data. Genetics 155: 945–959.
Quesada H, Zapata C, Alvarez G (1995) A multilocus allozyme discontinuity in the mussel Mytilus-
Galloprovincialis—the interaction of ecological and life-history factors. Mar Ecol Prog Ser 116: 99–
115. doi: 10.3354/meps116099.
Rogers AR, Harpending H (1992) Population-growth makes waves in the distribution of pairwise genetic-
differences. Mol Biol Evol 9: 552–569.
Roman J, Palumbi SR (2004) A global invader at home: population structure of the green crab, Carcinus
maenas, in Europe. Mol Ecol 13: 2891–2898. doi: 10.1111/j.1365-294X.2004.02255.x.
Rousset F (1997) Genetic differentiation and estimation of gene flow from F-statistics under isolation by
distance. Genetics 145: 1219–1228.
Saavedra C, Pena JB (2005) Nucleotide diversity and Pleistocene population expansion in Atlantic and
Mediterranean scallops (Pecten maximus and P. jacobaeus) as revealed by the mitochondrial 16S
ribosomal RNA gene. J Exp Mar Biol Ecol 323: 138–150. doi: 10.1016/j.jembe.2005.03.006.
Shanks AL, Grantham BA, Carr MH (2003) Propagule dispersal distance and the size and spacing of marine
reserves. Ecol Appl 13: S159–S169.
Shaw PW, Pierce GJ, Boyle PR (1999) Subtle population structuring within a highly vagile marine
invertebrate, the veined squid Loligo forbesi, demonstrated with microsatellite DNA markers. Mol
Ecol 8: 407–417. doi: 10.1046/j.1365-294X.1999.00588.x.
Slatkin M (1995) A measure of population subdivision based on microsatellite allele frequencies. Genetics
139: 1463.
18
Slatkin M, Excoffier L (1996) Testing for linkage disequilibrium in genotypic data using the expectation–
maximization algorithm. Heredity 76: 377–383. doi: 10.1038/hdy.1996.55.
Smith MJ, Arndt A, Gorski S, Fajber E (1993) The phylogeny of echinoderm classes based on mitochondrial
gene arrangements. J Mol Evol 36: 545–554. doi: 10.1007/BF00556359.
Stamatis C, Triantafyllidis A, Moutou KA, Mamuris Z (2004) Mitochondrial DNA variation in northeast
Atlantic and Mediterranean populations of Norway lobster, Nephrops norvegicus. Mol Ecol 13: 1377–
1390. doi: 10.1111/j.1365-294X.2004.02165.x.
Stamatis C, Triantafyllidis A, Moutou KA, Mamuris Z (2006) Allozymic variation in Northeast Atlantic and
Mediterranean populations of Norway lobster, Nephrops norvegicus. Mark Sci 63: 875–882. doi:
10.1016/j.icesjms.2006.01.006.
Tajima F (1983) Evolutionary relationship of DNA-sequences in finite populations. Genetics 105: 437–460.
Tajima F (1989) Statistical method for testing the neutral mutation hypothesis by DNA polymorphism.
Genetics 123: 585–595.
Templeton AR, Crandall KA, Sing CF (1992) A cladistic analysis of phenotypic associations with
haplotypes inferred from restriction endonuclease mapping and DNA-sequence data. 3. Cladogram
estimation. Genetics 132: 619–633.
Templeton AR, Routman E, Phillips CA (1995) Separating population structure from population history—a
cladistic-analysis of the geographical-distribution of mitochondrial-DNA haplotypes in the Tiger
Salamander, Ambystoma-Tigrinum. Genetics 140: 767–782.
Tintore J, Laviolette PE, Blade I, Cruzado A (1988) A study of an intense density front in the Eastern
Alboran-Sea–the Almeria-Oran Front. J Phys Oceanogr 18: 1384–1397.
Tortonese E (1980) Apérçu sommaire sur les asteroidea de la Méditerrannée (histoire, distribution,
systematique). Journées d’études sur la systématique évolutive et la biogéographie en Méditerranée,
Cagliari, pp 11–19.
Triantafyllidis A, Apostolidis AP, Katsares V, Kelly E, Mercer J, Hughes M, Jorstad K, Tsolou A, Hynes R,
Triantaphyllidis C (2005) Mitochondrial DNA variation in the European lobster (Homarus gammarus)
throughout the range. Mar Biol (Berl) 146: 223–235. doi: 10.1007/s00227-004-1435-2.
Turan C, Carvalho GR, Mork J (1998) Molecular genetic analysis of Atlanto-Scandian herring (Clupea
harengus) populations using allozymes and mitochondrial DNA markers. J Mar Biol Assoc UK 78:
269–283.
Uthicke S, Benzie JAH (2003) Gene flow and population history in high dispersal marine invertebrates:
mitochondrial DNA analysis of Holothuria nobilis (Echinodermata : Holothuroidea) populations from
the Indo-Pacific. Mol Ecol 12: 2635–2648. doi: 10.1046/j.1365-294X.2003.01954.x.
Van Oosterhout C, Hutchinson WF, Wills DPM, Shipley P (2004) MICRO-CHECKER: software for
identifying and correcting genotyping errors in microsatellite data. Mol Ecol Notes 4: 535–538. doi:
10.1111/j.1471-8286.2004.00684.x.
19
Waters JM, O’Loughlin PM, Roy MS (2004) Cladogenesis in a starfish species complex from southern
Australia: evidence for vicariant speciation? Mol Phylogenet Evol 32: 236–245. doi:
10.1016/j.ympev.2003.11.014.
Waters JM, Roy MS (2004) Phylogeography of a high-dispersal New Zealand sea-star: does upwelling block
gene flow? Mol Ecol 13: 2797–2806. doi: 10.1111/j.1365-294X.2004.02282.x.
Watterson GA (1984) Allele frequencies after a Bottleneck. Theor Popul Biol 26: 387–407. doi:
10.1016/0040-5809(84)90042-X.
Weir BS, Cockerham CC (1984) Estimating F-statistics for the analysis of population-structure. Evolution
Int J Org Evolution 38: 1358–1370. doi: 10.2307/2408641.
Williams ST (2000) Species boundaries in the starfish genus Linckia. Mar Biol (Berl) 136: 137–148. doi:
10.1007/s002270050016.
Williams ST, Benzie JAH (1997) Indo-West Pacific patterns of genetic differentiation in the high-dispersal
starfish Linckia laevigata. Mol Ecol 6: 559–573. doi: 10.1046/j.1365-294X.1997.00221.x.
Williams ST, Benzie JAH (1998) Evidence of a biogeographic break between populations of a high dispersal
starfish: congruent regions within the Indo-West Pacific defined by color morphs, mtDNA, and
allozyme data. Evolution 52: 87–99. doi: 10.2307/2410923.
Williams ST, Jara J, Gomez E, Knowlton N (2002) The marine Indo-West Pacific break: contrasting the
resolving power of mitochondrial and nuclear genes. Integr Comp Biol 42: 941–952. doi:
10.1093/icb/42.5.941.
Xia X, Xie Z (2001) DAMBE: Software package for data analysis in molecular biology and evolution. J
Hered 92: 371–373. doi: 10.1093/jhered/92.4.371.
Yasuda N, Nagai S, Hamaguchi M, Lian CL, Nadaoka K (2006) Development of microsatellite markers for
the crown-of-thorns starfish Acanthaster planci. Mol Ecol Notes 6: 141–143. doi: 10.1111/j.1471-
8286.2005.01168.x.
Zane L, Ostellari L, Maccatrozzo L, Bargelloni L, Cuzin-Roudy J, Buchholz F, Patarnello T (2000) Genetic
differentiation in a pelagic crustacean (Meganyctiphanes norvegica : Euphausiacea) from the North
East Atlantic and the Mediterranean Sea. Mar Biol (Berl) 136: 191–199. doi: 10.1007/s002270050676.
Zavodnik D (1960) Echinodermata der Insel Krk. Acta Adriat 9: 3–19.
Zhan AB, Bao ZM, Lu W, Hu XL, Peng W, Wang ML, Hu JJ (2007) Development and characterization of
45 novel microsatellite markers for sea cucumber (Apostichopus japonicus). Mol Ecol Notes 7: 1345–
1348. doi: 10.1111/j.1471-8286.2007.01876.x.
Zulliger D, Ruch M, Tanner S, Ribi G (2008) Characterization of nine microsatellite loci in the sea star
Astropecten aranciacus and cross-species amplification for related taxa. Mol Ecol Res 8: 634–636.
doi: 10.1111/j.1471-8286.2007.02027.x.
20
Table 1: A. aranciacus intra-population genetic variability at the mitochondrial control region (CR) including flanking regions and four microsatellite loci for nine sampling
locations. Indicated are the number of individuals processed (n) for mitochondrial and nuclear markers, as well as the number of total haplotypes (T), the number of location-specific
haplotypes found within each sampling location (S) and haplotype (h) and nucleotide (π) diversity. Standard errors are in parenthesis. For microsatellite loci the number of alleles
(Na), expected (HE) and observed heterozygosity (HO) and the allelic richness (Rs) are shown. Allelic richness is adjusted for a minimum sample size of 20 diploid individuals.
Estimated null allele frequencies (r; van Oosterhout) are shown for populations with significant lower HO from HWE after false discovery rate (FDR) correction.
MtDNA Microsatellite loci
CR and flanking regions Aaran06 Aaran09 Aaran2/05 Aaran2/25
Location n T S h π n Na HO HE Rs Na HO HE Rs Na HO HE Rs Na HO HE Rs Mean Rs
MAD 19 12 11 0.8363
(0.0199) 0.0029
(0.0004) 21 9 0.810 0.832 8.949 3 0.429 0.547 3.000 6 0.667 0.667 5.952 18
0.700* r = 0.112
0.923 18.000 8.975
FAR 18 15 12 0.9804
(0.0057) 0.0062
(0.0008) 30 11 0.759 0.798 10.149 5 0.724 0.725 4.900 9 0.625 0.710 7.943 22
0.704*** r = 0.121
0.941 18.860 10.463
Total
Atlantic 37 27 23
0.9535
(0.0044)
0.0050
(0.0005) 51 12 0.780 0.810 9.549 5 0.600 0.671 3.950 9 0.640 0.695 6.948 30
0.702***
r = 0.127 0.951 18.430 9.719
LAH 15 13 7 0.9714 (0.0100
0.0069 (0.0010)
22 12 0.864 0.863 11.539 4 0.727 0.718 4.000 11 0.864 0.848 10.545 17 0.727*** r = 0.105
0.943 16.597 10.670
BAN 23 9 0.652° 0.788 8.709 7 0.696 0.620 6.580 10 0.739 0.864 9.810 19 0.619**
r = 0.162 0.945 18.567 10.917
MUR 20 20 13 1.0000
(0.0035) 0.0054
(0.0007) 49 14 0.886 0.837 11.627 6 0.818*** 0.648 5.115 14 0.773 0.815 10.567 25
0.757* r = 0.096
0.95 19.904 11.803
GAE 20 19 12 0.9947
(0.0040) 0.0072
(0.0009) 28 12 0.893 0.860 10.679 6 0.643 0.604 5.330 11 0.893 0.823 9.773 25 0.857° 0.96 21.138 11.730
Total W.
Med. 55 44 38
0. 9892
(0.0008)
0.0064
(0.0005) 122 15 0.838 0.838 10.639 7 0.735*** 0.646 5.256 17 0.812 0.834 10.174 36
0.750***
r = 0.117 0.954 19.052 11.280
CRE 20 18 14 0.9895
(0.0043) 0.0065
(0.0008) 21 10 0.750 0.837 10.000 6 0.619° 0.714 5.950 8 0.714 0.816 7.951 24 0.900° 0.968 24.000 11.975
HER 20 19 17 0.9947
(0.0040) 0.0078
(0.0009) 30 12 0.933 0.881 11.197 6 0.467 0.652 5.226 12 0.833° 0.904 11.482 24 0.900 0.958 20.311 12.054
KAV 19 18 14 0.9942
(0.0044) 0.0067
(0.0008) 30 12 0.733 0.847 10.441 5 0.667 0.627 4.333 11 0.897 0.866 9.493 28
0.767***
r = 0.098 0.968 23.131 11.850
Total E.
Med. 59 51 47
0.9930
(0.0007)
0.0069
(0.0005) 81 15 0.813 0.854 10.546 8 0.580 0.654 5.170 12 0.825 0.869 9.642 37
0.850***
r = 0.057 0.966 22.481 11.960
All Pops 151 114 100 0.9910
(0.0002)
0.0064
(0.0003) 254 17 0.818 0.838 10.598 9 0.657 0.657 5.246 18 0.781 0.826 9.841 46
0.774**
r = 0.095 0.960 21.917 11.901
* = P < 0.05, ** = P < 0.01, *** = P < 0.001, ° = values that become non-significant after applying FDR correction.
21
Table 2: Population pairwise genetic differentiation FST between sampling locations of A. aranciacus based on
mtDNA sequence data and FST and standardized genetic differentiation in four microsatellite loci. Below
diagonal: multilocus FST (Weir & Cockerham 1984) and standardized genetic differentiation (Hedrick 2005) in
italic (for microsatellite loci only); above diagonal: P-values < 0.05. Significance is indicated in bold after false
discovery rate correction.
Atlantic West Mediterranean East Mediterranean
MAD FAR LAH BAN MUR GAE CRE HER KAV
mtDNA MAD - 0.0000 0.0000 0.0000 0.0000 0.0000 0.0000 0.0000
FAR 0.1796 - 0.0488 0.0396 LAH 0.1666 -0.0253 - BAN - MUR 0.1711 0.0039 -0.0045 - 0.0397 GAE 0.1884 -0.0014 -0.0151 -0.0147 - 0.0489 0.0381 CRE 0.1378 -0.0043 0.0011 0.0020 0.0105 - HER 0.1630 0.0428 0.0257 0.0337 0.0437 0.0026 - KAV 0.1663 0.0463 0.0351 0.0419 0.0510 0.0007 -0.0317 -
microsatellite
loci
MAD - 0.0046 0.0040 0.0039 0.0114 0.0160 0.0315 0.0013 0.0029
FAR 0.0254 0.1079
- 0.0059 0.0273 0.0030 0.0083
LAH 0.0299 0.1443
-0.0010 0.0000
-
BAN 0.0312 0.1361
0.0231 0.1129
0.0052 0.0296
-
MUR 0.0165 0.0716
0.0010 0.0048
-0.0027 0.0000
0.0016 0.0080
-
GAE 0.0178 0.0809
0.0125 0.0635
0.0068 0.0400
0.0021 0.0111
-0.0039 0.0000
-
CRE 0.0197 0.0914
0.0073 0.0383
0.0032 0.0198
0.0094 0.0514
0.0024 0.0129
-0.0004 0.0000
-
HER 0.0305 0.1529
0.0213 0.1204
0.0055 0.0366
0.0051 0.0302
0.0061 0.0366
0.0034 0.0207
0.0017 0.0110
-
KAV 0.0251 0.1177
0.0167 0.0879
-0.0003 0.0000
0.0003 0.0016
0.0020 0.0108
-0.0009 0.0000
0.0004 0.0024
-0.0069 0.0000
-
22
Table 3: Analysis of molecular variance (AMOVA) based on pairwise distances in A. aranciacus for different
groupings of Atlantic (A) versus Mediterranean (M) and within the Mediterranean for eastern (EM) versus
western (WM) samples. Grouping the sample LAH to a basin other than the western Mediterranean is indicated
by +, removing it by -. The table includes the degrees of freedom (df) for both mitochondrial DNA (mtDNA)
and microsatellite loci (msats) and the F-statistics. Only P-values > 0.05 are listed, and significance after false
discovery rate correction is indicated in bold.
df
Percentage of
variation Fixation indices P
Grouping mtDNA msats mtDNA msats mtDNA msats mtDNA msats
(A) A+ vs. M Among groups 1 1 1.39 0.52 FCT = 0.013 0.005 - 0.035
Within groups 6 7 3.94 0.500 FSC = 0.039 0.005 0.005 0.035 Within populations 143 487 94.68 98.98 FST = 0.053 0.010 0.000 0.002
(B) A vs. M Among groups 1 1 2.11 0.80 FCT = 0.021 0.008 - 0.029
Within groups 6 7 3.73 0.45 FSC = 0.038 0.005 0.000 0.049 Within populations 143 487 94.15 98.75 FST = 0.058 0.013 0.000 0.002
(C) A+ vs. WM vs. EM Among groups 2 2 2.47 0.48 FCT = 0.024 0.005 0.043 0.014
Within groups 5 6 2.79 0.39 FSC = 0.028 0.004 0.029 - Within populations 143 487 94.73 99.13 FST = 0.052 0.009 0.000 0.002
(D) A vs. WM vs. EM Among groups 2 2 3.24 0.60 FCT = 0.032 0.006 0.014 0.007
Within groups 5 6 2.22 0.32 FSC = 0.022 0.003 0.002 - Within populations 143 487 94.54 99.08 FST = 0.054 0.009 0.000 0.002
(E) WM vs. EM Among groups 1 1 3.79 0.37 FCT = 0.037 0.004 - 0.028
Within groups 4 5 -1.01 -0.06 FSC = -0.010 -0.001 - - Within populations 108 389 97.21 99.69 FST = 0.027 0.003 - - (F) WM- vs. EM Among groups 1 1 3.94 0.47 FCT = 0.039 0.005 - - Within groups 3 4 -0.96 -0.13 FSC = -0.010 -0.001 - - Within populations 94 346 97.02 99.66 FST = 0.029 0.003 - -
- = non significant (P > = 0.05)
23
Figure 1: Map showing the sampling sites of A. aranciacus.
MAD Madeira, FAR Faro, LAH La Herradura, BAN Banyuls, MUR Muravera, GAE Gaeta, CRE Cres, HER
Heraklion, KAV Kavala
Figure 2: Parsimony network showing relationships among all Astropecten aranciacus mtDNA haplotypes.
Haplotypes are colored according to the region: Atlantic (gray), western Mediterranean (black), and eastern
Mediterranean (white). Circle size is proportional to the number of samples with the same haplotype and size of
pie slices to the number of samples from the same region. Each line in the network represents a single mutational
change. Small dots indicate intermediate haplotypes not observed in the sample but necessary to link all observed
haplotypes to the network
24
Figure 3: Results of the structure analysis using microsatellite data indicating the average ¡log PR(X|K) estimate
with standard error bars for each number of populations (K)
Figure 4: Genetic differentiation (computed as FST/(1-FST)) versus the logarithm of the geographic distance in
km in A. aranciacus based on a) mtDNA sequence data and b) microsatellite data. Full lines represent the
regression line over all pairwise FST , dotted lines represent the regression line omitting the location MAD.
a) mtDNA
-0.05
0
0.05
0.1
0.15
0.2
0.25
5 6 7 8 9
Log distance (Km)
FS
T/(
1-F
ST)
b) microsatellite loci
-0.01
0
0.01
0.02
0.03
0.04
5 6 7 8 9
Log distance (Km)
FS
T/(
1-F
ST)
○ = pairs with MAD ● = pairs without MAD
r = 0.41
r = 0.58
r = 0.47
r = 0.49
25
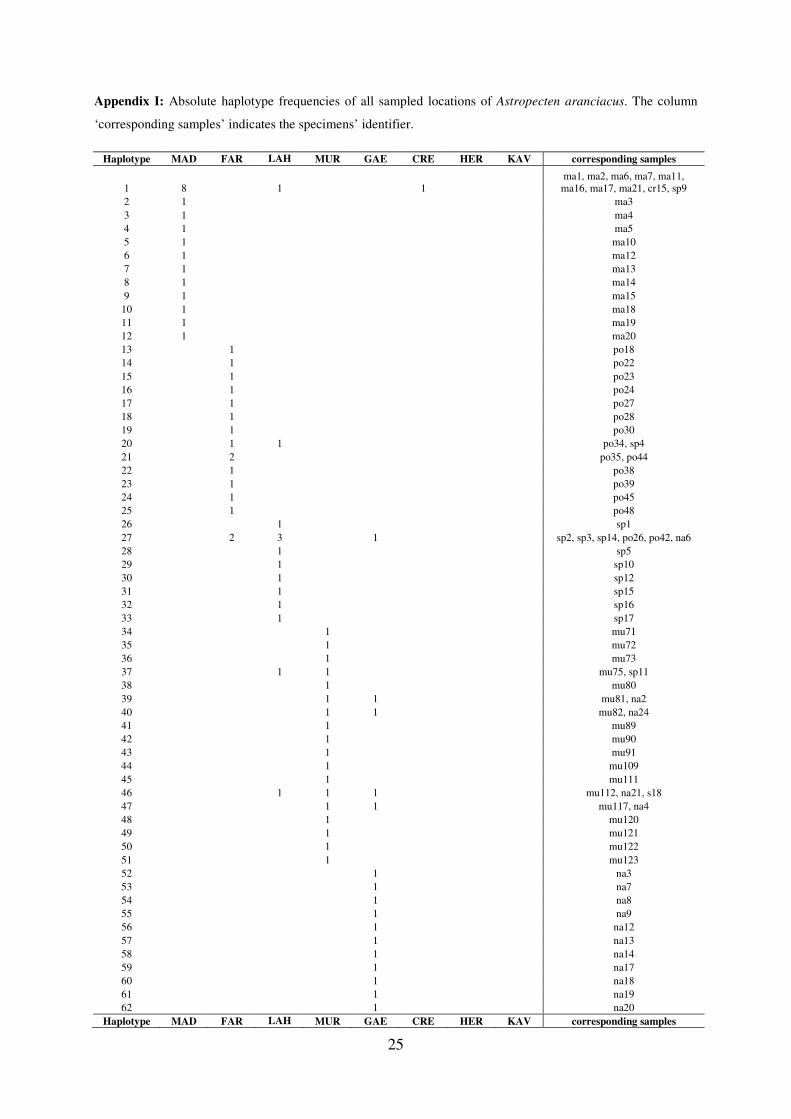
Appendix I: Absolute haplotype frequencies of all sampled locations of Astropecten aranciacus. The column
‘corresponding samples’ indicates the specimens’ identifier.
Haplotype MAD FAR LAH
HerraMUR GAE CRE HER KAV corresponding samples
1 8 1 1 ma1, ma2, ma6, ma7, ma11, ma16, ma17, ma21, cr15, sp9
2 1 ma3 3 1 ma4 4 1 ma5 5 1 ma10 6 1 ma12 7 1 ma13 8 1 ma14 9 1 ma15
10 1 ma18 11 1 ma19 12 1 ma20 13 1 po18 14 1 po22 15 1 po23 16 1 po24 17 1 po27 18 1 po28 19 1 po30 20 1 1 po34, sp4 21 2 po35, po44 22 1 po38 23 1 po39 24 1 po45 25 1 po48 26 1 sp1 27 2 3 1 sp2, sp3, sp14, po26, po42, na6 28 1 sp5 29 1 sp10 30 1 sp12 31 1 sp15 32 1 sp16 33 1 sp17 34 1 mu71 35 1 mu72 36 1 mu73 37 1 1 mu75, sp11 38 1 mu80 39 1 1 mu81, na2 40 1 1 mu82, na24 41 1 mu89 42 1 mu90 43 1 mu91 44 1 mu109 45 1 mu111 46 1 1 1 mu112, na21, s18 47 1 1 mu117, na4 48 1 mu120 49 1 mu121 50 1 mu122 51 1 mu123 52 1 na3 53 1 na7 54 1 na8 55 1 na9 56 1 na12 57 1 na13 58 1 na14 59 1 na17 60 1 na18 61 1 na19 62 1 na20
Haplotype MAD FAR LAH
HerraMUR GAE CRE HER KAV corresponding samples
26
63 1 2 na25, na27, mu119 64 1 na28 65 1 cr16 66 1 cr17 67 1 cr183 68 2 cr184, cr195 69 1 cr185 70 1 cr187 71 1 cr188
72 2 1 2 2 cr189, cr201, ka2, ka28, mu43,
po4, po5 73 1 cr190 74 1 cr193 75 1 1 1 cr194, ka9, na22 76 1 cr196 77 1 cr198 78 1 1 cr199, kr5 79 1 cr200 80 1 cr202 81 1 cr203 82 2 1 kr1, kr2, ka12 83 1 kr3 84 1 kr6 85 1 kr7 86 1 kr8 87 1 kr9 88 1 kr10 89 1 kr13 90 1 kr15 91 1 kr16 92 1 kr19 93 1 kr22 94 1 kr23 95 1 kr24 96 1 kr26 97 1 kr27 98 1 kr29 99 1 kr30
100 1 ka1 101 1 ka3 102 1 ka4 103 1 ka5 104 1 ka7 105 1 ka8 106 1 ka11 107 1 1 ka14, sp19 108 1 ka15 109 1 ka16 110 1 ka18 111 1 ka22 112 1 ka23 113 1 ka26 114 1 ka29
27
Appendix II: Allele-frequencies at four microsatellite loci for A. aranciacus from nine sampling locations.
Number of individuals sampled is indicated by n.
Location
Locus Allele
MAD
n =21
FAR
n = 38
LAH
n = 22
BAN
n = 23
MUR
n = 44
GAE
n = 28
CRE
n = 21
HER
n = 30
KAV
n = 30
all
weighted
all un-
weighted
Aaran06
84 0.048 0.034 0.023 0 0.034 0 0.025 0.033 0.033 0.026 0.026
86 0.333 0.414 0.295 0.391 0.352 0.25 0.325 0.317 0.25 0.326 0.325
88 0.071 0.069 0.136 0.109 0.102 0.089 0.1 0.133 0.15 0.107 0.107
90 0.167 0.121 0.159 0.217 0.136 0.196 0.2 0.117 0.1 0.152 0.157
92 0.048 0.034 0.023 0.043 0.068 0.018 0 0 0.033 0.032 0.03
95 0 0.017 0.023 0 0.011 0 0.025 0 0 0.008 0.008
97 0 0 0 0 0 0.018 0 0 0 0.002 0.002
99 0.167 0.052 0.068 0.087 0.057 0.054 0.05 0.067 0.033 0.067 0.07
101 0.095 0.086 0.045 0 0.057 0.036 0 0.033 0.05 0.047 0.045
103 0 0.017 0 0.043 0.057 0.018 0.075 0.017 0.083 0.036 0.034
105 0.048 0.086 0.091 0.022 0.045 0.179 0.125 0.117 0.133 0.093 0.094
107 0.024 0.069 0.091 0.065 0.023 0.089 0.025 0.117 0.083 0.065 0.065
109 0 0 0.023 0 0.023 0.018 0.05 0.017 0.017 0.016 0.016
111 0 0 0 0 0 0 0 0 0.033 0.004 0.004
113 0 0 0 0 0.011 0.036 0 0.017 0 0.008 0.007
117 0 0 0 0 0 0 0 0.017 0 0.002 0.002
122 0 0 0.023 0.022 0.023 0 0 0 0 0.008 0.007
Aaran09
115 0 0 0 0.022 0 0.036 0.048 0 0.033 0.014 0.015
117 0.119 0.207 0.205 0.043 0.068 0.054 0.238 0.167 0.167 0.135 0.141
119 0.619 0.328 0.364 0.543 0.466 0.536 0.452 0.533 0.517 0.482 0.484
121 0 0 0 0.022 0.011 0.018 0 0 0.017 0.008 0.008
122 0 0.069 0.091 0.043 0.068 0 0 0 0 0.032 0.03
123 0.262 0.362 0.341 0.304 0.364 0.339 0.19 0.267 0.25 0.304 0.298
124 0 0 0 0 0 0 0.048 0 0 0.004 0.005
125 0 0 0 0 0 0 0 0.017 0 0.002 0.002
128 0 0.034 0 0.022 0.023 0.018 0.024 0.017 0.017 0.018 0.017
Aaran2/05
193 0.024 0.017 0 0.043 0.034 0.018 0.095 0.034 0.083 0.038 0.039
194 0 0 0 0 0.011 0 0 0 0 0.002 0.001
195 0.548 0.5 0.318 0.196 0.364 0.357 0.357 0.259 0.2 0.342 0.344
196 0 0 0 0 0 0 0 0 0.017 0.002 0.002
197 0 0.017 0.023 0.043 0.057 0.107 0.024 0.069 0.067 0.049 0.045
199 0.071 0.052 0.091 0.043 0.023 0.018 0 0.034 0.1 0.047 0.048
201 0 0.017 0.023 0.043 0.034 0.089 0.095 0.138 0.067 0.057 0.056
203 0.143 0.034 0.091 0.13 0.057 0.071 0.095 0.086 0.1 0.085 0.09
204 0 0 0 0 0.011 0 0 0 0.033 0.006 0.005
205 0.095 0.138 0.114 0.174 0.182 0.161 0.19 0.103 0.067 0.138 0.136
206 0.119 0.069 0.114 0.065 0.091 0.036 0 0.086 0.067 0.073 0.072
207 0 0.155 0.159 0.239 0.102 0.107 0.095 0.172 0.15 0.132 0.131
208 0 0 0.023 0 0 0 0 0 0 0.002 0.003
209 0 0 0 0 0 0.018 0.048 0.017 0.05 0.014 0.015
210 0 0 0.023 0.022 0 0 0 0 0 0.004 0.005
211 0 0 0.023 0 0.011 0.018 0 0 0 0.006 0.006
212 0 0 0 0 0.011 0 0 0 0 0.002 0.001 213 0 0 0 0 0.011 0 0 0 0 0.002 0.001
28
Location
Locus Allele
MAD
n =21
FAR
n = 38
LAH
n = 22
BAN
n = 23
MUR
n = 44
GAE
n = 28
CRE
n = 21
HER
n = 30
KAV
n = 30
all
weighted
all un-
weighted
Aaran2/25 70 0 0.111 0.091 0 0.054 0.089 0.075 0.033 0.033 0.055 0.054 72 0 0 0 0 0 0 0 0.017 0 0.002 0.002 74 0 0.056 0.045 0.119 0.068 0.071 0.025 0.083 0.117 0.068 0.065 76 0 0.037 0.023 0 0.054 0 0 0.05 0.05 0.028 0.024 80 0.225 0 0 0.071 0 0.018 0.05 0 0 0.032 0.04 83 0 0.037 0.159 0.048 0.027 0 0 0.05 0.017 0.036 0.037 85 0.025 0 0.045 0 0.027 0 0 0.05 0 0.017 0.016 87 0.025 0.093 0.091 0.143 0.081 0.071 0.025 0.067 0.033 0.07 0.07 89 0 0 0 0 0 0.018 0 0 0 0.002 0.002 93 0 0 0 0.024 0 0 0 0 0 0.002 0.003 95 0 0 0 0.048 0 0.018 0 0 0 0.006 0.007 96 0 0 0 0 0 0.018 0 0.017 0.033 0.009 0.008 97 0 0 0.045 0 0.014 0.018 0 0 0 0.009 0.009 98 0 0 0 0 0 0.018 0 0.05 0.083 0.019 0.017 100 0.05 0.037 0.045 0.024 0.027 0.071 0.05 0.017 0.067 0.043 0.043 102 0.025 0 0 0.095 0.027 0.071 0.05 0.033 0 0.032 0.034 104 0.1 0.056 0.023 0.024 0.027 0.089 0.025 0.083 0.067 0.055 0.055 106 0.05 0.019 0.045 0 0.068 0 0.075 0.067 0.05 0.043 0.041 108 0.025 0.019 0 0 0 0.018 0 0 0 0.006 0.007 110 0.025 0.019 0.068 0.024 0.041 0 0.025 0 0.017 0.023 0.024 111 0.075 0 0 0 0 0 0 0 0 0.006 0.008 113 0 0 0 0 0 0.018 0.05 0 0.017 0.009 0.009 115 0 0 0 0 0.014 0.018 0.025 0.05 0 0.013 0.012 117 0.025 0.019 0 0 0.027 0.018 0.025 0.033 0.017 0.019 0.018 119 0.1 0.074 0 0.024 0.027 0 0 0.017 0.067 0.034 0.034 121 0.025 0 0 0 0.014 0.036 0 0.033 0 0.013 0.012 123 0 0.148 0.068 0.071 0.081 0.054 0.125 0.017 0.067 0.07 0.07 125 0 0 0.091 0.048 0.027 0 0.025 0.05 0 0.026 0.027 127 0 0 0 0 0.014 0.018 0 0 0 0.004 0.003 129 0 0.019 0.068 0.048 0.027 0.036 0.025 0.017 0.017 0.028 0.028 131 0.025 0 0 0 0 0 0 0 0.017 0.004 0.005 133 0 0.019 0 0 0 0 0 0.017 0 0.004 0.004 135 0.025 0 0 0 0 0 0.05 0.017 0 0.009 0.01 137 0 0 0 0.024 0.014 0.036 0.025 0 0.017 0.013 0.013 139 0.05 0.037 0 0.024 0.027 0.036 0.025 0.033 0.033 0.03 0.029 141 0.1 0.111 0.023 0.095 0.149 0.089 0.075 0 0.05 0.079 0.077 143 0 0.019 0.045 0.024 0.054 0.036 0.025 0 0.017 0.026 0.024 145 0 0 0 0 0.014 0 0.025 0.017 0.067 0.015 0.014 147 0 0 0.023 0 0 0.018 0.025 0.017 0.017 0.011 0.011 149 0 0.019 0 0 0 0 0.025 0 0 0.004 0.005 151 0 0.019 0 0 0 0 0 0.017 0 0.004 0.004 153 0.025 0 0 0 0 0 0 0.033 0.033 0.011 0.01 155 0 0 0 0 0 0 0 0.017 0 0.002 0.002 159 0 0.019 0 0 0 0 0 0 0 0.002 0.002 161 0 0.019 0 0.024 0 0 0 0 0 0.004 0.005 163 0 0 0 0 0 0 0.05 0 0 0.004 0.006