Embed Size (px)
Citation preview
UNIVERSITY OF WISCONSIN-LA CROSSE
Graduate Studies
ACOUSTIC ANALYSIS AS A SURROGATE FOR GAS EXCHANGE
A Manuscript Style Thesis Submitted in Partial Fulfillment of the Requirements for the
Degree of Master of Science, Clinical Exercise Physiology
Amanda J. Peterson
College of Science and Health
Clinical Exercise Physiology
May, 2013
iii
ABSTRACT
Peterson, A.J. Acoustic analysis as a surrogate for gas exchange. MS in Clinical Exercise
Physiology, May 2013, 37pp. (C. Foster)
Measurement of ventilatory (VT) and respiratory compensation (RCT) threshold is a
standard practice during exercise testing with measurement of respiratory gas exchange
(RGE). Previous work suggested the feasibility that a conceptually simple breath sound
analysis (BSA) technique might be an alternative to direct RGE. This study extends
observations of the relationship between VT and RCT detection using RGE and BSA.
Healthy subjects (n=20) performed two incremental, maximal cycle ergometer exercise
tests (25W + 25W per 2 min). Heart rate (HR) and Rate of Perceived Exertion (RPE)
were recorded during the last thirty seconds of each stage using radiotelemetry and the
Category Ratio RPE scale. RGE was performed using open circuit spirometery with VT
and RCT determined from v-slope and ventilatory equivalents. BSA was performed
using proprietary software from a microphone in the breathing valve, and included
measurements of respiratory rate and sound intensity (the product of tidal
volume/inspiratory and expiratory time). There was a significant relationship between the
HR at VT and RCT combined (R2=0.72) and power output (PO) at VT and RCT
combined (R2=0.78) between the RGE and BSA, with the best fit line basically
equivalent to the line of identity. The conceptually simple BSA appears to be a viable
surrogate for direct measurement of VT and RCT using RGE.
iv
ACKNOWLEDGEMENT
I would like to thank Carl Foster, Scott Doberstein, and Glenn Wright for
advising me throughout this research and for being on my thesis committee. I would like
to express my deepest appreciation to Carl Foster for always promoting a stimulating
learning environment where I was able to grow as a young professional, as well as an
individual – the lessons I have learned mean so much more than what can be found on the
pages of a book. Finally, I would like to thank my family and my new ‘LEHP Family’
for all of the support and encouragement throughout this year. “Read It and Weep”.
v
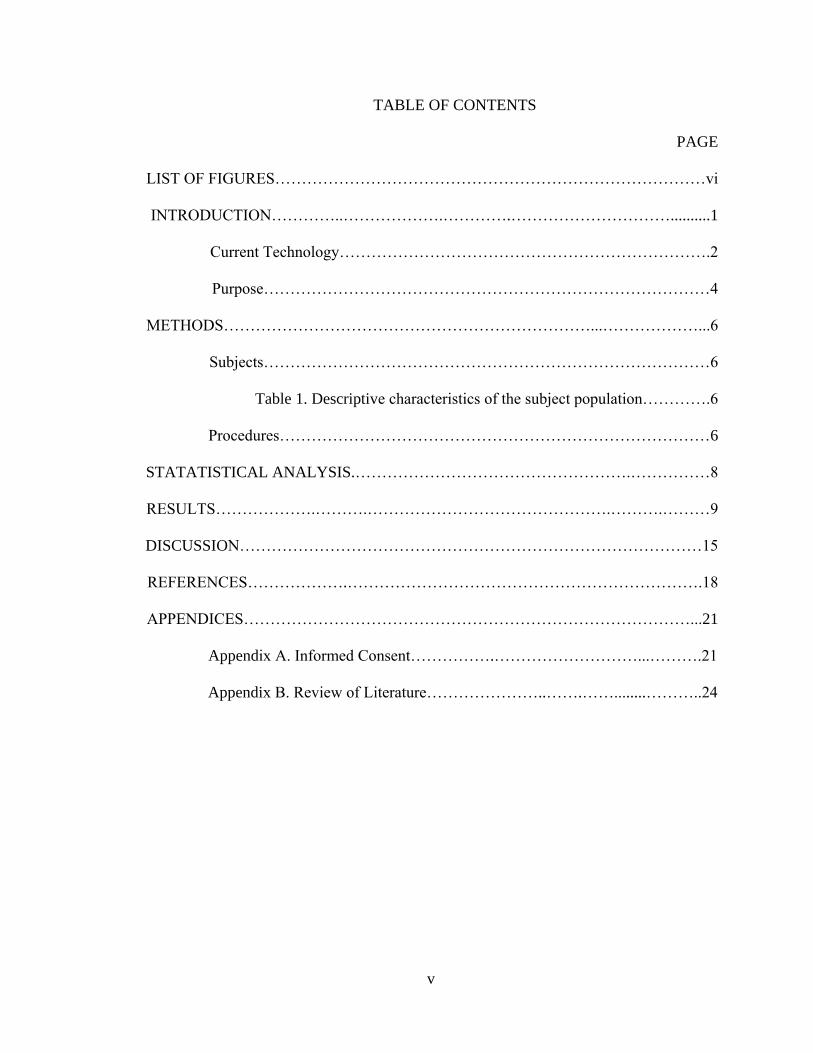
TABLE OF CONTENTS
PAGE
LIST OF FIGURES………………………………………………………………………vi
INTRODUCTION…………..……………….………….…………………………..........1
Current Technology…………………………………………………………….2
Purpose…………………………………………………………………………4
METHODS……………………………………………………………...………………...6
Subjects…………………………………………………………………………6
Table 1. Descriptive characteristics of the subject population………….6
Procedures………………………………………………………………………6
STATATISTICAL ANALYSIS.…………………………………………….……………8
RESULTS……………….……….……………………………………….……….………9
DISCUSSION……………………………………………………………………………15
REFERENCES……………….………………………………………………………….18
APPENDICES…………………………………………………………………………...21
Appendix A. Informed Consent…………….………………………...……….21
Appendix B. Review of Literature…………………..…….……........………..24
vi
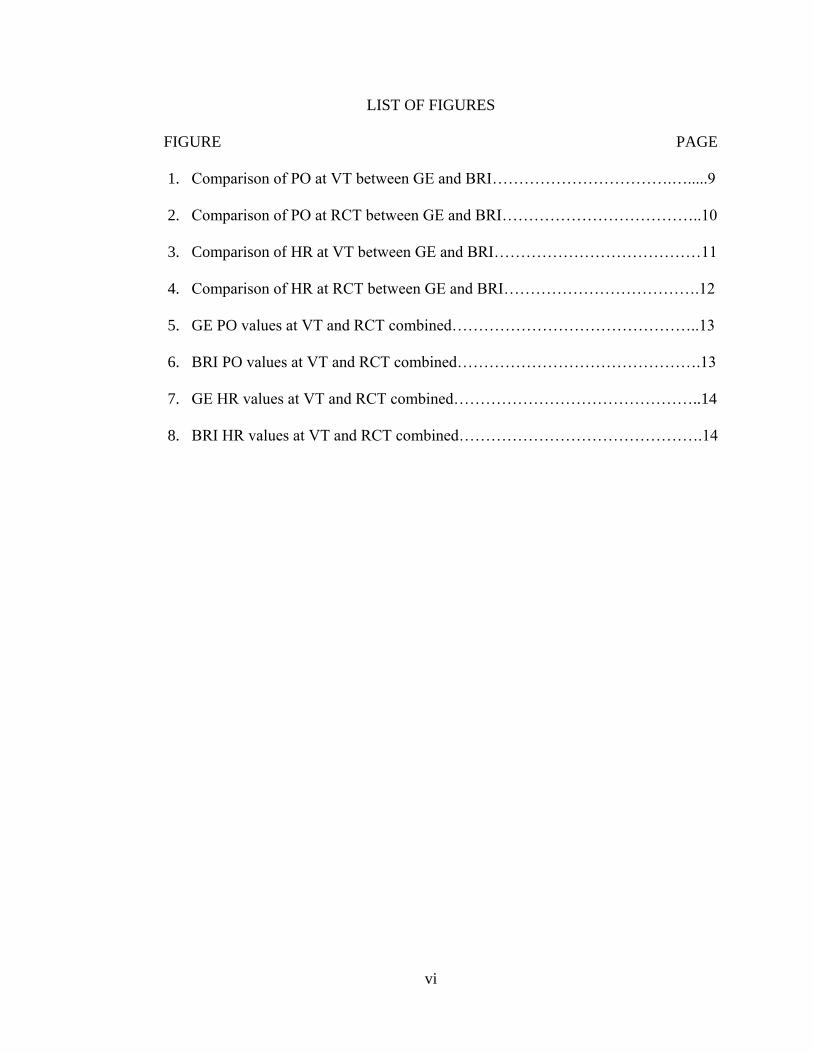
LIST OF FIGURES
FIGURE PAGE
1. Comparison of PO at VT between GE and BRI…………………………….….....9
2. Comparison of PO at RCT between GE and BRI………………………………..10
3. Comparison of HR at VT between GE and BRI…………………………………11
4. Comparison of HR at RCT between GE and BRI……………………………….12
5. GE PO values at VT and RCT combined………………………………………..13
6. BRI PO values at VT and RCT combined……………………………………….13
7. GE HR values at VT and RCT combined………………………………………..14
8. BRI HR values at VT and RCT combined……………………………………….14
1
INTRODUCTION
The ability to make metabolic threshold measurements has long been a reference
standard for measuring sustainable exercise capacity (McLellan & Skinner, 1981).
Measured thresholds derived from either blood lactate analysis (Karlsson & Jacobs, 1982;
Kindermann, Simon, & Keul, 1979) or respiratory gas exchange (Wasserman, Hansen,
Sue, Whipp & Casaburi, 1994; Wasserman & McIlroy, 1964) have a long history of
proven usefulness when evaluating functional capacity and developing exercise
prescriptions. Recent professional society guidelines (Mezzani, Hamm, Jones, McBride,
Moholdt, Stone, Urhausen, & Williams, 2012) suggest that threshold measurement may
be superior to the relative percent of oxygen consumption (VO2) or heart rate reserve
(HRR) that have been the gold standard for exercise prescription for a generation
(ACSM, 2010). Though a variety of methods exist to make such measurements, current
methodology requires a high level of precision and attention to detail and generally
requires equipment that is quite expensive, thus out of the range of the vast majority of
the health-fitness community, and outside the skill set of much of the clinical exercise
physiology community. A conceptually simple process, such as measuring respiratory gas
exchange, is sophisticated, as well as, time consuming.
Alternatively, the air moving into and out of the respiratory system during exercise
creates sound. Since conventional respiratory gas analysis is at least partially based on
breathing frequency and volume, it seems reasonable to suspect that analysis of breath
sounds might provide an alternative approach to direct threshold determination. Acoustic
2
analysis of breath sounds is a new, yet relatively simple technology. It has shown promise
in terms of evaluating clinical disorders such as sleep apnea. Recent studies from our
laboratory have demonstrated the promise of acoustic analysis as a surrogate to obtain
such measurements, specifically ventilatory threshold (VT) and respiratory compensation
threshold (RCT) (Foster, Yee, Stamopolous, & Nacy, 2012).
Current Technology
A plethora of data exist regarding measurement of metabolic thresholds. Methods
range in complexity, from the more simplistic, such as the Rating of Perceived Exertion
(RPE) (Eston, Davies, & Williams, 1987; Noble, & Robertson, 1996) and the Talk Test
(TT) (Foster, Porcari, Anderson, Paulson, Smaczny, Webber, Doberstein, & Udermann,
2008; Jeans, Foster, Porcari, Gibson, & Doberstein, 2011), to the technically complex,
such as measuring respiratory gas exchange using open circuit spirometry. Blood lactate
threshold (LT) and the “onset of blood lactate accumulation” (OBLA) have also been
utilized as a marker for exercise capacity (Bang, 1936; Christansen, Douglas, & Haldand,
1914; Hill, Long, & Lupton, 1924; Owles, 1930) which is more or less equivalent to
thresholds measure using respiratory gas exchange. Heart rate (HR) and the HR
performance curve have also been useful when determining threshold based functional
capacity (Pokan, Hofman, Preidler, Leitner, Dusleag, & Eber, 1993). Percent of peak
power output (PO), expressed in watts (W), also give an indication of exercise capacity
(DeKoning, Foster, Bakkum, Kloppenburg, Thiel, Joseph, Cohen, & Porcari, 2011;
Condello, Reynolds, Schnieder, Wheery, Knutson, Casolino, Doberstein, Gibson, de
Koning, & Foster, 2012).
3
Exercise tests which obtain large amounts of metabolic, ventilatory, and
circulatory data are the most widely accepted determinant of aerobic fitness (Wasserman
et al., 1994). Tests utilizing open circuit spiometry produce measurements for VT, RCT,
and max VO2 have been a long standing ‘tradition’ as the gold standard in the exercise
discipline. Despite the well-accepted role of metabolic measures, on a basis of cost, time,
and availability to the ‘normal’ population, alternative methods need be investigated,
analyzed, reproduced, and introduced into the spectrum of deriving metabolic threshold
measurements.
Respiratory gas exchange (GE), and measurements for VT and RCT, are
determined from a relatively simple analysis of pulmonary ventilation, VO2 and carbon-
dioxide production (VCO2). During exercise, an increase in the need for oxygen (O2) is
required as well as increased removal of carbon dioxide (CO2) (Wasserman et al., 1994).
Simultaneously, an increase in lung function, pulmonary circulation, cardiovascular
function, and peripheral circulation is necessary. In conjunction, total ventilation
increases, using both tidal volume and respiratory rate (West, 1990). Minute ventilation
(VE) increases at a rate appropriate to cover CO2 produced during exercise (Wasserman et
al., 1994), at least up to RCT.
Air movement during inspiration and expiration (basic breathing mechanics)
produces breath sounds, which are a conceptually simple diagnostic tool that has been
used in the field of medicine for many years (Reichert, Gass, Brandt & Andres, 2008).
Anderson et al. (2001) suggested that the human ear is able to detect such breath sounds,
both normal and abnormal. Furthermore, these breath sounds from a recording are
potentially able to distinguish potential pathological conditions. Moreover, mathematical
4
analysis of breath sounds has been shown to be clinically useful. (Anderson, Qiu,
Whittaker & Lucas, 2001).
BreathResearch Incorporated (BRI) (California, USA) is a well-established,
research based company. They have developed a strategy for acoustic analysis of breath
recordings, generated from a proprietary algorithm, which is designed to provide
information about health, fitness, and overall wellness. Seven metrics of the breath
recording are taken into account, including: rate, depth, tension, flow, variability, apnea,
and respiratory cycle. Subsequent to recording breath sounds, a “BRI” score is produced
based on these seven metrics. Breath sounds which are captured and analyzed provide
useful information about health and wellness; a conceptually simple method of analyzing
acoustics is utilized to produce such information.
Published data including the correlation of such acoustic analysis and markers of
metabolic thresholds is limited, but promising (Foster et al., 2012). Preliminary data
correlating markers of VT and RCT derived through gas exchange, have been shown to
be similar to those derived utilizing this form of acoustic analysis (Foster et al., 2012).
Increases in HR, as well as, PO were also comparable without significant differences.
However, this preliminary data was based on a study where acoustic analysis and
respiratory gas exchange measurements were derived from two separate exercise tests,
which presents an inherent limitation based on assuming that responses during different
exercise tests are the same.
Purpose
The purpose of the current study was to determine which variables derived from
acoustic analysis of breathing are related to VT and RCT thresholds as defined by
5
respiratory gas analysis. We hypothesized a combination of variables from acoustic
analysis will define VT and RCT better than any single variable. Finally, for reliability
purposes, to determine if derived variables of acoustic analysis compare to normal GE
variables, acoustic and gas analysis tests were conducted in duplicate using simultaneous
measurements.
6
METHODS
Subjects
The University of Wisconsin – La Crosse Institutional Review Board for the Protection
of Human Subjects approved this study and all subjects provided written informed
consent prior to participation. Twenty (n=20), healthy young adults; males (n=9) and
females (n=11) were recruited and preliminary measurements, such as height and weight,
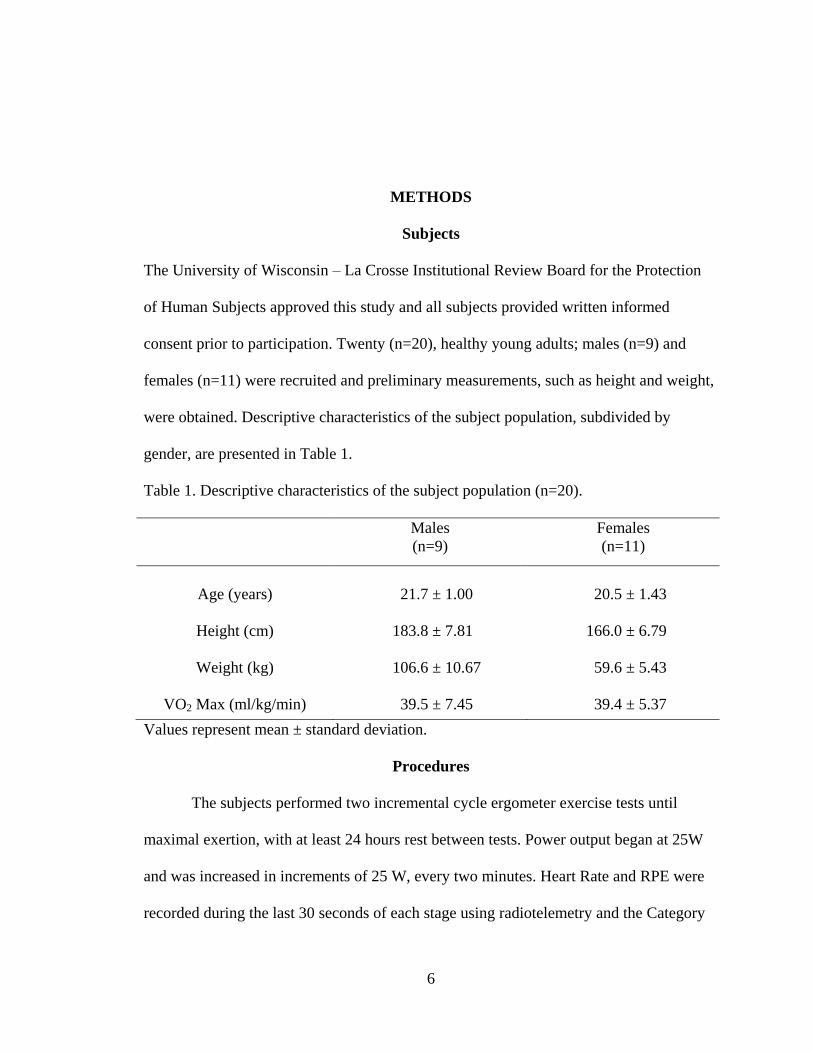
were obtained. Descriptive characteristics of the subject population, subdivided by
gender, are presented in Table 1.
Table 1. Descriptive characteristics of the subject population (n=20).
Males
(n=9)
Females
(n=11)
Age (years)
21.7 ± 1.00
20.5 ± 1.43
Height (cm)
183.8 ± 7.81 166.0 ± 6.79
Weight (kg)
106.6 ± 10.67 59.6 ± 5.43
VO2 Max (ml/kg/min) 39.5 ± 7.45 39.4 ± 5.37
Values represent mean ± standard deviation.
Procedures
The subjects performed two incremental cycle ergometer exercise tests until
maximal exertion, with at least 24 hours rest between tests. Power output began at 25W
and was increased in increments of 25 W, every two minutes. Heart Rate and RPE were
recorded during the last 30 seconds of each stage using radiotelemetry and the Category
7
Ratio RPE scale (Borg, 1973; Borg, 1980), respectively. Breath recordings were captured
using a small microphone developed by BreathResearch Incorporated, inserted in a Hans
Rudolph breathing valve, allowing both GE and acoustic analysis data to be collected
simultaneously.
The acoustic analysis was digitally analyzed for breathing frequency and a
variable referred to as ‘intensity’ (obtained from the expiratory phase of the acoustic
signature, which is conceptually similar to the tidal volume divided by the expiratory
time). Independent of information about respiratory gas analysis, the acoustic signature
was analyzed based on the first derivative of change in breathing frequency and
‘intensity’ and candidates for the VT and RCT were identified.
The VT and RCT from the respiratory GE data were analyzed using conventional
markers including the v-slope and ventilator equivalents (Beaver, Wasserman, & Whipp,
1986). When the exercise time at the VT and RCT did not agree between the v-slope and
GE equivalent data, information of respiratory rate, total pulmonary ventilation and the
HR performance curve were used to rectify the data.
8
STATISICAL ANALYSIS
Comparisons of VT and RCT estimated by the acoustic analysis versus the
directly measured values based on GE were made using paired t-tests and linear
regression, with the GE value assumed to be the ‘true’ value. Comparisons of the
reproducibility of VT and RCT, based on GE and on acoustic analysis, were made using
paired t-tests and intraclass correlations (ICC). Statistical significance was accepted when
p<0.025, with Bonferroni correction for multiple t-tests. All analyses were conducted
using the Statistical Package for the Social Sciences (SPSS, Version 19; SPSS Inc.,
Chicago, IL.)

9
RESULTS
The comparison of PO at VT between GE and BRI is presented in Figure 1. The
PO achieved at VT was not significantly different (p=0.077) between GE (105±37) and
BRI (111±30). The effect size (0.28) suggests very small differences between GE and
BRI. The correlation between PO at VT between GE and BRI was (r=0.849). The results
suggest no meaningful difference for PO at VT between GE and BRI.
y = 0.6484x + 43.419R² = 0.639
0
50
100
150
200
250
300
0 50 100 150 200 250 300
PO
Bre
ath
Re
sear
ch In
c.
PO Gas Exchange
Power Output - VT
Figure 1. Comparison of PO at VT between GE and BRI.
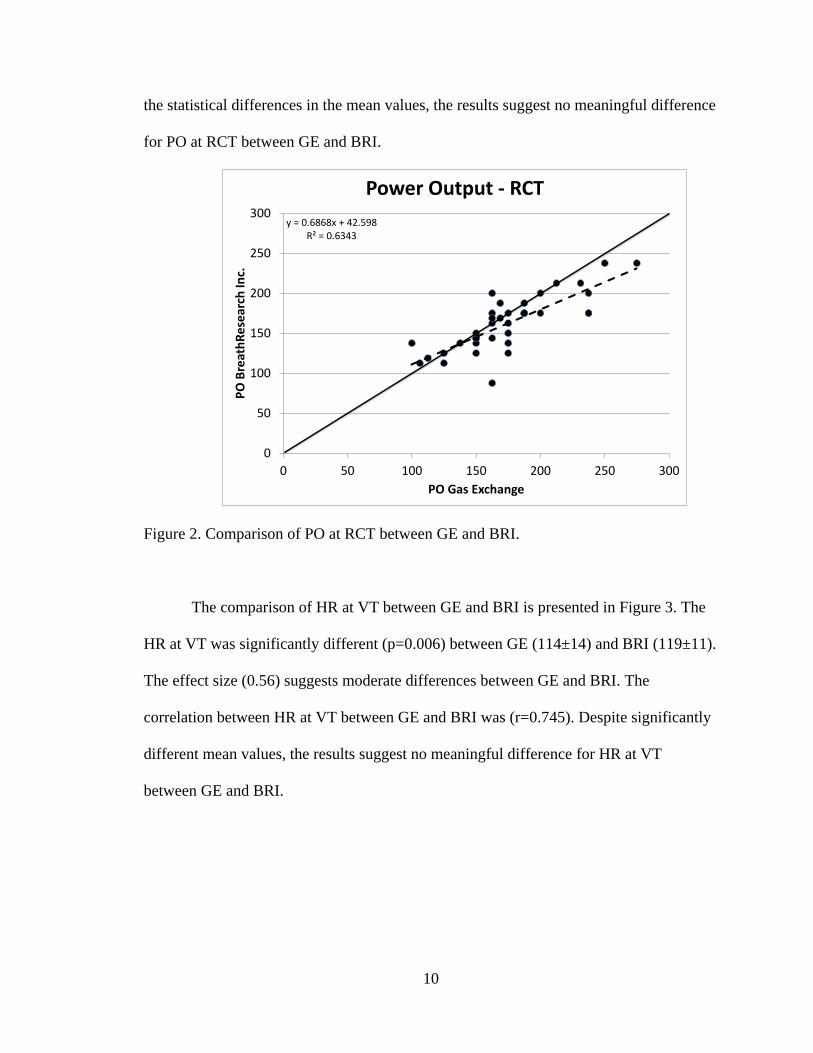
The comparison of PO at RCT between GE and BRI is presented in Figure 2. The
PO at RCT was significantly different (p=0.004) between GE (174±40) and BRI
(162±34). The effect size (0.50) suggests only moderate differences between GE and
BRI. The correlation between PO at RCT between GE and BRI was (r=0.796). Despite
10
the statistical differences in the mean values, the results suggest no meaningful difference
for PO at RCT between GE and BRI.
y = 0.6868x + 42.598R² = 0.6343
0
50
100
150
200
250
300
0 50 100 150 200 250 300
PO
Bre
ath
Re
sear
ch In
c.
PO Gas Exchange
Power Output - RCT
Figure 2. Comparison of PO at RCT between GE and BRI.
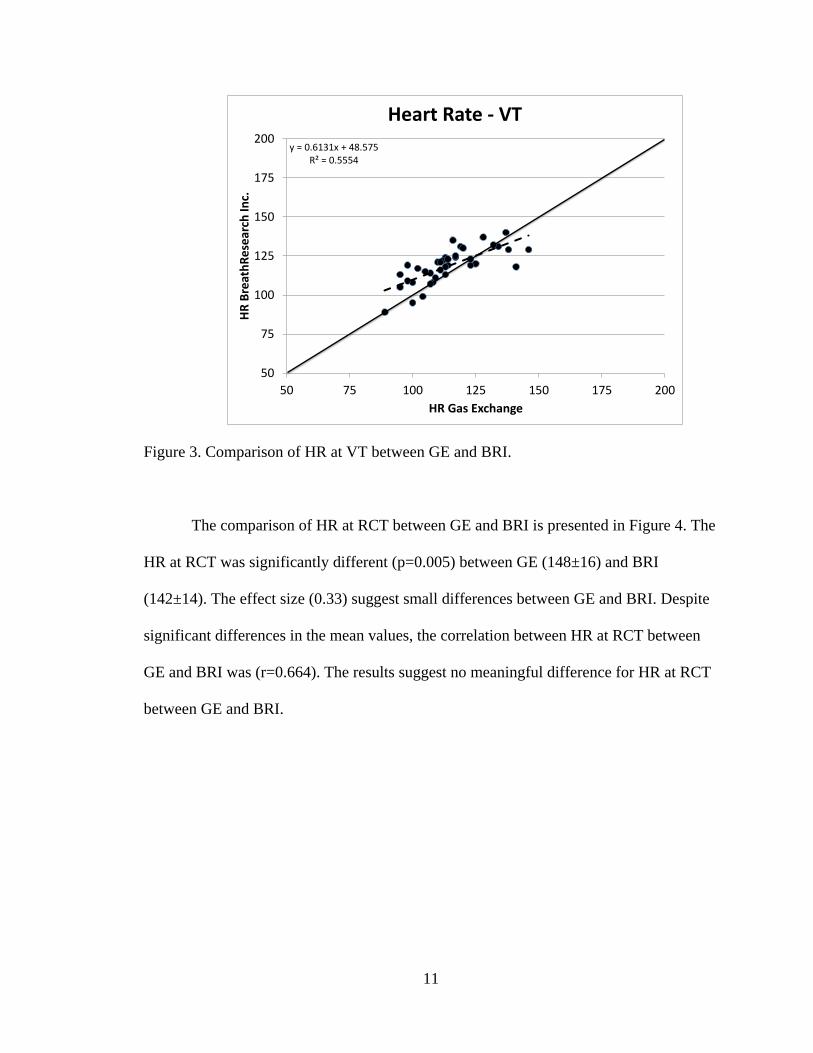
The comparison of HR at VT between GE and BRI is presented in Figure 3. The
HR at VT was significantly different (p=0.006) between GE (114±14) and BRI (119±11).
The effect size (0.56) suggests moderate differences between GE and BRI. The
correlation between HR at VT between GE and BRI was (r=0.745). Despite significantly
different mean values, the results suggest no meaningful difference for HR at VT
between GE and BRI.
11
y = 0.6131x + 48.575R² = 0.5554
50
75
100
125
150
175
200
50 75 100 125 150 175 200
HR
Bre
ath
Res
earc
h In
c.
HR Gas Exchange
Heart Rate - VT
Figure 3. Comparison of HR at VT between GE and BRI.
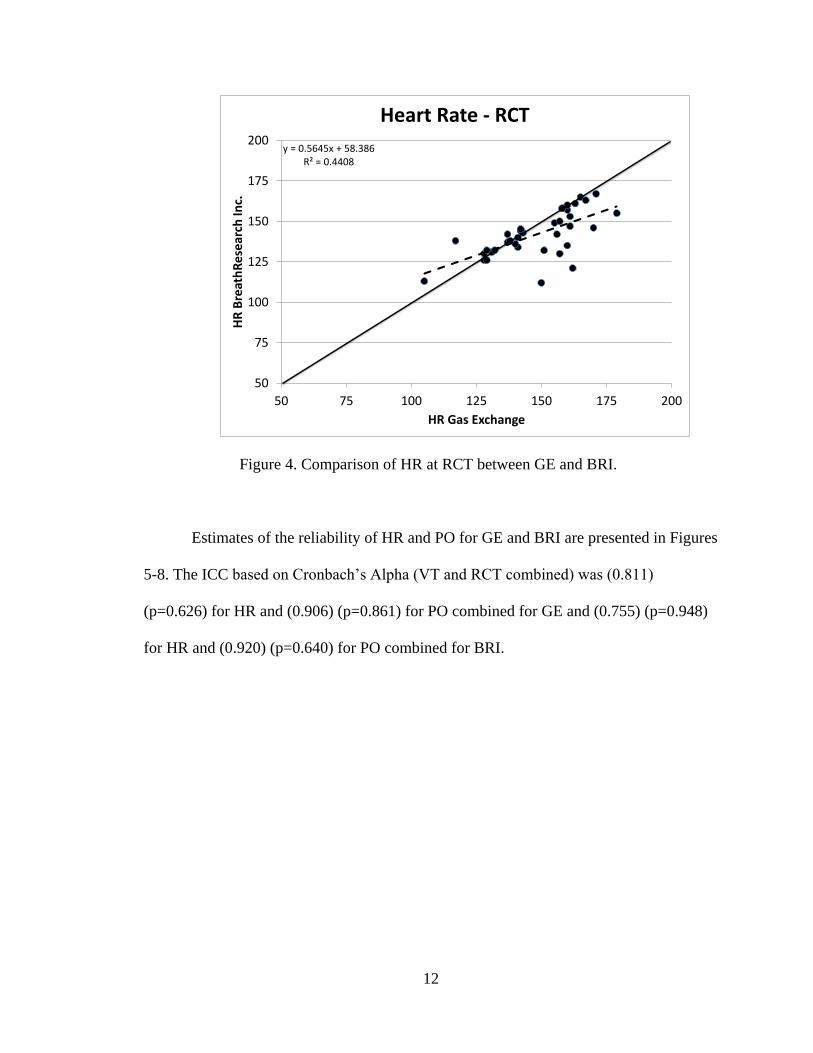
The comparison of HR at RCT between GE and BRI is presented in Figure 4. The
HR at RCT was significantly different (p=0.005) between GE (148±16) and BRI
(142±14). The effect size (0.33) suggest small differences between GE and BRI. Despite
significant differences in the mean values, the correlation between HR at RCT between
GE and BRI was (r=0.664). The results suggest no meaningful difference for HR at RCT
between GE and BRI.
12
y = 0.5645x + 58.386R² = 0.4408
50
75
100
125
150
175
200
50 75 100 125 150 175 200
HR
Bre
ath
Re
sear
ch In
c.
HR Gas Exchange
Heart Rate - RCT
Figure 4. Comparison of HR at RCT between GE and BRI.
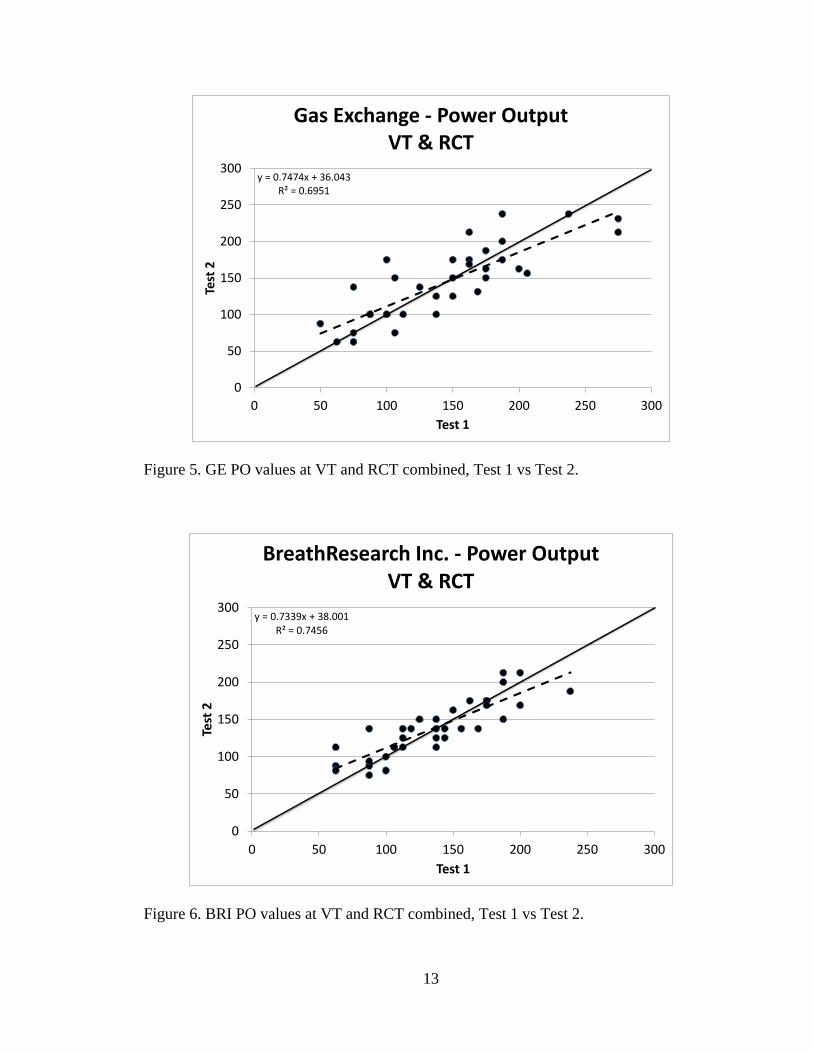
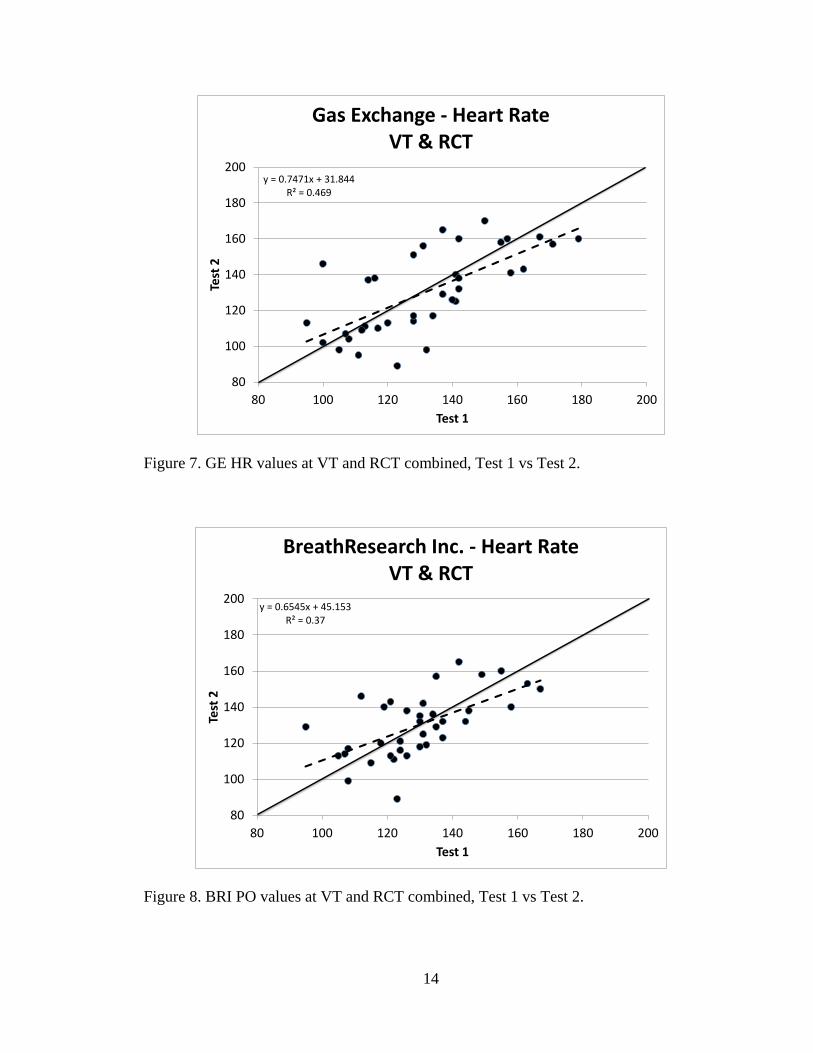
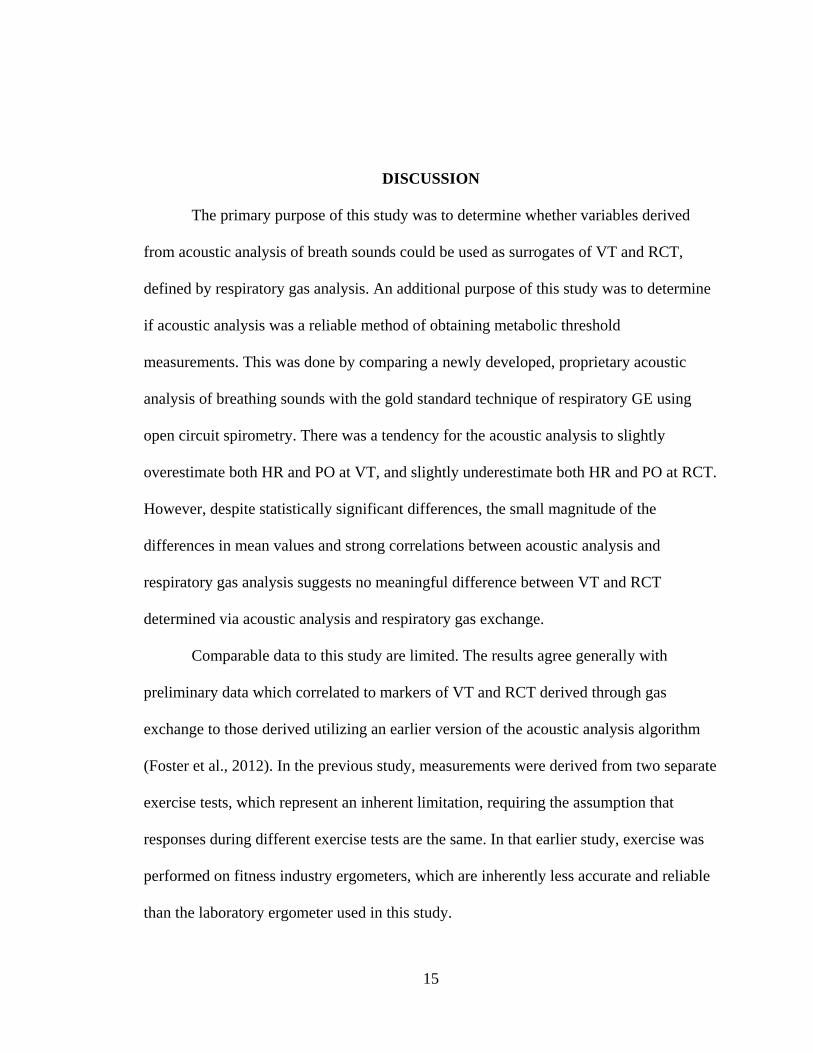
Estimates of the reliability of HR and PO for GE and BRI are presented in Figures
5-8. The ICC based on Cronbach’s Alpha (VT and RCT combined) was (0.811)
(p=0.626) for HR and (0.906) (p=0.861) for PO combined for GE and (0.755) (p=0.948)
for HR and (0.920) (p=0.640) for PO combined for BRI.
13
y = 0.7474x + 36.043R² = 0.6951
0
50
100
150
200
250
300
0 50 100 150 200 250 300
Test
2
Test 1
Gas Exchange - Power OutputVT & RCT
Figure 5. GE PO values at VT and RCT combined, Test 1 vs Test 2.
y = 0.7339x + 38.001R² = 0.7456
0
50
100
150
200
250
300
0 50 100 150 200 250 300
Test
2
Test 1
BreathResearch Inc. - Power OutputVT & RCT
Figure 6. BRI PO values at VT and RCT combined, Test 1 vs Test 2.
14
y = 0.7471x + 31.844R² = 0.469
80
100
120
140
160
180
200
80 100 120 140 160 180 200
Test
2
Test 1
Gas Exchange - Heart RateVT & RCT
Figure 7. GE HR values at VT and RCT combined, Test 1 vs Test 2.
y = 0.6545x + 45.153R² = 0.37
80
100
120
140
160
180
200
80 100 120 140 160 180 200
Test
2
Test 1
BreathResearch Inc. - Heart RateVT & RCT
Figure 8. BRI PO values at VT and RCT combined, Test 1 vs Test 2.
15
DISCUSSION
The primary purpose of this study was to determine whether variables derived
from acoustic analysis of breath sounds could be used as surrogates of VT and RCT,
defined by respiratory gas analysis. An additional purpose of this study was to determine
if acoustic analysis was a reliable method of obtaining metabolic threshold
measurements. This was done by comparing a newly developed, proprietary acoustic
analysis of breathing sounds with the gold standard technique of respiratory GE using
open circuit spirometry. There was a tendency for the acoustic analysis to slightly
overestimate both HR and PO at VT, and slightly underestimate both HR and PO at RCT.
However, despite statistically significant differences, the small magnitude of the
differences in mean values and strong correlations between acoustic analysis and
respiratory gas analysis suggests no meaningful difference between VT and RCT
determined via acoustic analysis and respiratory gas exchange.
Comparable data to this study are limited. The results agree generally with
preliminary data which correlated to markers of VT and RCT derived through gas
exchange to those derived utilizing an earlier version of the acoustic analysis algorithm
(Foster et al., 2012). In the previous study, measurements were derived from two separate
exercise tests, which represent an inherent limitation, requiring the assumption that
responses during different exercise tests are the same. In that earlier study, exercise was
performed on fitness industry ergometers, which are inherently less accurate and reliable
than the laboratory ergometer used in this study.
16
The conceptual basis of BRI is sound intensity, which effectively represents the
Tidal Volume/expiratory time. Since the Tidal Volume increases rapidly at the beginning
of exercise, and then slowly throughout the remainder of incremental exercise bouts
(Davis, Whipp, & Wasserman, 1980), and expiratory time is probably getting smaller
over a bout of incremental exercise, the logic of the BRI approach is reasonable. The
current acoustic analysis technique did not allow for acceptable direct measurement of
expiratory time in simultaneous measurements. Some ‘extraneous sounds’, caused by the
microphone being inside the breathing valve, made interpretation of the breath recordings
more difficult. Follow up experiments, which are currently underway, may give better
estimates of the magnitude of decrease in expiratory time. Perhaps simultaneous
collection of measurements may not have been the best method. This caused difficulty
with the BRI approach which was developed using an independent microphone. Further
studies may yield advances in the BRI algorithm.
It is suggested that further research using acoustic analysis be conducted, with
special attention to reproducibility and reliability and to making measurements of
changes in inspiratory and expiratory time, data which is not in the literature. Tests
utilizing the methods, during independent, well controlled exercise tests may provide
easier analysis of acoustic recordings. Further, other elements of the acoustic analysis that
BRI routinely uses with analysis of resting breathing recordings may prove of interest.
Experimentation with stage length should also be investigated. Shorter exercise stages
may yield a clearer demarcation of the phases of the respiratory cycle. Conventionally, it
is believed that VT is better detected utilizing a shorter protocols (Wasserman, Hansen,
Sue, & Whipp, 1987). We chose to use longer stages, on the premise that more nearly
17
steady state conditions would be achieved. However, a more ramp like procedure might
yield better results.
The data support the concept that a simple analysis of breath sounds during
exercise can provide a reasonable surrogate of physiologic threshold events measured
using state of the art GE technology. As such, the acoustic analysis may provide a
simpler method for making threshold measurements, which may be useful both
diagnostically and for exercise prescription.
18
REFERENCES
American College of Sports Medicine. (2010). Guidelines for exercise testing and
prescriptions. 8th ed. Philadelphia. (PA): Lippincott Williams and Wilkins.
Anderson, K., Qiu, Y., Whittaker, A. R., & Lucas, M. (2001). Breath sounds, asthma, and
the mobile phone.The Lancet, 358 (9290), 1343-1344.
Bang, O. (1936). The lactate content of the blood during and after muscular exercise in
men. Skandivica Archives of Physiology Supplement. 10: 51-82.
Beaver, W.L., Wasserman, K., & Whipp, B.J. (1986). A new method for detecting the
anaerobic threshold by gas exchange. Journal of Applied Physiology. 60: 2020-
2027.
Borg, G. (1980). A category scale with ratio properties for intermodal and interindividual
comparisons. Proceedings of the 22nd
International Congress of Psychology.
Leipzig; VEB Deutscher Verlag.
Borg, G.A.V. (1973). Perceived exertion: a note on `history’ and methods. Medicine and
Science in Sports. 5: 90-93.
Christansen, J., Douglas, C.G., & Haldand, J.S. (1914). The absorption and dissociation
of carbon dioxide of human blood. Journal of Physiology (London). 48: 244-271.
Condello, G., Reynolds, E., Schnieder, A., Wheery, E., Knutson, M., Casolino, E.,
Doberstein, S., Gibson, M., de Koning, J.J., & Foster, C. (2012). A simplified
approach for estimateing VT and RCT. Medicine & Science in Sports &
Exercise. 44: 2416.
Davis, J.A., Whipp, B.J., & Wasserman, K. (1980). The relation of ventilation to
metabolic rate during moderate exercise in man. Journal of Applied Physiology.
44: 97-108.
DeKoning, J. J., Foster C., Bakkum A., Kloppenburg S., Thiel C., Joseph T., Cohen J., &
Porcari J. P., (2011). Regulation of pacing strategy during athletic
competition. PLoS ONE, 6(1), 1-5. doi: 10.1371/journal.pone.0015863
Eston, R.G., Davies, B.L., & Williams, J.G. (1987). Use of perceived effort ratings to
control exercise intensity in young healthy adults. European Journal of Applied
Physiology and Occupational Physiology. 56 (2): 222-224.
19
Foster C, Yee NB, Stamopoulos C, Nacy G., (2012). Breath sound analysis as a surrogate
for gas exchange measurement of ventilatory and respiratory compensation
thresholds. Proceedings European College of Sports Science 17: 58.
Foster, C., Porcari, J.P., Anderson, J., Paulson, M., Smaczny, D., Webber, H., Doberstein,
S., & Udermann, B. (2008). The talk test as a marker of exercise training
intensity. Journal of Cardiopulmonary Rehabilitation & Prevention. 28 (1): 24-
30.
Jeans, EA, Foster, C, Porcari, JP, Gibson, M, and Doberstein, S. (2011). Translation of
exercise testing to exercise prescription using the talk test. Journal of Strength
and Conditioning Research. 25(3): 590-596.
Hill, A.V., Long, C.N.H., & Lupton, H. (1924). Muscular exercise, lactic acid and the
supply and utilization of oxygen: Part VI. The oxygen debt at the end of exercise.
Proceedings of the Royal Society of London. 97: 127-137.
Karlsson, J., & Jacobs, I. (1982). Onset of blood lactate accumulation during muscular
exercise as a threshold concept: Theoretical considerations. International Journal
of Sports Medicine. 3: 190-201.
Kindermann, W., Simon, G., & Keul, J. (1979). The significance of the aerobic-anaerobic
transition for the determination of work load intensities during endurance training.
Europoean Journal of Applied Physiology. 42: 25-34.
McLellan, T.M., & Skinner, J.S. (1981). The use of the aerobic threshold as a basis for
training. Canadian Journal of Applied Sport Sciences. 6: 197-201.
Mezzani, A., Hamm, L.F., Jones, A.M., McBride, P.E., Moholdt, T., Stone, J.A.,
Urhausen, A., & Williams, M.A. (2012). Aerobic exercise intensity assessment
and prescription in cardiac rehabilitation. Journal of Cardiopulmonary
Rehabilitation and Prevention. 32: 327-350.
Noble, B.J., & Robertson. (1996). Perceived Exertion. Champaign, IL; Human Kinetics.
pp. 4-5, 61-77.
Owles, W.H. (1930). Alterations in the lactic acid content of the blood as a result of light
exercise and associated changes in the CO2 combining power of the blood and in
the alveolar CO2 pressure. Journal of Physiology. 69: 214-237.
Pokan, R., Hofman, P., Preidler, K., Leitner, H., Dusleag, J., Eber, et al. (1993).
Correlation between inflection of heart rate/work performance curve and
myocardial function in exhausting cycle ergometer exercise. European Journal of
Applied Physiology. 67: 385-388.
20
Reichert, S., Gass, R., Brandt, C., & Andres, E. (2008). Analysis of respiratory sounds:
State of the art.Clin Med: Circ Respirat Pulm Med. 2: 45-58.
Wasserman, K., Hansen, J. E., Sue, D. Y., Whipp, B. J., & Casaburi, R.
(1994). Principles of exercise testing and interpretation. 2: 2, 36, 96.
Wasserman, K., Hansen, J.E., Sue, D.Y., & Whipp, B.J. (1987). Principles of exercise
testing and interpretation. Philadelphia: Lea & Febiger.
Wasserman, K., & McIlroy, M.B. (1964). Detecting the threshold of anaerobic
metabolism. American Journal of Cardiology. 14: 844-852.
West, J. B. (1990). Ventilation. Respiratory Physiology. 4: 11-20.
APPENDIX A
INFORMED CONSENT
22
INFORMED CONSENT FOR “Acoustic Analysis as a Surrogate for Gas
Exchange”
1. I, ______________________, give my informed consent to participate in this
study designed to evaluate the validity of acoustic analysis as a
reliable/reproducible surrogate for gas exchange when determining metabolic
thresholds of exercise, and in turn verify its reliability as a test for prescribing
exercise. As a participant in this study, I understand that I will be in the Human
Performance Lab on two separate occasions for approximately 45 minutes each
session to complete the two separate exercise tests. I have been informed that the
study is under the direction of Carl Foster, Ph.D. who is a Professor in the
Department of Exercise and Sport Science at the University of Wisconsin-La
Crosse. I consent to the presentation, publication and other release of summary
data from the study, which is not identifiable with myself.
2. I have been informed that there are two phases of the overall study. In both
phases, I will be required to perform a maximal incremental exercise test on a
cycle ergometer, while my breathing will be monitored from a scuba-like
mouthpiece, and my heart rate is monitored from a chest strap. Every two
minutes, the principle investigator will increase the resistance on the bicycle, and
I will be asked how hard I am working using a rating of perceived exertion scale
(RPE). This will continue until I have reached my maximum exercise potential. I
also understand that during these tests a recording of my breathing will be taken
for analysis.
3. I have been informed that during these two exercise tests, there are no risks to me
as a participant other than the fatigue normally associated with high intensity
exercise. I may also find the scuba-like mouthpiece used to monitor my breathing
to be an inconvenience, however it will not cause me any harm.
4. The primary benefit of this study is to determine if variables derived from my
breath sounds can be correlated to different threshold measurements taken
through respiratory gas exchange conventionally. RPE and heart rate will be
recorded as a basis, as they are shown to be reproducible among individuals from
one test to the next; as well as correlate with VO2 Max test measurements (RPE,
heart rate, and metabolic respiratory responses). If this can be shown, a new –
simplistic - method of potentially determining metabolic thresholds may be
studied further.
5. I have been informed that the investigators will answer questions regarding the
procedures throughout the course of the study.

23
6. I have been informed that I am free to decline participation, or to withdraw from
the study at any time without penalty.
7. Concerns about any aspects of this study may be referred to Dr Carl Foster (608
785 8687). Questions about the protection of human subjects may be addressed to
Dr Bart Vanvoorhis (608 785 6892), Chair of the UW-L Institutional Review
Board for the protection of human subjects.
Investigator: _______________________
Subject (Print Name): _______________________ Subject Signature:
_____________________________
Date: _________________
I have observed the informed consent process for this subject and am writing my name
below to signify that I believe that the subject understands the nature of the study and the
risks that they are being asked to assume.
Witness: __________________________

APPENDIX B
REVIEW OF LITERATURE
25
REVIEW OF LITERATURE
The purpose of this document is to review the literature concerning an innovative
proposed method to determine metabolic threshold measurements, such as ventilatory
threshold (VT) and respiratory compensation threshold (RCT), by using acoustic analysis
of breath sounds as a surrogate.
Current Methodology
A plethora of data exists regarding measurement of metabolic thresholds.
Methods range in complexity, from the more simplistic, self-reported, and subjective,
such as the Rate of Perceived Exertion (RPE) scale and the Talk Test (TT). To the
technically complex, objective, such as heart rate (HR), maximal oxygen consumption
(VO2max), heart rate reserve (HRR), and respiratory gas exchange. Blood lactate threshold
(LT) and the “onset of blood lactate accumulation” (OBLA) have been utilized as a
marker for exercise capacity (Bang, 1936; Christansen, Douglas, & Haldand, 1914; Hill,
Long, & Lupton, 1924; Owles, 1930). HR and HRR, as it relates to oxygen (O2) uptake
kinetics, have also been useful when determining functional capacity in exercise. Power
output (PO) and percent peak power output, which is expressed in watts (W), also give
one an indication of exercise capacity (DeKoning, 2012).
Exercise tests which obtain large amounts of metabolic, ventilatory, and
circulatory data are the most widely accepted determinant of aerobic fitness (Wasserman,
26
Hansen, Sue, Whipp & Casaburi, 1994). Tests utilizing open circuit spiometry produce
measurements for VT, RCT, and VO2max have been a long standing ‘tradition’ in
the exercise discipline. Respiratory gas exchange, and measurements for VT and RCT, is
determined from a relatively simple analysis of VO2 and carbon-dioxide production.
Analyzers measuring O2 and CO2 can be calibrated to produce a highly accurate
measurements, which also yields accurate measures for VO2/VCO2 (Meckel, 2002).
Mechanics of Breathing
The process of breathing is self-sustaining, involuntary and voluntary, and can be
influenced by many factors. Behavior factors influencing breathing include: crying,
laughing, coughing, whistling, singing, and talking (Meckel, 2002; Shea, 1996).
However, the ultimate function of ventilation, both at rest and during exercise, is O2
demand, delivery and utilization, as well as, CO2 removal and disposal (Meckel, 2002).
During exercise, an increase in need for O2 is required (depending on work rate)
as well as increased removal of CO2 (Wasserman et al., 1994). Simultaneously, an
increase in lung function, pulmonary circulation, cardiovascular function, and peripheral
circulation is necessary. In conjunction, total ventilation – which can be measured from
the CO2 present in the expired air – is required to increase accordingly (West, 1990). In
addition, minute ventilation (VE) increases at a rate appropriate to cover CO2 produced
during exercise (Wasserman et al., 1994).
Acoustic Analysis
Air movement, which theoretically is the process of inspiration and expiration,
produces breath sounds, a conceptually simple diagnostic tool that has been used mainly
27
in the field of medicine (Reichert, Gass, Brandt & Andres, 2008). Commonly heard
through the chest wall with the assistance of a stethoscope, different breath sounds can be
heard and distinguished as normal or abnormal, leading to a diagnostic criterion for
pulmonary or respiratory obstructions and diseases.
Anderson et al. (2001) have suggested that the human ear is able to detect such
breath sounds, normal as well as abnormal in a study which concluded the ability to
distinguish asthmatics from non-asthmatics simply based on key sound differences heard
among subjects’ breath recording. The use of a small microphone in a mobile telephone
allowed for recording of breath sounds in a voicemail which were then analyzed and
notably disguisable. Furthermore, a study conducted by Reichert et al. (2008) initiated
that recording and analyzing breath sounds enhanced the understanding of certain
respiratory sounds linked to pathologies.
BreathResearch Incorporated (California, USA) is a well-established, research
based company which utilizes such analyses of breath sounds. Acoustic analysis of breath
recordings, generated from a proprietary algorithm, provides information about health,
fitness, and overall wellness. Seven metrics of the breath recording are taken into
account, including: rate, depth, tension, flow, variability, apnea, and respiratory cycle.
Subsequent to recording breath sounds, a “BRI” score is produced based on these seven
metrics. Breath sounds which are captured and analyzed then provide useful information
about health and wellness; a technically sophisticated, yet conceptually simple, method of
analyzing acoustics is utilized to produce such information.
Published data including the correlation of such acoustic analysis and markers of
metabolic thresholds does not exist, consequently making this study extraordinarily
28
unique. Preliminary results from a pilot study correlated markers of VT and RCT derived
through gas exchange to those found through acoustic analysis and Digital Signal
Processing (DSP) (Foster, Yee, Stamopoulous, Nacy, 2012). An increase in HR and PO
were also comparable, without significant differences, to ensure reproducibility of test
results between the individual subjects. The protocol consisted of subjects performing
two incremental cycle ergometer exercise tests where, during the first, gas exchange
measures were obtained, and, during the second, breath sounds were recorded using a
small microphone with a recording application on an Apple device. On-going data results
correlating Threshold 1 (T1) and Threshold 2 (T2) markers of acoustic analysis are
comparable to those marked during respiratory gas exchange analysis as VT and RCT,
respectively.
The variables contained in the analysis of breath sounds, relevant to produce
comparable data, seem to be duration and intensity of each breath stage at T1 and T2.
Combined variables, such as inhalation/exhalation duration ratio and
inhalation/exhalation intensity ratio, prove useful when analyzing such information and
also allocate a more precise analysis. Generally, it is important to know where the
capacity of the O2 is maximized within a breath cycle (i.e. right after inhalation, right
before exhalation etc).
Validity
Imperative to support this innovative method of acoustic analysis is to test validity
by reproducibility and reliability; similar to testing other simplistic, subjective, self-
reported measurements to guide exercise – such as RPE and the TT. In studies testing the
reliability of such subjective methods, it is best to objectively measure intensity as well
29
(Zanettini et al., 2012). Likewise, and relative to this purposed surrogate, objective
measurements such as HR, RPE, and gas exchange measurements will be taken
simultaneously.
30
REFERENCES
Anderson K, Qiu Y, Whittaker AR, Lucas, M. (2001). Breath sounds, asthma, and the
mobile phone.The Lancet, 358 (9290), 1343-1344.
Bang, O. (1936). The lactate content of the blood during and after muscular exercise in
men. Skandivica Archives of Physiology Supplement. 10: 51-82.
Christansen, J., Douglas, C.G., & Haldand, J.S. (1914). The absorption and dissociation
of carbon dioxide of human blood. Journal of Physiology (London). 48: 244-271.
DeKoning, J. J., Foster C., Bakkum A., Kloppenburg S., Thiel C., Joseph T., Cohen J., &
Porcari J. P., (2011). Regulation of pacing strategy during athletic
competition. PLoS ONE, 6(1), 1-5. doi: 10.1371/journal.pone.0015863
Foster C, Maud PJ. (1995). Blood Lactate, Respiratory, and Heart Rate Markers on the
Capacity for Sustained Exercise. Physiological assessment of human fitness. 2:
63-75.
Foster C, Yee NB, Stamopoulos C, Nacy G (2013). Breath sound analysis as a surrogate
for gas exchange measurement of ventilatory and respiratory compensation
thresholds. Proceedings European College of Sports Science 17: 58.
Hill, A.V., Long, C.N.H., & Lupton, H. (1924). Muscular exercise, lactic acid and the
supply and utilization of oxygen: Part VI. The oxygen debt at the end of exercise.
Proceedings of the Royal Society of London. 97: 127-137.
Meckel Y, Rotstein A, Inbar O. (2002). The effects of speech production on physiologic
responses during submaximal exercise. Medicine and science in sports and
exercise. 34(8): 1337-1342.
Owles, W.H. (1930). Alterations in the lactic acid content of the blood as a result of light
exercise and associated changes in the CO2 combining power of the blood and in
the alveolar CO2 pressure. Journal of Physiology. 69: 214-237.
Reichert S, Gass R, Brandt C, Andres E. (2008). Analysis of respiratory sounds: State of
the art.Clin Med: Circ Respirat Pulm Med. 2: 45-58.
Shea S. (1995). Behavioral and Arousal-Related Influences on Breathing in Humans.
Expiramental Physiology. 81: 1-26.
31
Wasserman K, Hansen JE, Sue DY, Whipp BJ, Casaburi R. (1994). Principles of exercise
testing and interpretation. 2: 2, 36, 96.
West JB. (1990). Ventilation. Respiratory Physiology. 4: 11-20.
Zanettini R, Centeleghe P, Franzelli C, Mori I, Benna S, Penati C, Sorlini N. (2012).
Validity of the Talk Test for exercise prescription after myocardial
revascularization. Euro Jour of Prev Card. 0(00): 1-7.