Embed Size (px)
Citation preview
University of Wah Journal of Science and Technology (ISSN: 2523-0123)
i
ISSN: 2616-4396 (Online)
ISSN: 2523-0123 (Print)
Abstracted and Indexed in:
PASTIC SCIENCE ABSTRACTS
UNIVERSITY OF WAH
JOURNAL OF
SCIENCE AND TECHNOLOGY
Vol. No. 2
December 2018
University of Wah
www.uow.edu.pk
www.uwjst.org.pk
University of Wah Journal of Science and Technology (ISSN: 2523-0123)
i
UNIVERSITY OF WAH
JOURNAL OF SCIENCE AND TECHNOLOGY
Vol. No. 2
December 2018
University of Wah, Quaid Avenue, Wah Cantt, Pakistan.
Ph: 051-9157000, 051-451425256-7, Fax: 051-9311431
Website: www.uow.edu.pk
www.uwjst.org.pk [email protected]

University of Wah Journal of Science and Technology (ISSN: 2523-0123)
ii
University of Wah Journal of Science and Technology (UWJST)
The UWJST is an international, multidisciplinary, peer-reviewed, academic open access journal published
annually by University of Wah, Wah Cantt, Pakistan. The UWJST offers a platform to scientists and engineers
to publish their original and current research of high scientific value in the areas of Basic Sciences, Computer
Science and Engineering at international level. Articles published in the Journal illustrate innovations,
developments and achievements in the relevant areas. The Journal is being published electronically as well as
a paper version. It is easily accessible and free of charge.
Aim and Scope
Aim of the Journal is to provide platform for the researchers, innovators, scholars and students to share their
research worldwide. The Journal promotes research in multi-disciplines of Basic Sciences, Computer Science
and Engineering for the advancement of knowledge and understanding. The Journal provides a quality readable
and valuable addition to the knowledge; serves as a source for the researchers and provides support to the
scholars to enable them to undertake and disseminate their research with development of their own skills of
reasoning and understanding.
Preference for publication in the Journal is given to the research papers and articles which contain advanced
research concepts, innovative and up to date ideas.
University of Wah Journal of Science and Technology (ISSN: 2523-0123)
iii
Editorial Board
Editor-in-Chief
Prof. Aamir Hanif (Chairperson, Department of Electrical Engineering, UW)
Associate Editor(s)
Dr. Adnan Tariq (Associate Professor, Department of Mechanical Engineering, UW)
Assistant Editor(s)
Dr. Maria Imtiaz (Assistant Professor, Department of Mathematics, UW)
Dr. Shaukat Ali (Assistant Professor, Department of Mechatronics Engineering, UW
National Members International Members
Prof. Rani Faryal Faheem Tahir
Quaid-i-Azam University,
Islamabad.
Prof. Mohammad Mujahid
SCME, NUST,
Islamabad.
Dr. Naheed Riaz
Associate Professor,
Department of Chemistry,
The Islamia University of Bahawalpur.
Prof. Tahir Mehmood
University of Engineering and Technology,
Taxila.
Prof. Aftab Sadiq
Principal,
Wah Engineering College,
University of Wah, Wah Cantt.
Prof. A. K. Salariya
Dean,
Faculty of Engineering,
University of Wah, Wah Cantt.
Prof. Ghulam Mustafa Mamoor
Dean,
Faculty of Management Sciences,
University of Wah, Wah Cantt.
Prof. Uzma Ghazanfer
Dean,
Faculty of Basic Sciences,
University of Wah, Wah Cantt.
Prof. Asghari Bano
Department of Bio Sciences,
University of Wah, Wah Cantt.
Prof. M. S. Reddy
Chairman, Asian PGPR Society Auburn
University, Auburn, AL USA.
Prof. Abdul Rehman Khan
Environmental Life Sciences,
Kuwait Institute for Scientific Research,
P.O. Box 24885, Safar 13109 Kuwait.
Prof. Arif Masood
Department of Civil and Environmental
Engineering,
University of Illinois, USA.
Prof. Syed M. Ahmed
Head, Department of Construction Management
East Carolina University, USA.
Prof. David Benyon
Edinburgh Napier University,
Merchiston, Edinburgh, Scotland.
Prof. Hamid R. Arabnia
Department of Computer Science,
University of Georgia, USA.
Prof. Irfan Anjum Manarvi
College of Engineering,
Prince Sultan University,
Riyadh, Saudi Arabia.
Prof. Ismat Shah
Department of Physics and Astronomy,
University of Delaware, USA.
Dr. Rafiq Ahmad
Assistant Professor,
Department of Mechanical Engineering,
University of Alberta, Canada.
University of Wah Journal of Science and Technology (ISSN: 2523-0123)
iv
Prof. Sajid Hussain
Department of Mechanical Engineering,
University of Wah, Wah Cantt.
Prof. Zulfiqar Ahmad
Department of Civil Engineering,
University of Wah, Wah Cantt.
Prof. M. Afzal Bhati
Chairperson,
Department of Computer Sciences,
University of Wah, Wah Cantt.
Prof. Mirza M. Javed
Department of Electrical Engineering,
University of Wah, Wah Cantt.
Dr. Mohammad Asim Farooqi
Chairperson,
Department of Mechatronics Engineering,
University of Wah, Wah Cantt.
Col. (R) Hafiz Sibgat Ullah Fazil
Chairperson,
Department of Mechanical Engnieering,
University of Wah, Wah Cantt.
Dr. Zaheer Ahmad
Chairperson,
Department of Chemistry,
University of Wah, Wah Cantt.

University of Wah Journal of Science and Technology (ISSN: 2523-0123)
v
UNIVERSITY OF WAH
JOURNAL OF SCIENCE AND TECHNOLOGY
Vol. No. 2
December 2018
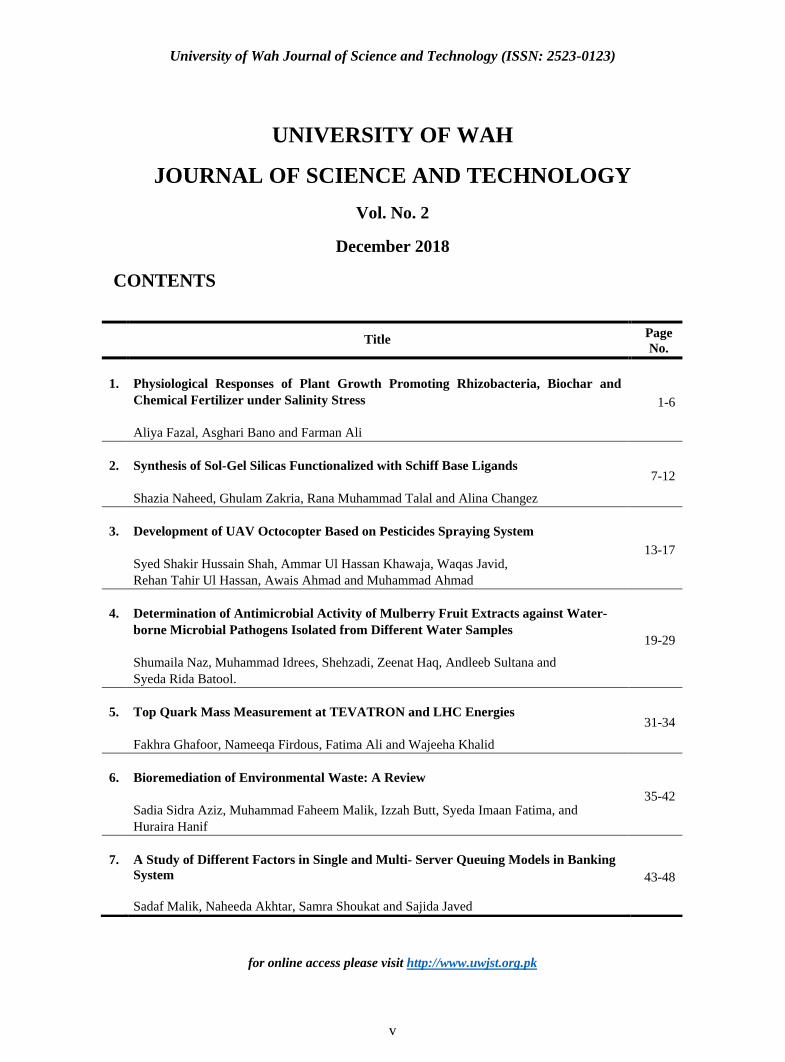
CONTENTS
for online access please visit http://www.uwjst.org.pk
Title
Page
No.
1. Physiological Responses of Plant Growth Promoting Rhizobacteria, Biochar and
Chemical Fertilizer under Salinity Stress
Aliya Fazal, Asghari Bano and Farman Ali
1-6
2. Synthesis of Sol-Gel Silicas Functionalized with Schiff Base Ligands
Shazia Naheed, Ghulam Zakria, Rana Muhammad Talal and Alina Changez
7-12
3. Development of UAV Octocopter Based on Pesticides Spraying System
Syed Shakir Hussain Shah, Ammar Ul Hassan Khawaja, Waqas Javid,
Rehan Tahir Ul Hassan, Awais Ahmad and Muhammad Ahmad
13-17
4. Determination of Antimicrobial Activity of Mulberry Fruit Extracts against Water-
borne Microbial Pathogens Isolated from Different Water Samples
Shumaila Naz, Muhammad Idrees, Shehzadi, Zeenat Haq, Andleeb Sultana and
Syeda Rida Batool.
19-29
5. Top Quark Mass Measurement at TEVATRON and LHC Energies
Fakhra Ghafoor, Nameeqa Firdous, Fatima Ali and Wajeeha Khalid
31-34
6. Bioremediation of Environmental Waste: A Review
Sadia Sidra Aziz, Muhammad Faheem Malik, Izzah Butt, Syeda Imaan Fatima, and
Huraira Hanif
35-42
7. A Study of Different Factors in Single and Multi- Server Queuing Models in Banking
System
Sadaf Malik, Naheeda Akhtar, Samra Shoukat and Sajida Javed
43-48

UW Journal of Science and Technology 2 (2018) 1-6
2523-0123©UWJST 2018: Personal Use Permitted, but republicaiton/redistribution requires UW permission.
1
Abstract—This research work is conducted to evaluate the
physiological responses of phosphate solubilizing
rhizobacteria (Pseudomonas sp.), biochar and N-fertilizer
under salt stress. Biochar and fertilizer are mixed in soil (5:1)
while Pseudomonas sp. is applied as seed soaking at 106
cells/ml prior to seed sowing. Salt stress with 150mM NaCl is
applied for three days (3d) at three (3) leaf stage. The obtained
results depicted significant effect of Pseudomonas sp. on root
fresh weight and leaf area both under unstressed and salt
stress conditions followed by biochar. Treatment with biochar
and Pseudomonas sp. resulted in increased root fresh weight,
leaf area, chlorophyll fluorescence and decreased osmotic
potential by 60% particularly under salt stress. On the
contrary, fertilizer treatment is found to be ineffective on seed
germination (results not presented here), however increased
chlorophyll content by 77%. Under salt stress, fertilizer
treatment increased the osmotic potential of leaves. The
combined treatments of fertilizer with Pseudomonas and
biochar significantly increased root fresh weight, chlorophyll
content and leaf area under salt stress. It is inferred that
combined application of biochar and Pseudomonas can
augment the effects of N-fertilizer on plants.
Index Terms—Stomatal index, Leaf area, Salt stress,
Inoculation, Trichomes, Plant growth promoting
rhizobacteria (PGPR).
I. INTRODUCTION
ALINITY is detrimental for several processes
occurring in plant like photosynthesis, lipid
metabolism and synthesis of protein. The initial response
of plant to salinity is decreased in leaf surface area
followed by inhibition in the expansion of leaf.
Manuscript received December 1, 2017; accepted May 23, 2018.
A. Fazal (email:[email protected]) and F. Ali (email:
[email protected]) are affiliated with State Key Laboratory of
Pharmaceutical Biotechnology, School of Life Sciences, Nanjing
University, Nanjing, China.
A. Bano is affiliated with Department of Biosciences, University of
Wah, Wah Cantt, Pakistan. (email: [email protected])
Corresponding author email: [email protected])
Plant photosynthesis is badly affected when plant is
exposed to salinity [1]. Salinity stress causes significant
reduction in water uptake that ultimately results in reduced
growth rate due to excessive buildup of salts in the plant
causing premature senescence [2]. However, plants have
adopted certain biochemical pathways that offer salt
tolerance to plants. These pathways are associated with
preservation and uptake of water, protection of protoplast,
maintaining ion homeostasis, synthesis of osmolytes,
specific proteins and certain oxidant scavenging enzymes
that protect the plant from detrimental effects of free
radicals [1].
Fertilizers both organic and inorganic add fertility to soil
[3]. However in tropical conditions, inorganic fertilizers
are less competent in weathered and highly degraded soils
and there is less accessibility to resource-pool in using
inorganic fertilizers [4]. Therefore, organic fertilizers are
preferable use as they enhance efficiency of nutrients
because of rapid rate of mineralization in the soil [1, 3, 5-
20].
Biochar addition seems to be an efficient technique only
if it is applied to permanently farmed soils [5].
Enhancement in yield generally occurs when soil is treated
with hardwood biochars and chars possessing high N
content [21].
Many plant growth promoting rhizobacteria (PGPR)
facilitate plant growth indirectly by reducing plant
pathogens or directly by facilitating the uptake of nutrients
from environment. In addition, PGPR can also affect plant
growth by increasing germination rate, root and shoot
growth and weight, yield, leaf area, chlorophyll content, K
and N uptake, protein content and delayed leaf senescence
[22]. In [7], it is stated that combined inoculation of
Azotobacter, Azospirillum, Pseudomonas, and
Mesorhizobium increases grain yield and biomass in
chickpea. Whereas it increases biomass of maize by 99 %
and 96 % respectively, when seeds are inoculated with two
University of Wah
Journal of Science and Technology
www.uow.edu.pk
Physiological Responses of Plant Growth
Promoting Rhizobacteria, Biochar and
Chemical Fertilizer Under Salinity Stress Aliya Fazal, Asghari Bano and Farman Ali
S
UW Journal of Science and Technology 2 (2018) 1-6
2523-0123©UWJST 2018: Personal Use Permitted, but republicaiton/redistribution requires UW permission.
2
P-solubilizing bacteria (Serratiamarcescens EB-67 and
Pseudomonas spp. CDB-35) [11].
Present investigation is aimed to evaluate the effects of
biochar, Pseudomonas and N-fertilizer alone and in
combination on some physiological traits of maize under
control and induced salt stress.
II. MATERIALS AND METHODS
A. Plant material and growing conditions
Maize seeds are surface sterilized by shaking in 95%
ethanol for 2 to 3 min followed by shaking in 10% chlorox
for 2-3 min. Thereafter, seeds are thoroughly washed with
autoclaved distilled water. Pot experiment is conducted and
seeds are sown in plastic pots (width 7cm, length 11cm)
and grown in growth chamber with 14h photoperiod at
22/26°C. The biochar (derived from Poplar sawdust) is
autoclaved prior to mixing in soil with urea (5:1). N-
Fertilizer (1.20 g/pot), is put immediately after sowing and
then immediately irrigated [8].
B. Inocula preparation
Inoculum is prepared by inoculating LB broth with 24h
old fresh culture of Pseudomomas sp. (Acc No KF307196)
the culture is incubated on a rotary shaker for 48h followed
by centrifugation on a centrifuge (Labofuge 400e) for 10
min at 10,000 rpm. The supernatant is discarded while
pellet is suspended in distilled water to adjust the optical
density 1 at OD 660nm to get bacterial count of
106cells/ml. Sterilized seeds are then soaked in the inocula
thus prepared for 2 to 4h. Seeds are sown in plastic pots (6
plants per pot) containing biochar @ 5g/Kg in autoclaved
soil and sand mixed in 3:1 ratio.
C. Induction of salt stress
Salt stress is induced after 2 weeks of sowing by adding
aqueous solution of NaCl (150mM) for 3d.
D. Osmotic potential
Cell sap (after 17 days of sowing) from the leaves of
control and treated plants is extracted to measure osmotic
potential with the help of freezing point osmometer using
the technique developed by Capell and Doerffling [10].
E. Root fresh weight
Fresh weight of leaf and root is measured using electric
balance.
F. Leaf area
After 17 days of sowing, plants are harvested and their
leaf area is calculated using equation (1), by taking average
height (cm) and width (cm) of three plants from all the
treatments [23].
Leaf area (cm2) = ℎ𝑒𝑖𝑔ℎ𝑡 × 𝑤𝑖𝑑𝑡ℎ (1)
G. Measurement of stomata and epidermal appendages
Dehydrated leaves are randomly taken from the plant
and boiled in lactic acid. The adaxial surface of leaf is
pealed and observed in a light microscope at 20x, and the
total number of stomata and other epidermal cells are
counted. Stomatal Index (SI) is calculated using equation
(2) as [24].
SI(%) =No. of stomata
No. of stomata + No. of epidermal cells× 100 (2)
H. Chlorophyll fluorescence
Chlorophyll fluorescence is measured with a portable
Chlorophyll Fluorometer after 20 min of dark adaptation.
Chlorophyll fluorescence is expressed as 𝐹𝑣
𝐹𝑚 ratio. It is
calculated as:
FV
Fm=
Fm − F0
Fm (3)
Where Fm and F0 are maximal and minimal fluorescence
of dark adopted leaves respectively and Fv is variable
fluorescence [25].
I. Chlorophyll content
Chlorophyll content of fully expanded young maize
leaves is measured using Soil-Plant Analyses Development
(SPAD) instrument [26].
J. Statistical Analysis
Analysis of variance (ANOVA) is performed using
factorial randomized complete plot design to assess
significant variation. Significant differences between
treatment means is determined through (LSD) tests. Least
significant difference is measured at P<0.0 5 and MS Excel
software is used to illustrate and compare data on figures
[27].
III. RESULTS
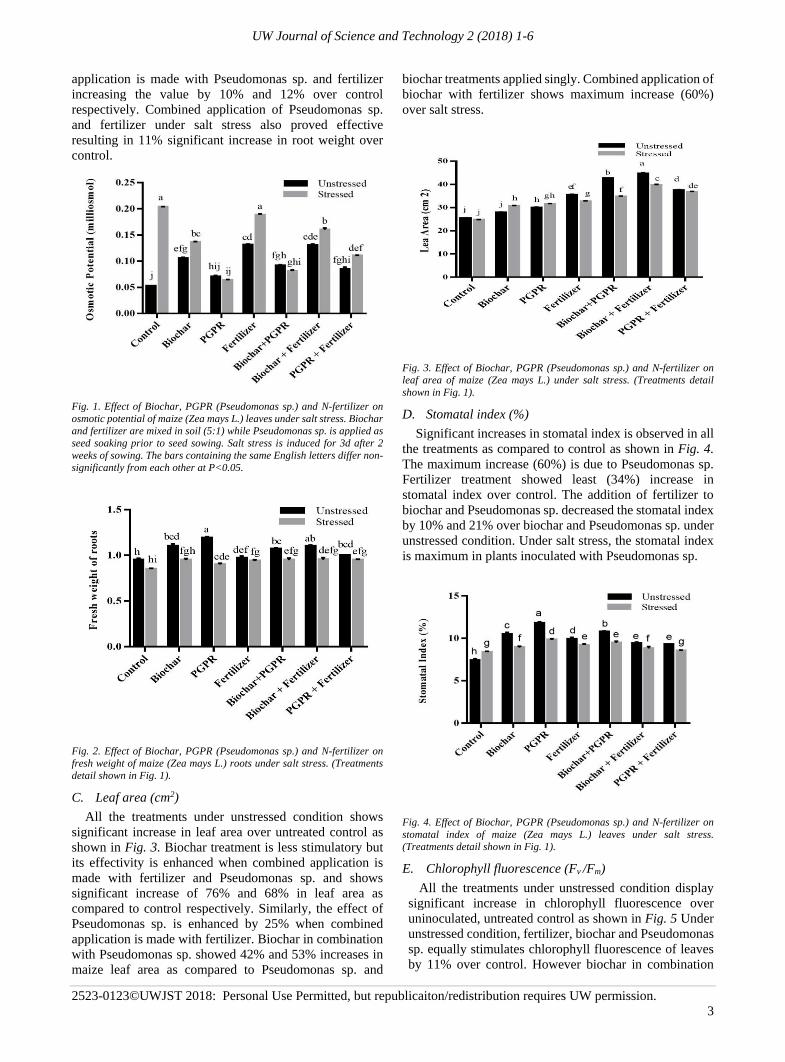
A. Osmotic potential
The maximum increase (150%) in the osmotic potential
is due to fertilizer treatment which is decreased in
combined treatment with Pseudomonas sp. under salt stress
as shown in Fig. 1. Fertilizer addition to biochar and
Pseudomonas sp. increased the osmotic potential of leaves
over biochar used alone. The combined treatment of
Pseudomonas sp. with biochar had no significant effect as
compared to Pseudomonas sp. inoculation alone but the
combined treatment of fertilizer with biochar and
Pseudomonas sp. are 21% and 46% lower over that of salt
stress respectively.
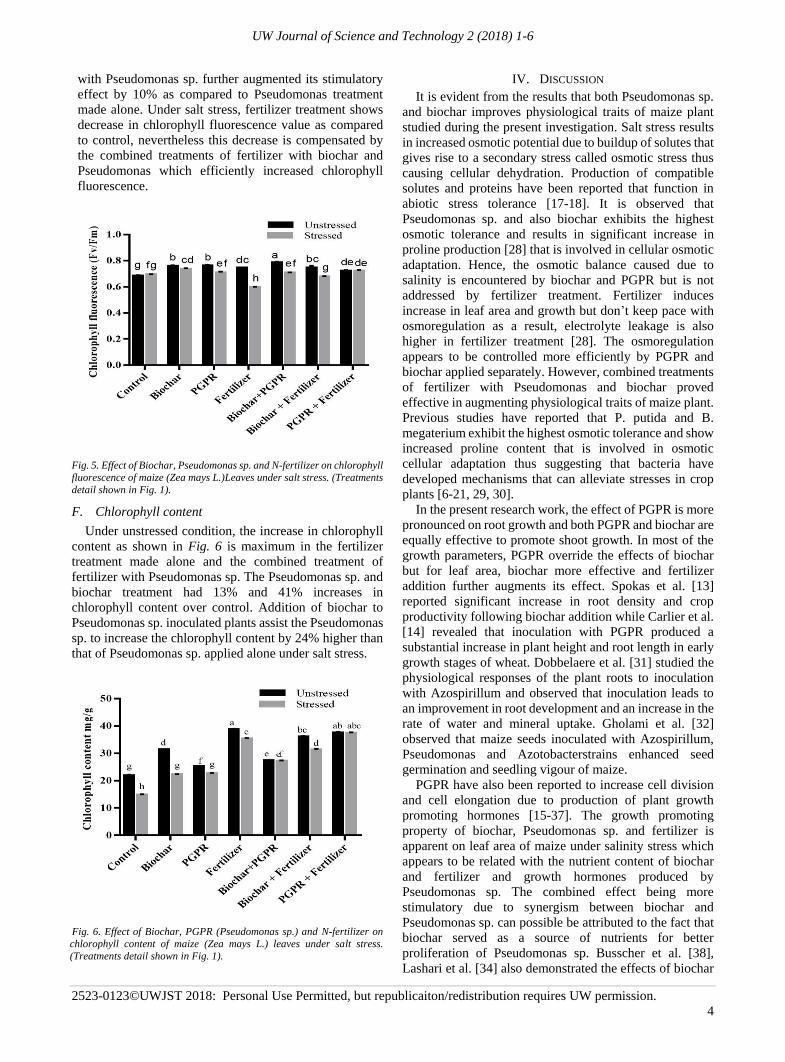
B. Fresh weight of roots
All the treatments significantly increased (26%-30%)
fresh weight of leaves under both unstressed and salt
stressed conditions respectively (results not presented).
The maximum significant increase (28%) in root fresh
weight is in plants inoculated with Pseudomonas sp. under
unstressed condition as shown in Fig. 2. The biochar and
fertilizer treatments has similar magnitude of increase and
their combined treatment do not differ significantly.
Pseudomonas sp. has significant (20%) increase over salt
stress. Biochar treatment under salt stress is less
stimulatory but it’s effectively is enhanced when combined
UW Journal of Science and Technology 2 (2018) 1-6
2523-0123©UWJST 2018: Personal Use Permitted, but republicaiton/redistribution requires UW permission.
3
application is made with Pseudomonas sp. and fertilizer
increasing the value by 10% and 12% over control
respectively. Combined application of Pseudomonas sp.
and fertilizer under salt stress also proved effective
resulting in 11% significant increase in root weight over
control.
Fig. 1. Effect of Biochar, PGPR (Pseudomonas sp.) and N-fertilizer on
osmotic potential of maize (Zea mays L.) leaves under salt stress. Biochar
and fertilizer are mixed in soil (5:1) while Pseudomonas sp. is applied as
seed soaking prior to seed sowing. Salt stress is induced for 3d after 2
weeks of sowing. The bars containing the same English letters differ non-
significantly from each other at P<0.05.
Fig. 2. Effect of Biochar, PGPR (Pseudomonas sp.) and N-fertilizer on
fresh weight of maize (Zea mays L.) roots under salt stress. (Treatments
detail shown in Fig. 1).
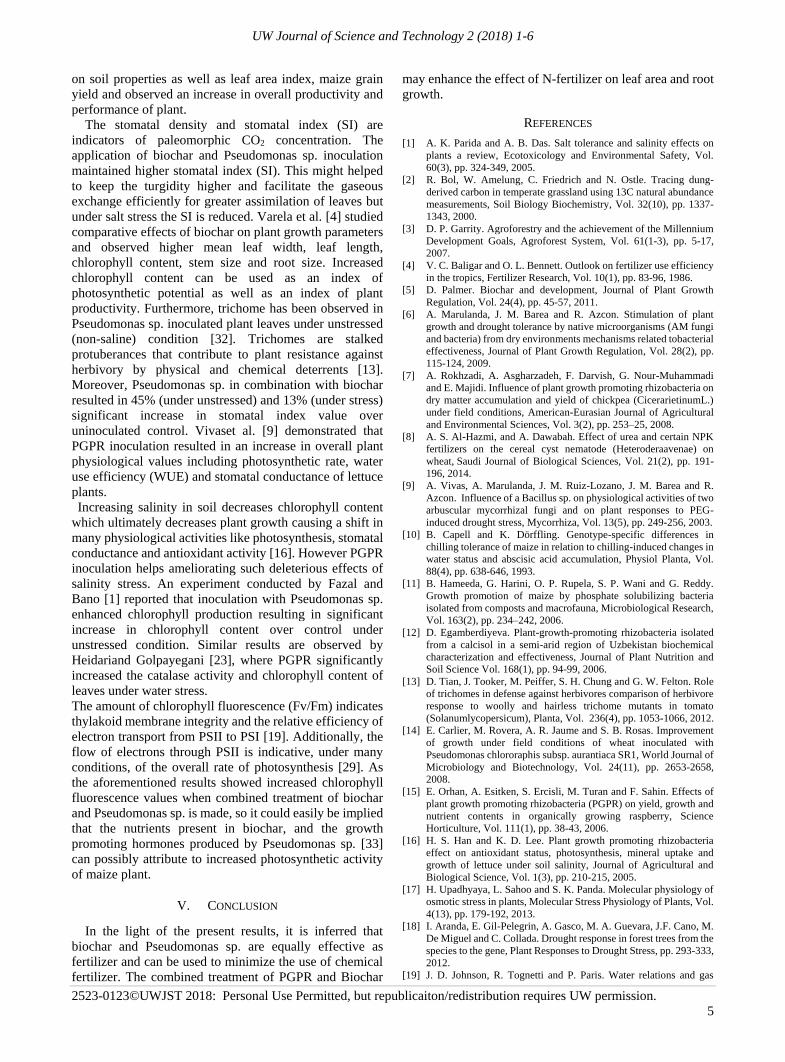
C. Leaf area (cm2)
All the treatments under unstressed condition shows
significant increase in leaf area over untreated control as
shown in Fig. 3. Biochar treatment is less stimulatory but
its effectivity is enhanced when combined application is
made with fertilizer and Pseudomonas sp. and shows
significant increase of 76% and 68% in leaf area as
compared to control respectively. Similarly, the effect of
Pseudomonas sp. is enhanced by 25% when combined
application is made with fertilizer. Biochar in combination
with Pseudomonas sp. showed 42% and 53% increases in
maize leaf area as compared to Pseudomonas sp. and
biochar treatments applied singly. Combined application of
biochar with fertilizer shows maximum increase (60%)
over salt stress.
Fig. 3. Effect of Biochar, PGPR (Pseudomonas sp.) and N-fertilizer on
leaf area of maize (Zea mays L.) under salt stress. (Treatments detail
shown in Fig. 1).
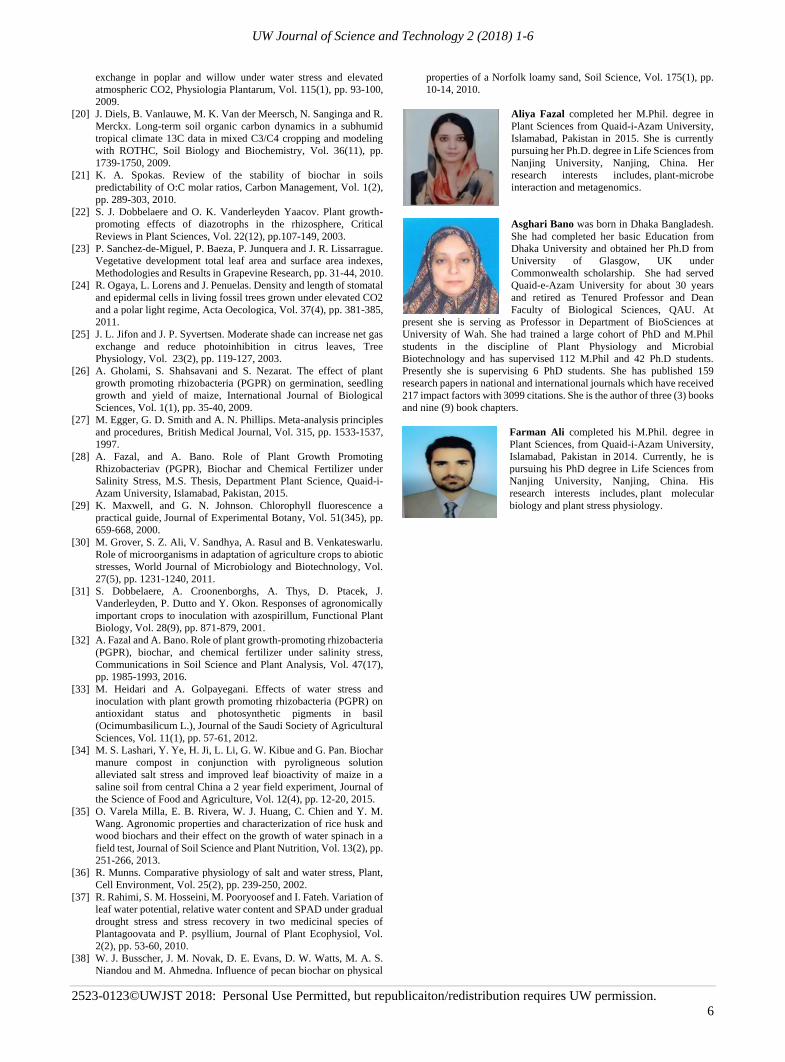
D. Stomatal index (%)
Significant increases in stomatal index is observed in all
the treatments as compared to control as shown in Fig. 4.
The maximum increase (60%) is due to Pseudomonas sp.
Fertilizer treatment showed least (34%) increase in
stomatal index over control. The addition of fertilizer to
biochar and Pseudomonas sp. decreased the stomatal index
by 10% and 21% over biochar and Pseudomonas sp. under
unstressed condition. Under salt stress, the stomatal index
is maximum in plants inoculated with Pseudomonas sp.
Fig. 4. Effect of Biochar, PGPR (Pseudomonas sp.) and N-fertilizer on
stomatal index of maize (Zea mays L.) leaves under salt stress.
(Treatments detail shown in Fig. 1).
E. Chlorophyll fluorescence (Fv /Fm)
All the treatments under unstressed condition display
significant increase in chlorophyll fluorescence over
uninoculated, untreated control as shown in Fig. 5 Under
unstressed condition, fertilizer, biochar and Pseudomonas
sp. equally stimulates chlorophyll fluorescence of leaves
by 11% over control. However biochar in combination
UW Journal of Science and Technology 2 (2018) 1-6
2523-0123©UWJST 2018: Personal Use Permitted, but republicaiton/redistribution requires UW permission.
4
with Pseudomonas sp. further augmented its stimulatory
effect by 10% as compared to Pseudomonas treatment
made alone. Under salt stress, fertilizer treatment shows
decrease in chlorophyll fluorescence value as compared
to control, nevertheless this decrease is compensated by
the combined treatments of fertilizer with biochar and
Pseudomonas which efficiently increased chlorophyll
fluorescence.
Fig. 5. Effect of Biochar, Pseudomonas sp. and N-fertilizer on chlorophyll
fluorescence of maize (Zea mays L.)Leaves under salt stress. (Treatments
detail shown in Fig. 1).
F. Chlorophyll content
Under unstressed condition, the increase in chlorophyll
content as shown in Fig. 6 is maximum in the fertilizer
treatment made alone and the combined treatment of
fertilizer with Pseudomonas sp. The Pseudomonas sp. and
biochar treatment had 13% and 41% increases in
chlorophyll content over control. Addition of biochar to
Pseudomonas sp. inoculated plants assist the Pseudomonas
sp. to increase the chlorophyll content by 24% higher than
that of Pseudomonas sp. applied alone under salt stress.
Fig. 6. Effect of Biochar, PGPR (Pseudomonas sp.) and N-fertilizer on
chlorophyll content of maize (Zea mays L.) leaves under salt stress.
(Treatments detail shown in Fig. 1).
IV. DISCUSSION
It is evident from the results that both Pseudomonas sp.
and biochar improves physiological traits of maize plant
studied during the present investigation. Salt stress results
in increased osmotic potential due to buildup of solutes that
gives rise to a secondary stress called osmotic stress thus
causing cellular dehydration. Production of compatible
solutes and proteins have been reported that function in
abiotic stress tolerance [17-18]. It is observed that
Pseudomonas sp. and also biochar exhibits the highest
osmotic tolerance and results in significant increase in
proline production [28] that is involved in cellular osmotic
adaptation. Hence, the osmotic balance caused due to
salinity is encountered by biochar and PGPR but is not
addressed by fertilizer treatment. Fertilizer induces
increase in leaf area and growth but don’t keep pace with
osmoregulation as a result, electrolyte leakage is also
higher in fertilizer treatment [28]. The osmoregulation
appears to be controlled more efficiently by PGPR and
biochar applied separately. However, combined treatments
of fertilizer with Pseudomonas and biochar proved
effective in augmenting physiological traits of maize plant.
Previous studies have reported that P. putida and B.
megaterium exhibit the highest osmotic tolerance and show
increased proline content that is involved in osmotic
cellular adaptation thus suggesting that bacteria have
developed mechanisms that can alleviate stresses in crop
plants [6-21, 29, 30].
In the present research work, the effect of PGPR is more
pronounced on root growth and both PGPR and biochar are
equally effective to promote shoot growth. In most of the
growth parameters, PGPR override the effects of biochar
but for leaf area, biochar more effective and fertilizer
addition further augments its effect. Spokas et al. [13]
reported significant increase in root density and crop
productivity following biochar addition while Carlier et al.
[14] revealed that inoculation with PGPR produced a
substantial increase in plant height and root length in early
growth stages of wheat. Dobbelaere et al. [31] studied the
physiological responses of the plant roots to inoculation
with Azospirillum and observed that inoculation leads to
an improvement in root development and an increase in the
rate of water and mineral uptake. Gholami et al. [32]
observed that maize seeds inoculated with Azospirillum,
Pseudomonas and Azotobacterstrains enhanced seed
germination and seedling vigour of maize.
PGPR have also been reported to increase cell division
and cell elongation due to production of plant growth
promoting hormones [15-37]. The growth promoting
property of biochar, Pseudomonas sp. and fertilizer is
apparent on leaf area of maize under salinity stress which
appears to be related with the nutrient content of biochar
and fertilizer and growth hormones produced by
Pseudomonas sp. The combined effect being more
stimulatory due to synergism between biochar and
Pseudomonas sp. can possible be attributed to the fact that
biochar served as a source of nutrients for better
proliferation of Pseudomonas sp. Busscher et al. [38],
Lashari et al. [34] also demonstrated the effects of biochar
UW Journal of Science and Technology 2 (2018) 1-6
2523-0123©UWJST 2018: Personal Use Permitted, but republicaiton/redistribution requires UW permission.
5
on soil properties as well as leaf area index, maize grain
yield and observed an increase in overall productivity and
performance of plant.
The stomatal density and stomatal index (SI) are
indicators of paleomorphic CO2 concentration. The
application of biochar and Pseudomonas sp. inoculation
maintained higher stomatal index (SI). This might helped
to keep the turgidity higher and facilitate the gaseous
exchange efficiently for greater assimilation of leaves but
under salt stress the SI is reduced. Varela et al. [4] studied
comparative effects of biochar on plant growth parameters
and observed higher mean leaf width, leaf length,
chlorophyll content, stem size and root size. Increased
chlorophyll content can be used as an index of
photosynthetic potential as well as an index of plant
productivity. Furthermore, trichome has been observed in
Pseudomonas sp. inoculated plant leaves under unstressed
(non-saline) condition [32]. Trichomes are stalked
protuberances that contribute to plant resistance against
herbivory by physical and chemical deterrents [13].
Moreover, Pseudomonas sp. in combination with biochar
resulted in 45% (under unstressed) and 13% (under stress)
significant increase in stomatal index value over
uninoculated control. Vivaset al. [9] demonstrated that
PGPR inoculation resulted in an increase in overall plant
physiological values including photosynthetic rate, water
use efficiency (WUE) and stomatal conductance of lettuce
plants.
Increasing salinity in soil decreases chlorophyll content
which ultimately decreases plant growth causing a shift in
many physiological activities like photosynthesis, stomatal
conductance and antioxidant activity [16]. However PGPR
inoculation helps ameliorating such deleterious effects of
salinity stress. An experiment conducted by Fazal and
Bano [1] reported that inoculation with Pseudomonas sp.
enhanced chlorophyll production resulting in significant
increase in chlorophyll content over control under
unstressed condition. Similar results are observed by
Heidariand Golpayegani [23], where PGPR significantly
increased the catalase activity and chlorophyll content of
leaves under water stress.
The amount of chlorophyll fluorescence (Fv/Fm) indicates
thylakoid membrane integrity and the relative efficiency of
electron transport from PSII to PSI [19]. Additionally, the
flow of electrons through PSII is indicative, under many
conditions, of the overall rate of photosynthesis [29]. As
the aforementioned results showed increased chlorophyll
fluorescence values when combined treatment of biochar
and Pseudomonas sp. is made, so it could easily be implied
that the nutrients present in biochar, and the growth
promoting hormones produced by Pseudomonas sp. [33]
can possibly attribute to increased photosynthetic activity
of maize plant.
V. CONCLUSION
In the light of the present results, it is inferred that
biochar and Pseudomonas sp. are equally effective as
fertilizer and can be used to minimize the use of chemical
fertilizer. The combined treatment of PGPR and Biochar
may enhance the effect of N-fertilizer on leaf area and root
growth.
REFERENCES
[1] A. K. Parida and A. B. Das. Salt tolerance and salinity effects on
plants a review, Ecotoxicology and Environmental Safety, Vol.
60(3), pp. 324-349, 2005.
[2] R. Bol, W. Amelung, C. Friedrich and N. Ostle. Tracing dung-
derived carbon in temperate grassland using 13C natural abundance
measurements, Soil Biology Biochemistry, Vol. 32(10), pp. 1337-
1343, 2000.
[3] D. P. Garrity. Agroforestry and the achievement of the Millennium
Development Goals, Agroforest System, Vol. 61(1-3), pp. 5-17,
2007.
[4] V. C. Baligar and O. L. Bennett. Outlook on fertilizer use efficiency
in the tropics, Fertilizer Research, Vol. 10(1), pp. 83-96, 1986.
[5] D. Palmer. Biochar and development, Journal of Plant Growth
Regulation, Vol. 24(4), pp. 45-57, 2011.
[6] A. Marulanda, J. M. Barea and R. Azcon. Stimulation of plant
growth and drought tolerance by native microorganisms (AM fungi
and bacteria) from dry environments mechanisms related tobacterial
effectiveness, Journal of Plant Growth Regulation, Vol. 28(2), pp.
115-124, 2009.
[7] A. Rokhzadi, A. Asgharzadeh, F. Darvish, G. Nour-Muhammadi
and E. Majidi. Influence of plant growth promoting rhizobacteria on
dry matter accumulation and yield of chickpea (CicerarietinumL.)
under field conditions, American-Eurasian Journal of Agricultural
and Environmental Sciences, Vol. 3(2), pp. 253–25, 2008.
[8] A. S. Al-Hazmi, and A. Dawabah. Effect of urea and certain NPK
fertilizers on the cereal cyst nematode (Heteroderaavenae) on
wheat, Saudi Journal of Biological Sciences, Vol. 21(2), pp. 191-
196, 2014.
[9] A. Vivas, A. Marulanda, J. M. Ruiz-Lozano, J. M. Barea and R.
Azcon. Influence of a Bacillus sp. on physiological activities of two
arbuscular mycorrhizal fungi and on plant responses to PEG-
induced drought stress, Mycorrhiza, Vol. 13(5), pp. 249-256, 2003.
[10] B. Capell and K. Dörffling. Genotype-specific differences in
chilling tolerance of maize in relation to chilling-induced changes in
water status and abscisic acid accumulation, Physiol Planta, Vol.
88(4), pp. 638-646, 1993.
[11] B. Hameeda, G. Harini, O. P. Rupela, S. P. Wani and G. Reddy.
Growth promotion of maize by phosphate solubilizing bacteria
isolated from composts and macrofauna, Microbiological Research,
Vol. 163(2), pp. 234–242, 2006.
[12] D. Egamberdiyeva. Plant-growth-promoting rhizobacteria isolated
from a calcisol in a semi-arid region of Uzbekistan biochemical
characterization and effectiveness, Journal of Plant Nutrition and
Soil Science Vol. 168(1), pp. 94-99, 2006.
[13] D. Tian, J. Tooker, M. Peiffer, S. H. Chung and G. W. Felton. Role
of trichomes in defense against herbivores comparison of herbivore
response to woolly and hairless trichome mutants in tomato
(Solanumlycopersicum), Planta, Vol. 236(4), pp. 1053-1066, 2012.
[14] E. Carlier, M. Rovera, A. R. Jaume and S. B. Rosas. Improvement
of growth under field conditions of wheat inoculated with
Pseudomonas chlororaphis subsp. aurantiaca SR1, World Journal of
Microbiology and Biotechnology, Vol. 24(11), pp. 2653-2658,
2008.
[15] E. Orhan, A. Esitken, S. Ercisli, M. Turan and F. Sahin. Effects of
plant growth promoting rhizobacteria (PGPR) on yield, growth and
nutrient contents in organically growing raspberry, Science
Horticulture, Vol. 111(1), pp. 38-43, 2006.
[16] H. S. Han and K. D. Lee. Plant growth promoting rhizobacteria
effect on antioxidant status, photosynthesis, mineral uptake and
growth of lettuce under soil salinity, Journal of Agricultural and
Biological Science, Vol. 1(3), pp. 210-215, 2005.
[17] H. Upadhyaya, L. Sahoo and S. K. Panda. Molecular physiology of
osmotic stress in plants, Molecular Stress Physiology of Plants, Vol.
4(13), pp. 179-192, 2013.
[18] I. Aranda, E. Gil-Pelegrin, A. Gasco, M. A. Guevara, J.F. Cano, M.
De Miguel and C. Collada. Drought response in forest trees from the
species to the gene, Plant Responses to Drought Stress, pp. 293-333,
2012.
[19] J. D. Johnson, R. Tognetti and P. Paris. Water relations and gas
UW Journal of Science and Technology 2 (2018) 1-6
2523-0123©UWJST 2018: Personal Use Permitted, but republicaiton/redistribution requires UW permission.
6
exchange in poplar and willow under water stress and elevated
atmospheric CO2, Physiologia Plantarum, Vol. 115(1), pp. 93-100,
2009.
[20] J. Diels, B. Vanlauwe, M. K. Van der Meersch, N. Sanginga and R.
Merckx. Long-term soil organic carbon dynamics in a subhumid
tropical climate 13C data in mixed C3/C4 cropping and modeling
with ROTHC, Soil Biology and Biochemistry, Vol. 36(11), pp.
1739-1750, 2009.
[21] K. A. Spokas. Review of the stability of biochar in soils
predictability of O:C molar ratios, Carbon Management, Vol. 1(2),
pp. 289-303, 2010.
[22] S. J. Dobbelaere and O. K. Vanderleyden Yaacov. Plant growth-
promoting effects of diazotrophs in the rhizosphere, Critical
Reviews in Plant Sciences, Vol. 22(12), pp.107-149, 2003.
[23] P. Sanchez-de-Miguel, P. Baeza, P. Junquera and J. R. Lissarrague.
Vegetative development total leaf area and surface area indexes,
Methodologies and Results in Grapevine Research, pp. 31-44, 2010.
[24] R. Ogaya, L. Lorens and J. Penuelas. Density and length of stomatal
and epidermal cells in living fossil trees grown under elevated CO2
and a polar light regime, Acta Oecologica, Vol. 37(4), pp. 381-385,
2011.
[25] J. L. Jifon and J. P. Syvertsen. Moderate shade can increase net gas
exchange and reduce photoinhibition in citrus leaves, Tree
Physiology, Vol. 23(2), pp. 119-127, 2003.
[26] A. Gholami, S. Shahsavani and S. Nezarat. The effect of plant
growth promoting rhizobacteria (PGPR) on germination, seedling
growth and yield of maize, International Journal of Biological
Sciences, Vol. 1(1), pp. 35-40, 2009.
[27] M. Egger, G. D. Smith and A. N. Phillips. Meta-analysis principles
and procedures, British Medical Journal, Vol. 315, pp. 1533-1537,
1997.
[28] A. Fazal, and A. Bano. Role of Plant Growth Promoting
Rhizobacteriav (PGPR), Biochar and Chemical Fertilizer under
Salinity Stress, M.S. Thesis, Department Plant Science, Quaid-i-
Azam University, Islamabad, Pakistan, 2015.
[29] K. Maxwell, and G. N. Johnson. Chlorophyll fluorescence a
practical guide, Journal of Experimental Botany, Vol. 51(345), pp.
659-668, 2000.
[30] M. Grover, S. Z. Ali, V. Sandhya, A. Rasul and B. Venkateswarlu.
Role of microorganisms in adaptation of agriculture crops to abiotic
stresses, World Journal of Microbiology and Biotechnology, Vol.
27(5), pp. 1231-1240, 2011.
[31] S. Dobbelaere, A. Croonenborghs, A. Thys, D. Ptacek, J.
Vanderleyden, P. Dutto and Y. Okon. Responses of agronomically
important crops to inoculation with azospirillum, Functional Plant
Biology, Vol. 28(9), pp. 871-879, 2001.
[32] A. Fazal and A. Bano. Role of plant growth-promoting rhizobacteria
(PGPR), biochar, and chemical fertilizer under salinity stress,
Communications in Soil Science and Plant Analysis, Vol. 47(17),
pp. 1985-1993, 2016.
[33] M. Heidari and A. Golpayegani. Effects of water stress and
inoculation with plant growth promoting rhizobacteria (PGPR) on
antioxidant status and photosynthetic pigments in basil
(Ocimumbasilicum L.), Journal of the Saudi Society of Agricultural
Sciences, Vol. 11(1), pp. 57-61, 2012.
[34] M. S. Lashari, Y. Ye, H. Ji, L. Li, G. W. Kibue and G. Pan. Biochar
manure compost in conjunction with pyroligneous solution
alleviated salt stress and improved leaf bioactivity of maize in a
saline soil from central China a 2 year field experiment, Journal of
the Science of Food and Agriculture, Vol. 12(4), pp. 12-20, 2015.
[35] O. Varela Milla, E. B. Rivera, W. J. Huang, C. Chien and Y. M.
Wang. Agronomic properties and characterization of rice husk and
wood biochars and their effect on the growth of water spinach in a
field test, Journal of Soil Science and Plant Nutrition, Vol. 13(2), pp.
251-266, 2013.
[36] R. Munns. Comparative physiology of salt and water stress, Plant,
Cell Environment, Vol. 25(2), pp. 239-250, 2002.
[37] R. Rahimi, S. M. Hosseini, M. Pooryoosef and I. Fateh. Variation of
leaf water potential, relative water content and SPAD under gradual
drought stress and stress recovery in two medicinal species of
Plantagoovata and P. psyllium, Journal of Plant Ecophysiol, Vol.
2(2), pp. 53-60, 2010.
[38] W. J. Busscher, J. M. Novak, D. E. Evans, D. W. Watts, M. A. S.
Niandou and M. Ahmedna. Influence of pecan biochar on physical
properties of a Norfolk loamy sand, Soil Science, Vol. 175(1), pp.
10-14, 2010.
Aliya Fazal completed her M.Phil. degree in
Plant Sciences from Quaid-i-Azam University,
Islamabad, Pakistan in 2015. She is currently
pursuing her Ph.D. degree in Life Sciences from
Nanjing University, Nanjing, China. Her
research interests includes, plant-microbe
interaction and metagenomics.
Asghari Bano was born in Dhaka Bangladesh.
She had completed her basic Education from
Dhaka University and obtained her Ph.D from
University of Glasgow, UK under
Commonwealth scholarship. She had served
Quaid-e-Azam University for about 30 years
and retired as Tenured Professor and Dean
Faculty of Biological Sciences, QAU. At
present she is serving as Professor in Department of BioSciences at
University of Wah. She had trained a large cohort of PhD and M.Phil
students in the discipline of Plant Physiology and Microbial
Biotechnology and has supervised 112 M.Phil and 42 Ph.D students.
Presently she is supervising 6 PhD students. She has published 159
research papers in national and international journals which have received
217 impact factors with 3099 citations. She is the author of three (3) books
and nine (9) book chapters.
Farman Ali completed his M.Phil. degree in
Plant Sciences, from Quaid-i-Azam University,
Islamabad, Pakistan in 2014. Currently, he is
pursuing his PhD degree in Life Sciences from
Nanjing University, Nanjing, China. His
research interests includes, plant molecular
biology and plant stress physiology.
UW Journal of Science and Technology 2 (2018) 7-12
2523-0123©UWJST 2018: Personal Use Permitted, but republicaiton/redistribution requires UW permission.
7
Abstract—Schiff bases containing azomethine linkage in
their structure are good ligands and show great metal binding
ability. In last few years sol-gel method is found very
attractive for synthesis of gels due to its low cost, low
operating temperature and ease of synthesis. This work
presents the synthesis of Schiff base functionalized gels
through sol-gel method and their use in extraction of metal
ions from aqueous medium at room temperature and
appropriate pH. Fourier transform infrared spectroscopy
(FTIR), scanning electron microscopy (SEM) and X-ray
diffraction (XRD) analyses of both blank and functionalized
gels are presented. The analyses data show successful
incorporation of the Schiff base in sol-gel matrix. Metal
removal data show high efficiency of Schiff base
functionalized gels.
Index Terms—Schiff base functionalized silicas, Sol-gel
method, Extraction of metal ions.
I. INTRODUCTION
HE organic compounds consisting of azomethine
linkage (-HC=N-) in their structure are called Schiff
bases. Hugo Schiff the pioneer synthesized such
compounds by the reaction of aromatic amine with
aldehyde or ketone [1]. In a Schiff base nitrogen atom is
connected to an aryl or alkyl group but not with hydrogen.
Fig. 1. Formation of Schiff base.
Manuscript received August 15, 2017; accepted January 22, 2018.
S. Naheed (email:[email protected]), A. Changez (email:
[email protected]) and R.M. Talal (email:
[email protected]) are affiliated with Department of Chemistry,
University of Wah, Wah Cantt, Pakistan.
G. Zakria is affiliated with Advanced Engineering Research
Organization, Wah Cant, Pakistan. (email: [email protected])
Corresponding author email: [email protected]
It is a condensation reaction in which amine, acting as a
nucleophile attacks at the electrophilic carbonyl carbon
forming Schiff base in which (C=O) of carbonyl group is
replaced by (C=N) of imine or Schiff base. A variety of
compounds having amino group can be employed for the
preparation of Schiff bases as shown in Fig.1 [2-3]. Product
(Schiff base) both are very low [4]. pH of the reaction
mixture is to be maintained due to high basicity of aliphatic
amines. Imines formed from aromatic amines are called
Anils. Just like aliphatic amines, aliphatic carbonyls are
also not preferred for Schiff bases synthesis as aliphatic carbonyl compounds are less stable [5-7]. Usually
aldehyde is the carbonyls of choice due to their better
reactivity as compare to ketones. If carbon or nitrogen of
(C=N) is attached with aromatic ring, it increases the
stability of the Schiff base due to conjugation [8].
Preparation of Schiff base is a reversible reaction.
Therefore, the reaction can be used for the protection of
amines. It takes place under basic or acidic conditions or
simply by refluxing the reactants in a suitable solvent. The
equilibrium can be shifted towards forward direction by
dehydration with a desiccant such as TiCl4 [9] or by
azeotropic distillation [10-11]. As Schiff bases form
crystals they usually show sharp melting points. They are
good as ligands and form complexes with metals.
Transition metal complexes form a large group in
Chemistry [12].
Mechanism of Schiff base formation shows that it is
nucleophilic addition reaction due to which an unstable
addition product known as carbinolamine is formed.
Elimination of water from carbinolamine results in the
formation of Schiff base. Its elimination takes place under
mild acidic conditions. This step is rate determining step in
the synthesis. Therefore the reaction is often done under
mild acidic conditions. Harsh acidic conditions can
protonate amine diminishing their nucleophilicity and
resulting backward reaction. Hydrolysis of Schiff base can
be done by water under acidic or basic conditions.
Schiff bases are versatile organic ligands [13-17]. Their
biomedical [18] and catalytic [19-21], analytical and other
applications are well documented in literature. Previously
University of Wah
Journal of Science and Technology
www.uow.edu.pk
Synthesis of Sol-Gel Silicas functionalized
with Schiff Base Ligands
Shazia Naheed, Ghulam Zakria, Rana Muhammad Talal and Alina Changez
T
UW Journal of Science and Technology 2 (2018) 7-12
2523-0123©UWJST 2018: Personal Use Permitted, but republicaiton/redistribution requires UW permission.
8
Schiff bases have been utilized in estimation [22-23] and
separation of metals [24] and estimation of oxo groups [25-
26]. They are well known for their biological activities
[27]. Azomethine linkage in the structure of Schiff base is
thought to be responsible for their bioactivities [28] against
cancer [29], bacterial infections [30-31], AIDS [32-33],
fungal infections [34-35], viral infections [36, 37],
mosquito larvae [3], flamatory [39] and cancer. Entrapment
of bioactive materials in a suitable matrix as support and
their transport to the infected parts is an emerging field of
research.
Sol-gel process was discovered in 1800. Synthesis of
organic-inorganic hybrids through sol-gel process has
attained much attention. Metal or semimetal alkoxides
being the precursor substance of this process undergo two
reactions i.e. Hydrolysis and Condensation, which leads to
formation of inorganic network within which the organic
moiety get entrapped due to low operating temperature.
Occurrence of poly condensation reaction at low
temperature is the biggest attraction and advantage of this
process [40]. These reactions are shown in Fig. 2.
Industrial development is mainly contributing to
environment pollution which is affecting the ecosystem as
well as human health [41]. Un-loading of these toxic metals
from environment is the urgent need of present era. Some
of the previous methods for toxic metal removal are
oxidation, precipitation, complexation, electrochemical
treatment, filtration, distillation, application of selective
membranes and sorptonetc [42-44]. Of all, Sorption is
superior and more attractive method due to low cost,
ecological correctness, higher efficiency and ease of
operation. Chelating polymeric materials have been
reported for pre-concentration and removal of metals [45-
49]. Polymeric resins showed low mechanical and
chemical stability, slow kinetics and irreversible
adsorption [50]. Unmodified naturally occurring materials
[51] and modified naturally occurring materials have also
been applied for metal removal.
To overcome the problems of polymeric resins inorganic
supports such as silica gel or functionalized silica gel have
been applied for metal removal. They have high thermal
and mechanical stability, stability to chemicals, negligible
swelling, shrinking poisoning and fast sorption kinetics. To
avoid some limitations of silica gel modified sol-gel
materials have been used as sorbents. Porosity and surface
layer composition of sol-gel materials can be tuned for
specific application. The sol-gel materials can be
physically or chemically functionalized with active
chelating ligands for metal removal.
II. EXPERIMENTAL METHODOLOGY
A. General procedure for synthesis of Schiff bases (L1-
L4)
10mmol (0.01 M) of 4, 4-oxydianiline was dissolved in
methanol to get a clear solution. 20mmol (0.02 M)
aldehyde/ketone was also dissolved in the same solvent.
Both the solutions were mixed and refluxed. Progress of reaction was monitored through TLC in appropriate solvent
system from time to time. After reaction completion,
mixture was evaporated on rotary evaporator followed by
the filtration of the product. Solid obtained was weighted,
recrystallized and stored in desiccator.
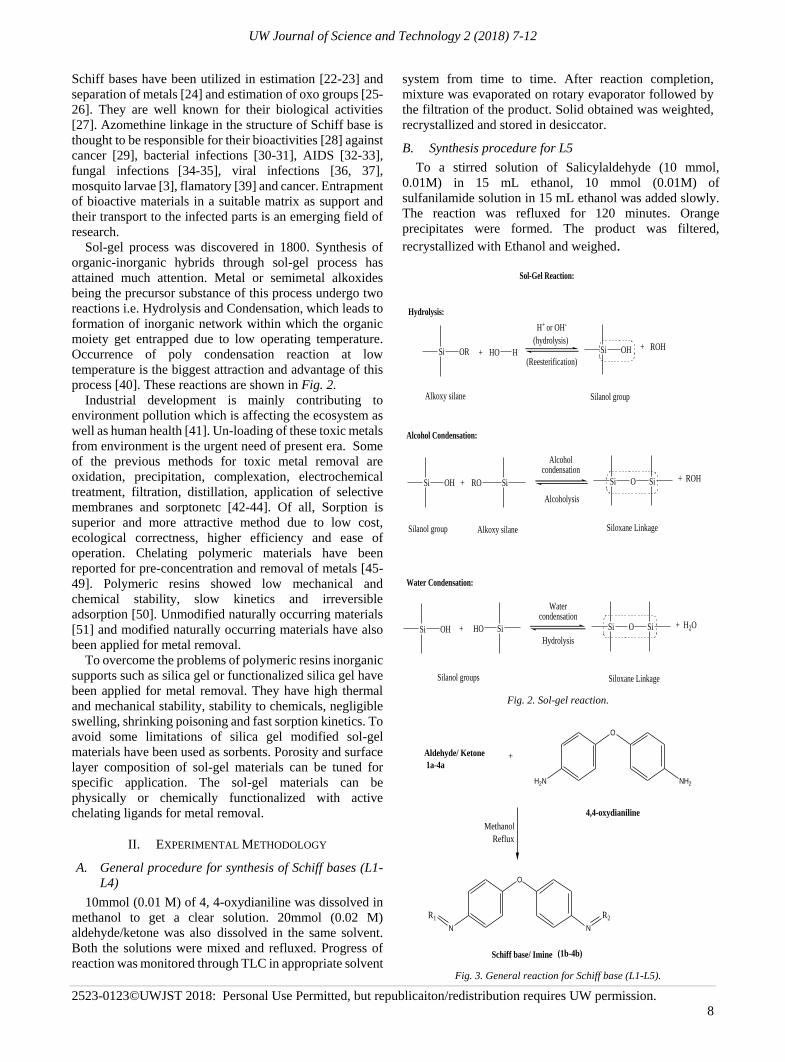
B. Synthesis procedure for L5
To a stirred solution of Salicylaldehyde (10 mmol,
0.01M) in 15 mL ethanol, 10 mmol (0.01M) of
sulfanilamide solution in 15 mL ethanol was added slowly.
The reaction was refluxed for 120 minutes. Orange
precipitates were formed. The product was filtered,
recrystallized with Ethanol and weighed.
+ HO H Si OH
Silanol group
+ ROH
Alkoxy silane
Si OR
Hydrolysis:
Si OH Si O
Si OH + HO Si Si O
H+ or OH-
(hydrolysis)
(Reesterification)
Alcohol Condensation:
SiRO+
Alcohol condensation
Alcoholysis
Si + ROH
Silanol group Alkoxy silane Siloxane Linkage
Water Condensation:
Water condensation
Hydrolysis
Si + H2O
Silanol groups Siloxane Linkage
Sol-Gel Reaction:
Fig. 2. Sol-gel reaction.
O
NH2H2N
4,4-oxydianiline
+Aldehyde/ Ketone
O
NN
R2R1
Schiff base/ Imine
1a-4a
Reflux
Methanol
(1b-4b)
Fig. 3. General reaction for Schiff base (L1-L5).
UW Journal of Science and Technology 2 (2018) 7-12
2523-0123©UWJST 2018: Personal Use Permitted, but republicaiton/redistribution requires UW permission.
9
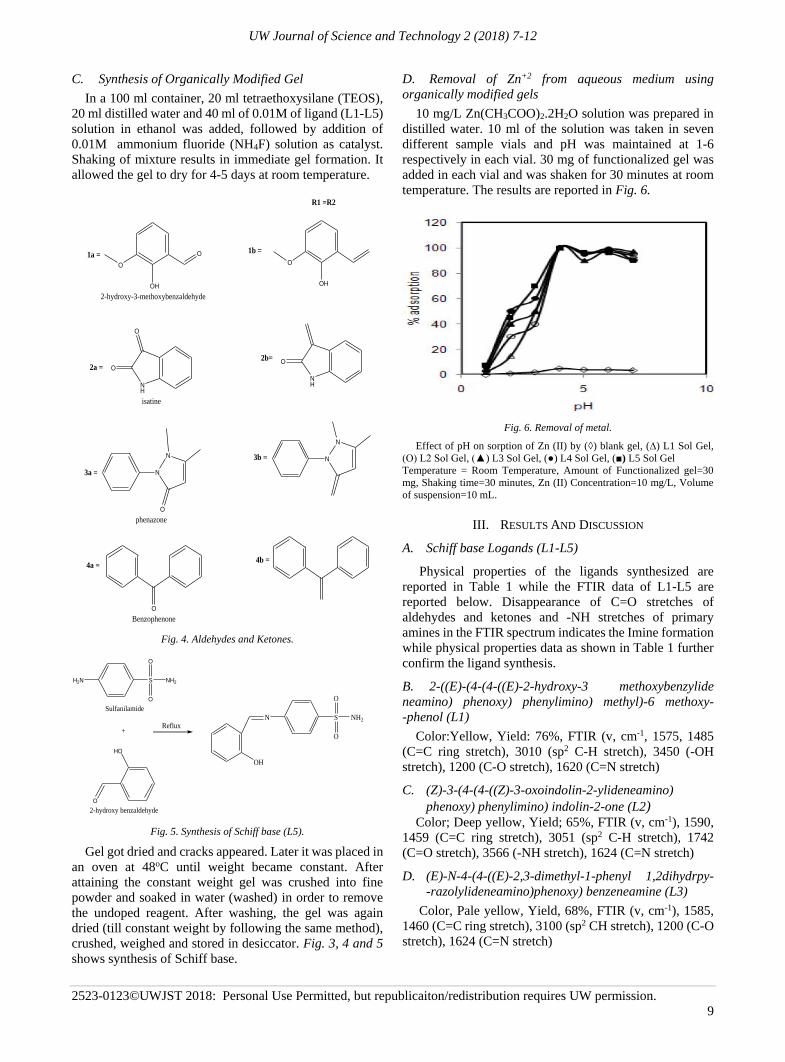
C. Synthesis of Organically Modified Gel
In a 100 ml container, 20 ml tetraethoxysilane (TEOS),
20 ml distilled water and 40 ml of 0.01M of ligand (L1-L5)
solution in ethanol was added, followed by addition of
0.01M ammonium fluoride (NH4F) solution as catalyst.
Shaking of mixture results in immediate gel formation. It
allowed the gel to dry for 4-5 days at room temperature.
NH
O
O
isatine
2a =
O
N
N
phenazone
O
Benzophenone
3a =
4a =
1a = O
O
OH
2-hydroxy-3-methoxybenzaldehyde
O
OH
NH
O
N
N
1b =
2b=
3b =
4b =
R1 =R2
Fig. 4. Aldehydes and Ketones.
NH2S
O
O
H2N
Sulfanilamide
O
HO
2-hydroxy benzaldehyde
+
N
OH
S
O
O
NH2
Reflux
Fig. 5. Synthesis of Schiff base (L5).
Gel got dried and cracks appeared. Later it was placed in
an oven at 48oC until weight became constant. After
attaining the constant weight gel was crushed into fine
powder and soaked in water (washed) in order to remove
the undoped reagent. After washing, the gel was again
dried (till constant weight by following the same method),
crushed, weighed and stored in desiccator. Fig. 3, 4 and 5
shows synthesis of Schiff base.
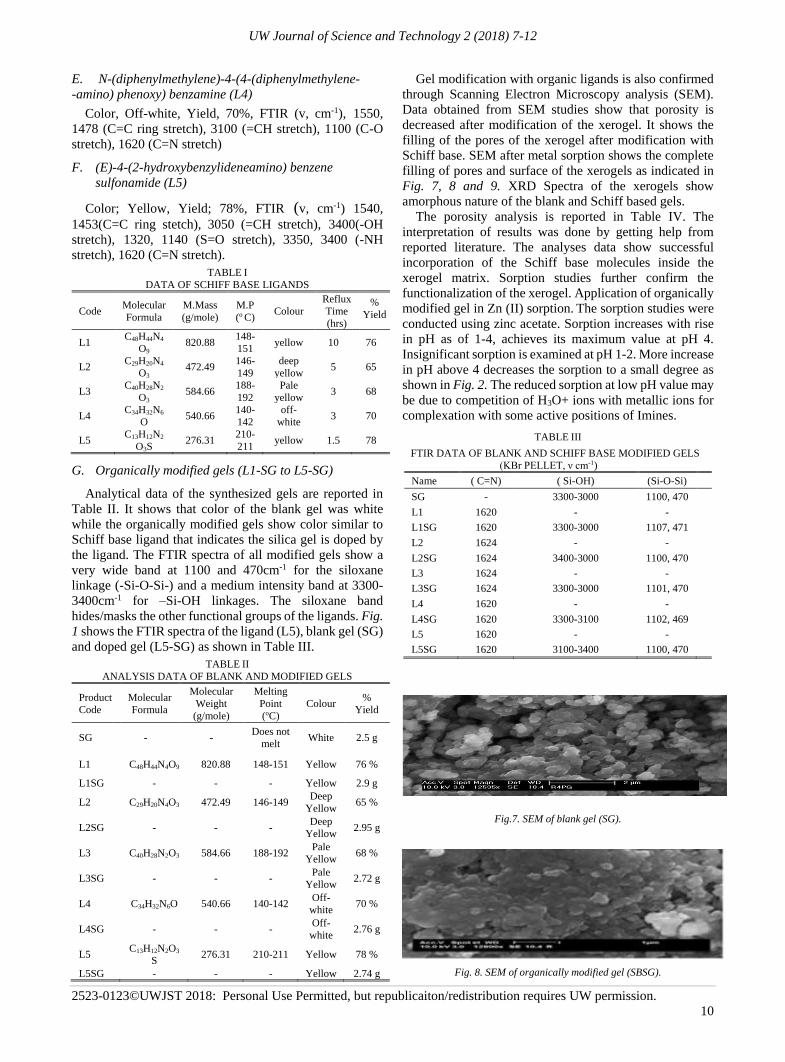
D. Removal of Zn+2 from aqueous medium using
organically modified gels
10 mg/L Zn(CH3COO)2.2H2O solution was prepared in
distilled water. 10 ml of the solution was taken in seven
different sample vials and pH was maintained at 1-6
respectively in each vial. 30 mg of functionalized gel was
added in each vial and was shaken for 30 minutes at room
temperature. The results are reported in Fig. 6.
Fig. 6. Removal of metal.
Effect of pH on sorption of Zn (II) by (◊) blank gel, (∆) L1 Sol Gel,
(O) L2 Sol Gel, (▲) L3 Sol Gel, (●) L4 Sol Gel, (■) L5 Sol Gel
Temperature = Room Temperature, Amount of Functionalized gel=30
mg, Shaking time=30 minutes, Zn (II) Concentration=10 mg/L, Volume
of suspension=10 mL.
III. RESULTS AND DISCUSSION
A. Schiff base Logands (L1-L5)
Physical properties of the ligands synthesized are
reported in Table 1 while the FTIR data of L1-L5 are
reported below. Disappearance of C=O stretches of
aldehydes and ketones and -NH stretches of primary
amines in the FTIR spectrum indicates the Imine formation
while physical properties data as shown in Table 1 further
confirm the ligand synthesis.
B. 2-((E)-(4-(4-((E)-2-hydroxy-3 methoxybenzylide
neamino) phenoxy) phenylimino) methyl)-6 methoxy-
-phenol (L1)
Color:Yellow, Yield: 76%, FTIR (v, cm-1, 1575, 1485
(C=C ring stretch), 3010 (sp2 C-H stretch), 3450 (-OH
stretch), 1200 (C-O stretch), 1620 (C=N stretch)
C. (Z)-3-(4-(4-((Z)-3-oxoindolin-2-ylideneamino)
phenoxy) phenylimino) indolin-2-one (L2) Color; Deep yellow, Yield; 65%, FTIR (v, cm-1), 1590,
1459 (C=C ring stretch), 3051 (sp2 C-H stretch), 1742
(C=O stretch), 3566 (-NH stretch), 1624 (C=N stretch)
D. (E)-N-4-(4-((E)-2,3-dimethyl-1-phenyl 1,2dihydrpy-
-razolylideneamino)phenoxy) benzeneamine (L3)
Color, Pale yellow, Yield, 68%, FTIR (v, cm-1), 1585,
1460 (C=C ring stretch), 3100 (sp2 CH stretch), 1200 (C-O
stretch), 1624 (C=N stretch)
UW Journal of Science and Technology 2 (2018) 7-12
2523-0123©UWJST 2018: Personal Use Permitted, but republicaiton/redistribution requires UW permission.
10
E. N-(diphenylmethylene)-4-(4-(diphenylmethylene-
-amino) phenoxy) benzamine (L4)
Color, Off-white, Yield, 70%, FTIR (v, cm-1), 1550,
1478 (C=C ring stretch), 3100 (=CH stretch), 1100 (C-O
stretch), 1620 (C=N stretch)
F. (E)-4-(2-hydroxybenzylideneamino) benzene
sulfonamide (L5)
Color; Yellow, Yield; 78%, FTIR (v, cm-1) 1540,
1453(C=C ring stetch), 3050 (=CH stretch), 3400(-OH stretch), 1320, 1140 (S=O stretch), 3350, 3400 (-NH
stretch), 1620 (C=N stretch).
TABLE I
DATA OF SCHIFF BASE LIGANDS
Code Molecular
Formula M.Mass
(g/mole) M.P
(o C) Colour
Reflux
Time
(hrs)
L1 C48H44N4
O9 820.88
148-
151 yellow 10 76
L2 C29H20N4
O3 472.49
146-
149 deep
yellow 5 65
L3 C40H28N2
O3 584.66
188-
192 Pale
yellow 3 68
L4 C34H32N6
O 540.66
140-
142 off-
white 3 70
L5 C13H12N2
O3S 276.31
210-
211 yellow 1.5 78
G. Organically modified gels (L1-SG to L5-SG)
Analytical data of the synthesized gels are reported in
Table II. It shows that color of the blank gel was white
while the organically modified gels show color similar to
Schiff base ligand that indicates the silica gel is doped by
the ligand. The FTIR spectra of all modified gels show a
very wide band at 1100 and 470cm-1 for the siloxane
linkage (-Si-O-Si-) and a medium intensity band at 3300-
3400cm-1 for –Si-OH linkages. The siloxane band
hides/masks the other functional groups of the ligands. Fig.
1 shows the FTIR spectra of the ligand (L5), blank gel (SG)
and doped gel (L5-SG) as shown in Table III.
TABLE II
ANALYSIS DATA OF BLANK AND MODIFIED GELS
Product
Code
Molecular
Formula
Molecular
Weight
(g/mole)
Melting
Point
(oC)
Colour %
Yield
SG - - Does not
melt White 2.5 g
L1 C48H44N4O9 820.88 148-151 Yellow 76 %
L1SG - - - Yellow 2.9 g
L2 C29H20N4O3 472.49 146-149 Deep
Yellow 65 %
L2SG - - - Deep
Yellow 2.95 g
L3 C40H28N2O3 584.66 188-192 Pale
Yellow 68 %
L3SG - - - Pale
Yellow 2.72 g
L4 C34H32N6O 540.66 140-142 Off-
white 70 %
L4SG - - - Off-
white 2.76 g
L5 C13H12N2O3
S 276.31 210-211 Yellow 78 %
L5SG - - - Yellow 2.74 g
Gel modification with organic ligands is also confirmed
through Scanning Electron Microscopy analysis (SEM).
Data obtained from SEM studies show that porosity is
decreased after modification of the xerogel. It shows the
filling of the pores of the xerogel after modification with
Schiff base. SEM after metal sorption shows the complete
filling of pores and surface of the xerogels as indicated in
Fig. 7, 8 and 9. XRD Spectra of the xerogels show
amorphous nature of the blank and Schiff based gels.
The porosity analysis is reported in Table IV. The
interpretation of results was done by getting help from
reported literature. The analyses data show successful
incorporation of the Schiff base molecules inside the
xerogel matrix. Sorption studies further confirm the
functionalization of the xerogel. Application of organically
modified gel in Zn (II) sorption. The sorption studies were
conducted using zinc acetate. Sorption increases with rise
in pH as of 1-4, achieves its maximum value at pH 4.
Insignificant sorption is examined at pH 1-2. More increase
in pH above 4 decreases the sorption to a small degree as
shown in Fig. 2. The reduced sorption at low pH value may
be due to competition of H3O+ ions with metallic ions for
complexation with some active positions of Imines.
TABLE III
FTIR DATA OF BLANK AND SCHIFF BASE MODIFIED GELS
(KBr PELLET, ν cm-1)
Name ( C=N) ( Si-OH) (Si-O-Si)
SG - 3300-3000 1100, 470
L1 1620 - -
L1SG 1620 3300-3000 1107, 471
L2 1624 - -
L2SG 1624 3400-3000 1100, 470
L3 1624 - -
L3SG 1624 3300-3000 1101, 470
L4 1620 - -
L4SG 1620 3300-3100 1102, 469
L5 1620 - -
L5SG 1620 3100-3400 1100, 470
Fig.7. SEM of blank gel (SG).
Fig. 8. SEM of organically modified gel (SBSG).
%
Yield
UW Journal of Science and Technology 2 (2018) 7-12
2523-0123©UWJST 2018: Personal Use Permitted, but republicaiton/redistribution requires UW permission.
11
Fig. 9. SEM of modified gel after sorption of metal ions.
TABLE IV
POROSITY DATA OF BLANK AND MODIFIED GELS
Xerogels Surface Area
(m/g)2
Pore volume
(g/cm)3
Pore diameter
(nm)
SG 269 0.73 17.10
L1SG 249 0.53 9.12
L2SG 235 0.54 9.09
L3SG 265 0.60 10.00
L4SG 250 0.56 11.00
L5SG 255 0.49 0.88
functionalized gels. The data shows high efficiency of the
functionalized gels as compared with blank gel. The
advantage of the work is that it shows high efficiency at
room temperature and moderate pH.
IV. CONCLUSION
In the light of above study it is concluded that Schiff
bases being good ligands for toxic metals retain metal
extraction potential even after doping of silica. Sol-gel
method is a good approach for synthesis of organically
modified gels. The Schiff base modified gel is more
promising for metal extraction than the blank gel. SEM and
XRD analysis data show the successful incorporation of the
Schiff base ligand into the gel. Present study confirms that
Schiff base modified gels are found very promising for
extraction of Zinc metal at moderate pH at room
temperature as compared to blank gel.
REFERENCES
[1] H. Schiff. Synthesis of Sciiff bases, Annual Chemical Supplement,
Vol. 3, pp. 343, 1864.
[2] S. C. Bell, G. L. Conklin and S. J. Childress. The separation of
ketimine isomers, Journal of the American Chemical Society, Vol.
85, pp. 2868-2869, 1963.
[3] H. Schiff. On some phenolic derivatives of aldehydes, Annals of
Chemistry, Vol. 131, pp.118, 1864.
[4] Dr. M. Fogiel. Staff of Research and Education Association, The
Organic Problem Solver, Education Association, New York, 1987.
[5] R. A. Mekheimer, A. M. A. Hameed and K. U. Sadek. First
synthesis and isolation of the e-and z-isomers of some new Schiff
bases Reactions of 6-azido-5-formyl-2-pyridone with aromatic
amines, Molecules, Vol. 13, pp. 195-203, 2008.
[6] K. N. Campbell, H. Sommers and B. K. Campbell.
Organohalogenated persistent organic pollutants in American
captured in eastern Canada, Journal of American Chemical Society,
Vol. 66, p. 6682, 1994.
[7] J. Hine and C. Y. Yeh. Equilibrium in formation and
conformational isomerization of imines derived from
isobutyraldehyde and saturated aliphatic primary amines, Journal
of the American Chemical Society, Vol. 89, pp. 2669-2676, 1967.
[8] C. Sandorfy. The chemistry of the carbon-nitrogen double bond,
1970.
[9] H. Weingarten, J. P. Chupp and W. A. White. Ketimine syntheses
use of titanium tetrachloride in a new procedure for their
preparation, The Journal of Organic Chemistry, Vol. 32, pp. 3246-
3249, 1967.
[10] R. Bonnett and T. Emerson. 834 Optical rotatory dispersion Part
XXII, Steroidal azomethines, Journal of the Chemical Society, pp.
4508-4511, 1965.
[11] M.B. Smith and J. March. Advanced Organic Chemistry, 5th
edition 1994.
[12] A. O. De Souza, F.C.S.Galetti, C.L. Silva, B. Bicalho, M.M. Parma
and S.F. Fonseca. Antimycobacterial and cytotoxicity activity of
synthetic and natural compounds, Quim Nova, Vol. 30(7), pp.
1563-1566, 2007.
[13] A. N. Mazidji, B. Koopman and G. Bitton. Chelating resin versus
ion-exchange resin for heavy metal removal in toxicity
fractionation, Water Science Tecnology, Vol. 26, p. 189, 1982.
[14] Nilchi, M. R. Hadjmohammadi, S. R. Garmarodi and R. Saberi and
J. Hazard. Mater Studies on the adsorption behavior of trace
amounts of 90Sr2+, 140La3+, 60Co2+, Ni2+ and Zr4+ cations on
synthesized inorganic ion exchangers, Journal of hazardous
materials, Vol. 167, pp. 531-535, 2009.
[15] G. V. Myasoedova and S. B. Savvin. Chelating sorbents in
analytical chemistry. Critical Review Analytical Chemistry, Vol.
171, 1986.
[16] G. Myasoedova and S. Savvin. New chelating sorbents and their
analytical application, Zhurnal Analiticheskoj Khimii, Vol. 37, pp.
499-519, 1982.
[17] A. Chow and H. Gesser. Preconcentration of trace metals from
aquatic environmental samples, Hazard Assessment of Chemicals:
Current Developments, Vol. 1, 1981.
[18] J. G. Cory and A. H. Cory. International Encylopedia of
Pharmacology and Therapeutics, Pergamon Press, New York,
1989.
[19] A. Llobet, A. E. Martell and M. A. Martı́nez. Cu (I) and Cu (II)
dinuclear complexes of a new hexaaza schiff base dinucleating
macrocyclic ligand and their oxygenation chemistry, Journal of
Molecular Catalysis Chemical, Vol. 129, pp. 19-26, 1998.
[20] T. Katsuki. Unique asymmetric catalysis of cis-β metal complexes
of salen and its related Schiff-base ligands. Chemical Society
Reviews, Vol. 33, pp. 437-444, 2004.
[21] Lozana, P. G. Lassahn, C. Zhang, B. Wu, C. Janiak, G. Rheinwald.
Dinuclear nickel (II) and palladium (II) complexes in combination
with different co-catalysts as highly active catalysts for the
vinyl/addition polymerization of norbornene, Zeitschrift für
Naturforschung, Vol. 58, pp. 1152-1164, 2003.
[22] R. Soomro, M. J. Ahmed, N. Memon and H. Khan. A simple and
selective spectrophotometric method for the determination of trace
gold in real, environmental, biological, geological and soil samples
using bis (salicylaldehyde) orthophenylenediamine, Analytical
Chemistry Insights, Vol. 3, pp. ACI-S977, 2008.
[23] M. J. Ahmed and M. N. Uddin. A simple spectrophotometric
method for the determination of cobalt in industrial, environmental,
biological and soil samples using bis (salicylaldehyde)
orthophenylenediamine, Chemosphere, Vol. 67, pp. 2020-2027,
2007.
[24] G. K. Krishnapillai and S. J. Konnully. Removal of Fe (III) using a
polystyrene anchored Schiff base, Environmental Chemistry
Letters, Vol. 5, pp. 19-21, 2007.
[25] Z. H. Chohan, M. H. Youssoufi, A. Jarrahpour and T. B. Hadda.
Identification of antibacterial and antifungal pharmacophore sites
for potent bacteria and fungi inhibition: indolenyl sulfonamide
derivatives, European Journal of Medicinal Chemistry, Vol. 45(3),
pp. 1189-1199, 2009.
[26] L. Gibson, W. Kerr, A. Nordon, J. Reglinski, C. Robertson, L.
Turnbull. On-site determination of formaldehyde a low cost
measurement device for museum environments, Analytica Chimica
Acta, Vol. 623, pp. 109-116, 2008.
[27] M. Shingare and D. Ingle. Synthesis of pyrimidine schiff-bases as
anticancer agents, Journal of the Indian Chemical Society, Vol. 53,
pp. 1036-1037, 1976.
[28] P. Pathak, V. Jolly and K. Sharma. Synthesis and biological
activities of some new substituted arylazo schiff bases, Oriental
Journal of Chemistry, Vol. 16, pp. 161-162, 2000.
[29] A. T. Chaviara, P. C. Christidis, A. Papageorgiou, E. Chrysogelou,
D. HadjipavlouLitina and C. Bolos. In vivo anticancer, anti-
inflammatory, and toxicity studies of mixed-ligand Cu (II)
complexes of dien and its Schiff dibases with heterocyclic
aldehydes and 2-amino-2-thiazoline Crystal structure of (Cu
UW Journal of Science and Technology 2 (2018) 7-12
2523-0123©UWJST 2018: Personal Use Permitted, but republicaiton/redistribution requires UW permission.
12
(dien)(Br)(2a-2tzn)](Br)(H 2 O), Journal of Inorganic
Biochemistry, Vol. 99, pp. 2102-2109, 2005.
[30] M. Baseer, V. Jadhav, R. Phule, Y. Archana and Y. Vibhute.
Synthesis and antibacterial activity of some new schiff bases,
Oriental Journal of Chemistry, Vol. 16, pp. 553-556, 2000.
[31] Z. H. Chohan, Hassan, H. Pervez, A. Rauf, A. Scozzafava and C.
T. Supuran. Isatin-derived antibacterial and antifungal compounds
and their transition metal complexes, Journal of Enzyme Inhibition
and Medicinal Chemistry, Vol. 17(2), 2000.
[32] S. Pandeya, D. Sriram, G. Nath, and E. DeClercq. Synthesis,
antibacterial, antifungal and anti-HIV activities of Schiff and
Mannich bases derived from isatin derivatives and N-[4-(4′-
chlorophenyl) thiazol-2-yl] thiosemicarbazide, European Journal
of Pharmaceutical Sciences, Vol. 9, pp. 25-31, 1999.
[33] S. Sridhar, S. Pandeya, and E. De Clercq. Synthesis and anti-HIV
activity of some isatin derivatives, Bollettino Chimico
Farmaceutico, Vol. 140, pp. 302-305, 2001.
[34] I. Cohen, N. Rist and C. Duponchel. Synthesis and antituberculosis
activity of thiocarboxamide derivatives of schiff bases, Journal of
Pharmaceutical Sciences, Vol. 66, pp. 1332-1334, 1977.
[35] W. Singh and B. Dash. Synthesis of some new schiff bases
containing thiazole and oxazole nuclei and their fungicidal activity,
Pesticides, Vol. 22, pp. 33-37, 1988.
[36] R. Pignatello, A. Panico, P. Mazzone, M. Pinizzotto, A.Garozzo
and P. Fumeri. Schiff bases of N-hydroxy-N-aminoguanidines as
antiviral, antibacterial and anticancer agents, European Journal of
Medicinal Chemistry, Vol. 29, pp. 781-785, 1994.
[37] L. Guofa, S. Tongshun and Z. Yongnian. Infrared and Raman
spectra of complexes about rare earth nitrate with schiff base from
o-vanillin and 1-naphthylamine, Journal of Molecular Structure,
Vol. 412, pp. 75-81, 1997.
[38] Das, T. Choudhury, G. Das, D. Chowdhury and B. Choudhury.
Comparative studies on largicidal activity of some schiff bases with
Correspondian Amines. Chemistry Environmental Review, Vol. 3,
pp. 19-23, 1994.
[39] F. Sparatore, G. Pirisino, M. Alamanni, P. Manca-Dimich and M.
Satta. Azomethine derivatives with anti-inflammatory activity,
Bollettino chimico farmaceutico, Vol. 117, pp. 638-651, 1978.
[40] J. Wen and G. L. Wilkes. Organic/inorganic hybrid network
materials by the sol-gel approach, Chemistry of Materials, Vol. 8,
pp. 1667-1681, 1996.
[41] S. E. Bailey, T. J. Olin, R. M. Bricka, and D. D. Adrian. A review
of potentially low-cost sorbents for heavy metals, Water Research,
Vol. 33, pp. 2469-2479, 1999.
[42] Cochrane, S. Lu, S. Gibb and I. Villaescusa. A comparison of low-
cost biosorbents and commercial sorbents for the removal of
copper from aqueous media, Journal of Hazardous Materials, Vol.
137, pp. 198-206, 2006.
[43] G. Nakhla, A. Lugowski, J. Patel and V. Rivest. Combined
biological and membrane treatment of food-processing wastewater
to achieve dry-ditch criteria: pilot and full-scale performance,
Bioresource technology, Vol. 97, pp. 1-14, 2006.
[44] B. E. Reed, W. Lin, M. R. Matsumoto and J. N. Jensen.
Physicochemical processes, Water environment research, Vol. 69,
pp. 444-462, 1997.
[45] G. V. Myasoedova, S. B. Savvin and E. Blasius. Chelating sorbents
in analytical chemistry. Critical Reviews in Analyticl Chemistry,
Vol. 17, pp. 1-63, 1986.
[46] G. Myasoedova and S. Savvin. New chelating sorbents and their
analytical application, Zhurnal Analiticheskoj Khimii, Vol. 37(3),
pp. 499-519, 1982.
[47] Chow and H. Gesser. Preconcentration of Trace Metals from
Aquatic Environmental Samples, Hazard Assessment of
Chemicals: Current Developments, Vol. 1, 1981.
[48] R. S. Murthy, J. Holzbecher and D. E. Ryan. Trace element
preconcentration from aqueous solutions on a solid phase. Reviews
in Analytical Chemistry, Vol. 6, pp. 113-150, 1982.
[49] C. Xiong and C. Yao. Study on the adsorption of cadmium (II) from
aqueous solution by D152 resin, Journal of Hazardous Materials,
Vol. 166, pp. 815-820, 2009.
[50] N. V. Deorkar and L. L. Tavlarides. Zinc, cadmium and lead
separation from aqueous streams using solid-phase extractants,
Industrial and Engineering Chemistry Research, Vol. 36, pp. 399-
406, 1997.
[51] M. Nadeem, I. Tan, M. Haq, S. Shahid, S. Shah and G. McKay.
Sorption of lead ions from aqueous solution by chickpea leaves,
stems and fruit peelings, Adsorption Science and Technology, Vol.
24, pp. 269-282, 2006.
Shazia Naheed is working as an Assistant
Professor at the Department of Chemistry,
University of Wah. She completed her PhD
in Chemistry from Bahauddin Zakariya
University Multan in 2016. Her research
interests include Synthesis, Characterization
and Applications of Organic-Inorganic
Hybrid Materials.
Alina Changez received the degree of MS
Chemistry from University of Wah, Wah
Cantt. in 2017. Her research interests include
Synthesis, Analysis and Applications of
Organic-Inorganic Hybrids and Inorganic
hybrid Polymeric Materials.
Rana Muhammad Talal received the
degree of MS Chemistry from University of
Wah, Wah Cantt. in 2016. His research
interests are Organic Synthesis, Synthesis of
Organic-Inorganic Hybrid Materials,
Characterization and Applications.
Ghulam Zakria did PhD from the
University of Science and Technology,
China. Currently he is working at Advanced
Engineering Research Organization, Wah
Cant. His Research interests include Surface
Studies of Porous Materials.
UW Journal of Science and Technology 2 (2018) 13-17
2523-0123©UWJST 2018: Personal Use Permitted, but republicaiton/redistribution requires UW permission.
13
Abstract—The application of pesticides in agriculture has a
leading role in increasing the per acre yield of different crops.
There are a number of systems through which pesticides can
be sprayed on crops. Unmanned aerial vehicles (UAVs) are
being progressively used for this purpose due to their
improved efficiency and high-speed characteristics. This
research work mainly focuses on the construction of an
octocopter based on the idea of UAVs for the agriculture
sector. The implementation of octocopter for spraying
chemicals is prominently increasing to minimize the wastage
of pesticides while increasing the production of crops. This
research also strives to minimize the spraying time, labor cost
and weight of the octocopter for its better utilization and
implementation in the field of agriculture. The flight test
showed that the octocopter is useful, efficient and beneficial
for the intended application.
Index Terms—Octocopter, Spraying drone, UAV,
Agricultural pesticides
I. INTRODUCTION
NMANNED aerial vehicle (UAV) has become less
costly due to advancements in the software
technology and reduction in the cost of hardware [1]. An
unmanned aerial vehicle is basically a human operated
vehicle through a remote control. Nowadays, the
unmanned aerial vehicles are being used in many fields of
daily life such as: agriculture, search, rescue operations [2],
traffic surveillance, security, military and police [3],
firefighting [4], and during live coverage of different
outdoor events by different TV channels. UAVs have the
ability to reach such places which are generally impossible
for human beings [5].
Manuscript received September 8, 2017; accepted June 22, 2018.
S.S.H Shah (email:[email protected]), A. H. Khawaja
(email:[email protected]),W.Javid(email:waqas.javid@wec
uw.edu.pk), R.T.U Hassan (email:[email protected]), A. Ahmad
(email:[email protected]) and M. Ahmad (email:
[email protected]) are affiliated with Department of Mechanical
Engineering, University of Wah, Wah Cantt, Pakistan.
Corresponding author Email: [email protected]
Depending on the load to be carried, different, different
amendments are made in copters. Nowadays, a multi-rotor
vehicle, embedding a remote controlled system, has the
ability to carry a load of about two kilograms [6]. UAVs
have ability to takeoff vertically, landing, hovering and
moving carefully and skillfully.
The octocopter can take off and land vertically, which
relates it to the group of the multi-rotor helicopter. In
helicopter, fixed-pitched blade is used with rotor, while in
multi-rotor vehicle’s pitches do not change as in the case
of blade rotors. First multirotor dragon flyer was
manufactured around 2000 [7]. The star shape
configuration of an octocopter is the best to carry the
maximum amount of payload [8].
This paper proposes agriculture based application
through an octocopter where it is responsible for spraying
chemicals on crops fields. In the agriculture sector, UAVs
are mostly used for cultivation, production, protection and
spraying purposes. The octocopter is generally selected
because of its higher stability and maximum payload
carrying ability [9]. The spraying of chemicals is
controlled through wireless sensors.
The World Health Organization (WHO) estimated that
every year more than one million cases of deaths while
spraying pesticides are registered. The World Health
Organization (WHO) estimated that every year more than
one million case of deaths are register with pesticides
spraying and it also effect the yield of former and economy
of country as well. [9].
The main objective of this research is to reduce spraying
time on crops as compared to conventional spraying
systems and labor cost. This also increases the efficiency
of spraying.
Basically, the idea of an octocopter was presented by Joo
et al. [8] but they did not implement it practically. This
research is, therefore, focused on the fabrication of a low
weight octocopter and its implementation in the field of
agriculture. Table I shows the overall literature study
related to UAV Octocopter based on Pesticides’ Spraying
System.
University of Wah
Journal of Science and Technology
www.uow.edu.pk
Development of UAV Octocopter Based
on Pesticides Spraying System Syed Shakir Hussain Shah, Ammar Ul Hassan Khawaja, Waqas Javid, Rehan Tahir Ul Hassan,
Awais Ahmad and Muhammad Ahmad
U
UW Journal of Science and Technology 2 (2018) 13-17
2523-0123©UWJST 2018: Personal Use Permitted, but republicaiton/redistribution requires UW permission.
14
II. WORKING PRINCIPLE AND SYSTEM DESCRIPTION
The Octocopter developed during research work has
eight rotor propellers in which four rotates clockwise (CW)
and four counterclockwise (CCW). The eight rotors
produce different thrust and octocopter hovers and moves
according to these motors. Basically, one motor produces a
thrust of 1400g and the total thrust produced is, therefore,
11200g. Due to eight rotors plus (+) and star (*), both
configurations are used in octocopter. The Octocopters
have more lifting capacity and redundancy. They are very
popular in carrying heavy payloads and for higher stability.
According to safety aspect if copter is high in the sky
carrying some expensive camera equipment it is good to
have extra protection in case of crash landings.
The system, developed during this research, consists of
the mechanical and electrical structures.
A. Mechanical Structure
The mechanical structure consists of frame and
propellers. Frame is the basic element for any multirotor
because it holds all the components together. If there is
vibration or instability in the frame the flight would not be
smooth and if the frame is stable and well-designed then it
would be easy to move, hover and fly a multirotor.
The frame of an octocopter should be rigid and has the
capacity to reduce vibrations produced by brushless
motors. In octocopters, the frame is usually large as
compared to quadcopter and hexacopter. The frame of an
octocopter is star shaped because of its stability
requirements [8]. Its arms are made of Aluminum rods
because of its higher strength and lower cost.
Fig. 1. The physical structure of the system.
The Aluminum is compared with steel and carbon fiber.
Steel is lesser in cost but heavier in weight whereas carbon
fiber is even more costly but lighter in weight. So,
Aluminum is the better option for arms because of lower
weight and lesser cost. The length of each rod is 38cm.
Total diameter of developed octocopter is 89cm and its
weight is 916g excluding electronics. Every arm is equal in
length and at an angle of 45 degrees to another adjacent
arm [8]. The base and motor mount are made of fiberglass
because of higher stiffness and lower weight as compared
to carbon fiber which is comparatively more expensive
though lighter in weight. The base consists of battery pads,
landing gears, controlling pads and legs.
Propellers are the type of fans which convert rotational
motion into thrust. Propellers of a multirotor of quadcopter
have different diameter and pitch scales; 10 (inch) * 4.7
(inch), 10 (inch) * 4.5 (inch) etc. A multirotor travel
according to its pitch. An octocopter has eight propellers,
four normal propellers, and four pushing propellers. For
counter motor torque, octocopter use four clockwise
propellers and four counterclockwise propellers. Normal
propellers spin counter-clockwise and pushing propellers
spin clockwise. Propellers used in the octocopter,
developed here, are 10 (inch) * 4.5 (inch) which is
according to the distance between its arms. 10 (inch) is the
length of propeller and 4.5 (inch) is its pitch. Propellers are
of low weight type made of nylon. Propellers made of
nylon are of higher strength as compared to wood and
carbon fiber, and also lower in cost. All the propellers used
in the octocopter, developed during this research, are of the
same diameter and pitch.
B. Electrical Structure
The electrical structure consists of the following
components:
Transmitter and receiver having different components
like the fly sky, FS-T6 transmitter with receiver, 6
channels, 2.40-2.48Hz range, 12V power DC (1.5A * 8)
Reference Researcher Type Research
Purpose
The
weight
of
Designed
Copters
Design
Fabrication kg
[1] Girard et.
al Quadcopter ✓ ✓ 3
[2] Penga et.al Helicopter ✓ ✓ 5
[3] Pound. et.al Quadcopter ✓ 2
[4] Mc Kerrow
et.al Quadcopter ✓ ✓ 4
[5] Casbeer
et.al Quadcopter ✓ 4
[6] Rayana
et.al Quadcopter ✓ ✓ 3
[7]
MIT
Technology
Review
Quadcopter ✓ ✓ 4
[8] Joo et.al Octocopter ✓ - 5
[9] Gandhi
et.al Quadcopter ✓ ✓ 4
This
Research Shah et. al Octocopter - ✓ 3.8
TABLE I
RESEARCH MATRIX
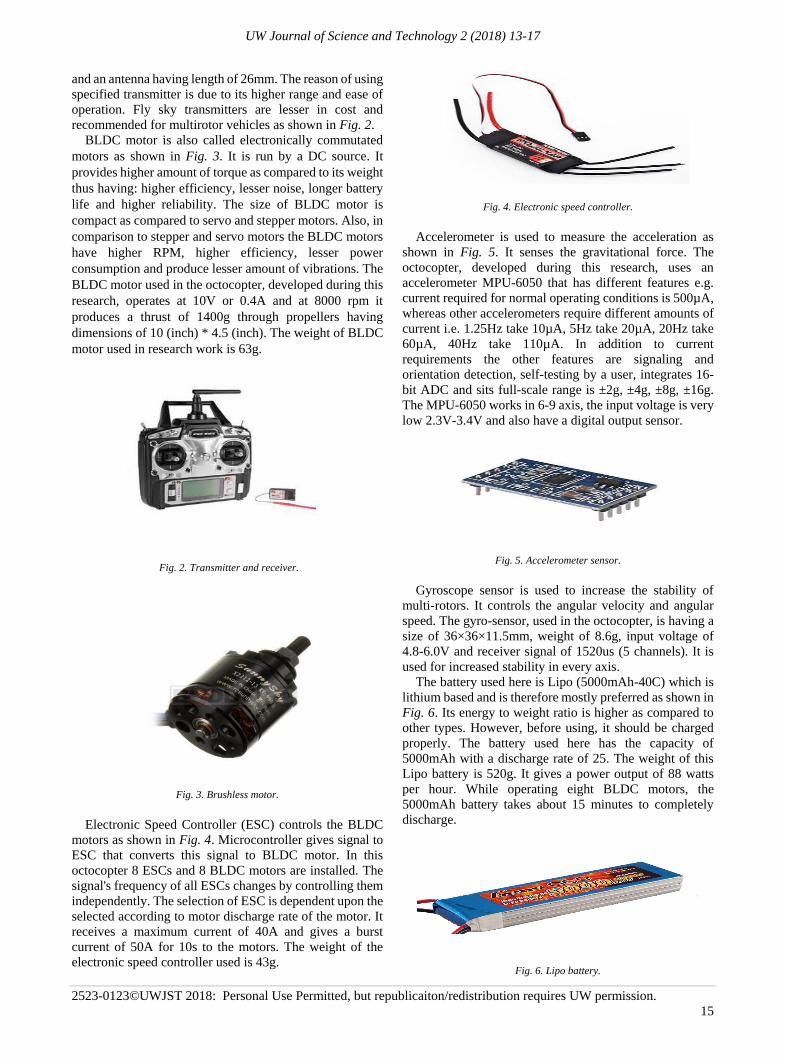
UW Journal of Science and Technology 2 (2018) 13-17
2523-0123©UWJST 2018: Personal Use Permitted, but republicaiton/redistribution requires UW permission.
15
and an antenna having length of 26mm. The reason of using
specified transmitter is due to its higher range and ease of
operation. Fly sky transmitters are lesser in cost and
recommended for multirotor vehicles as shown in Fig. 2.
BLDC motor is also called electronically commutated
motors as shown in Fig. 3. It is run by a DC source. It
provides higher amount of torque as compared to its weight
thus having: higher efficiency, lesser noise, longer battery
life and higher reliability. The size of BLDC motor is
compact as compared to servo and stepper motors. Also, in
comparison to stepper and servo motors the BLDC motors
have higher RPM, higher efficiency, lesser power
consumption and produce lesser amount of vibrations. The
BLDC motor used in the octocopter, developed during this
research, operates at 10V or 0.4A and at 8000 rpm it
produces a thrust of 1400g through propellers having
dimensions of 10 (inch) * 4.5 (inch). The weight of BLDC
motor used in research work is 63g.
Fig. 2. Transmitter and receiver.
Fig. 3. Brushless motor.
Electronic Speed Controller (ESC) controls the BLDC
motors as shown in Fig. 4. Microcontroller gives signal to
ESC that converts this signal to BLDC motor. In this
octocopter 8 ESCs and 8 BLDC motors are installed. The
signal's frequency of all ESCs changes by controlling them
independently. The selection of ESC is dependent upon the
selected according to motor discharge rate of the motor. It
receives a maximum current of 40A and gives a burst
current of 50A for 10s to the motors. The weight of the
electronic speed controller used is 43g.
Fig. 4. Electronic speed controller.
Accelerometer is used to measure the acceleration as
shown in Fig. 5. It senses the gravitational force. The
octocopter, developed during this research, uses an
accelerometer MPU-6050 that has different features e.g.
current required for normal operating conditions is 500µA,
whereas other accelerometers require different amounts of
current i.e. 1.25Hz take 10µA, 5Hz take 20µA, 20Hz take
60µA, 40Hz take 110µA. In addition to current
requirements the other features are signaling and
orientation detection, self-testing by a user, integrates 16-
bit ADC and sits full-scale range is ±2g, ±4g, ±8g, ±16g.
The MPU-6050 works in 6-9 axis, the input voltage is very
low 2.3V-3.4V and also have a digital output sensor.
Fig. 5. Accelerometer sensor.
Gyroscope sensor is used to increase the stability of
multi-rotors. It controls the angular velocity and angular
speed. The gyro-sensor, used in the octocopter, is having a
size of 36×36×11.5mm, weight of 8.6g, input voltage of
4.8-6.0V and receiver signal of 1520us (5 channels). It is
used for increased stability in every axis.
The battery used here is Lipo (5000mAh-40C) which is
lithium based and is therefore mostly preferred as shown in
Fig. 6. Its energy to weight ratio is higher as compared to
other types. However, before using, it should be charged
properly. The battery used here has the capacity of
5000mAh with a discharge rate of 25. The weight of this
Lipo battery is 520g. It gives a power output of 88 watts
per hour. While operating eight BLDC motors, the
5000mAh battery takes about 15 minutes to completely
discharge.
Fig. 6. Lipo battery.
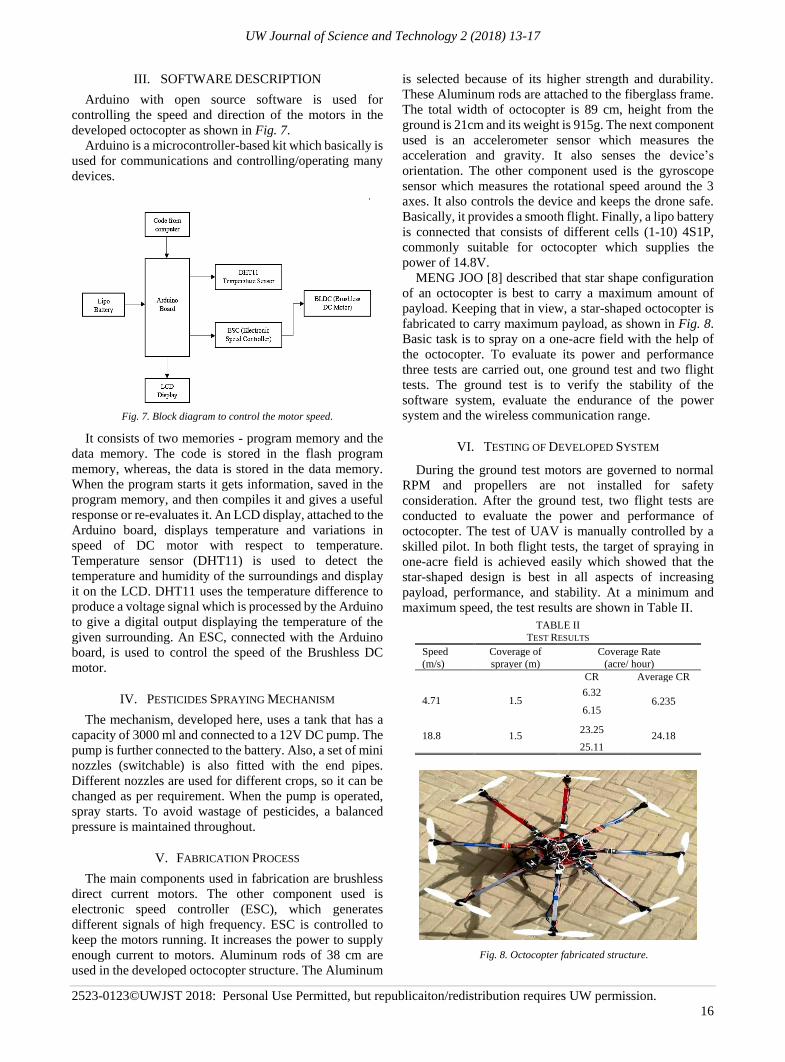
UW Journal of Science and Technology 2 (2018) 13-17
2523-0123©UWJST 2018: Personal Use Permitted, but republicaiton/redistribution requires UW permission.
16
III. SOFTWARE DESCRIPTION
Arduino with open source software is used for
controlling the speed and direction of the motors in the
developed octocopter as shown in Fig. 7.
Arduino is a microcontroller-based kit which basically is
used for communications and controlling/operating many
devices.
Fig. 7. Block diagram to control the motor speed.
It consists of two memories - program memory and the
data memory. The code is stored in the flash program
memory, whereas, the data is stored in the data memory.
When the program starts it gets information, saved in the
program memory, and then compiles it and gives a useful
response or re-evaluates it. An LCD display, attached to the
Arduino board, displays temperature and variations in
speed of DC motor with respect to temperature.
Temperature sensor (DHT11) is used to detect the
temperature and humidity of the surroundings and display
it on the LCD. DHT11 uses the temperature difference to
produce a voltage signal which is processed by the Arduino
to give a digital output displaying the temperature of the
given surrounding. An ESC, connected with the Arduino
board, is used to control the speed of the Brushless DC
motor.
IV. PESTICIDES SPRAYING MECHANISM
The mechanism, developed here, uses a tank that has a
capacity of 3000 ml and connected to a 12V DC pump. The
pump is further connected to the battery. Also, a set of mini
nozzles (switchable) is also fitted with the end pipes.
Different nozzles are used for different crops, so it can be
changed as per requirement. When the pump is operated,
spray starts. To avoid wastage of pesticides, a balanced
pressure is maintained throughout.
V. FABRICATION PROCESS
The main components used in fabrication are brushless
direct current motors. The other component used is
electronic speed controller (ESC), which generates
different signals of high frequency. ESC is controlled to
keep the motors running. It increases the power to supply
enough current to motors. Aluminum rods of 38 cm are
used in the developed octocopter structure. The Aluminum
is selected because of its higher strength and durability.
These Aluminum rods are attached to the fiberglass frame.
The total width of octocopter is 89 cm, height from the
ground is 21cm and its weight is 915g. The next component
used is an accelerometer sensor which measures the
acceleration and gravity. It also senses the device’s
orientation. The other component used is the gyroscope
sensor which measures the rotational speed around the 3
axes. It also controls the device and keeps the drone safe.
Basically, it provides a smooth flight. Finally, a lipo battery
is connected that consists of different cells (1-10) 4S1P,
commonly suitable for octocopter which supplies the
power of 14.8V.
MENG JOO [8] described that star shape configuration
of an octocopter is best to carry a maximum amount of
payload. Keeping that in view, a star-shaped octocopter is
fabricated to carry maximum payload, as shown in Fig. 8.
Basic task is to spray on a one-acre field with the help of
the octocopter. To evaluate its power and performance
three tests are carried out, one ground test and two flight
tests. The ground test is to verify the stability of the
software system, evaluate the endurance of the power
system and the wireless communication range.
VI. TESTING OF DEVELOPED SYSTEM
During the ground test motors are governed to normal
RPM and propellers are not installed for safety
consideration. After the ground test, two flight tests are
conducted to evaluate the power and performance of
octocopter. The test of UAV is manually controlled by a
skilled pilot. In both flight tests, the target of spraying in
one-acre field is achieved easily which showed that the
star-shaped design is best in all aspects of increasing
payload, performance, and stability. At a minimum and
maximum speed, the test results are shown in Table II.
TABLE II
TEST RESULTS Speed
(m/s)
Coverage of
sprayer (m)
Coverage Rate
(acre/ hour)
CR Average CR
4.71 1.5 6.32
6.235 6.15
18.8 1.5 23.25
24.18 25.11
Fig. 8. Octocopter fabricated structure.
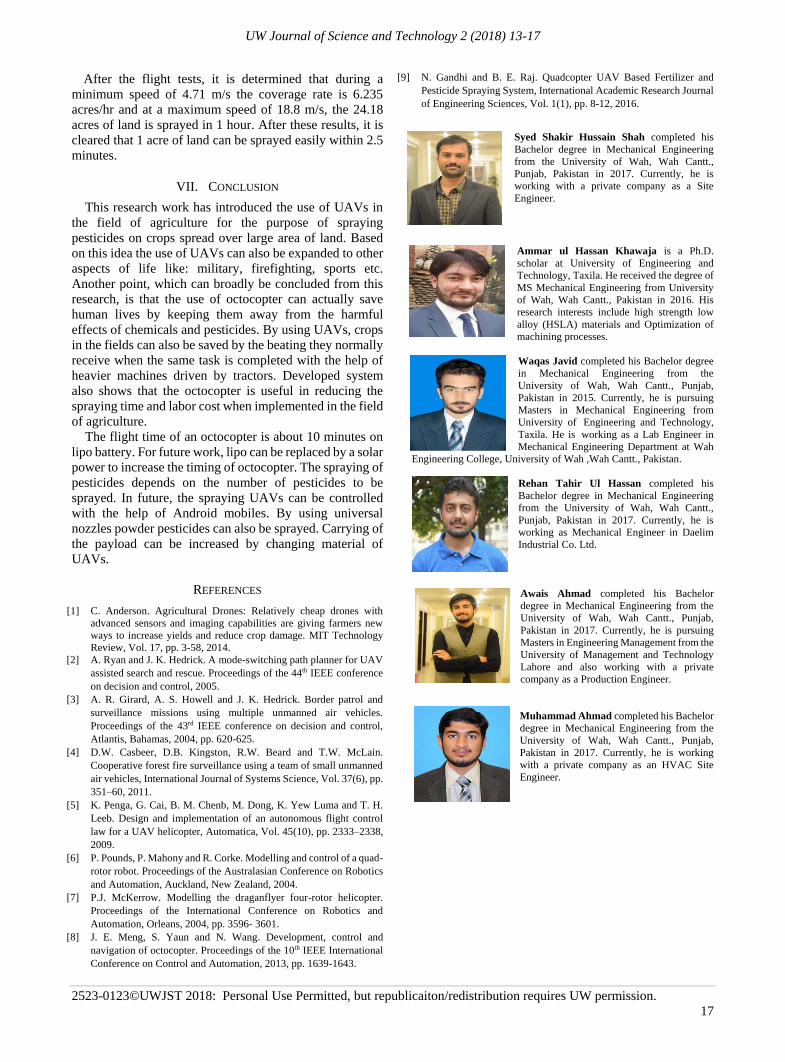
UW Journal of Science and Technology 2 (2018) 13-17
2523-0123©UWJST 2018: Personal Use Permitted, but republicaiton/redistribution requires UW permission.
17
After the flight tests, it is determined that during a
minimum speed of 4.71 m/s the coverage rate is 6.235
acres/hr and at a maximum speed of 18.8 m/s, the 24.18
acres of land is sprayed in 1 hour. After these results, it is
cleared that 1 acre of land can be sprayed easily within 2.5
minutes.
VII. CONCLUSION
This research work has introduced the use of UAVs in
the field of agriculture for the purpose of spraying
pesticides on crops spread over large area of land. Based
on this idea the use of UAVs can also be expanded to other
aspects of life like: military, firefighting, sports etc.
Another point, which can broadly be concluded from this
research, is that the use of octocopter can actually save
human lives by keeping them away from the harmful
effects of chemicals and pesticides. By using UAVs, crops
in the fields can also be saved by the beating they normally
receive when the same task is completed with the help of
heavier machines driven by tractors. Developed system
also shows that the octocopter is useful in reducing the
spraying time and labor cost when implemented in the field
of agriculture.
The flight time of an octocopter is about 10 minutes on
lipo battery. For future work, lipo can be replaced by a solar
power to increase the timing of octocopter. The spraying of
pesticides depends on the number of pesticides to be
sprayed. In future, the spraying UAVs can be controlled
with the help of Android mobiles. By using universal
nozzles powder pesticides can also be sprayed. Carrying of
the payload can be increased by changing material of
UAVs.
REFERENCES
[1] C. Anderson. Agricultural Drones: Relatively cheap drones with
advanced sensors and imaging capabilities are giving farmers new
ways to increase yields and reduce crop damage. MIT Technology
Review, Vol. 17, pp. 3-58, 2014.
[2] A. Ryan and J. K. Hedrick. A mode-switching path planner for UAV
assisted search and rescue. Proceedings of the 44th IEEE conference
on decision and control, 2005.
[3] A. R. Girard, A. S. Howell and J. K. Hedrick. Border patrol and
surveillance missions using multiple unmanned air vehicles.
Proceedings of the 43rd IEEE conference on decision and control,
Atlantis, Bahamas, 2004, pp. 620-625.
[4] D.W. Casbeer, D.B. Kingston, R.W. Beard and T.W. McLain.
Cooperative forest fire surveillance using a team of small unmanned
air vehicles, International Journal of Systems Science, Vol. 37(6), pp.
351–60, 2011.
[5] K. Penga, G. Cai, B. M. Chenb, M. Dong, K. Yew Luma and T. H.
Leeb. Design and implementation of an autonomous flight control
law for a UAV helicopter, Automatica, Vol. 45(10), pp. 2333–2338,
2009.
[6] P. Pounds, P. Mahony and R. Corke. Modelling and control of a quad-
rotor robot. Proceedings of the Australasian Conference on Robotics
and Automation, Auckland, New Zealand, 2004.
[7] P.J. McKerrow. Modelling the draganflyer four-rotor helicopter.
Proceedings of the International Conference on Robotics and
Automation, Orleans, 2004, pp. 3596- 3601.
[8] J. E. Meng, S. Yaun and N. Wang. Development, control and
navigation of octocopter. Proceedings of the 10th IEEE International
Conference on Control and Automation, 2013, pp. 1639-1643.
[9] N. Gandhi and B. E. Raj. Quadcopter UAV Based Fertilizer and
Pesticide Spraying System, International Academic Research Journal
of Engineering Sciences, Vol. 1(1), pp. 8-12, 2016.
Syed Shakir Hussain Shah completed his
Bachelor degree in Mechanical Engineering
from the University of Wah, Wah Cantt.,
Punjab, Pakistan in 2017. Currently, he is
working with a private company as a Site
Engineer.
Ammar ul Hassan Khawaja is a Ph.D.
scholar at University of Engineering and
Technology, Taxila. He received the degree of
MS Mechanical Engineering from University
of Wah, Wah Cantt., Pakistan in 2016. His
research interests include high strength low
alloy (HSLA) materials and Optimization of
machining processes.
Waqas Javid completed his Bachelor degree
in Mechanical Engineering from the
University of Wah, Wah Cantt., Punjab,
Pakistan in 2015. Currently, he is pursuing
Masters in Mechanical Engineering from
University of Engineering and Technology,
Taxila. He is working as a Lab Engineer in
Mechanical Engineering Department at Wah
Engineering College, University of Wah ,Wah Cantt., Pakistan.
Rehan Tahir Ul Hassan completed his
Bachelor degree in Mechanical Engineering
from the University of Wah, Wah Cantt.,
Punjab, Pakistan in 2017. Currently, he is
working as Mechanical Engineer in Daelim
Industrial Co. Ltd.
Awais Ahmad completed his Bachelor
degree in Mechanical Engineering from the
University of Wah, Wah Cantt., Punjab,
Pakistan in 2017. Currently, he is pursuing
Masters in Engineering Management from the
University of Management and Technology
Lahore and also working with a private
company as a Production Engineer.
Muhammad Ahmad completed his Bachelor
degree in Mechanical Engineering from the
University of Wah, Wah Cantt., Punjab,
Pakistan in 2017. Currently, he is working
with a private company as an HVAC Site
Engineer.

UW Journal of Science and Technology 2 (2018) 19-29
2523-0123©UWJST 2018: Personal Use Permitted, but republicaiton/redistribution requires UW permission.
19
Abstract─Mulberry (Morus sp.) is being used worldwide
due to its nutritional values and medicinal properties. In the
current study, antimicrobial activities of Ripened and Un-
Ripened Black and White mulberry fruit extracts are tested
against microbial pathogens isolated from different water
samples. Aqueous fruit extracts show significant
antimicrobial activity with 35mm zone of inhibition by
Ripened White Toot (RWT) against V. cholera and 32mm
zone of inhibition by Un-Ripened Black Toot (URBT) against
M. luteus. All mulberry extracts are considerably active
against E. coli and B. thuringiensis. Present findings indicate
that mulberry fruit extracts have medicinal potential and will
be an excellent choice for the development of alternative
antimicrobial drug.
Index Terms—Antimicrobial activity, antibiotics, Morus
nigra L., Morus alba L., bacterial strains.
I. INTRODUCTION
LANTS have been used as crude drugs and healing
agents since pre-historic times [1]. Around 25% of
modern medicines are acquired from plants [2]. Almost
65-80% of the world population of developing countries
depends on plants for their medicinal needs [3-4]. In
flourished countries the preparations of herbal medicines
are popular. Recommendation for registration of such
medicines exists in developed countries including
Germany, France, Italy and the United States [6].
Manuscript received June 14, 2017: accepted August 28, 2018.
S. Naz (email: [email protected]), M. Idrees (email:
[email protected]), Shehzadi (email: [email protected]), Z.
Haq, (email: [email protected]), A. Sultana (email:
[email protected]), R. Batool are affiliated with Department
of Biosciences, University of Wah, Wah Cantt, Pakistan.
Corresponding author email: [email protected]
Medicinal plants contain synergistic combinations of
active compounds which can be used against common
pathogens with low or no side effects. In Pakistan more
than 500 species of flowering plants are used in traditional
medicine [7-9]. The numbers of plant species which have
been used worldwide for medicinal purposes are
approximately more than 50,000 [10]. In the past years,
worldwide the mass production and growth of chemically
synthesized drugs have revolutionized health care.
However, in developing countries large portions of the
people still depends upon herbal medicines and traditional
practitioners for their health concerns. Ninety percent of
population in Africa and up to 70% in India relies on
traditional medicine. In China, traditional medicine
accounts for around 40% of all health care delivered and
more than 90% of general hospitals have units for
traditional medicine [11].
Due to the hot and humid environment in the region, our
local environment remains on the great risk of water-borne
diseases. The diseases associated with the contamination of
water are believed to be transmitted through water borne
pathogens. The widespread water borne infectious diseases
caused by protozoan, bacteria and viruses includes
diarrheal diseases, Amoebiasis, Microsporidiosis,
Giardiasis, Cyclosporiasis, Cryptosporidiosis, E. coli
Infection, Cholera, Typhoid fever, Leptospirosis,
Dysentery, Salmonellosis, Legionellosis, M. marinum
infection, Campylobacteriosis, Botulism, Vibrio Illness,
Otitis Externa, SARS, Hepatitis A, Poliomyelitis (Polio)
and Polyomavirus infection [12-15].
Many efforts have been made for the development of
new antibiotics against resistance pathogens [16-17].
Bacteria resistant to antibiotics are actively increasing in
aquatic environment. In general, physicians are using wide
range of antibiotics for treatment against infections. The
noticeable reason is that most of the bacterial strains are
University of Wah
Journal of Science and Technology
www.uow.edu.pk
Determination of Antimicrobial Activity of
Mulberry Fruit Extracts against Water-
borne Microbial Pathogens Isolated from
Different Water Samples
Shumaila Naz, Muhammad Idrees, Shehzadi, Zeenat Haq, Andleeb Sultana and Syeda Rida Batool.
P
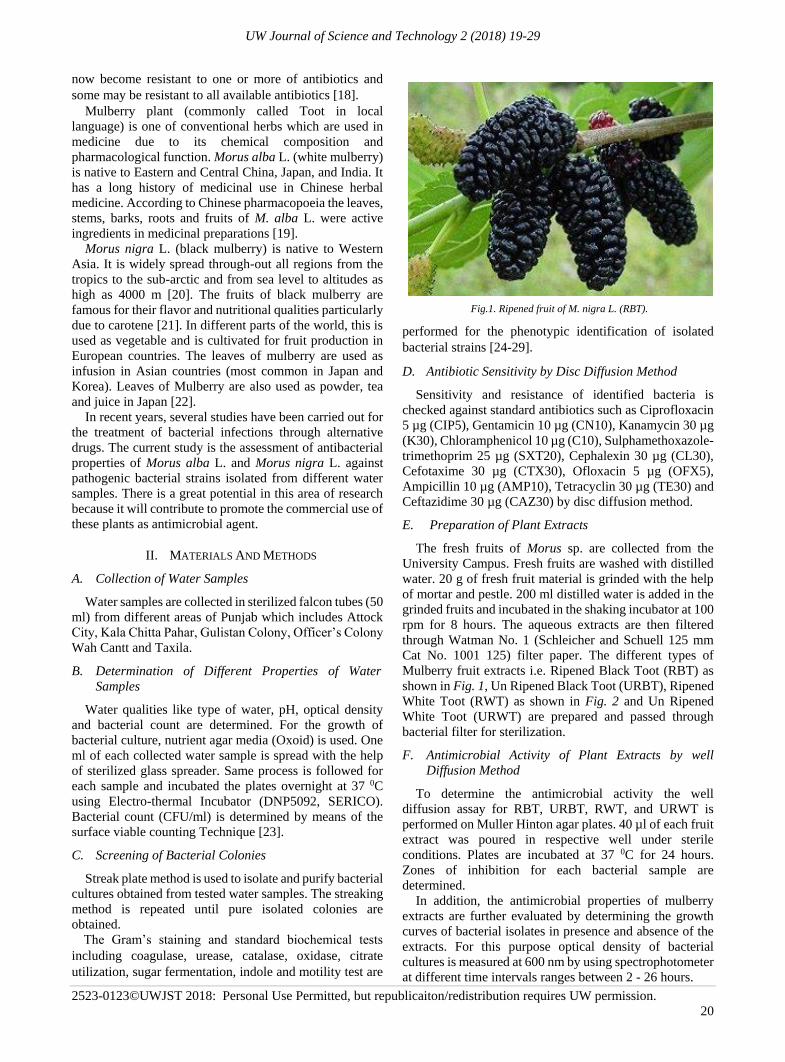
UW Journal of Science and Technology 2 (2018) 19-29
2523-0123©UWJST 2018: Personal Use Permitted, but republicaiton/redistribution requires UW permission.
20
now become resistant to one or more of antibiotics and
some may be resistant to all available antibiotics [18].
Mulberry plant (commonly called Toot in local
language) is one of conventional herbs which are used in
medicine due to its chemical composition and
pharmacological function. Morus alba L. (white mulberry)
is native to Eastern and Central China, Japan, and India. It
has a long history of medicinal use in Chinese herbal
medicine. According to Chinese pharmacopoeia the leaves,
stems, barks, roots and fruits of M. alba L. were active
ingredients in medicinal preparations [19].
Morus nigra L. (black mulberry) is native to Western
Asia. It is widely spread through-out all regions from the
tropics to the sub-arctic and from sea level to altitudes as
high as 4000 m [20]. The fruits of black mulberry are
famous for their flavor and nutritional qualities particularly
due to carotene [21]. In different parts of the world, this is
used as vegetable and is cultivated for fruit production in
European countries. The leaves of mulberry are used as
infusion in Asian countries (most common in Japan and
Korea). Leaves of Mulberry are also used as powder, tea
and juice in Japan [22].
In recent years, several studies have been carried out for
the treatment of bacterial infections through alternative
drugs. The current study is the assessment of antibacterial
properties of Morus alba L. and Morus nigra L. against
pathogenic bacterial strains isolated from different water
samples. There is a great potential in this area of research
because it will contribute to promote the commercial use of
these plants as antimicrobial agent.
II. MATERIALS AND METHODS
A. Collection of Water Samples
Water samples are collected in sterilized falcon tubes (50
ml) from different areas of Punjab which includes Attock
City, Kala Chitta Pahar, Gulistan Colony, Officer’s Colony
Wah Cantt and Taxila.
B. Determination of Different Properties of Water
Samples
Water qualities like type of water, pH, optical density
and bacterial count are determined. For the growth of
bacterial culture, nutrient agar media (Oxoid) is used. One
ml of each collected water sample is spread with the help
of sterilized glass spreader. Same process is followed for
each sample and incubated the plates overnight at 37 0C
using Electro-thermal Incubator (DNP5092, SERICO).
Bacterial count (CFU/ml) is determined by means of the
surface viable counting Technique [23].
C. Screening of Bacterial Colonies
Streak plate method is used to isolate and purify bacterial
cultures obtained from tested water samples. The streaking
method is repeated until pure isolated colonies are
obtained.
The Gram’s staining and standard biochemical tests
including coagulase, urease, catalase, oxidase, citrate
utilization, sugar fermentation, indole and motility test are
performed for the phenotypic identification of isolated
bacterial strains [24-29].
D. Antibiotic Sensitivity by Disc Diffusion Method
Sensitivity and resistance of identified bacteria is
checked against standard antibiotics such as Ciprofloxacin
5 µg (CIP5), Gentamicin 10 µg (CN10), Kanamycin 30 µg
(K30), Chloramphenicol 10 µg (C10), Sulphamethoxazole-
trimethoprim 25 µg (SXT20), Cephalexin 30 µg (CL30),
Cefotaxime 30 µg (CTX30), Ofloxacin 5 µg (OFX5),
Ampicillin 10 µg (AMP10), Tetracyclin 30 µg (TE30) and
Ceftazidime 30 µg (CAZ30) by disc diffusion method.
E. Preparation of Plant Extracts
The fresh fruits of Morus sp. are collected from the
University Campus. Fresh fruits are washed with distilled
water. 20 g of fresh fruit material is grinded with the help
of mortar and pestle. 200 ml distilled water is added in the
grinded fruits and incubated in the shaking incubator at 100
rpm for 8 hours. The aqueous extracts are then filtered
through Watman No. 1 (Schleicher and Schuell 125 mm
Cat No. 1001 125) filter paper. The different types of
Mulberry fruit extracts i.e. Ripened Black Toot (RBT) as
shown in Fig. 1, Un Ripened Black Toot (URBT), Ripened
White Toot (RWT) as shown in Fig. 2 and Un Ripened
White Toot (URWT) are prepared and passed through
bacterial filter for sterilization.
F. Antimicrobial Activity of Plant Extracts by well
Diffusion Method
To determine the antimicrobial activity the well
diffusion assay for RBT, URBT, RWT, and URWT is
performed on Muller Hinton agar plates. 40 µl of each fruit
extract was poured in respective well under sterile
conditions. Plates are incubated at 37 0C for 24 hours.
Zones of inhibition for each bacterial sample are
determined.
In addition, the antimicrobial properties of mulberry
extracts are further evaluated by determining the growth
curves of bacterial isolates in presence and absence of the
extracts. For this purpose optical density of bacterial
cultures is measured at 600 nm by using spectrophotometer
at different time intervals ranges between 2 - 26 hours.
Fig.1. Ripened fruit of M. nigra L. (RBT).
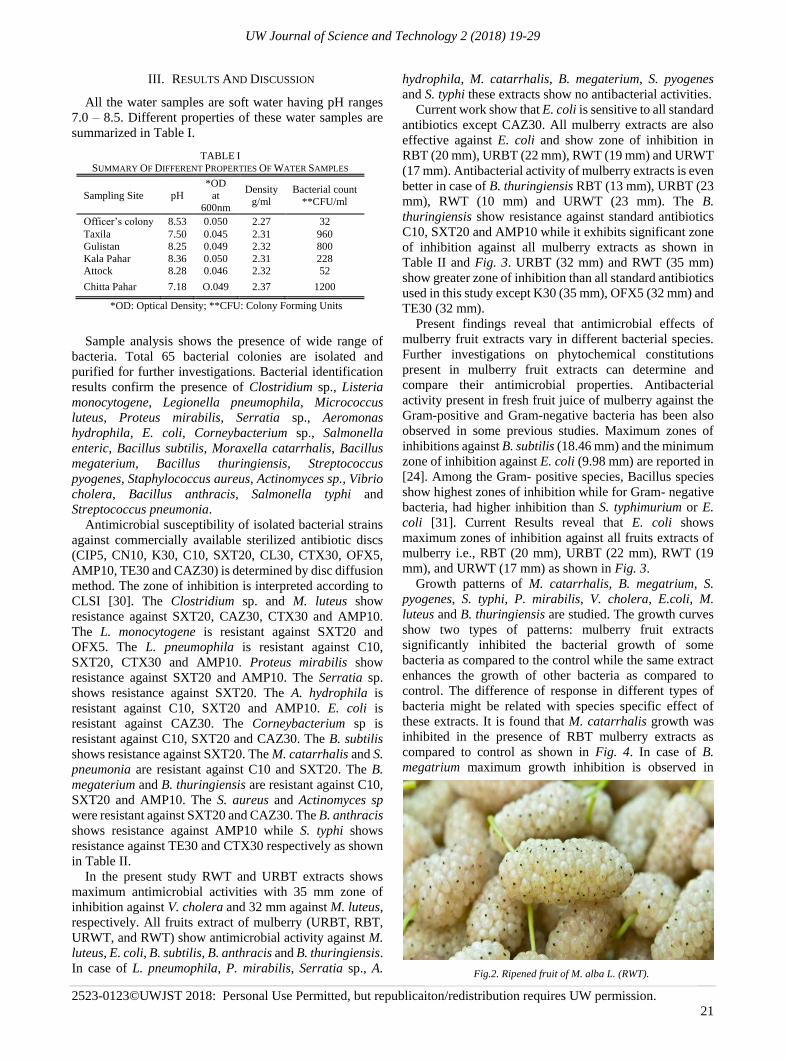
UW Journal of Science and Technology 2 (2018) 19-29
2523-0123©UWJST 2018: Personal Use Permitted, but republicaiton/redistribution requires UW permission.
21
III. RESULTS AND DISCUSSION
All the water samples are soft water having pH ranges
7.0 – 8.5. Different properties of these water samples are
summarized in Table I.
Sample analysis shows the presence of wide range of
bacteria. Total 65 bacterial colonies are isolated and
purified for further investigations. Bacterial identification
results confirm the presence of Clostridium sp., Listeria
monocytogene, Legionella pneumophila, Micrococcus
luteus, Proteus mirabilis, Serratia sp., Aeromonas
hydrophila, E. coli, Corneybacterium sp., Salmonella
enteric, Bacillus subtilis, Moraxella catarrhalis, Bacillus
megaterium, Bacillus thuringiensis, Streptococcus
pyogenes, Staphylococcus aureus, Actinomyces sp., Vibrio
cholera, Bacillus anthracis, Salmonella typhi and
Streptococcus pneumonia.
Antimicrobial susceptibility of isolated bacterial strains
against commercially available sterilized antibiotic discs
(CIP5, CN10, K30, C10, SXT20, CL30, CTX30, OFX5,
AMP10, TE30 and CAZ30) is determined by disc diffusion
method. The zone of inhibition is interpreted according to
CLSI [30]. The Clostridium sp. and M. luteus show
resistance against SXT20, CAZ30, CTX30 and AMP10.
The L. monocytogene is resistant against SXT20 and
OFX5. The L. pneumophila is resistant against C10,
SXT20, CTX30 and AMP10. Proteus mirabilis show
resistance against SXT20 and AMP10. The Serratia sp.
shows resistance against SXT20. The A. hydrophila is
resistant against C10, SXT20 and AMP10. E. coli is
resistant against CAZ30. The Corneybacterium sp is
resistant against C10, SXT20 and CAZ30. The B. subtilis
shows resistance against SXT20. The M. catarrhalis and S.
pneumonia are resistant against C10 and SXT20. The B.
megaterium and B. thuringiensis are resistant against C10,
SXT20 and AMP10. The S. aureus and Actinomyces sp
were resistant against SXT20 and CAZ30. The B. anthracis
shows resistance against AMP10 while S. typhi shows
resistance against TE30 and CTX30 respectively as shown
in Table II.
In the present study RWT and URBT extracts shows
maximum antimicrobial activities with 35 mm zone of
inhibition against V. cholera and 32 mm against M. luteus,
respectively. All fruits extract of mulberry (URBT, RBT,
URWT, and RWT) show antimicrobial activity against M.
luteus, E. coli, B. subtilis, B. anthracis and B. thuringiensis.
In case of L. pneumophila, P. mirabilis, Serratia sp., A.
hydrophila, M. catarrhalis, B. megaterium, S. pyogenes
and S. typhi these extracts show no antibacterial activities.
Current work show that E. coli is sensitive to all standard
antibiotics except CAZ30. All mulberry extracts are also
effective against E. coli and show zone of inhibition in
RBT (20 mm), URBT (22 mm), RWT (19 mm) and URWT
(17 mm). Antibacterial activity of mulberry extracts is even
better in case of B. thuringiensis RBT (13 mm), URBT (23
mm), RWT (10 mm) and URWT (23 mm). The B.
thuringiensis show resistance against standard antibiotics
C10, SXT20 and AMP10 while it exhibits significant zone
of inhibition against all mulberry extracts as shown in
Table II and Fig. 3. URBT (32 mm) and RWT (35 mm)
show greater zone of inhibition than all standard antibiotics
used in this study except K30 (35 mm), OFX5 (32 mm) and
TE30 (32 mm).
Present findings reveal that antimicrobial effects of
mulberry fruit extracts vary in different bacterial species.
Further investigations on phytochemical constitutions
present in mulberry fruit extracts can determine and
compare their antimicrobial properties. Antibacterial
activity present in fresh fruit juice of mulberry against the
Gram-positive and Gram-negative bacteria has been also
observed in some previous studies. Maximum zones of
inhibitions against B. subtilis (18.46 mm) and the minimum
zone of inhibition against E. coli (9.98 mm) are reported in
[24]. Among the Gram- positive species, Bacillus species
show highest zones of inhibition while for Gram- negative
bacteria, had higher inhibition than S. typhimurium or E.
coli [31]. Current Results reveal that E. coli shows
maximum zones of inhibition against all fruits extracts of
mulberry i.e., RBT (20 mm), URBT (22 mm), RWT (19
mm), and URWT (17 mm) as shown in Fig. 3.
Growth patterns of M. catarrhalis, B. megatrium, S.
pyogenes, S. typhi, P. mirabilis, V. cholera, E.coli, M.
luteus and B. thuringiensis are studied. The growth curves
show two types of patterns: mulberry fruit extracts
significantly inhibited the bacterial growth of some
bacteria as compared to the control while the same extract
enhances the growth of other bacteria as compared to
control. The difference of response in different types of
bacteria might be related with species specific effect of
these extracts. It is found that M. catarrhalis growth was
inhibited in the presence of RBT mulberry extracts as
compared to control as shown in Fig. 4. In case of B.
megatrium maximum growth inhibition is observed in
TABLE I
SUMMARY OF DIFFERENT PROPERTIES OF WATER SAMPLES
Sampling Site pH
*OD
at
600nm
Density
g/ml
Bacterial count
**CFU/ml
Officer’s colony 8.53 0.050 2.27 32
Taxila 7.50 0.045 2.31 960
Gulistan 8.25 0.049 2.32 800
Kala Pahar 8.36 0.050 2.31 228
Attock 8.28 0.046 2.32 52
Chitta Pahar 7.18 O.049 2.37 1200
*OD: Optical Density; **CFU: Colony Forming Units
Fig.2. Ripened fruit of M. alba L. (RWT).
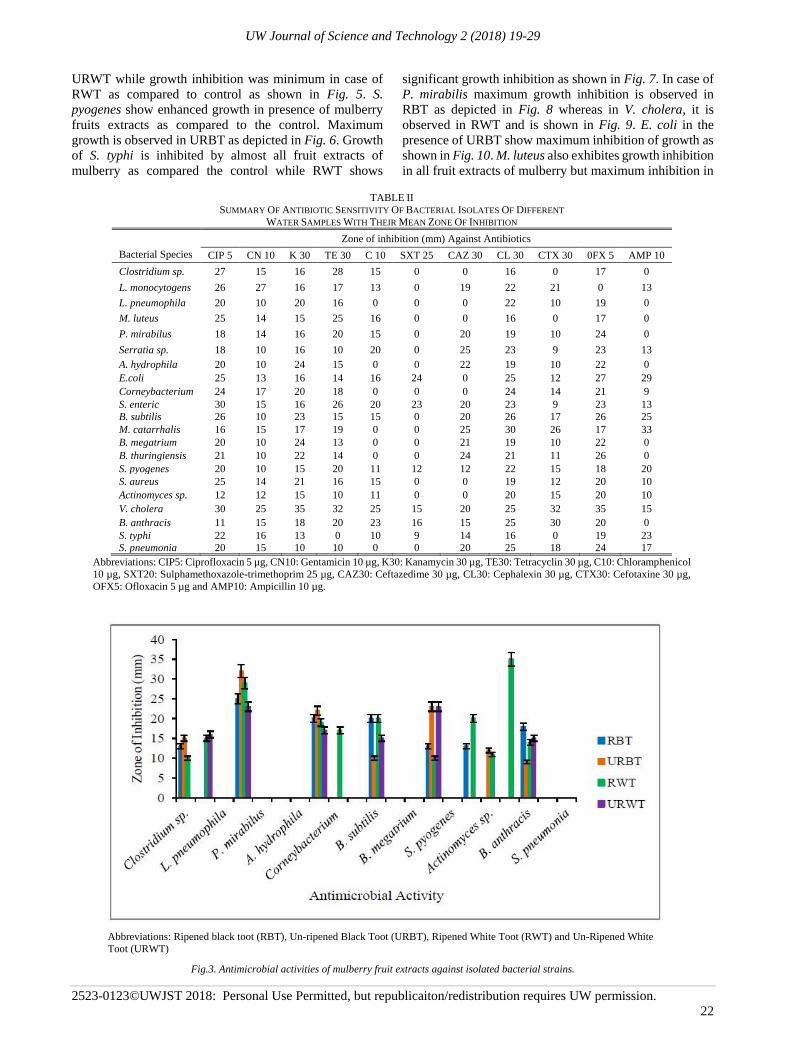
UW Journal of Science and Technology 2 (2018) 19-29
2523-0123©UWJST 2018: Personal Use Permitted, but republicaiton/redistribution requires UW permission.
22
URWT while growth inhibition was minimum in case of
RWT as compared to control as shown in Fig. 5. S.
pyogenes show enhanced growth in presence of mulberry
fruits extracts as compared to the control. Maximum
growth is observed in URBT as depicted in Fig. 6. Growth
of S. typhi is inhibited by almost all fruit extracts of
mulberry as compared the control while RWT shows
significant growth inhibition as shown in Fig. 7. In case of
P. mirabilis maximum growth inhibition is observed in
RBT as depicted in Fig. 8 whereas in V. cholera, it is
observed in RWT and is shown in Fig. 9. E. coli in the
presence of URBT show maximum inhibition of growth as
shown in Fig. 10. M. luteus also exhibites growth inhibition
in all fruit extracts of mulberry but maximum inhibition in
TABLE II
SUMMARY OF ANTIBIOTIC SENSITIVITY OF BACTERIAL ISOLATES OF DIFFERENT
WATER SAMPLES WITH THEIR MEAN ZONE OF INHIBITION
Bacterial Species
Zone of inhibition (mm) Against Antibiotics
CIP 5 CN 10 K 30 TE 30 C 10 SXT 25 CAZ 30 CL 30 CTX 30 0FX 5 AMP 10
Clostridium sp. 27 15 16 28 15 0 0 16 0 17 0
L. monocytogens 26 27 16 17 13 0 19 22 21 0 13
L. pneumophila 20 10 20 16 0 0 0 22 10 19 0
M. luteus 25 14 15 25 16 0 0 16 0 17 0
P. mirabilus 18 14 16 20 15 0 20 19 10 24 0
Serratia sp. 18 10 16 10 20 0 25 23 9 23 13
A. hydrophila 20 10 24 15 0 0 22 19 10 22 0
E.coli 25 13 16 14 16 24 0 25 12 27 29
Corneybacterium 24 17 20 18 0 0 0 24 14 21 9
S. enteric 30 15 16 26 20 23 20 23 9 23 13
B. subtilis 26 10 23 15 15 0 20 26 17 26 25
M. catarrhalis 16 15 17 19 0 0 25 30 26 17 33
B. megatrium 20 10 24 13 0 0 21 19 10 22 0
B. thuringiensis 21 10 22 14 0 0 24 21 11 26 0
S. pyogenes 20 10 15 20 11 12 12 22 15 18 20
S. aureus 25 14 21 16 15 0 0 19 12 20 10
Actinomyces sp. 12 12 15 10 11 0 0 20 15 20 10
V. cholera 30 25 35 32 25 15 20 25 32 35 15
B. anthracis 11 15 18 20 23 16 15 25 30 20 0
S. typhi 22 16 13 0 10 9 14 16 0 19 23
S. pneumonia 20 15 10 10 0 0 20 25 18 24 17
Abbreviations: CIP5: Ciprofloxacin 5 µg, CN10: Gentamicin 10 µg, K30: Kanamycin 30 µg, TE30: Tetracyclin 30 µg, C10: Chloramphenicol
10 µg, SXT20: Sulphamethoxazole-trimethoprim 25 µg, CAZ30: Ceftazedime 30 µg, CL30: Cephalexin 30 µg, CTX30: Cefotaxine 30 µg,
OFX5: Ofloxacin 5 µg and AMP10: Ampicillin 10 µg.
Abbreviations: Ripened black toot (RBT), Un-ripened Black Toot (URBT), Ripened White Toot (RWT) and Un-Ripened White
Toot (URWT)
Fig.3. Antimicrobial activities of mulberry fruit extracts against isolated bacterial strains.
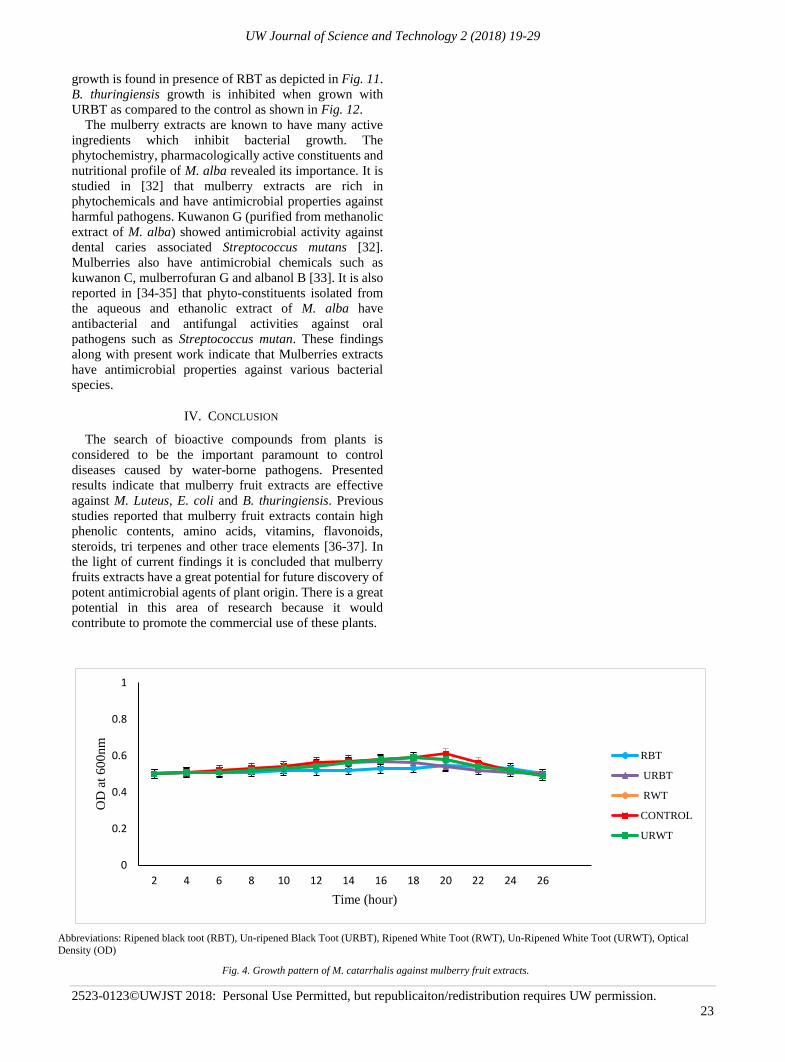
UW Journal of Science and Technology 2 (2018) 19-29
2523-0123©UWJST 2018: Personal Use Permitted, but republicaiton/redistribution requires UW permission.
23
growth is found in presence of RBT as depicted in Fig. 11.
B. thuringiensis growth is inhibited when grown with
URBT as compared to the control as shown in Fig. 12.
The mulberry extracts are known to have many active
ingredients which inhibit bacterial growth. The
phytochemistry, pharmacologically active constituents and
nutritional profile of M. alba revealed its importance. It is
studied in [32] that mulberry extracts are rich in
phytochemicals and have antimicrobial properties against
harmful pathogens. Kuwanon G (purified from methanolic
extract of M. alba) showed antimicrobial activity against
dental caries associated Streptococcus mutans [32].
Mulberries also have antimicrobial chemicals such as
kuwanon C, mulberrofuran G and albanol B [33]. It is also
reported in [34-35] that phyto-constituents isolated from
the aqueous and ethanolic extract of M. alba have
antibacterial and antifungal activities against oral
pathogens such as Streptococcus mutan. These findings
along with present work indicate that Mulberries extracts
have antimicrobial properties against various bacterial
species.
IV. CONCLUSION
The search of bioactive compounds from plants is
considered to be the important paramount to control
diseases caused by water-borne pathogens. Presented
results indicate that mulberry fruit extracts are effective
against M. Luteus, E. coli and B. thuringiensis. Previous
studies reported that mulberry fruit extracts contain high
phenolic contents, amino acids, vitamins, flavonoids,
steroids, tri terpenes and other trace elements [36-37]. In
the light of current findings it is concluded that mulberry
fruits extracts have a great potential for future discovery of
potent antimicrobial agents of plant origin. There is a great
potential in this area of research because it would
contribute to promote the commercial use of these plants.
Abbreviations: Ripened black toot (RBT), Un-ripened Black Toot (URBT), Ripened White Toot (RWT), Un-Ripened White Toot (URWT), Optical
Density (OD)
Fig. 4. Growth pattern of M. catarrhalis against mulberry fruit extracts.
0
0.2
0.4
0.6
0.8
1
2 4 6 8 10 12 14 16 18 20 22 24 26
OD
at
600
nm
Time (hour)
RBT
URBT
RWT
CONTROL
URWT
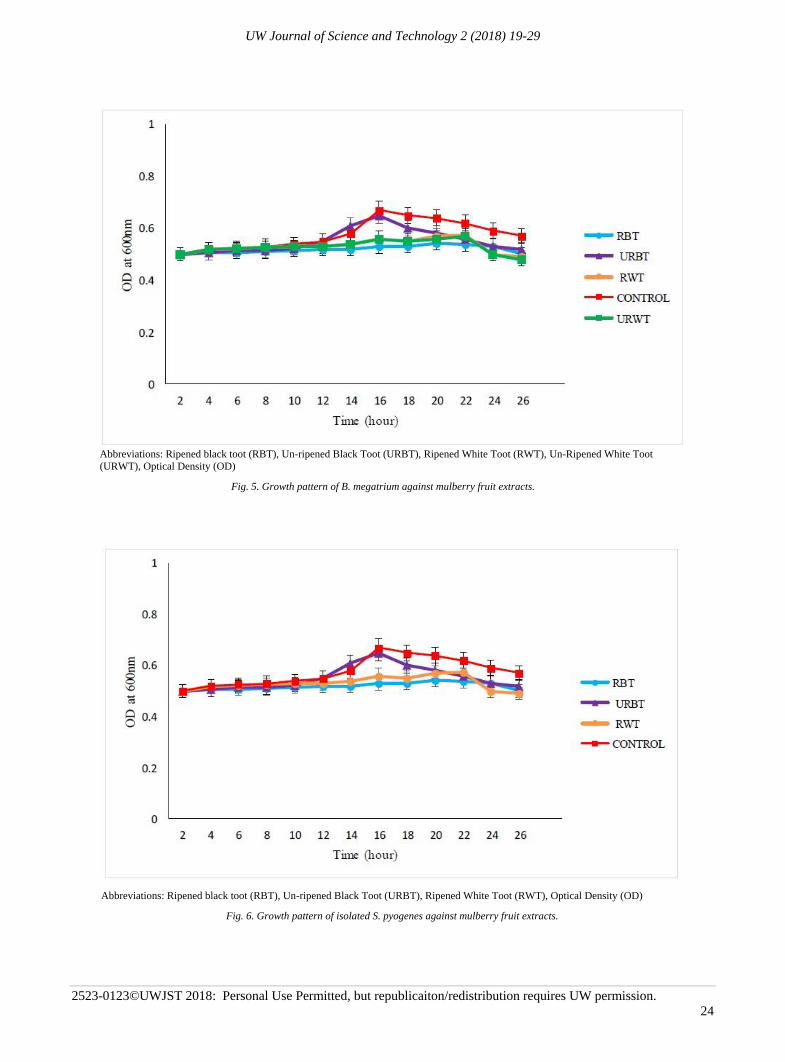
UW Journal of Science and Technology 2 (2018) 19-29
2523-0123©UWJST 2018: Personal Use Permitted, but republicaiton/redistribution requires UW permission.
24
Abbreviations: Ripened black toot (RBT), Un-ripened Black Toot (URBT), Ripened White Toot (RWT), Un-Ripened White Toot
(URWT), Optical Density (OD)
Fig. 5. Growth pattern of B. megatrium against mulberry fruit extracts.
Abbreviations: Ripened black toot (RBT), Un-ripened Black Toot (URBT), Ripened White Toot (RWT), Optical Density (OD)
Fig. 6. Growth pattern of isolated S. pyogenes against mulberry fruit extracts.
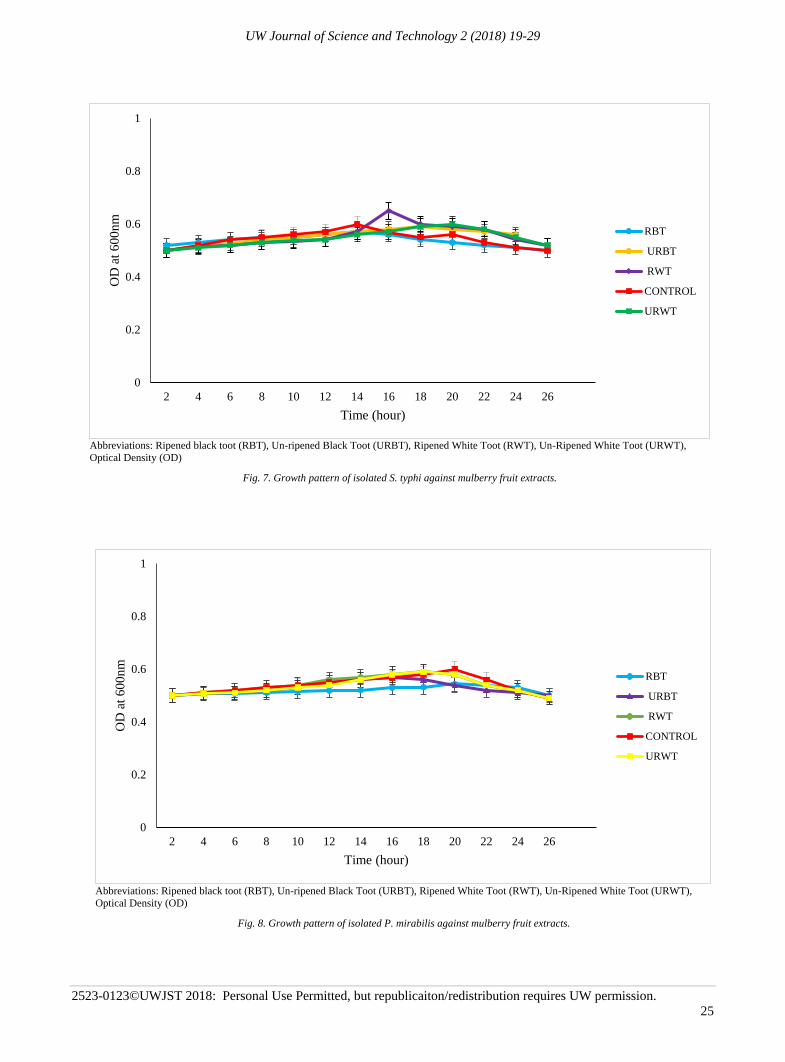
UW Journal of Science and Technology 2 (2018) 19-29
2523-0123©UWJST 2018: Personal Use Permitted, but republicaiton/redistribution requires UW permission.
25
Abbreviations: Ripened black toot (RBT), Un-ripened Black Toot (URBT), Ripened White Toot (RWT), Un-Ripened White Toot (URWT),
Optical Density (OD)
Fig. 8. Growth pattern of isolated P. mirabilis against mulberry fruit extracts.
0
0.2
0.4
0.6
0.8
1
2 4 6 8 10 12 14 16 18 20 22 24 26
OD
at
60
0n
m
Time (hour)
RBT
URBT
RWT
CONTROL
URWT
Abbreviations: Ripened black toot (RBT), Un-ripened Black Toot (URBT), Ripened White Toot (RWT), Un-Ripened White Toot (URWT),
Optical Density (OD)
Fig. 7. Growth pattern of isolated S. typhi against mulberry fruit extracts.
0
0.2
0.4
0.6
0.8
1
2 4 6 8 10 12 14 16 18 20 22 24 26
OD
at
60
0n
m
Time (hour)
RBT
URBT
RWT
CONTROL
URWT
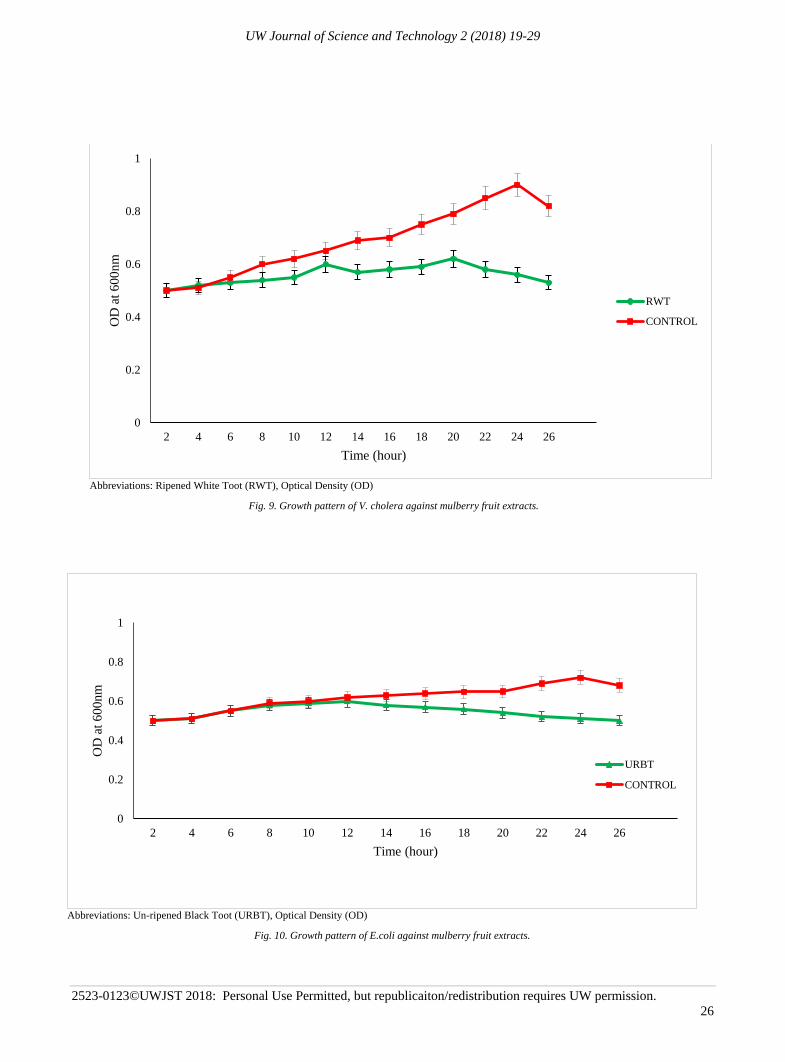
UW Journal of Science and Technology 2 (2018) 19-29
2523-0123©UWJST 2018: Personal Use Permitted, but republicaiton/redistribution requires UW permission.
26
Abbreviations: Ripened White Toot (RWT), Optical Density (OD)
Fig. 9. Growth pattern of V. cholera against mulberry fruit extracts.
0
0.2
0.4
0.6
0.8
1
2 4 6 8 10 12 14 16 18 20 22 24 26
OD
at
60
0n
m
Time (hour)
RWT
CONTROL
Abbreviations: Un-ripened Black Toot (URBT), Optical Density (OD)
Fig. 10. Growth pattern of E.coli against mulberry fruit extracts.
0
0.2
0.4
0.6
0.8
1
2 4 6 8 10 12 14 16 18 20 22 24 26
OD
at
60
0n
m
Time (hour)
URBT
CONTROL
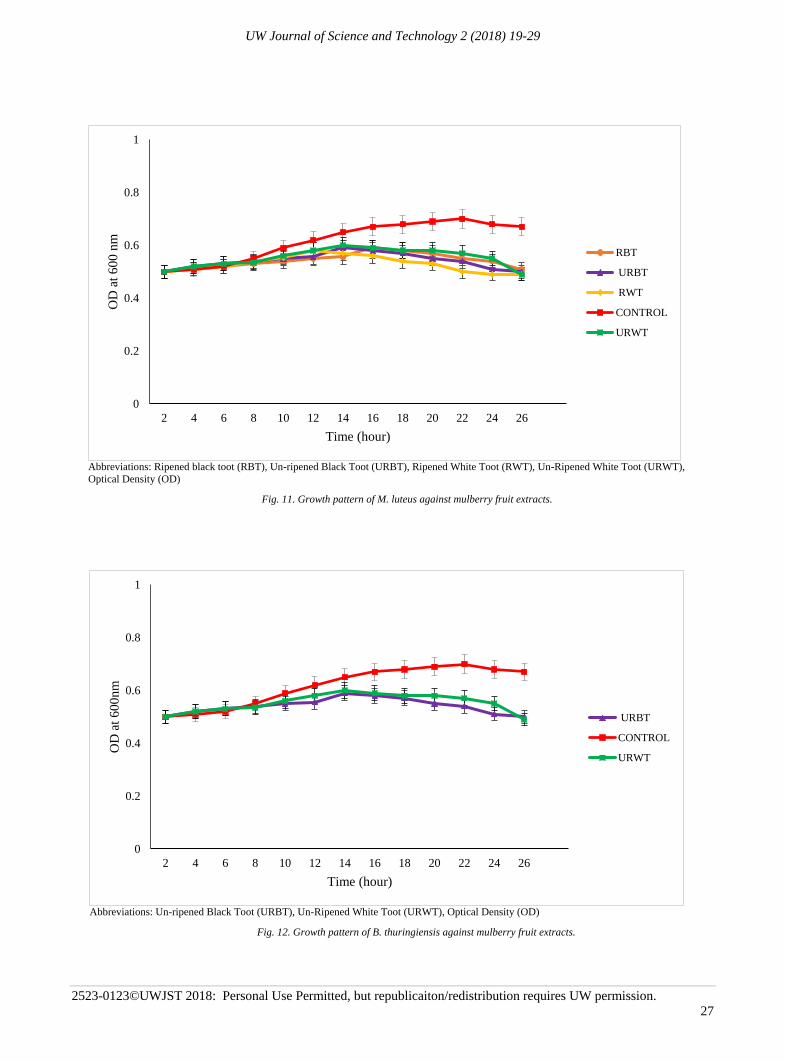
UW Journal of Science and Technology 2 (2018) 19-29
2523-0123©UWJST 2018: Personal Use Permitted, but republicaiton/redistribution requires UW permission.
27
Abbreviations: Ripened black toot (RBT), Un-ripened Black Toot (URBT), Ripened White Toot (RWT), Un-Ripened White Toot (URWT),
Optical Density (OD)
Fig. 11. Growth pattern of M. luteus against mulberry fruit extracts.
0
0.2
0.4
0.6
0.8
1
2 4 6 8 10 12 14 16 18 20 22 24 26
OD
at
60
0 n
m
Time (hour)
RBT
URBT
RWT
CONTROL
URWT
Abbreviations: Un-ripened Black Toot (URBT), Un-Ripened White Toot (URWT), Optical Density (OD)
Fig. 12. Growth pattern of B. thuringiensis against mulberry fruit extracts.
0
0.2
0.4
0.6
0.8
1
2 4 6 8 10 12 14 16 18 20 22 24 26
OD
at
60
0n
m
Time (hour)
URBT
CONTROL
URWT
UW Journal of Science and Technology 2 (2018) 19-29
2523-0123©UWJST 2018: Personal Use Permitted, but republicaiton/redistribution requires UW permission.
28
REFERENCES
[1] W. C. Evans, D. Evans, G. E. Trease and Evans. Pharmacognosy.
WB Saunders. Edinburgh, London, 15th edition, 2002.
[2] P. A. De Smet. The role of plant-derived drugs and herbal medicines
in healthcare drugs, Vol. 54(6), pp. 801-840, 1997.
[3] N. R. Farnsworth and D. D. Soejarto. Global importance of
medicinal plants, Conservation of Medicinal Plants, 1991, pp.25-51.
[4] N. G. Bisset and M. Wichtl. Herbal drugs and
phytopharmaceuticals, medpharm gmbh scientific publishers,
Stuttgart, CRC Press, Boca Raton, 1994, pp. 91-95.
[5] P. K. Mukherjee. Quality control of herbal drugs: an approach of
evaluation of botanicals, New Delhi, Business Horizons Publication,
1st edition, 2002.
[6] World Health Organization. National policy on traditional medicine
and regulation of herbal medicines - Report of a WHO Global
Survey, 2005, pp. 1-168.
[7] A. H. Gilani and A. Rahman. Trends in ethno pharmacology, Journal
of Ethnopharmacol, Vol. 100(1), pp. 43-49, 2005.
[8] M. Athar and M. A. Siddiqi. Reflections on the taxonomy and
distribution of medicinal flowers of Pakistan, SIDA, Contributions
to Botany, Vol. 21(1), pp. 357-368, 2004.
[9] Z. K. Shinwari, M. Rehman, T. Watanabe and Y. Yoshikawa.
Medicinal and aromatic plants of Pakistan (A Pictorial Guide),
Kohat University of Science and Technology, Kohat, Pakistan, pp.
492, 2006.
[10] J. A. Duke and E. S. Ayensu. Medicinal plants of china, Journal of
Botanical Taxonomy and Geobotany, Reference publication, Vol.
20(4), 1985.
[11] World Health Organization. National policy on traditional medicine
and regulation of herbal medicines: Report of a WHO global survey,
2005.
[12] N. Nwachcuku and C. P. Gerba. Emerging waterborne pathogens:
can we kill them all, Current Opinion in Biotechnology, Vol. 15(3),
pp. 175-180, 2005.
[13] N. Nwachuku, C. P. Gerba, A. Oswald and F. D. Mashadi.
Comparative inactivation of adenovirus serotypes by UV light
disinfection, Applied and Environmental Microbiology, Vol. 71(9),
pp. 5633-5636, 2005.
[14] E. J. Dziuban, J. L. Liang, G. F. Craun, V. Hill, P. A. Yu, J. Painter,
M. R. Moore, R. L. Calderon, S. L. Roy and M. J. Beach.
Surveillance for waterborne disease and outbreaks associated with
recreational water, United States, 2003–2004, Morbidity and
Mortality Weekly Report: Surveillance Summaries, Vol. 55(12), pp.
1-30, 2006.
[15] B. Petrini. Mycobacterium marinum: ubiquitous agent of
waterborne granulomatous skin infections, European Journal of
Clinical Microbiology and Infectious Diseases, Vol.25(10), pp. 609-
613, 2006.
[16] H. Westh, C. S. Zinn, V.T. Rosdahl and S. S. Group. An
international multicenter study of antimicrobial consumption and
resistance in staphylococcus aureus isolates from 15 hospitals in 14
countries, Microbial Drug Resistance, Vol. 10(2), pp. 169-176,
2004.
[17] S. Hashemi, A. Nasrollah and M. Rajabi. Irrational antibiotic
prescribing: a local issue or global concern, EXCLI Journal, Vol. 12,
pp. 384, 2013.
[18] D. I. Andersson. Persistence of antibiotic resistant bacteria, Current
Opinion in Microbiology, Vol. 6(5), pp.452-456, 2003.
[19] R. V. Kumar and S. Chauhan. Mulberry: Life enhancer, Journal of
Medicinal Plants Research, Vol. 2(10), pp. 271–278, 2008.
[20] S. Ercisli and E. Orhan. Chemical composition of white (Morus
alba), red (Morus rubra) and black (Morus nigra) mulberry
fruits, Food Chemistry, Vol. 103(4), pp. 1380-1384, 2007.
[21] N. M. A. Hassimotto, M.I. Genovese and F.M. Lajolo.
Identification and characterization of anthocyanins from wild
mulberry (Morus nigra L.) growing in Brazil, Food Science and
Technology International. Vol. 1(1), pp. 17-25, 2007.
[22] D. Gerasopoulos and G. Stavroulakis. Quality characteristics of four
mulberry (Morus sp) cultivars in the area of Chania, Greece, Journal
of the Science of Food and Agriculture, Vol. 73(2), pp. 261-264,
1997.
[23] A. A. Miles, S. S. Misra and J.O. Irwin. The estimation of the
bactericidal power of the blood, Epidemiology & Infection, Vol.
38(6), pp.732-49, 1938.
[24] G. J. Hucker. A new modification and application of the Gram stain,
Journal of Bacteriology, Vol. 6(4), pp. 395-397, 1921.
[25] W. Z. Sperber and S. R. Tatini. Interpretation of the tube coagulase
test for identification of Staphylococcus aureus, Applied
Microbiology, Vol. 29(4), pp. 502-505, 1975.
[26] F. Y. Aditi, S. S. Rahman and M. M. Hossain. A study on the
microbiological status of mineral drinking water, The Open
Microbiology Journal, Vol. 11, pp. 1-31, 2017.
[27] H. P. Seeliger. Use of a urease test for the screening and
identification of Cryptococci, Journal of Bacteriology, Vol. 72(2),
pp. 127, 1956.
[28] S.P. Chakraborty, S.K. Mahapatra and S. Roy. Biochemical
characters and antibiotic susceptibility of Staphylococcus aureus
isolates. Asian Pacific Journal of Tropical Biomedicine, Vol. 1(3),
pp. 212-216, 2011.
[29] H. C. Thaker, M. N. Brahmbhatt, J.B. Nayak, and H.C. Thaker.
Isolation and identification of staphylococcus aureus from milk and
milk products and their drug resistance patterns in Anand, Gujarat,
Veterinary World, Vol. 6(1), pp.10-13, 2013.
[30] Clinical and Laboratory Standards Institute. Performance standards
for antimicrobial susceptibility testing; twenty-second informational
supplement, Vol. 31(1), 2012.
[31] N. Khalid, S. A. Fawad and I. Ahmed. Antimicrobial activity
phytochemical profile and trace minerals of black mulberry (Morus
nigra L.) fresh juice, Pakistan, Pakistan Journal of Botany, Vol. 43,
pp. 91-96, 2011.
[32] K. M. Park, J. S. You, H.Y. Lee, N. I. Baek and J. K. Hwang.
Kuwanon G: an antibacterial agent from the root bark of Morus alba
against oral pathogens, Journal of ethno pharmacology, Vol. 84(2,
3), pp.181-185, 2003.
[33] H. Y. Sohn, K. H. Son, C. S. Kwon, G. S. Kwon and S. S. Kang.
Antimicrobial and cytotoxic activity of 18 prenylated flavonoids
isolated from medicinal plants: Morus alba L., morus mongolica
schneider, broussnetia papyrifera (l.) vent sophora flavescens ait and
echinosophora koreensis nakai, Phytomedicine, Vol. 11(7, 8), pp.
666-672, 2004.
[34] O. A. Ayoola, R. A. Baiyewu, J. N. Ekunola, B. A. Olajire, J. A.
Egunjobi, E. O Ayeni and O. O. Ayodele. Phytoconstituent
screening and antimicrobial principles of leaf extracts of two
variants of Morus alba (S30 and S54), African Journal of Pharmacy
and Pharmacology, Vol. 5(19), pp. 2161-2165, 2011.
[35] B. Islam, S. N. Khan, I. Haque, M. Alam, M. Mushfiq and A. U.
Khan. Novel anti-adherence activity of mulberry leaves: inhibition
of Streptococcus mutans biofilm by 1-deoxynojirimycin isolated
from Morus alba, Journal of Antimicrobial Chemotherapy, Vol.
62(4), pp. 751-757, 2008.
[36] M. S. Butt, A. Nazir, M. T. Sultan and K. Schroen. Morus alba L.
nature's functional tonic, Trends in Food Science & Technology,
Vol. 19(10), pp. 505-512, 2008.
[37] D. Yigit, and N. Yigit. Antibacterial activity of black mulberry
(Morus nigra) fruits and leaves, Erzincan University, Journal of
Science and Technology, Vol. 1(1), pp. 39-48, 2008.
Shumaila Naz is working as the
Chairperson/Assistant Professor in the Department
of Biosciences, University of Wah, Pakistan. She
received her Ph.D. degree in Biological sciences
specialization (Biochemistry/ Biotechnology) from
University of the Punjab - Lahore, Pakistan in the
year 2009.

UW Journal of Science and Technology 2 (2018) 19-29
2523-0123©UWJST 2018: Personal Use Permitted, but republicaiton/redistribution requires UW permission.
29
Muhammad Idrees is working as Assistant
Professor in the Department of Biosciences,
University of Wah, Pakistan. He received the
degree of Ph.D. from COMSATS Institute of
Information Technology, Islamabad, Pakistan in
the year 2015. He also holds the professional
degree of B. Pharmacy from University of The
Punjab, Lahore, Pakistan. Shehzadi is an alumnus of University of Wah,
Pakistan. She received the degree of MSc in
Biosciences from the University of Wah in the year
2015.
Zeenat Haq is PhD Scholar and Lecturer in the
Department of Biosciences, University of Wah,
Pakistan. She received the degree of MS in
Biosciences from University of Wah, Wah Cantt,
Pakistan in the year 2016.
Andleeb Sultana is an alumnus of University of
Wah, Pakistan. She received the degree of MS in
Biotechnology from International Islamic
University, Islamabad, Pakistan in the year 2018.
She completed her MSc Biosciences from
University of Wah, Pakistan.
Syeda Rida Batool is an alumnus of University of
Wah. She received the degree of MSc in
Biosciences from the University of Wah, Pakistan
in the year 2015.


UW Journal of Science and Technology 2 (2018) 31-34
2523-0123©UWJST 2018: Personal Use Permitted, but republicaiton/redistribution requires UW permission.
31
Abstract─This research work provides a review of a well
heaviest known quark i.e. Top Quark (a fundamental particle
ever observed). In hadron collisions, it produces in particle-
antiparticle combination, which provides an important probe
of the strong interactions i.e. one of the four fundamental
interactions. Top quark was discovered in 1995 at Fermi lab,
with a mass that is about as heavy as an entire atom of gold,
still remains a topic of intense research interest. The top
quark mass is one of the key parameter of SM of Particle
Physics. Its exact value effects directly to the key predictions
of the SM including the production rates of top at the Large
Hadron Collider (LHC). This study presents an overview of
the top quark mass measurement at TEVATRON to LHC
including the precise measurement of the top given by CMS
(Compact Muon Solenoid) experiment at LHC.
Index Terms—Standard Model (SM), Hadronization, Jet
Scale Factor (JSF), Parton Distribution Function (PDF),
Luminosity, Transfer Function, Top Quark, Compact Muon
Solenoid (CMS).
I. INTRODUCTION
N Standard Model, Top Quark is known to be heaviest
fundamental particle so far. It possesses unique features.
In addition, its short lifetime makes it worth studying.
Observed lifetime is ~10−25 sec which is much shorter
than the hadronization time. Top quark is also termed as
bare quark as it does not exists in bound states due to its
short lifetime and decays via W boson and a b quark in
very short span.
During Top Quark Run I, proton-antiproton (pp ̅)
collisionhad been placed at 1.8TeV. In 1995, CDF and D0
Manuscript received July 20, 2017; accepted August 31, 2018.
F. Ghafoor is affiliated with department of Physics, University of Wah,
Wah Cantt, Pakistan, as a Lecturer. (email: [email protected]).
N. Firdous is affiliated with GIFT University, Gujranwala, as Assistant
Professor. (email: [email protected]).
F. Ali Khan (email: [email protected]) and W. Khalid (email:
[email protected]) are affiliated with Department of Physics,
University of Wah, Wah Cantt, Pakistan as a Lecturer.
Corresponding Author Email: [email protected]
experiments discovered the top quark with 67pb−1and
50 pb−1of integrated luminosity, respectively [1-4].
During its Run I, proton-antiproton collision had been
placed at 1.8 TeV. In 1995, CDF and D 0 experiments
discovered the top quark with 67pb−1 and 50 pb−1 of
integrated luminosity, respectively [1-4].
In 2001, Run II started with 1.96 TeV, pp ̅collisions
with provision of approximately 10.5fb−1 of integrated
luminosity. It also leads us towards Beyond Standard
Model (BSM). In Past, different simulation techniques
have been developed for mass measurement of top quark.
Whilst, Large Hadron Collider (LHC) at CERN is also
known as top factory where proton proton (pp) collisions
at center of mass energy (7 TeV) has delivered already
more than 3fb−1 of data to ATLAS and CMS (Two general
purpose detectors). Most dominant processes of top quarks
production are q̅q → tt̅ and gg → tt ̅[5-6].
At TEVATRON, quark-antiquark annihilation is
dominant with 85% of production cross section
measurement. Whereas gg fusion shows less dominant
process with 15% production cross section measurement.
While at LHC energies, gg fusion is dominant with 80% of
the production at (√s = 7 TeV). Due to the high energy,
the production rate of t t¯at LHC is much larger than at the
TEVATRON [7, 8]. The large datasets at all main
experiments like ATLAS and CMS enable us to measure
top quark cross section production with high precision.
II. LITERATURE SURVEY
A. Production of Top Quarks
There exist many channels by which top quarks can be
produced. Figs. 1 and 2 show one of the most occurring
channels of hadron colliders via strong interaction in which
top anti-top is produced in pair [9, 10].
Alternative production via electroweak interaction
involving a Wtb vertex. Top quarks produced in this way
are often referred to as single top quark as shown in Figs.
3 and 4, which means only one top is produced.
Additionally, single top quark events have a much larger
background due to their lower jet multiplicity. These two
University of Wah
Journal of Science and Technology
www.uow.edu.pk
Top Quark Mass Measurement at
TEVATRON and LHC Energies
Fakhra Ghafoor, Nameeqa Firdous, Fatima Ali and Wajeeha Khalid
I
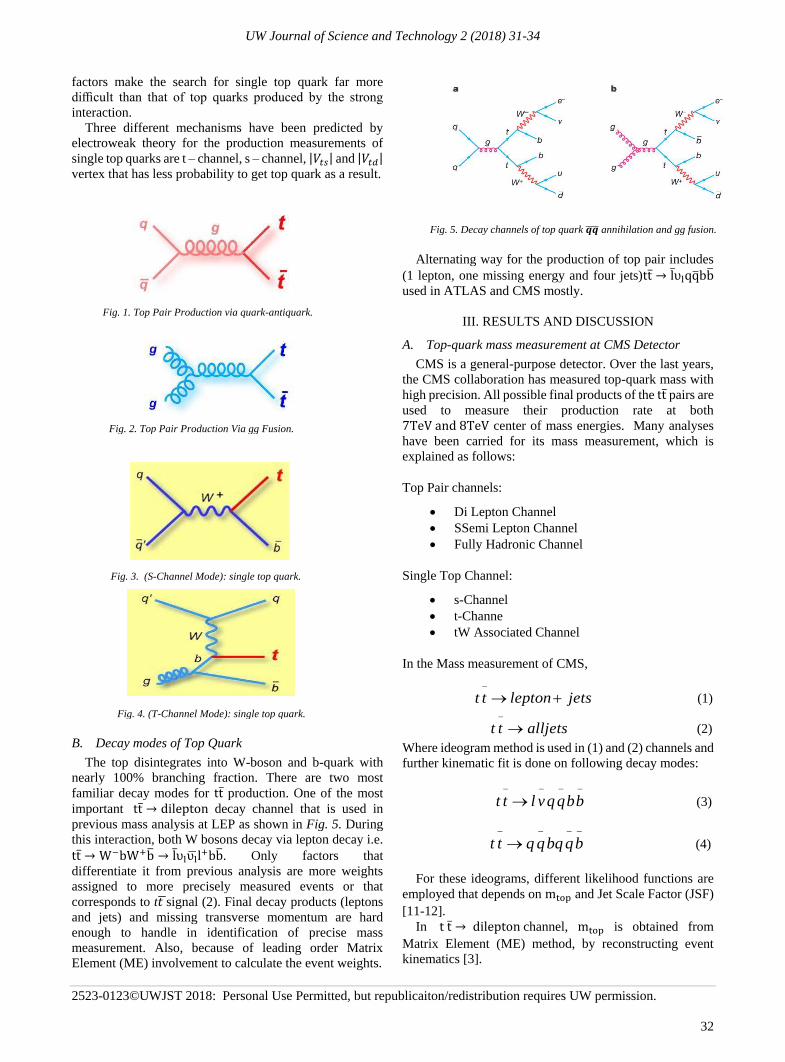
UW Journal of Science and Technology 2 (2018) 31-34
2523-0123©UWJST 2018: Personal Use Permitted, but republicaiton/redistribution requires UW permission.
32
factors make the search for single top quark far more
difficult than that of top quarks produced by the strong
interaction.
Three different mechanisms have been predicted by
electroweak theory for the production measurements of
single top quarks are t – channel, s – channel, |𝑉𝑡𝑠| and |𝑉𝑡𝑑| vertex that has less probability to get top quark as a result.
B. Decay modes of Top Quark
The top disintegrates into W-boson and b-quark with
nearly 100% branching fraction. There are two most
familiar decay modes for tt ̅ production. One of the most
important tt̅ → dilepton decay channel that is used in
previous mass analysis at LEP as shown in Fig. 5. During
this interaction, both W bosons decay via lepton decay i.e.
tt̅ → W−bW+b̅ → lυ̅lυl̅l+bb̅. Only factors that
differentiate it from previous analysis are more weights
assigned to more precisely measured events or that
corresponds to t𝑡 ̅signal (2). Final decay products (leptons
and jets) and missing transverse momentum are hard
enough to handle in identification of precise mass
measurement. Also, because of leading order Matrix
Element (ME) involvement to calculate the event weights.
Alternating way for the production of top pair includes
(1 lepton, one missing energy and four jets)tt̅ → lυ̅lqq̅bb̅
used in ATLAS and CMS mostly.
III. RESULTS AND DISCUSSION
A. Top-quark mass measurement at CMS Detector
CMS is a general-purpose detector. Over the last years,
the CMS collaboration has measured top-quark mass with
high precision. All possible final products of the tt̅ pairs are
used to measure their production rate at both
7TeV and 8TeV center of mass energies. Many analyses
have been carried for its mass measurement, which is
explained as follows:
Top Pair channels:
• Di Lepton Channel
• SSemi Lepton Channel
• Fully Hadronic Channel
Single Top Channel:
• s-Channel
• t-Channe
• tW Associated Channel
In the Mass measurement of CMS,
jetsleptontt +→−
(1)
alljetstt →−
(2)
Where ideogram method is used in (1) and (2) channels and
further kinematic fit is done on following decay modes:
−−−−
→ bbqqvltt (3)
−−−−
→ bqbqqqtt (4)
For these ideograms, different likelihood functions are
employed that depends on mtop and Jet Scale Factor (JSF)
[11-12].
In t t̅ → dilepton channel, mtop is obtained from
Matrix Element (ME) method, by reconstructing event
kinematics [3].
Fig. 1. Top Pair Production via quark-antiquark.
Fig. 2. Top Pair Production Via gg Fusion.
Fig. 3. (S-Channel Mode): single top quark.
Fig. 5. Decay channels of top quark 𝒒𝒒̅̅̅̅ annihilation and gg fusion.
Fig. 4. (T-Channel Mode): single top quark.
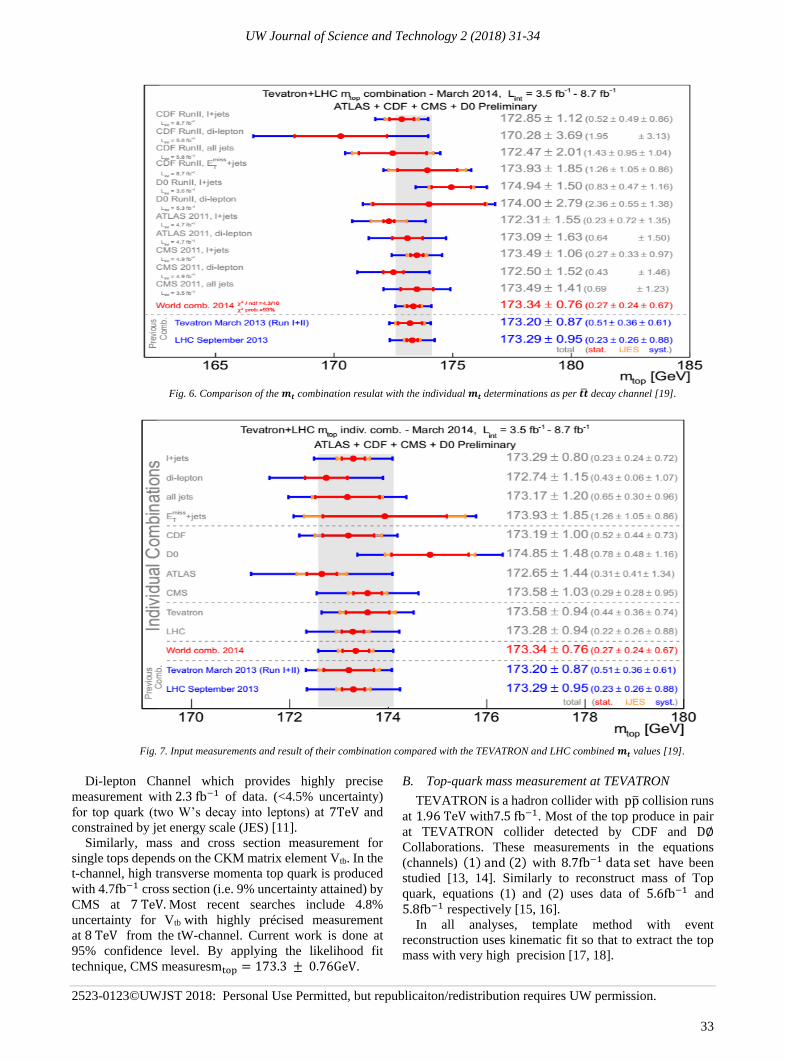
UW Journal of Science and Technology 2 (2018) 31-34
2523-0123©UWJST 2018: Personal Use Permitted, but republicaiton/redistribution requires UW permission.
33
Di-lepton Channel which provides highly precise
measurement with 2.3 fb−1 of data. (<4.5% uncertainty)
for top quark (two W’s decay into leptons) at 7TeV and
constrained by jet energy scale (JES) [11].
Similarly, mass and cross section measurement for
single tops depends on the CKM matrix element Vtb. In the
t-channel, high transverse momenta top quark is produced
with 4.7fb−1 cross section (i.e. 9% uncertainty attained) by
CMS at 7 TeV. Most recent searches include 4.8%
uncertainty for Vtb with highly précised measurement
at 8 TeV from the tW-channel. Current work is done at
95% confidence level. By applying the likelihood fit
technique, CMS measuresmtop = 173.3 ± 0.76GeV.
B. Top-quark mass measurement at TEVATRON
TEVATRON is a hadron collider with pp̅ collision runs
at 1.96 TeV with7.5 fb−1. Most of the top produce in pair
at TEVATRON collider detected by CDF and D∅
Collaborations. These measurements in the equations
(channels) (1) and (2) with 8.7fb−1 data set have been
studied [13, 14]. Similarly to reconstruct mass of Top
quark, equations (1) and (2) uses data of 5.6fb−1 and
5.8fb−1 respectively [15, 16].
In all analyses, template method with event
reconstruction uses kinematic fit so that to extract the top
mass with very high precision [17, 18].
Fig. 6. Comparison of the 𝒎𝒕 combination resulat with the individual 𝒎𝒕 determinations as per 𝒕�̅� decay channel [19].
Fig. 7. Input measurements and result of their combination compared with the TEVATRON and LHC combined 𝒎𝒕 values [19].
UW Journal of Science and Technology 2 (2018) 31-34
2523-0123©UWJST 2018: Personal Use Permitted, but republicaiton/redistribution requires UW permission.
34
Template method picks those set of variables xi
sensitive to mtop which maximises the liklihood consistent
with observation, whereas in matrix element method,
Parton Distribution Function (PDF) is calculated on event-
by–event basis by using following equation.
),()|)(1
)(1111 ti mydyxTF
NxP
→→→→
= (5)
TF in equation (5) is transfer function that is used by
parton level quantities to map them accordingly. The
reconstruced mtop after liklihood fit calculated by D∅
collaboration at 1.96 TeV with 3.6fb−1 luminosity is
173.34 ± 0.76 GeV [19].
IV. CONCLUSION
The précised value of mtop will allow experimentalists
for verification of further mathematical predictions that
will provide the strong connections between the Higgs top
and their intermediate particle of electro weak force i.e. W
boson. Theorists are currently working to explore its more
precise value that will change the predictions regarding
Higgs field and its ultimate effect on exploration of
universe [18]. It will also provide the framework for
searching beyond standard model that will lead for our
better understanding of the universe.
In future, BSM constraints derived from top physics
measurements will continue to improve until 2035. Top
quark studies at future facilities have the potential to
deliver the transformation that this field needs to have
higher energy hadron colliders so that Yukawa coupling
goes to one with 0% control to systematics.
REFERENCES
[1] V. M. Abazov1, B. Abbott, A. Abdesselam et al. A precision
measurement of the mass of the top quark, DØ Collaboration,
Nature, Vol 429, pp. 638–642, June 2004.
[2] G. Cortiana. Experimental and theoretical uncertainties in top-quark
mass measurements at the TEVATRON and the LHC, Journal of
Physics: Conference Series, Vol 452, 2013.
[3] F. S Roscher. Charge asymmetry measurements in top quark pair
production at s√=8tevs=8tev with the cms experiment, CERN-
THESIS, 2015.
[4] D. Griffths. Introduction to elementary particles, John Wiley Sons
Incorporated, 2008.
[5] Y. Ilchenko, Measurement of the top-quark mass in proton-
antiproton collisions using events with two leptons, Physical
Review D, 2012.
[6] P. Sturm. Studies for the measurement of single top quark events
with the cms-experiment, Phd Dissertation, 2008.
[7] F. Abe, H. Akimoto, A. Akopian et al. Observation of top quark
production in pp̅̅̅̅ collisions with the collider detector at fermilab,
Physical Review Letters, CDF Collaboration, Vol. 74, pp. 2626-
2631, 1995.
[8] T. Aaltonen, J. Arnald. Adelman, T. Akimoto et al. Top quark mass
measurement in the lepton plus jets channel using a modified matrix
element method, Physical Review D, CDF Collaboration, 2009.
[9] F. Wilczek. Quantum field theory, Review of Modern Physics, Vol.
74(14), pp. 2626, 1999.
[10] Gaillard, Mand. Kana and G, P. Dueil and S, F. Josaf. The Standard
model of particle physics, Review of Modern Physics, Vol. 71(2),
pp. S96, 1998.
[11] H. Spiesberger, M. Spira and P.M. Zerwas. The Standard model:
Physical basis and scattering experiments, High Energy Physics –
Phenomenology, 2000.
[12] R. Din and F. Din. A modern introduction to particle physics, World
Scientific Publication Corporation, 3rd edition, 2011.
[13] G. Moortgat-Pick, H. Baer, M. Battaglia el al. Measurement of the
top-quark mass in the all-hadronic channel using the full CDF data
set, Physical Review D, CDF Collaboration, Vol. 90(9), 2015.
[14] S. Blyweert. Top-quark mass measurements at the LHC, ATLAS
and CMS collaborations, High Energy Physics – Experiment, 2012.
[15] V. M. Abazov, Abbott, B. Abdesselam, A. Abolinset et al.
Measurement of the top quark mass in all-jet events, Physics Letters
B, D0 Collaboration, 2005.
[16] B. Abbott, B. W. Harris, E. Laenen, Z. Sullivan. Search for
Electroweak Production of Single Top Quarks in ppbar Collisions,
High Energy Physics - Experiments, D0 Collaboration, 2001.
[17] CDF Collaboration, Top quark mass measurement using the
template method in the lepton+jets channel at CDF, Physics Review
D, High Energy Physics – Experiments, 2011.
[18] V. D Heide and Jan. Single top production via w-gluon fusion,
University of Twente Postbus, M. S. Thesis, 2000.
[19] G. Cortiana. First combination of Tevatron and LHC measurements
of the top-quark mass, ATLAS, CDF, CMS and D0 Collaborations,
2014.
.
Fakhra Ghafoor received the degree of MPhil from
Quaid-i-Azam University Islamabad in 2013. She is
working as Lecturer in Department of Physics,
University of Wah since 2013. Currently she is
doing PhD from PIEAS, Islamabad, Pakistan.
Fatima Ali Khan received the degree of MPhil from
International Islamic University, Islamabad in 2013.
She is working as Lecturer in Department of
Physics, University of Wah since 2013. Currently
she is doing PhD from PIEAS, Islamabad, Pakistan.
Wajeeha Khalid received the degree of MPhil from
Quaid-i-Azam University Islamabad in 2012. She is
working as Lecturer in Department of Physics,
University of Wah since 2013.
Nameeqa Firdous received the degree of PhD from
University of InnsBruk, Austria in 2013. Currently
she is working as Assistant Professor in Faculty of
Natural Sciences, GIFT University Gujranwala,
Pakistan.
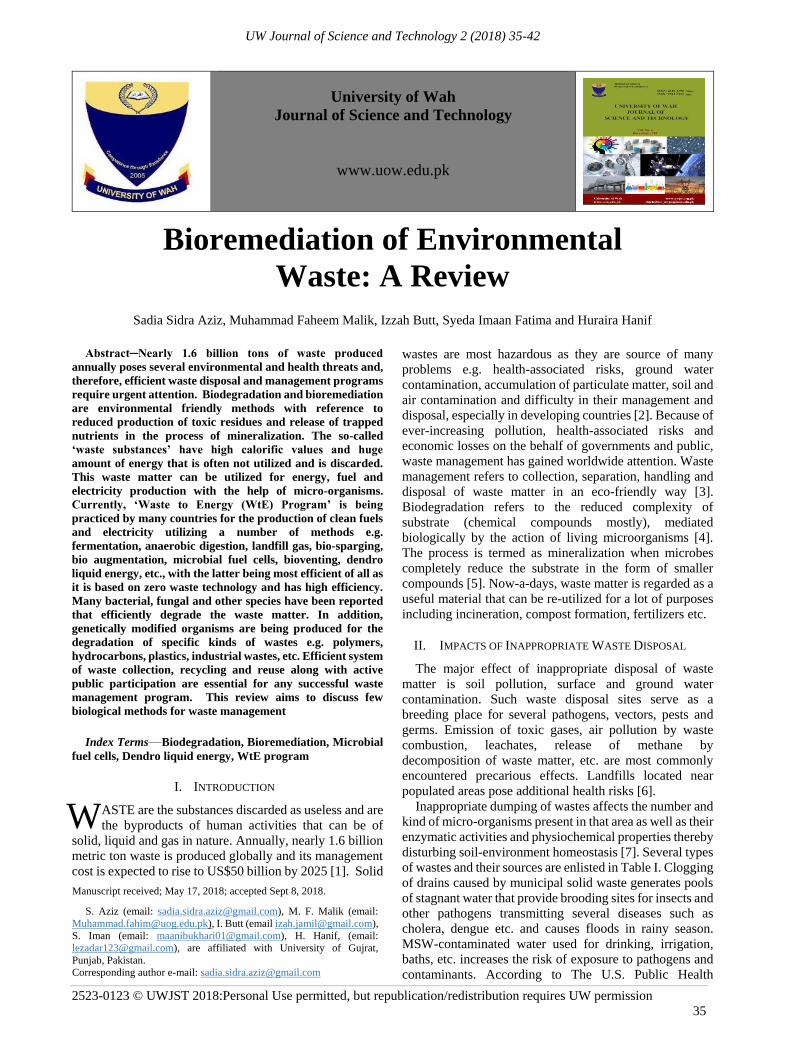
UW Journal of Science and Technology 2 (2018) 35-42
2523-0123 © UWJST 2018:Personal Use permitted, but republication/redistribution requires UW permission
35
University of Wah
Journal of Science and Technology
www.uow.edu.pk
Bioremediation of Environmental
Waste: A Review
Sadia Sidra Aziz, Muhammad Faheem Malik, Izzah Butt, Syeda Imaan Fatima and Huraira Hanif
Abstract─Nearly 1.6 billion tons of waste produced
annually poses several environmental and health threats and,
therefore, efficient waste disposal and management programs
require urgent attention. Biodegradation and bioremediation
are environmental friendly methods with reference to
reduced production of toxic residues and release of trapped
nutrients in the process of mineralization. The so-called
‘waste substances’ have high calorific values and huge
amount of energy that is often not utilized and is discarded.
This waste matter can be utilized for energy, fuel and
electricity production with the help of micro-organisms.
Currently, ‘Waste to Energy (WtE) Program’ is being
practiced by many countries for the production of clean fuels
and electricity utilizing a number of methods e.g.
fermentation, anaerobic digestion, landfill gas, bio-sparging,
bio augmentation, microbial fuel cells, bioventing, dendro
liquid energy, etc., with the latter being most efficient of all as
it is based on zero waste technology and has high efficiency.
Many bacterial, fungal and other species have been reported
that efficiently degrade the waste matter. In addition,
genetically modified organisms are being produced for the
degradation of specific kinds of wastes e.g. polymers,
hydrocarbons, plastics, industrial wastes, etc. Efficient system
of waste collection, recycling and reuse along with active
public participation are essential for any successful waste
management program. This review aims to discuss few
biological methods for waste management
Index Terms—Biodegradation, Bioremediation, Microbial
fuel cells, Dendro liquid energy, WtE program
I. INTRODUCTION
ASTE are the substances discarded as useless and are
the byproducts of human activities that can be of
solid, liquid and gas in nature. Annually, nearly 1.6 billion
metric ton waste is produced globally and its management
cost is expected to rise to US$50 billion by 2025 [1]. Solid
wastes are most hazardous as they are source of many
problems e.g. health-associated risks, ground water
contamination, accumulation of particulate matter, soil and
air contamination and difficulty in their management and
disposal, especially in developing countries [2]. Because of
ever-increasing pollution, health-associated risks and
economic losses on the behalf of governments and public,
waste management has gained worldwide attention. Waste
management refers to collection, separation, handling and
disposal of waste matter in an eco-friendly way [3].
Biodegradation refers to the reduced complexity of
substrate (chemical compounds mostly), mediated
biologically by the action of living microorganisms [4].
The process is termed as mineralization when microbes
completely reduce the substrate in the form of smaller
compounds [5]. Now-a-days, waste matter is regarded as a
useful material that can be re-utilized for a lot of purposes
including incineration, compost formation, fertilizers etc.
II. IMPACTS OF INAPPROPRIATE WASTE DISPOSAL
The major effect of inappropriate disposal of waste
matter is soil pollution, surface and ground water
contamination. Such waste disposal sites serve as a
breeding place for several pathogens, vectors, pests and
germs. Emission of toxic gases, air pollution by waste
combustion, leachates, release of methane by
decomposition of waste matter, etc. are most commonly
encountered precarious effects. Landfills located near
populated areas pose additional health risks [6].
Inappropriate dumping of wastes affects the number and
kind of micro-organisms present in that area as well as their
enzymatic activities and physiochemical properties thereby
disturbing soil-environment homeostasis [7]. Several types
of wastes and their sources are enlisted in Table I. Clogging
of drains caused by municipal solid waste generates pools
of stagnant water that provide brooding sites for insects and
other pathogens transmitting several diseases such as
cholera, dengue etc. and causes floods in rainy season.
MSW-contaminated water used for drinking, irrigation,
baths, etc. increases the risk of exposure to pathogens and
contaminants. According to The U.S. Public Health
W
Manuscript received; May 17, 2018; accepted Sept 8, 2018.
S. Aziz (email: [email protected]), M. F. Malik (email:
[email protected]), I. Butt (email [email protected]),
S. Iman (email: [email protected]), H. Hanif, (email:
[email protected]), are affiliated with University of Gujrat,
Punjab, Pakistan.
Corresponding author e-mail: [email protected]
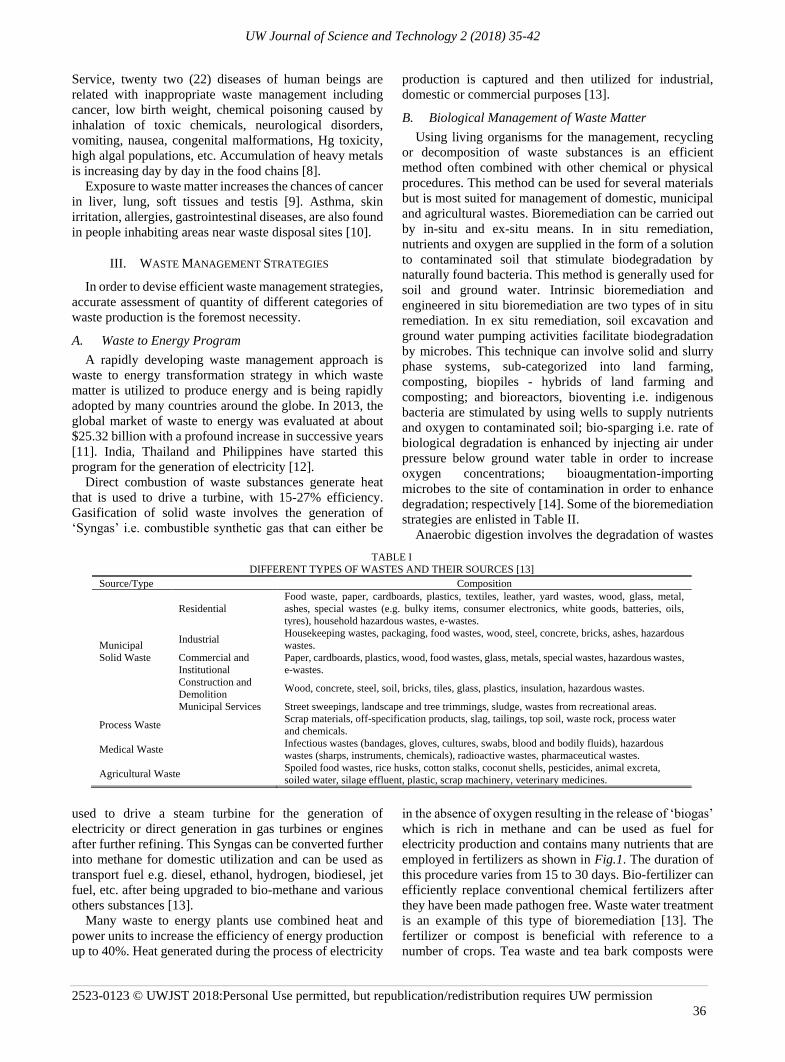
UW Journal of Science and Technology 2 (2018) 35-42
2523-0123 © UWJST 2018:Personal Use permitted, but republication/redistribution requires UW permission
36
Service, twenty two (22) diseases of human beings are
related with inappropriate waste management including
cancer, low birth weight, chemical poisoning caused by
inhalation of toxic chemicals, neurological disorders,
vomiting, nausea, congenital malformations, Hg toxicity,
high algal populations, etc. Accumulation of heavy metals
is increasing day by day in the food chains [8].
Exposure to waste matter increases the chances of cancer
in liver, lung, soft tissues and testis [9]. Asthma, skin
irritation, allergies, gastrointestinal diseases, are also found
in people inhabiting areas near waste disposal sites [10].
III. WASTE MANAGEMENT STRATEGIES
In order to devise efficient waste management strategies,
accurate assessment of quantity of different categories of
waste production is the foremost necessity.
A. Waste to Energy Program
A rapidly developing waste management approach is
waste to energy transformation strategy in which waste
matter is utilized to produce energy and is being rapidly
adopted by many countries around the globe. In 2013, the
global market of waste to energy was evaluated at about
$25.32 billion with a profound increase in successive years
[11]. India, Thailand and Philippines have started this
program for the generation of electricity [12].
Direct combustion of waste substances generate heat
that is used to drive a turbine, with 15-27% efficiency.
Gasification of solid waste involves the generation of
‘Syngas’ i.e. combustible synthetic gas that can either be
used to drive a steam turbine for the generation of
electricity or direct generation in gas turbines or engines
after further refining. This Syngas can be converted further
into methane for domestic utilization and can be used as
transport fuel e.g. diesel, ethanol, hydrogen, biodiesel, jet
fuel, etc. after being upgraded to bio-methane and various
others substances [13].
Many waste to energy plants use combined heat and
power units to increase the efficiency of energy production
up to 40%. Heat generated during the process of electricity
production is captured and then utilized for industrial,
domestic or commercial purposes [13].
B. Biological Management of Waste Matter
Using living organisms for the management, recycling
or decomposition of waste substances is an efficient
method often combined with other chemical or physical
procedures. This method can be used for several materials
but is most suited for management of domestic, municipal
and agricultural wastes. Bioremediation can be carried out
by in-situ and ex-situ means. In in situ remediation,
nutrients and oxygen are supplied in the form of a solution
to contaminated soil that stimulate biodegradation by
naturally found bacteria. This method is generally used for
soil and ground water. Intrinsic bioremediation and
engineered in situ bioremediation are two types of in situ
remediation. In ex situ remediation, soil excavation and
ground water pumping activities facilitate biodegradation
by microbes. This technique can involve solid and slurry
phase systems, sub-categorized into land farming,
composting, biopiles - hybrids of land farming and
composting; and bioreactors, bioventing i.e. indigenous
bacteria are stimulated by using wells to supply nutrients
and oxygen to contaminated soil; bio-sparging i.e. rate of
biological degradation is enhanced by injecting air under
pressure below ground water table in order to increase
oxygen concentrations; bioaugmentation-importing
microbes to the site of contamination in order to enhance
degradation; respectively [14]. Some of the bioremediation
strategies are enlisted in Table II.
Anaerobic digestion involves the degradation of wastes
in the absence of oxygen resulting in the release of ‘biogas’
which is rich in methane and can be used as fuel for
electricity production and contains many nutrients that are
employed in fertilizers as shown in Fig.1. The duration of
this procedure varies from 15 to 30 days. Bio-fertilizer can
efficiently replace conventional chemical fertilizers after
they have been made pathogen free. Waste water treatment
is an example of this type of bioremediation [13]. The
fertilizer or compost is beneficial with reference to a
number of crops. Tea waste and tea bark composts were
TABLE I
DIFFERENT TYPES OF WASTES AND THEIR SOURCES [13]
Source/Type Composition
Municipal
Solid Waste
Residential
Food waste, paper, cardboards, plastics, textiles, leather, yard wastes, wood, glass, metal,
ashes, special wastes (e.g. bulky items, consumer electronics, white goods, batteries, oils,
tyres), household hazardous wastes, e-wastes.
Industrial Housekeeping wastes, packaging, food wastes, wood, steel, concrete, bricks, ashes, hazardous
wastes.
Commercial and
Institutional
Paper, cardboards, plastics, wood, food wastes, glass, metals, special wastes, hazardous wastes,
e-wastes.
Construction and
Demolition Wood, concrete, steel, soil, bricks, tiles, glass, plastics, insulation, hazardous wastes.
Municipal Services Street sweepings, landscape and tree trimmings, sludge, wastes from recreational areas.
Process Waste Scrap materials, off-specification products, slag, tailings, top soil, waste rock, process water
and chemicals.
Medical Waste Infectious wastes (bandages, gloves, cultures, swabs, blood and bodily fluids), hazardous
wastes (sharps, instruments, chemicals), radioactive wastes, pharmaceutical wastes.
Agricultural Waste Spoiled food wastes, rice husks, cotton stalks, coconut shells, pesticides, animal excreta,
soiled water, silage effluent, plastic, scrap machinery, veterinary medicines.
UW Journal of Science and Technology 2 (2018) 35-42
2523-0123 © UWJST 2018:Personal Use permitted, but republication/redistribution requires UW permission
37
experimentally proven to enhance the yield in ‘Great Lakes
118’ lettuce [16].
Fermentation involves anaerobic conversion of organic
wastes to produce acids or alcohols, leaving behind a
residue rich in a number of useful nutrients. Production of
bioethanol using various yeast strain and substrates is an
excellent example of fermentation. This process can
provide an annual production of about 2-3 lac tons of
bioethanol which is regarded as clean fuel [13].
Landfill gas (LFG) emitted from landfills as a result of
decomposition of organic wastes, is mainly composed of
50% of CO2 and CH4 each. It is an eco-friendly method as
methane has 25% greater global warming capacity as
compared to CO2. LFG is used mainly in thermal kilns,
boilers, infrared heaters, sludge dryers, forgers, electricity
generations, leachate evaporations, blacksmithing forges,
etc. [13].
Microbial Fuel Cell (MFC) are systems that involve the
production of electricity from bacteria or enzymes from the
oxidation of organic wastes. In MFC chambers, proton
exchange membranes separate the anode and cathode
chambers; the former chamber is maintained under
anaerobic conditions and latter submerged in aerobic
solutions or is exposed to air as shown in Fig.2. External
circuit regulates the flow of electrons from anode to
cathode [17]. MFC systems find applications in many areas
ranging from power sensors in devices used to monitor
corrosion and those that measure pressure levels in deep
sea gas and oil pipelines; electricity generation on small
scale; waste water treatment; production of bio-hydrogen;
bioremediation and biosensors for monitoring of various
processes and analysis of many pollutants. This technique
is not yet being used commercially because of expensive
electrode materials, inadequate manufacturing capabilities
for producing reactor cathodes etc. [18].
Recently, a German innovation named Dendro Liquid
Energy (DLE) involves bio-processing of mixed wastes
e.g. plastics, wood logs etc. to produce clean fuels e.g. CO,
H2, etc.; needed for electricity production. The system is
based on ‘zero waste technology’ and is 4 times more
efficient as compared to anaerobic digestion involving no
combustion, effluents, emissions discharges or nuisance
[19].
Insects driven Bioremediation is gaining popularity
now days. Many insets like black soldier fly, Hermetia
illucens L, can actively degrade the waste matter for
example, can reduce kitchen waste, poultry feed, fruits and
vegetables, pig liver, rendered fish and pig manure, that can
be used in animal feed [20]. In addition, bioremediation of
organic wastes can be promoted by using earthworms due
to their physical, chemical, and biological activities.
Earthworms are reported to improve the aeration, fertility
TABLE II
BIOREMEDIATION STRATEGIES [15]
Technology Examples Benefits Limitations Factors to Consider
In situ
In situ
bioremediation
Bio-sparging
Bioventing
Bio augmentation
Most cost efficient
Non-invasive
Relatively passive
Natural attenuation
processes
Treats soil and water
Environmental
constraints
Extended treatment
time
Monitoring difficulties
Bio degradative abilities of
microorganisms
Presence of metals and other
inorganics
Environmental parameters
Biodegradability of pollutants
Chemical solubility
Geological factors
Distribution of pollutants
Ex situ
Land farming
Composting
Bio piles
Cost Efficient
Low Cost
Can be done on site
Space requirements
Extended treatment
time
control abiotic loss
Mass transfer issues
Bioavailability
limitations
See Above
Bioreactors Slurry reactors
Aqueous reactors
Rapid degradation
kinetic
Optimized
environmental
parameters
Enhance mass transfer
Effective use of
inoculants and
surfactants
Soil requires excavation
Relatively high cost
capital
Relatively high
operating cost
See above
Bio augmentation
Toxicity of amendments
Toxicity concentrations of
contaminants
Fig. 1. Anaerobic digestion of waste matter.
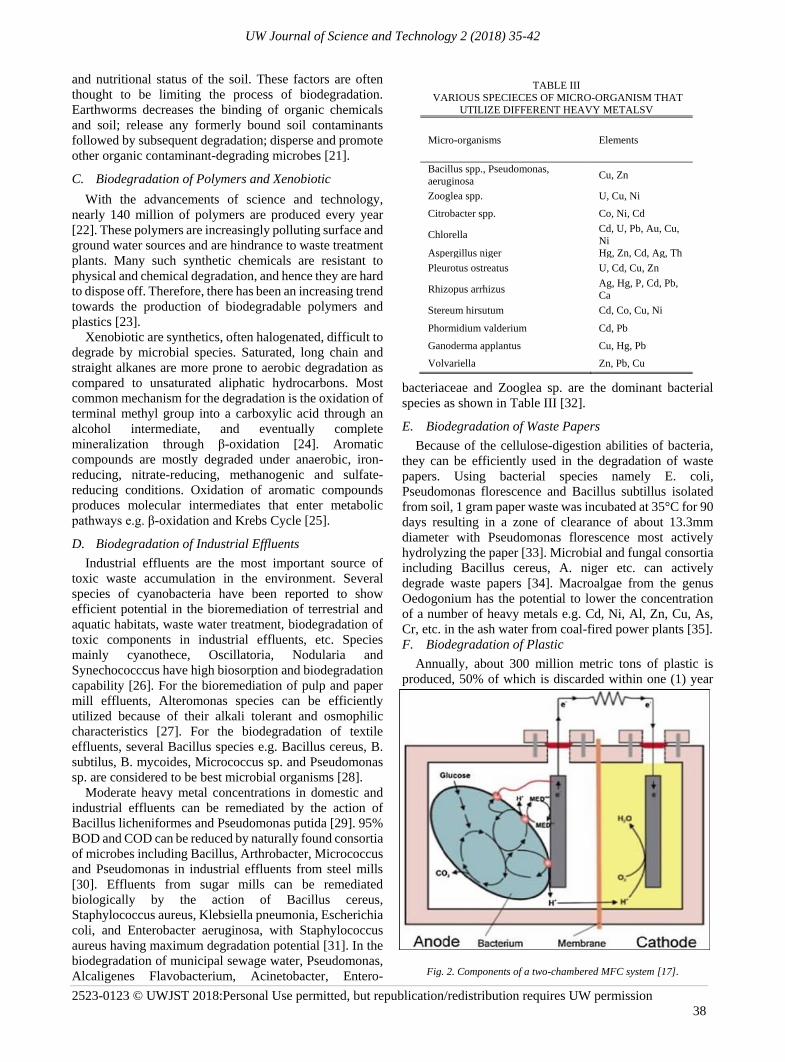
UW Journal of Science and Technology 2 (2018) 35-42
2523-0123 © UWJST 2018:Personal Use permitted, but republication/redistribution requires UW permission
38
and nutritional status of the soil. These factors are often
thought to be limiting the process of biodegradation.
Earthworms decreases the binding of organic chemicals
and soil; release any formerly bound soil contaminants
followed by subsequent degradation; disperse and promote
other organic contaminant-degrading microbes [21].
C. Biodegradation of Polymers and Xenobiotic
With the advancements of science and technology,
nearly 140 million of polymers are produced every year
[22]. These polymers are increasingly polluting surface and
ground water sources and are hindrance to waste treatment
plants. Many such synthetic chemicals are resistant to
physical and chemical degradation, and hence they are hard
to dispose off. Therefore, there has been an increasing trend
towards the production of biodegradable polymers and
plastics [23].
Xenobiotic are synthetics, often halogenated, difficult to
degrade by microbial species. Saturated, long chain and
straight alkanes are more prone to aerobic degradation as
compared to unsaturated aliphatic hydrocarbons. Most
common mechanism for the degradation is the oxidation of
terminal methyl group into a carboxylic acid through an
alcohol intermediate, and eventually complete
mineralization through β-oxidation [24]. Aromatic
compounds are mostly degraded under anaerobic, iron-
reducing, nitrate-reducing, methanogenic and sulfate-
reducing conditions. Oxidation of aromatic compounds
produces molecular intermediates that enter metabolic
pathways e.g. β-oxidation and Krebs Cycle [25].
D. Biodegradation of Industrial Effluents
Industrial effluents are the most important source of
toxic waste accumulation in the environment. Several
species of cyanobacteria have been reported to show
efficient potential in the bioremediation of terrestrial and
aquatic habitats, waste water treatment, biodegradation of
toxic components in industrial effluents, etc. Species
mainly cyanothece, Oscillatoria, Nodularia and
Synechococccus have high biosorption and biodegradation
capability [26]. For the bioremediation of pulp and paper
mill effluents, Alteromonas species can be efficiently
utilized because of their alkali tolerant and osmophilic
characteristics [27]. For the biodegradation of textile
effluents, several Bacillus species e.g. Bacillus cereus, B.
subtilus, B. mycoides, Micrococcus sp. and Pseudomonas
sp. are considered to be best microbial organisms [28].
Moderate heavy metal concentrations in domestic and
industrial effluents can be remediated by the action of
Bacillus licheniformes and Pseudomonas putida [29]. 95%
BOD and COD can be reduced by naturally found consortia
of microbes including Bacillus, Arthrobacter, Micrococcus
and Pseudomonas in industrial effluents from steel mills
[30]. Effluents from sugar mills can be remediated
biologically by the action of Bacillus cereus,
Staphylococcus aureus, Klebsiella pneumonia, Escherichia
coli, and Enterobacter aeruginosa, with Staphylococcus
aureus having maximum degradation potential [31]. In the
biodegradation of municipal sewage water, Pseudomonas,
Alcaligenes Flavobacterium, Acinetobacter, Entero-
bacteriaceae and Zooglea sp. are the dominant bacterial
species as shown in Table III [32].
E. Biodegradation of Waste Papers
Because of the cellulose-digestion abilities of bacteria,
they can be efficiently used in the degradation of waste
papers. Using bacterial species namely E. coli,
Pseudomonas florescence and Bacillus subtillus isolated
from soil, 1 gram paper waste was incubated at 35°C for 90
days resulting in a zone of clearance of about 13.3mm
diameter with Pseudomonas florescence most actively
hydrolyzing the paper [33]. Microbial and fungal consortia
including Bacillus cereus, A. niger etc. can actively
degrade waste papers [34]. Macroalgae from the genus
Oedogonium has the potential to lower the concentration
of a number of heavy metals e.g. Cd, Ni, Al, Zn, Cu, As,
Cr, etc. in the ash water from coal-fired power plants [35].
F. Biodegradation of Plastic
Annually, about 300 million metric tons of plastic is
produced, 50% of which is discarded within one (1) year
TABLE III
VARIOUS SPECIECES OF MICRO-ORGANISM THAT
UTILIZE DIFFERENT HEAVY METALSV
Micro-organisms Elements
Bacillus spp., Pseudomonas,
aeruginosa Cu, Zn
Zooglea spp. U, Cu, Ni
Citrobacter spp. Co, Ni, Cd
Chlorella Cd, U, Pb, Au, Cu,
Ni
Aspergillus niger Hg, Zn, Cd, Ag, Th
Pleurotus ostreatus U, Cd, Cu, Zn
Rhizopus arrhizus Ag, Hg, P, Cd, Pb,
Ca
Stereum hirsutum Cd, Co, Cu, Ni
Phormidium valderium Cd, Pb
Ganoderma applantus Cu, Hg, Pb
Volvariella Zn, Pb, Cu
Fig. 2. Components of a two-chambered MFC system [17].
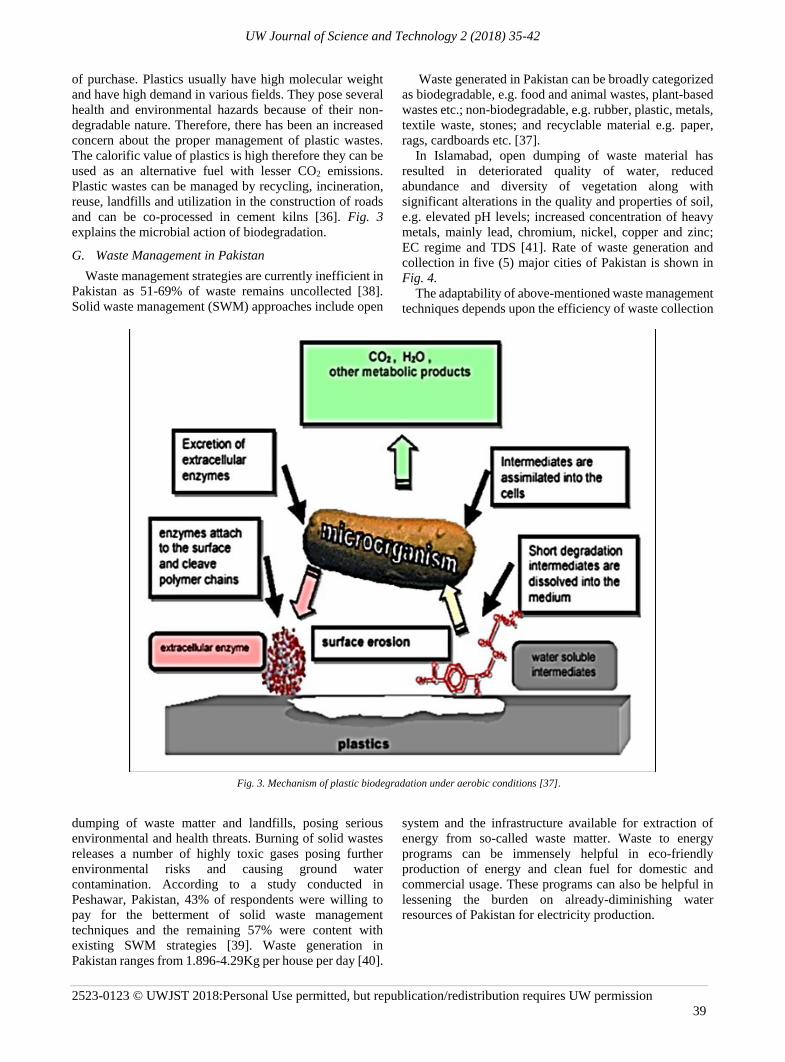
UW Journal of Science and Technology 2 (2018) 35-42
2523-0123 © UWJST 2018:Personal Use permitted, but republication/redistribution requires UW permission
39
of purchase. Plastics usually have high molecular weight
and have high demand in various fields. They pose several
health and environmental hazards because of their non-
degradable nature. Therefore, there has been an increased
concern about the proper management of plastic wastes.
The calorific value of plastics is high therefore they can be
used as an alternative fuel with lesser CO2 emissions.
Plastic wastes can be managed by recycling, incineration,
reuse, landfills and utilization in the construction of roads
and can be co-processed in cement kilns [36]. Fig. 3
explains the microbial action of biodegradation.
G. Waste Management in Pakistan
Waste management strategies are currently inefficient in
Pakistan as 51-69% of waste remains uncollected [38].
Solid waste management (SWM) approaches include open
dumping of waste matter and landfills, posing serious
environmental and health threats. Burning of solid wastes
releases a number of highly toxic gases posing further
environmental risks and causing ground water
contamination. According to a study conducted in
Peshawar, Pakistan, 43% of respondents were willing to
pay for the betterment of solid waste management
techniques and the remaining 57% were content with
existing SWM strategies [39]. Waste generation in
Pakistan ranges from 1.896-4.29Kg per house per day [40].
Waste generated in Pakistan can be broadly categorized
as biodegradable, e.g. food and animal wastes, plant-based
wastes etc.; non-biodegradable, e.g. rubber, plastic, metals,
textile waste, stones; and recyclable material e.g. paper,
rags, cardboards etc. [37].
In Islamabad, open dumping of waste material has
resulted in deteriorated quality of water, reduced
abundance and diversity of vegetation along with
significant alterations in the quality and properties of soil,
e.g. elevated pH levels; increased concentration of heavy
metals, mainly lead, chromium, nickel, copper and zinc;
EC regime and TDS [41]. Rate of waste generation and
collection in five (5) major cities of Pakistan is shown in
Fig. 4.
The adaptability of above-mentioned waste management
techniques depends upon the efficiency of waste collection
system and the infrastructure available for extraction of
energy from so-called waste matter. Waste to energy
programs can be immensely helpful in eco-friendly
production of energy and clean fuel for domestic and
commercial usage. These programs can also be helpful in
lessening the burden on already-diminishing water
resources of Pakistan for electricity production.
Fig. 3. Mechanism of plastic biodegradation under aerobic conditions [37].
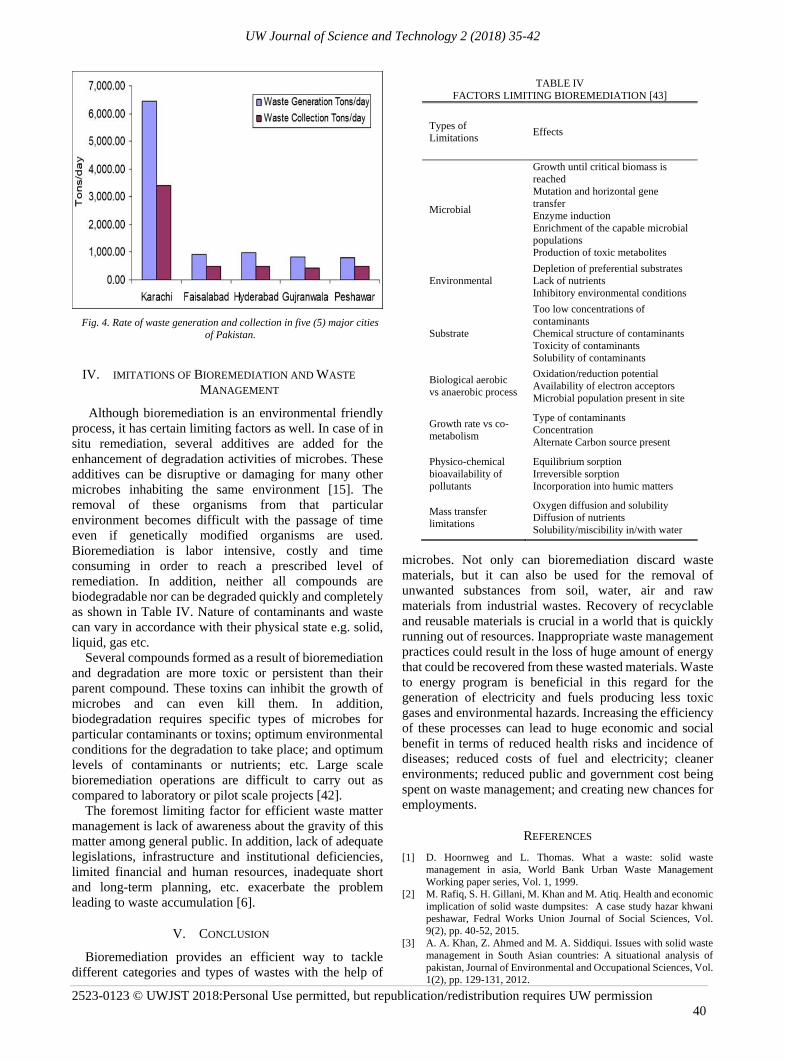
UW Journal of Science and Technology 2 (2018) 35-42
2523-0123 © UWJST 2018:Personal Use permitted, but republication/redistribution requires UW permission
40
IV. IMITATIONS OF BIOREMEDIATION AND WASTE
MANAGEMENT
Although bioremediation is an environmental friendly
process, it has certain limiting factors as well. In case of in
situ remediation, several additives are added for the
enhancement of degradation activities of microbes. These
additives can be disruptive or damaging for many other
microbes inhabiting the same environment [15]. The
removal of these organisms from that particular
environment becomes difficult with the passage of time
even if genetically modified organisms are used.
Bioremediation is labor intensive, costly and time
consuming in order to reach a prescribed level of
remediation. In addition, neither all compounds are
biodegradable nor can be degraded quickly and completely
as shown in Table IV. Nature of contaminants and waste
can vary in accordance with their physical state e.g. solid,
liquid, gas etc.
Several compounds formed as a result of bioremediation
and degradation are more toxic or persistent than their
parent compound. These toxins can inhibit the growth of
microbes and can even kill them. In addition,
biodegradation requires specific types of microbes for
particular contaminants or toxins; optimum environmental
conditions for the degradation to take place; and optimum
levels of contaminants or nutrients; etc. Large scale
bioremediation operations are difficult to carry out as
compared to laboratory or pilot scale projects [42].
The foremost limiting factor for efficient waste matter
management is lack of awareness about the gravity of this
matter among general public. In addition, lack of adequate
legislations, infrastructure and institutional deficiencies,
limited financial and human resources, inadequate short
and long-term planning, etc. exacerbate the problem
leading to waste accumulation [6].
V. CONCLUSION
Bioremediation provides an efficient way to tackle
different categories and types of wastes with the help of
microbes. Not only can bioremediation discard waste
materials, but it can also be used for the removal of
unwanted substances from soil, water, air and raw
materials from industrial wastes. Recovery of recyclable
and reusable materials is crucial in a world that is quickly
running out of resources. Inappropriate waste management
practices could result in the loss of huge amount of energy
that could be recovered from these wasted materials. Waste
to energy program is beneficial in this regard for the
generation of electricity and fuels producing less toxic
gases and environmental hazards. Increasing the efficiency
of these processes can lead to huge economic and social
benefit in terms of reduced health risks and incidence of
diseases; reduced costs of fuel and electricity; cleaner
environments; reduced public and government cost being
spent on waste management; and creating new chances for
employments.
REFERENCES
[1] D. Hoornweg and L. Thomas. What a waste: solid waste
management in asia, World Bank Urban Waste Management
Working paper series, Vol. 1, 1999.
[2] M. Rafiq, S. H. Gillani, M. Khan and M. Atiq. Health and economic
implication of solid waste dumpsites: A case study hazar khwani
peshawar, Fedral Works Union Journal of Social Sciences, Vol.
9(2), pp. 40-52, 2015.
[3] A. A. Khan, Z. Ahmed and M. A. Siddiqui. Issues with solid waste
management in South Asian countries: A situational analysis of
pakistan, Journal of Environmental and Occupational Sciences, Vol.
1(2), pp. 129-131, 2012.
TABLE IV
FACTORS LIMITING BIOREMEDIATION [43]
Types of
Limitations Effects
Microbial
Growth until critical biomass is
reached
Mutation and horizontal gene
transfer
Enzyme induction
Enrichment of the capable microbial
populations
Production of toxic metabolites
Environmental
Depletion of preferential substrates
Lack of nutrients
Inhibitory environmental conditions
Substrate
Too low concentrations of
contaminants
Chemical structure of contaminants
Toxicity of contaminants
Solubility of contaminants
Biological aerobic
vs anaerobic process
Oxidation/reduction potential
Availability of electron acceptors
Microbial population present in site
Growth rate vs co-
metabolism
Type of contaminants
Concentration
Alternate Carbon source present
Physico-chemical
bioavailability of
pollutants
Equilibrium sorption
Irreversible sorption
Incorporation into humic matters
Mass transfer
limitations
Oxygen diffusion and solubility
Diffusion of nutrients
Solubility/miscibility in/with water
Fig. 4. Rate of waste generation and collection in five (5) major cities
of Pakistan.
UW Journal of Science and Technology 2 (2018) 35-42
2523-0123 © UWJST 2018:Personal Use permitted, but republication/redistribution requires UW permission
41
[4] J. J. Ortega-Calvo and M. Alexander. Roles of bacterial attachment
and spontaneous partitioning in the biodegradation of naphthalene
initially present in non-aqueous-phase liquids, Apple Environment
Microbiology, Vol. 60, pp. 2643–2646, 1994.
[5] M. Marinscu, M. Dumitru and A. Lacatusu. Biodegradation of
Petroleum Hydrocarbons in artificial polluted soil, Research Journal
of Agricultural Science, Vol. 41(2), 2009.
[6] C. Visvanathan and U. Glawe. Domestic solid waste management in
south asian countries – A comparative analysis, 3-R South Asia
Expert Workshop, 2006.
[7] B. Breza-Boruta, J. Lemanowicz and A. Bartkowiak. Variation in
biological and physicochemical parameters of the soil affected by
uncontrolled landfill sites, Environment. Earth Science, Vol.
75(201), pp. 1-13, 2016.
[8] P. Alam and K. Ahmade. Impact of solid waste on health and the
environment, International Journal of Sustainable Development and
Green Economics, Vol. 2(2), pp. 165-168, 2013.
[9] N. Gouveia and R. R. D. Prado. Health risks in areas close to urban
solid waste landfill sites, Revista de Saúde Pública, Vol. 44, pp. 859-
866, 2010.
[10] S. De and B. Debnath. Prevalence of health hazards associated with
solid waste disposal - A case study of kolkata, India, Procedia
Environmental Sciences, Vol. 35, pp. 201–208, 2016.
[11] Global news wire. Waste to energy (wte) market will be worth
$37.64 billion by 2020, Grand View Research, Inc, 2015.
[12] S. Udomsri, M. P. Petrov, A. R. Martin and T. H. Fransson. Clean
energy conversion from municipal solid waste and climate change
mitigation in Thailand: Waste management and thermodynamic
evaluation, Energy for Sustainable Development, Vol. 15, pp. 355-
364, 2011.
[13] World Energy Council Report. World energy resources: waste to
energy, 2016.
[14] A. Kumar, B. S. Bisht, V. D. Joshhi and T. Dhewa. Review on
bioremediation of polluted environment: A management tool,
International Journal of Environmental Sciences, Vol. 1(6), pp.
1079-1093, 2011.
[15] M. Vidali. Bioremediation: An overview, Pure Applied Chemistry,
Vol. 73(7), pp. 1163–1172, 2001.
[16] F. Mastouri, R. M. Hassandokht and P. N. M. Dehkaei. The effect
of application of agricultural waste compost on growing media and
greenhouse lettuce yield, International Symposium on Soilless
Culture and Hydroponics, Acta Hort, Vol. 697, pp. 153-158, 2005.
[17] M. Rahimnejad, A. A. Ghoreyshi, G. Najafpour and T. Jafary,
Power generation from organic substrate in batch and continuous
flow microbial fuel cell operations, Applied Energy, Vol. 88, pp.
3999–4004, 2011.
[18] B. E. Logan. Assessment of microbial fuel cell configurations and
power densities, Environmental Science and Technology Letters,
Vol. 2, pp. 206-214, 2015.
[19] B. Ghougassian. Waste to energy technologies, Arab Forum for
Environment and Development, 2012.
[20] X. T. T. Nguyen, K. J. Tomberlin and S. Vanlaerhoven. Ability of
black soldier fly (diptera: stratiomyidae) larvae to recycle food
waste, Environment Entomol, pp. 1–5, 2015.
[21] A. Z. Hickman and J. B. Reid. Earthworm assisted bioremediation
of organic contaminants, Environment International, Vol. 34(7), pp.
1072–1081, 2008.
[22] M. Shimao. Biodegradation of plastics, Current Opinion
Biotechnology, Vol. 12, pp. 242, 2001.
[23] P. White, M. Franke and P. Hindle. Integrated solid waste
management: A lifecycle inventory, Chapmann and Hall, Vol. 368,
1994.
[24] C. Zhang and G. N. Bennett. Biodegradation of xenobiotic by
anaerobic bacteria, Applied Microbiology Biotechnology, Vol. 67,
pp. 600, 2005.
[25] L. P. Wilson and E. J. Bouwer. Biodegradation of aromatic
compounds under mixed oxygen/denitrifying conditions: A review,
Journal of Industrial Microbiology and Biotechnology, Vol. 18, pp.
116, 1997.
[26] S. K. Dubey, J. Dubey, S. Mehra, P. Tiwari and A. J. Bishwas.
Potential use of cyanobacterial species in bioremediation of
industrial effluents, African Journal of Biotechnology, Vol. 10(7),
pp. 1125-1132, 2011.
[27] K. Murugesan. Bioremediation of paper and pulp mill effluents,
International Journal of Experimental Biology, Vol. 41, pp. 1239-
1248, 2003.
[28] R. Mahmood, R. Shariff, S. Ali and M. U. Hayyat. Bioremediation
of textile effluents by indigenous bacterial consortia and its effects
on zea mays L.CVC 1415, Journal of Animal and Plant Sciences,
Vol. 23(4), pp. 1193-1199, 2013.
[29] L. Kamika, and M. N. B. Momba. Comparing tolerance limits of
selected bacterial and protozoan species to vanadium in waste water
systems, Water, Air and Soil pollution, Vol. 223(5), pp. 2525-2539,
2012.
[30] R. Krishnaveni, Y. Pramiladevi and R. S. Ramgopal.
Bioremediation of steel industrial effluents using soil
microorganisms, International Journal of Advanced Biotechnology
and Research, Vol. 4(1), pp. 51-56, 2013.
[31] S. Buvaneswari, M. Muthukumaran, S. Damodarkumar, and S.
Murugesan. Isolation and identification of predominant bacteria to
evaluate the bioremediation in sugar mill effluent, International
Journal of Current Science, Vol. 5, pp. 123-132, 2013.
[32] S. Kappesser, E. Rude and H. J. Kutzner. Microbiological studies of
selected bacterial cultures for aerobic treatment of waste water,
Proc. Dechema Biotechnology Conference, Vol. 3, pp. 855-858,
1989.
[33] M. D. Jabir, and M. M. Jabir. A study of biodegradation of paper
wastes by using bacteria isolated from the soil, Asian Journal of
Microbiology and Biotechnology Environmental Sciences, Vol.
18(3), pp. 225-229, 2016.
[34] I. A. Adeyemo, O. E. Adetoyi, M. O. Oni, M. J. Ayodele and A. B.
Olayemi. Studies on degradation of waste papers using
microflora/microbial consortia isolated from refuse dumpsites in
Ilorin metropolis, International Journal of Biotechnology and Food
Science, Vol. 1(1), pp. 13-22, 2013.
[35] A. D. Roberts, A. N. Paul, I. M. Bird, and D. N. Rocky.
Bioremediation of coal-fired power stations using macro algae,
Journal of Environmental Management, Vol. 153, pp. 25-32, 2015.
[36] P. Singh and P. V. Sharma. Integrated plastic waste management:
environmental and improved health approaches, Procedia
Environmental Sciences, Vol. 35, pp. 692–700, 2015.
[37] R. J. Mueller. Biodegradability of polymers: regulations and
methods for testing, Biopolymers, Vol. 10, 2003.
[38] A. Mahar, R. N. Malik, A. Qadir, T. Ahmed, Z. Khan and M. A.
Khan. Review and analysis of current solid waste management
situation in urban areas of Pakistan, International Conference on
Sustainable Solid Waste Management, India, 2007, pp. 34-41.
[39] R. U. M. Khattak, J. Khan and I. Ahmad. An analysis of willingness
to pay for better solid waste management services in urban areas of
district Peshawar, Sarhad Journal of Agriculture., Vol. 25(3), pp.
529-535. 2009.
[40] Pakistan environmental protection agency. Guidelines for solid
waste management, Ministry of Environment, PEP and United
Nation Developed Program, 2005.
[41] M. S. Ali, A. Pervaiz, B. Afzal, N. Hamid and A. Yasmin. Open
dumping of municipal solid wastes and its hazardous impacts on soil
and vegetation diversity at waste dumping sites of Islamabad city,
Journal of King Saud University of Science, Vol. 26, pp. 59-65,
2014.
[42] M. D. Zeyaullah, M. D. Atif, B. Islam, S. Azza, S. P. Abdelkafel,
M. A. ElSaady and A. Ali. Bioremediation: A tool for
environmental cleaning, African Journal of Microbiology Research,
Vol. 3(6), pp. 1014, 2009.
[43] R. Boopathy. Factors limiting bioremediation technologies, Bio
Resource Technology, Vol. 74, pp. 63-67, 2000.
Muhammad Fahim Malik completed his PhD
in Environmental Entomology from University
of Baluchistan, Pakistan. Currently he is working
as Dean Faculty of Sciences and Professor in
Department of Zoology at University of Gujrat,
Pakistan.
UW Journal of Science and Technology 2 (2018) 35-42
2523-0123 © UWJST 2018:Personal Use permitted, but republication/redistribution requires UW permission
42
Sadia Sidra Aziz completed her MSc in
Zoology in 2016 from University of Gujrat,
Pakistan and is now enrolled in MPhil Zoology
in same institute.
Izzah Butt completed her MSc in Zoology in
2016 from University of Gujrat, Pakistan and is
now enrolled in MPhil Zoology in same
institute.
Syeda Iman Fatima received her Master’s
degree from University of Gujrat, Pakistan in
2016 and is currently enrolled for MPhil in
Zoology in the same institute.
Huraira Hanif completed her BS in Zoology in
2016 from University of Gujrat and is now
enrolled in MPhil Zoology in same institute.
UW Journal of Science and Technology 2 (2018) 43-48
2523-0123 © UWJST 2018:Personal Use permitted, but republication/redistribution requires UW permission
43
University of Wah
Journal of Science and Technology
www.uow.edu.pk
A Study of Different Factors in Single and
Multiple Server Queuing Models in Banking
System
Sadaf Malik, Naheeda Akhtar, Samra Shoukat and Sajida Javed Abstract─Queuing theory is discipline of operational
research in mathematics. It is mostly dealt with
demonstration and analysis of system that deliver service to
random demands. In this research work, the queuing
numeral, service windows numerals and the maximum
service figures are checked out by the help of queuing theory.
Queuing models signifies the formation of physical systems. It
specifies the server number and their arrangement in order
to give services to their clients, and statistical or probabilistic
demand nature, by stipulating inconsistency in process of
arrival and service. Main concerns of different counters such
as “cash deposits counter”, “cheque deposits counter” and
“cash draw counter” are studied in the field of bank such as
arrival and departure of customers and service time provided
to them. Distinctive queues and quantities of servers engaged
with the procedures are additionally observed by utilizing
proper probability distributions. The arrival procedure
figured by exponential distributions and administration
process is measured by Poisson Distributions. Single server
and various server queuing models are utilized in order to
dissect lining parameters and execution measures of the
framework. WinQsb programming is utilized to perform
queuing investigation and queuing simulation in order to
process these parameters and execution measures. Moreover,
qualities of connection between various execution measures
are computed utilizing SPSS (Statistical Package for Social
Sciences) 16.
Index Terms—Waiting lines, Single Server, Multiple
Server, Queuing Model
Manuscript received; July 17, 2017; accepted Nov 15, 2018.
N. Akhtar is working as an Assistant Professor in Government College
Women, Fateh Jang under Higher Education Department of Pakistan.
(Email: [email protected]).
S. Shoukat is affiliated with University of Wah as a Lecturer in
Statistics Department. (Email: [email protected]).
S. Malik is affiliated with Islamic International University, Islamabad,
as a Visiting Lecturer. (Email: [email protected]).
S. Javed is affiliated with Journal of Army Medical College,
Rawalpindi, Pakistan as a Statistician. (Email
Corresponding author e-mail: [email protected]
I. INTRODUCTION
N 1930’s, Operations Research was used as a subject of
science and main subdivision of applied mathematics. It
is used to apply adequate analytical methods for
assessment creating. Operations Research application can
help in making better decisions and solve complicated
decision issues. In this research work, an associate
optimized model is projected to enhance the bank queuing
system supported by queuing theory. This technique will
optimize the number of server and improve the service
potency that might effectively can cut down service prices
and customer’s waiting time. One of the extraordinary
classes of lining framework that experienced in daily lives,
is business benefit framework, in which customers get hold
of supplier from business organizations. Many gatherings
involve individual-to-individual service at a tough and
quick pace, alongside a hair salon, cafeteria, petroleum
pump and bank. Numerous business banks have done
extraordinary endeavor to blast the bearer proficiency and
buyer fulfillment however the most extreme of them are
managing a difficult issue of prepared line of clients. In
money related organization (i.e. banks), the waiting line of
clients appears to be because of low productivity of the
lining machine. It emulates the missing of the endeavor
reasoning of client driven, and low amenity cost of the
device.
Numerous analytical mechanisms used in Islamabad
region includes, network analysis, game theory,
mathematical logic, queuing theory and simulation etc. But
most generally used analytical strategy in numerous field
of life is Queuing precept. It is nearly a hundred years old
theory. Telephone waiting times for a profitable service in
two unlike experiments and consumer thoughts of waiting
times considering a psychophysical power function is
described in [1]. The negative impact of perceived waiting
time on wait evaluations is increased by the pecuniary
expenses of waiting. The waiting times are packed in
numerous ways like: with music, queuing data, and
knowledge regarding expected waiting time. A
supplementary variable technique was introduced by David
I
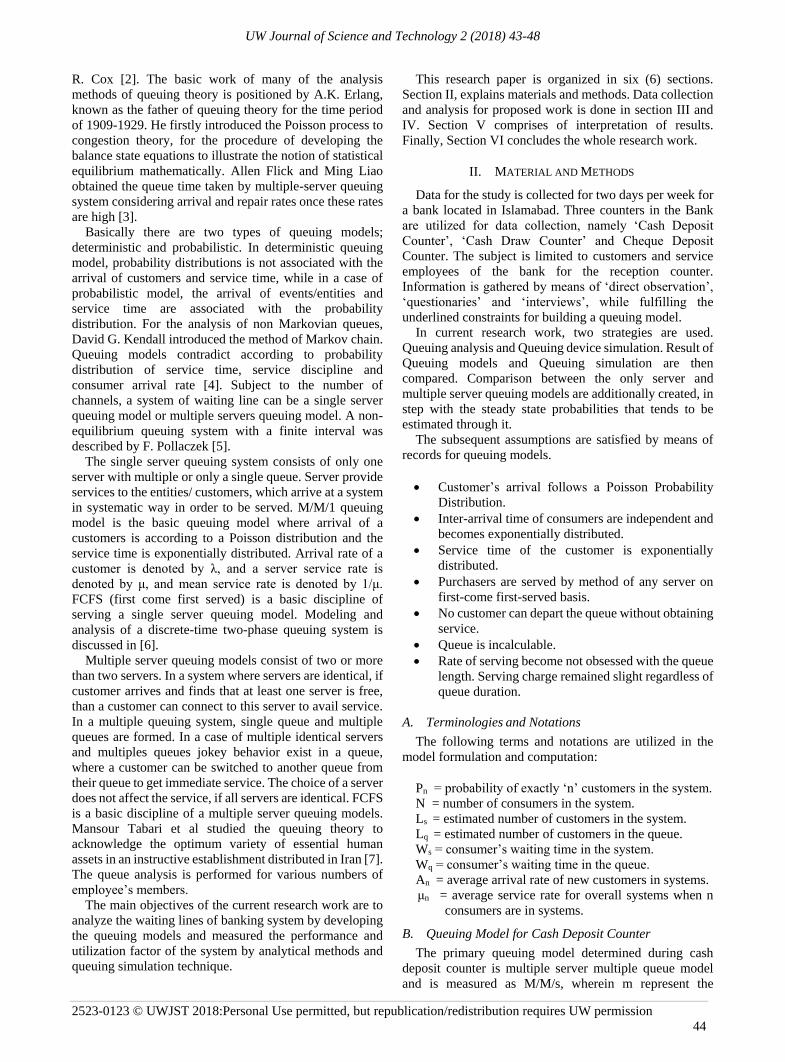
UW Journal of Science and Technology 2 (2018) 43-48
2523-0123 © UWJST 2018:Personal Use permitted, but republication/redistribution requires UW permission
44
R. Cox [2]. The basic work of many of the analysis
methods of queuing theory is positioned by A.K. Erlang,
known as the father of queuing theory for the time period
of 1909-1929. He firstly introduced the Poisson process to
congestion theory, for the procedure of developing the
balance state equations to illustrate the notion of statistical
equilibrium mathematically. Allen Flick and Ming Liao
obtained the queue time taken by multiple-server queuing
system considering arrival and repair rates once these rates
are high [3].
Basically there are two types of queuing models;
deterministic and probabilistic. In deterministic queuing
model, probability distributions is not associated with the
arrival of customers and service time, while in a case of
probabilistic model, the arrival of events/entities and
service time are associated with the probability
distribution. For the analysis of non Markovian queues,
David G. Kendall introduced the method of Markov chain.
Queuing models contradict according to probability
distribution of service time, service discipline and
consumer arrival rate [4]. Subject to the number of
channels, a system of waiting line can be a single server
queuing model or multiple servers queuing model. A non-
equilibrium queuing system with a finite interval was
described by F. Pollaczek [5].
The single server queuing system consists of only one
server with multiple or only a single queue. Server provide
services to the entities/ customers, which arrive at a system
in systematic way in order to be served. M/M/1 queuing
model is the basic queuing model where arrival of a
customers is according to a Poisson distribution and the
service time is exponentially distributed. Arrival rate of a
customer is denoted by λ, and a server service rate is
denoted by μ, and mean service rate is denoted by 1/μ.
FCFS (first come first served) is a basic discipline of
serving a single server queuing model. Modeling and
analysis of a discrete-time two-phase queuing system is
discussed in [6].
Multiple server queuing models consist of two or more
than two servers. In a system where servers are identical, if
customer arrives and finds that at least one server is free,
than a customer can connect to this server to avail service.
In a multiple queuing system, single queue and multiple
queues are formed. In a case of multiple identical servers
and multiples queues jokey behavior exist in a queue,
where a customer can be switched to another queue from
their queue to get immediate service. The choice of a server
does not affect the service, if all servers are identical. FCFS
is a basic discipline of a multiple server queuing models.
Mansour Tabari et al studied the queuing theory to
acknowledge the optimum variety of essential human
assets in an instructive establishment distributed in Iran [7].
The queue analysis is performed for various numbers of
employee’s members.
The main objectives of the current research work are to
analyze the waiting lines of banking system by developing
the queuing models and measured the performance and
utilization factor of the system by analytical methods and
queuing simulation technique.
This research paper is organized in six (6) sections.
Section II, explains materials and methods. Data collection
and analysis for proposed work is done in section III and
IV. Section V comprises of interpretation of results.
Finally, Section VI concludes the whole research work.
II. MATERIAL AND METHODS
Data for the study is collected for two days per week for
a bank located in Islamabad. Three counters in the Bank
are utilized for data collection, namely ‘Cash Deposit
Counter’, ‘Cash Draw Counter’ and Cheque Deposit
Counter. The subject is limited to customers and service
employees of the bank for the reception counter.
Information is gathered by means of ‘direct observation’,
‘questionaries’ and ‘interviews’, while fulfilling the
underlined constraints for building a queuing model.
In current research work, two strategies are used.
Queuing analysis and Queuing device simulation. Result of
Queuing models and Queuing simulation are then
compared. Comparison between the only server and
multiple server queuing models are additionally created, in
step with the steady state probabilities that tends to be
estimated through it.
The subsequent assumptions are satisfied by means of
records for queuing models.
• Customer’s arrival follows a Poisson Probability
Distribution.
• Inter-arrival time of consumers are independent and
becomes exponentially distributed.
• Service time of the customer is exponentially
distributed.
• Purchasers are served by method of any server on
first-come first-served basis.
• No customer can depart the queue without obtaining
service.
• Queue is incalculable.
• Rate of serving become not obsessed with the queue
length. Serving charge remained slight regardless of
queue duration.
A. Terminologies and Notations
The following terms and notations are utilized in the
model formulation and computation:
Pn = probability of exactly ‘n’ customers in the system.
N = number of consumers in the system.
Ls = estimated number of customers in the system.
Lq = estimated number of customers in the queue.
Ws = consumer’s waiting time in the system.
Wq = consumer’s waiting time in the queue.
An = average arrival rate of new customers in systems.
μn = average service rate for overall systems when n
consumers are in systems.
B. Queuing Model for Cash Deposit Counter
The primary queuing model determined during cash
deposit counter is multiple server multiple queue model
and is measured as M/M/s, wherein m represent the
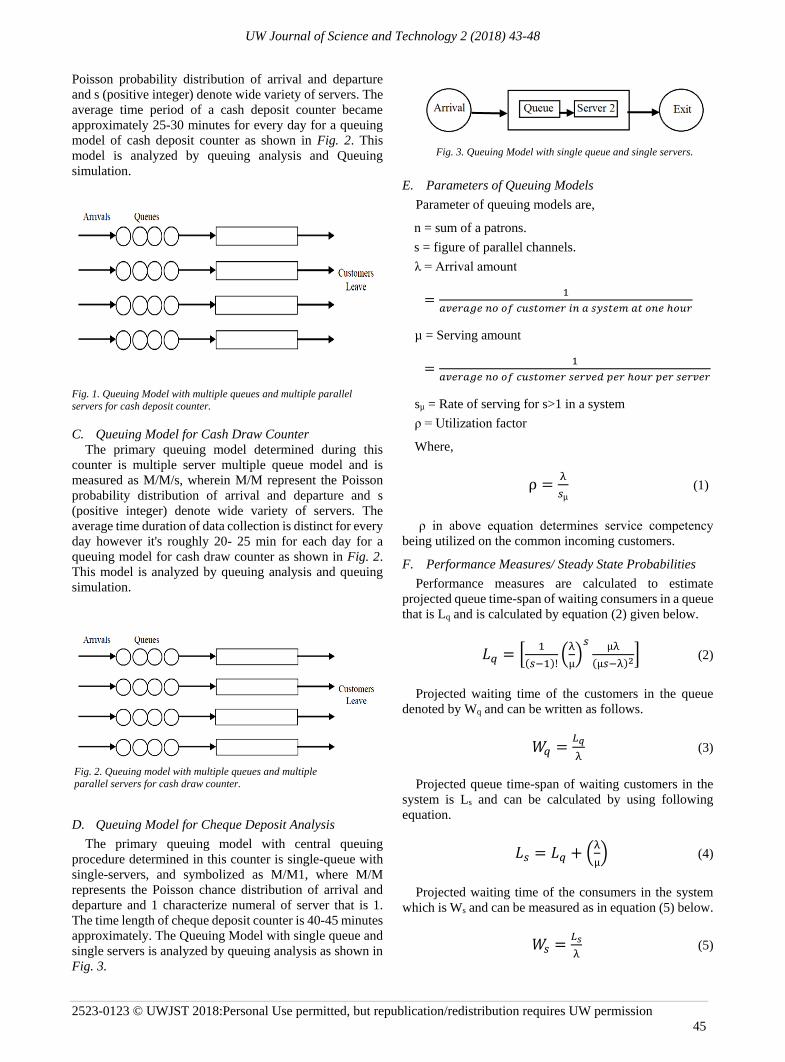
UW Journal of Science and Technology 2 (2018) 43-48
2523-0123 © UWJST 2018:Personal Use permitted, but republication/redistribution requires UW permission
45
Poisson probability distribution of arrival and departure
and s (positive integer) denote wide variety of servers. The
average time period of a cash deposit counter became
approximately 25-30 minutes for every day for a queuing
model of cash deposit counter as shown in Fig. 2. This
model is analyzed by queuing analysis and Queuing
simulation.
C. Queuing Model for Cash Draw Counter
The primary queuing model determined during this
counter is multiple server multiple queue model and is
measured as M/M/s, wherein M/M represent the Poisson
probability distribution of arrival and departure and s
(positive integer) denote wide variety of servers. The
average time duration of data collection is distinct for every
day however it's roughly 20- 25 min for each day for a
queuing model for cash draw counter as shown in Fig. 2.
This model is analyzed by queuing analysis and queuing
simulation.
D. Queuing Model for Cheque Deposit Analysis
The primary queuing model with central queuing
procedure determined in this counter is single-queue with
single-servers, and symbolized as M/M1, where M/M
represents the Poisson chance distribution of arrival and
departure and 1 characterize numeral of server that is 1.
The time length of cheque deposit counter is 40-45 minutes
approximately. The Queuing Model with single queue and
single servers is analyzed by queuing analysis as shown in
Fig. 3.
E. Parameters of Queuing Models
Parameter of queuing models are,
n = sum of a patrons.
s = figure of parallel channels.
λ = Arrival amount
=1
𝑎𝑣𝑒𝑟𝑎𝑔𝑒 𝑛𝑜 𝑜𝑓 𝑐𝑢𝑠𝑡𝑜𝑚𝑒𝑟 𝑖𝑛 𝑎 𝑠𝑦𝑠𝑡𝑒𝑚 𝑎𝑡 𝑜𝑛𝑒 ℎ𝑜𝑢𝑟
µ = Serving amount
=1
𝑎𝑣𝑒𝑟𝑎𝑔𝑒 𝑛𝑜 𝑜𝑓 𝑐𝑢𝑠𝑡𝑜𝑚𝑒𝑟 𝑠𝑒𝑟𝑣𝑒𝑑 𝑝𝑒𝑟 ℎ𝑜𝑢𝑟 𝑝𝑒𝑟 𝑠𝑒𝑟𝑣𝑒𝑟
sµ = Rate of serving for s>1 in a system
ρ = Utilization factor
Where,
ρ =λ
𝑠µ (1)
ρ in above equation determines service competency
being utilized on the common incoming customers.
F. Performance Measures/ Steady State Probabilities
Performance measures are calculated to estimate
projected queue time-span of waiting consumers in a queue
that is Lq and is calculated by equation (2) given below.
𝐿𝑞 = [1
(𝑠−1)!(
λ
µ)
𝑠 µλ
(µ𝑠−λ)2] (2)
Projected waiting time of the customers in the queue
denoted by Wq and can be written as follows.
𝑊𝑞 =𝐿𝑞
λ (3)
Projected queue time-span of waiting customers in the
system is Ls and can be calculated by using following
equation.
𝐿𝑠 = 𝐿𝑞 + (λ
µ) (4)
Projected waiting time of the consumers in the system
which is Ws and can be measured as in equation (5) below.
𝑊𝑠 =𝐿𝑠
λ (5)
Fig. 3. Queuing Model with single queue and single servers.
Fig. 1. Queuing Model with multiple queues and multiple parallel
servers for cash deposit counter.
Fig. 2. Queuing model with multiple queues and multiple
parallel servers for cash draw counter.
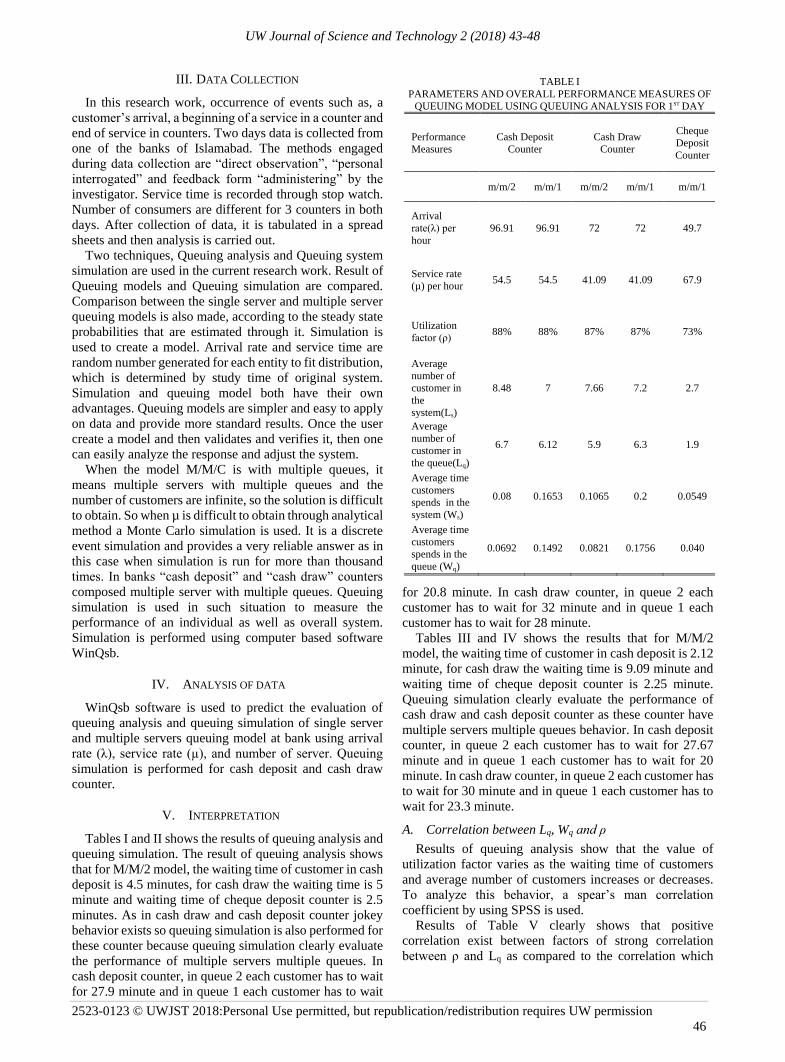
UW Journal of Science and Technology 2 (2018) 43-48
2523-0123 © UWJST 2018:Personal Use permitted, but republication/redistribution requires UW permission
46
III. DATA COLLECTION
In this research work, occurrence of events such as, a
customer’s arrival, a beginning of a service in a counter and
end of service in counters. Two days data is collected from
one of the banks of Islamabad. The methods engaged
during data collection are “direct observation”, “personal
interrogated” and feedback form “administering” by the
investigator. Service time is recorded through stop watch.
Number of consumers are different for 3 counters in both
days. After collection of data, it is tabulated in a spread
sheets and then analysis is carried out.
Two techniques, Queuing analysis and Queuing system
simulation are used in the current research work. Result of
Queuing models and Queuing simulation are compared.
Comparison between the single server and multiple server
queuing models is also made, according to the steady state
probabilities that are estimated through it. Simulation is
used to create a model. Arrival rate and service time are
random number generated for each entity to fit distribution,
which is determined by study time of original system.
Simulation and queuing model both have their own
advantages. Queuing models are simpler and easy to apply
on data and provide more standard results. Once the user
create a model and then validates and verifies it, then one
can easily analyze the response and adjust the system.
When the model M/M/C is with multiple queues, it
means multiple servers with multiple queues and the
number of customers are infinite, so the solution is difficult
to obtain. So when µ is difficult to obtain through analytical
method a Monte Carlo simulation is used. It is a discrete
event simulation and provides a very reliable answer as in
this case when simulation is run for more than thousand
times. In banks “cash deposit” and “cash draw” counters
composed multiple server with multiple queues. Queuing
simulation is used in such situation to measure the
performance of an individual as well as overall system.
Simulation is performed using computer based software
WinQsb.
IV. ANALYSIS OF DATA
WinQsb software is used to predict the evaluation of
queuing analysis and queuing simulation of single server
and multiple servers queuing model at bank using arrival
rate (λ), service rate (µ), and number of server. Queuing
simulation is performed for cash deposit and cash draw
counter.
V. INTERPRETATION
Tables I and II shows the results of queuing analysis and
queuing simulation. The result of queuing analysis shows
that for M/M/2 model, the waiting time of customer in cash
deposit is 4.5 minutes, for cash draw the waiting time is 5
minute and waiting time of cheque deposit counter is 2.5
minutes. As in cash draw and cash deposit counter jokey
behavior exists so queuing simulation is also performed for
these counter because queuing simulation clearly evaluate
the performance of multiple servers multiple queues. In
cash deposit counter, in queue 2 each customer has to wait
for 27.9 minute and in queue 1 each customer has to wait
for 20.8 minute. In cash draw counter, in queue 2 each
customer has to wait for 32 minute and in queue 1 each
customer has to wait for 28 minute.
Tables III and IV shows the results that for M/M/2
model, the waiting time of customer in cash deposit is 2.12
minute, for cash draw the waiting time is 9.09 minute and
waiting time of cheque deposit counter is 2.25 minute.
Queuing simulation clearly evaluate the performance of
cash draw and cash deposit counter as these counter have
multiple servers multiple queues behavior. In cash deposit
counter, in queue 2 each customer has to wait for 27.67
minute and in queue 1 each customer has to wait for 20
minute. In cash draw counter, in queue 2 each customer has
to wait for 30 minute and in queue 1 each customer has to
wait for 23.3 minute.
A. Correlation between Lq, Wq and ρ
Results of queuing analysis show that the value of
utilization factor varies as the waiting time of customers
and average number of customers increases or decreases.
To analyze this behavior, a spear’s man correlation
coefficient by using SPSS is used.
Results of Table V clearly shows that positive
correlation exist between factors of strong correlation
between ρ and Lq as compared to the correlation which
TABLE I
PARAMETERS AND OVERALL PERFORMANCE MEASURES OF
QUEUING MODEL USING QUEUING ANALYSIS FOR 1ST DAY
Performance
Measures
Cash Deposit
Counter
Cash Draw
Counter
Cheque
Deposit
Counter
m/m/2 m/m/1 m/m/2 m/m/1 m/m/1
Arrival
rate(λ) per
hour
96.91 96.91 72 72 49.7
Service rate
(µ) per hour 54.5 54.5 41.09 41.09 67.9
Utilization
factor (ρ) 88% 88% 87% 87% 73%
Average
number of
customer in
the
system(Ls)
8.48 7 7.66 7.2 2.7
Average
number of
customer in
the queue(Lq)
6.7 6.12 5.9 6.3 1.9
Average time
customers
spends in the
system (Ws)
0.08 0.1653 0.1065 0.2 0.0549
Average time
customers
spends in the
queue (Wq)
0.0692 0.1492 0.0821 0.1756 0.040
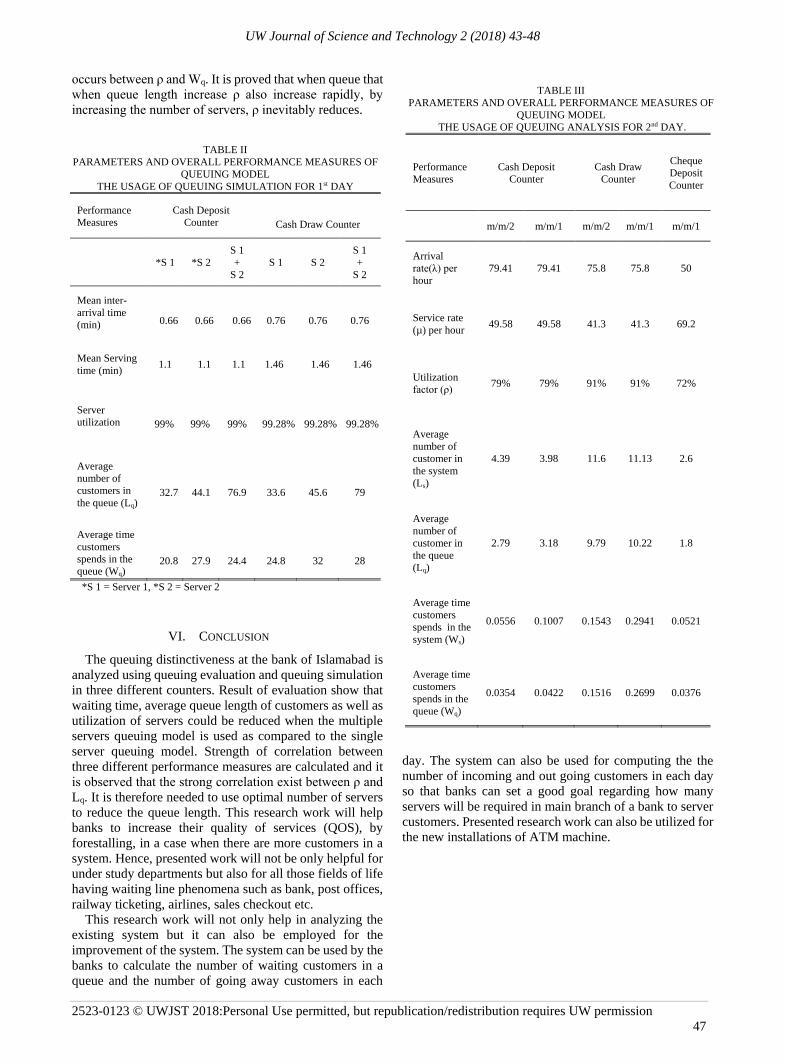
UW Journal of Science and Technology 2 (2018) 43-48
2523-0123 © UWJST 2018:Personal Use permitted, but republication/redistribution requires UW permission
47
occurs between ρ and Wq. It is proved that when queue that
when queue length increase ρ also increase rapidly, by
increasing the number of servers, ρ inevitably reduces.
VI. CONCLUSION
The queuing distinctiveness at the bank of Islamabad is
analyzed using queuing evaluation and queuing simulation
in three different counters. Result of evaluation show that
waiting time, average queue length of customers as well as
utilization of servers could be reduced when the multiple
servers queuing model is used as compared to the single
server queuing model. Strength of correlation between
three different performance measures are calculated and it
is observed that the strong correlation exist between ρ and
Lq. It is therefore needed to use optimal number of servers
to reduce the queue length. This research work will help
banks to increase their quality of services (QOS), by
forestalling, in a case when there are more customers in a
system. Hence, presented work will not be only helpful for
under study departments but also for all those fields of life
having waiting line phenomena such as bank, post offices,
railway ticketing, airlines, sales checkout etc.
This research work will not only help in analyzing the
existing system but it can also be employed for the
improvement of the system. The system can be used by the
banks to calculate the number of waiting customers in a
queue and the number of going away customers in each
day. The system can also be used for computing the the
number of incoming and out going customers in each day
so that banks can set a good goal regarding how many
servers will be required in main branch of a bank to server
customers. Presented research work can also be utilized for
the new installations of ATM machine.
TABLE III
PARAMETERS AND OVERALL PERFORMANCE MEASURES OF
QUEUING MODEL
THE USAGE OF QUEUING ANALYSIS FOR 2nd DAY.
Performance
Measures
Cash Deposit
Counter
Cash Draw
Counter
Cheque
Deposit
Counter
m/m/2 m/m/1 m/m/2 m/m/1 m/m/1
Arrival
rate(λ) per
hour
79.41 79.41 75.8 75.8 50
Service rate
(µ) per hour 49.58 49.58 41.3 41.3 69.2
Utilization
factor (ρ) 79% 79% 91% 91% 72%
Average
number of
customer in
the system
(Ls)
4.39 3.98 11.6 11.13 2.6
Average
number of
customer in
the queue
(Lq)
2.79 3.18 9.79 10.22 1.8
Average time
customers
spends in the
system (Ws)
0.0556 0.1007 0.1543 0.2941 0.0521
Average time
customers
spends in the
queue (Wq)
0.0354 0.0422 0.1516 0.2699 0.0376
TABLE II
PARAMETERS AND OVERALL PERFORMANCE MEASURES OF
QUEUING MODEL
THE USAGE OF QUEUING SIMULATION FOR 1st DAY
Performance
Measures
Cash Deposit
Counter Cash Draw Counter
*S 1 *S 2
S 1
+
S 2
S 1 S 2
S 1
+
S 2
Mean inter-
arrival time
(min) 0.66 0.66 0.66 0.76 0.76 0.76
Mean Serving
time (min) 1.1 1.1 1.1 1.46 1.46 1.46
Server
utilization 99% 99% 99% 99.28% 99.28% 99.28%
Average
number of
customers in
the queue (Lq) 32.7 44.1 76.9 33.6 45.6 79
Average time
customers
spends in the
queue (Wq) 20.8 27.9 24.4 24.8 32 28
*S 1 = Server 1, *S 2 = Server 2
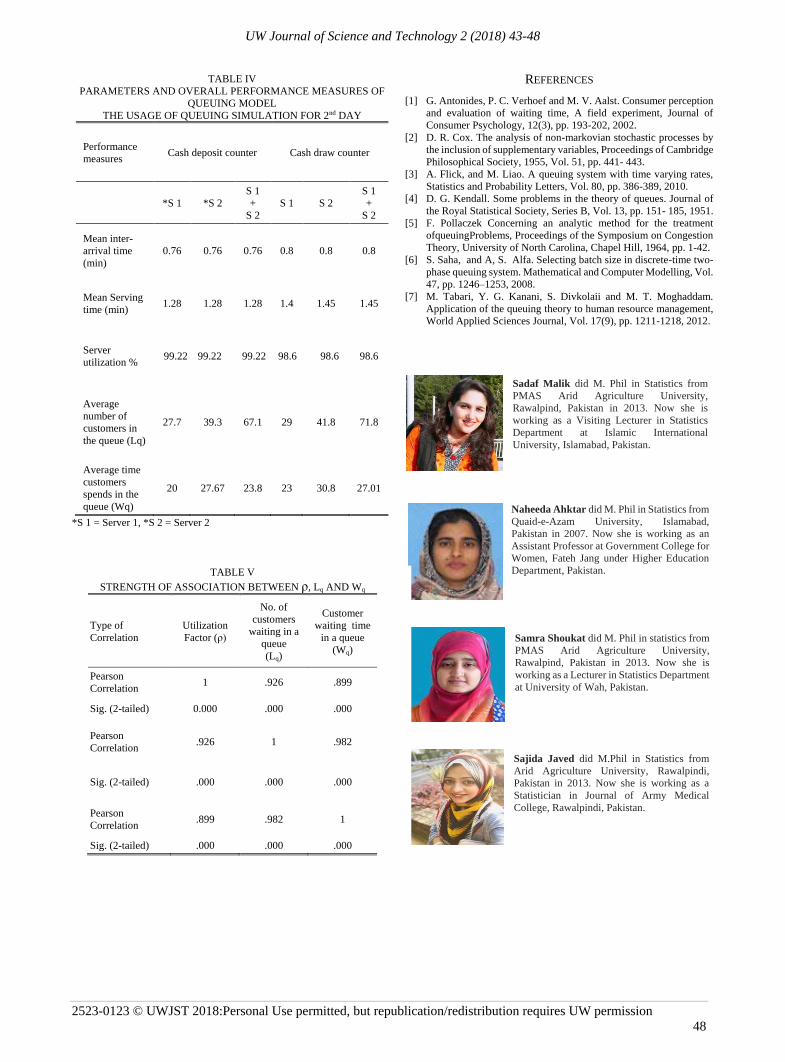
UW Journal of Science and Technology 2 (2018) 43-48
2523-0123 © UWJST 2018:Personal Use permitted, but republication/redistribution requires UW permission
48
REFERENCES
[1] G. Antonides, P. C. Verhoef and M. V. Aalst. Consumer perception
and evaluation of waiting time, A field experiment, Journal of
Consumer Psychology, 12(3), pp. 193-202, 2002.
[2] D. R. Cox. The analysis of non-markovian stochastic processes by
the inclusion of supplementary variables, Proceedings of Cambridge
Philosophical Society, 1955, Vol. 51, pp. 441- 443.
[3] A. Flick, and M. Liao. A queuing system with time varying rates,
Statistics and Probability Letters, Vol. 80, pp. 386-389, 2010.
[4] D. G. Kendall. Some problems in the theory of queues. Journal of
the Royal Statistical Society, Series B, Vol. 13, pp. 151- 185, 1951.
[5] F. Pollaczek Concerning an analytic method for the treatment
ofqueuingProblems, Proceedings of the Symposium on Congestion
Theory, University of North Carolina, Chapel Hill, 1964, pp. 1-42.
[6] S. Saha, and A, S. Alfa. Selecting batch size in discrete-time two-
phase queuing system. Mathematical and Computer Modelling, Vol.
47, pp. 1246–1253, 2008.
[7] M. Tabari, Y. G. Kanani, S. Divkolaii and M. T. Moghaddam.
Application of the queuing theory to human resource management,
World Applied Sciences Journal, Vol. 17(9), pp. 1211-1218, 2012.
Naheeda Ahktar did M. Phil in Statistics from
Quaid-e-Azam University, Islamabad,
Pakistan in 2007. Now she is working as an
Assistant Professor at Government College for
Women, Fateh Jang under Higher Education
Department, Pakistan.
Samra Shoukat did M. Phil in statistics from
PMAS Arid Agriculture University,
Rawalpind, Pakistan in 2013. Now she is
working as a Lecturer in Statistics Department
at University of Wah, Pakistan.
Sajida Javed did M.Phil in Statistics from
Arid Agriculture University, Rawalpindi,
Pakistan in 2013. Now she is working as a
Statistician in Journal of Army Medical
College, Rawalpindi, Pakistan.
TABLE IV
PARAMETERS AND OVERALL PERFORMANCE MEASURES OF
QUEUING MODEL
THE USAGE OF QUEUING SIMULATION FOR 2nd DAY
Performance
measures Cash deposit counter Cash draw counter
*S 1 *S 2
S 1
+
S 2
S 1 S 2
S 1
+
S 2
Mean inter-
arrival time
(min)
0.76 0.76 0.76 0.8 0.8 0.8
Mean Serving
time (min) 1.28 1.28 1.28 1.4 1.45 1.45
Server
utilization % 99.22 99.22 99.22 98.6 98.6 98.6
Average
number of
customers in
the queue (Lq)
27.7 39.3 67.1 29 41.8 71.8
Average time
customers
spends in the
queue (Wq)
20 27.67 23.8 23 30.8 27.01
*S 1 = Server 1, *S 2 = Server 2
TABLE V
STRENGTH OF ASSOCIATION BETWEEN ρ, Lq AND Wq
Type of
Correlation
Utilization
Factor (ρ)
No. of
customers
waiting in a
queue
(Lq)
Customer
waiting time
in a queue
(Wq)
Pearson
Correlation 1 .926 .899
Sig. (2-tailed) 0.000 .000 .000
Pearson
Correlation .926 1 .982
Sig. (2-tailed) .000 .000 .000
Pearson
Correlation .899 .982 1
Sig. (2-tailed) .000 .000 .000
Sadaf Malik did M. Phil in Statistics from
PMAS Arid Agriculture University,
Rawalpind, Pakistan in 2013. Now she is
working as a Visiting Lecturer in Statistics
Department at Islamic International
University, Islamabad, Pakistan.
Instructions for Authors
The University of Wah Journal of Science and Technology (UWJST) is an international, multidisciplinary peer-reviewed annual academic open access
journal. The UWJST offers platform to scientists and engineers to publish their original and current research of high scientific value in areas of Basic
Sciences, Computer Sciences and Engineering at international level. Manuscript published in the Journal illustrate innovations, developments and
achievements in the relevant areas. The journal is being published electronically (online) as well as a paper version (print). It is easily accessible and free
of charge.
Submission: Manuscripts [in .pdf or Word (.doc, .docx)] should be submitted by one of the authors through the email at [email protected].
After manuscripts are accepted, authors are asked to submit (a) Copyright form, (b) Author contribution form.
Terms of Submission: Each submission to UWJST implies that the manuscript presents the results of original scientific research and has not been
published nor has been submitted for publication elsewhere. The manuscript is written in clear and standard English. The reported research should meet
all applicable ethical standards and research integrity. The submitted manuscripts are screened for plagiarism during the editorial process.
Peer Review of Manuscripts: Manuscripts are anonymously peer-reviewed by two national/international scholars appropriate for the topic and content.
The chief editor is responsible for guaranteeing anonymity of the author(s) and reviewers during the review process. A checklist is given to author, in
which manuscript’s review detail is specified. Author has to change their manuscript according to checklist in case of major/minor changes and list all
changes made in corrected paper in Author Response.
Manuscript Preparation: The text should be type written in MS word (2007 and onward), Times new Roman, font size 10, at single space with margins
as 0.75 inch top, 0.75 inch left, 0.75 inch right and 0.5 inch bottom on an A-4 size paper. The manuscript should be completed in the following order:
Title page should contain 1) Paper title 2) Complete authors name 3) Affiliations with email addresses 4) Abstract 5) Index Terms.
Author names and affiliations: Provide complete name of all the authors and their affiliations with e-mail addresses. Present the authors's affiliation
addresses at the bottom of first column of first page. Clearly indicate the corresponding author at the end of authors’s affiliations.
Index Terms immediately after the abstract, provide index terms. These terms will be used for indexing purposes.
Introduction section states the objectives of the work and provides an adequate background, avoiding a detailed literature survey or a summary of the
results.
Experimental/Methodology section should contain sufficient detail to allow the work to be reproduced. Methods already published should be indicated
by a reference: only relevant modifications should be described.
Results and Discussion should provide the significance of the results of the work, not repeat them. A combined Results and Discussion section is often
appropriate. Avoid extensive citations and discussion of published literature.
Conclusions of the research work may be presented in a short Conclusion section.
References must be numbered consecutively and citations of references in text should be identified using numbers in square brackets (e.g., “as discussed
by Smith [9]”; “as discussed elsewhere [9-10]”). Reference format for UWJST publication is as given below:
Reference format for Journal/Transaction
[1] A. Qarni, Z. Ahmed, M. Billah, S. Khan, A. Khan and A. Munir. Effects of organic and inorganic fertilizers on growth and yield of two maize varieties
in Hazara, area Kpk, Pakistan, University of Wah Journal of Science and Technology (UWJST), Vol. 1, pp. 15-21, 2017.
Reference format for conference/proceeding
[2] W. Makni, N. B. Hadj, H. Samet, and R. Neji. Design simulation and realization of solar battery charge controller using Arduino Uno, 17th International
Conference on Sciences and Techniques of Automatic Control and Computer Engineering, 2016, pp. 635-639.
Reference format for book
[3] S. Franko. Electric Circuits Fundamentals, 6th edition, Oxford University Press, 1995.
Reference format for Thesis or Dissertation
[4] Y. LI. Immersive pre-travel training application for seniors and people with disabilities, M. S. thesis, University of Massachusetts Amherst, USA,
2018.
Biographies: A brief information about all authors along with their latest good quality pictures (1*1 inch) should be included separately at the end of the
manuscript as per format given below.
First Author and the other authors should include biographies at the end of regular papers. The paragraph may contain the author’s educational background
with degrees that should be listed with type of degree in what field, which institution, city, state or country, and year. It lists academia and industrial work
experience, including summer and fellowship jobs. Current and previous research interests ends the paragraph.
Accuracy of all the technical, scientific and mathematical information contained in the paper should be checked with great care.
Length of Manuscript should be consisting of 5-12 pages (double column) as per specification given above.
Subdivision - numbered sections: The manuscript should be divided into clearly defined and each section should be numbered I, II, III etc, whereas end
subsection should be numbered A, B, C etc (the abstract and reference are not included in section numbering). Any subsection may be given a brief
heading that should be italic. Each heading should appear on its own separate line.
Figures and Tables: Include all figures and tables in the PDF/Word file of the manuscript. Figures and tables should not be submitted in separate files.
If the manuscript is accepted, authors will be asked to provide the source files (jpg/jpeg) of the figures. Each figure should be supplied in a separate
electronic file. All figures and tables should be cited in the paper in a consecutive order. All authors should number tables and figures as Table I and Fig.
1 respectively.
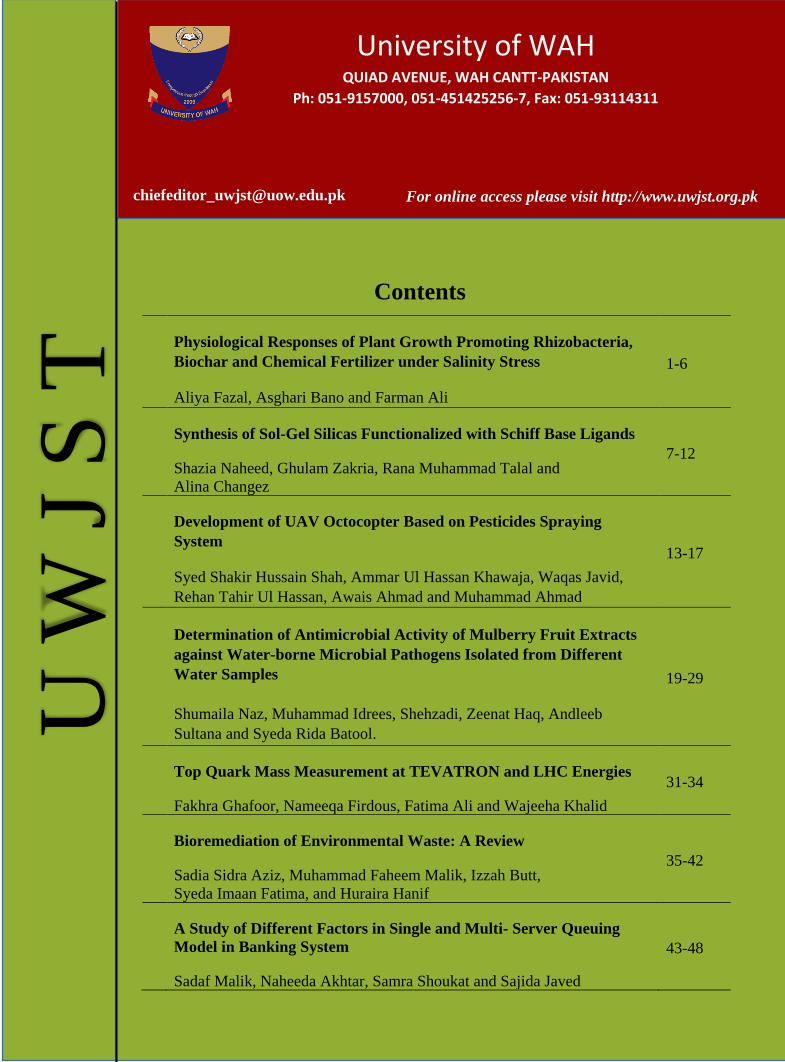
U W
J S
T
Contents
Physiological Responses of Plant Growth Promoting Rhizobacteria,
Biochar and Chemical Fertilizer under Salinity Stress
Aliya Fazal, Asghari Bano and Farman Ali
1-6
Synthesis of Sol-Gel Silicas Functionalized with Schiff Base Ligands
Shazia Naheed, Ghulam Zakria, Rana Muhammad Talal and
Alina Changez
7-12
Development of UAV Octocopter Based on Pesticides Spraying
System
Syed Shakir Hussain Shah, Ammar Ul Hassan Khawaja, Waqas Javid,
Rehan Tahir Ul Hassan, Awais Ahmad and Muhammad Ahmad
13-17
Determination of Antimicrobial Activity of Mulberry Fruit Extracts
against Water-borne Microbial Pathogens Isolated from Different
Water Samples
Shumaila Naz, Muhammad Idrees, Shehzadi, Zeenat Haq, Andleeb
Sultana and Syeda Rida Batool.
19-29
Top Quark Mass Measurement at TEVATRON and LHC Energies
Fakhra Ghafoor, Nameeqa Firdous, Fatima Ali and Wajeeha Khalid
31-34
Bioremediation of Environmental Waste: A Review
Sadia Sidra Aziz, Muhammad Faheem Malik, Izzah Butt,
Syeda Imaan Fatima, and Huraira Hanif
35-42
A Study of Different Factors in Single and Multi- Server Queuing
Model in Banking System
Sadaf Malik, Naheeda Akhtar, Samra Shoukat and Sajida Javed
43-48
For online access please visit http://www.uwjst.org.pk [email protected]
University of WAH QUIAD AVENUE, WAH CANTT-PAKISTAN
Ph: 051-9157000, 051-451425256-7, Fax: 051-93114311
U W
J S
T