Embed Size (px)
Citation preview
AN ANALYSIS OF JOB PLACEMENT PATTERNS OF BLACK AND NON-BLACKMALE AND FEMALE UNDERGRADUATES AT THE UNIVERSITY OF VIRGINIA
AND HAMPTON INSTITUTE
A Dissertation
Presented to
The Faculty of
The Graduate School of Education
University of Virginia
(NASA-TM-X-72204) AN ANALYSIS OF JOB N75-15490
PLACEMENT PATTERNS OF BLACK AND NON-BLACKMALE AND FEMALE UNDERGRADUATES AT THE
UNIVERSITY OF VIRGINIA AND HAMPTON INSTITUTE Unclas
,Ph.D. Thesis - Virginia Univ. (NASA) 125 p_ G3/80 08264
In Partial Fulfillment
of the Requirements for the Degree
Doctor of Eduction
by
Alvin Frederick Anderson
1974
https://ntrs.nasa.gov/search.jsp?R=19750007418 2019-08-08T14:42:22+00:00Z
APPROVAL SHEET
This dissertation by Alvin Frederick Anderson is accepted
in its present form as satisfying the dissertation requirement
for the degree of Doctor of Education.
For the Faculty of the School of Education, University
of Virginia, Charlottesville, Virginia.
Robert H. Pate, Jr., Ph.D.Chairman
Paul B. Walter, Ph.D.
N. Kenneth La Fleur, Ph.D.
Lawrence A. Simpson, Ed.D.
Jennings L. Wagoner, Ph.D.
Date
ACKNOWLEDGEMENTS
No man knows fully what has shaped his own thinking.
Many people contributed to the development of this project,
and whenever the source is known, reference is made in the
numerous footnotes and bibliography. Among these are four
individuals to whom I owe an especial debt, though of
varying degree and kind. To them I want to pay tribute.
The earliest and greatest of.these debts is acknowledged
in the dedication of this work to my wife Martha, and to my
three sons, Alvin F., Christian G., and Leland Jay.
To my advisor and friend, Dr. Robert H. Pate, Jr., I
am grateful for having had his encouragement in times of
trial and frustration. A special thanks goes to Dr. Paul B.
Walter who helped me escape from the provincialism of
thinking.
To Dr. Lawrence A. Simpson, Dr. N. Kenneth La Fleur and
Dr. Jennings L. Wagoner, who also served on my committee, I
appreciate their interest and valuable suggestions. I am
grateful to the graduates of the University of Virginia and
Hampton Institute who served as subjects and made this study
possible.
Finally, I wish to thank Ms. Blanche M. Johnson and the
staff of the Reproduction Center of the NASA-Langley Research
Center for the highly professional manner in which they pro-
duced this dissertation.
iv
ABSTRACT
This research provides data about the job placement pat-
terns of selected June, 1973, graduates of the University of
Virginia at Charlottesville and Hampton Institute, Hampton,
Virginia.
The independent variables were race, sex, and institu-
tion attended. Research questions were proposed to determine
the relationship of the independent variables and dependent
variables when academic major, grade point average, placement
registration, other activity (non-employment), employer, and
source of employer contact were control variables. The de-
pendent variables were number of job offers received, salary
received in position accepted and willingness or unwilling-
ness to recommend source of employer contact.
Background is provided about Black students and their
"special problems" of assimilation, their unique environmental
'perceptions, and their reluctance to use the student personnel
services in higher education. Special consideration is also
given to the overall perception of student personnel services
of both Black and non-Black students, including data on the
differential effects of such variables as race, sex and insti-
tution attended, on their job placement patterns.
The frequency of response to each questionnaire item
representing a dependent or control variable is displayed in
V
tables crosstabulated by each of the independent variables.
To determine whether any observed relationships between the
independent and dependent variables investigated might re-
sult from sampling error, inferential analysis was completed.
The analysis of the dependent variables, number of job offers
received and salary, is based on multiple linear regression
analysis. The analysis determined whether adding informa--A
tion about race, sex and institution attended to a regression
equation makes a statistically significant (p < .05) improve-
ment in the prediction of number of job offers and salary.
The analysis of satisfaction with the source of employer con-
tact was a Chi-Square test to determine whether satisfaction
is independent of source of contact.
The analysis revealed no statistical significance of
institution attended as a predictor of job offers. Further-
more, institution attended was also not statistically signi-
ficant as a predictor of salary. However, statistically
significant relationships were found between race and number
of job offers received, although race was not the most im-
portant variable. Sex was statistically significant in
predicting the number of job offers received. While race
was found to be statistically significant in the prediction
of salary, the analysis shows, however, that academic major,
grade point average and source of employer contact, were all
more useful in the prediction of salary.
vi
Another statistically significant relationship was found
between sex and salary received. It is important to note
that sex as a predictor is the most important variable in
the model, with the exception of non-employment activity.
Finally, the analysis of satisfaction revealed that willifg-
ness to recommend employer contact was not independent of
that source at the 5% level of significance.
The responses of subjects in this study indicate that
contrary to established beliefs, Black students received
more job offers than non-Black students and that despite
race making a statistically significant addition to the
salary received (non-Blacks higher) for all practical pur-
poses, the salaries were equal. The finding that salaries
for females fell below males was noteworthy.
CONTENTS
Page
TITLE PAGE ............................................ i
APPROVAL SHEET ....... .......... .................... . ii
ACKNOWLEDGEMENTS ......................................... .. iii
ABSTRACT ..................................... ...... iv
CHAPTER
1 INTRODUCTION ...................................... 1
Conceptual Foundations ........................... 4
Research Foundations ............................. 7
Review of Selected Literature .................... 10
Rationale: Selection of Institutions ............ 16
Historical Perspective: Black Students at theUniversity of Virginia ...................... 17
Overview: Career Planning and Placement at theUniversity of Virginia ......................... 19
Historical Perspective: Non-Black Students atHampton Institute ............................. 21
Overview: Career Planning and Placement atHampton Institute ............... ............ . 23
Objectives of the Study ........................ 25
2 METHODS AND PROCEDURES ............................ 27
Plan of Study ................................... 27
Instrumentation .................................. 28
Subjects ......................................... 28
Analysis of Data ................. ........... 33
Variables ...................................... 33
Descriptive Analysis ............................ 34
Inferential Analysis ........................... 34
Research Questions .......................... .... 35
3 RESULTS .......................................... 37
Descriptive Data ................................ 37
Summary of First Independent and ControlVariables Crosstabulated ..................... 38
Summary of Second Independent and ControlVariables Crosstabulated . ................... 39
Summary of Third Independent and ControlVariables Crosstabulated ................... 40
Inferential Analysis ............................. 41
Answers to Research Questions .................. 51
Job Offers .................................... 51
Salary ................. ...................... 57
Recommendation of Source of Contact .......... 63
Summary ....................................... 64
4 DISCUSSION ........................................ 66
Methodological Limitations ...................... 71
Population Limitations .......................... 71
Implications .................................... 72
REFERENCES .......................................... 75
APPENDICES
A. LETTER TO PROSPECTIVE STUDENTS .............. 78
B. FOLLOW-UP LETTER ............................ 80

C. THIRD CONTACT LETTER .................. ...... 82
D. THE TEN-ITEM QUESTIONNAIRE: DETERMININGJOB PLACEMENT PATTERNS .................... 84
E. SUPPLEMENTARY TABLES ....................... 87
TABLES
Table Page
1 Summary Responses to Questions Dealing WithCareer/Educational Counseling and PlacementConcerns ....... .. .......................... 9
2 University of Virginia Enrollments - Negroand Total - Fall 1970-71, UndergraduatesOnly ...................................... 20
3 Hampton Institute Undergraduates Enrollment,Fall, 1970-71 ................................ 24
4 Population by Institution ...................... 30
5 Sample Distribution ........................... 31
6 Count of Questionnaires Distributed andReturned ..................................... 32
7 Crosstabulation of Race and Number of JobOffers .................................... ... . 44
8 Crosstabulation of Race and Salary Accepted .... 45
9 Crosstabulation of Sex and Number of JobOffers ...................................... 46
10 Crosstabulation of Sex and Salary Accepted ..... 47
11 Crosstabulation of Institution and Number ofJob Offers ...................... . .......... . 49
12 Crosstabulation of Institution and SalaryAccepted ........................ ... ........ 50
13 Correlation Coefficients in the MultipleRegression Model ......................... .... 52
14 Summary of the Multiple Linear RegressionAnalyses of the Relationship of Race, Sex,and Institution to Job Offers ................ 53
15 Summary of Stepwise Regression of Race withJob Offers ..... ........... ..... ... . .... 54
16 Summary of Stepwise Regression of Sex withJob Offers .......... ...... .................... 55
17 Summary of Stepwise Regression of Institutionwith Job Offers ..... ....................... 56
18 Summary of the Multiple Linear RegressionAnalyses of the Relationship of Race, Sex,and Institution to Salary .................... 59
19 Summary of Stepwise Regression of Race withSalary ... .. ................... ............ 60
20 Summary of Stepwise Regression of Sex withSalary ....................................... 61
21 Summary of Stepwise Regression of Institutionwith Salary ......... ......................... . 62
22 Chi-Square Source by Recommendation ................ 63
Supplementary Tables - Appendix E
23 Crosstabulation of Race and Major ............. 88
24 Crosstabulation of Race and Grade PointAverage ..................................... 89
25 Crosstabulation of Race and PlacementRegistration ........... .................... .. 90
26 Crosstabulation of Race and EmployerClassification .............................. 91
27 Crosstabulation of Race and Source ofContact ....... ..................... ....... . 92
28 Crosstabulation of Race and Place ofContact ......... ........ ................. . 93
29 Crosstabulation of Sex and Major .............. 94
30 Crosstabulation of Sex and Grade PointAverage ......... ........................... 95
31 Crosstabulation of Sex and PlacementRegistration ................................. 96
32 Crosstabulation of Sex and EmployerClassification ................................ 97
33 Crosstabulation of Sex and Source of Contact ... 98
3 4 Crosstabulation of Sex and Place of Contact .... 99
35 Crosstabulation of Institution and Major ....... 100
36 Crosstabulation of Institution and GradePoint Average ................................ 101
37 Crosstabulation of Institution and Placement
Registration ................................. 102
38 Crosstabulation of Institution and EmployerClassification ........... : .............. .... 103
39 Crosstabulation of Institution and Sourceof Contact .................................. 104
40 Crosstabulation of Institution and Placeof Contact .............. .... ....... .... . 105
41 Crosstabulation of Race and Non-EmploymentActivity ..................................... 106
42 Crosstabulation of Sex and Non-EmploymentActivity ... ....... ....... ........ .......... 107
43 Crosstabulation of Institution and Non-Employment Activity .... ....... 108
44 Crosstabulation of Race and Recommendation ..... 109
45 Crosstabulation of Sex and Recommendation ...... 110
46 Crosstabulation of Institution andRecommendation .............................. 111
47 The Variables in the Multiple RegressionModel ..... ...... ... ........................... 112
Chapter 1
INTRODUCTION
Horace Mann (1958) said in 1848 that the educational
institution must serve as the great equalizer of the condi-
tions of men and the balance wheel of the social machinery;
While there is considerable disagreement as to the role and
potency of eduction in furthering equality, those who share
Mann's commitment generally support the idea that programs
designed to attract and retain Black students at institutions
of higher education should provide guidance and counseling
services pertinent to the needs of these students.
Brown and others (1972) reported that Black college
students felt that counseling services were not relevant to
their life goals. They did not accept counseling services
because these contacts were seen as tangential tO their life
styles and concerns. Celia (1966) pointed out that the
counseling process is incongruous with the life pattern of
minority students.
A review of research by Banks (1968), Blumrosen (1968),
Ledvinka (1969), Celia (1966), Vontress (1971), Beaumont
(1972), Knight (1972), and Sedlack (1970) revealed that
problems of Black college students form an identifiable
pattern. Greene and Kester (1970) have identified some
"special problems" of Black students, and claim that their
2
feeling of having been "victimized by the status quo was
very pervasive". Black students indicated that they have
more problems than their non-Black counterparts in the fol-
lowing areas (significant at or beyond the .05 level):
Needing a job during vacationDeciding whether to leave college for a jobWanting part-time experience in my fieldLacking necessary experience for a jobParents expecting too much of me (p. 4)
It seems that Black students do have "unique and
special problems" that deserve attention. This point of
view with regard to Black-non-Black differences was also
supported by a pilot study conducted by the present author.
One problem which evolved from these investigations may be
phrased as a question: How can placement officials meet
the differing career/educational counseling and placement
needs of Black students and non-Black students?
Black students have developed unique environmental
perceptions, values, and attitudes which may disrupt the
non-Black personnel worker's professional pattern during
the counseling relationship. The lack of mutual understand-
ing and knowledge of cultural differences may make empathy
with Black students difficult to achieve. Rogers (1959)
regards the possession of empathy, along with the equally
difficult to achieve genuineness and acceptance as necessary
traits for a counselor. One who has them will be on his way
to establishing a very effective growth-promoting relation-
3
ship with Black clients.
The general area of concern in this research is career
planning and placement activities as they occur in institu-
tions of higher education. In addition to race, the type of
institution attended and its philosophical orientation, may
have differential effects upon the respective student popu-
lation, with respect to their career planning and eventual
job placement. While there are certain ideological differ-
ences between colleges founded t6 serve Blacks, like Hampton
Institute, and those founded to serve non-Blacks, like the
University of Virginia, Black colleges today, according to
Jencks and Riesman (1969) face many of the same dilemmas as
the non-Black institutions. To the extent that Blacks seek
entry into a racially integrated national labor force, they
will usually be interested in integrated colleges that pre-
pare them directly for such a life (p. 4 7 4 ). On the other
hand, Blacks may choose a Black college for social or psy-
chological reasons. Also, Jencks and Riesman (1969) point
to educational research which shows that sex is one of the
most important factors differentiating students' hopes and
performance at all levels. The equalization of educational
opportunity did not, of course, bring overnight equality be-
tween the sexes, even though the attack on sex segregation
and exclusion in higher education has accelerated over the
years (p. 297).
Many of these problems helped to form the basis of a
pilot study conducted by Anderson (1972) at the University
of Virginia, which investigated student personnel services,
by identifying, classifying, and analyzing perception pat-
terns of Black and non-Black students in-residence. The
goal of the present investigation is to determine the in-
fluence of college graduates' race, sex, and institution on
job placement patterns.
Conceptual Foundations
This study considers race, sex and type of institution
attended as variables which may have some effect on the job
placement patterns of college students.
Race.- During the 1968-69 academic year, officials of
College Placement Service (CPS) and the College Placement
Council (CPC) received reports from employers and from col-
leges and universities with a predominantly non-Black enrol-
lment indicating that Black students were not participating
in the regular career counseling and placement programs of-
fered by these institutions. An appraisal of the situation
as reported by Beaumont (1972) is that "these students not
only lacked current information about career options but
they also expressed doubt about their chances of employment
in the white business world (p. 1)".
IIi
Young (1968) contends that "counseling and placement
have been handmaidens in sustaining the economic disad-
vantage of the Negro. Placement activities have proved
inept and inadequate. Many placement officials have assumed
automatically that industrial recruiters are not interested
in interviewing Negroes (p. 238)". Furthermore, according
to Knight (1972) "skin color nullifies vocational opportuni-
ties and imposes other restrictions (p. 3)".
Research by Phillips (1961)'shows that non-Blacks have
a preconceived mental picture of Blacks which may prohibit
a neutral counseling session, or which may interfere with
the counselor's execution of his skills. When dealing with
the Black student, it is also important to consider his per-
ception of the various student personnel programs and to
recognize the significance of interviewing techniques.
Further evidence of a "dual environment" comes from a closer
inspection of perceptual responses. While both racial groups
viewed the general features of their colleges similarly, they
viewed the so-called racial environment quite differently.
Centra (1970) states that Black students appeared not only
to be very much aware of their minority status, but also
perceived their colleges as places where race or background
determine friendships and associations.
What conclusions, if any, can be drawn about Black
students at predominantly white colleges? On the basis of
6
empirical evidence presented by Centra (1970), it would
seem that they are both similar and different from their
non-Black counterparts. But some of the differences accord-
ing to Centra were impressive and, in fact, point toward the
existence of a "dual environment". Given different interests
and concerns, Black students have spent their spare time in
activities "most meaningful to them, especially promoting
civil rights or improving their situation on campus (p. 14)".
Sex.- There are of course, certain culturally determined
roles and functions which affect both males and females.
Much of what is considered "male roles" and "female roles"
may be based on myths and stereotypes. During the past
decade, females have also responded to social and legal in-
justice with widespread protest movements and civil disobedi-
ence leading, with varying degrees of success, to modifica-
tions of legal norms and a consequent restructuring of social
attitudes.
Kanowitz (1969) noted that the similarities between the
legal and social situation of American women and American
Blacks are indeed striking: "both groups are easily identi-
fiable, and both are objects of a discrimination largely
influenced by sexual factors (p. 165)".
In the employment sector, Pressman (1970) also feels that
the forms of discrimination against women are similar to the
7
forms of discrimination against Blacks: "confinement to
low-skilled; low-pay jobs; wage differentials for similar
work; separate lines of seniority and progression; exclusion
from managerial and supervisory jobs; etc. (p. 2)".
Institution Attended.- Students may choose to attend
different types of colleges for a variety of reasons. While
this study will not attempt to analyze the reasons for se-
lecting a particular type of institution, it has been sug-
gested that the introduction of Black students into a new
environment at an integrated university, for example, is
often difficult. However, several factors relating to the
perception of the career/educational counseling and place-
ment services should be considered: (1) this may be the
first time the Black student has had to relate to non-Black
student personnel workers; (2) it may be the first time that
non-Black student personnel workers have had Black counselees;
(3) the new Black student may feel anxious about his recep-
tion; and (4) the non-Black student personnel worker may also
feel anxious about his reception.
Research Foundations
Anderson's (1972) questionnaire elicited from Black and
non-Black students, reactions to their involvement in and
perceptions of the placement activities at the University
8
of Virginia. The pilot study population was 178. Of this
group who voluntarily completed and returned the question-
naire, there were 50 Black male, 50 non-Black male, 39 Black
female, and 39 non-Black female students in-residence.
Part III of the questionnaire was entitled "General
Concerns". It was subdivided into five categories of items
adopted and amended from the Mooney Problem Checklist, 1950,
revision by Ross L. Mooney. These categories were labled as
follows: (1) Academic, (2) Financial, (3) Personal/Social,
(4) Career/Educational Counseling, and (5) Measurement/Eval-
uation.
On the basis of the evidence presented in the pilot
study, it was determined that there are differences between
Black and non-Black students in their perceptions of career/
educational counseling and placement services. It then be-
came an additional research concern to discover if their
career counseling needs were being met by these services,
and if a differential effect of job placement patterns in-
hibited their ability to secure jobs upon graduation. A
summary of the "General Concerns" of Black and non-Black
students is provided in Table 1.
This summary table is significant only because it
provides a listing of personal concerns, with frequency
tabulations by race and sex of the subjects in the pilot
study from which this present study is an outgrowth. It is
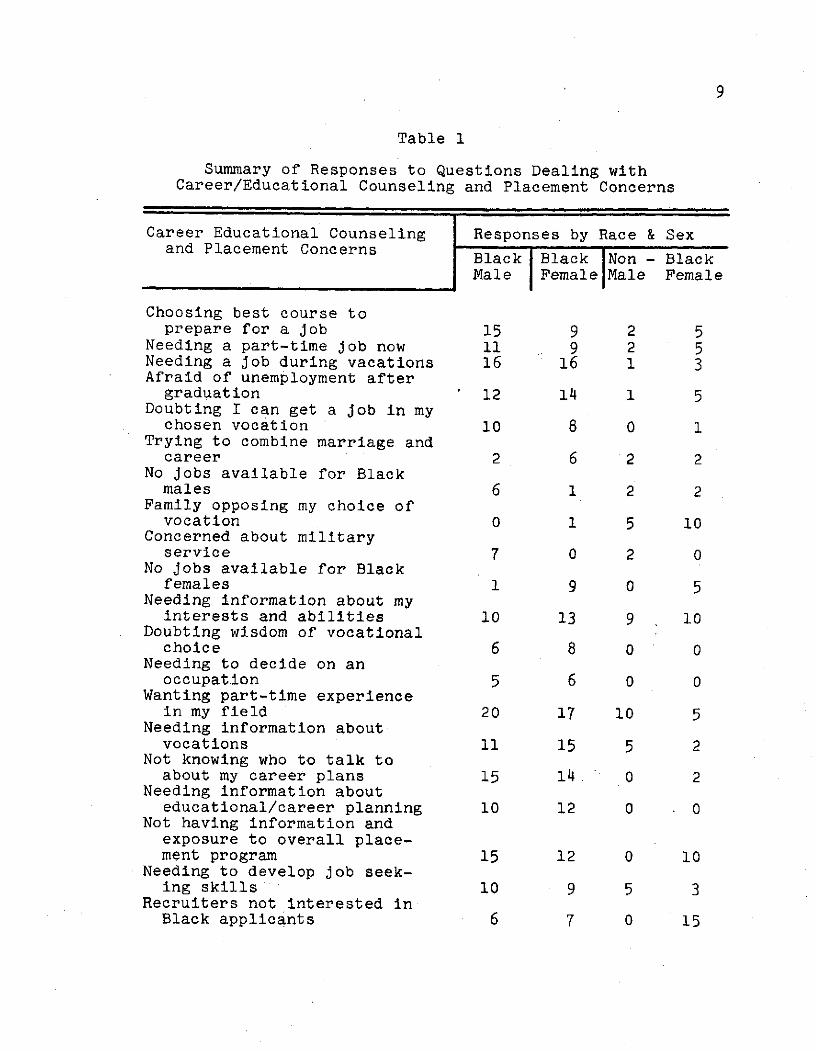
Table 1
Summary of Responses to Questions Dealing withCareer/Educational Counseling and Placement Concerns
Career Educational Counseling Responses by Race & Sexand Placement Concerns Black Black Non Black
Male Female Male Female
Choosing best course toprepare for a job 15 9 2 5
Needing a part-time job now 11 9 2 5Needing a job during vacations 16 16 1 3Afraid of unemployment after
graduation 12 14 1 5Doubting I can get a job in my
chosen vocation 10 8 0 1Trying to combine marriage and
career 2 6 2 2No jobs available for Blackmales 6 1 2 2
Family opposing my choice ofvocation 0 1 5 10
Concerned about militaryservice 7 0 2 0
No jobs available for Blackfemales 1 9 0 5
Needing information about myinterests and abilities 10 13 9 10
Doubting wisdom of vocationalchoice 6 8 0 0
Needing to decide on anoccupation 5 6 0 0
Wanting part-time experiencein my field 20 17 10 5
Needing information aboutvocations 11 15 5 2
Not knowing who to talk toabout my career plans 15 14. 0 2
Needing information abouteducational/career planning 10 12 0 0
Not having information andexposure to overall place-ment program 15 12 0 10
Needing to develop job seek-ing skills 10 9 5 3
Recruiters not interested inBlack applicants 6 7 0 15
10
Wanting advice on next step aftercollege 10 7 0 0
Needing to plan ahead for thefuture 7 7 0 0
Doubting value of college degree 7 6 10 15Not knowing how to look for a
job 6 5 5 10Not knowing how to talk torecruiters 7 5 5 3
Needing information about co-opprograms 12 4 0 0
Not knowing how to develop apersonal resume 10 3 2 1
Unable to enter my desiredvocation 0 3 15 20
Wondering whether further edu-cation is worthwhile 10 3 0 0
Deciding whether to leavecollege for a job 7 0 2 0
Needing information about speci-fic occupations 10 10 5 3
Wanting more worthwhile dis-cussions with career counselors 15 15 2 5
No Black counselor to talk to 25 14 5 0Needing money for graduate
training 15 9 3 2
inclusive and yet more detailed than the findings of Greene
and Kester (1970).
Review of Selected Literature
Though there are those who would argue against the nec-
essity for special programs for Black.students, Dr. James G.
Bond, Vice President for Student Affairs at Bowling Green
State Uni-versity, in a 1969 speech drew attention to the
importance of the counselor's understanding the culture,
behavioral patterns, language, attitudes, appearance,
interviewing techniques, mobility and general problems of
Blacks. Vontress (1970) talks about the middle-class per-
son's "inability or unwillingness to understand and relate
to cultural minorities in our society". This inaptitude, he
claims, "is so pervasive that it permeates the ranks of
counselors, teachers, and other professionals". Vontress
recommends in-service training for counselors. The primary
goals of such training should be that of "sensitizing thera-
peutic professionals to the nature and needs of cultural
minorities".
While many colleges have established special programs,
perhaps to attract Black students, reports by Sedlack and
Brooks (1970) reveal that many of these programs appear to
be typical student services such as tutoring and counseling,
which are offered to all students, with no mechanisms to
ensure that Black students will take advantage of these
services.
Tolson (1972) makes reference to negative labeling, when
she talks about some of the adjectives (disadvantaged, poor,
black) which have become so "culturally powerful that they
control our perception and thereby limit our ability to ap-
ply what we know to be good counseling techniques". The
question of language then, is an important vehicle of com-
munication and further is a significant component of the
counseling relationship. Schumaker and others (1972) help
12
to clarify the issue when they state that effective communi-
cation between non-Black personnel workers and Black students
depends at least in part upon "linguistic compatability".
The results of their study suggest that "linquistic compata-
bility" between Black students and non-Black personnel work-
ers is low. They conclude that having Black counselors in
the student personnel program and having an educational
component for non-Black counselors that deals with areas of
the curriculum related to Blacks'as well as on-the-job
training are means to eleviate the problem.
Few studies have considered the influence of key
figures upon the vocational development of Black youth.
One notable exception to the general lack of research is
Uzzell!s (1961) study of Black male high school seniors in
the South. Essentially, these students identified with the
same-sex parents with respect to career choices.
Pallone, Rickard and Hurley (1970) describe the relative
frequency with which certain key figures were reported by a
cross-section of Black youth from working class families in.
four cities in a northern state to have influenced their
occupational preference. Parents rank first or second in
order of influence, while a person who himself holds the
preferred occupation ranks in the alternate position. The
most influencers of occupational preference thus are the
same-sex parents. The influence of the opposite-sex parent
13
rivals that of the same-tex parent only among Black males, a
finding which Varies from previous observation on the domi-
nant role of the mother in the Black family and with the
categorization of the diminished role of the Black father.
Perhaps these youth have adopted a methodic approach to
the process of gathering information and opinions about self
and work from the most accessible and likely sources. For
the personnel worker, Pallone (1969) suggests that they might
profitably become concerned with'"influencing the influencers
...who are in a position to directly affect" the vocational
development of youth.
Facing the emerging feeling of alienation in the white
middle-class oriented colleges, the Black student may reject
services traditionally designed to meet the average student's
needs. In turn, he seeks to identify with his own set of
values, aspirations, system of reward and leadership models.
Haettenschwiller (1971) makes the point that counseling
services that are designed to help and assist the Black
student often call for an outreach approach in which contact.
is made with the student after acceptance and prior to his
arrival as an entering student. The counselor takes the
initiative by arranging to discuss the college program with
the student and his parents at home. The reassurance the
student can get from the brief home contact may provide the
basis for a good counseling relationship.
14
According to Harrison (1972), the Black student typical-
ly feels alienated from the faculty when relationships are
restricted and limited to formal classroom settings.
Faculty members could demonstrate a personal interest in
these students by allowing them to share in their research
experiences, and faculty could also develop classroom acti-
vities relevant to social problems. The faculty model could
seek every opportunity to engage the minority student in
dialogue on intellectual issues to enhance his intellectual
growth and development.
The above points of view do concur with Myers (1972)
who suggests that self-perception, individual development,
and other factors play important roles in how students begin
to align themselves to major fields and identify with career
choices.
The impact of the college attended on its students is
the topic of a publication (Feldman and Newcomb, 1969);
portions of which are relevant to this study. The inclusion
of college as an environmental stimuli is appropriate be-
cause college majors clearly are not ultimate career
choices. One of the earliest systematic attempts at isolat-
ing collegiate impact on vocational development was made by
Knapp and Goodrich (1952). They attributed the differences
in productivity to the prevailing atmosphere of the institu-
tion and to the type of student who is attracted to it.
15
Therefore, differential student populations among colleges
appear as a more probable explanation of differences in
productivity than the special qualities of institutions (p.
436).
It is our inclination to rank schools and colleges as
the primary influence on career development because so many
functions are served by educational institutions. According
to Rever's (1973) review, school and college effects have
not been substantiated, perhaps because of methodological
difficulties (p. 144). Nevertheless, it seems clear that
teachers, counselors, and subject-matter experiences are
related to.the direction taken in career planning.
The question of equality of job opportunities for some
women needs to be addressed as a variable in any discussion
of career planning. Why do surveys show that college women
are often paid lower salaries than college men? Many com-
panies indicated that women college graduates were paid the
same starting rates. Most employers, however, offered gen-
eral statements regarding the reasons why women are often
paid less. The reasons include discrimination, prejudice,
and an unenlightened attitude of management. Employers also
indicated that women apply for and accept lower paying jobs,
that women tend to prefer jobs with less responsibility (U.
S. Department of Labor, Women's Bureau, 1972).
Rever (1973) illustrates by research examples the fact
16
that the most powerful influence on both level of career path
and direction of career path is sex and the associated sex
role. The interest patterns of males and females have been
shown to beBslightly better predictors of direction of career
development than have other factors.
Rationale: Selection of Institutions
The question investigated is whether differences in
race, sex, or institution of a sample of 1973 college grad-
uates were related to job offers and salaries.
Hampton Institute and the University of Virginia were
selected as institutions with the greatest likelihood to
provide an environment to answer the above question for
several reasons: (1) the writer's familiarity with both
institutions in the role of faculty member and graduate
student respectively; (2) the types of institutions: one
predominantly Black, privately supported and the other pre-
dominantly non-Black, state supported; (3) the geographical
proximity of the institutions; (4) the racial composition of
the student personnel staffs and faculties; (5) the diversity
in socio-economic backgrounds of the students; and (6) the
age and historical significance of eac.h.
All of the above reasons may have a differential effect
upon the job placement patterns of the student populations
of the selected institutions.
17
Historical Perspective: Black Students at the Universityof Virginia
Brown (1972) reports that in the fall of 1 9 49, Gregory
Hayes Swanson, a Black attorney from Martinsville, Virginia,
applied for admission to the University of Virginia Law
School. As expected, Swanson's admissions request was re-
jected by the University Board of Visitors, on July 14,
because of his race. Swanson refused to accept this rejection
and had his attorney, a member of the NAACP legal staff,
petition the court to "enjoin the board for such action
against him and/or others similarly situated". On September
5, a three man Federal Court convened, and after a 30 minute
session, decreed for qualified Blacks to enter the University
of Virginia Law School (Richmond Times Dispatch, 1950). This
successful admission to the University signaled the introduc-
tion of Black student enrollment.
On January 1, 1951, the University of Virginia admitted
Alfreda Louise Madison, a Richmond school teacher, to its
graduate extension courses offered at Richmond Professional
Institute.
The next pioneer Black graduate student was Walter N.
Ridley who was the first Black student admitted to the Uni-
versity's main grounds in the fall of 1951. In June 1953,
Mr. Ridley received the Doctor of Education degree - another
first.
18
By the fall of 1970-71, significant integration by race
was seen in the growth of the number of Black students en-
rolled in the following graduate and professional schools:
Architecture 2; Arts & Sciences 24; Business Administration
3; Education 73; Engineering 3; Law 25; Medicine 7; Graduate
Total: 137.
The question of the integration of females at the Uni-
versity of Virginia is more complex than it appears on the
surface. There have been non-Black females enrolled in the
graduate and professional schools (e.g.,.Nursing) since 1920.
Therefore, for sake of consistency, co-education refers only
to undergraduate, on-campus enrollment at both institutions
in this study.
From a review of .the Clipping File and the Statistical
Information Series, housed in the Reference Section of the
Alderman Library of the University of Virginia, data can be
found which discusses the circumstances surrounding the de-
cision to admit females to the undergraduate schools which
is also open to interpretation. In 1968,, for example, a
faculty committee, called the Woody Committee, reported the
results of an 18-month long study on co-education at the
University. On February 15, 1969, the Board of Visitors
adopted a resolution dealing with the admission of females
and the provision that full co-education begin in the fall
of 1970 (The University of Virginia News Letter, 1969).
19
On the other hand, in April, 1969, a class-action suit
was brought against the University by four Charlottesville
women. The grounds for the suit were "sex discrimination"
and the plaintiffs were requesting "immediate admission to
the University". On September 8, 1969, the women won a
temporary injunction against the University, and Miss Virginia
Scott of Charlottesville was admitted to the University as a
full-time undergraduate student (The Daily Progress, 1969).
It appears that Black recruitment began in 1961 by
members of the Virginia Council on Human Relations, with
visitations to Black high schools by members of the Council
(Brown, 1972). Table 2 provides data on University of
Virginia undergraduate enrollment in the fall of 1970-71.
Overview: Career Planning Placement at the University of
Virginia
The Office of Career Planning and Placement at the Uni-
versity of Virginia does not operate as a typical "employ-
ment agency". Rather, its program efforts are based on
principles and services which are developmental and are
provided early and continuously in the students' tenure at
the University. Provisions are made for career and graduate
study information resources and for the development of career,
and graduate study outreach programs. In career planning,
placement efforts encourage and reward initiative and
20
Table 2
University of Virginia Enrollments - Negro* and TotalFall 1970-71 Undergraduates Only#
Undergraduate Negro 1970 1971 Total 1970 1971
Arts & Sciences 89 156 4,614 5,472Commerce 0 1 "204 238Architecture 8 7 260 331Education. 2 2 154 215Engineering 19 28 1,037 1,025Nursing** 3 2 324Medical Technology** 0 1 12
Entering Class Statistics
Applicants 191 247Offers 135 138Matriculants 92 9 5 a
Totals 236 334 10,837 12,351Second Semester 314(1972)
*Includes voluntary self-designation of Negro,Black, Afro-American, and Negroid to date.
**Prior to 1971, the Medical Technology enroll-ment was included with Nursing.
a1 97 1 Entering Class.
#Data obtained from Office of InstitutionalAnalysis, University of Virginia.
21
independence, which are of significant educational value to
students.
From this type of philosophy, the Office of Career
Planning and Placement.has developed specific objectives
which are communicated throughout the University community.
The approach has been to attempt.to respond to student needs
whenever and wherever possible. A description of the Uni-
versity's career planning and placement program is given by
Simpson and Harwood (1973).
Historical Perspective: Non-Black-Students at HamptonInstitute
Hampton Institute opened in 1868, under the leadership
of General Samuel C. Armstrong. Much of Armstrong's efforts
according to Bullock (1968) were guided by a four-pronged
educational concept. He wanted "to'make Negroes of service
to themselves and whites, to dignify human labor by rein-
forcing it with intelligence, to develop a sense of respon-
sibility within each pupil by giving him specific tasks to
perform and to saturate the entire program with useful forms
of manual training (p. 32)". Hampton became the other horn
of an educational dilemma that was to face Black leaders for
more than a half century. Bullock provides the following
explanation of the situation:
It (Hampton) introduced the idea ofvocational education for Negroes andattributed to this type of training
22
a value superior to that offered bythe liberal arts.colleges that werebeing established at this time (p.33).
In order to obtain information on the.historical presence
of non-Black students (non-Negroid) at Hampton Institute, a
search of selected records housed in the archives of the
Huntington Library was conducted. In a bound volume of
Catalogs dated 1870-1880, it was discovered that Herbert A.
Chenweth (non-Black) entered Hampton in 1877 and received a
diploma in 1879. In 1951, it was reported.by the Dean of
Admissions and Registrar, that Gordon L. Bradshaw received a
B.S. degree. He was the fourth non-Black student at Hampton,
but the first to receive a degree. It should be noted that
the Dean's report was only concerned with the identification
of the first non-Black student who received an academic degree.
Therefore, no mention was made of the second and third non-
Black students enrolled. It is also interesting to note that
many of the children of non-Black faculty members also attend-
ed classes at Hampton, and some lived in the dormitory.
In summary, integration of the races began at Hampton
Institute as early as 1877, approximately 73 years before the
University of Virginia.. Non-Black students have been contin-
uously enrolled at Hampton since 1946. In 1962, there were
6 full-time non-Black students enrolled. As of December 1973,
there were 295 (12-13%) non-Black students enrolled. With
23
respect to integration of the sexes, Hampton Institute has
traditionally been co-educational, while the University of
Virginia began to admit undergraduate females to its campus
in the fall of 1970.
Finally, perhaps the fact that Hampton Institute has had
a longer period of experience with co-education and racial
integration than the University of Virginia, the philosophi-
cal basis of operation of the respective student personnel
services may be different, which'may result in differences
in student perceptions of these services at the two institu-
tions. Table 3 provides data on Hampton Institute under-
graduate enrollment in the fall of 1970-71.
Overview: Career Planning and Placement at Hampton Institute
The Educational Resources Center of Hampton Institute
has both an academic and administrative purpose. The ad-
ministrative purpose is to deal primarily with non-instruc-
tional services to students. These services include Fresh-
man Studies, Financial Counseling, Testing Bureau, Psycho-
logical Counseling, Student Affairs, Career Planning and
Placement, and the Communication Center.
The primary objective of the Office of Career Planning
and Placement is to help students and alumni secure permanent
employment upon graduation from Hampton Institute. This
office also assists underclassmen to secure part-time or
24
Table 3
Hampton Institute Undergraduate Enrollment, Fall 1970-71
Undergraduate Divisions# 1970-71 School Year
Architecture 53Business 367Fine Arts 80Freshman Studies 549Human Ecology 46Communication Arts & Sciences,, 148Nursing 66Science and Mathematics 203Social Sciences 396Early Childhood Education 77Elementary Education 93Secondary Education 182Exchange 1Unclassified 1Industrial Engineering 1Electrical Engineering 67
Tri-Base** 135
Total 2,465*
*Although Hampton Institute had 295 (12-13%)students designated non-Black, divisionrecords are not maintained by race.
**Military Education Evening Program.
#Data obtained from Office of the Dean ofAdmissions and Registrar, Hampton Institute.
25
temporary employment, such as summer work experience. In
addition, the Cooperative Work-Study Program is administered
by the Placement Office in cooperation with four academic
divisions. These divisions are Business, Fine Arts & Human-
ities, Pure and Applied Science, and Social and Environmental
Studies.
In order to assist students to become employed citizens,a
career planning program is carried out. This is accomplished
by having individual conferences'with students, career inter-
view sessions, youth motivation programs and campus visits
by representatives from industry and government.
Objectives of the Study
The priimary goal of this study was to investigate career
planning and placement of Black and non-Black male and female
June, 1973, graduates of the University of Virginia and
Hampton Institute in order to determine and compare their
job placement patterns. For purposes of this study, the
following definitions are applicable:
Job Placement Pattern.- process through which students
identify, select, and prepare for obtaining a career position
upon graduation.
Willingness to Recommend Source of Employer Contact.-
non-hesitation, if asked, to refer other students to the
26
person or persons from whom helpful job information which
resulted in a successful job placement was received.
This study tests Knight's (1972) position that "skin
color nullifies vocational opportunities and imposes other
restrictions". Furthermore, it tests Kanowitz's (1969)
theory of similarities "between the legal and social situa-
tion of American women and American Blacks; especially since
both groups are easily identifiable, and both are objects of
a discrimination largely influended by sexual factors".
The primary objective of this study was to determine
if knowledge of the independent variables of race, sex,
and institution makes a statistically significant difference
in the prediction of the dependent variables which were
number of job offers and salary accepted, when academic
major, grade point average, placement registration, employer,
and source of employer contact as control variables, are
included in the prediction. The second objective was to
determine whether willingness to recommend the source of
employer contact is independent of that source.
27
Chapter 2
METHODS AND PROCEDURES
Plan of Study
The investigation was conducted during the spring
semester of the 197 3-7'4 academic year. Approval from the
respective placement directors was obtained to solicit
subjects for the study from rosters of students who graduated
in June 1973. In a cover-letter addressed to each subject
(see Appendix A) the purpose.of the questionnaire was ex-
plained as a method to determine job placement patterns of
former students. Each subject was encouraged to be honest
and candid in his reply. The investigator informed the
students that the results of the questionnaire would be
translated into "ways and means" of helping future students
in their career planning activities. They were also told
that their responses would become part of a dissertation
project which would neither identify individuals nor make
comparisons between individuals. No names were.requested on
the form.
The questionnaires were mailed to each subject, and
they were requested to complete and return them to the in-
vestigator in a stamped addressed envelope marked confiden-
tial. The solicitation of subjects was conducted during
January and February, 1974.
28
Ten days after initial date of mailing, a follow-up
letter was sent to each subject who did not return the
questionnaire (see Appendix B). After an additional ten
days, telephone calls were made to nonrespondents, and a
second questionnaire (third contact) was sent to those re-
maining subjects who indicated that they would participate
(see Appendix C).
Instrumentation
The instrument used in this study was a ten item ques-
tionnaire developed by the investigator in consultation
with members of his doctoral committee (see Appendix D).
Permission was granted by two professors at Norfolk State
College and Old Dominion University to use'20 senior stu-
dents to test the reliability of the research instrument.
No problems with the directions or overall comprehension of
the questionnaire were reported by these students. Face and
content validity of the questionnaire was attested to by two
placement directors (one Black and one non-Black).
Subjects
The following procedures were employed to attend to
number limitations in the solicitation of subjects;
1. June, 1973, graduates' statistics were obtained from
the office of the Dean of Admissions and Registrar at both
29 >
institutions. Black males and females and non-Black males
and females were identified separately (see Table 4).
2. From an alphabetized roster of the June, 1973,
graduates of Hampton Institute (male, female, Black and non-
Black separate) each third name was selected to obtain a,
sample of 50 Black males and 50 Black females. Because of
the small number of non-Black males and non-Black females in
the class, the following condition was established: If the
population of non-Black males and non-Black females was
less than 20, survey all. Ten was the population.
There were also less than 20 non-Black females in the class.
Therefore, all 8 were selected. In the case of Black males
and Black females, they represent a sample of the population;
whereas, non-Black males and non-Black females constitute
their respective populations.
3. From an alphabetized roster of the June, 1973,
graduates of the University of Virginia (male, female,
Black, non-Black separate) each third name was selected to
obtain a sample of 50 non-Black males. Because.of the small
number of Black males, Black females and non-Black females
in the class, the above condition for selection was also
advanced.
Since there were less than 20 Black males in the class,
all 10 were selected. There were also less than 20 Black
females and non-Black females in the class. Therefore, 10
Table 4
Population by Institution*
Distribution by Race and Sex
Name of Institution Black Male Black Female Non-Black Non-Black TotalsMale Female
Hampton Institute 236 215 10 8 469
Hampton, Virginia
University of Virginia 10 10 1511 10 1541
Charlottesville
Totals 246 225 1521 18 2010
June, 1973 Graduates*
The total number of subjects surveyed was 138. See Table 5
for sample distribution and Table 6 for count of question-
naires distributed and returned.
Table 5
Sample Distribution
Distribution by Race and Sex
Name of Institution Black Male Black Female Non-Black Non-Black, TotalsMale .Female
Hampton Institute 30 30 10 8 78Hampton, Virginia (S) (S) (P) (P)
University of Virginia 10 10 30 10 60Charlottesville (P) (P) (S) (P)
Totals 40 .40 40 18 138
(S) = Sample (P) = Population
Table 6
Count of Questionnaires Distributed and Returned
Distribution by Race, Sex Total Total Percent'and Institution Distributed Returned Returned
Hampton Institute
Black Male 50 30 60
Black Female 50 30 60
Non-Black Male 10 10 100
Non-Black Female 8 8 100
University of Virginia
Black Male 10 10 100
Black Female 10 10 100
Non-Black Male 50 30 60
Non-Black Female 10 10 100
.N = 138
33
Black females and 10 non-Black females were selected. In
the case of the non-Black males, they represent a sample of
the population; whereas, Black males, Black females and non-
Black females constitute their respective populations.
It should be noted that the first 30 responses were
taken from Black male and Black female subjects at Hampton
Institute and from the first 30 responses from non-Black
males at the University of Virginia. Three Black males and
4 Black females from Hampton Institute returned their ques-
tionnaire after the cut-off date. Two non-Black males from
the University of Virginia also returned their questionnaires
after the cut-off date.
Analysis of Data
Variables
The variables investigated were assessed through the
questionnaire described above. The independent variables
were race, sex and institution attended.' Academic major,
grade point average, other activity selected, placement
registration, employer, and source of employer contact were
the control variables. The dependent variables were number
of job offers received, salary received in position accepted
and willingness to recommend source of employer contact.
34
Descriptive Analysis
The frequency of response to each questionnaire item
representing a dependent or control variable was crosstabu-
lated by each of the independent variables. Thus, .the fre-
quency of each of the response categories was determined for
Blacks, males and females, and for the University of Virginia
and Hampton Institute.
Infer.ential Analysis
To determine whether any observed relationships between
the independent and dependent variables investigated might
result from sampling error, inferential analysis was complet-
ed. The analysis of the dependent variables, number of job
offers received and salary, was based on applied multiple
linear regression analysis (Kelly, Beggs, and McNeil, 1969).
Multiple regression analysis produces a linear combination
of predictors (independent and control variables) which have
the highest correlation with a criterion (dependent) variable.
The analysis determined whether adding information about race,
sex, and institution attended to a regression equation con-
taining the control variables makes a statistically signifi-
cant (p < .05) improvement in the prediction of number of
job offers and salary. The analysis of satisfaction with
the source of employer contact was a Chi-Square test to
determine whether satisfaction is independent of source of
35
contact.
Research Questions
The general research objective was to determine and
compare job placement patterns of June, 1973, graduates of
the University of Virginia and Hampton Institute, with race,
sex and institution attended serving as independent variables.
The specific research questions which this study at-
tempted to answer were:
Job Offers.-
l(a) Does knowledge of subjects' RACE make a statisticallysignificant difference in the prediction of the numberof JOB OFFERS received when academic major, grade pointaverage, placement registration, employer, other acti-vity, and source of employer contact are included inthe prediction?
(b) Does knowledge of subjects' SEX make a statisticallysignificant difference in the prediction of the numberof JOB OFFERS received when academic major, grade pointaverage, placement registration, employer, other activ-ity, and source of employer contact are tncluded in theprediction?
(c) Does knowledge of subjects' INSTITUTION ATTENDED make astatistically significant difference in the predictionof the number of JOB OFFERS received when academic major,grade point average, placement registration, employer,other activity, and source of employer contact are in-cluded in the prediction?
Salary.-
2(a) Does knowledge of subjects' RACE make a statisticallysignificant difference in the prediction of the SALARYRECEIVED when academic major, grade point average,placement registration, employer, other activity, and
36
source of employer contact are included in the pre-diction?
(b) Does knowledge of subjects' SEX make a statisticallysignificant difference in the prediction of the SALARYRECEIVED when academic major, grade point average,placement registration, employer, other activity, andsource of employer contact are included in the prediction?
(c) Does knowledge of subjects' INSTITUTION ATTENDED make astatistically significant difference in the prediction ofSALARY RECEIVED when academic major, grade point average,placement registration, employer, other activity, andsource of employer contact are included in the prediction?
Recommend Contact.-
3 Is subjects' WILLINGNESS TO RECOMMEND their SOURCE OFEMPLOYER CONTACT independent of that source?
Chapter 3 presents the results of the analysis of the data
gathered in the study.
37
Chapter 3
RESULTS
The independent variables in this investigation were
race, sex and institution. The dependent variables were
number of job offers received, salary received in position
accepted and willingness to recommend source of employer
contact. Academic major, grade point average, other activ-
ity, placement registration, employer, and source of employ-
er contact were the control variables. The control variables
were selected due to their potential to influence the de-
pendent variables and their potential relationship to the
independent variables.
Descriptive Data
Each variable investigated in the study was tallied
and crosstabulated. The crosstabulations were based on the
three independent variables, race, sex, and institution.
Certain variables were used as.controls in the inferential
analyses because observed relationship between the dependent
and independent variables might have been due to relation-
ships on control variables. A summary of the crosstabula-
tion of each of the variables used as controls and the
independent variables is provided. The data are presented
in tabula form in Appendix E, Tables 23 thru 46.
38
Summary of First Independent and Control Variables Cross-tabulated
With RACE as the first of the three independent varia-
bles, crosstabulated by the control variables, Table 23
reveals that 32.6% of the total population were Black liberal
arts majors, and 25.4% of this same group were professional
majors. In terms of non-Blacks, 13.8% were liberal arts
majors, while 28.3% were professional majors.
Table 24 shows that 23.9% of the total population were
Blacks with a grade point average of 3..0-3.4. Non-Blacks
in the same GPA range represented 17.4% of the total popu-
lation. Before continuing with this summary, it should be
noted that only the highest percentages are used for com-
parisons. As seen in Table 25, 39.9% of the Blacks regis-
tered with the Placement Office, while 31.9% of the non-
Blacks also registered.
Table 26 shows that with respect to classification of
employer, 16.7% of the Blacks were employed by Industry,
with Education and Business not too far behind. On the
other hand, 14.5% of.the non-Blacks were also employed by
Industry with Education in the next largest percentage.
Insofar as source of employer contact is concerned,
Table 27 shows that 21.0% of the Blacks used the Placement
Office as their source, with 19.6% of the non-Blacks using
the same source.
39
Although the place of job contact was not used as a
control variable in this study because it condenses data
related to the source of contact, it may be important to
note that job contacts were made on campus by 43.5% of the
Blacks and 25.4% of the non-Blacks. Table 28 presents the
data related to place of contact.
Summary of Second Independent and Control Variables Cross-tabulated
With SEX as the second of the three independent varia-
bles, crosstabulated by the control variables, Table 29
shows that 34.1% of the female subjects were liberal arts
majors, and that 45.7% of the males were professional
majors. In Table 30, 20.3% of the female subjects had
final grade point averages in the 3.0-3.4 range, with 21.0%
of the males in the same range.
In terms of placement registration, 29.0% of the fe-
males in Table 31, registered with the placement office,
and 42.8% of the males also registered. 19.6% of the fe-
males presented in Table 32 were employed in Education, and
26.8% of the males were employed by Industry. Table 33
shows that 14.5% of the female subjects used the Placement
Office as their source of employer' contact, and 26.1% of
the males also used the same source of contact.
Again it was important to note that 29.0% of the female
40
subjects made their contact with employers on campus, and
39.9% of the males also made their job contact on campus,
as seen in Table 34.
Summary of Third Independent and Control Variables Cross-tabulated
The third phase of the descriptive analysis dealt with
INSTITUTION attended as the third of three independent var-
iables, crosstabulated by a control variable.
With respect to institution attended, subjects from
Hampton Institute as shown in Table 35 represents 29.0% of
the total population who took professional degrees,'as op-
posed to 24.6% at the University of Virginia in the same
areas. In Table 36, 38.3% of the subjects achieved final
grade point averages in the 3.0-3.4 range at Hampton Insti-
tute, and 15.2% at the University of Virginia were in the
2.5-2.9 range.
Table 37 shows that 45.5% of the subjects from Hampton
Institute registered with the Placement Office and 25.4% of
the subjects from the University of Virginia also registered.
With respect to subjects' employing organization, Table 38
shows that at Hampton Institute, 19.5% were employed by
Industry and 15.9% in Education. At the University of Vir-
ginia, 11.6% were employed in Education, and 11.6% were also
employed in Industry. From Hampton Institute, 28.3% of the
subjects used the Placement Office as their source of em-
ployer contact, and 12.3% of the subjects from the University
of Virginia also in Table 39, used the Placement Office as
their source of employer contact.
Finally, Table 40 shows the results of a crosstabulation
of the institution and place of employer contact. As oppos-
ed to 47.8% of the population from Hampton Institute who made
their job contacts on campus, 21.0% of the subjects from the
University of Virginia made their contact on campus.
Inferential Analysis
To determine whether any observed relationships between
the independent and dependent variables investigated might
result from sampling error, inferential analyses'were com-
pleted. The analysis of the dependent variables, number of
Job offers received and salary, is based on applied multiple
linear regression analysis (Kelly Beggs, and McNeil, 1969)
using the University of Virginia Control Data Corporation
6400 computer. The p < .05 level was accepted as significant
in the investigation.
Multiple regression analysis produces a linear combina-
tion of predictors (independent and control variables) which
have the highest correlation with a criterion (dependent)
variable. The analysis determined whether adding information
about race, sex and institution attended to a regression
42
equation makes a statistically significant (p < .05) im-
provement in the prediction of number of job offers and
salary when the control variables were included in the pre-
diction equation.
The analysis of satisfaction with the source of employ-
er contact was a Chi-Square test to determine whether satis-
faction is independent of source of contact. For the Chi-
Square analysis all subjects were combined due to the small
number is some cells. The crosstabulations of willingness
to recommend and race, sex and institution are presented in
Tables 44 thru 46, Appendix E.
The actual analysis was performed using the Statistical
Package for the Social Sciences (SPSS) which is a system of
computer programs designed to provide the social scientists
with a unified and comprehensive package enabling him to
perform many different types of data analysis in a simple
and convenient manner (Nie, Bent and Hull, 1970). The
analyses were performed at the Academic Computing Center at
the University of Virginia using the CDC 6400 computer.
The frequency of response to questionnaire items repre-
senting an independent variable is displayed in Tables 7-12,
crosstabulated by each of the dependent variables. The.
first phase of the inferential analysis dealt with RACE as
the first of three independent variables, crosstabulated by
a dependent variable.
43
In terms of the number of job offers received, 20.3%
of the Blacks received 3 job offers, and 15.2% of the non-
Blacks received 2 job offers, as can be seen in Table 7.
Salaries in the $10-11,000 range were accepted by 19.6% of
the Blacks in Table 8, and with 11.6% of the non-Blacks ac-
cepting $8-9,000. Salary offers of less than $10,000 were
received by 35% of Black subjects and by 48% of non-Black
subjects. Less than three offers were received by 48% of
the Black subjects and by 60% of the non-Black subjects.
In order to determine what happened to those students
who did not accept a job, a crosstabulation of the indepen-
dent and a non-employment activity was performed. Of the
subjects who were engaged in non-employment activities,
4.3% of the Blacks went on to graduate school, and 2.2% of
the non-Blacks were engaged in the same activity as indicat-
ed in Tables 41 thru 43, Appendix E.
The second phase of the inferential analysis dealt
with SEX as the second of three independent variables, cross-
tabulated by a dependent variable.
In terms of the number of Job offers received, it can
be seen in Table 9 that 13.8% of the females received 2 job
offers, and 22.5% of the males received 3 job offers. In
Table 10, it can be seen that 16.7% of the females accepted
salaries in the $6-7,000 range, while 23.9% of the males
accepted salaries in the $10-11,000 range.
Table 7
Crosstabulation of Race and Number of Job Offers
Number of Offers.
1 2 3 4 N/A
Black 11 18 28 14 980
8.0% 13.0% 20.3% 10.1% 6.9%
Race
Non-Black 9 20 21 3 458
6.5% 14.5% 15.2% 2.2% 2.9%
N = 138
Table 8
Crosstabulation of Race and Salary Accepted
Salary Accepted
$6-7,000. $8-9,000 $10-11,000 $11-12,000 Over Not$12,000 Applicable
Black 13 16 27 12 5 980
9.4% 11.6% 19.6% 8.7% 3.6% 6.5%
Race
Non-Black 12 16 11 8 6 558
8.7% 11.6% 8.0% 5.8% 4.3% 3.5%
N = 138
Table 9
Crosstabulation of Sex and Number of Job Offers '
Number of Offers
1 2 3 4 N/A
Female 13 19 17 2 758
9.4% 13.8% 12.3% 1.4% 5.1%
Sex
Male 7 20 31 15 780
5.1% 14.5% 22.5% 10.9% 5.1%
N = 138
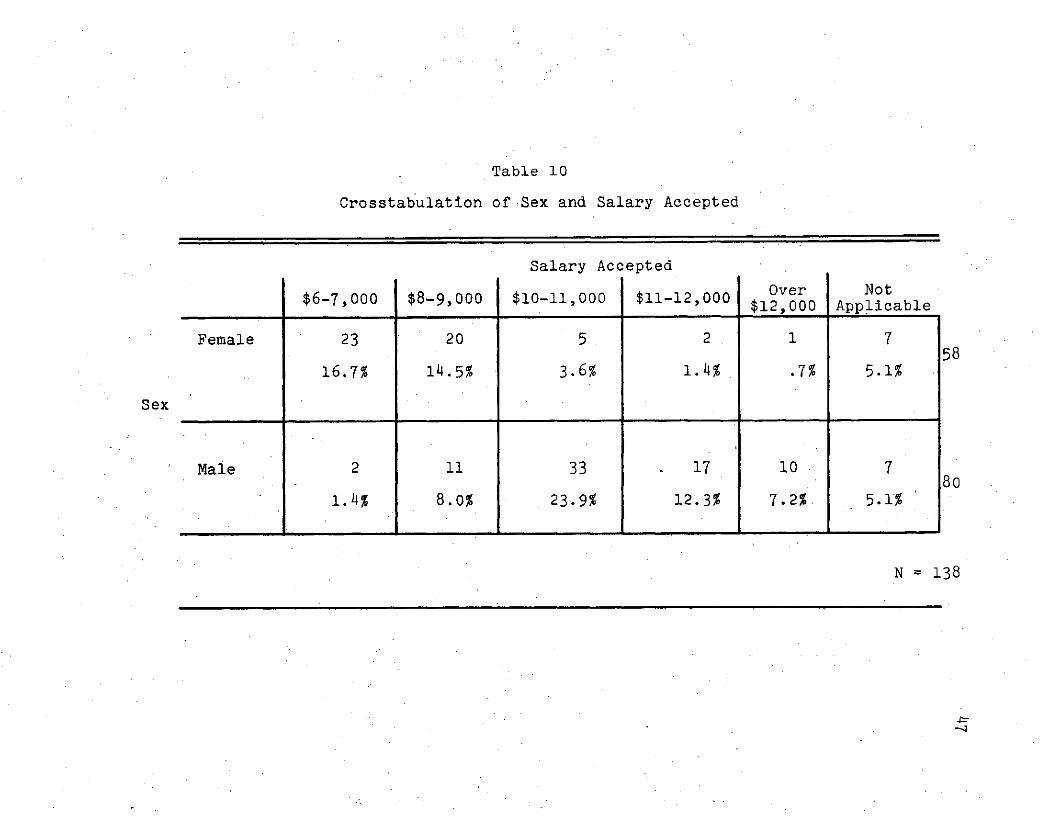
Table 10
Crosstabulation of Sex and Salary Accepted
Salary Accepted
$6-7,000 $8-9,000 $10-11ii,000 $11-12,000 Over Not$12,000 Applicable
Female 23 20 5 2 1 758
16.7% 14.5% 3.6% 1.4% .7% 5.1%
Sex
Male 2 11 33 17 10 780
1.4% 8.0% 23.9% 12.3% 7.2%. 5.1%
N = 138
48
Table 42, Appendix E, shows that 4.3% of the females
went to graduate school upon graduation, while 2.2% of the
males went to graduate school, and an additional 2.2% of
the males also went to professional school upon graduation.
Salary offers of less than $10,000 were received by
74% of the females and by only 19% of the male subjects.
However, the number of job offers were essentially equal
with 33% of female subjects and 32% of males receiving less
than three offers.
The third phase of the inferential analysis dealt with
INSTITUTION ATTENDED as the third of 3 independent variables,
crosstabulated by a dependent variable.
Twenty eight subjects at Hampton Institute received 3
job offers, representing 20.3% of the sample, and 14.5%
at the University of Virginia also received 3 Job offers as
seen in Table 11. The salary accepted by the subjects from
Hampton Institute in Table 12, shows 15.2% in the $10-11,000
range, and 11.6% of the population from the University of
Virginia in the $8-9,000 range.
Salary offers of less than $10,000 were received by
42% of the Hampton Institute subjects and by 35% of the
University of Virginia subjects. The number of offers re-
ceived were similar with 41% of Hampton subjects and 45% of
University of Virginia subjects receiving less than three
offers.
Table 11
Crosstabulation of Institution and Number of Job Offers
Number of Offers
1 2 3 4 N/A
12 20 28 15 3Hampton 78Institute 8.7% 14.5% 20.3% 10.9% 2.2%
Institution
8 19 20 3 10University 60of Virginia 5.8% 13.8% 14.5% 2.2% 7.2%
N = 138
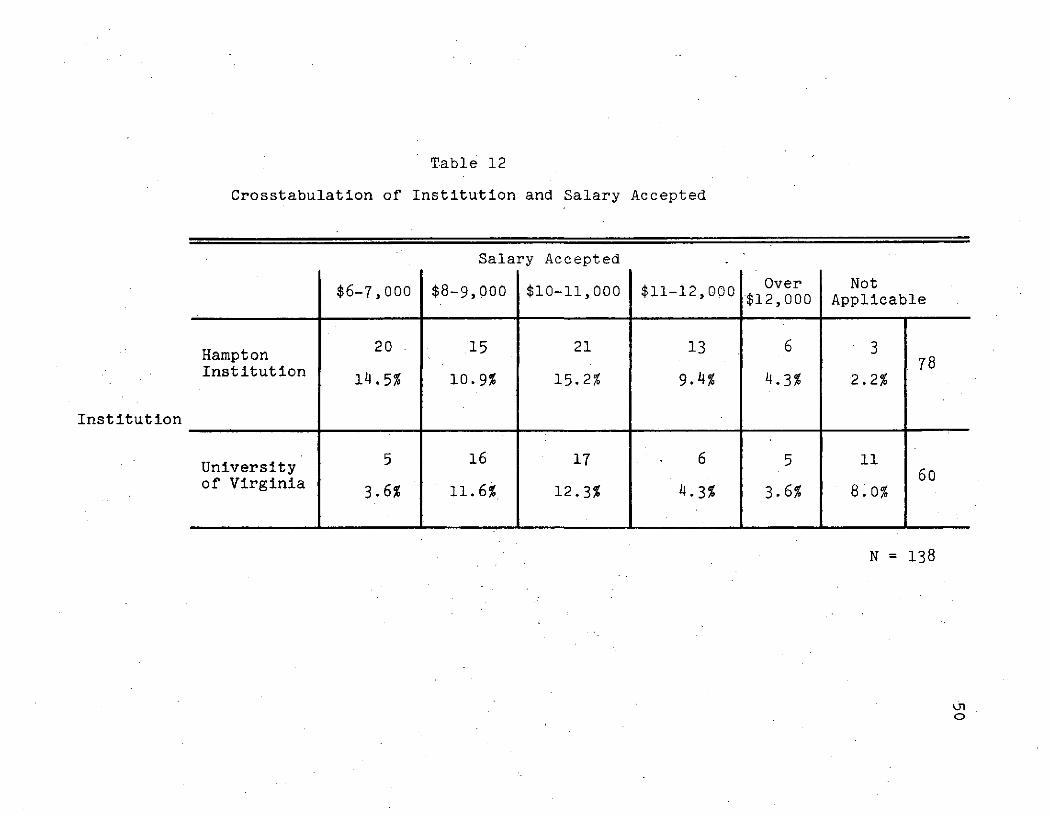
Table 12
Crosstabulation of Institution and Salary Accepted
Salary Accepted
$6-7,000 $8-9,000 $10-11ii,000 $11-12,000 Over Not$12,000 Applicable
Hampton 20 15 21 13 6 3
Institution 14.5% 10.9% 15.2% 9 .4% 4.3% 2.2%
Institution
University5 16 17 6 5 11 60
of Virginia 3.6% 11.6% 12.3% 4.3% 3.6% 8.0%
N = 138
u-
51
Table 43, Appendix E, shows that 1.4% of the sample
from Hampton Institute went to graduate school upon gradua-
tion, as opposed to 5.1% of those from the University of
Virginia.
Table 47, which presents the means, standard deviations,
number of cases and percent of responses to each response
category for each of the variables in the multiple regres-
sion model, is included in Appendix E.
The correlation matrix of the variables in the multiple
regression model is presented in Table 13 on the following
page.
Answers to Research Questions
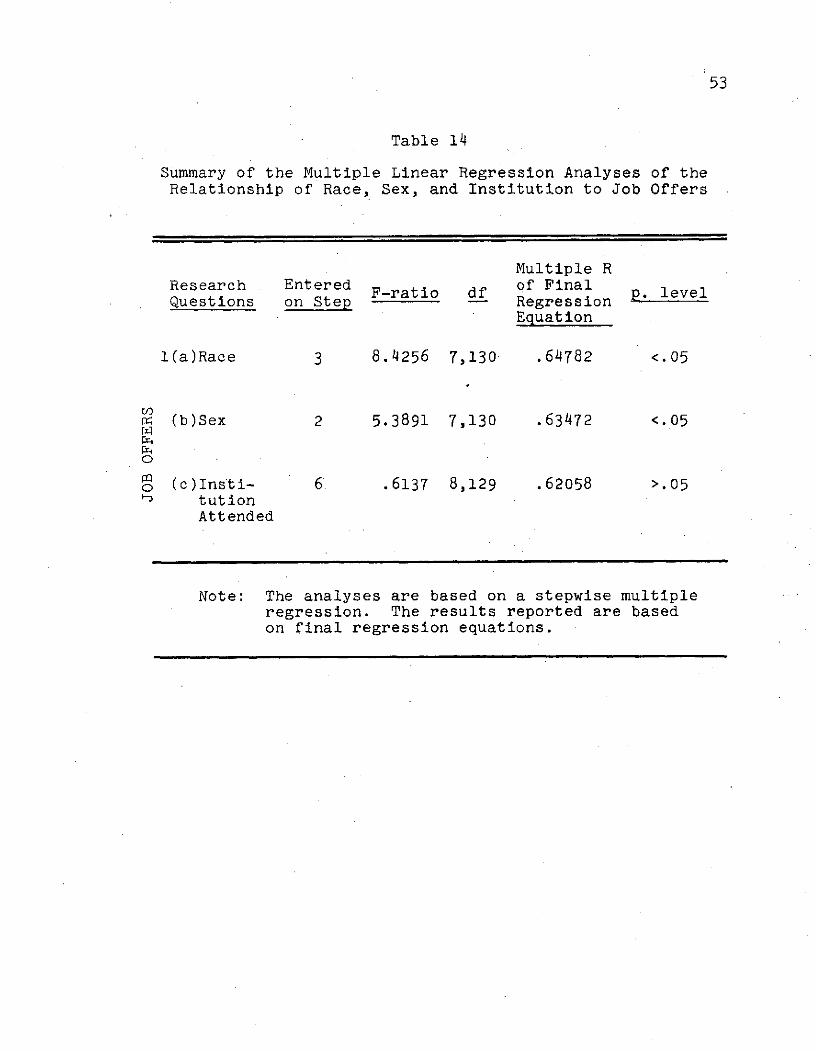
1. Job Offers. The data resulting from the regression
analyses of the independent variables' relationship to job
offers are summarized in Table 14. Tables 15, 16, and 17
present a summary of the stepwise multiple regression of
the independent variables to job offers. The research ques-
tions and results follow:
Question One (a) asked, "Does knowledge of subjects'
RACE make a statistically significant difference in the
prediction of the number of JOB OFFERS received when academic
major, grade pointuaverage, placement registration, employer,
and source of employer contact are included in the predic-
tion?" The analysis was a stepwise multiple regression
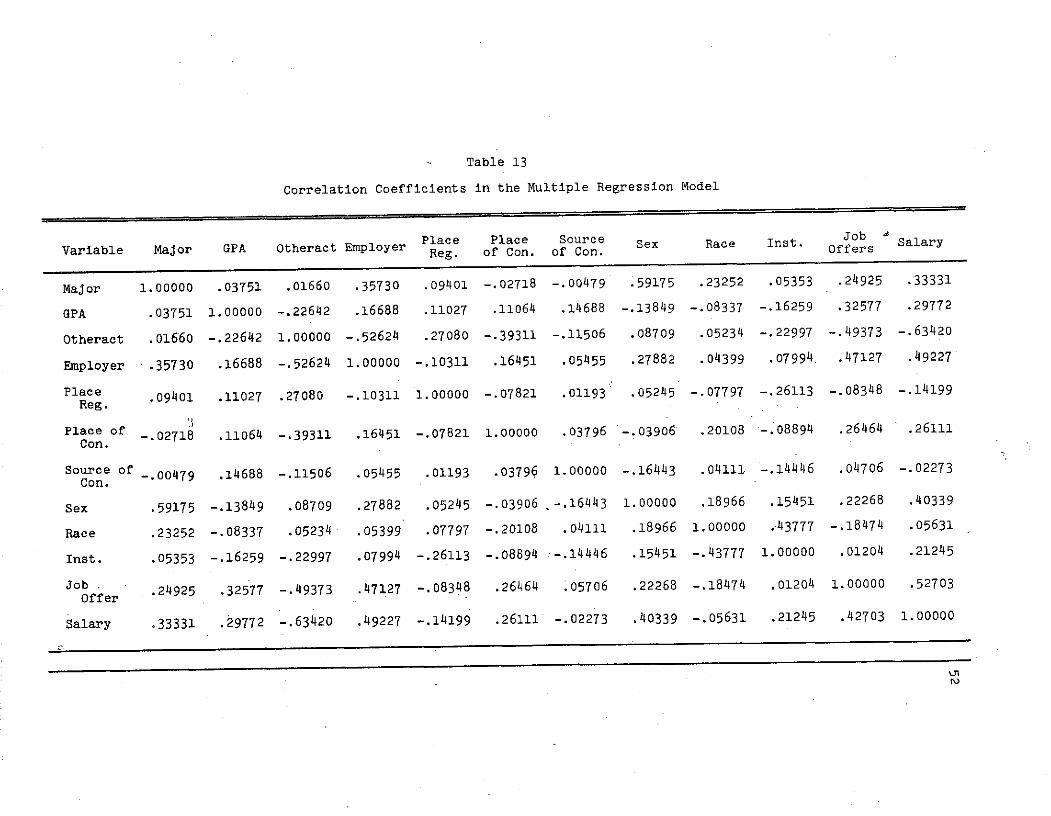
Table 13
Correlation Coefficients in the Multiple Regression Model
Place Place Source Sex Race Inst JobVariable Major GPA Otheract Employer Reg.Sex Race Inst. Offer Salary
Major 1.00000 .03751 .01660 .35730 .09401 -.02718 -.00479 .59175 .23252 .05353 .24925 .33331
GPA .03751 1.00000 -.22642 .16688 .11027 .11064 .14688 -.13849 -. 08337 -.16259 .32577 .29772
Otheract .01660 -.22642 1.00000 -. 52624 .27080 -.39311 -.11506 .08709 .05234 -.22997 -.49373 -.63420
Employer .35730 .16688 -.52624 1.00000 -.10311 .16451 .05455 .27882 .04399 .07994. .47127 .49227
Place .09401 .11027 .27080 -.10311 1.00000 -.07821 .01193 .05245 -.07797 -.26113 -.08348 -.14199Reg.
Place of -.02718 .11064 -.39311 .16451 -.07821 1.00000 .03796 -.03906 .20108 -.08894 .26464 .26111Con.
Source of -.00479 .14688 -.11506 .05455 .01193 .03796 1.00000 -.16443 .04111 -.14446 .04706 -.02273Con.
Sex .59175 -.13849 .08709 .27882 .05245 -.03906 .-. 16443 1.00000 .18966 .15451 .22268 .40339
Race .23252 -. 08337 .05234 .05399 .07797 -.20108 .04111 .18966 1.00000 .43777 -.18474 .05631
Inst. .05353 -.16259 -.22997 .07994 -.26113 -.08894 --.14446 .15451 -.43777 1.00000 .01204 .21245
Job .24925 .32577 -.49373 .47127 -.08348 .26464 .05706 .22268 -.18474 .01204 1.00000 .52703Offer
Salary .33331 .29772 -.63420 .49227 -.14199 .26111 -.02273 .40339 -. 05631 .21245 .42703 1.00000
53
Table 14
Summary of the Multiple Linear Regression Analyses of theRelationship of Race, Sex, and Institution to Job Offers
Multiple RResearch Entered of FinalQuestions on Step ratio Regression
Equation
l(a)Race 3 8.4256 7,130 .64782 <.05
(b)Sex 2 5.3891 7,130 .63472 <.05
o (c)Insti- 6. .6137 8,129 .62058 >.05tutionAttended
Note: The analyses are based on a stepwise multipleregression. The results reported are basedon final regression equations.
Table 15
Summary of Stepwise Regression of Race with Job Offers
STEP Variable Multiple R R Square B Beta
1 Other Activity .49373 .24377 -.35859 -.32524
2 Major .55684 .31007 .43186 .22847
3 Race .60057 .36069 -.48144 -.20471
4 GPA .63002 .39693 .23921 .19089
5 Employer .64617 .41754 .16138 .19009
6 Place of Contact .64773 .41955 .10520 .04986
7 Source of Contact .64782 .41967 .00640 -.01115
Table 16
Summary of Stepwise Regression of Sex with Job Offers
STEP Variable Multiple R R Square B Beta
1 Other Activity .49373 .23277 -.37380 -.33904
2 Sex .56115 .31489 .47634 .20254
3 GPA .61606 .37953 .30107 .24025
4 Employer .62971 .39654 .13049 .15370
5 Place of Contact .63478 .40294 .17396 .08841
6 Major .63730 .40616 -.03364 .07473
Table 17
Summary of Stepwise Regression of Institution with Job Offers
STEP Variable Multiple R R Square B Beta
1 Other Activity .49373 .24377 -.36748 -.33330
2 Major .44684 .31007 .43799 .18815
3 GPA .59475 .35373 .25146 .20067
4 Employer .61187 .37438 .15807 .18619
5 Place of Contact .61770 .38155 .16863 .07992
6 Institution .61946 .38374 -.14139 -.06038
7 Source of Contact .62022 .38467 -.01807 -.03150
57
indicating that although race was not the most important
variable in predicting the number of job offers received,
its F - ratio of 8.4256 is statistically significant at the
.05 level.
Question One (b) asked, "Does knowledge of subjects'
SEX make a statistically significant difference in the pre-
diction of the number of JOB OFFERS received when academic
major, grade point average, placement registration, employ-
er, and source of employer contact are included in the
prediction?" The F - ratio of 5.3891 resulting from the
analysis indicates that sex is statistically significant at
.05 level in predicting the number of job offers.
Question One (c) asked, "Does knowledge of subjects'
INSTITUTION attended make a statistically significant dif-
ference in the prediction of the number of JOB OFFERS re-
ceived when academic major, grade point average, placement
registration, employer, and source of employer contact are
included in the prediction?" The results of the analysis
show that the F - ratio, .6137, of institution attended as a
predictor of job offers is not statistically significant.
2. Salary. The data resulting from the regression
analyses of the independent variables' relationship to
salary are summarized in Table 18. Tables 19, 20, and 21
present a summary of the stepwise multiple regression of the
independent variables to salary. The research questions and
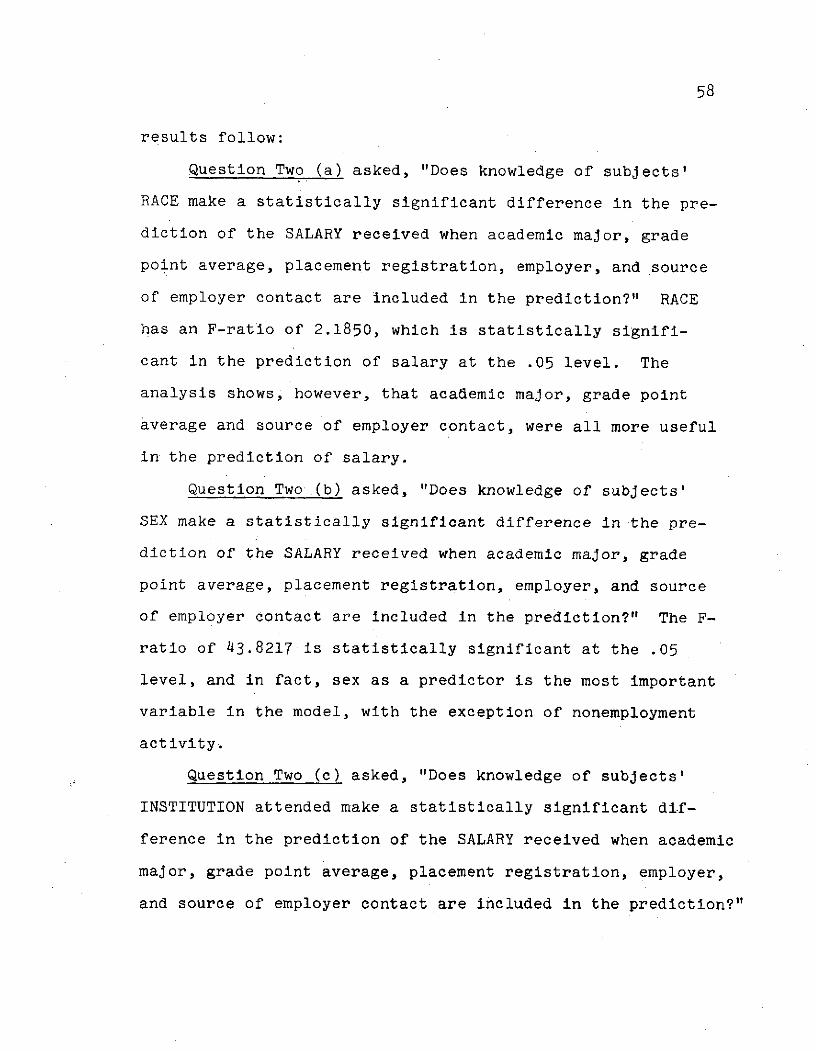
58
results follow:
Question Two (a) asked, "Does knowledge of subjects'
RACE make a statistically significant difference in the pre-
diction of the SALARY received when academic major, grade
point average, placement registration, employer, and source
of employer contact are included in the prediction?" RACE
has an F-ratio of 2.1850, which is statistically signifi-
cant in the prediction of salary at the .05 level. The
analysis shows, however, that academic major, grade point
average and source of employer contact, were all more useful
in the prediction of salary.
Question Two (b) asked, "Does knowledge of subjects'
SEX make a statistically significant difference in the pre-
diction of the SALARY received when academic major, grade
point average, placement registration, employer, and source
of employer contact are included in the prediction?" The F-
ratio of 43.8217 is statistically significant at the .05
level, and in fact, sex as a predictor is the most important
variable in the model, with the exception of nonemployment
activity.
Question Two (c) asked, "Does knowledge of subjects'
INSTITUTION attended make a statistically significant di-f-
ference in the prediction of the SALARY received when academic
major, grade point average, placement registration, employer,
and source of employer contact are included in the prediction?"
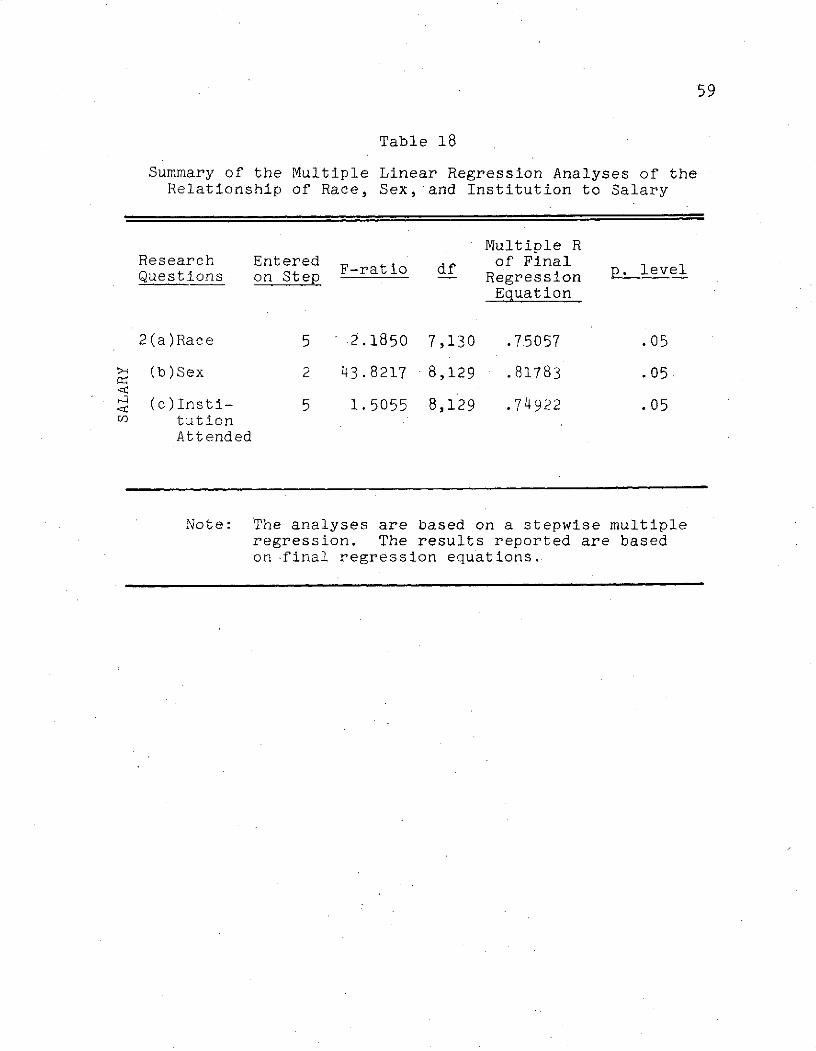
59
Table 18
Summary of the Multiple Linear Regression Analyses of theRelationship of Race, Sex, and Institution to Salary
Multiple RResearch Entered of FinalQuestions on Step F-ratio df Regression
Equation
2(a)Race 5 2.1850 7,130 .75057 .05
(b)Sex 2 43.8217 8,129 .81783 .05
(c)Insti- 5 1.5055 8,129 .74922 .05tutionAttended
Note: The analyses are based on a stepwise multipleregression. The results reported are basedon final regression equations.
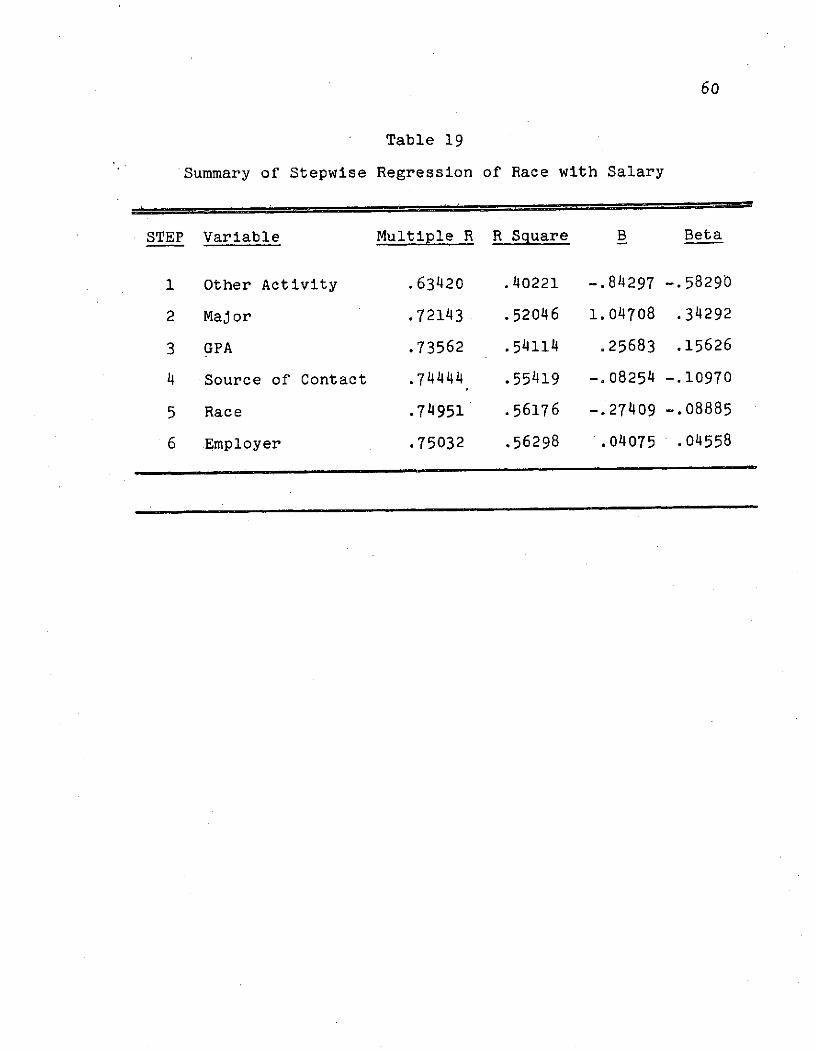
60
Table 19
Summary of Stepwise Regression of Race with Salary
STEP Variable Multiple R R Square B Beta
1 Other Activity .63420 .40221 -.84297 -.58290
2 Major .72143 .52046 1.04708 .34292
3 GPA .73562 .54114 .25683 .15626
4 Source of Contact .74444 .55419 -.08254 -.10970
5 Race .74951 .56176 -.27409 -.08885
6 Employer .75032 .56298 :.04075 .04558
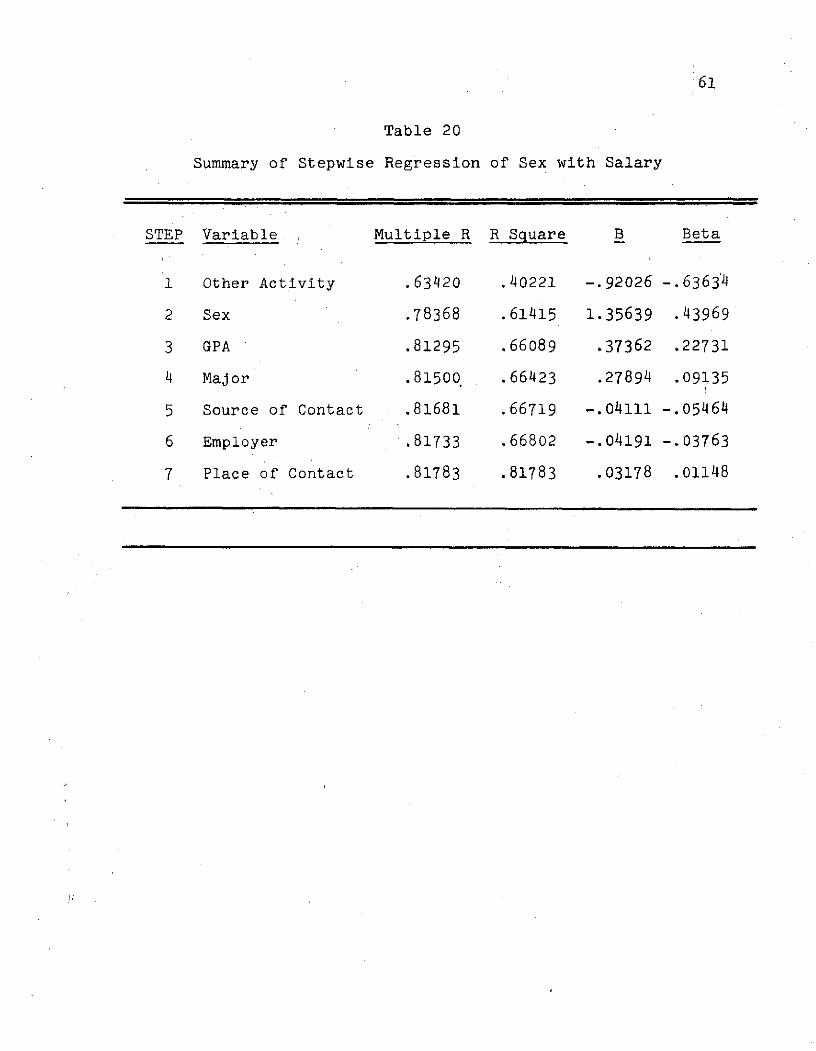
Table 20
Summary of Stepwise Regression of Sex with Salary
STEP Variable . Multiple R R Square B Beta
1 Other Activity .63420 .40221 -.92026 -.63634
2 Sex .78368 .61415 1.35639 .43969
3 GPA .81295 .66089 .37362 .22731
4 Major .81500 .66423 .27894 .09135
5 Source of Contact .81681 .66719 -.04111 -. 05464
6 Employer .81733 .66802 -.04191 -.03763
7 Place of Contact .81783 .81783 .03178 .01148
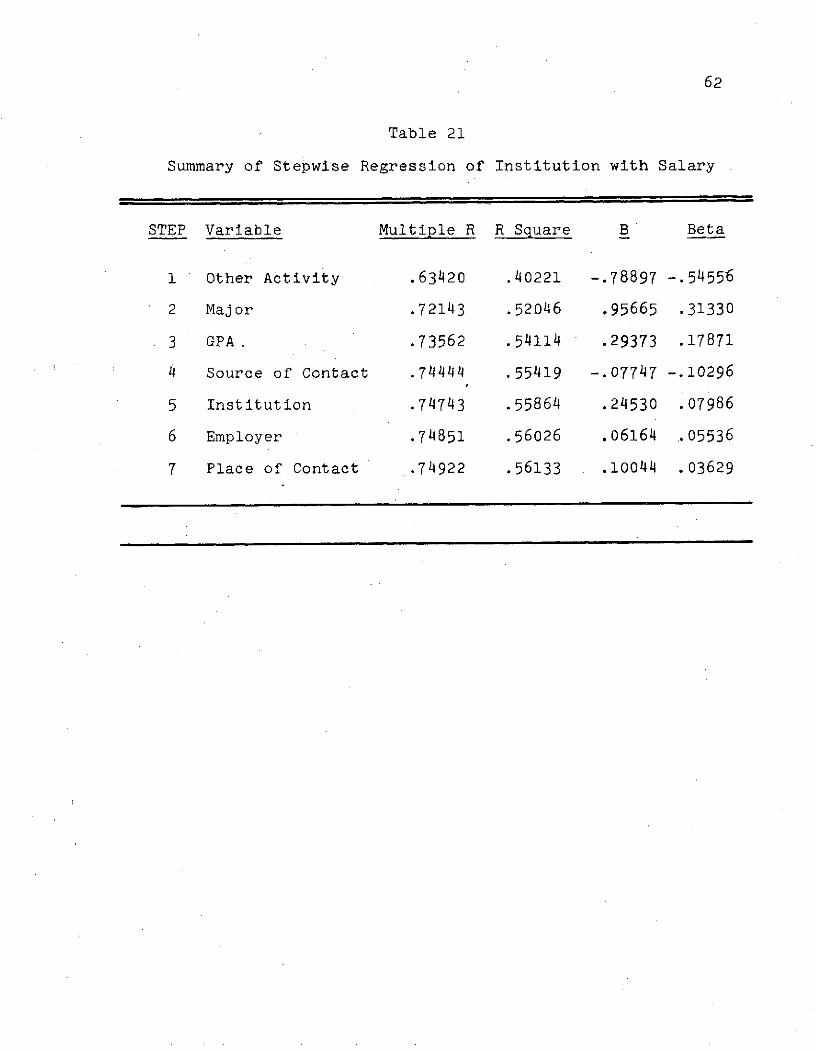
62
Table 21
Summary of Stepwise Regression of Institution with Salary
STEP Variable Multiple R R Square B Beta
1 Other Activity .63420 .40221 -.78897 -.54556
2 Major .72143 .52046 .95665 .31330
3 GPA. .73562 .54114 .29373 .17871
4 Source of Contact .74444 .55419 -.07747 -.10296
5 Institution .74743 .55864 .24530 .07986
6 Employer .74851 .56026 .06164 ..05536
7 Place of Contact .74922 .56133 .10044 .03629
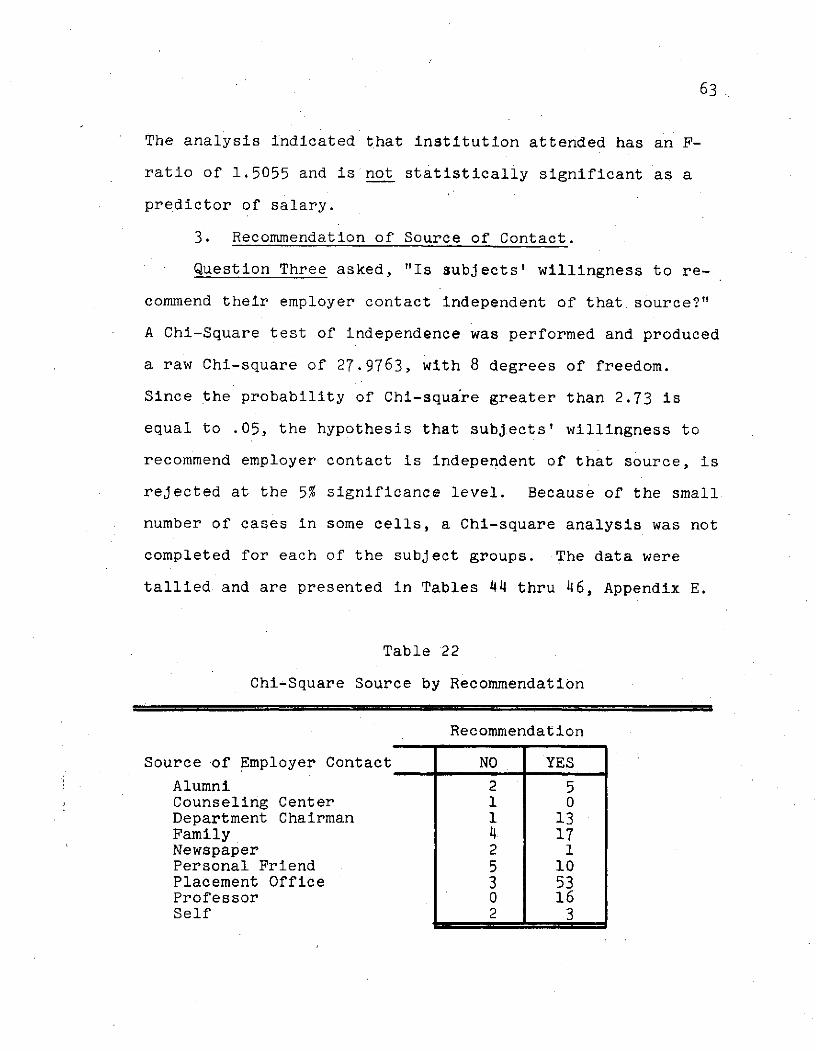
63
The analysis indicated that institution attended has an F-
ratio of 1.5055 and is not statistically significant as a
predictor of salary.
3. Recommendation of Source of Contact.
Question Three asked, "Is subjects' willingness to re-
commend their employer contact independent of that source?"
A Chi-Square test of independence was performed and produced
a raw Chi-square of 27.9763, with 8 degrees of freedom.
Since the probability of Chi-square greater than 2.73 is
equal to .05, the hypothesis that subjects' willingness to
recommend employer contact is independent of that source, is
rejected at the 5% significance level. Because of the small
number of cases in some cells, a Chi-square analysis was not
completed for each of the subject groups. The data were
tallied and are presented in Tables 44 thru 46, Appendix E.
Table 22
Chi-Square Source by Recommendation
Recommendation
Source -of Employer Contact NO YES
Alumni 2 5Counseling Center 1 0Department Chairman 1 13Family 4 17Newspaper 2 1Personal Friend 5 10Placement Office 3 53Professor 0 16Self 2 3
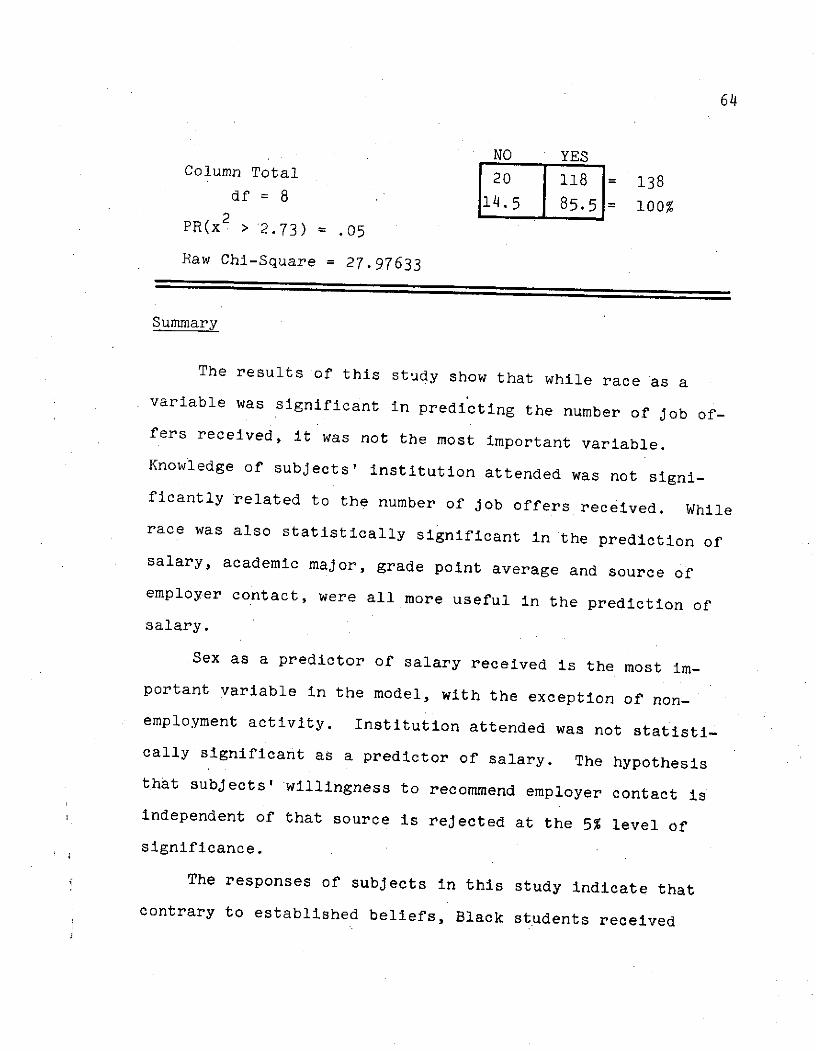
64
NO YESColumn Total 20 118 = 138
df = 8 14.5 85.51= i00%
PR(x. > 2.73) = .05
Raw Chi-Square = 27.97633
Summary
The results of this study show that while race as avariable was significant in predicting the number of job of-fers received, it was not the most important variable.
Knowledge of subjects' institution attended was not signi-ficantly related to the number of job offers received. Whilerace was also statistically significant in the prediction ofsalary, academic major, grade point average and source ofemployer contact, were all more useful in the prediction ofsalary.
Sex as a predictor of salary received is the most im-portant variable in the model, with the exception of non-employment activity. Institution attended was not statisti-
cally significant as a predictor of salary. The hypothesis
that subjects' willingness to recommend employer contact isindependent of that source is rejected at the 5% level ofsignificance.
The responses of subjects in this study indicate that
contrary to established beliefs, Black students received
65
more job offers than non-Black students and that despite
race making a statistically significant addition to the
salary received (non-Black higher) for'all practical purposes
the salaries were equal. The finding that salaries for fe-
males fell below males was noteworthy.
66
Chapter 4
DISCUSSION
This study was designed to respond to the general re-search objective which was an examination of career planningand placement services in higher education, in order to de-termine and compare job placement patterns of Black and non-Black June, 1973, graduates of the University of Virginiaand Hampton Institute. Seven specific research questionswere addressed in this study. Three of these questions at-tempted to discover if addition of knowledge of subjects'race, sex and institution attended makes a statistically sig-nificant difference in the prediction of the number of joboffers received when control variables were included in theprediction equations. The second set of three questionssought to determine if there were a significant differencein the prediction of the salary received if subjects' race,sex and institution attended are added to control variablesin the prediction equation. The final question asked ifsubjects' willingness to recommend their employer contact isindependent of that source.
To examine the relationships discussed above, inferen-tial analyses were completed. The analysis determined
whether adding information about race, sex and institution
attended to a regression equation makes a statistically
67
significant (p < .05) improvement in the prediction of number
of job offers and salary. The analysis of satisfaction with
the source of employer contact was a Chi-Square test to de-
termine whether satisfaction is independent of source of
contact.
e. The analysis revealed no statistical significance of in-
stitution attended as a predictor of job offers. Furthermore,institution attended was also not statistically significant
as a predictor of salary. However, statistically significant
relationships were found between race and number of Job offers
received, although race was not the most important variable.
Sex was statistically significant in predicting the number
of job offers received. Blacks and males received the most
offers. While race was found to be statistically significant
in the prediction of salary, the analysis shows, however,
that academic major, grade point average, and source of em-
ployer contact were all more useful in the prediction of
salary. Non-Blacks received less low and high offers than
Blacks with the result that Black and non-Black salaries
were essentially equal.
Another statistically significant relationship was found
between sex and salary received. It is important to note
that sex as a predictor is the most important variable in
the model, with the exception of nonemployment activity,
herein referred to as enrollment in graduate and professional
68
schools or military service upon graduation in lieu of full-
time employment. As might be expected those students who
entered nonemployment activities received few offers and
low salaries in the instances reported. For those few sub-
jects that variable was critical. However, for most sex was
most important with females receiving lower salaries. Final-
ly, the analysis of satisfaction revealed that willingness to
recommend employer contact was not independent of that source
(p > .05).
These findings of significance are consistent with cur-
rent research which suggests that women college graduates are
often paid lower salaries than men college graduates. The
assumption was made that there would be direct relationships
between job search and subsequent job patterns. Specifical-
ly, job choice is the outcome of the students' personal char-
acteristics and job objectives, the environment and placement
system within which the student is functioning, and his parti-
cular job search strategy. In short, these findings support
Kanowitz's (1969) premise that discrimination is largely in-
fluenced by sexual factors. Jencks and Riesman (1969) point
to educational research which shows that sex is one of 'the
most important factors differentiating students' hopes and
performance at all levels.
Since there was not statistically significant difference
found between institution attended and the number of Job
69
offers received, and no statistically significant difference
between institution attended and salary received; perhaps
Siegel (1968) is correct in his assumption that the most
obvious prejudice, that against Blacks, seems to be fading,
at least for college educated Blacks.
Inspection of the various tables in this study reveals
that as a group, most of the Black subjects were liberal arts
majors, as opposed to non-Black subjects who predominated in
the professions.. Black subjects in contrast with non-Black
subjects also had higher grade point averages; received more
job offers; engaged in more nonemployment activity (i.e.,
graduate and professional schools or military service);
tended to accept jobs with industry, business and in education;
received higher salaries in positions accepted; more frequent-
ly registered with the placement office; made most of their
job contacts on campus; used the placement office as a source
of employer contact; and would recommend their source of con-
tact to others.
Further review of the tables indicates that with respect
to institution attended, subjects at Hampton Institute were
almost.equally distributed between the two academic majors
(liberal arts and professional), while most of the subjects
at the University of Virginia majored in the professions.
Subjects at Hampton Institute also earned higher grade point
averages; received more job offers; accepted more jobs with
70
industry, in business and in education; accepted higher sal-
aries; more frequently registered with the placement office;
most made their job contacts on campus; used the placement
office as a source of employer contact; and would recommend
their source of contact to others.
Inspection of the data reveals that with respect to sex,
females tended to concentrate in the liberal arts, while
males concentrated in professional academic majors. Females
earned final grade point averages'almost as high as their
male counterparts. However, they did not receive as many job
offers. More females than males enrolled in graduate and
professional schools. Females did not receive salaries as
high as males. Fewer females registered with the placement
office. Thus, personal friends, family and professors were
significant sources of employer contact for females. Finally,
most females would recommend to others their source of employ-
er contact.
In summary, it should be noted that despite the fact
that female grade point averages were almost as high as those
of males, females did not receive as many job offers as males
or salaries equal to males. These situations may have en-
couraged the females to participate in nonemployment activi-
ties in greater numbers than males.
71
Methodological Limitations
In performing the stepwise multiple linear regression
analysis, variables were added in direct relation to their
calculated importance in the prediction equations. The re-
sults may have been more enlightening had the control varia-
ble, nonemployment activity, been excluded from consideration
in the regression model. This variable was obviously highly
correlated with job offers and salary, and hence dominated
the regression analysis statistics. Thus, additional analy-
sis excluding this might be appropriate. These limitations
notwithstanding, the results of the analysis performed were
sufficiently complete to answer the research questions posed
and provided sufficient support for the conclusions reached
in this study.
Population Limitations
This study was limited to a total of 138 June, 1973,
graduates of the University of Virginia and Hampton Institute.
This was a necessary limitation because there were less than
20 Black males, Black females and non-Black females in the
graduating population of the University of Virginia; and
less than 20 non-Black males and non-Black females in the
graduating population of Hampton Institute. Subjects who
participated in this study were those who voluntarily re-
;trned the questionnaire (see Table 6, page 32). Considering
72
the sample size which was 6.8% (N = 138) of a possible 2,010June, 1973, graduates, certain limits are to be placed on the'inferences applied to the findings. Inasmuch as the responses
were encouraging, perhaps this follow-up approach could be
duplicated with a more representative sample by appropriate
student personnel officials.
Implications
An implication of this study'concerns the counselor's
knowledge regarding the occupational status of women. There
seems to be a need for specialized training and procedures
to help sensitize personnel officials, counselors, recruiters
and other employing officials to the differing needs of fe-
males. Such training could include information on the per-
centage of working women, extent to which women are discrim-
inated against, the increasing discrepancy between men's and
women's incomes, and the probability of women attaining leader-
ship positions. Personnel workers must react to the changing
social structure of society and in particular to the rapidly
changing roles of the sexes.
Because a significant relationship was found between sex
and the number of job offers and salary received, a second
implication is that women are not entering career fields which
are as economically rewarding as those of their male counter-
parts. Procedures related to the dynamics of counseling women
73
suggest an examination of attitudes and practices toward
women, who are still overly represented among the liberal
arts majors. It seems that career counselors should take
on new roles in planning and developing special programs for
men and women. The college recruitment officer can give di-
rection by indicating what the job market is likely to
emphasize for those companies recruiting at the college.
He can suggest where the stress in the academic program
should be placed for students interested in careers in en-
gineering, business, and government, for example. In order
to be effective in this area, counselor educators need to
help counselors explore a variety of course content that
will be helpful in counseling women.
A third implication is that it is important to develop
ways in which counseling and guidance activities can enrich
the personal and career potential of students. Since academic
major and grade point averages were significant in the predic-
tion of salary, students should use job search strategies
which would lead them into career fields which are both re-
warding and are in demand. Career planning and placement
activities should be directed toward increased participation
of minorities and females in scientific and technical careers.
Although Blacks may seek entry into an integrated nation-
al labor force and may be interested in integrated colleges
that prepare them directly for such a life, this study
74
revealed that institution attended was not statistically
significant in the prediction of the number of job offers
and the amount of salary received in the position accepted.
This fourth implication is that students may continue to
attend Black as well as non-Black institutions where they
may participate in a strong Cooperative Education Program
which will provide the students with some actual work ex-
perience in the non-traditional career fields.
Subjects who participated in'this study also used their
professors and department chairmen as sources of employer
contact. A final implication is that faculty models can be
used on an outreach basis in support of career planning and
placement activities to help students explore new career
opportunities. Minority and female students could benefit
tremendously by getting this kind of teacher/student inter-
action and the kind of education and skills that will allow
a meaningful participation in the national economy.
75
REFERENCES
Anderson, A. F. Career counseling and placement needs ofBlack students at the University of Virginia. (Unpublishedresearch), Charlottesville, 1972.
Banks, W. M. The changing attitudes of Black students.Personnel and Guidance Journal, 1970, 739-745.
Beaumont, A. G. Career counseling and placement needs ofBlack students at integrated colleges. Pensylvania:College Placement Services, 1972.
Blumrosen, A. W. The duty of fair recruitment under civilrights act of 1964. Rutgers Law Review, Spring 1968, 22.
Brown, S. D.; Stevens, E. C. and Frey, D. H. Attitudes ofBlack junior college students toward counseling services.Journal of College Student Personnel, Sept. 1972, 13.
Brown, S. J. The process of racial desegregation of thestudent body of the University of Virginia: admission ofthe Negro, (Unpublished research), Charlottesville, 1972.
Bullock, H. A. A history of Negro education in the southfrom 1619 to the present. Cambridge: Harvard UniversityPress, 1968.
Celia, V. F. The culturally deprived client: a reformationof the counselor's role. Journal of Counseling in Psycho-logy, 1966, 13.
Centra, J. A Black students at predominantly white colleges:a research description. Maryland: ERIC Reports, ED042420,May 1970.
Daily Progress, September 9, 1969, Charlottesville, Virginia.
Feldman, K. and Newcomb, T. The impact of college on students.San Francisco: Jossey-Bass, 1969.
Greene, C. and Kester, D. Black community college studentshave special problems: what are these special problems?Maryland: ERIC Reports, ED047690, April 1970.
Haettenschwiller, D. L. Counseling Black college students inspecial programs. Personnel and Guidance Journal, 1971,50, 29- 34.
76
Harrison, E. C.' .Student unrest on the Black college campus.Journal of Negro Education, 1972, 41, 113-120.
Jencks, C. and Riesman, D. The academic revolution. New York,Doubleday, 1969.
Kanowitz, M. Women and the law, the unfinished revolution.New York: Harper & Row, 1969.
Kelly, F. J.; Beggs, D. L. and McNeil, K. A. Research desighin the behavioral sciences: multiple regression approach.Carbondale: Southern Illinois University Press, 1969.
Knapp, R. H. and Goodrich, H. B. Origins of American scien-tists. Chicago: University of Chicago Press, 1952.
Ledvinka,.J. D. Race of employment interviewer and the langu-age elaboration of Black job seekers. Doctoral Dissertation,University of Michigan, 1969. Dissertation Abstracts Inter-national, March 1970, 30, 4018-A.
Mann, H. Discussions in American history. 12th Annual Reportto Massachusetts State Board of Education, 1848. CommagerEdition, 1958.
Myers, R. A. Career development in the college years. Journalof College Placement, February-March 1972.
Nie, N.; Bent, D. H. and Hull, C. H. Statistical package forthe social sciences. New York: McGraw-Hill, 1970.
Pallone, N. J.; Rickard, R. S. and Hurley, R. B. Key influ-encers of occupational preference among Black youth. NewYork: New York University, Center for Field Research,School of Educatidn, 1969.
Phillips, W. B. Role of the counselor in the guidance ofNegro students. Harvard Educational Review, 1961, 31, (3).
Pressman, S. Job discrimination and the Black woman. TheCrisis, March 1970.
Rever, P. R. Perspectives on open admissions, Open admissionsand Equal Access, Iowa: 1973.
Richmond Times Dispatch, September 6, 1950.
Rogers, C. R. The interpersonal relationship: the core ofguidance. Harvard Educational Research, 1959, 43, 272-75.
77
Schumaker, L. C.; Banikiotes, P. G. and Banikiotes, F. G.Language compatibility and minority group counseling.Journal of Counseling Psychology, 1972, 255-256.
Sedlack, W. E., and Brooks, C. G. Black freshmen in largecolleges: a survey. Personnel and Guidance Journal, Dec.1970, 49, 307-311.
Selected characteristics of Negro undergraduate students en-rolled at the University of Virginia, 1966-1971. (Officeof Institutional Analysis, Charlottesville, August 1971),01A07172-188.
Siegel, M. The counseling of college students. New York:The Free Press, 1968.
Simpson, L. A. and Harwood, R. K.' Placement: from employmentbureau to career development center. NASPA Journal, 1973,10, 255-230.
Career planning, Business World, 1973,
Tolson, H. Counseling the disadvantaged. Personnel andGuidance Journal, 1972, 50, 735-738.
University of Virginia New Letter, April 1969.
U.S. Department of Labor, Women's Bureau Bulletin, 1972.
Uzzell, 0. Influencers of occupational choice. Personneland Guidance Journal, 1961, 39, 666-669.
Vontress, C. E. Counseling Negroes. Boston: Houghton-Mifflin, 1970.
Racial differences: impediments torapport. Journal of Counseling Psychology, 1971, 18, (1),7-13.
Young, W. M. Beyond racism. New York: McGraw-Hill, 1968.

78
APPENDIX A
LETTER TO PROSPECTIVE STUDENTS
79
DETERMINING JOB PLACEMENT PATTERNS
General Information and Directions
You are one of fifty persons selected to complete the
attached questionnaire; consequently, your response is criti-
cal to the success of the investigation. The purpose of this
questionnaire is to determine Job placement patterns of for-
mer students. You are encouraged to be honest and candid in
replying to questions, and to add "other"' responses whenever
necessary. The results of this questionnaire will be trans-
lated into "ways and means" of helping future students in
their career.planning activities. Your response will become
a part of a research project which will neither identify in-
dividuals nor make comparisons between individuals.
Please take a few minutes of your time to complete this
questionnaire and return it in the enclosed self-addressed
envelope.
Thank you for your time and cooperation.
Sincerely,
Alvin F. Anderson

80
APPENDIX B
FOLLOW-UP LETTER
Follow-Up Letter
Dear Mr./Ms.
Ten days ago, I sent you a ten item questionnaire which
was designed to determine job placement patterns of former
students. As I inidicated in my first letter, your response
will become a part of a research project which will neither
identify individuals nor make comparisons between individuals.
Perhaps you may have misplaced the questionnaire. There-
fore, I am enclosing another, and would sincerely appreciate
it if you would take a few minutes of your time to complete
and return it in the enclosed self-addressed envelope.
Thank you for your time, patience and cooperation.
Sincerely,
Alvin F. Anderson
Enclosure: QuestionnaireSelf-addressed envelope

82
APPENDIX C
THIRD CONTACT LETTER
83
Third Contact Letter
Dear Mr./Ms.
I enjoyed our short telephone conversation a few. days
ago. Thanks for agreeing to participate in the research
project. Enclosed is another questionnaire for your con-
venience.
Thank you for your time, patience, and cooperation.
Sincerely,
Alvin F. Anderson
Enclosure: QuestionnaireSelf-addressed envelope

84
APPENDIX D
TEN-ITEM QUESTIONNAIRE
85
DETERMINING JOB PLACEMENT PATTERNS
Questionnaire #2
Directions:
Please check (/) the appropriate responses and write-in otherinformation where requested.
(1) Academic Major (2) Grade Point Average
2.0-2.4write-in
2.5-2.9
3.0-3.4
3.5-3.9
4.0
(3) How many job offers did (4) If you did not seek ayou receive? position, what is yourpresent activity?
2 -- Graduate School
Military
Professional School
Marriage
Other
(5) If you are presently (6) What is your salary range?employed, what is thename of your employer? $6,000-7,000
$8, 000-9,000name of company
$10,000-11,000location
$11,000-12,000
Over $12,000
86
(7) Did you register with (8) Did you make the initial
the Placement Office? contact for your presentjob on campus?
YesYes
NoNo
(9) How did you make (10) Would you recommend yourcontact with your source of employer contact
present employer? to other students?
Placement Office Yes
Department Chairman No
Professor If yes, why?
Personal Friend
Alumni
Counseling Center
Immediate Family
Self Referral
Newspaper
If no, why not?

87
APPENDIX E
SUPPLEMENTARY TABLES
88
Table 23
Crosstabulation of Race and Major
Maj or
Liberal Arts Professional
45 35Black
32.6% 25.4%Race
19 39Non-Black
13.8% 28.3%
N = 138
89
Table 24
Crosstabulation of Race and Grade Point Average
Grade Point Average
2.0-2.4 2.5-2.9 3.0-3.4 3.5-3.9 '4.0
13 21 33 12 1Black
9.4% 15.2% 23.9% 8.7% .7%Race
9 20 24 5 0Non-Black
6.5% 14.5% 17.4% 3.6% .0%
N = 138
90
Table 25
Crosstabulation of Race and Placement Registration
Registration
No Yes
25. 55Black
18.1% 39.9% •Race
14 44Non-Black
10.1% 31.9%
N.= 138
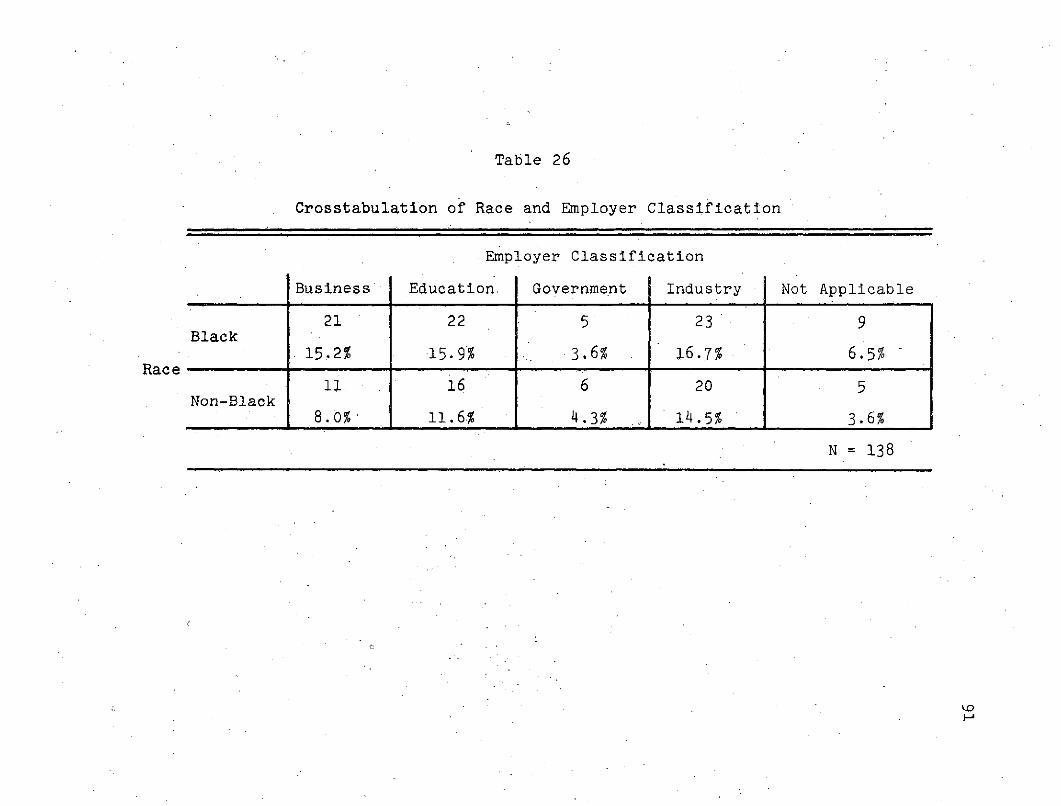
Table 26
Crosstabulation of Race and Employer Classification
.Employer Classification
Business Education. Government Industry Not Applicable
21 22 5 23 9Black
15.2% 15.9% 3.6% 16.7% 6.5%Race
11. 16 6 20 5Non-Black
8.0% 11.6% 4.3% 14.5% 3.6%
N = 138
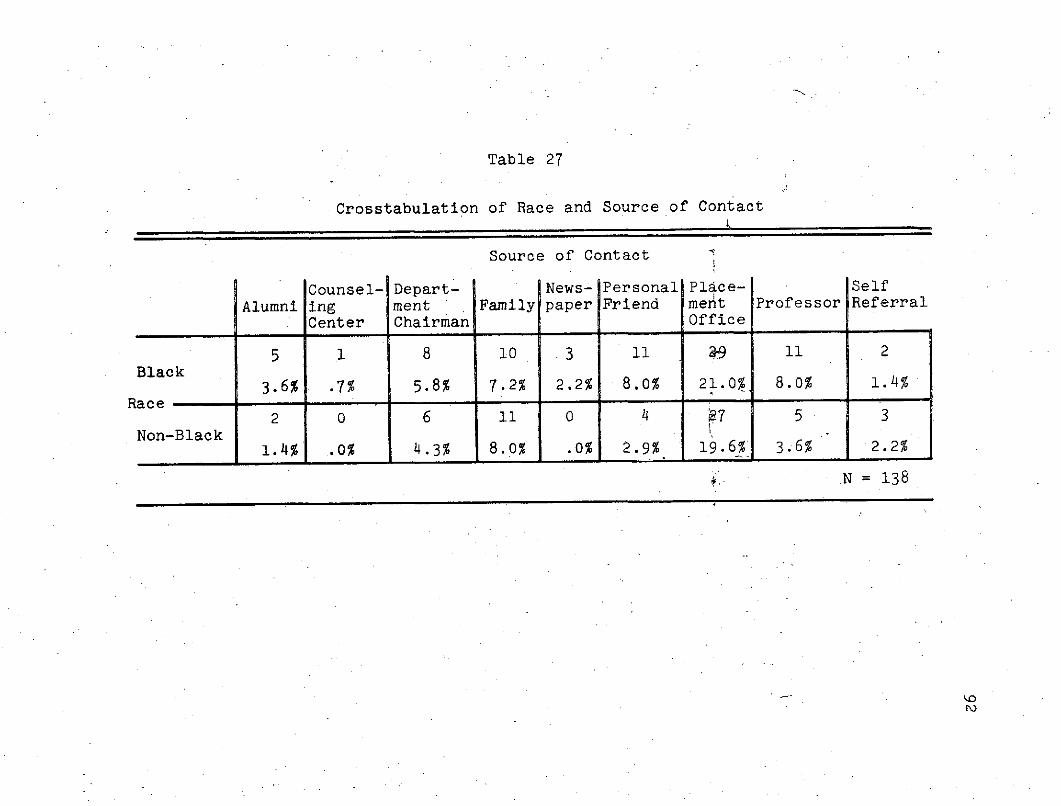
Table 27
Crosstabulation of Race and Source of Contact
Source of Contact
Counsel- Depart- News- Personal Place- Self
Alumni ing ment Family paper Friend met Professor Referral
Center Chairman Office
5 1 8 10 3 11 9 11 2Black
3.6% .7% 5.8% 7.2% 2.2% 8.0% 21.0% 8.0% 1.4%Race
2 0 6 11 0 4 7 5 3Non-Black 2.2%
1.4% .0% 4.3% 8.0% .0% 2.9% 19.6% 3.6% 2.2%
N = 138
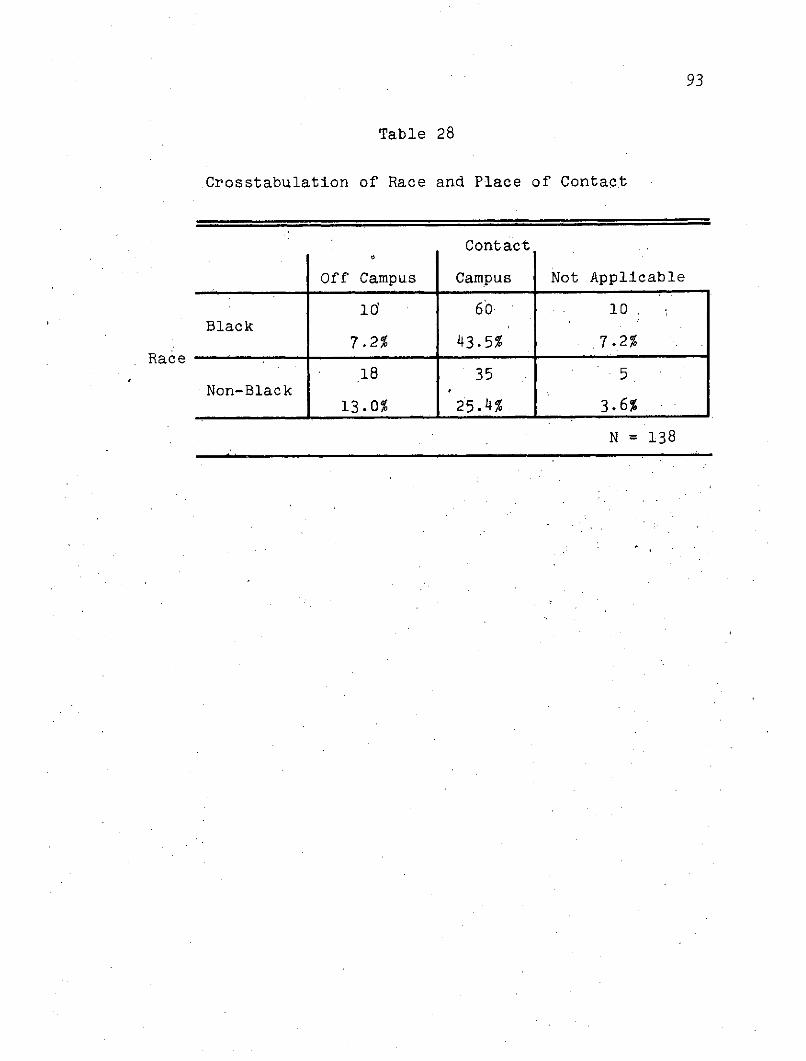
93
Table 28
Crosstabulation of Race and Place of Contact
Contact
Off Campus Campus Not Applicable
10 60 10Black
7.2% 43.5% .7.2%Race
18 35 5Non-Black
13.0% 25.4% 3.6%
N = 138
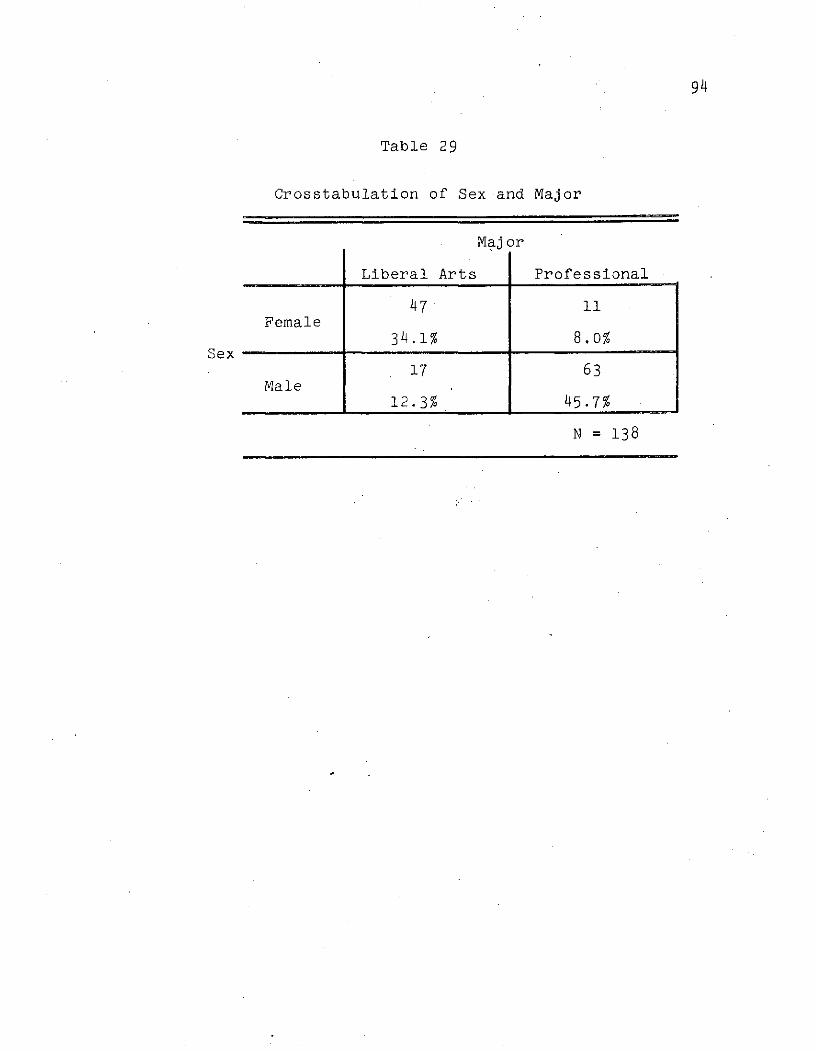
94
Table 29
Crosstabulation of Sex and Major
Maj or
Liberal Arts Professional
47 11Female
34.1% 8.0%Sex
17 63Male
12.3% 45.7%
N = 138
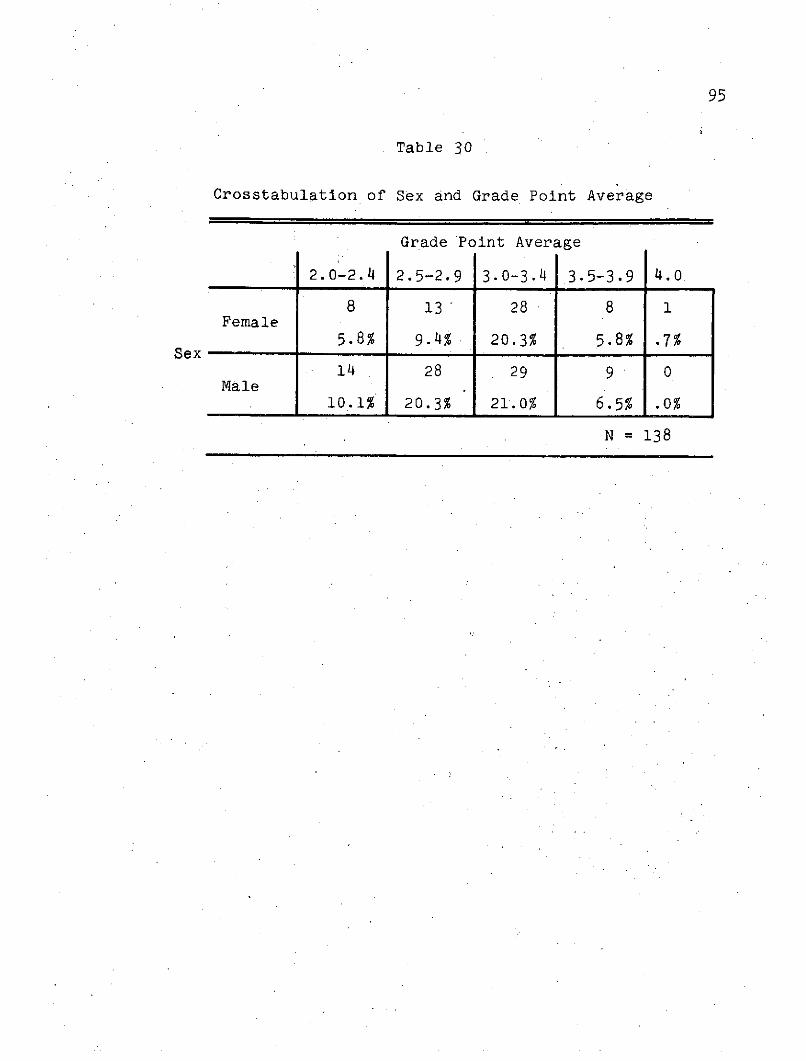
95
Table 30
Crosstabulation of Sex and Grade Point Average
Grade Point Average
2.0-2.4 2.5-2.9 3.0-3.4 3.5-3.9 4.0
8 13 28 8 1Female
5.8% 9.4% 20.3% 5.8% .7%Sex
14 28 29 9 0Male
10.1% 20.3% 21.0% 6.5% .0%
N = 138
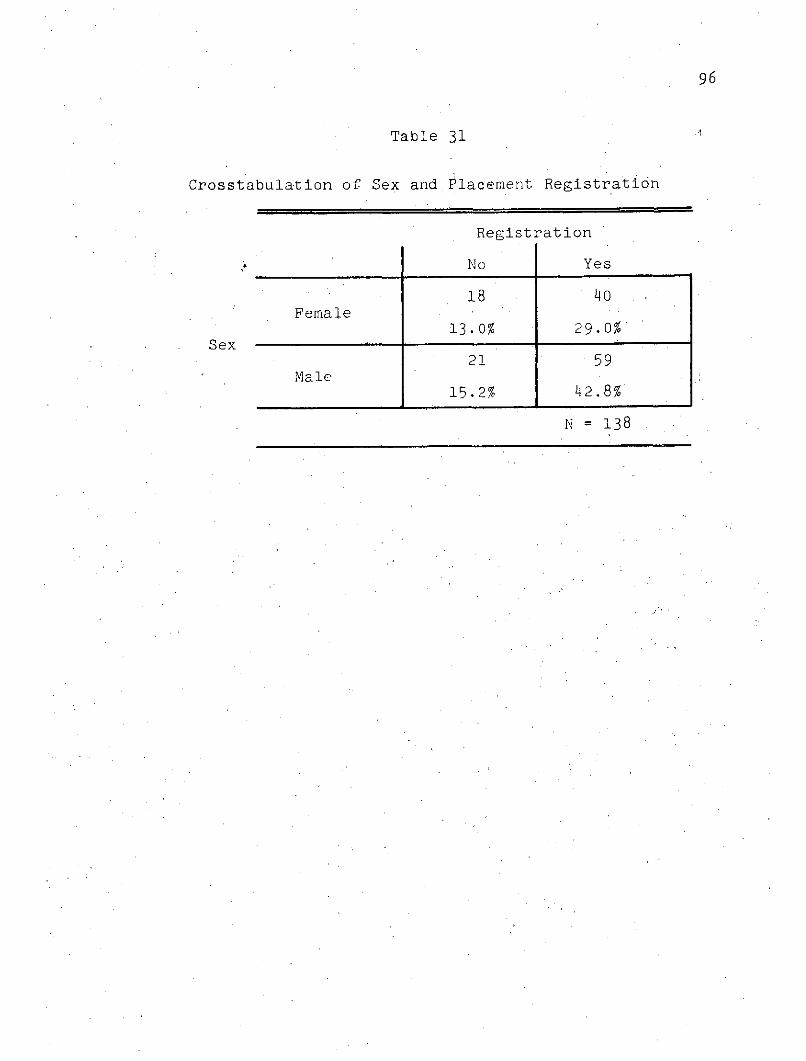
96
Table 31
Crosstabulation of Sex and Placement Registration
Registration
No Yes
18 40Female
13.0% 29.0%Sex
21 59Male
15.2% 42.8%
N = 138
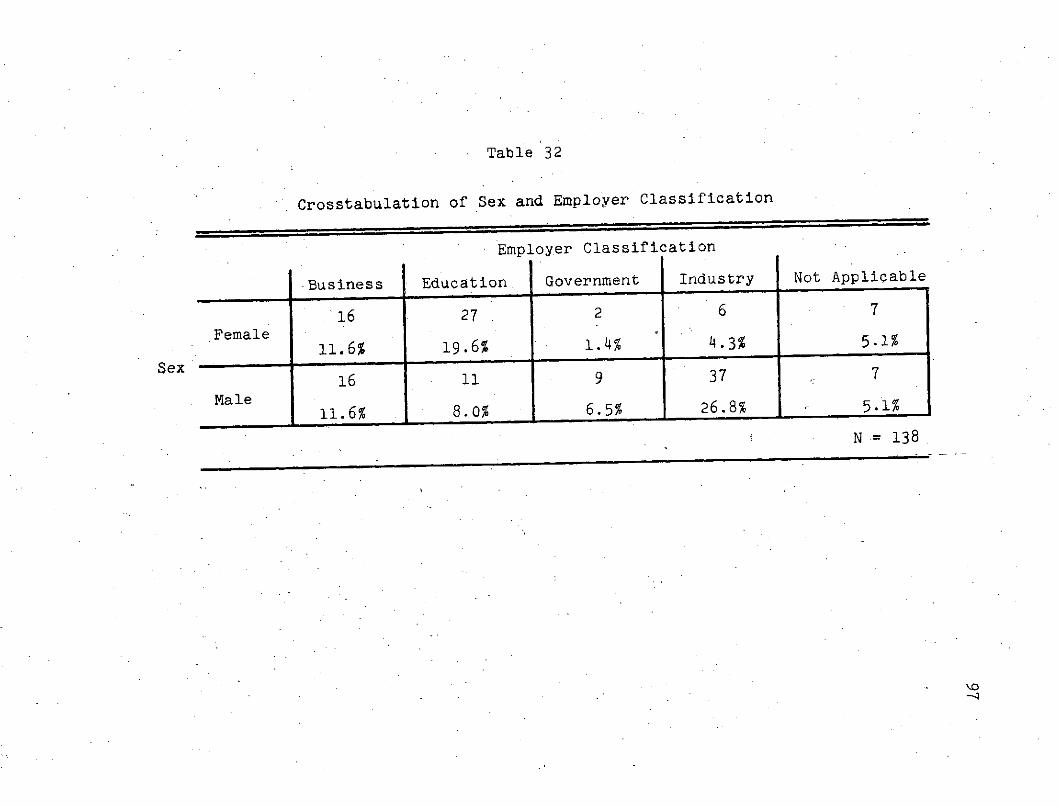
Table 32
Crosstabulation of Sex and Employer Classification
Employer Classification
-Business Education. Government Industry Not Applicable
16 27 2 6 7
Female "11.6% 19.6% 1.4% 4.3% 5.1%
Sex16 11 9 37 7
Male11.6% 8.0% 6.5% 26.8% 5.1%
N = 138
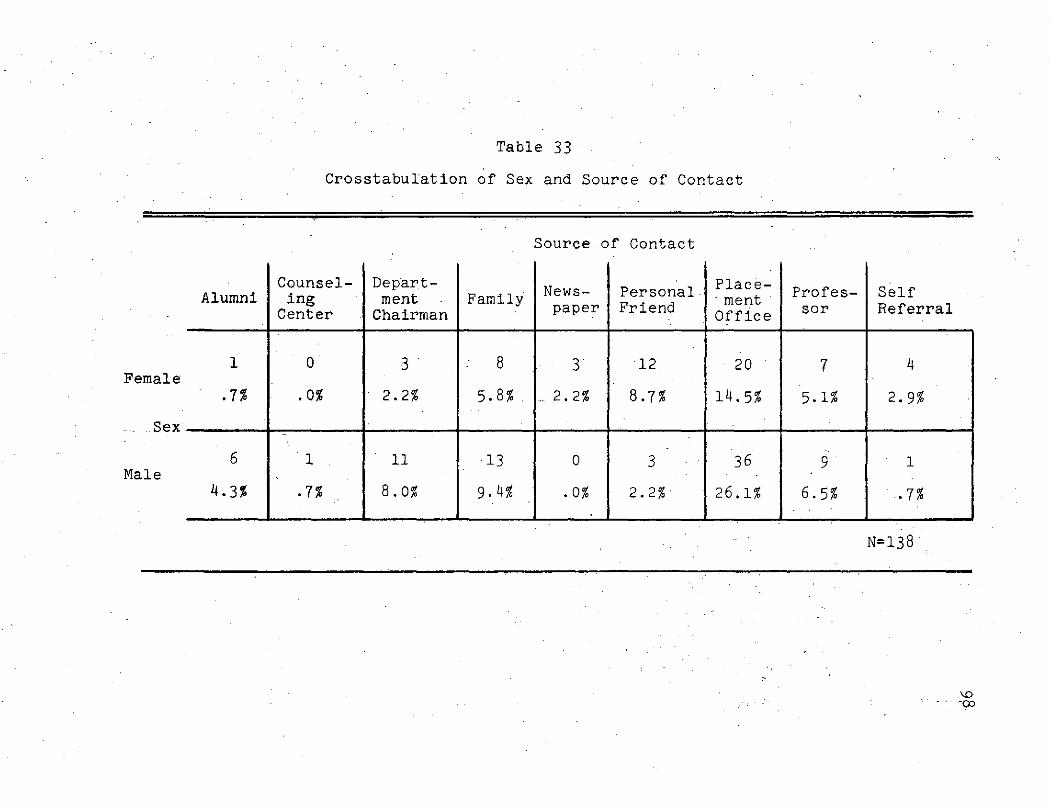
Table 33
Crosstabulation of Sex and Source of Contact
Source of Contact
Counsel- Depart- Place-Counsel- Depart- News- Personal Place- Profes- SelfAlumni ing ment Family paper Frienment or Referral
Center Chairman paper Friend Office sor Referral
1 0 3 8 3 12. 20 7 4Female
.7% .0% 2.2% 5.8% .. 2.2% 8.7% 14.5% 5.1% 2.9%
Sex
6 1 11 13 0 3 36 9 1Male
4.3% .7% 8.0% 9.4% .0% 2.2% 26.1% 6.5% .7%
N=138
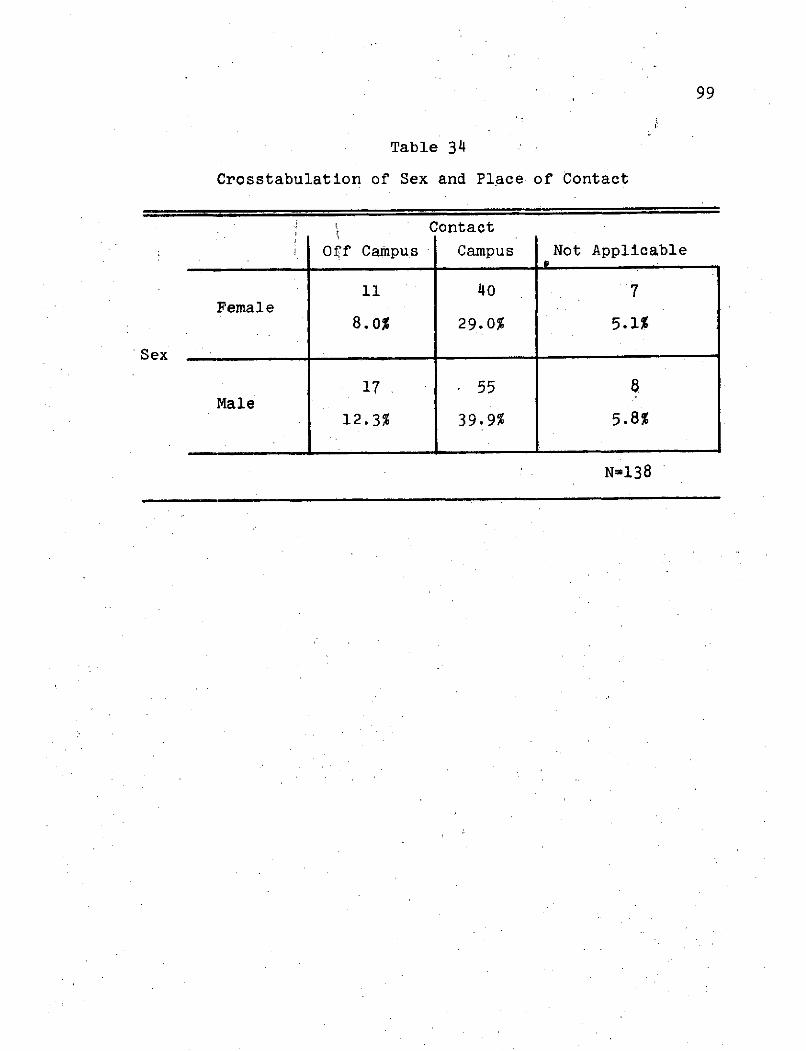
99
Table 34
Crosstabulation of Sex and Place of Contact
Contact
Off Campus Campus Not Applicable
11 40 7Female
8.0% 29.0% 5.1%
Sex
17 55 8Male
12.3% 39.9% 5.8%
N= 138
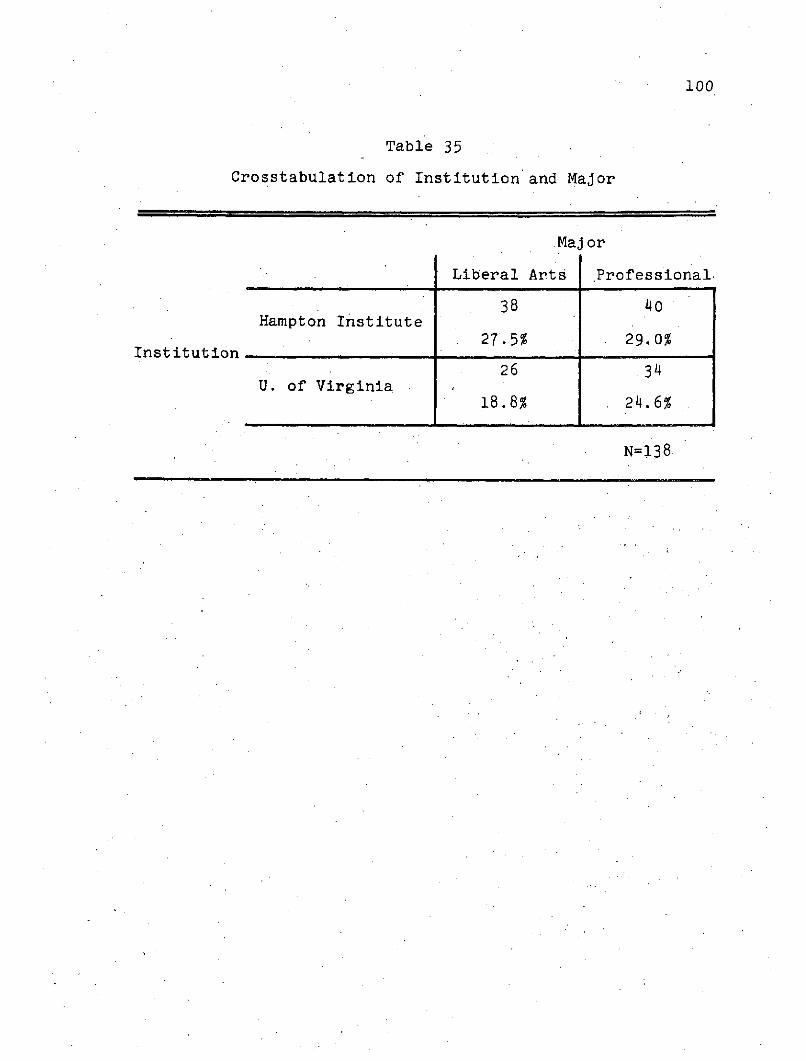
100
Table 35
Crosstabulation of Institution and Major
.Maj or
Liberal Arts Professional.
38 40Hampton Institute
27.5% 29.0%Institution
26 34U. of Virginia
18.8% 24.6%
N=138
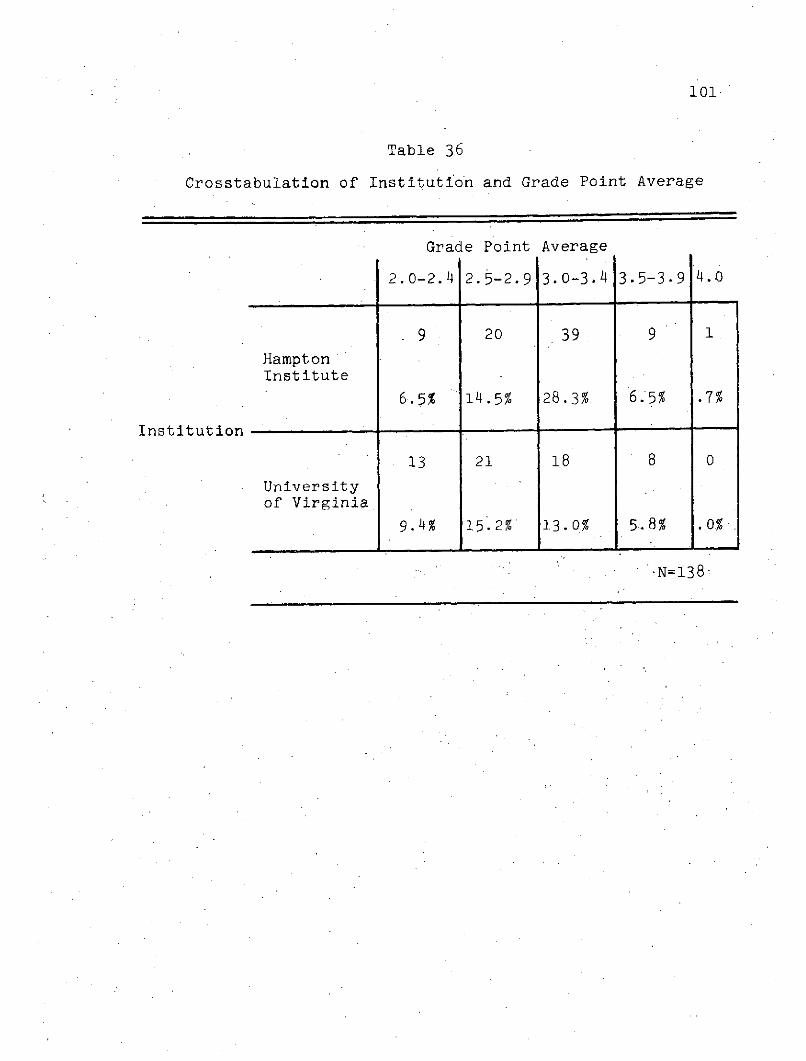
101
Table 36
Crosstabulation of Institution and Grade Point Average
Grade Point Average
2.0-2.4 2.5-2.9 3.0-3.4 3.5-3.9 4.0
9 20 39 9 1
HamptonInstitute
6.5% .14.5% 28.3% 6.5% .7%
Institution
13 21 18 8 0
Universityof Virginia
9.4% 15.2% ]13.0% 5.8% .0%
-N=138
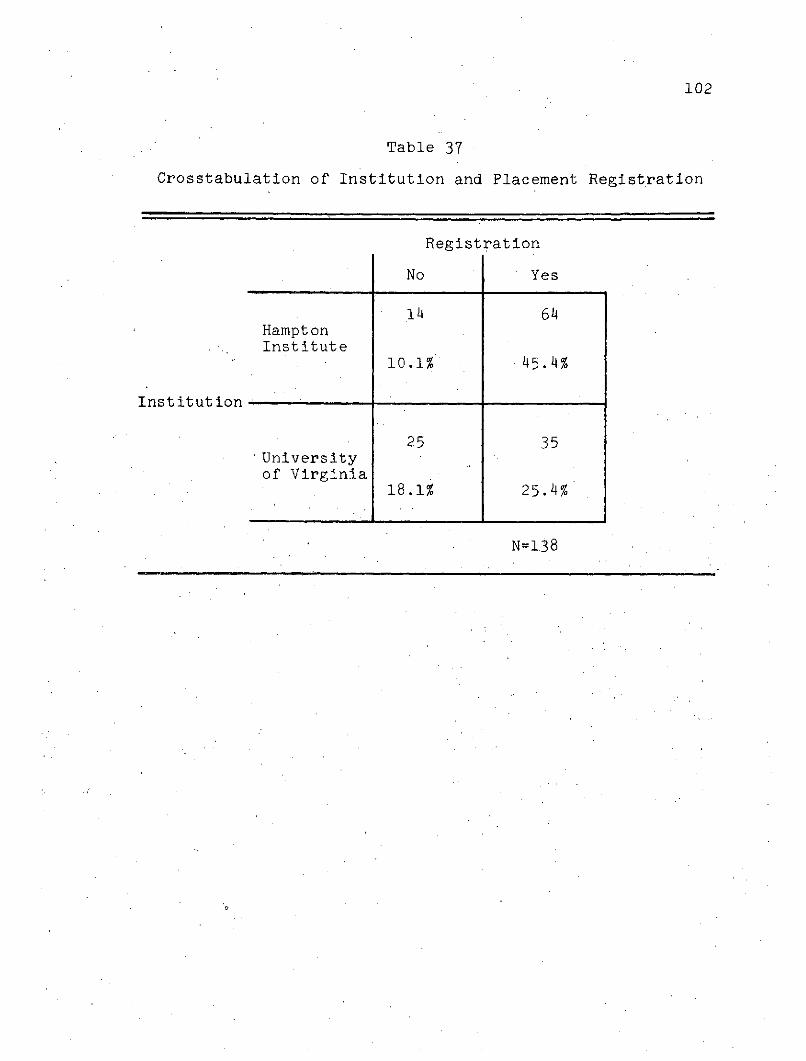
102
Table 37
Crosstabulation of Institution and Placement Registration
Registration
No Yes
14 64HamptonInstitute
10.1% 45.4%
Institution
25 35Universityof Virginia
18.1% 25.4%
N= 13 8
Table 38
Crosstabulation of Institution and Employer Classification
Employer Classification
Business Education Government Industry Not Applicable
-----Hampton 18 22 8 27 3-----------------... --- Hampton
Institute 13.0% 15.9% 5.8% 19.5%. 2.2%
Insti-tution
University 14 16 3 16 11
of Virginia 10.1% 11.6% 2.2% 11.6% 8.0%
N=138
I-
Table 39
Crosstabulation of Institution and Source of Contact
Source of Contact
5 0 6 7 3 5 39 2
4-) M0) WOc1 '-4; (t 4- 0) Orl
U 00 0). 0)4 0 0 -4 C4
tution 2 1 - 8 14 0 10 17 5 3University
of Virginia 1.4% .7% 5.8% 10.1% .0% 7.2% 12.3% 3.6% 2.2%
N=138
105
Table 40
Crosstabulation of Institution and Place of Contact
Contact
Off Campus Campus Not Applicable
8 66 4HamptonInstitute
5.8% 47.8% 2.9%Insti-tution
20 29 11Universityof Virginia
14.5% 21.0% 8.0%
N=138
Table 41
Crosstabulation of Race and Non-Employment Activity
Other Activity
Graduate School Military Professional School Not Applicable
6 1 2 71Black
4.3% .7%' .1.4% 51.4%
Race
3 0 2 53Non-Black
2.2% .0% 1.4% 38.4%
N=138
Cn
Table 42
Crosstabulation of Sex and Non-Employment Activity
Other Activity
Graduate School Military Professional School Not Applicable
6 0 1 51Female
4.3% .0% .7% 37.0%
Sex
3 1 3 73Male
2.2% .7% 2.2% 52.9%
N=138
Table 43
Crosstabulation of Institution and Non-Employment Activity
Other Activity
Graduate School Military Professional School Not Applicable
Hampton 2 0 75
Institute 14% .0% .7% 54.3%
Insti-tution
University 7 1 3 49
of Virginia 5.1% .7% 2,2% 35.5%
N=138
Co
109
Table 44
Crosstabulation of Race and Recommendation
Recommendation
No Yes
15 65Black
10.9% 47.1%
Race
5 53Non-Black
3.6% 38.4%
N=138*
110
Table 45
Crosstabulation of Sex and Recommendation
Recommendation
No Yes
13 45Female
9.4% 32.6% d
Sex
7 73Male
5.1% 52.9%
N=138
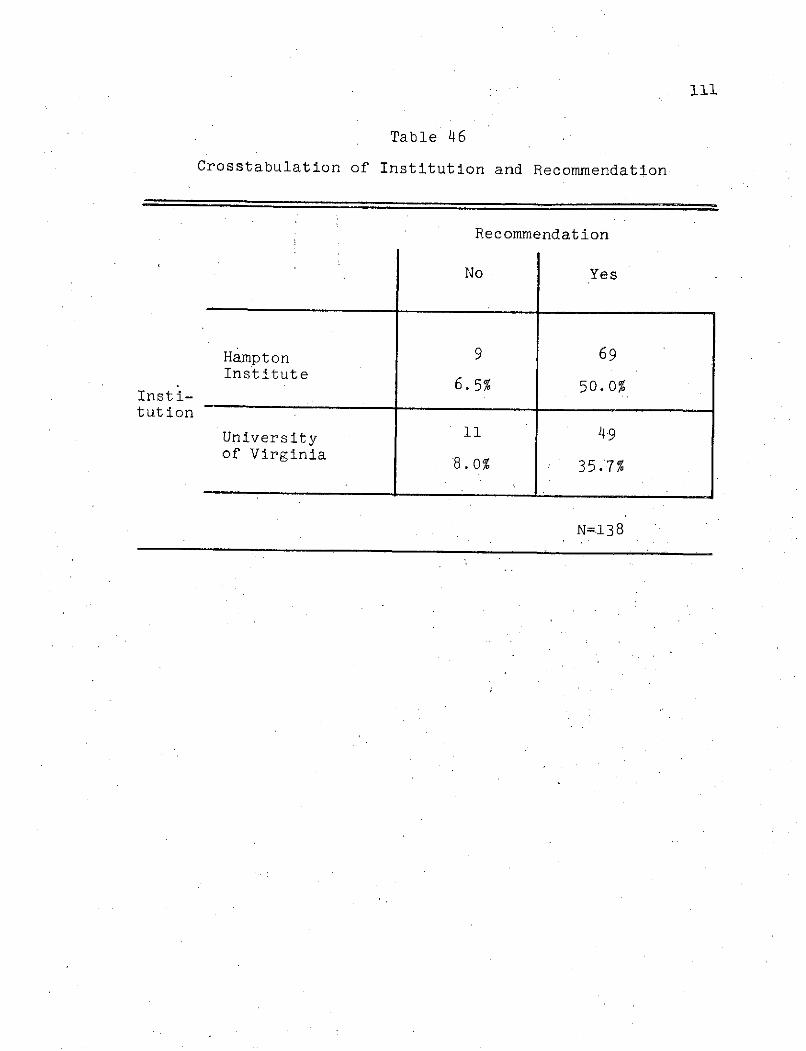
Table 46
Crosstabulation of Institution and Recommendation
Recommendation
No Yes
Hampton 9 69InstituteInstitute 6.5% 50.0%
Insti-
tution
University 11 49of Virginia 8.0% 35.7%
N=.138
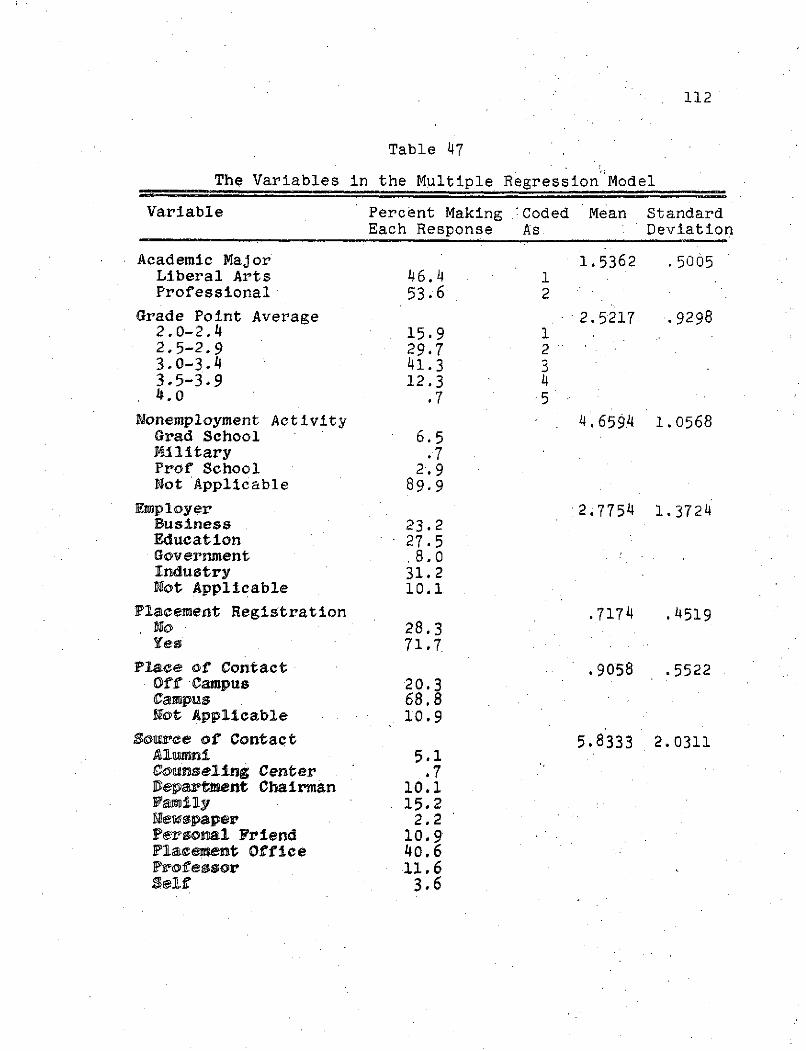
112
Table 47
The Variables in the Multiple Regression Model
Variable Percent Making .Coded Mean StandardEach Response As Deviation
Academic Major 1.5362 .5005Liberal Arts 46.4 1Professional 53.6 2
Grade Point Average 2.5217 .92982.0-2.4 15.9 12.5-2.9 29.7 23.0-3.4 41.3 33.5-3.9 12.3 44.0 .7 5
Nonemployment Activity 4.6594 1.0568Grad School 6.5Military .7Prof School 2.9Not Applicable 89.9
Employer 2.7754 1.3724Business 23.2Education 27.5Government .8.0Industry 31.2Not Applicable 10.1
Placement Registration .7174 .4519no 28.3Yes 71.7
Place of Contact .9058 .5522Off Campus 20.3Campus 68.8Not Applicable 10.9
Source of Contact 5.8333 2.0311Alumni 5.1Counseling Center .7Department Chairman 10.1Family 15.2Newspaper 2.2Personal Friend 10.9Placement Office 40.6Professor 11.6Self 3.6
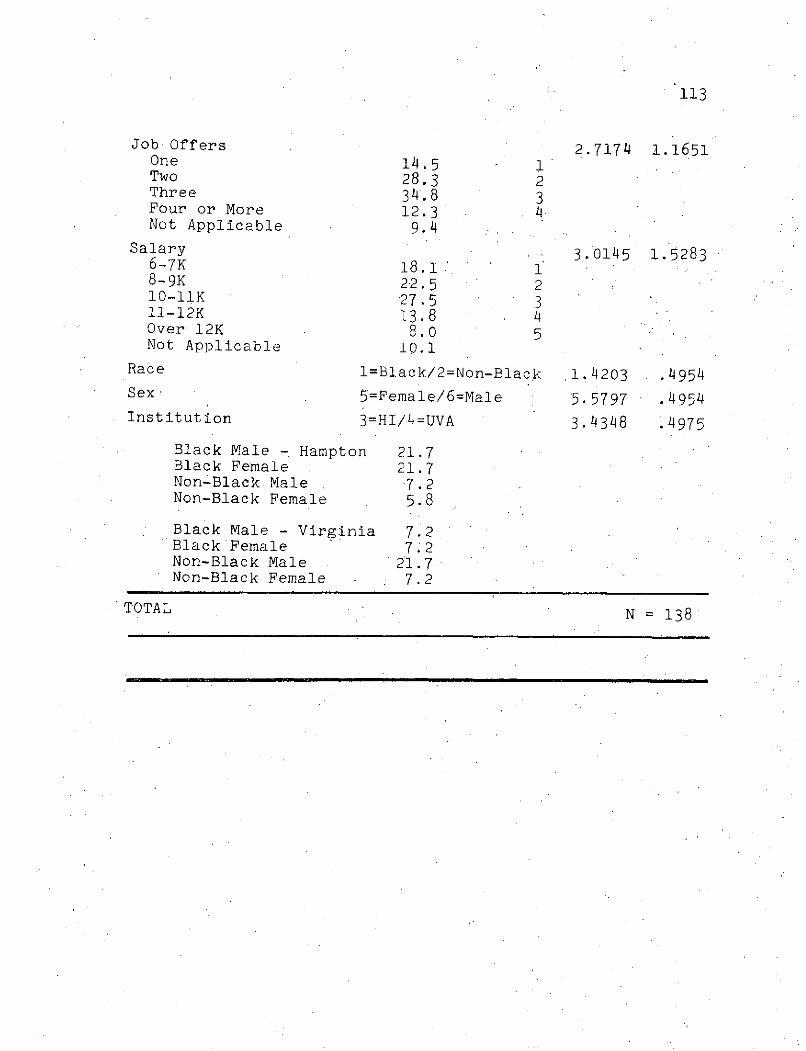
113
Job Offers 2.7174 1.1651One 14.5 1Two 28.3 2Three 34.8 3Four or More 12.3 4Not Applicable 9.4
Salary 3.0145 1.52836-7K 18.1 18-9K 22.5 210-11K 27.5 311-12K 13.8 4Over 12K 8.0 5Not Applicable 10.1
Race 1=Black/2=Non-Black .1.4203 .4954Sex 5=Female/6=Male 5.5797 .4954Institution 3=HI/4=UVA 3.4348 .4975
Black Male - Hampton 21.7Black Female 21.7Non-Black Male 7.2Non-Black Female 5.8
Black Male - Virginia 7.2Black Female 7.2Non-Black Male 21.7Non-Black Female 7.2
TOTAL N = 138